The following chart gives the average size home and number of family occupants. It uses the
years of 1950 and the year 2005 in order to make the comparison.
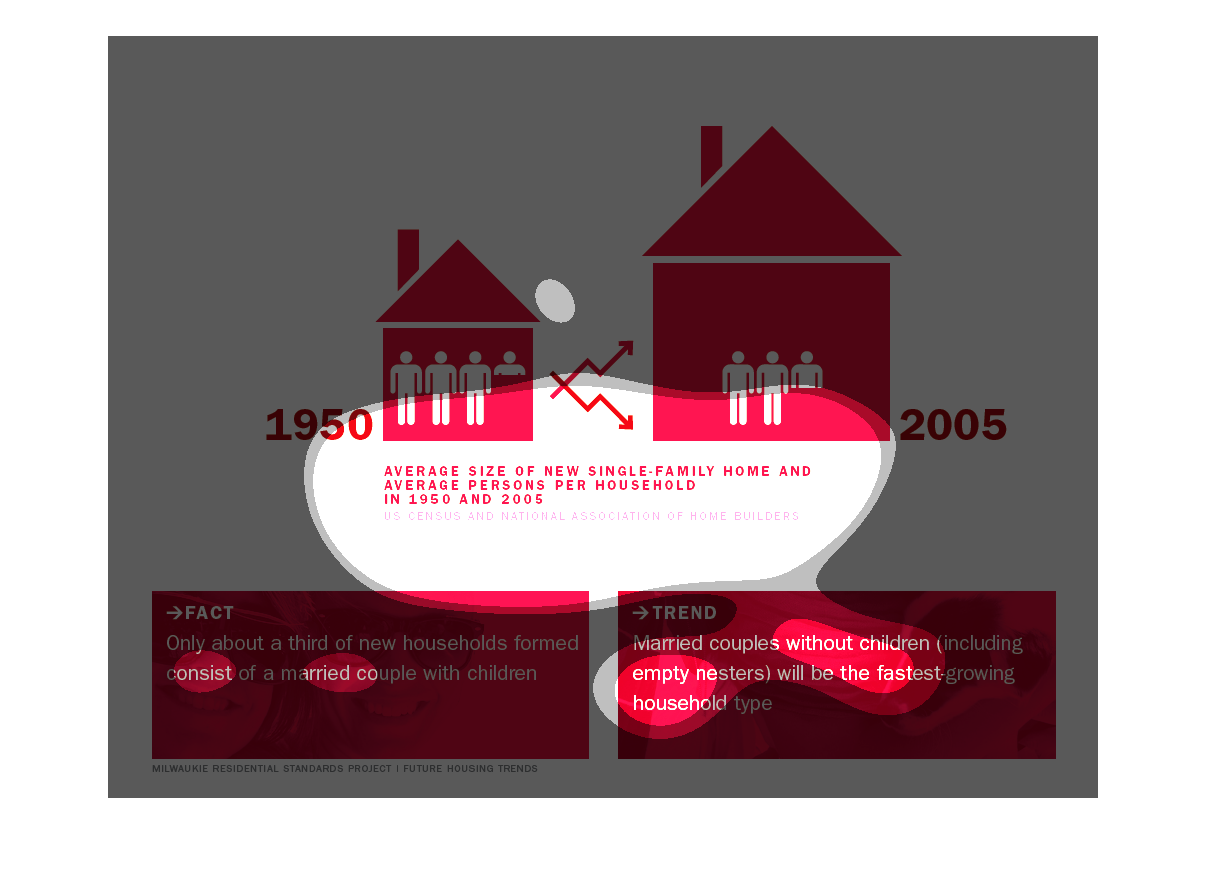
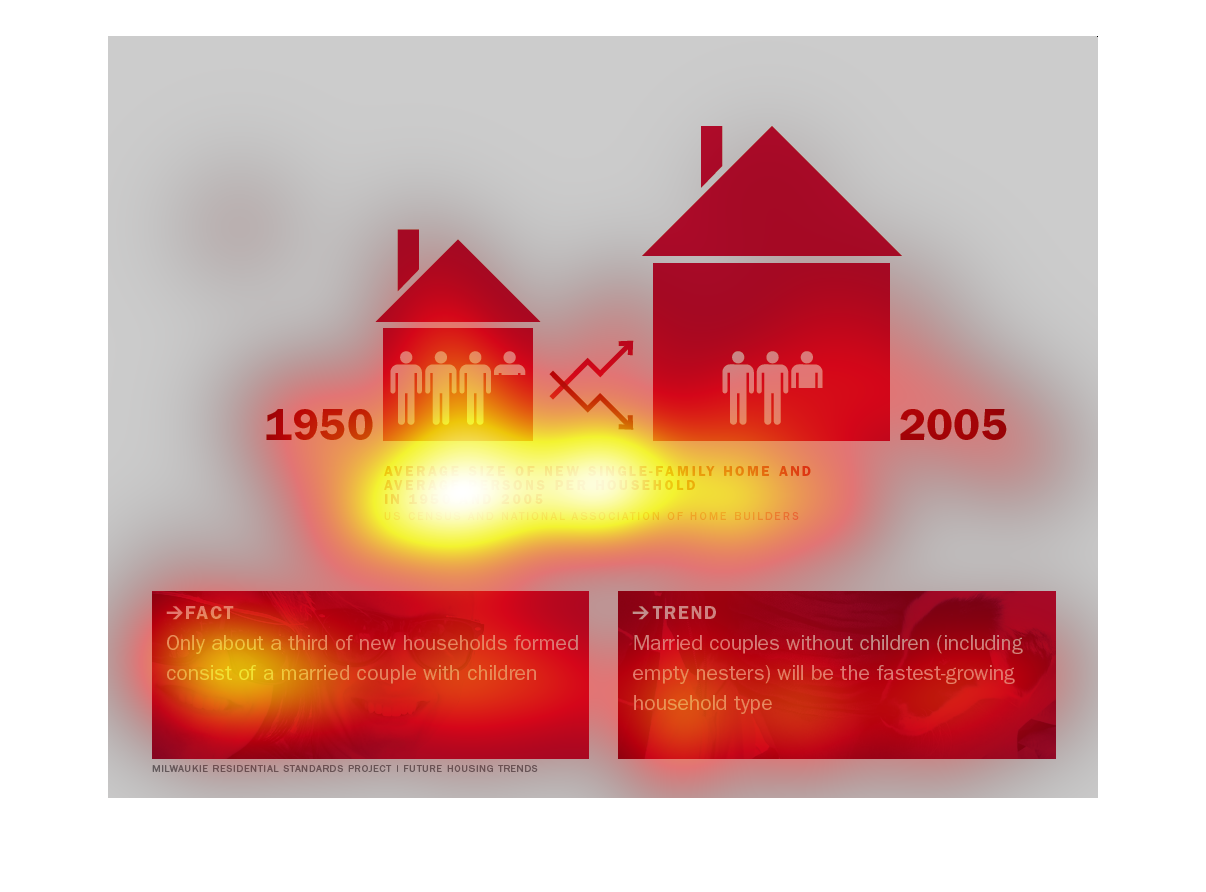
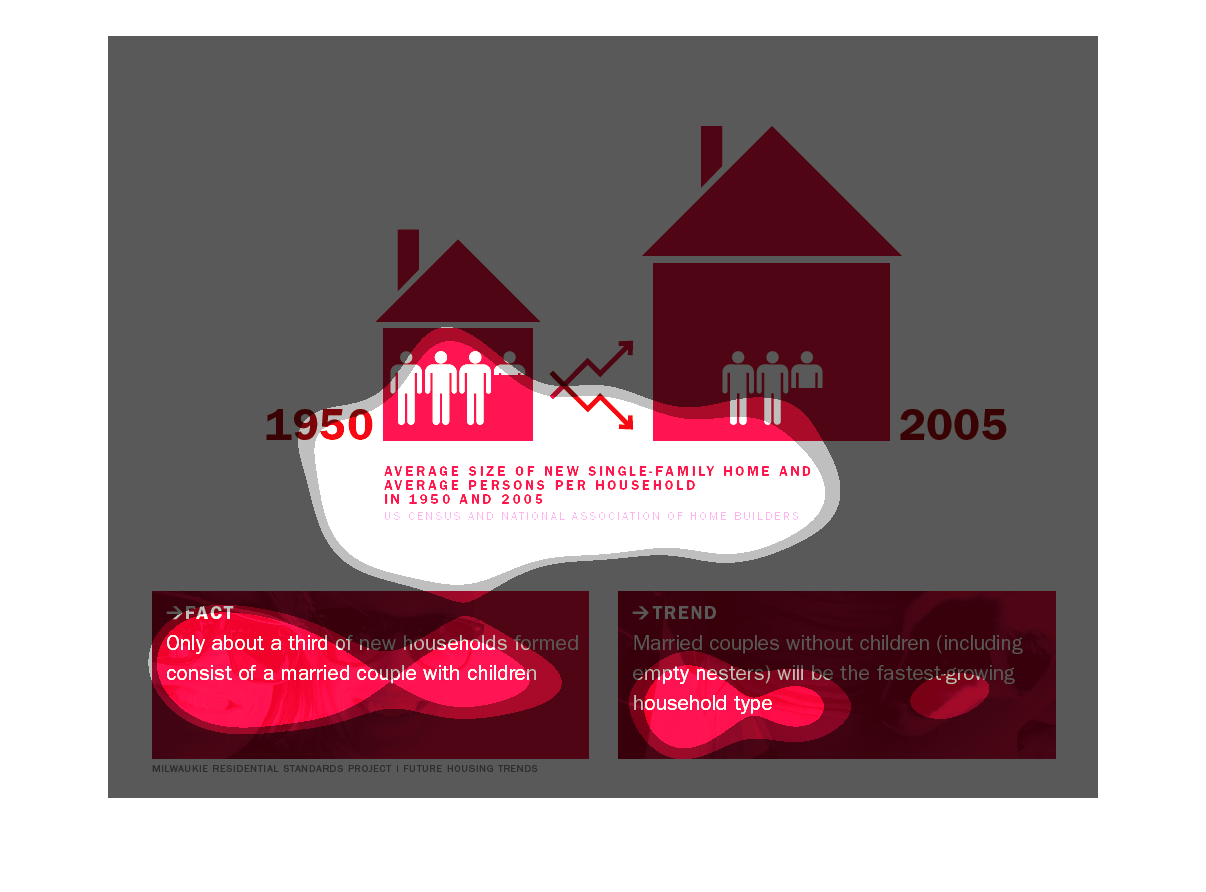
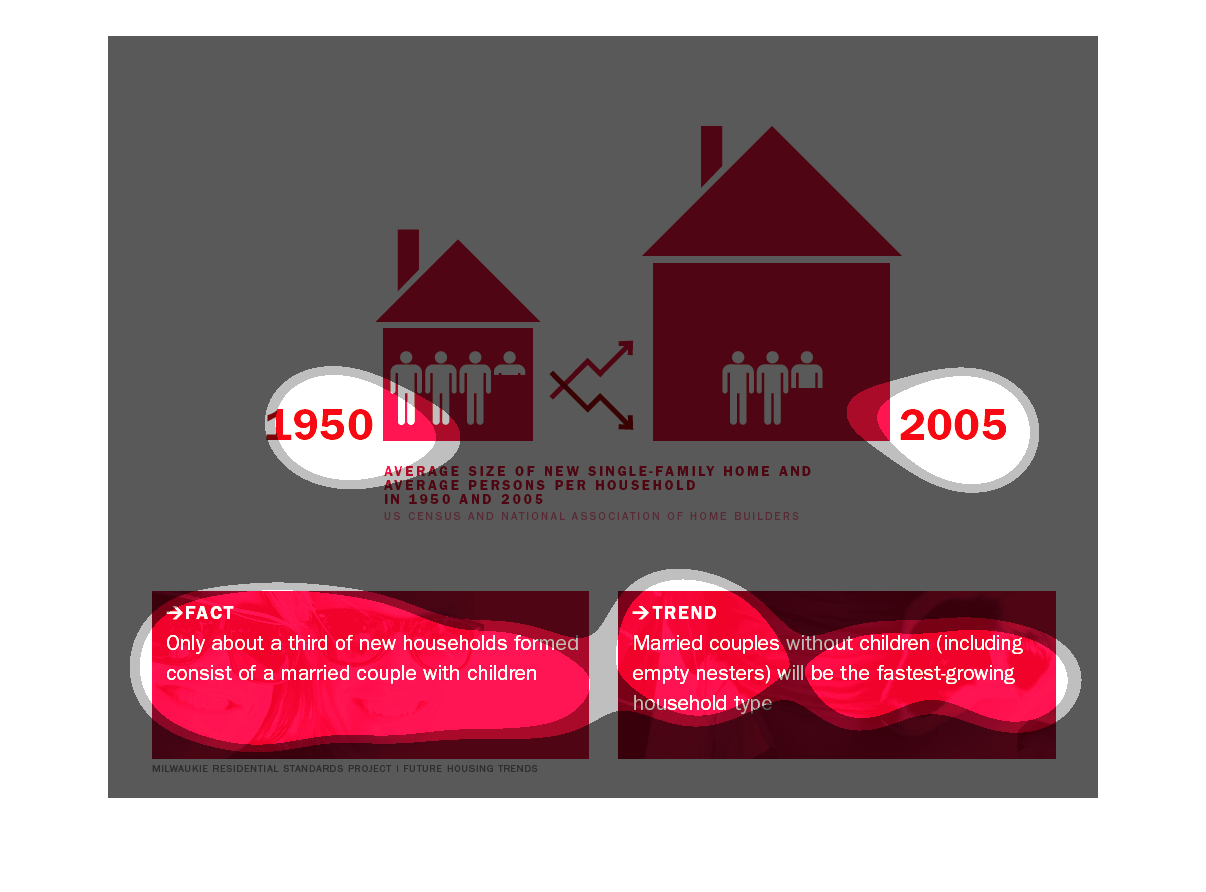
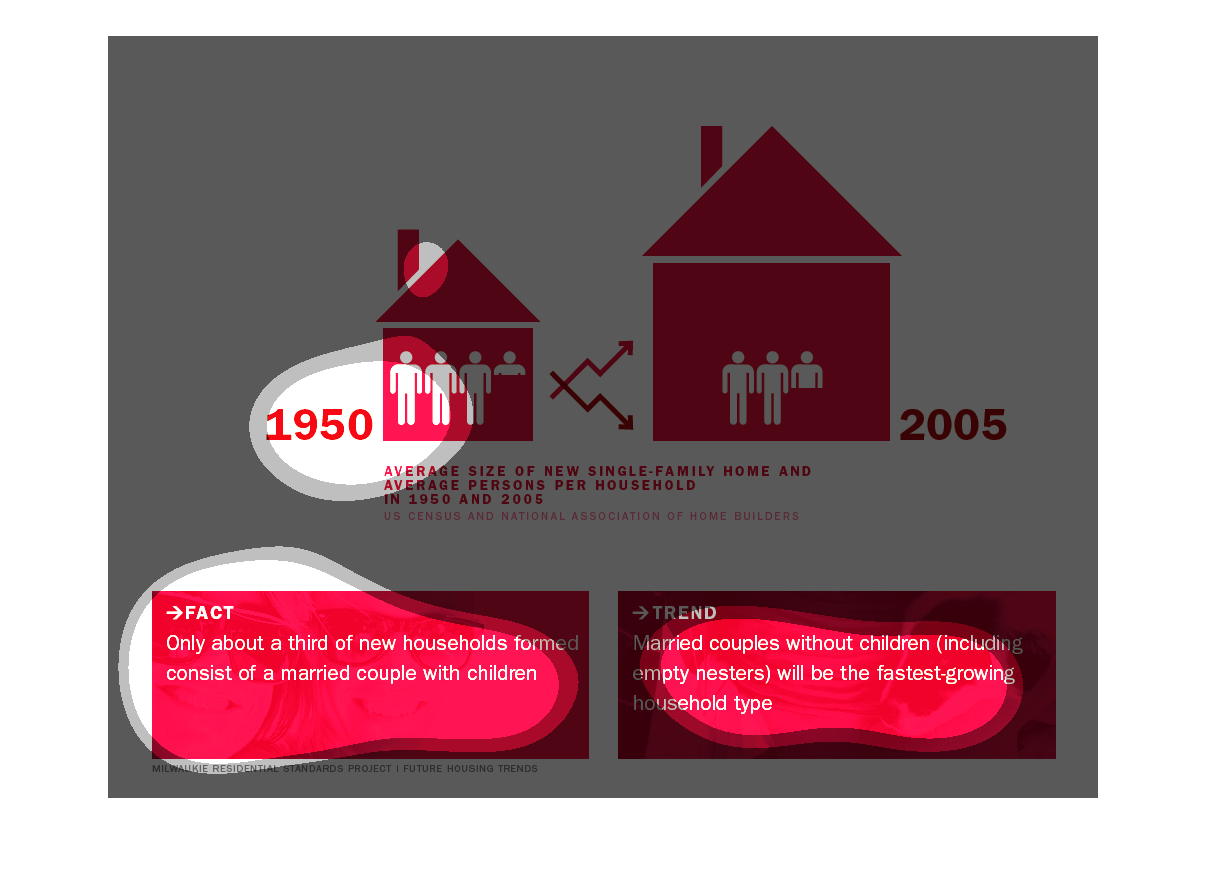
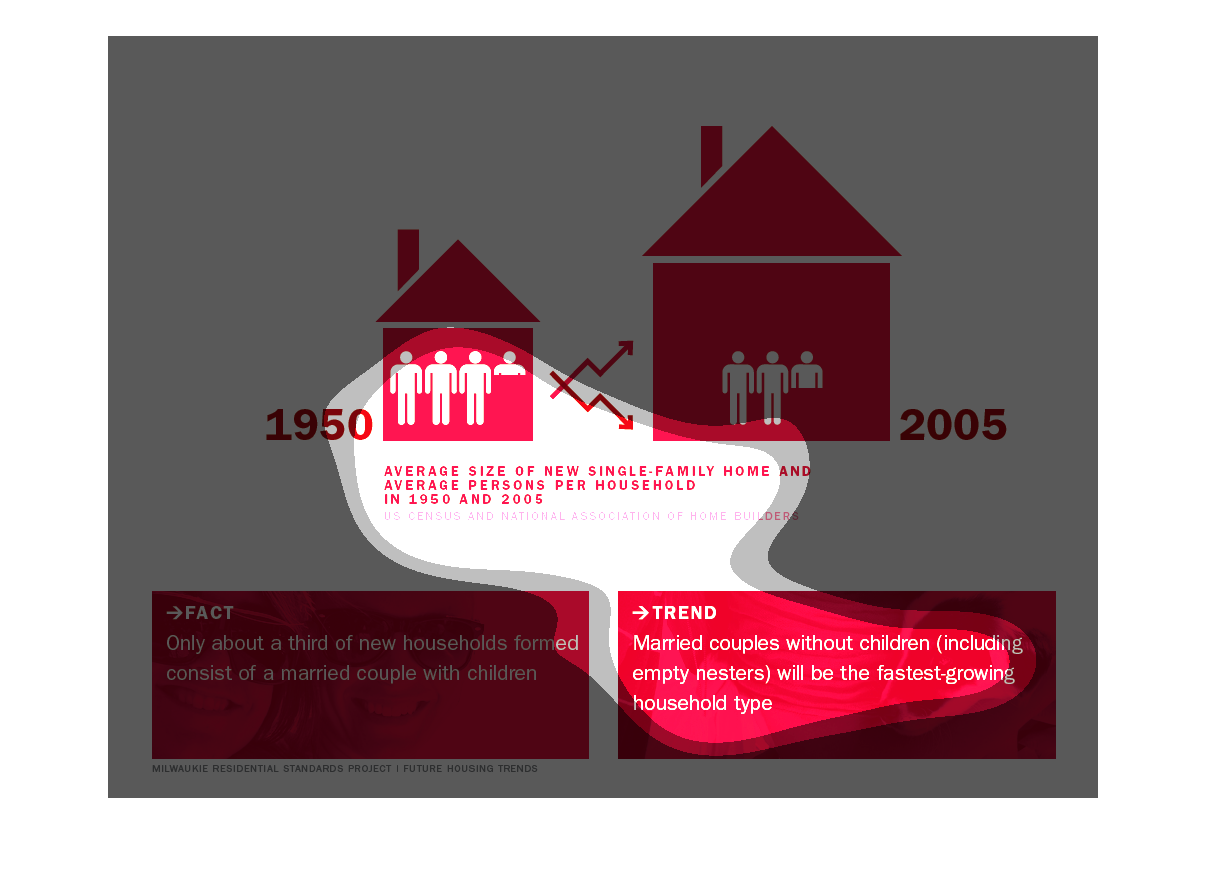
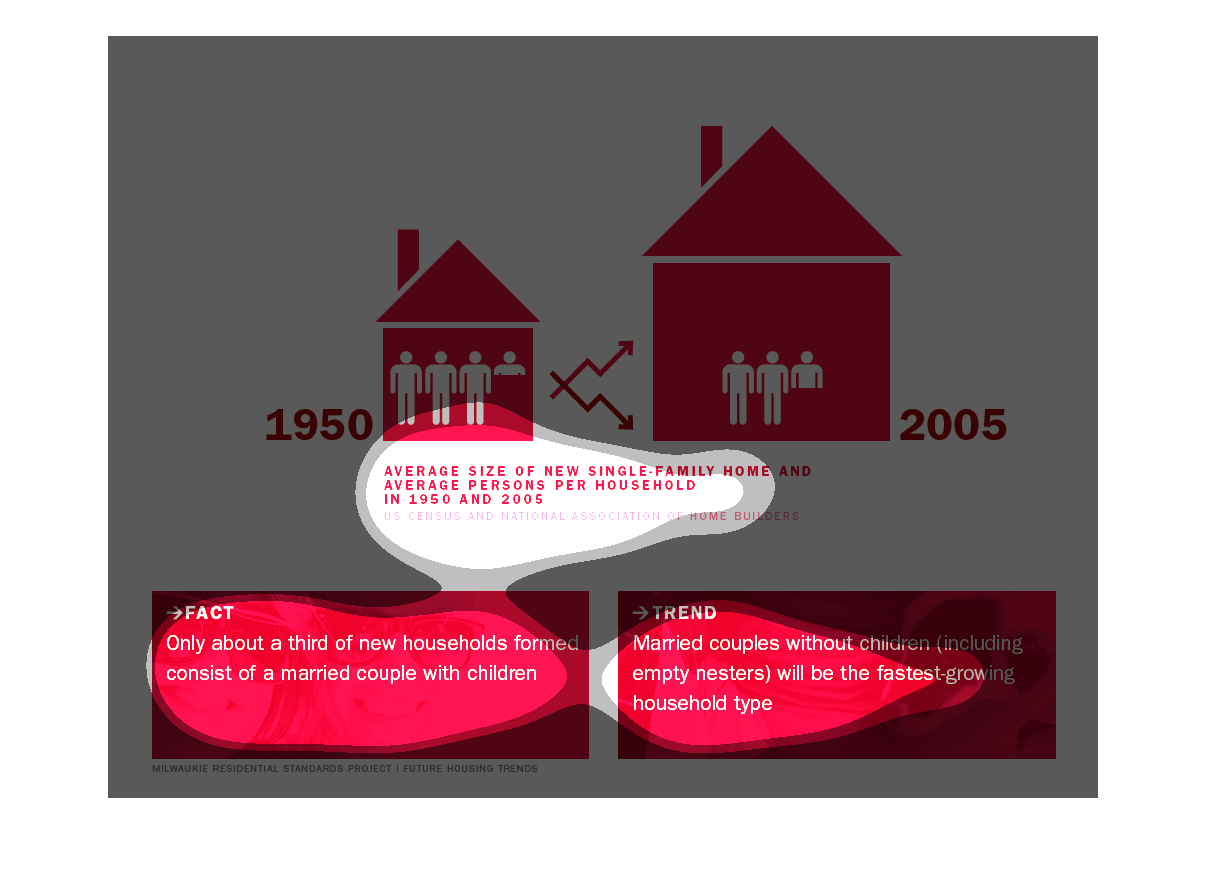
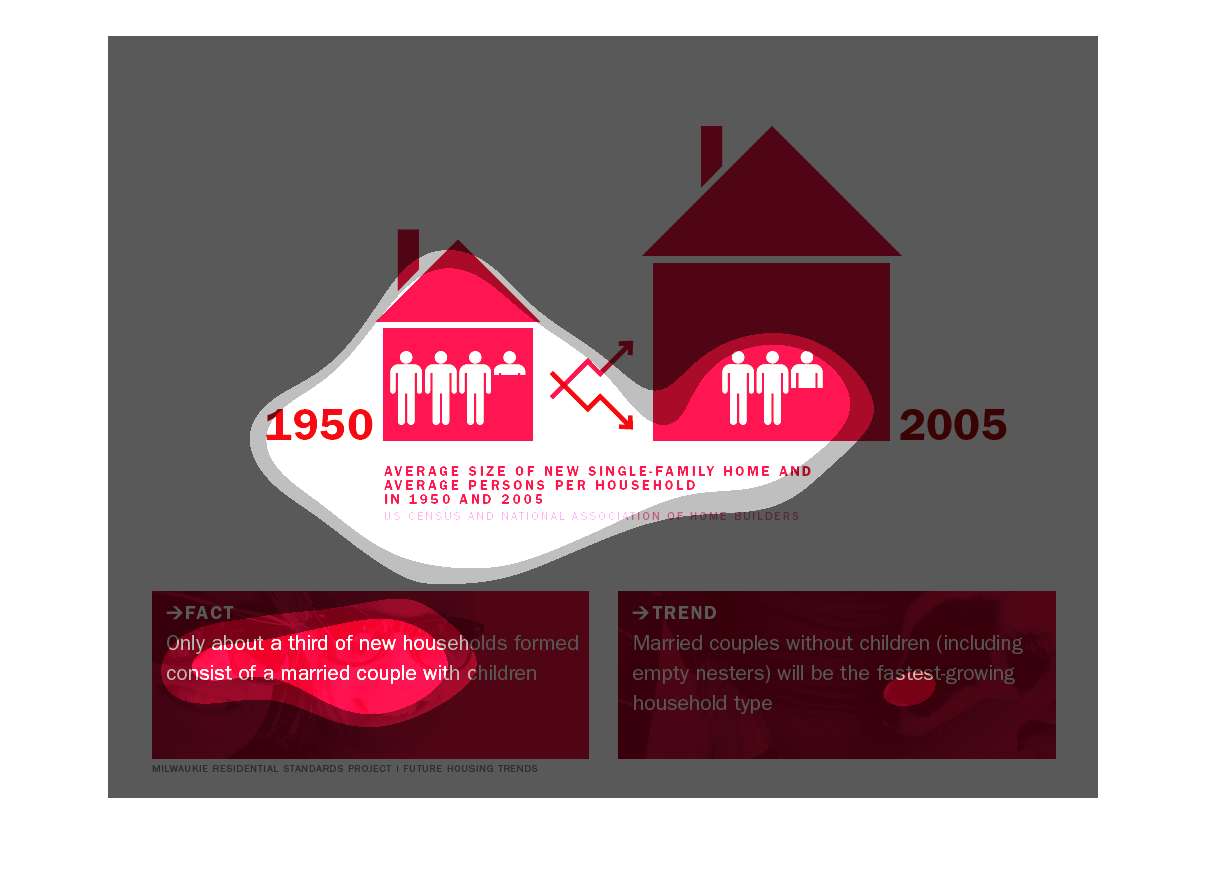
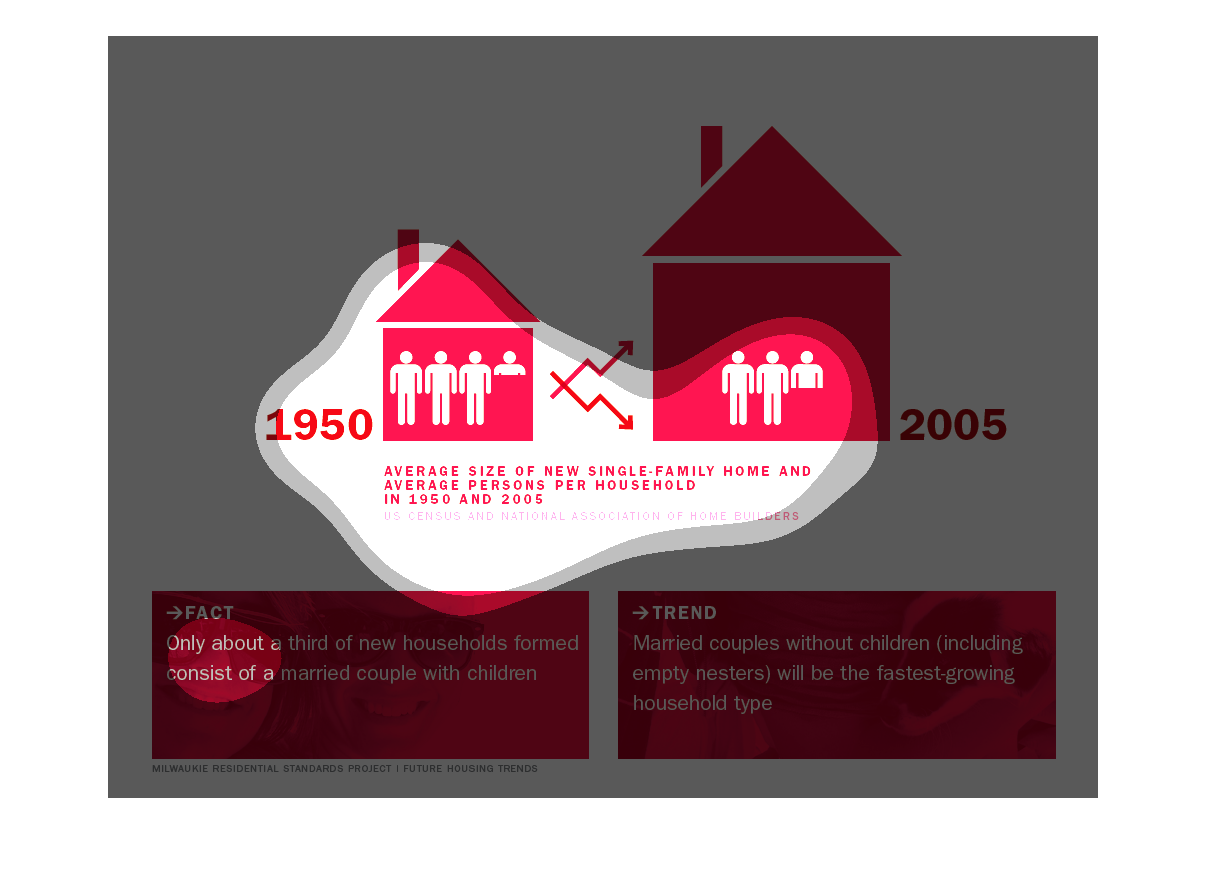
This graphic shows the difference to scale of a new single family home between 1950 and 2005
in the United States and the size of the household. On average, the size of the home has increased
drastically while the size of the household has decreased.
In this picture it shows two houses one from the 1950s which is so much smaller than one of
the houses from the year 2005 which is so much bigger than back in the day.
This illustrations shows how back in the 50s we lived a much simpler and natural life, and
these days all we care about is possessions and taking up space we might not really need.
This chart describes that only about a third of new households formed consist of a married
couple with children. And married couples without children will be the fastest growing household
type.
The image on the left hand side is depicting that houses within the past 55 years have grown
dramatically.  However, the people per capita in a household has not changed.  Therefore meaning
that individuals need more square feet per person in order to be comfortable.
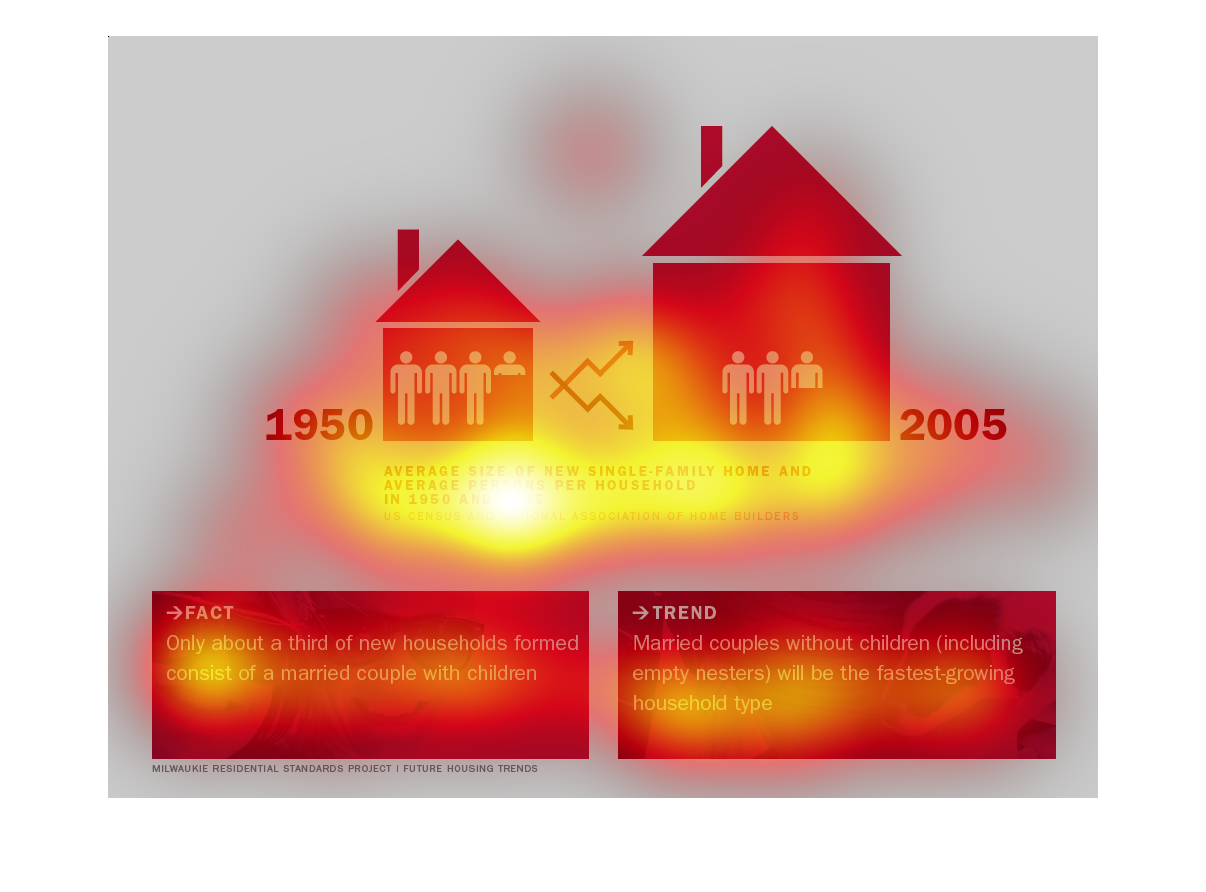
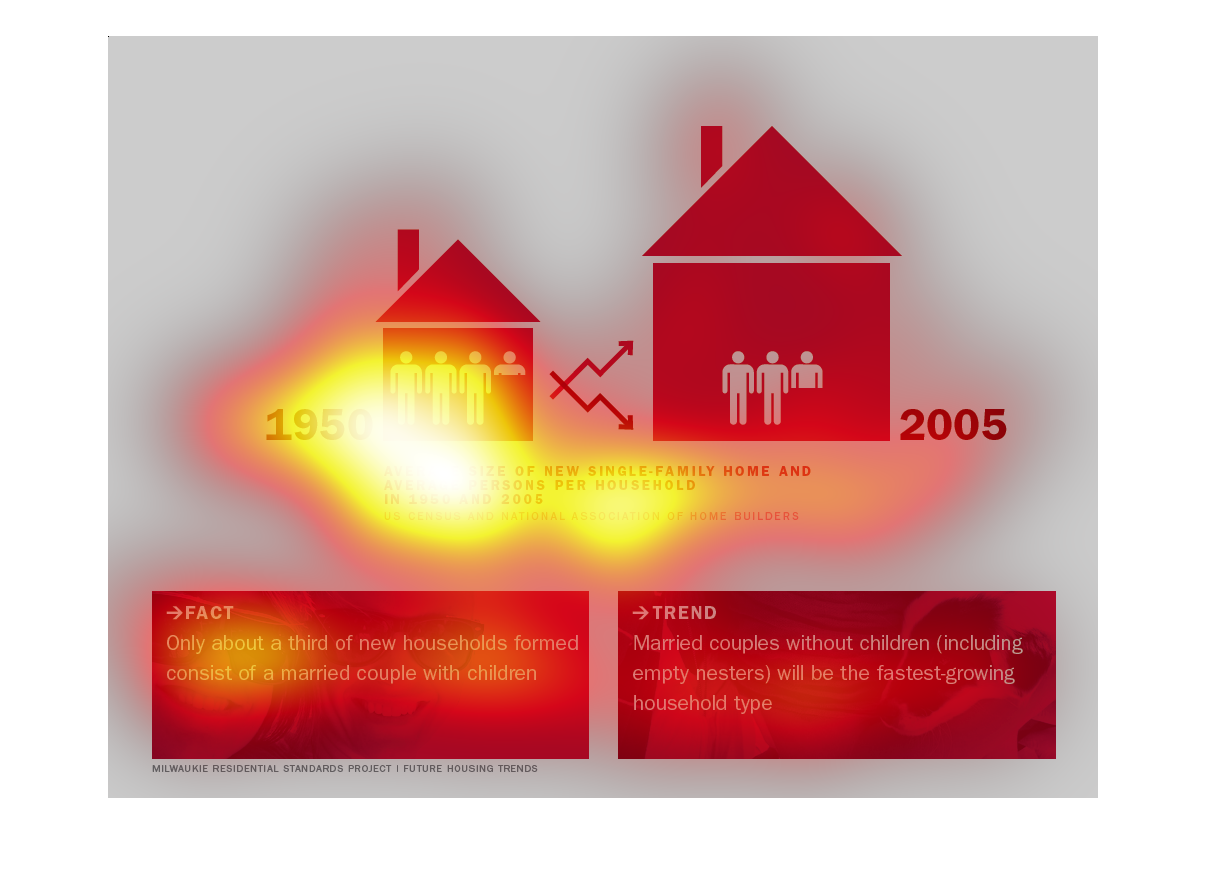
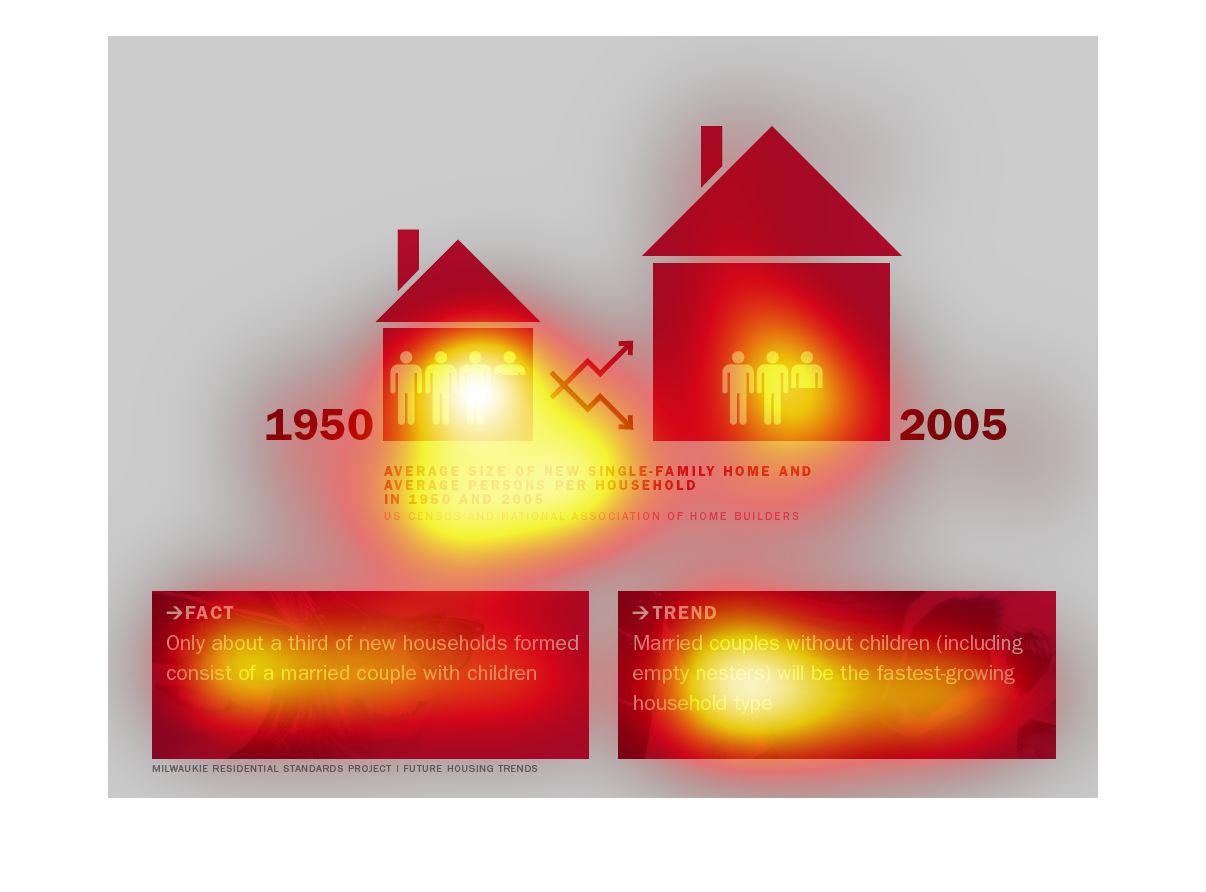
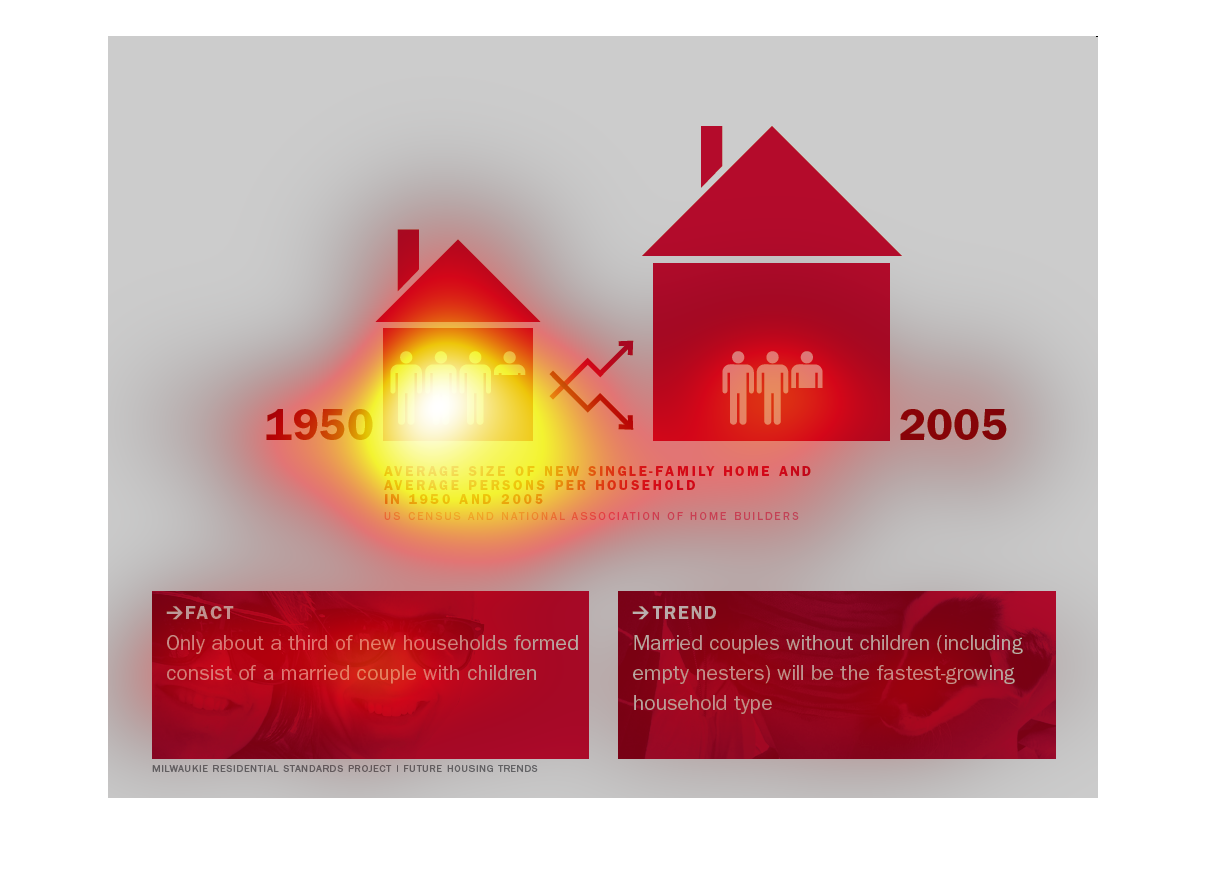
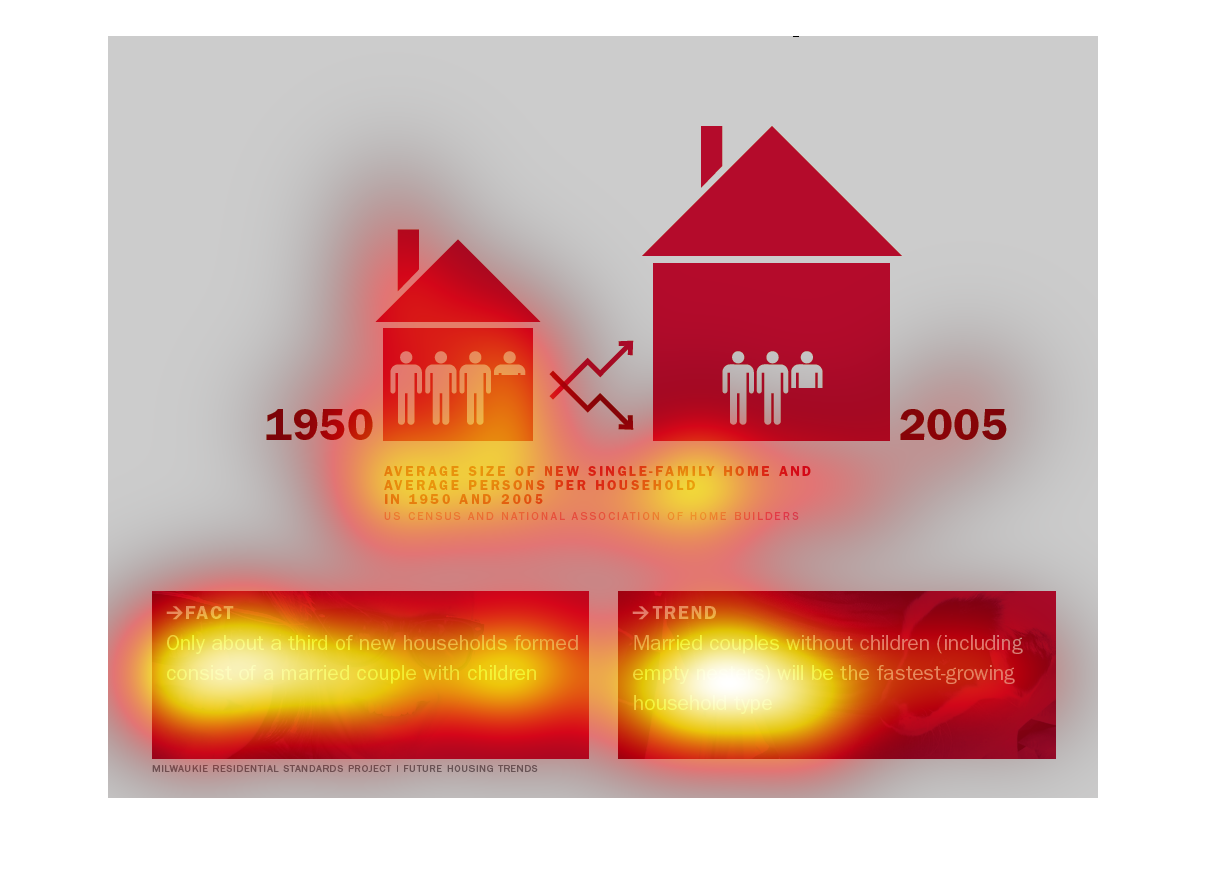
Between 1950 and 2005, the size of the average American home more than doubled in size, while
the size of the average family fell by about 2/3. In the future, married couples without children
will be the fastest growing type of household.
This infographic is about housing and the number of new single family homes that are built
as well as the number of persons that are living in the average household in 2008.
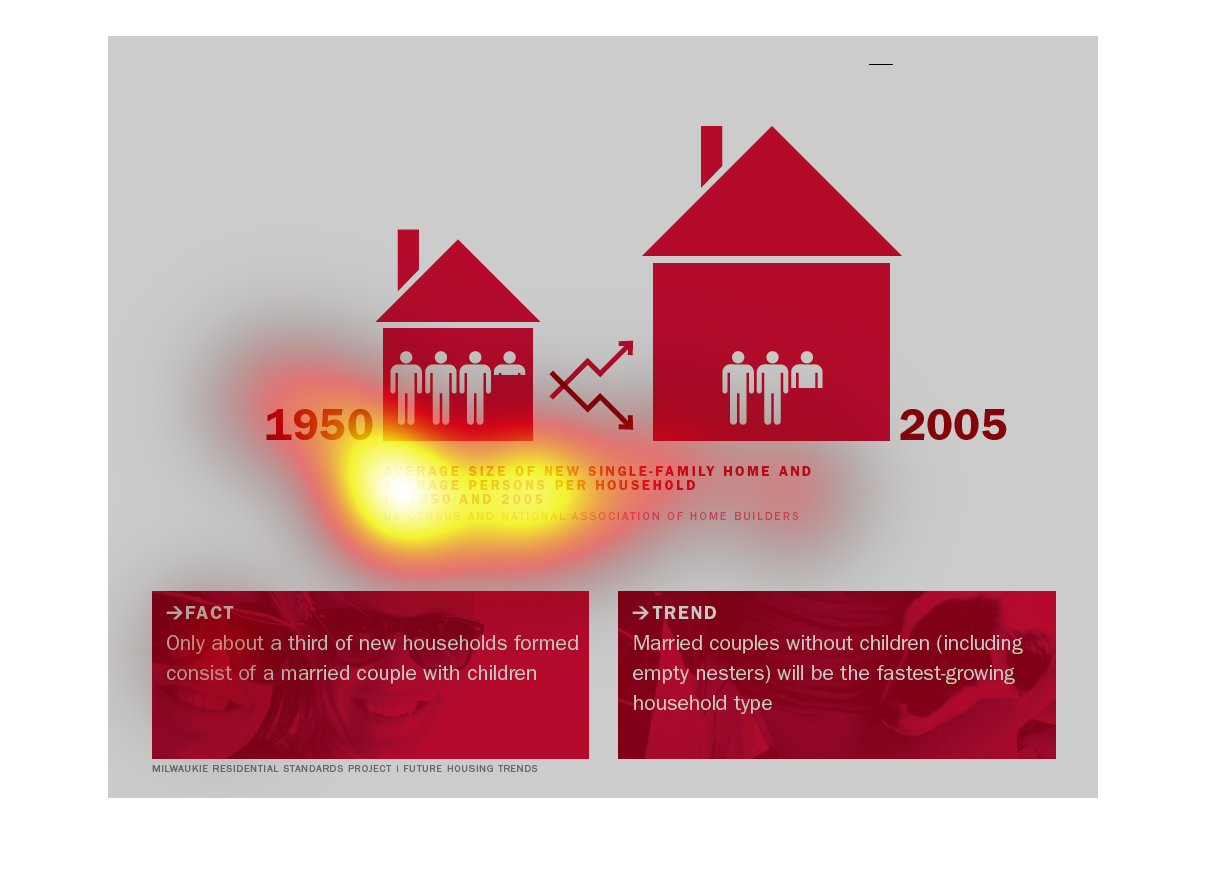
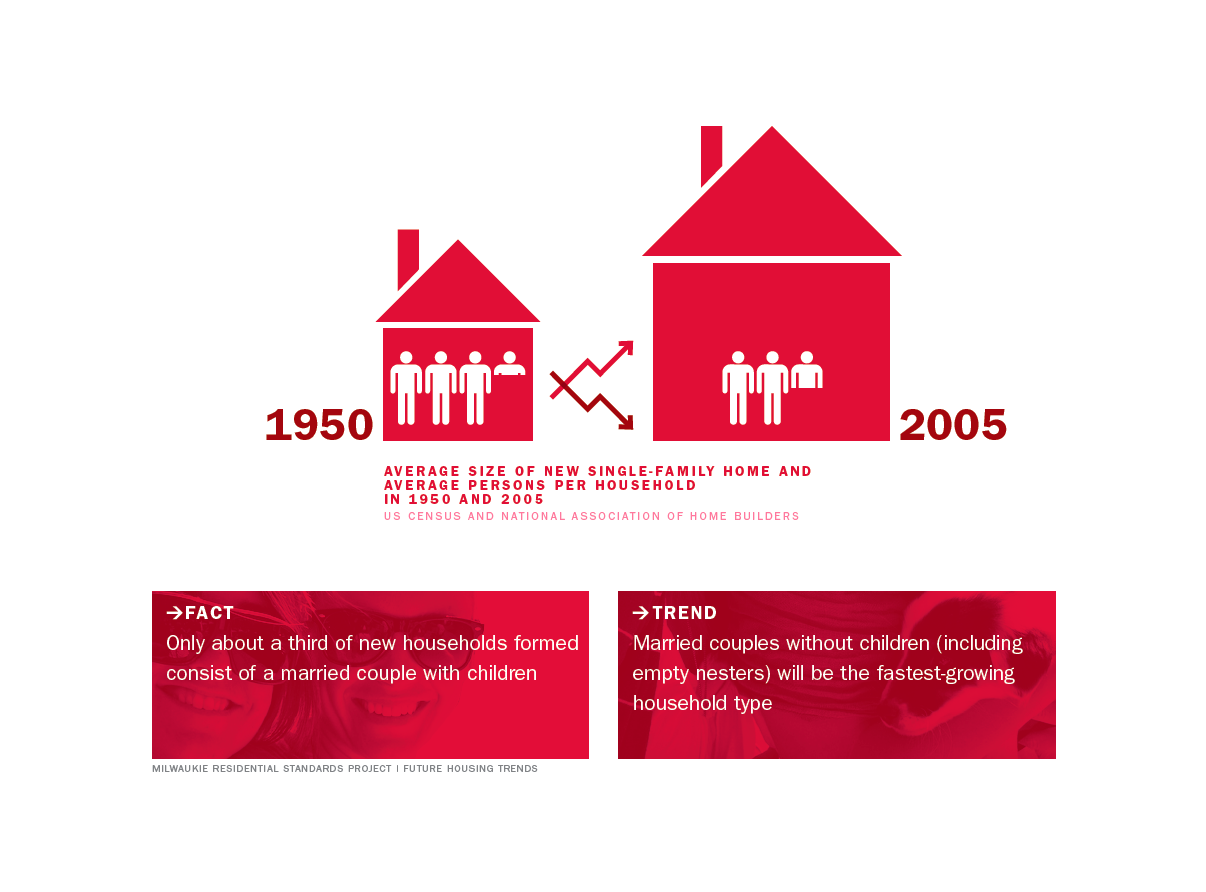
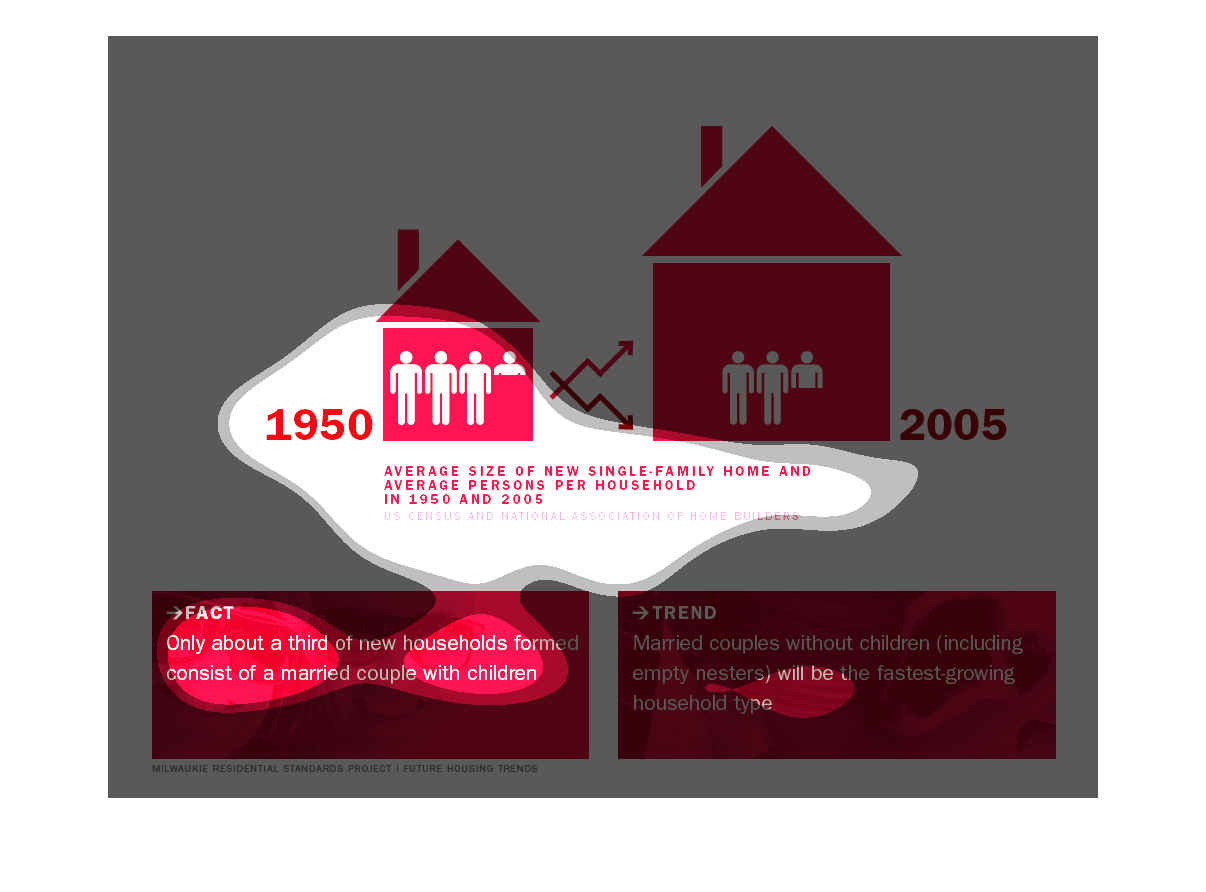
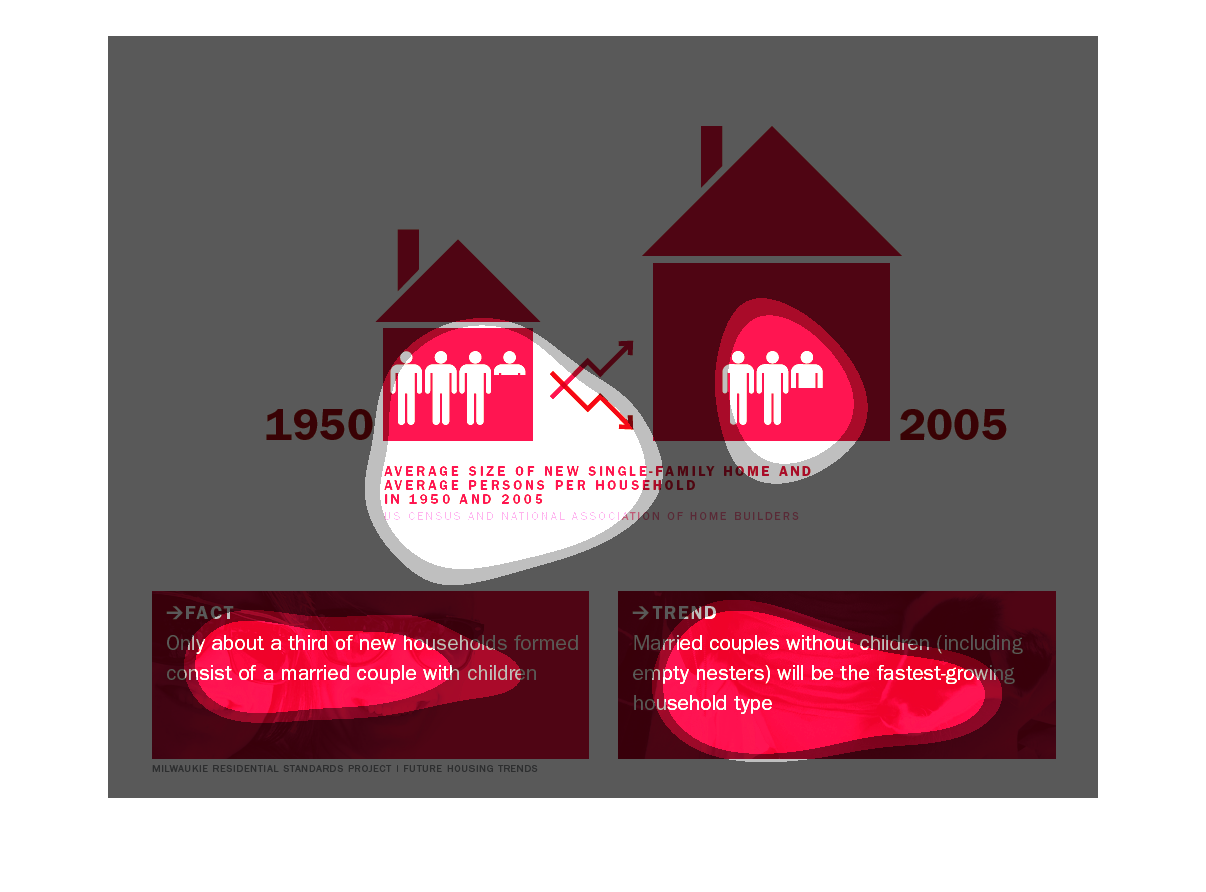
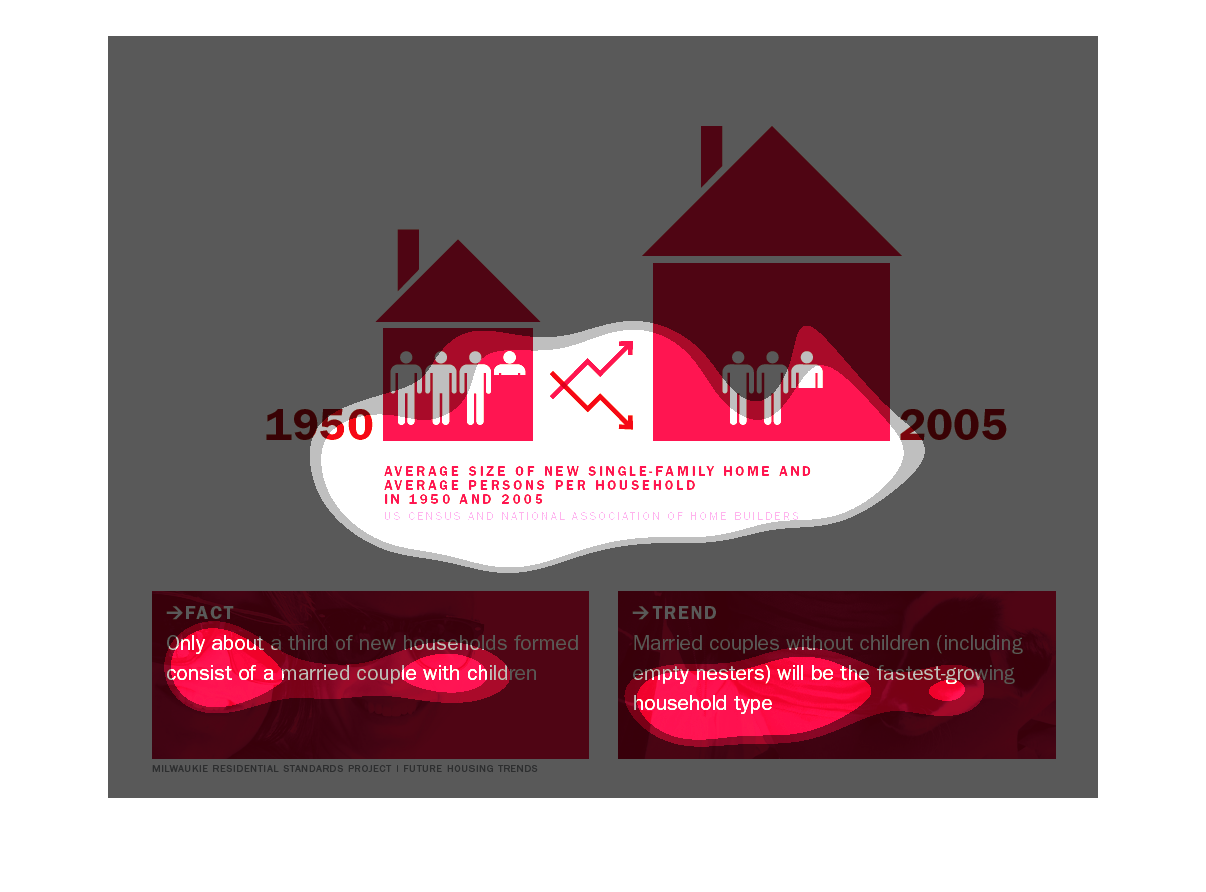
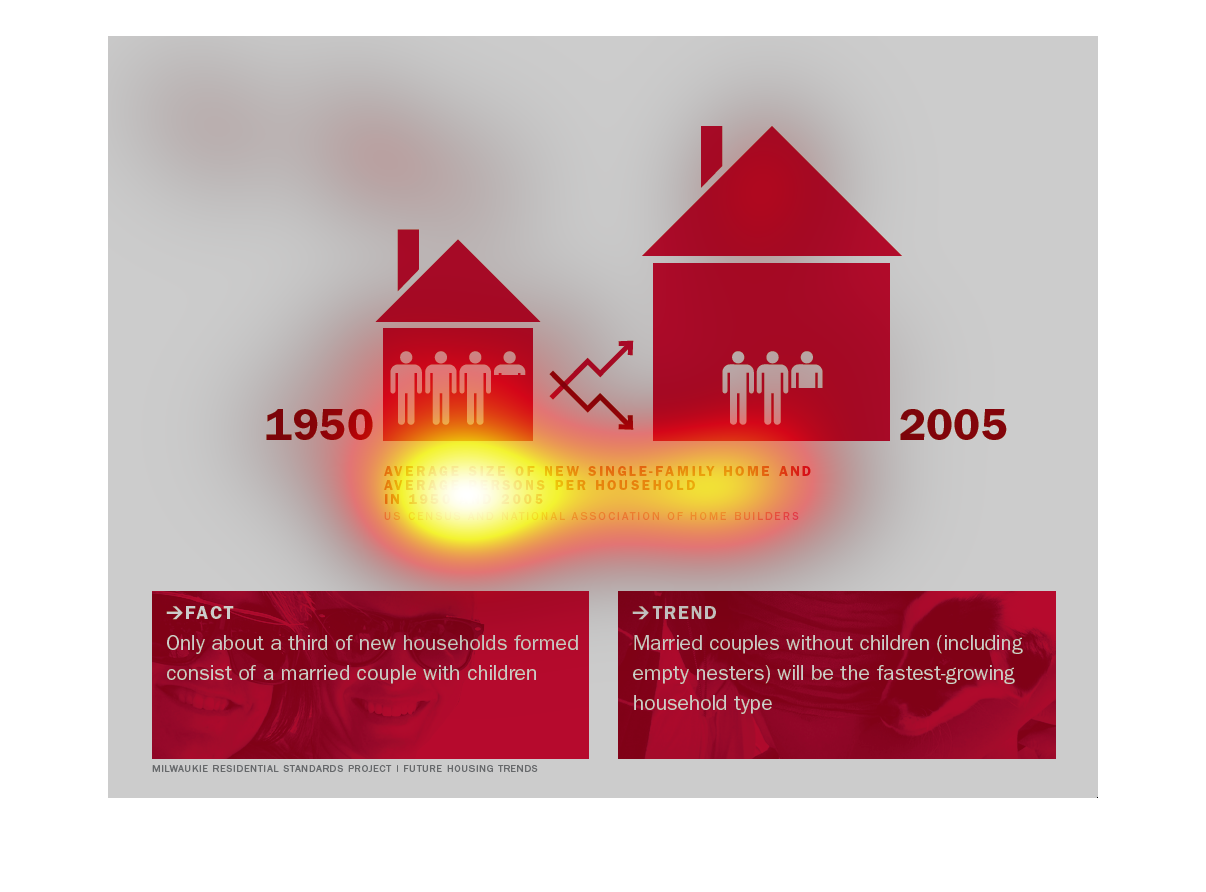
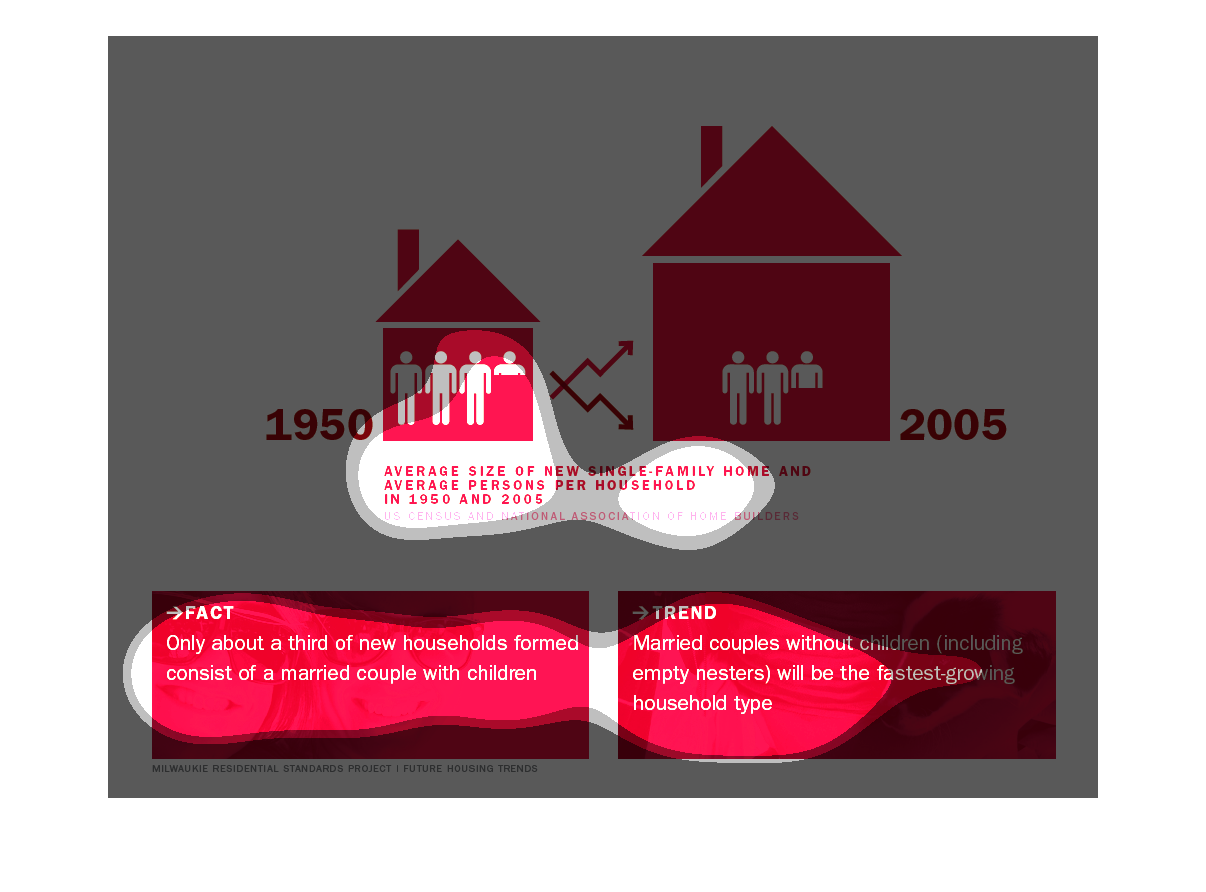
The image compares the size of new, single-family homes and the average persons per household
in 1960 to that of 2005. In 1950, an average of 3.25 people resided in a home one-third the
size of homes today that only house an average of 2.5 people.   Also as of 2005, about one-third
of new households formed are by married couples without children, making them the fastest
growing household type.
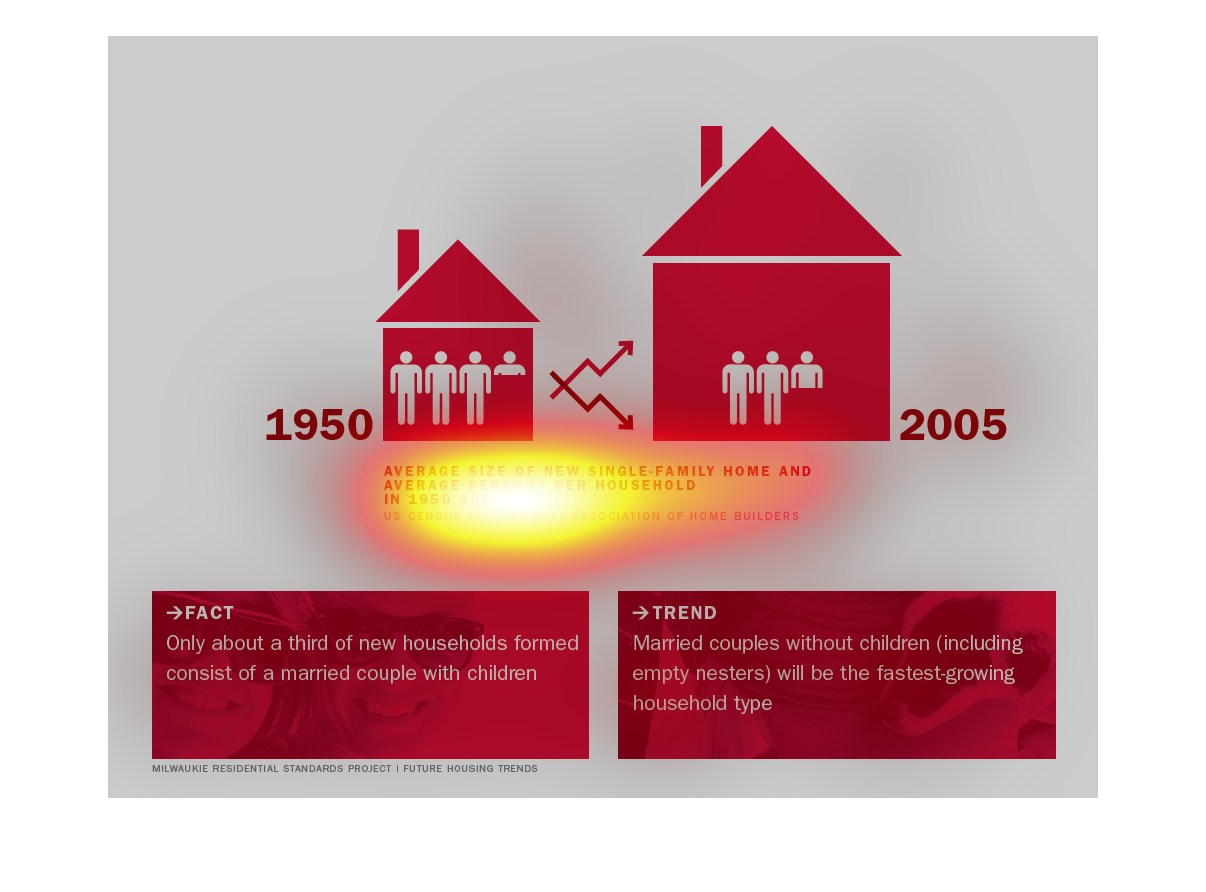
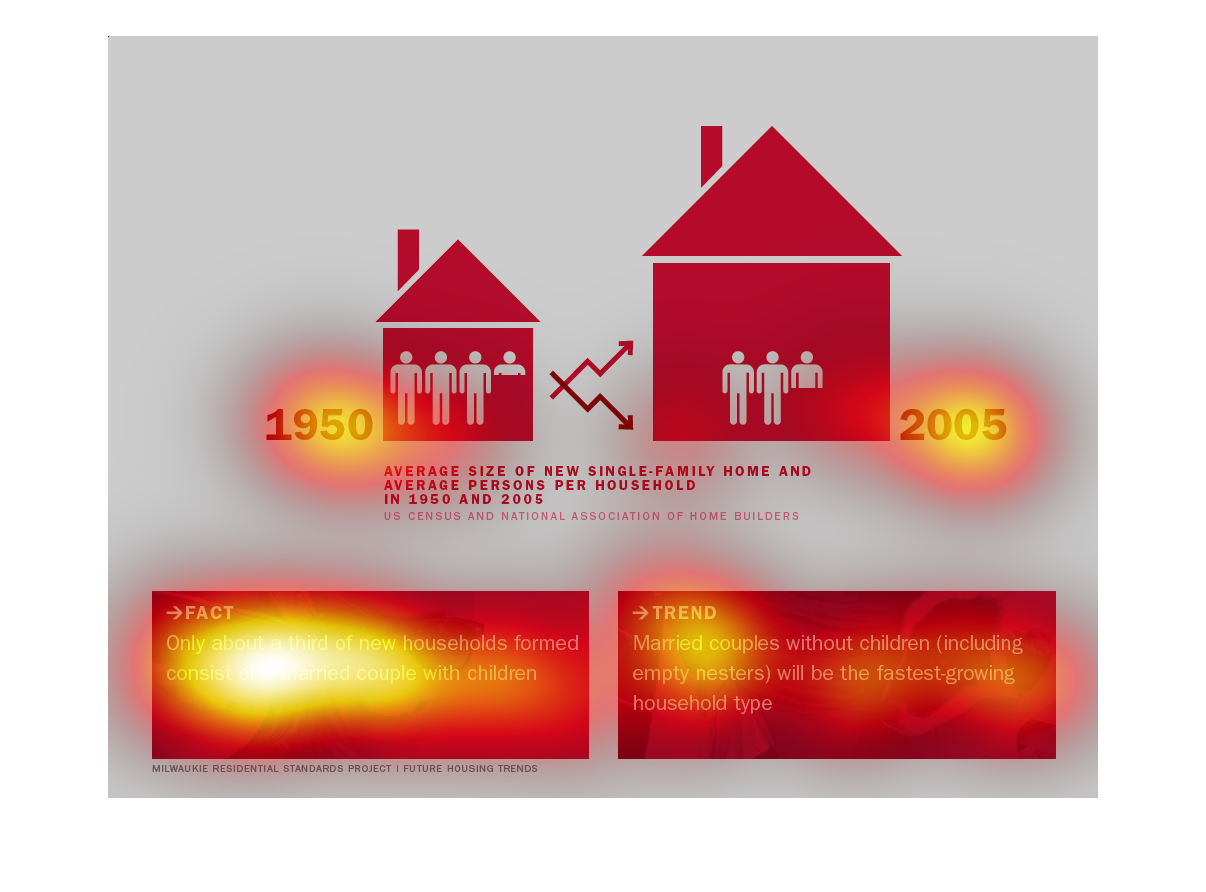
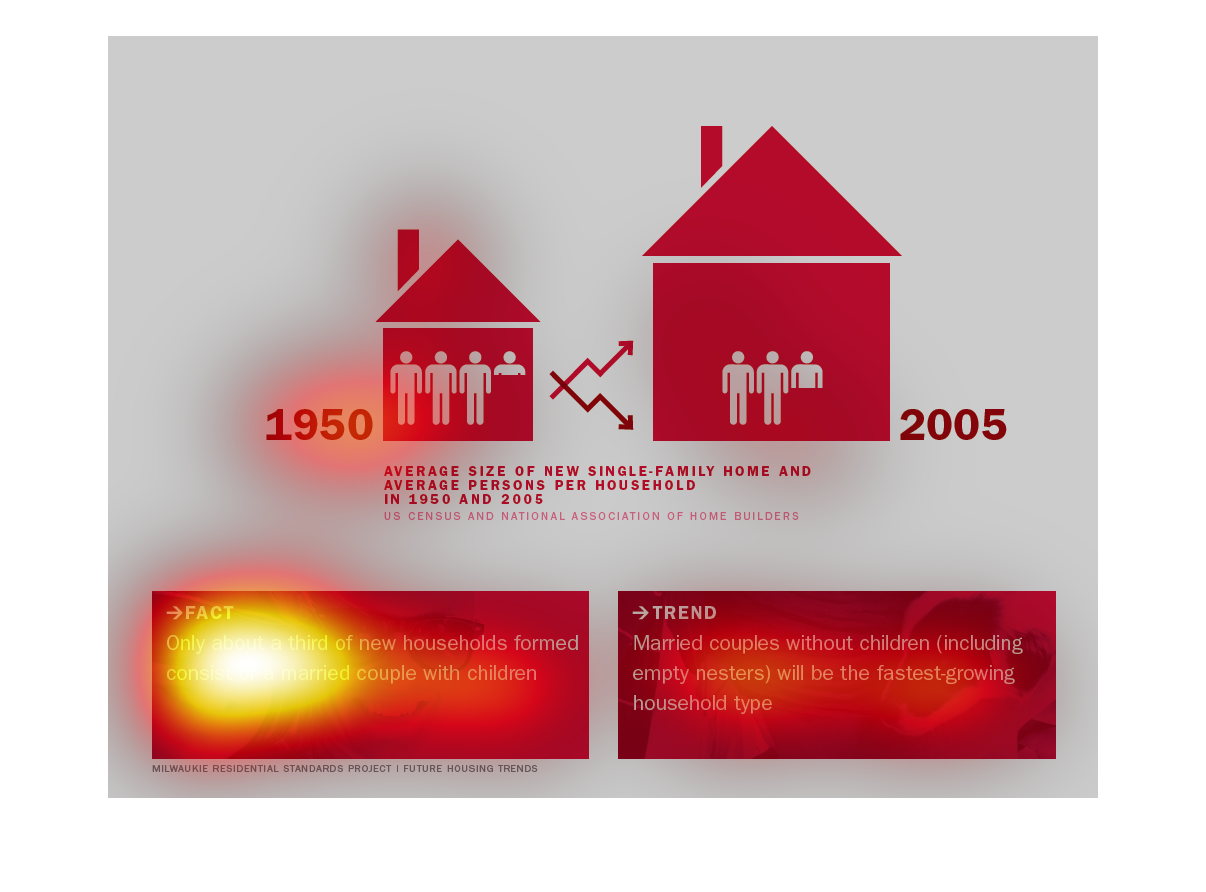
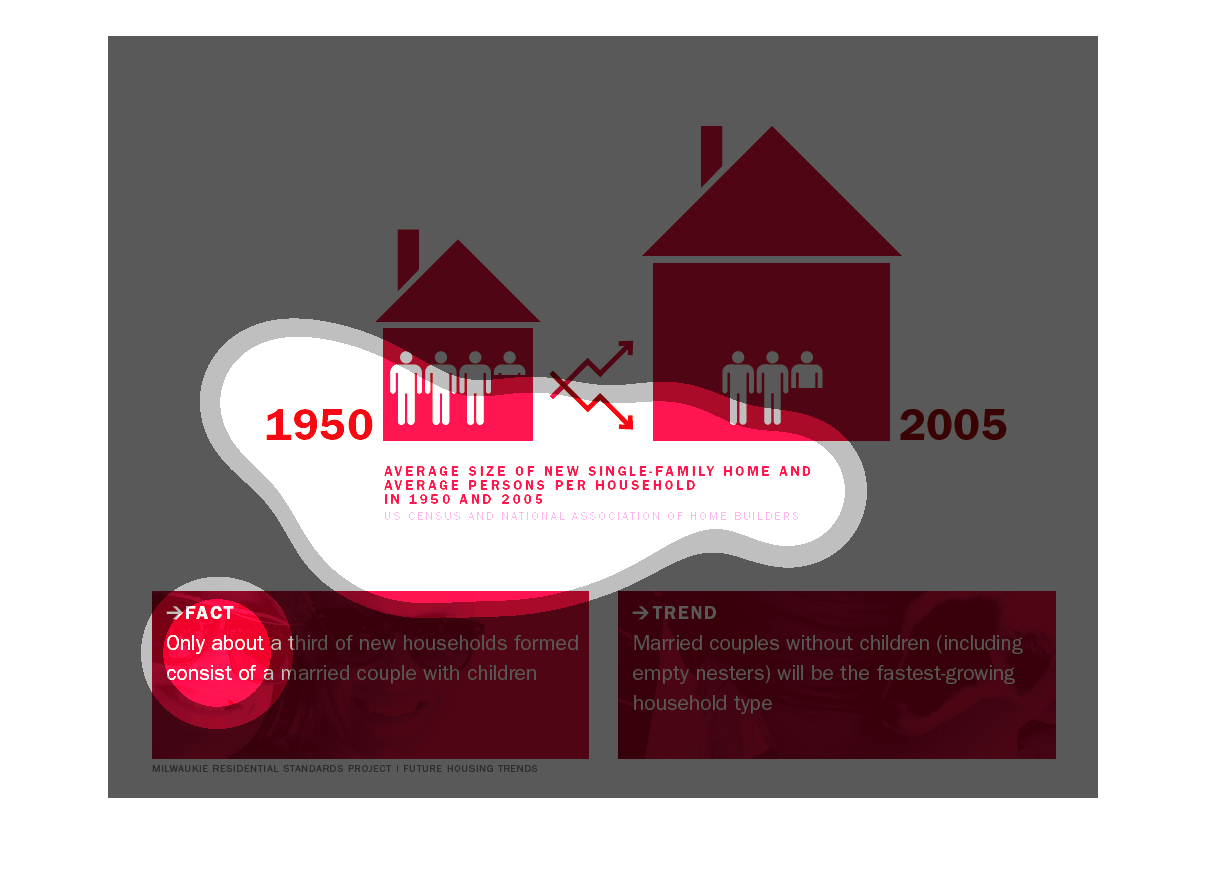
This chart clearly displays the average size of new single-family home and average person
per household in the years 1950 and 2005. It shows that each person today has much more room
in an overall larger house, with a total of less people in each house.
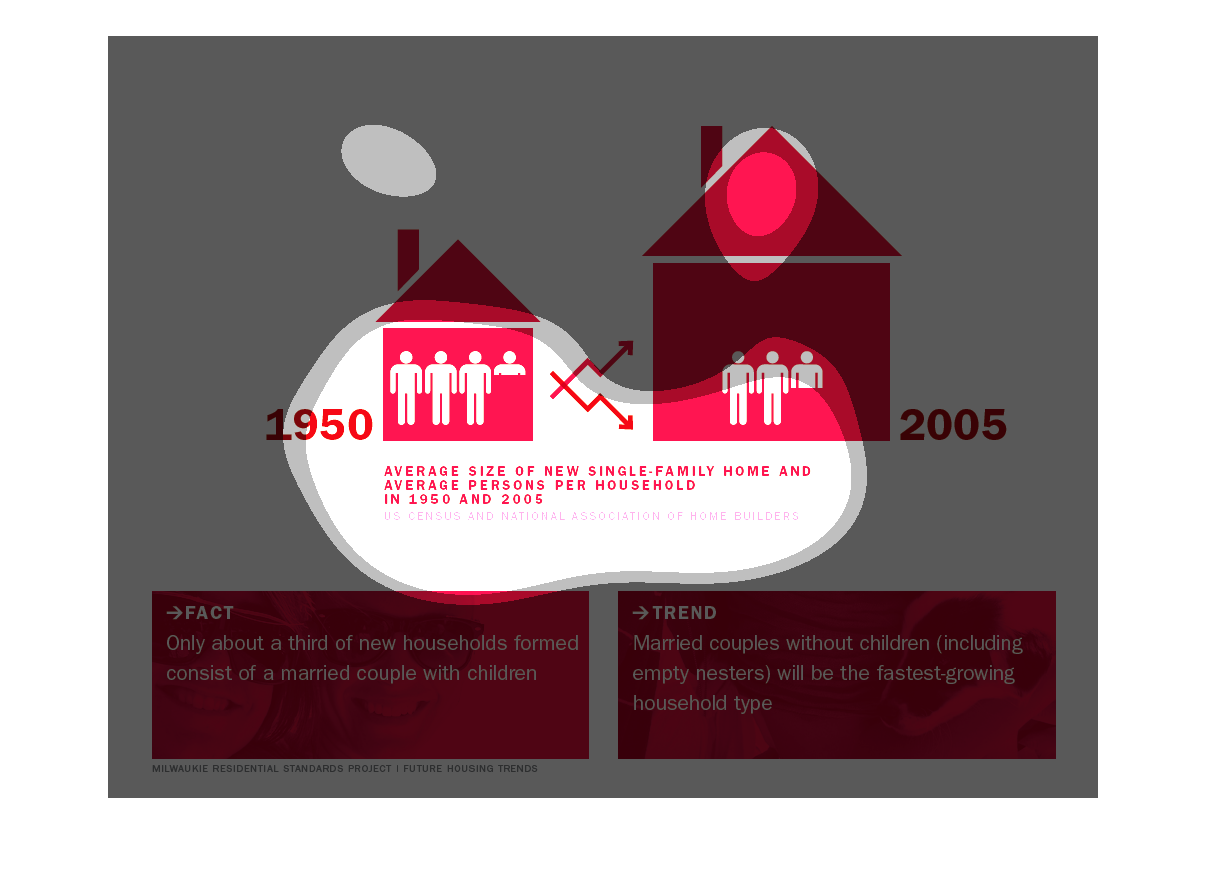
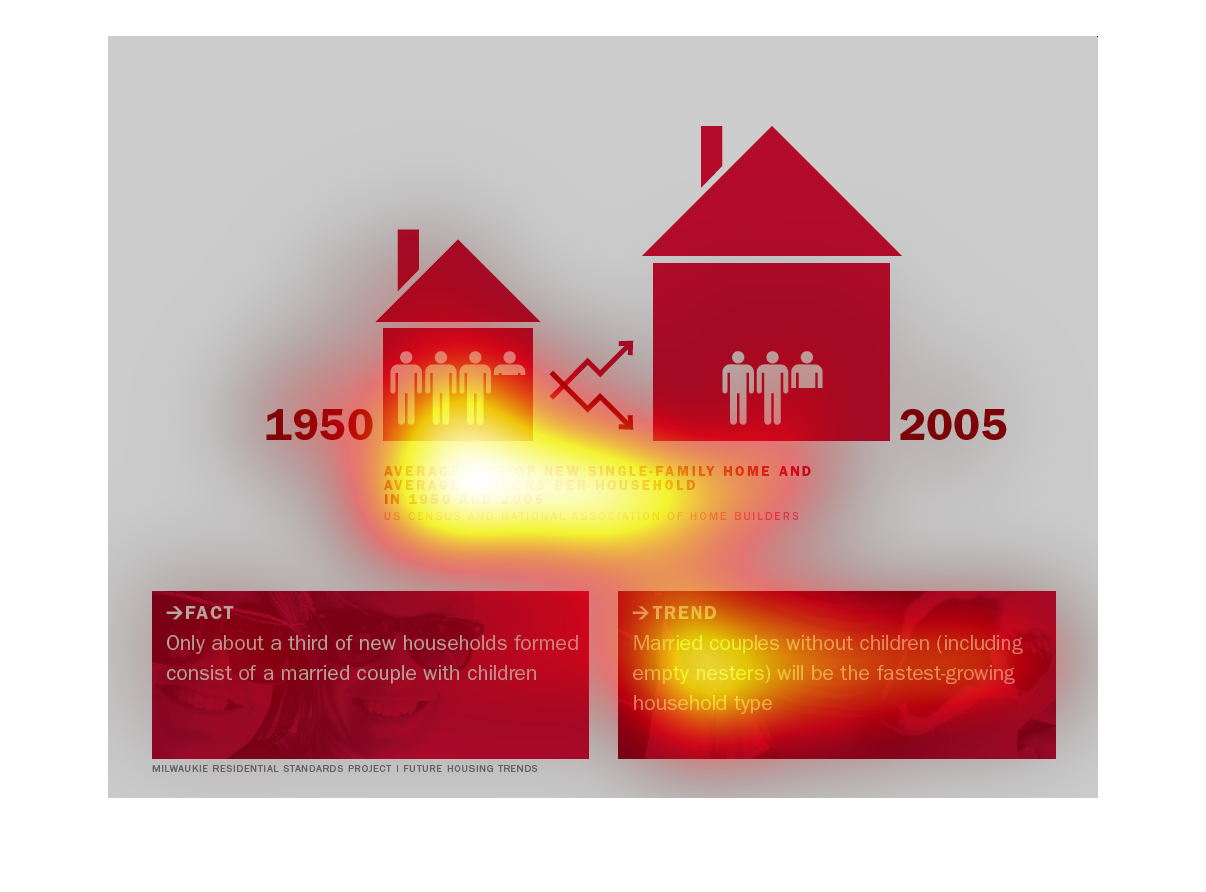
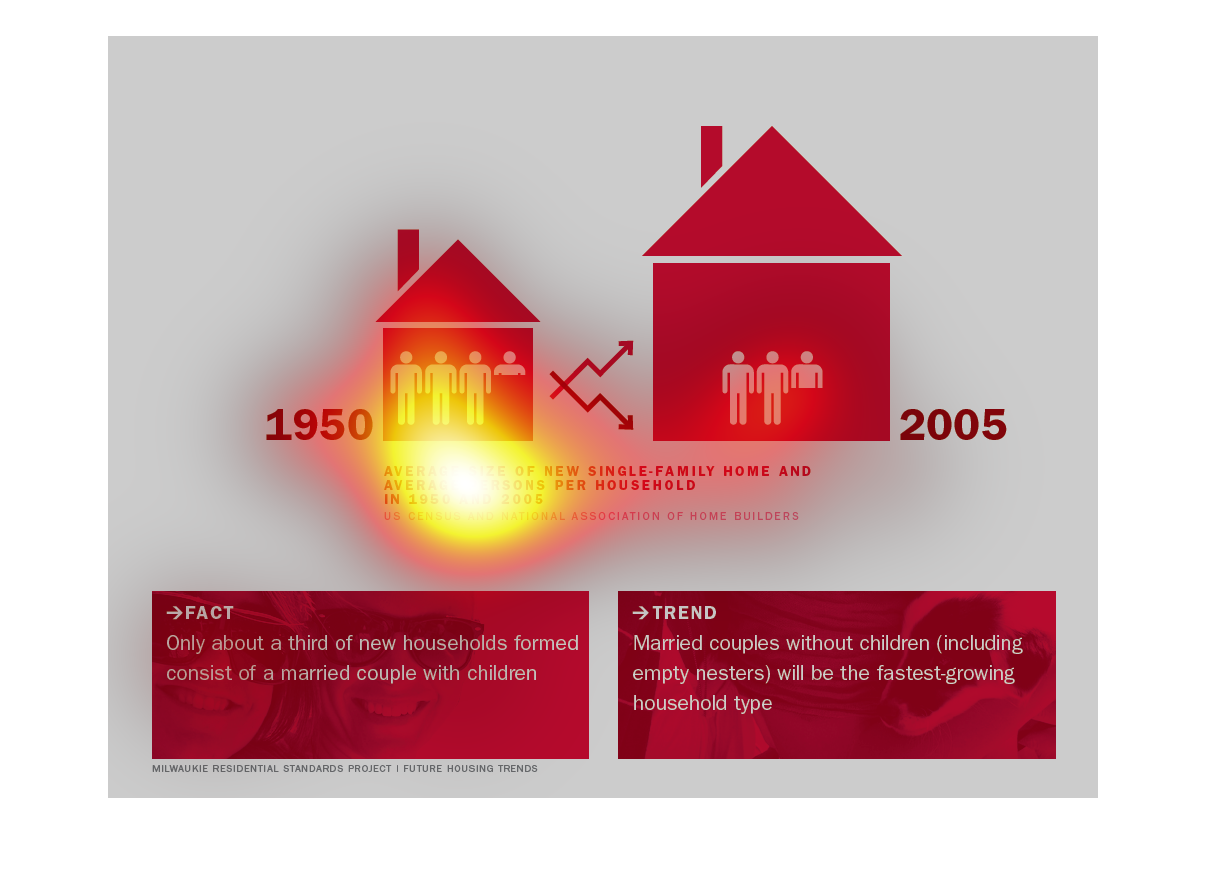
This image shows the differences between home and household size, comparing the years 1950
and 2005. There are no units as far as home size is represented, but the average home in 2005
appears to be 2 to 3 times larger than the average home in 1950. The average household size
in 1950 was 3.25, compared to 2.5 in 2005.
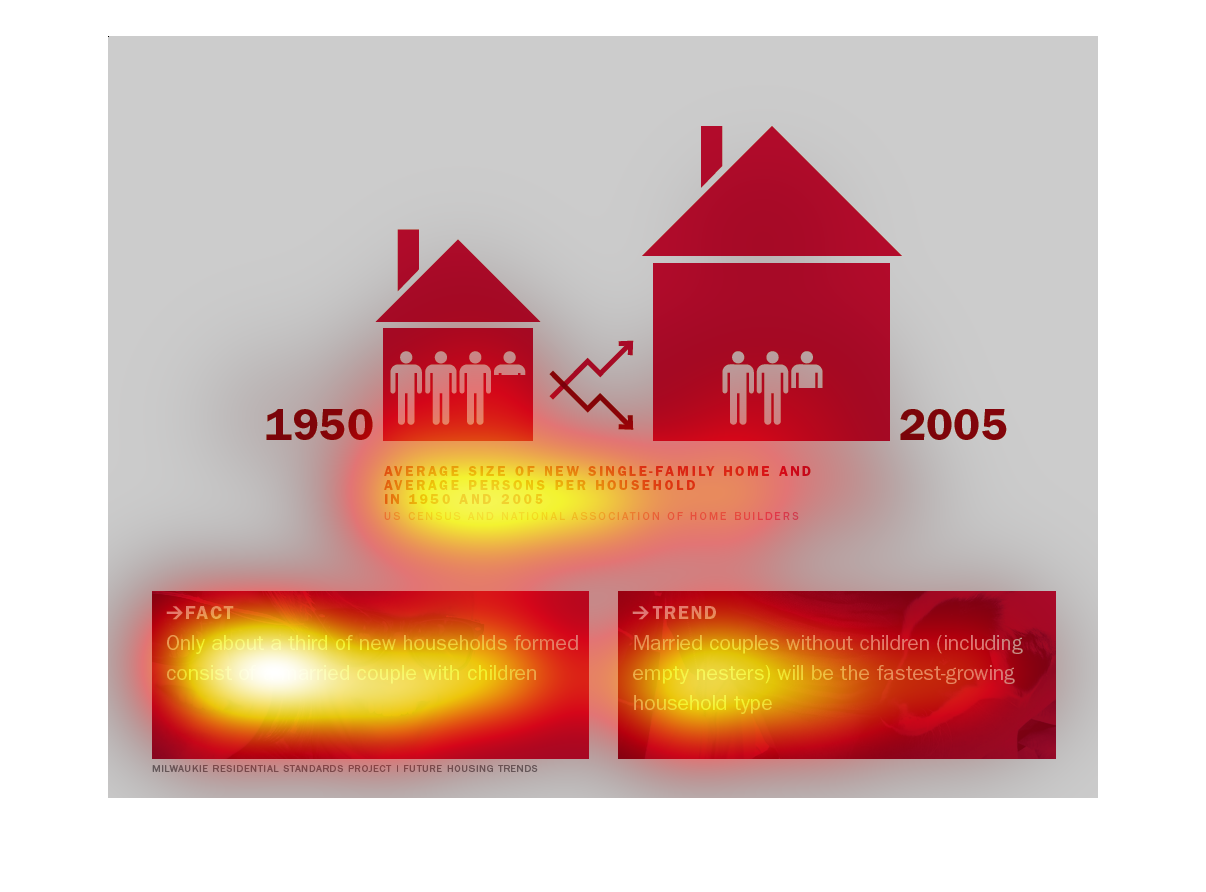
This image depicts the average size of a single family home in 1950 and 2005.  It also shows
some interesting facts about new home ownership.  For example, only about 1/3 of new homes
consist of a married couple with children.  It also shows that married couples without kids
will be the fastest growing household type.
This looks at the average sizes of single family homes and people per homes, comparing 1950
and 2005. In 1950 we saw about 3.25 per household in a house about half the size of today,
which sees about 2.5 people. Overall, houses got bigger with less people.
This is an infographic comparing the sizes of households in terms of number of individuals
and house sizes from 1950 to 2005. Houses got bigger, while the number of people in families
went down.
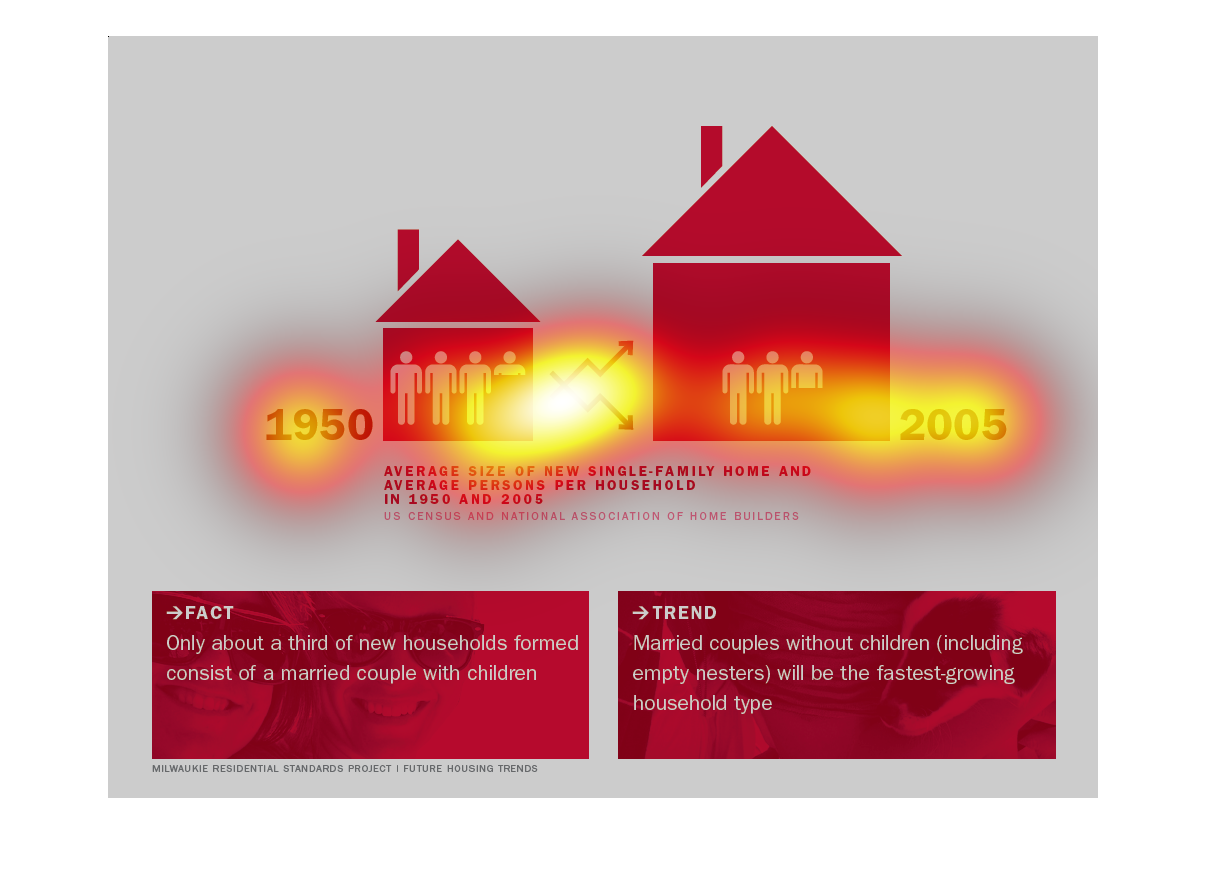
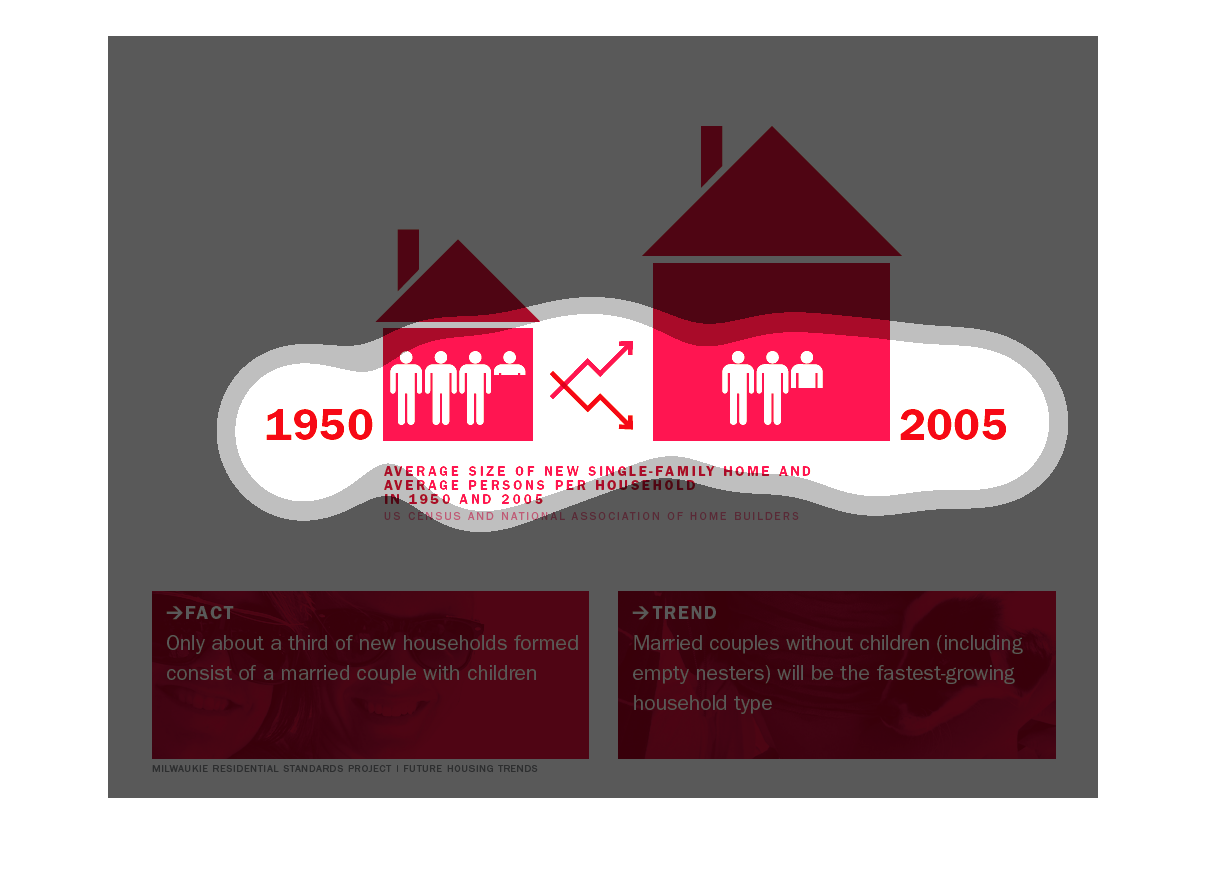
Table shows from 1950 to 2005, 3.5 people to 2.5 people average size of single family homes
and average person per household. Only a 3rd of households formed consists of married couples
with children.  married couples without children will be the fastest growing trend according
to the US Census and National Association of Home Builders.