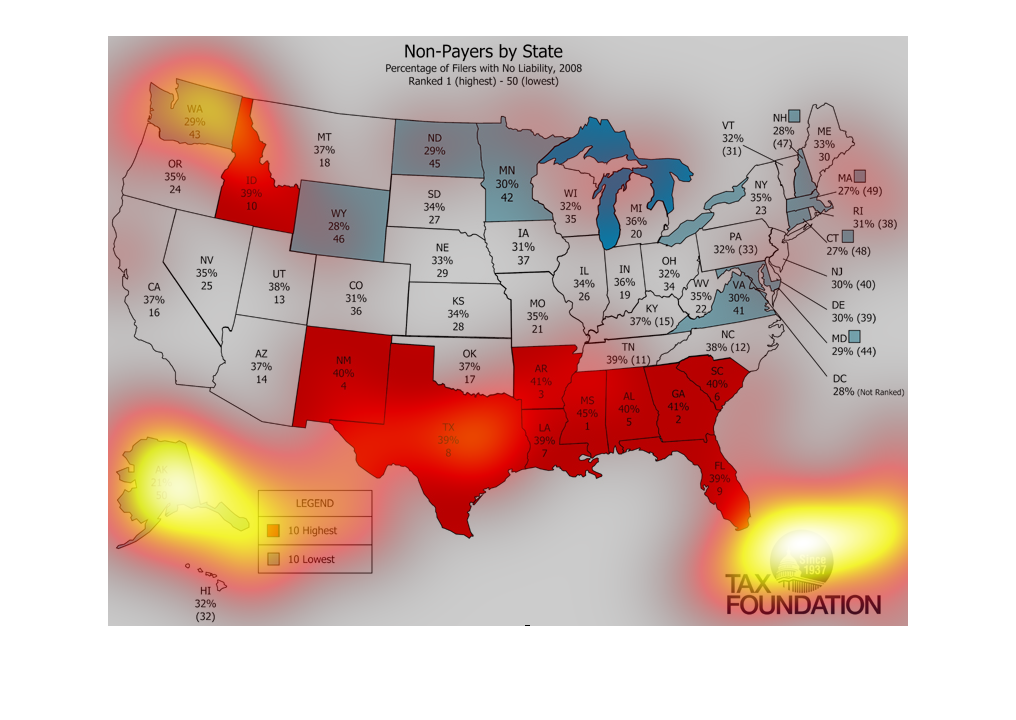
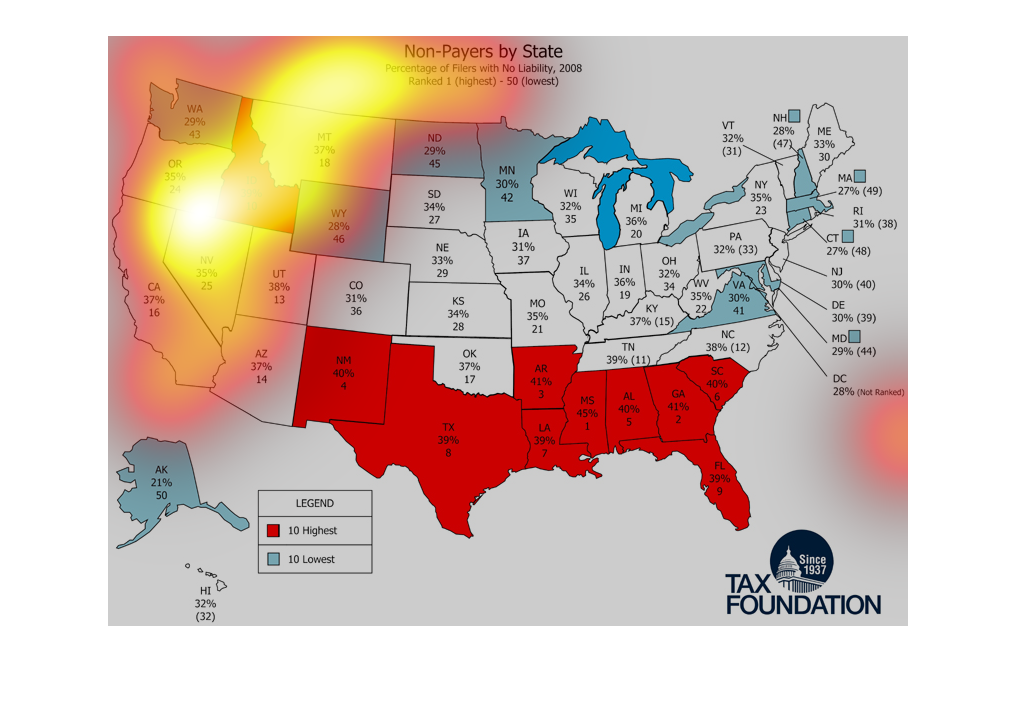
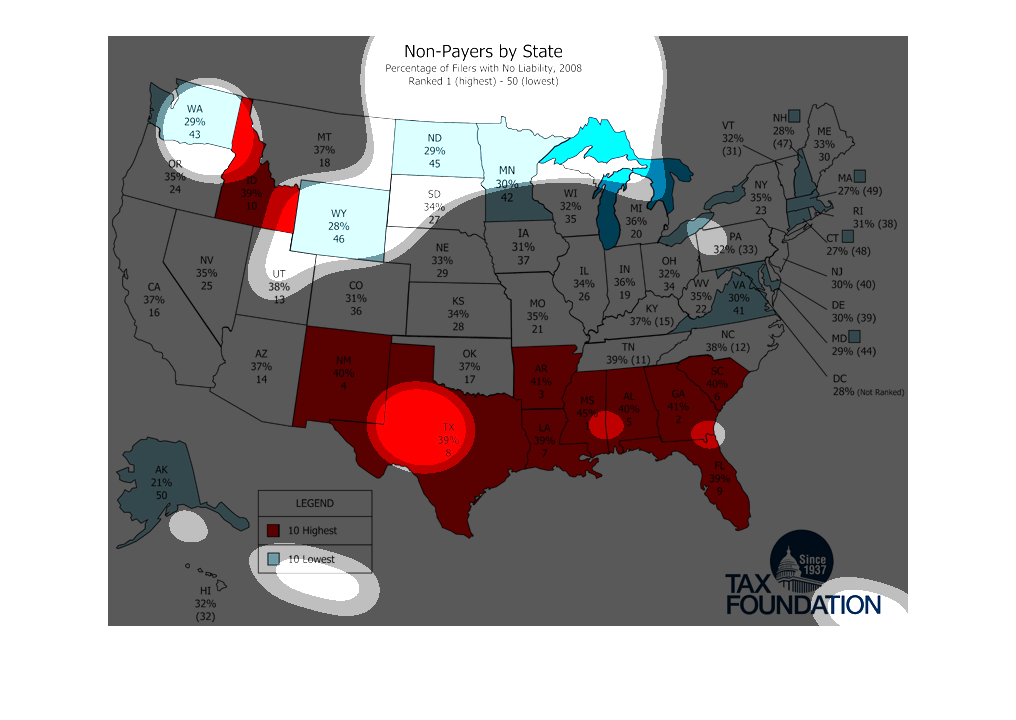
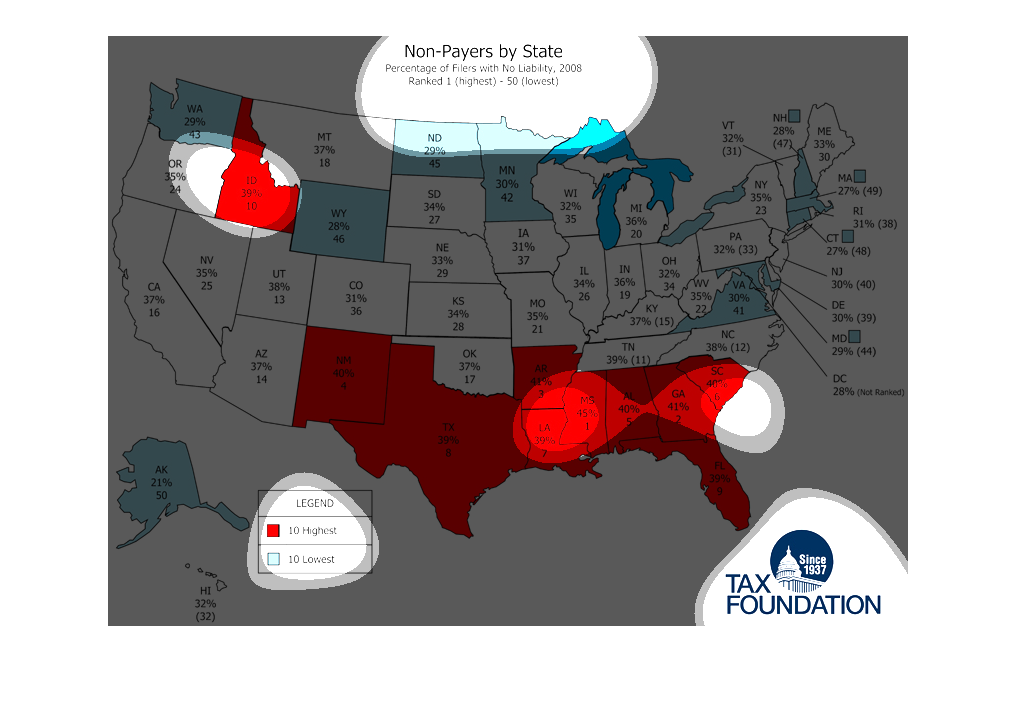
10 highest, and ten lowest payers by state, red and blue represented by blue and red states
on a map. not all states are represented on the map. mostly souther states are red and some
northern states are  blue.
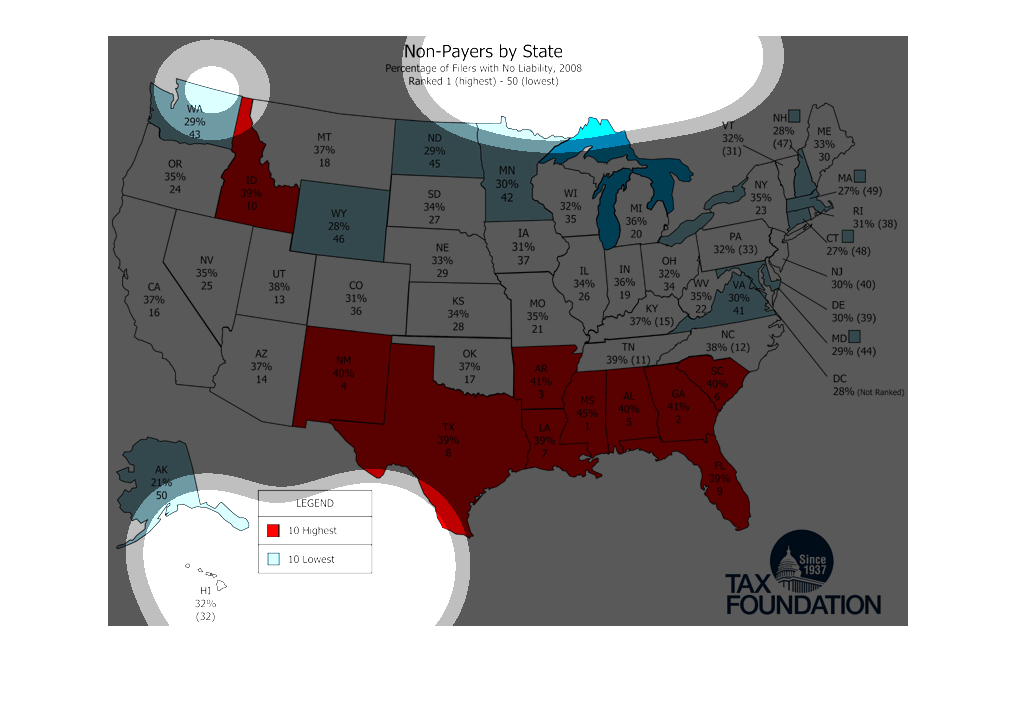
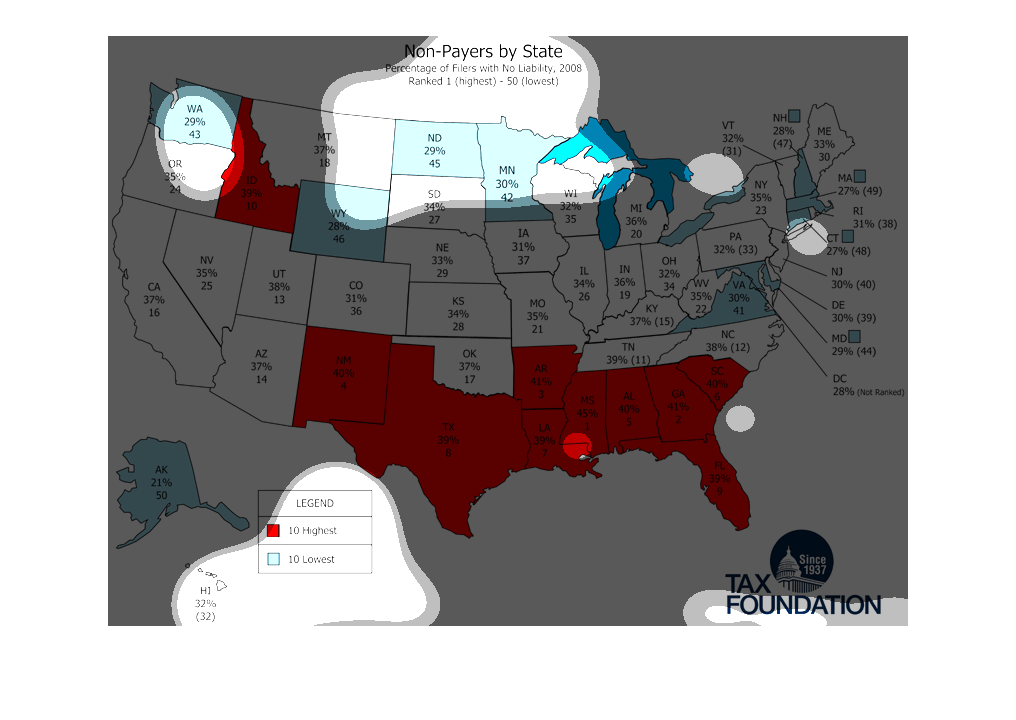
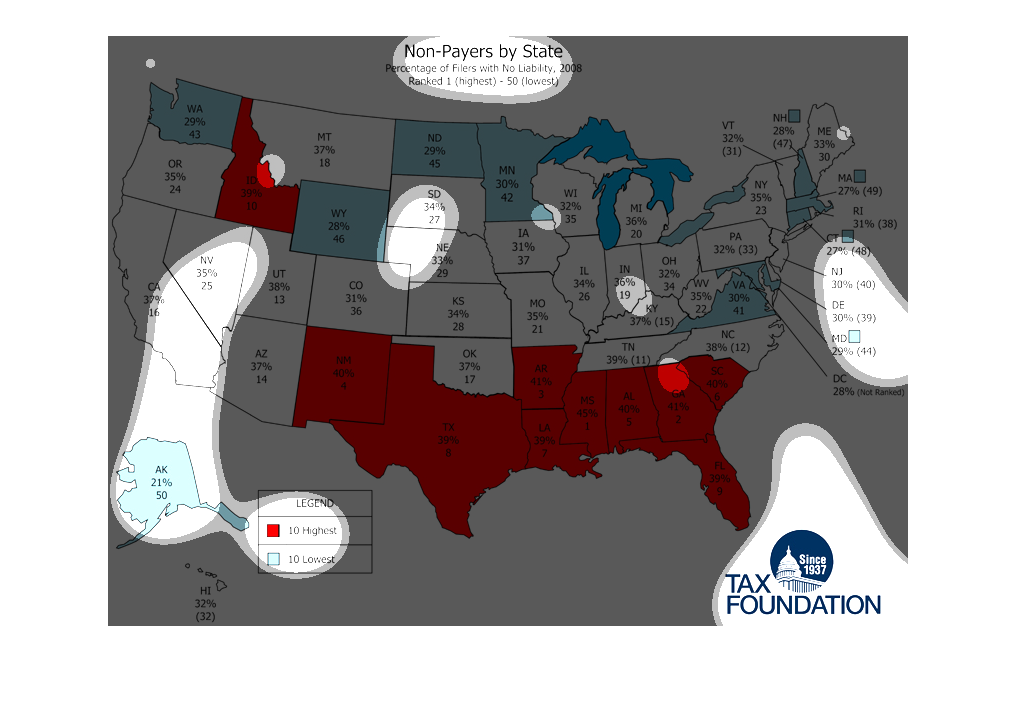
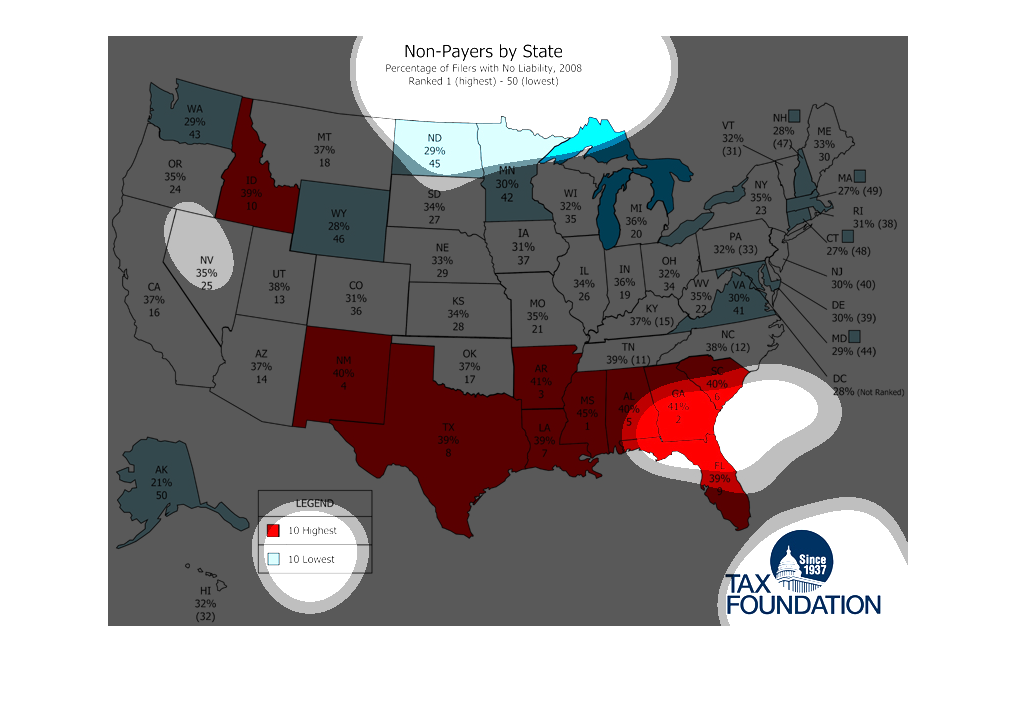
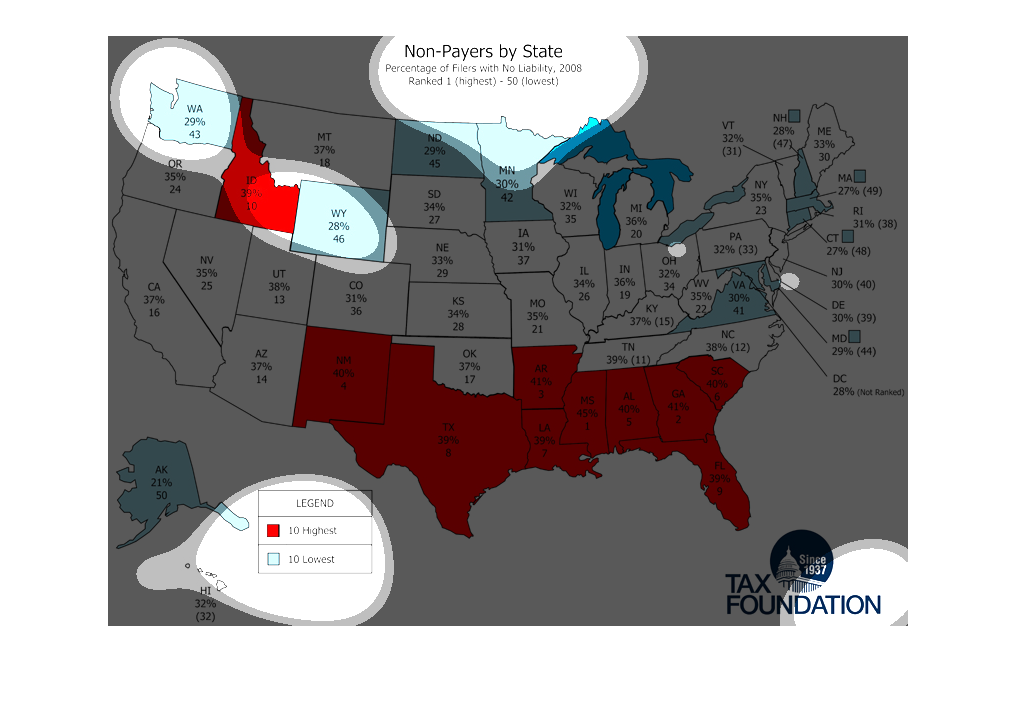
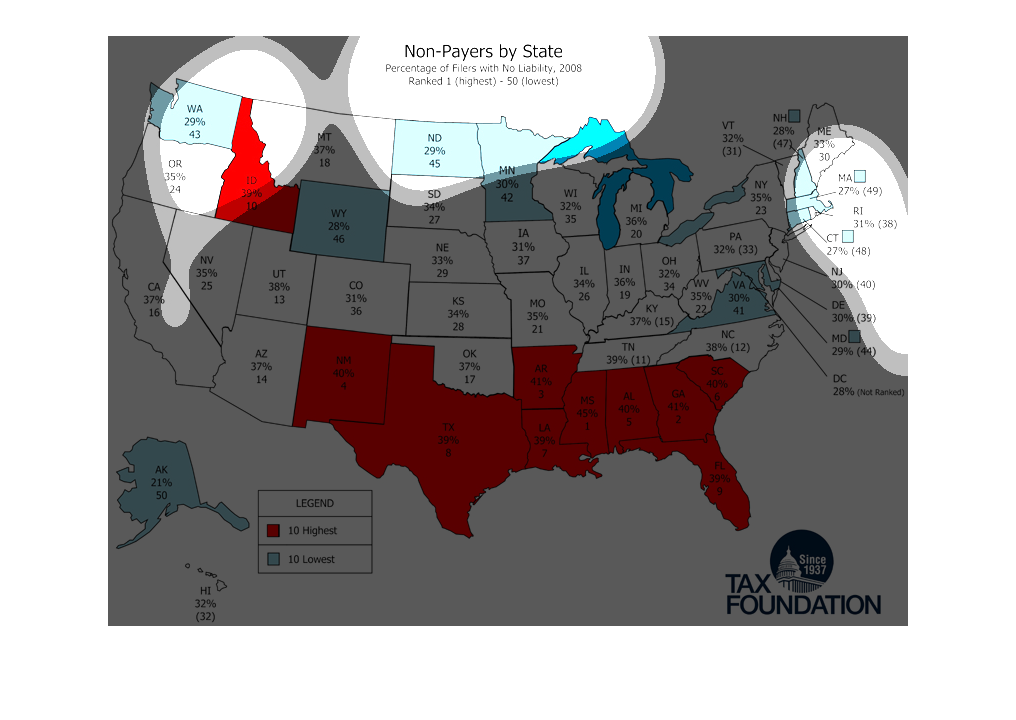
This chart is titled: Non-Payers by State, percentage of flier with No liability, 2008 Rnaked
! (highest)-50 (lowest). Below that is a U.S. map, showing the percentage of non-payers by
state.
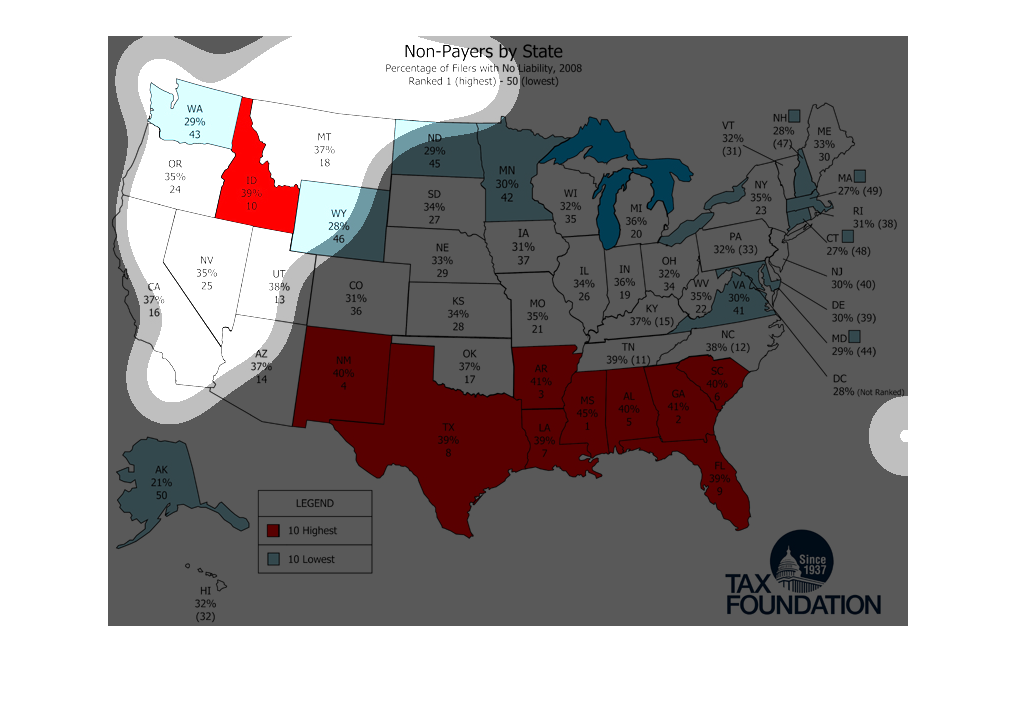
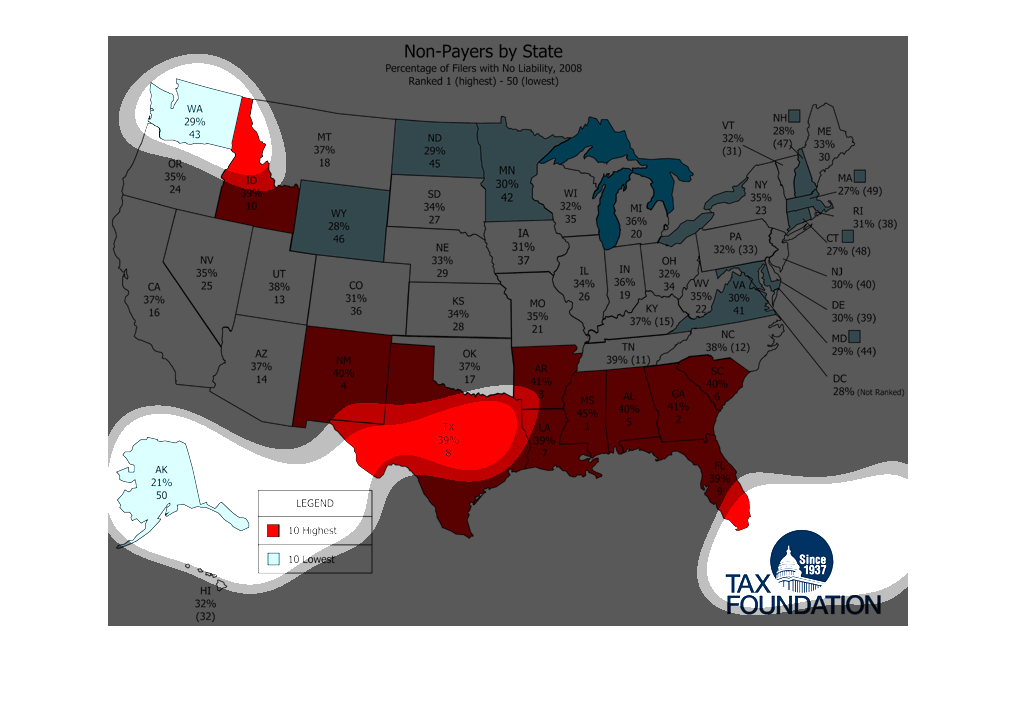
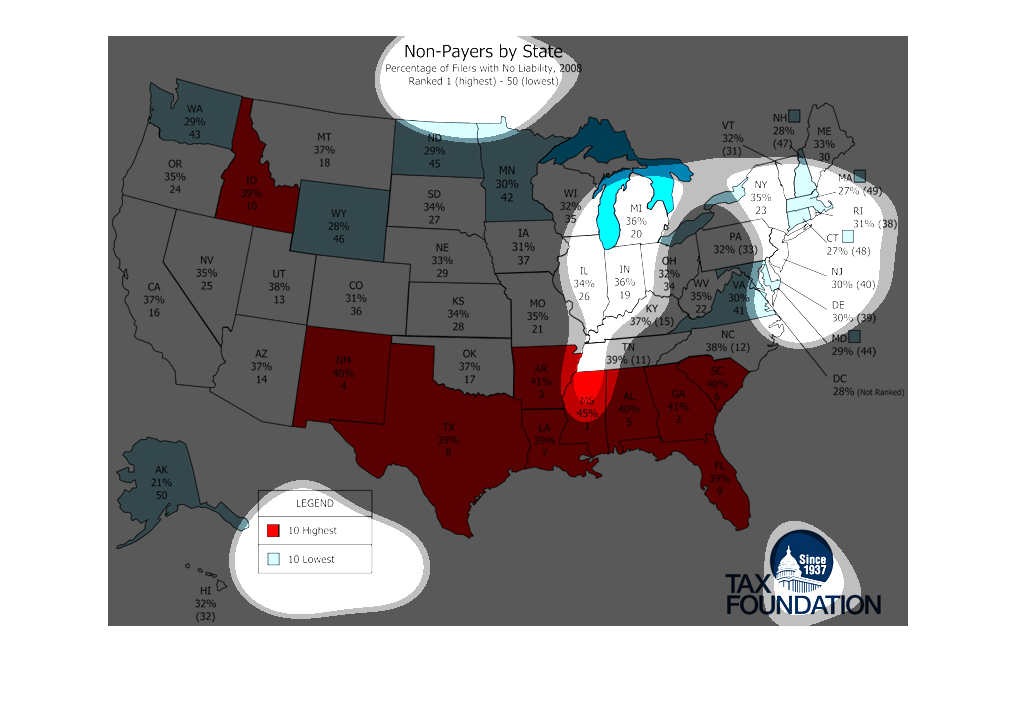
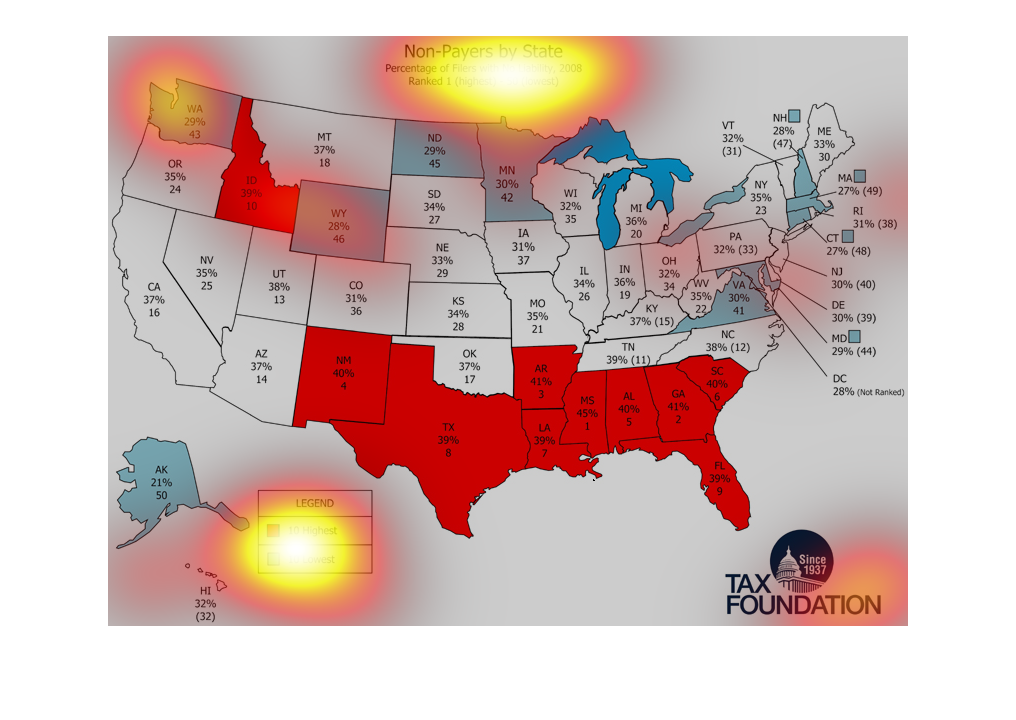
This is an infographic dealing with non tax payer populations by state. Apparently much of
the southeast does not pay  federal taxes. Many do say that the federal tax is unconstituional
and is not actually legal and/or lawful. But I'm paying.
The image is a map that shows the number of non-tax payers per state. In addition, the map
is color coordinated to show which states have the highest number of non-tax payers and the
lowest number. It seems as though the lowest number of non tax payers come from states that
do not have a large population of people living in them. However, the highest number comes
from generally the southern area, where there isn't as much tolerance/compliance with the
government/tax laws.
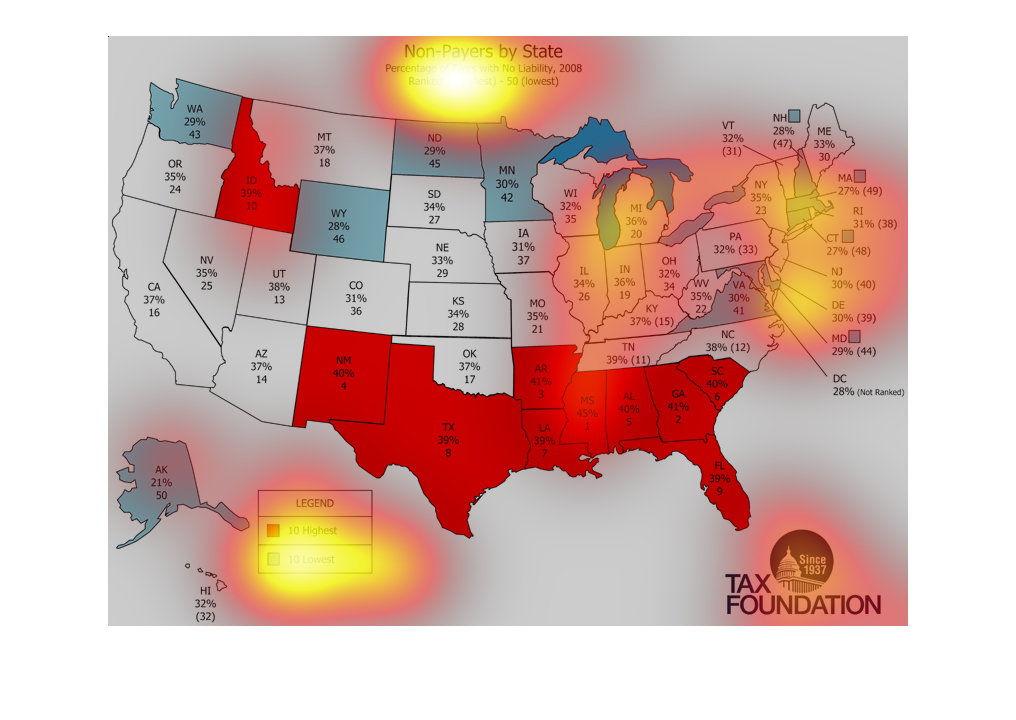
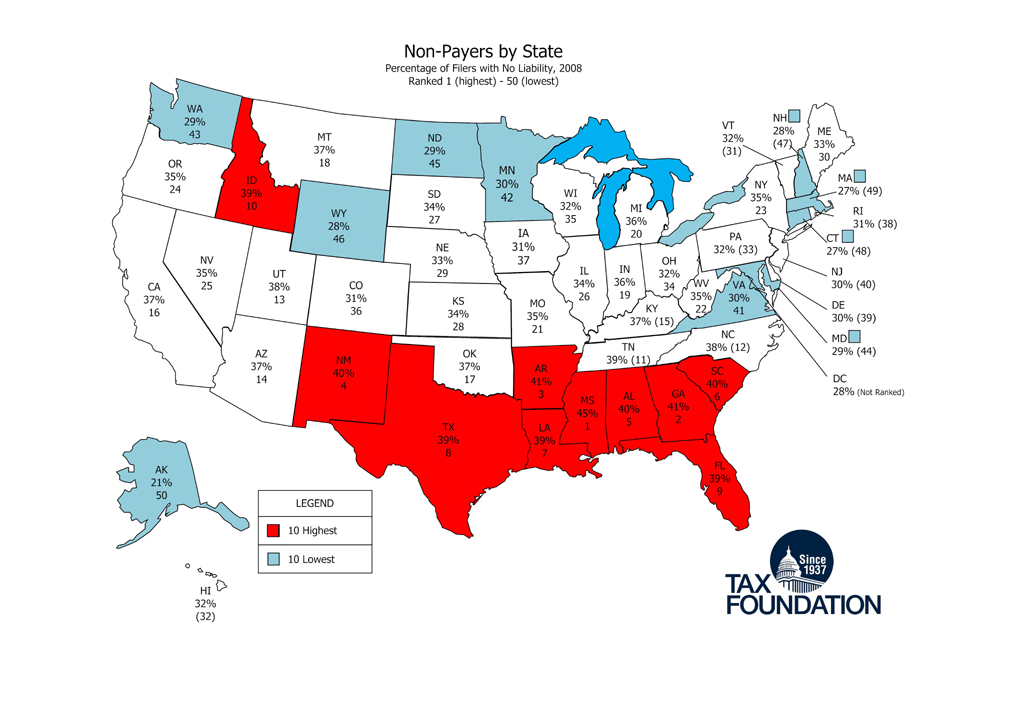
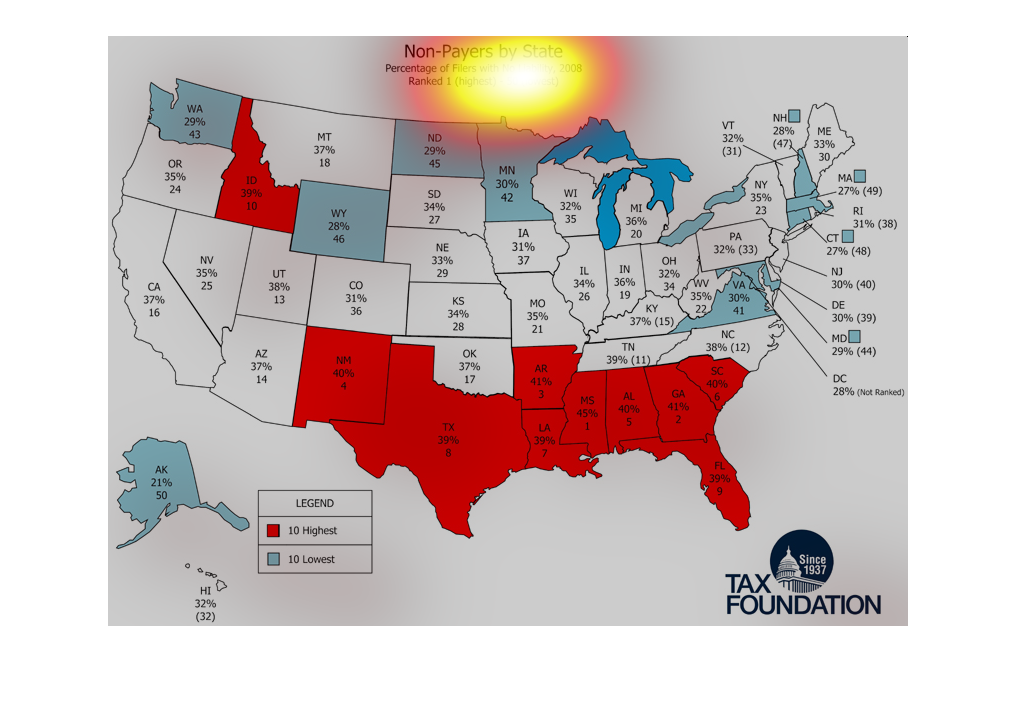
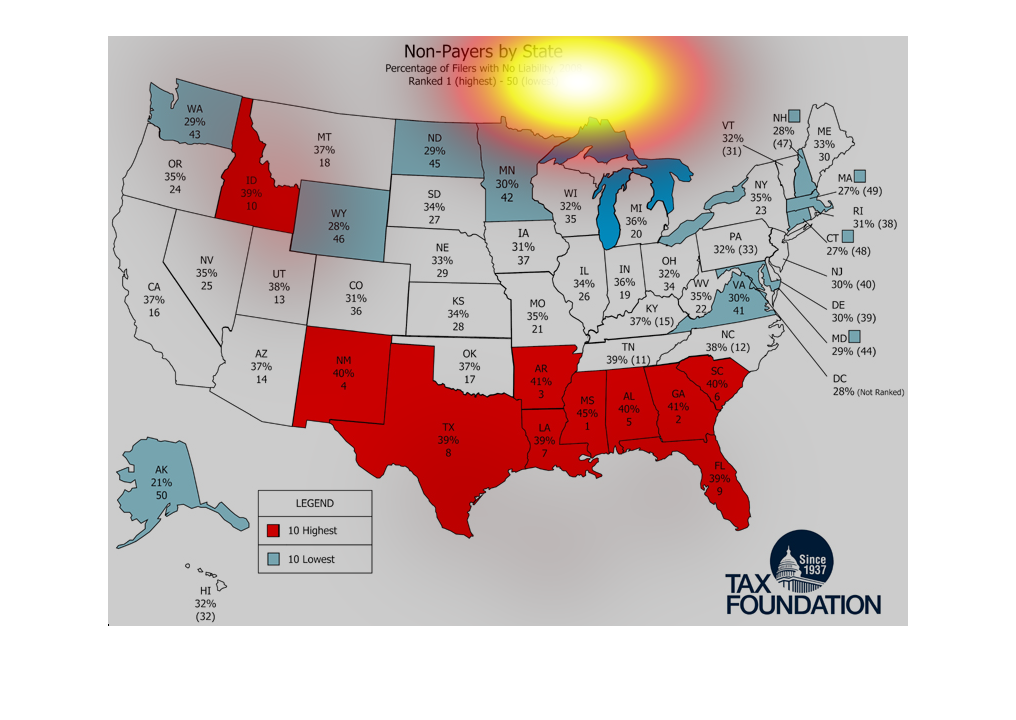
This chart describes non-payers by state, and is sourced by the tax foundation. The highest
percentages are represented on the chart by the color red, and the lowest by the color blue.
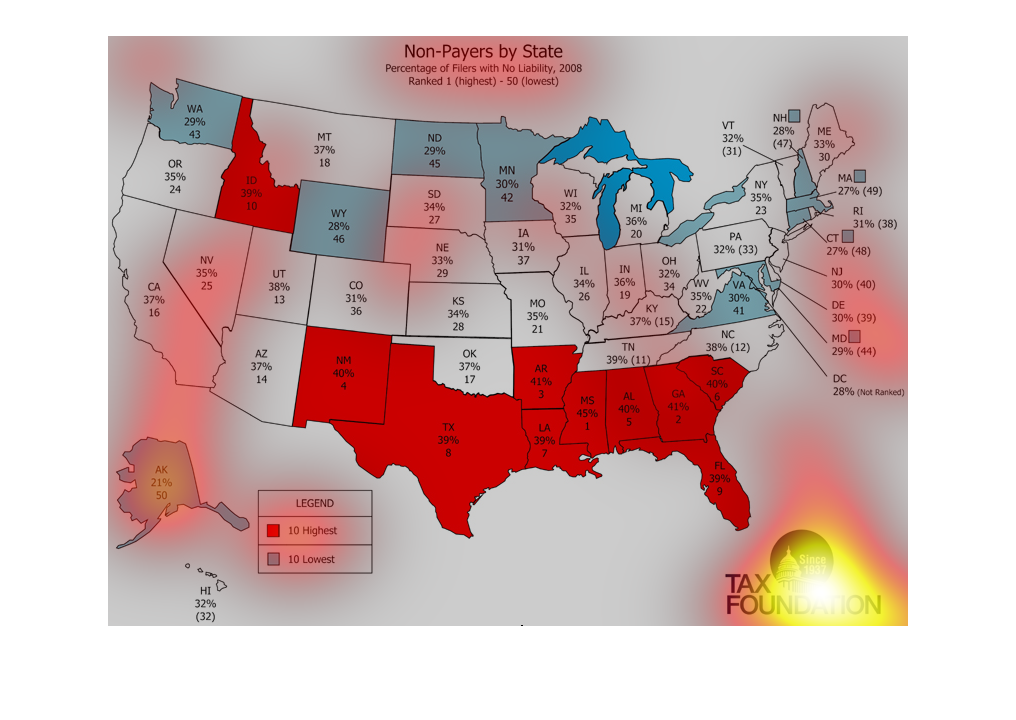
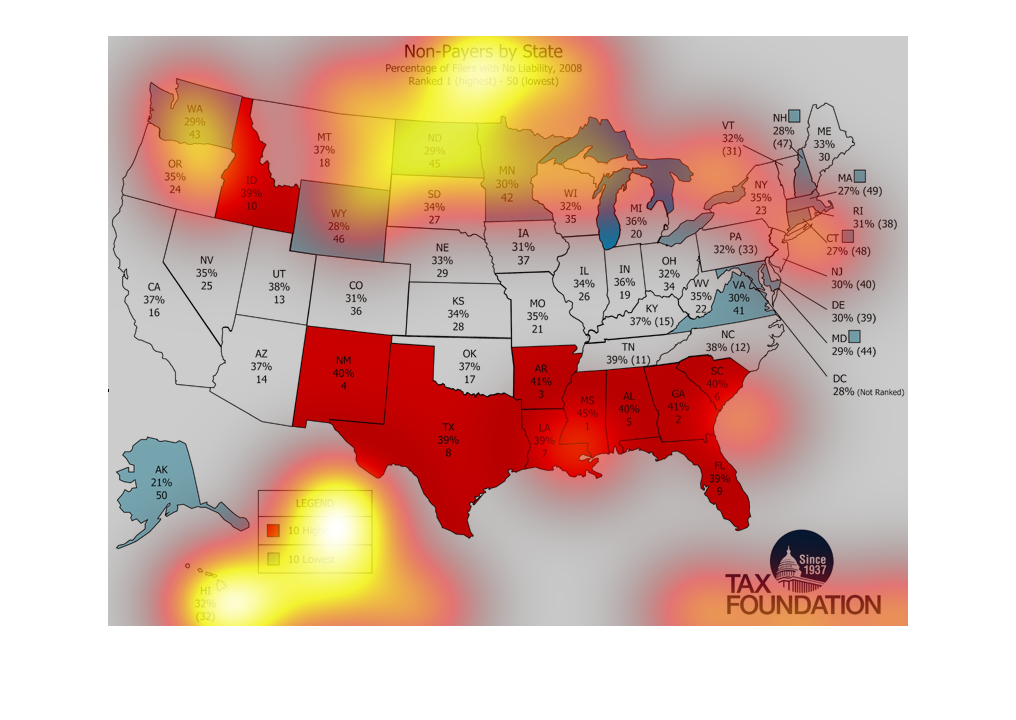
The image shows or depicts in statistical geographical format of the United States and shows
Non-Payers by state percentage of fillers with no liability for 2008.
The chart shows a map of the United States. There are two numbers in each state. The first
number is a percentage. This number shows the percentage of people in that state who filed
taxes and had no tax liability in 2008. The second number is a raking of the states, 1 being
the highest number of non-tax payers. This chart is from Tax Foundation.
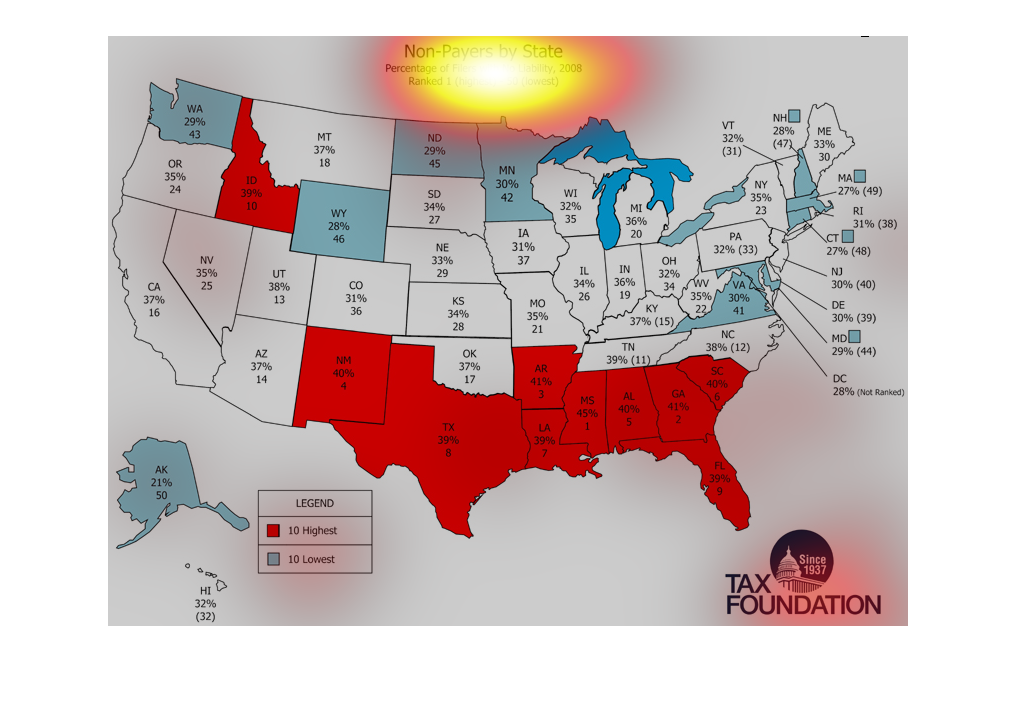
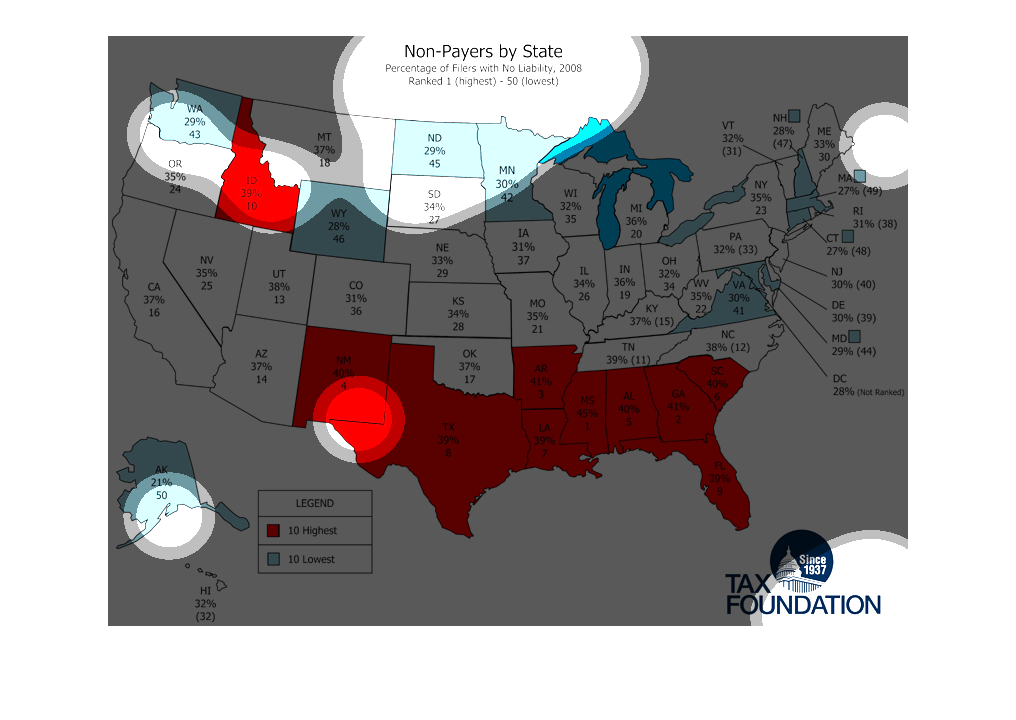
This chart shows Non-Payers by state for the year 2008.  It is a percentage of filers with
no liability represented by color-coded states.  The chart was published by Tax Foundation.
 Idaho, Texas, New Mexico, Arkansas, Louisiana, Mississippi, Alabama, Georgia, South Carolina,
and Florida had the highest percentage of filers with no liability.
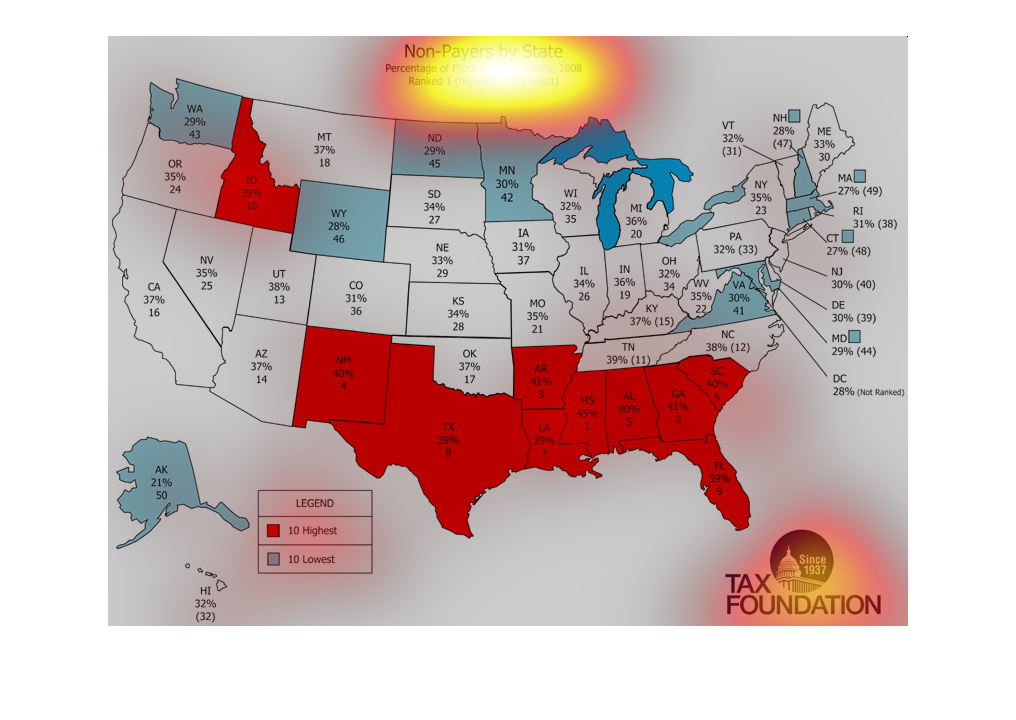
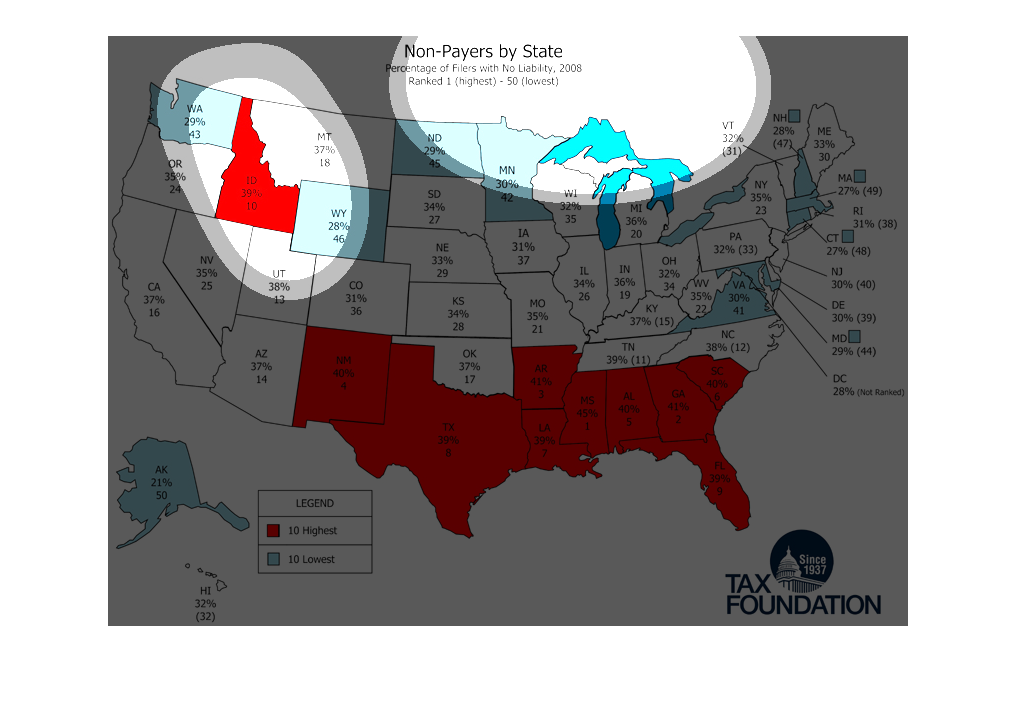
This shows the highest amount of tax evaders  according to the Tax Foundation. By far the
most evasive are in the southwest and southeast, and Idaho. The most responsible are in WA,
WY, AK, ND, MN, VA, MD, and New England.
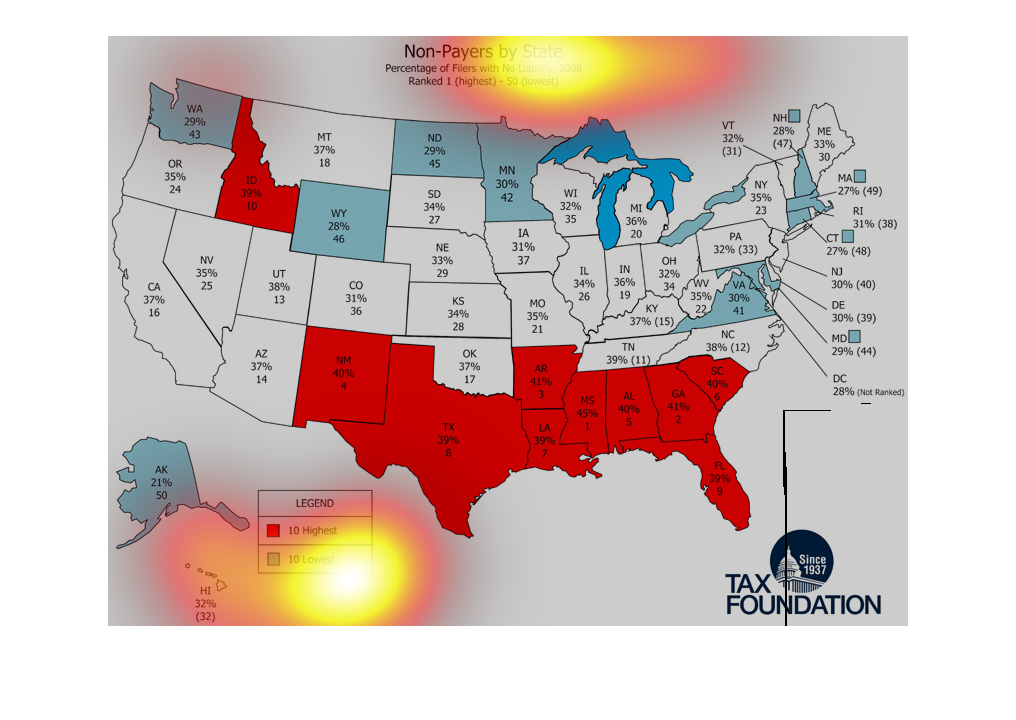
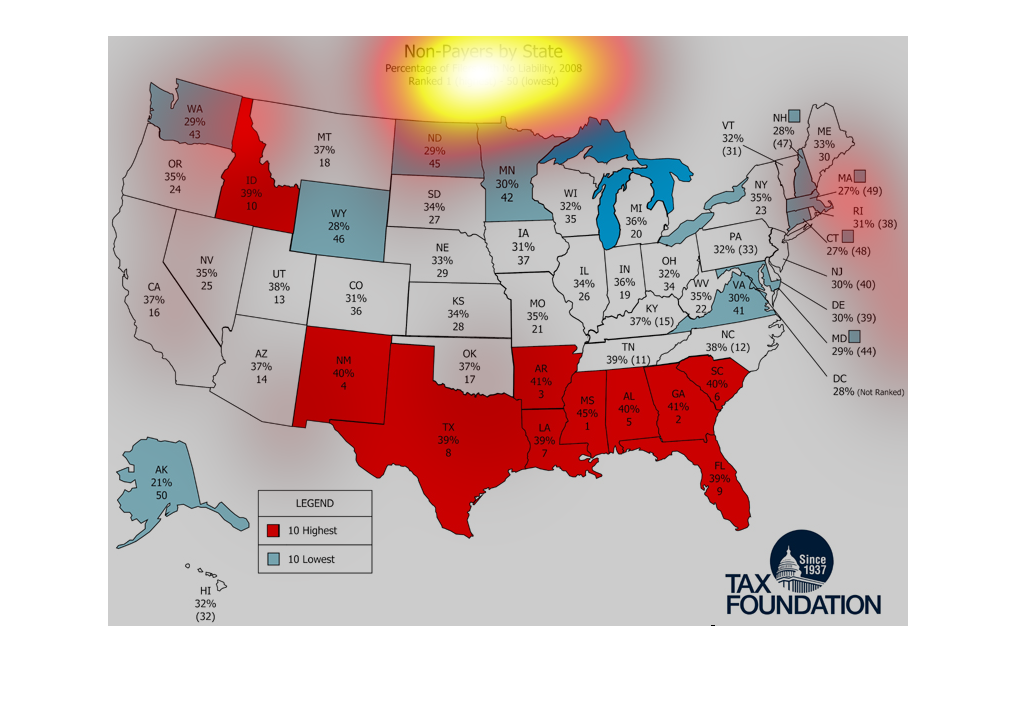
This graphic shows an image of the United States and indicates which states have the highest
percentage of non-payers, that is, filers with no liability. The southern states have some
of the highest percentages.
This is a map that shows the various non payers around all the states within the united states
of America. it shows each state and the percentage of non payers.
This is a map of the United States that represents non payers by state or those who have no
tax liability to the government.  It contains percentages and numbers by state.
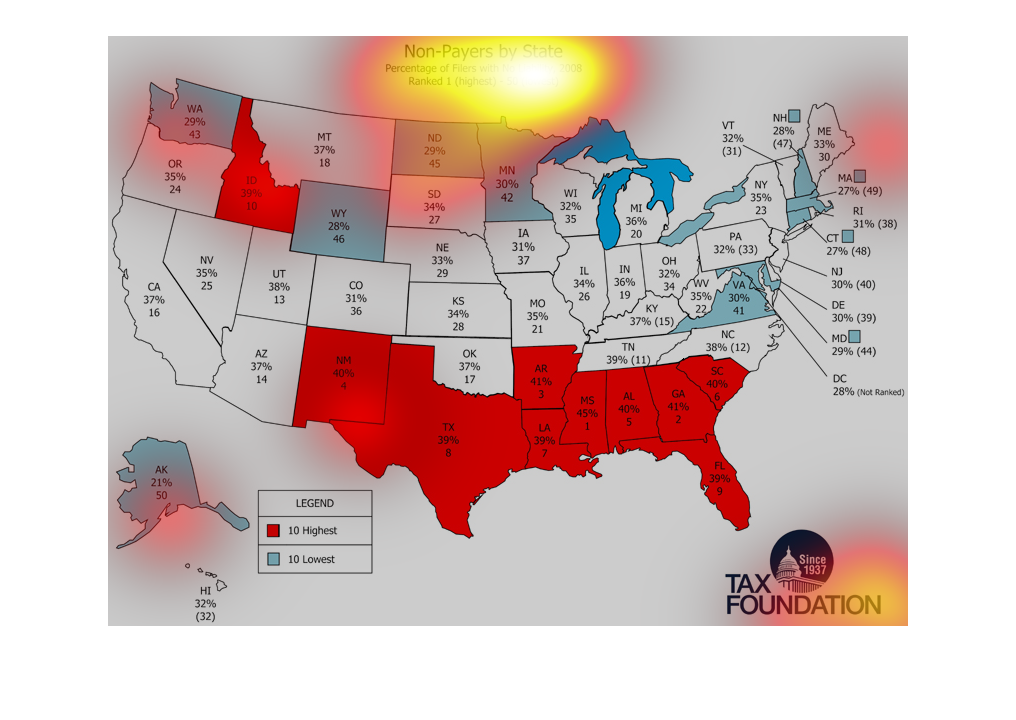
Tax Foundation Map of the United States showing the sates having the 10% highest tax rates
(red) and the 10% lowest tax rates (light blue). The highest tax rates appear to be localized
to the southern mainland portion of the US, except for Idaho in NW US. The lowest tax rates
are northern mainland US, and alaska.