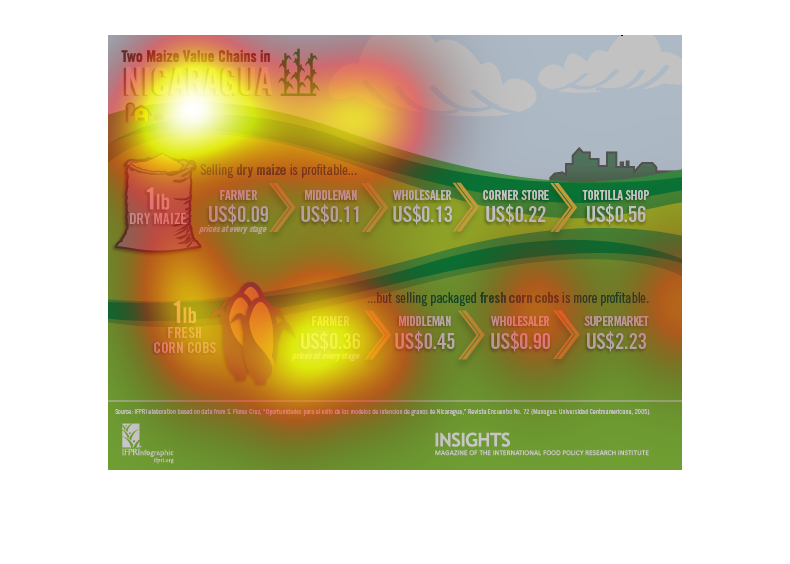
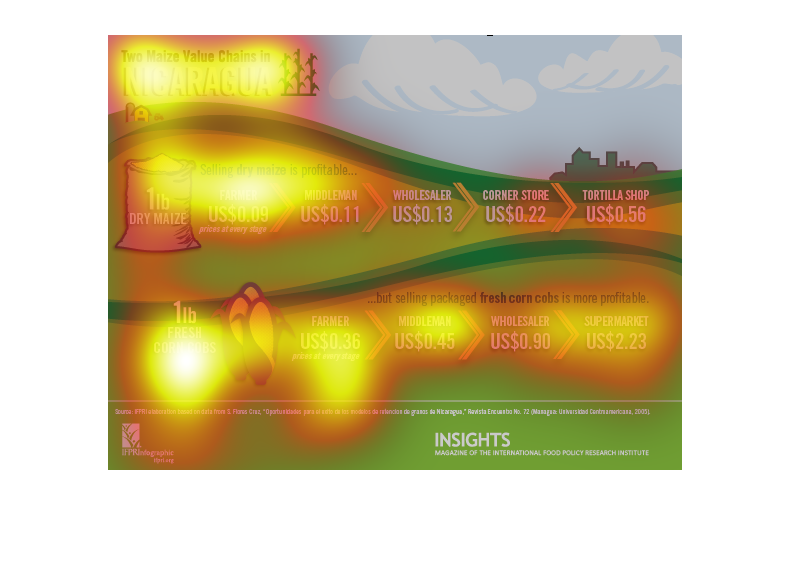
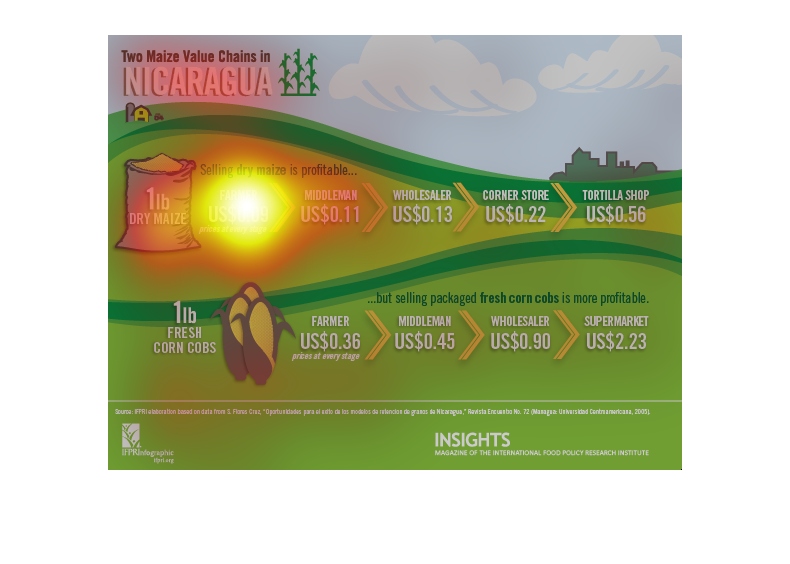
This picture depicts of a chart about two maize value chains in Nicaragua. It shows two different
pathways. One pathway is 1lb of dry maize and the other is 1lb corn.
This illustrates the maize or corn value chain in Nicaragua.  It shows how much a pound of
corn is worth from the farm to wholesaler to consumer throughout the supply chain.
It shows the chain of suppling foods to markets for consumers to consume coming in from Venezuela.
They start out really cheap and show how products get more expensive as there are more people
in between.
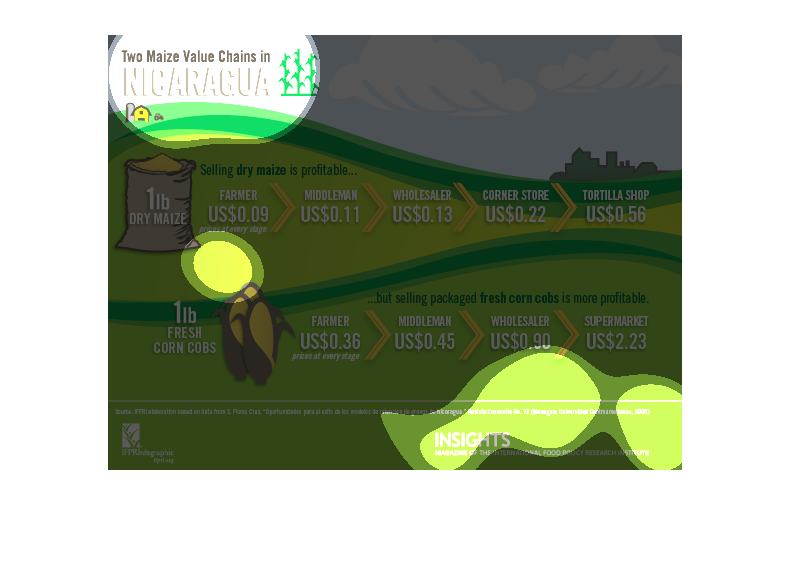
The graph on the left hand side is describing the trade of hands for Corn and dry maize within
Nicaragua.  It shows a chart showing the average price from the farmer all the way to the
supermarket.  It in details the assumed market up price each step of the way.  At the supermarket
price there is a big jump if one were to speak to the farmer.
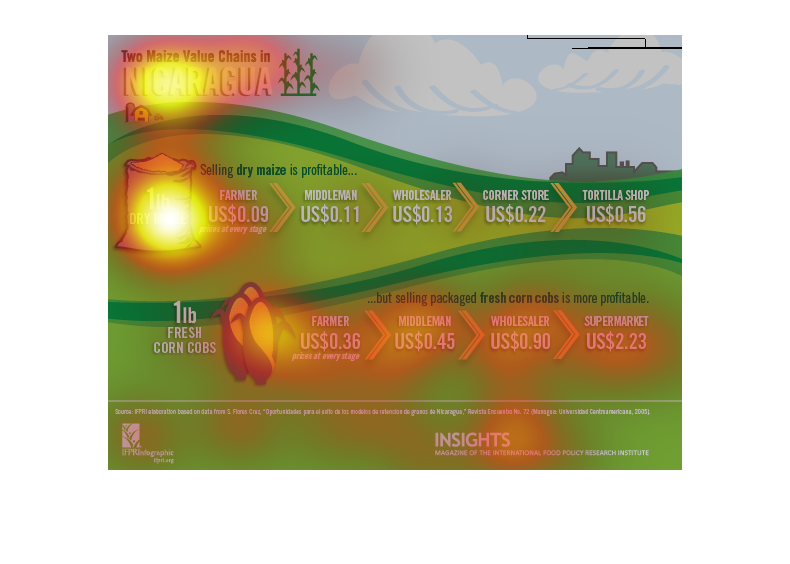
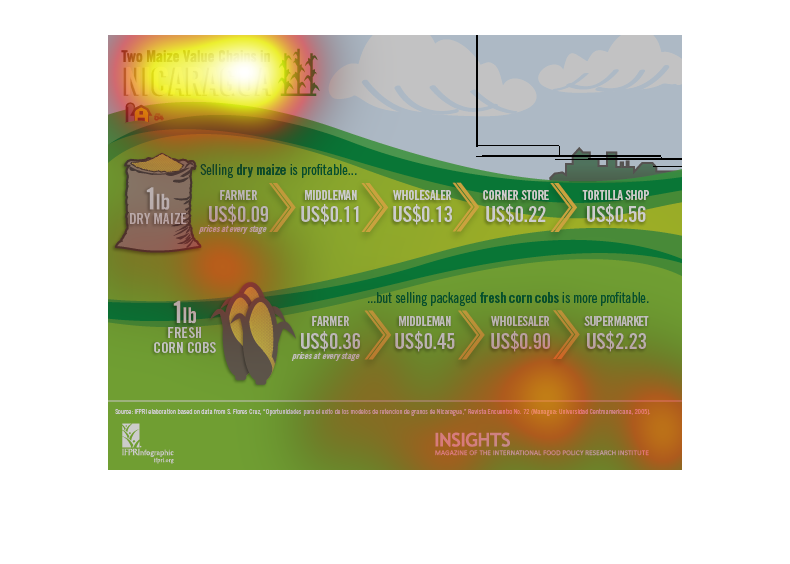
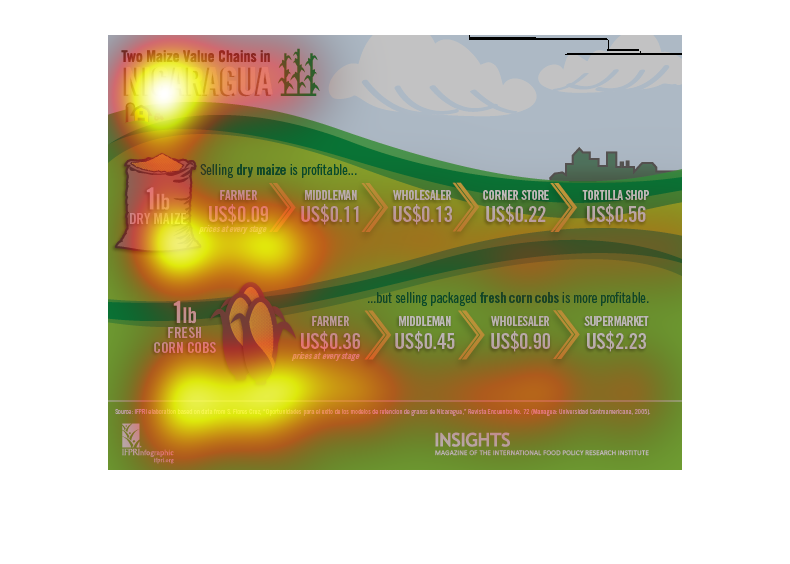
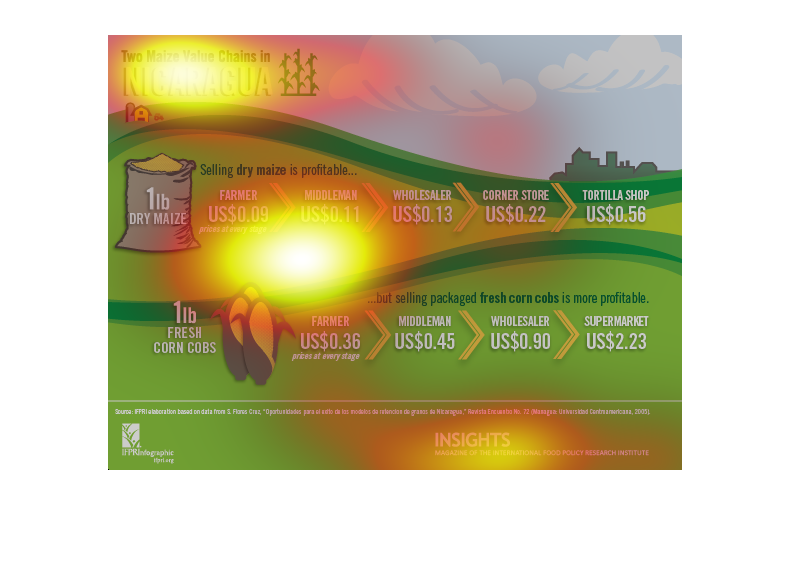
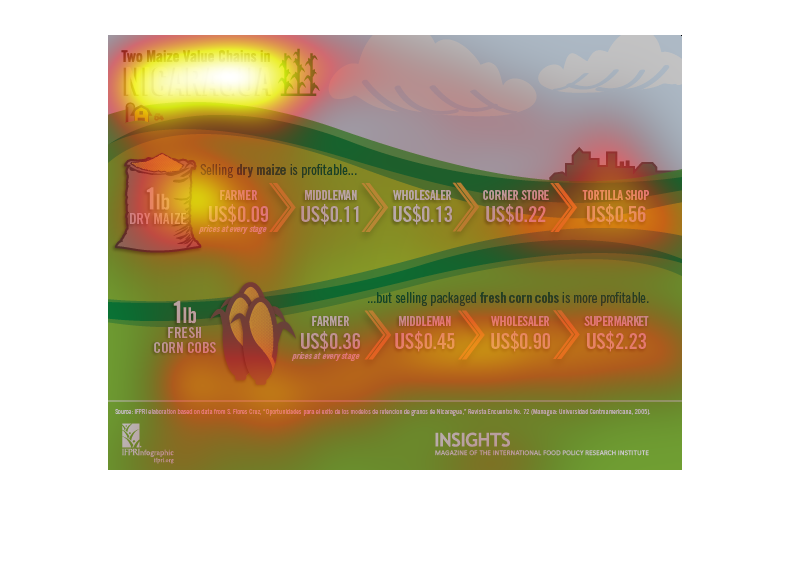
The image breaks down the prices of dry maize and fresh corn beginning with the cost of the
farmer, middleman, wholesaler, and store. The in store cost is about 6x the initial cost from
the farmer due to the amount of steps the crops go through until the store.
This shows how much profit is made by harvesting and selling corn it shows each stage of the
process from the farmers selling the corn to the consumer buying it
The image depicts the profitability of selling maze, specifically detailing the established
value chain in Nicaragua and the selling of maze to US farmers.
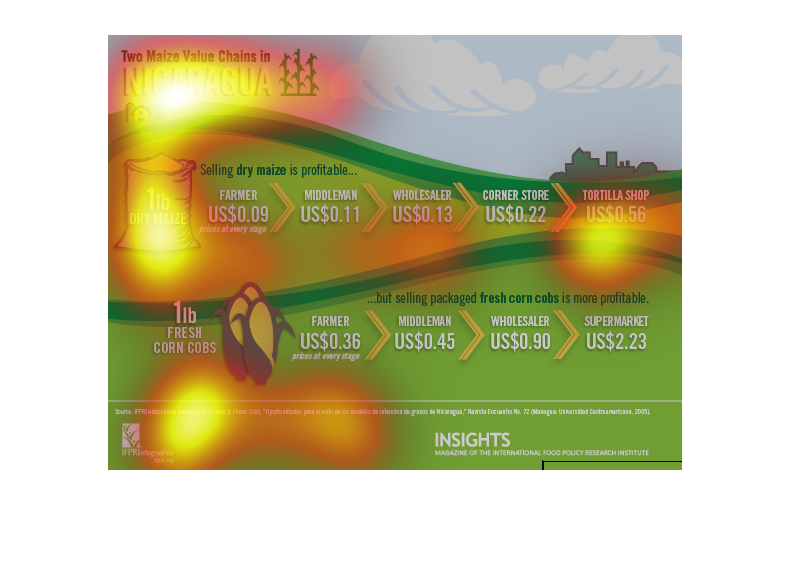
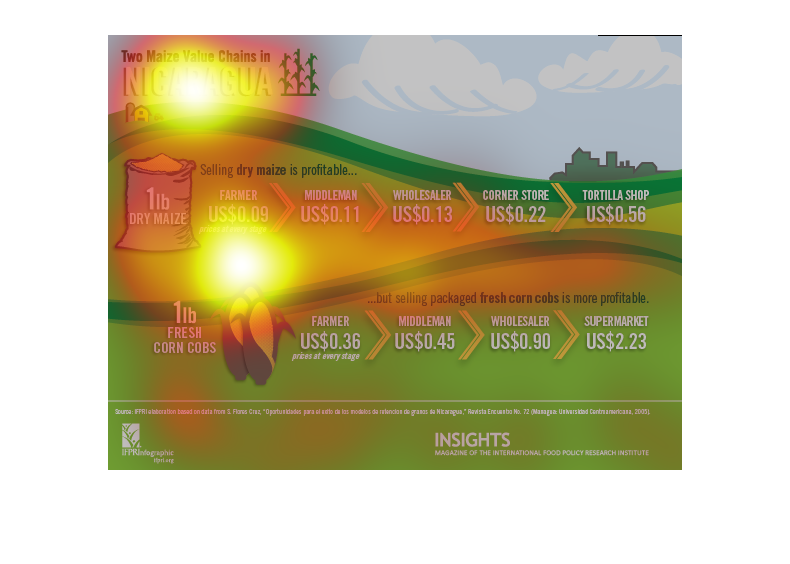
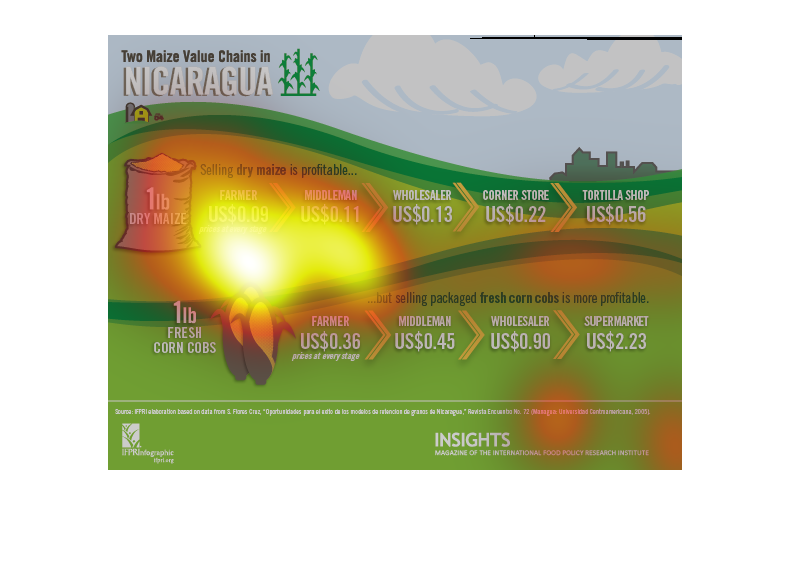
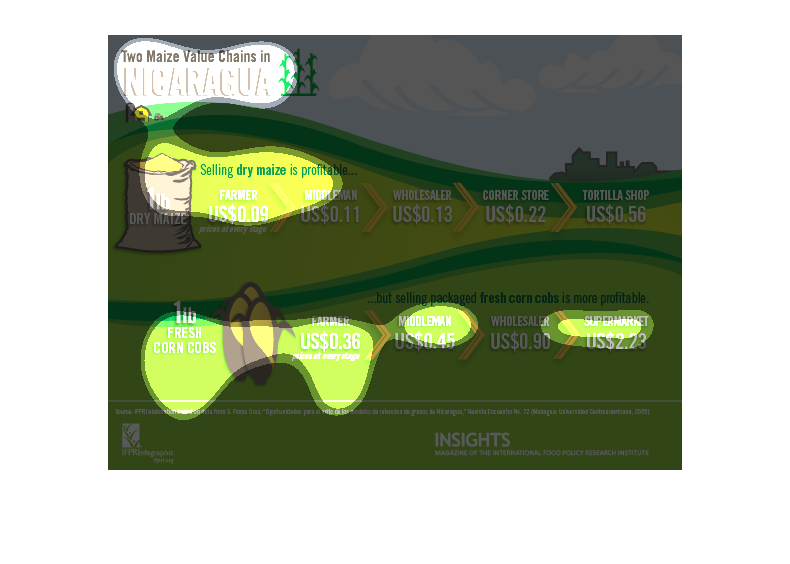
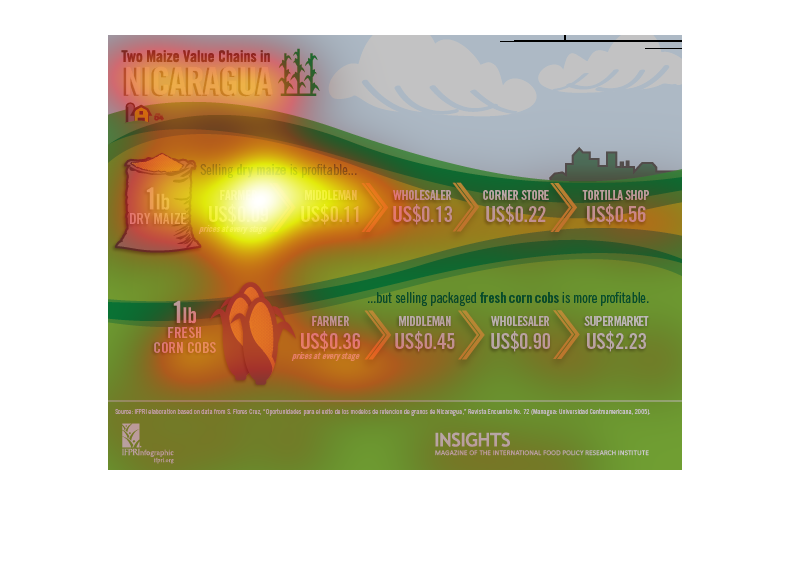
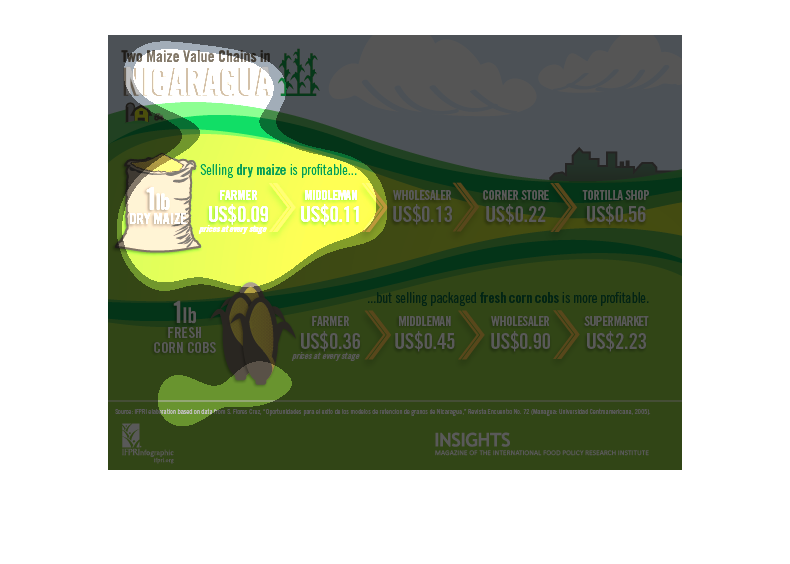
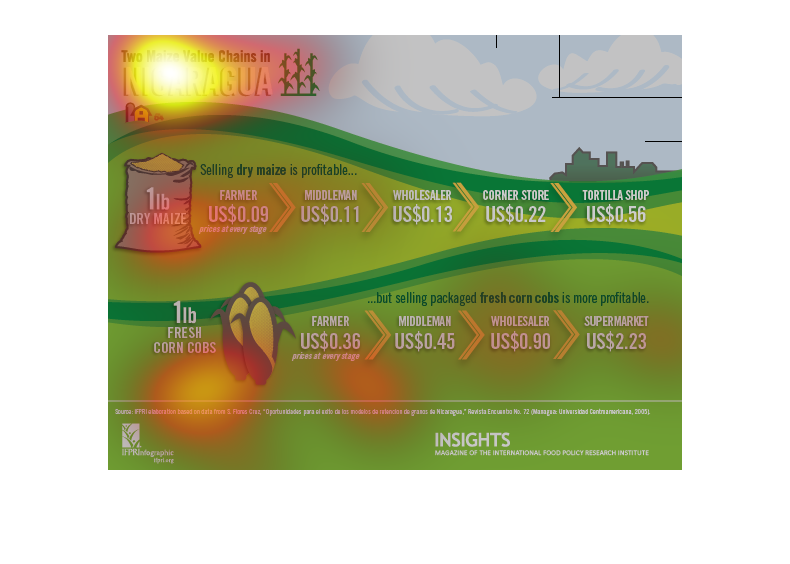
Infographic that describes different chains for selling maize. Selling dry prepackaged maize
is more profitable than selling fresh corn cobs. This is based off of maize coming from Nicarauga.
This illustration shows the various amount and prizes of processed and unprocessed corn in
the Republic of Nicaragua. Having to take in account labor, it can become quite labor intensive.
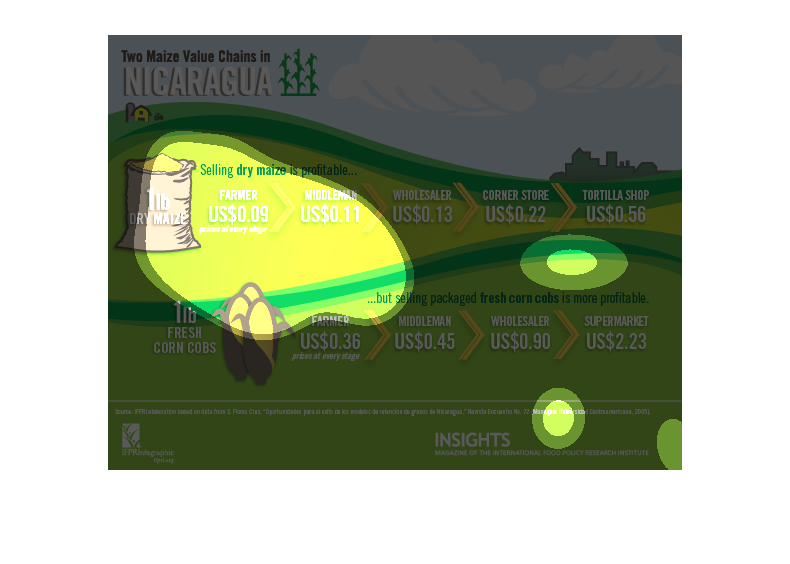
The graph shows the profitability of selling dry maize in Nicaragua. Per 1lb of maize a farmer
in the U.S profits $0.09, with the middleman profiting $0.11, wholesalers $0.13, corner stores
$0.22, and tortilla shops $0.56. The graph definitely demonstrates that farmers earn the least
amount of profit in this scenario.   However, per 1lb of fresh corn on the cob, farmers earn
$0.36, middlemen $0.45, wholesalers $0.90, and supermarkets $2.23. Supermarkets definitely
earn the largest profit whether it be from an ability to mark the price up more to their consumers/customers.
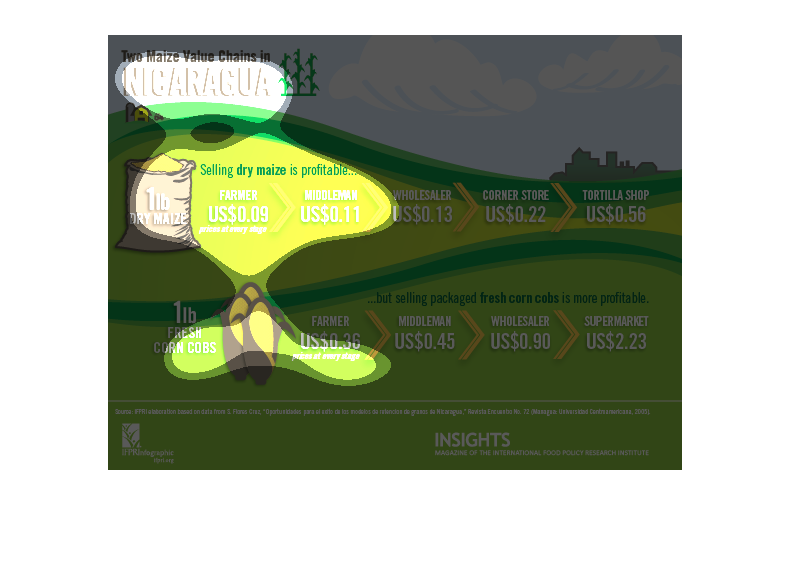
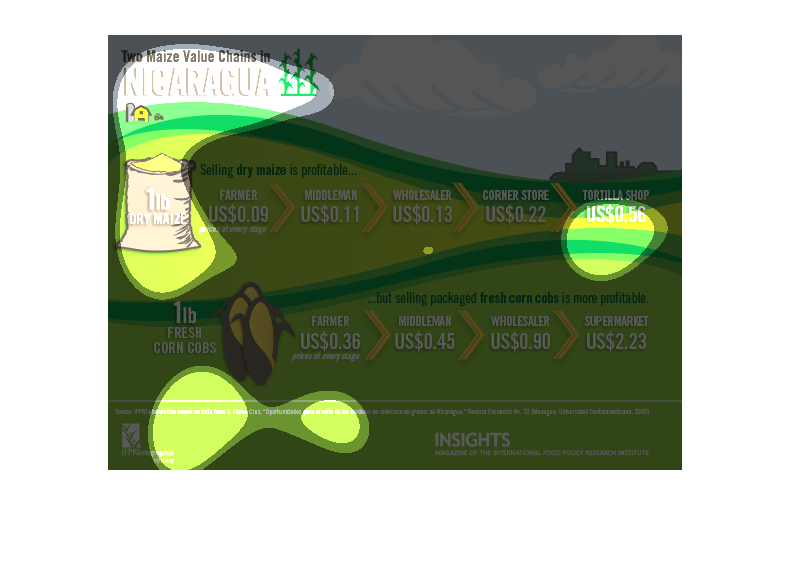
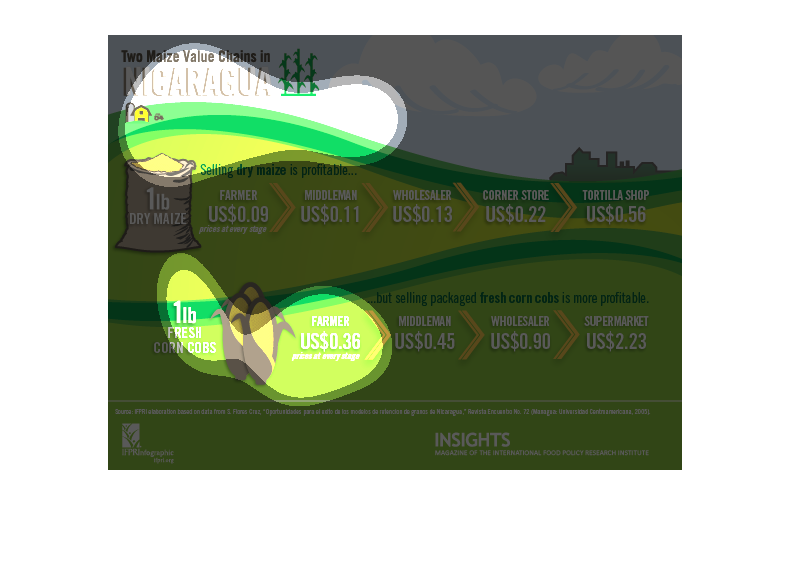
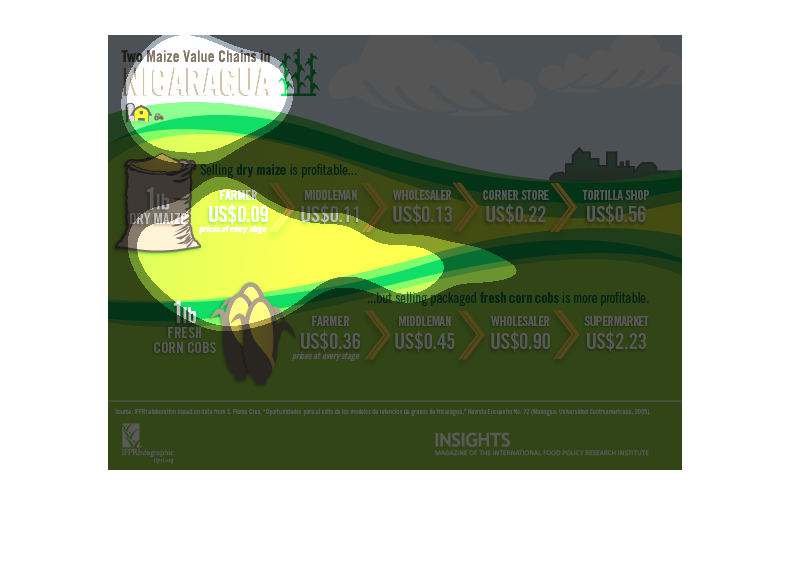
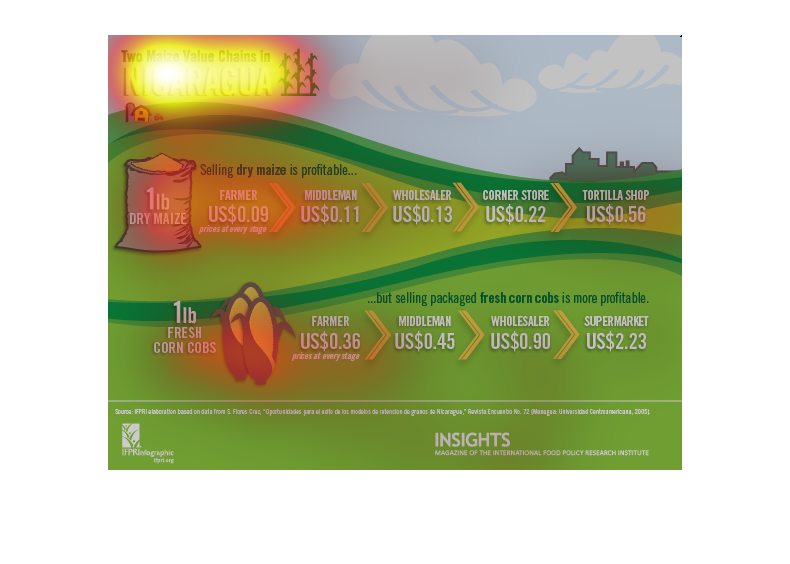
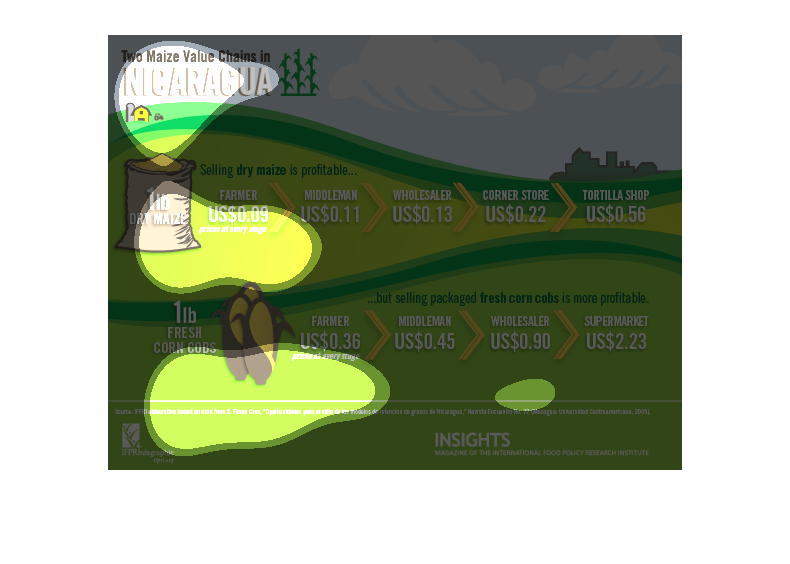
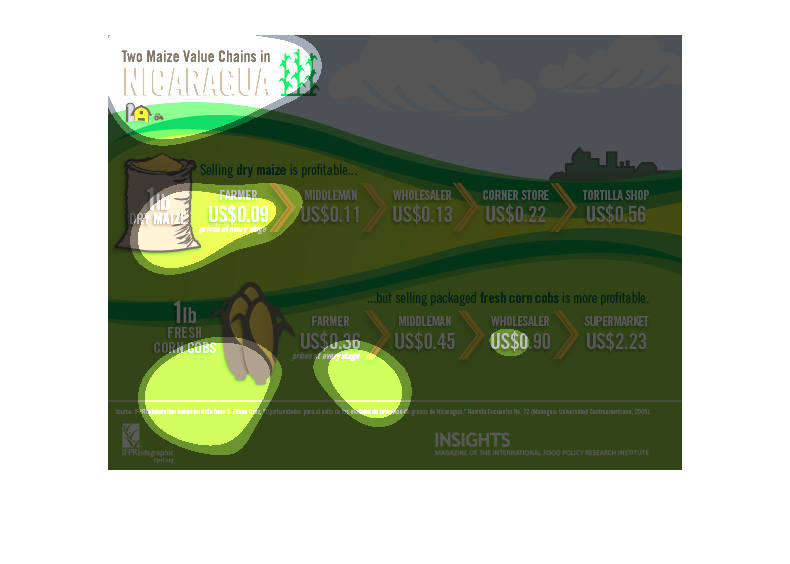
This chart describes two maize value chains in Nicaragua. The chart contains an illustration
of green hills to demonstrate the growing of maize in Nicaragua.
This chart shows two maize value chains in Nicaragua. Each shows the value of 1lb. of maize,
one fresh the other dry.  Dry maize is the less profitable, only bringing in $0.09 to the
U.S. farmer.  However fresh brings in $0.36 to the U.S. farmer.
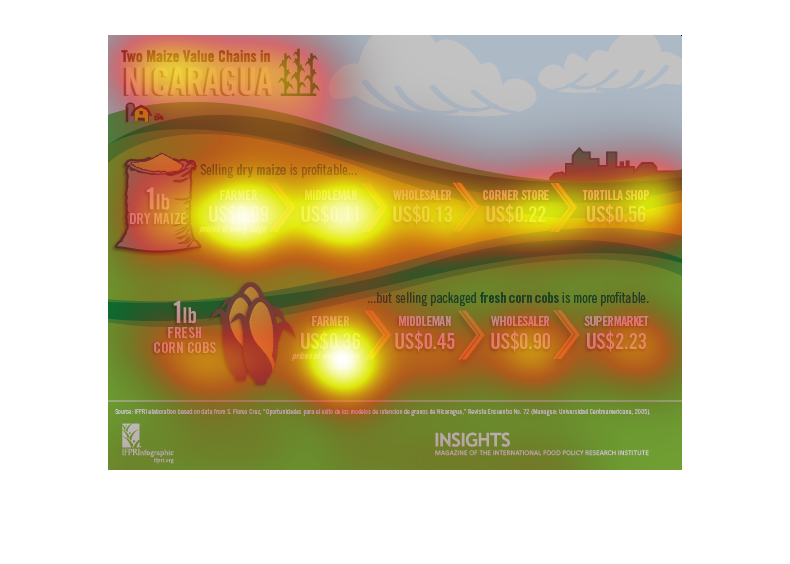
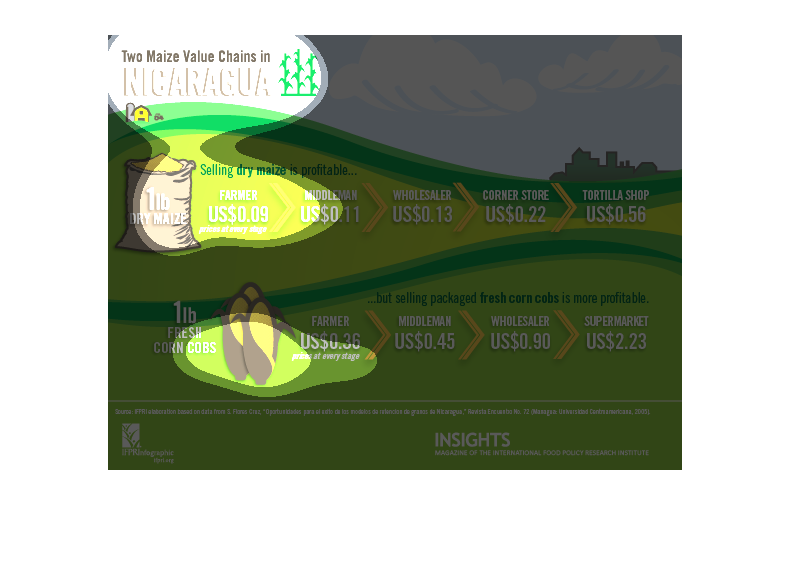
The following chart is called two maize chains in Nicaragua. It shows that is much more profitable
for a famer to sale ears of corn that to sale corn that is broken down.
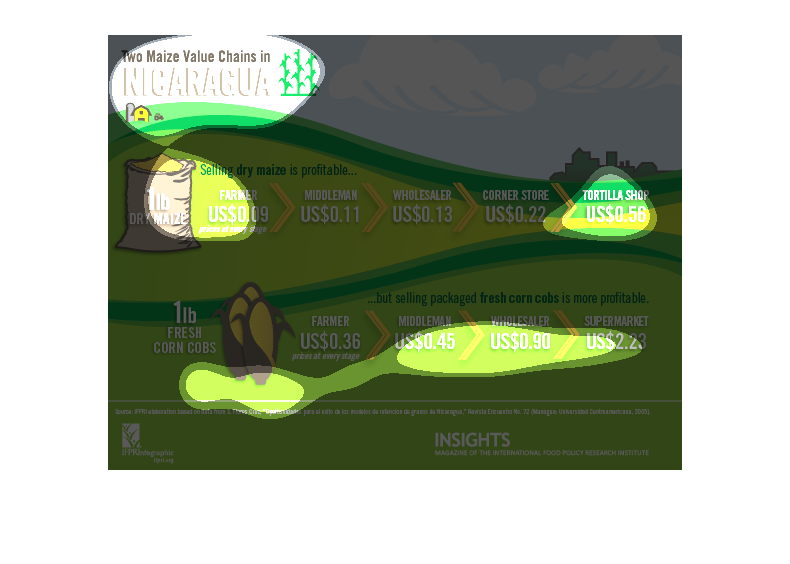
This is a graphical chart representation depicting two maize chains in the country of Nicaragua.
It shows that selling dry maize is profitable but selling fresh corn cobs is more profitable.
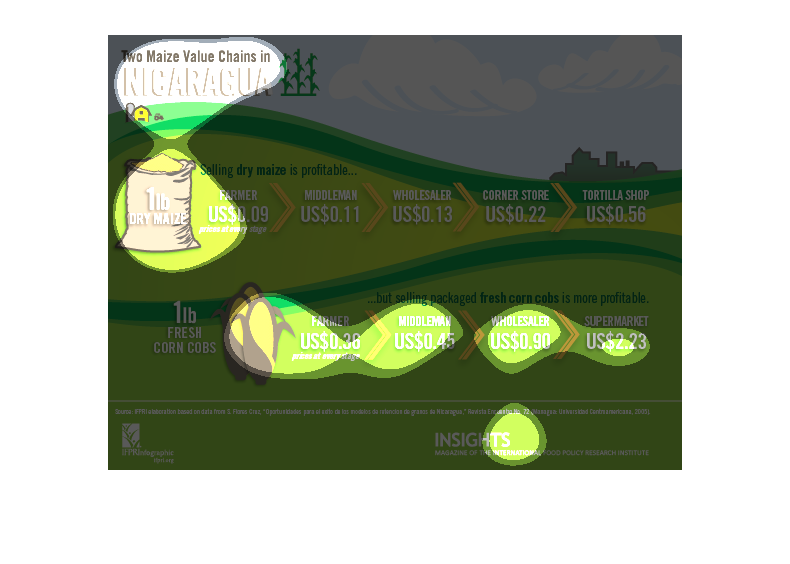
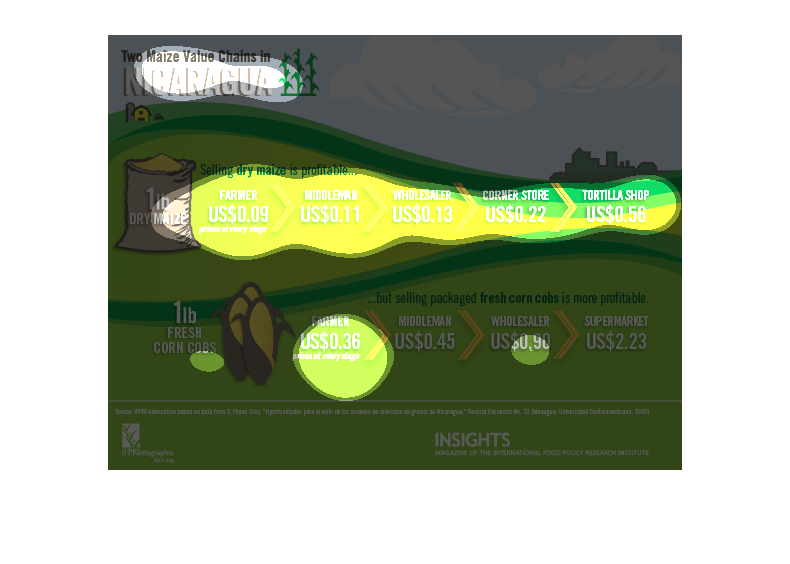
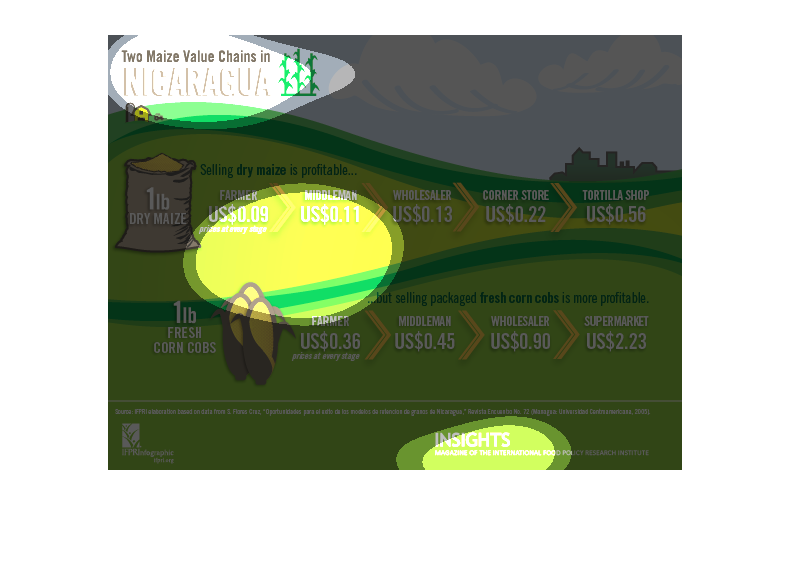
This infographic shows how much 1 lb of dry maize sells for each time it changes hand in Nicaragua,
going up the supply chain. The same thing is repeated below it for corn.