Warning: Image is too big to fit on screen; displaying at 50%
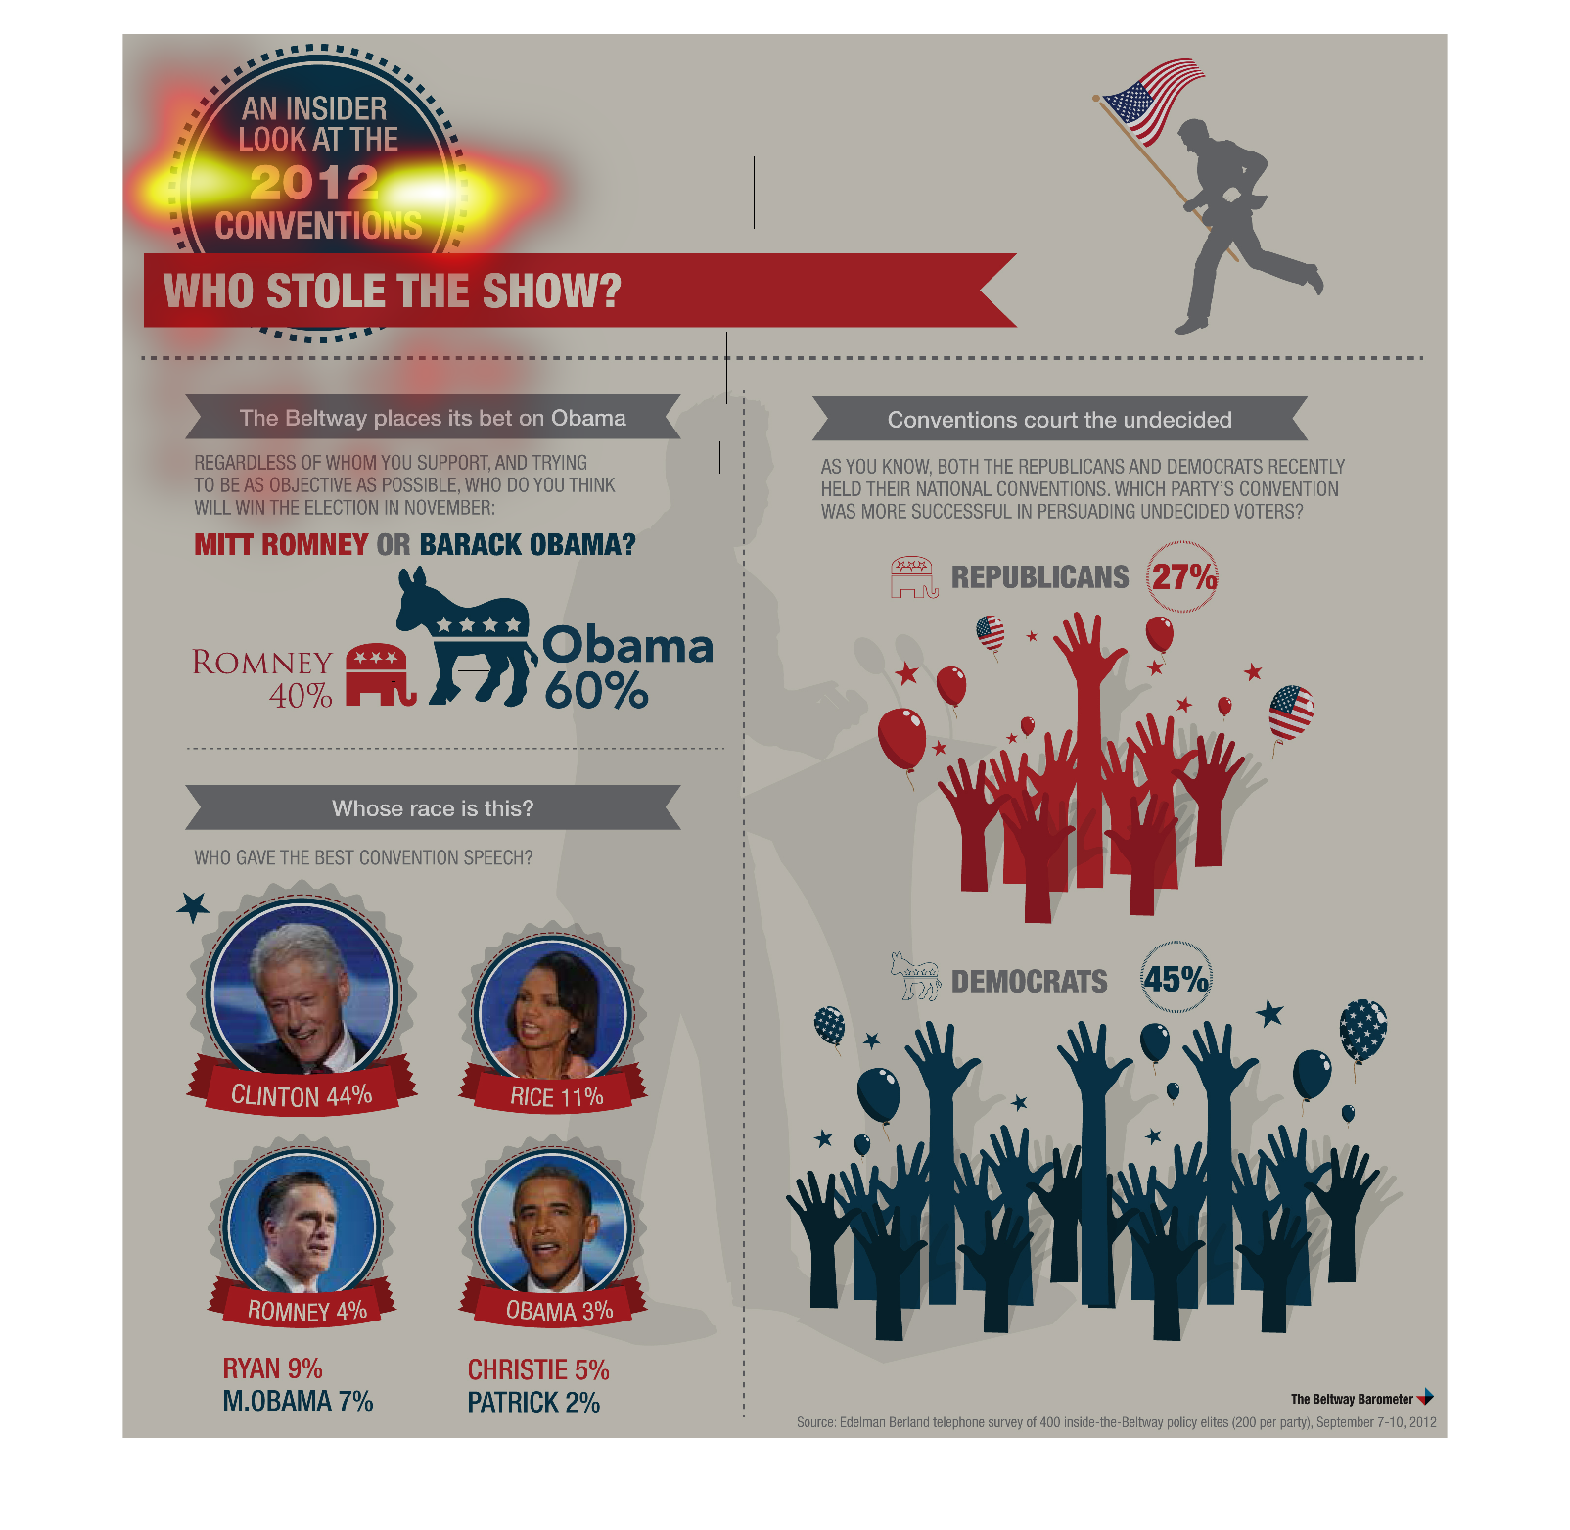
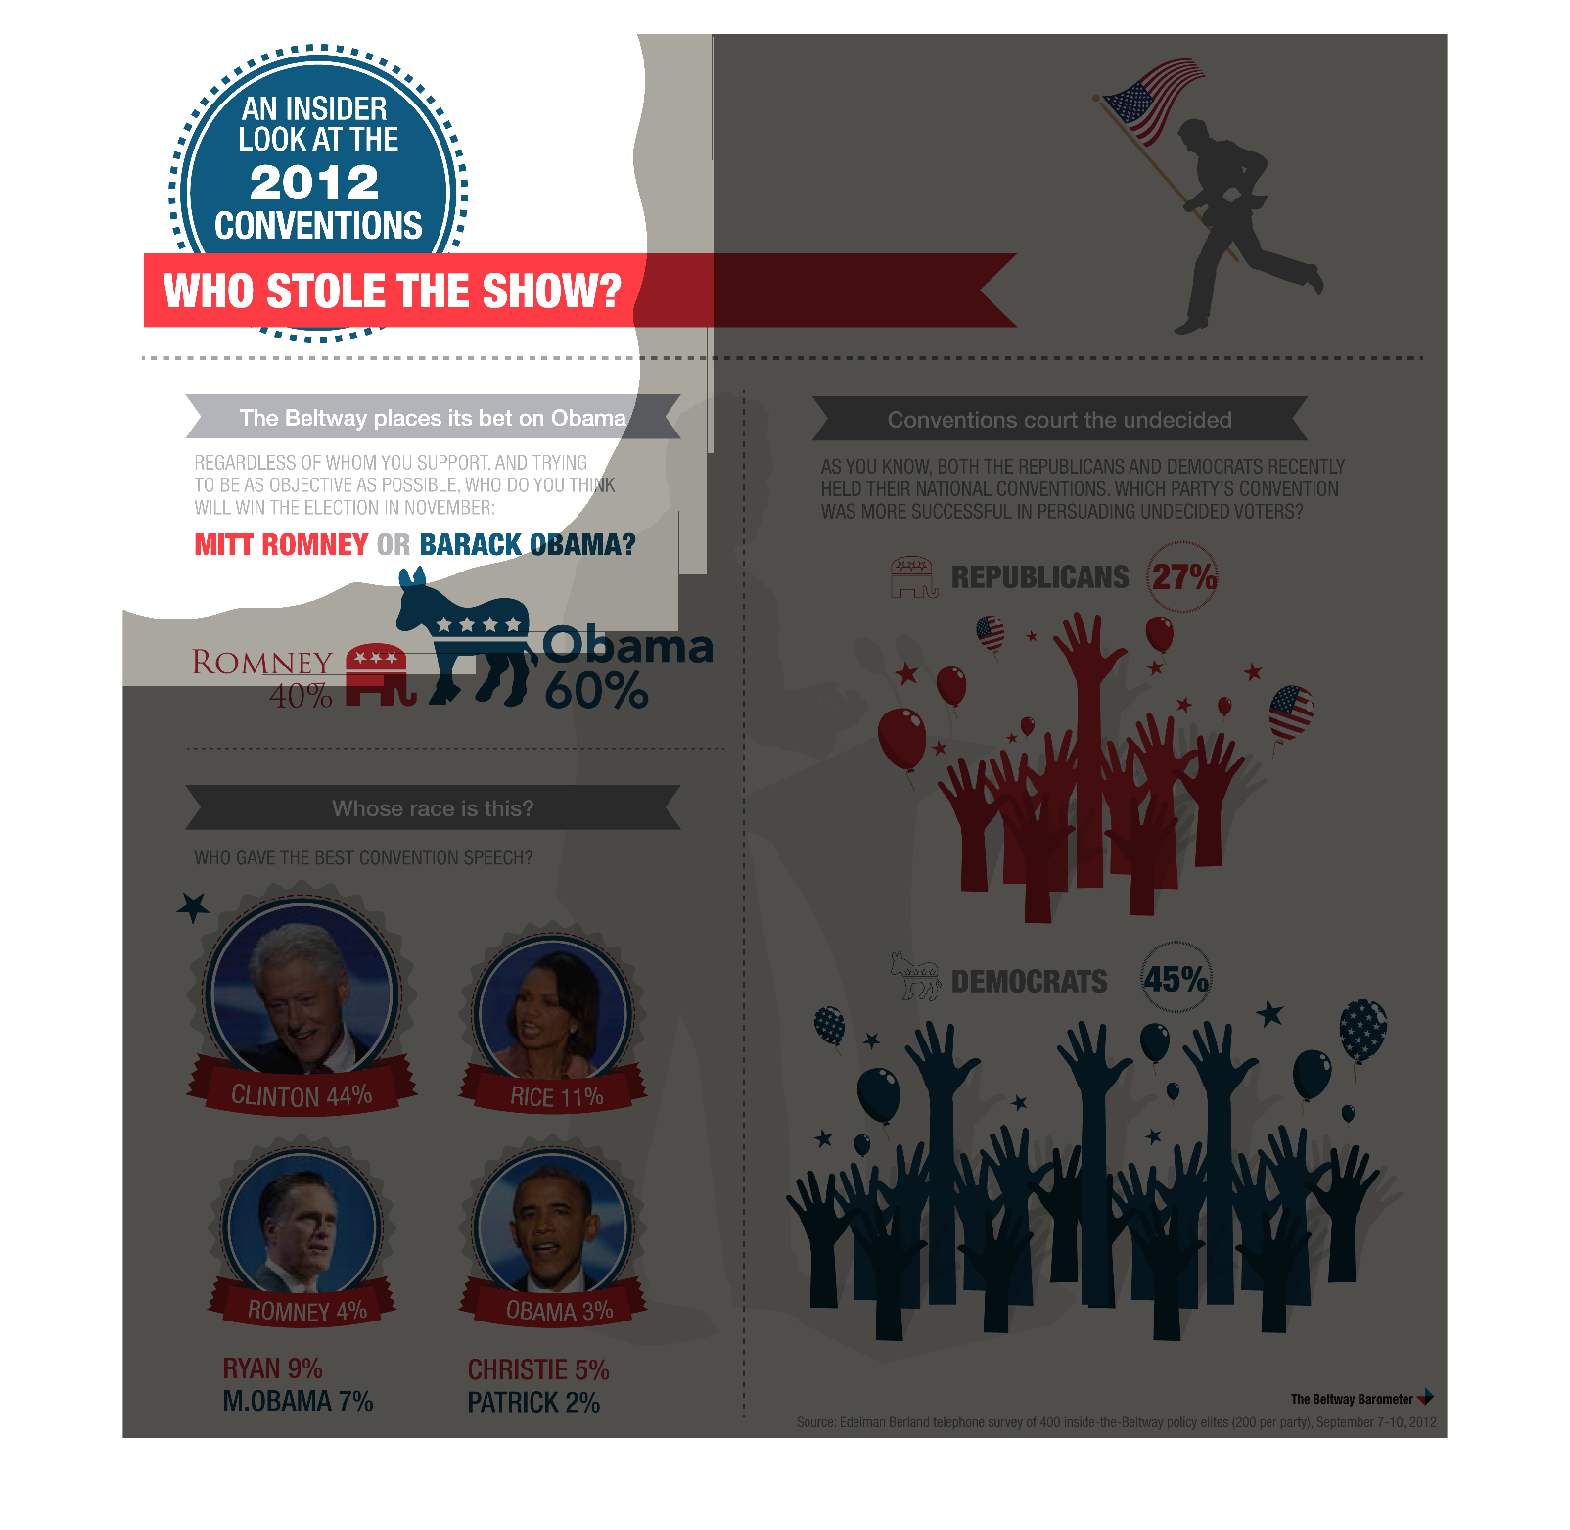
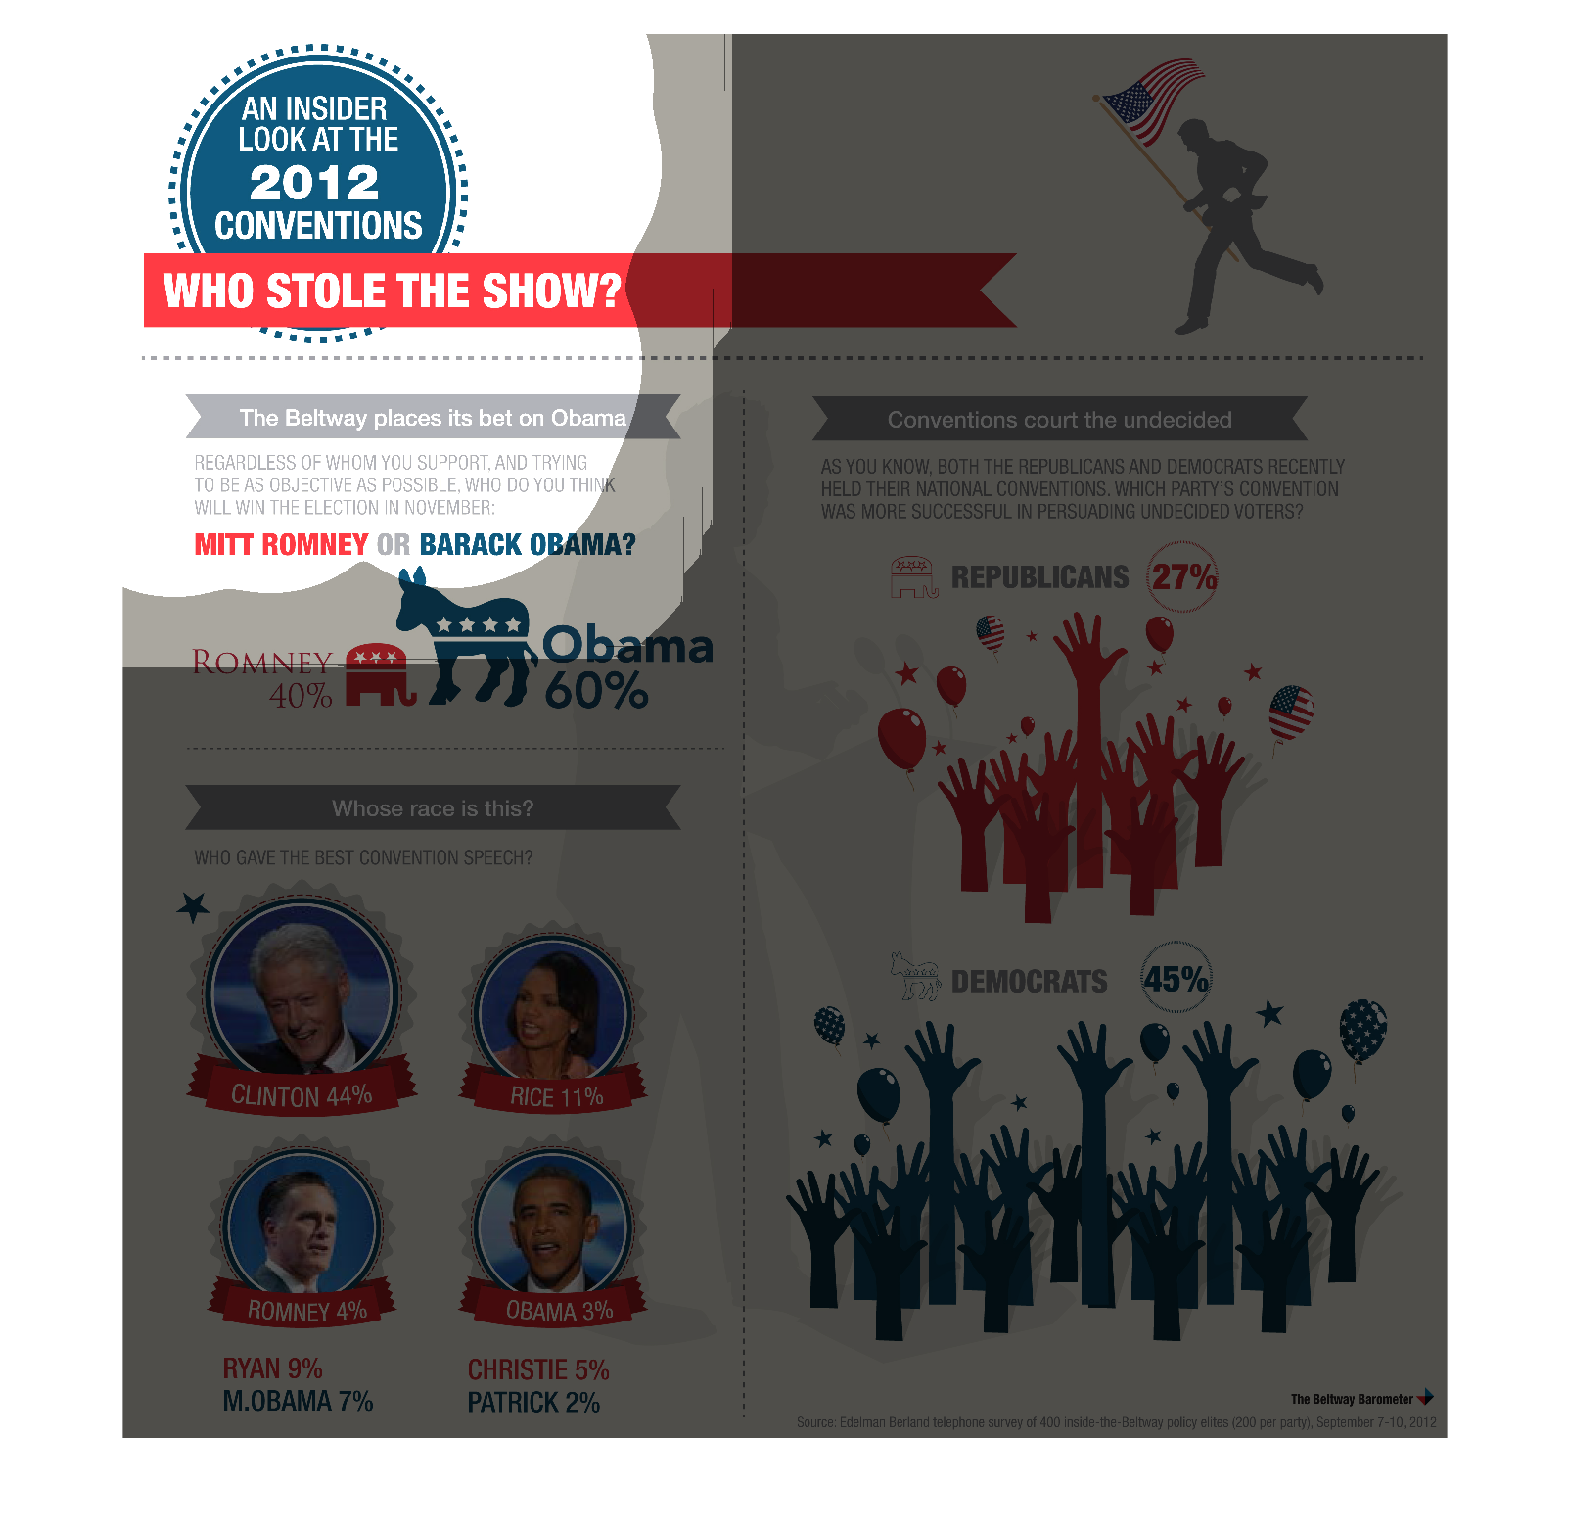
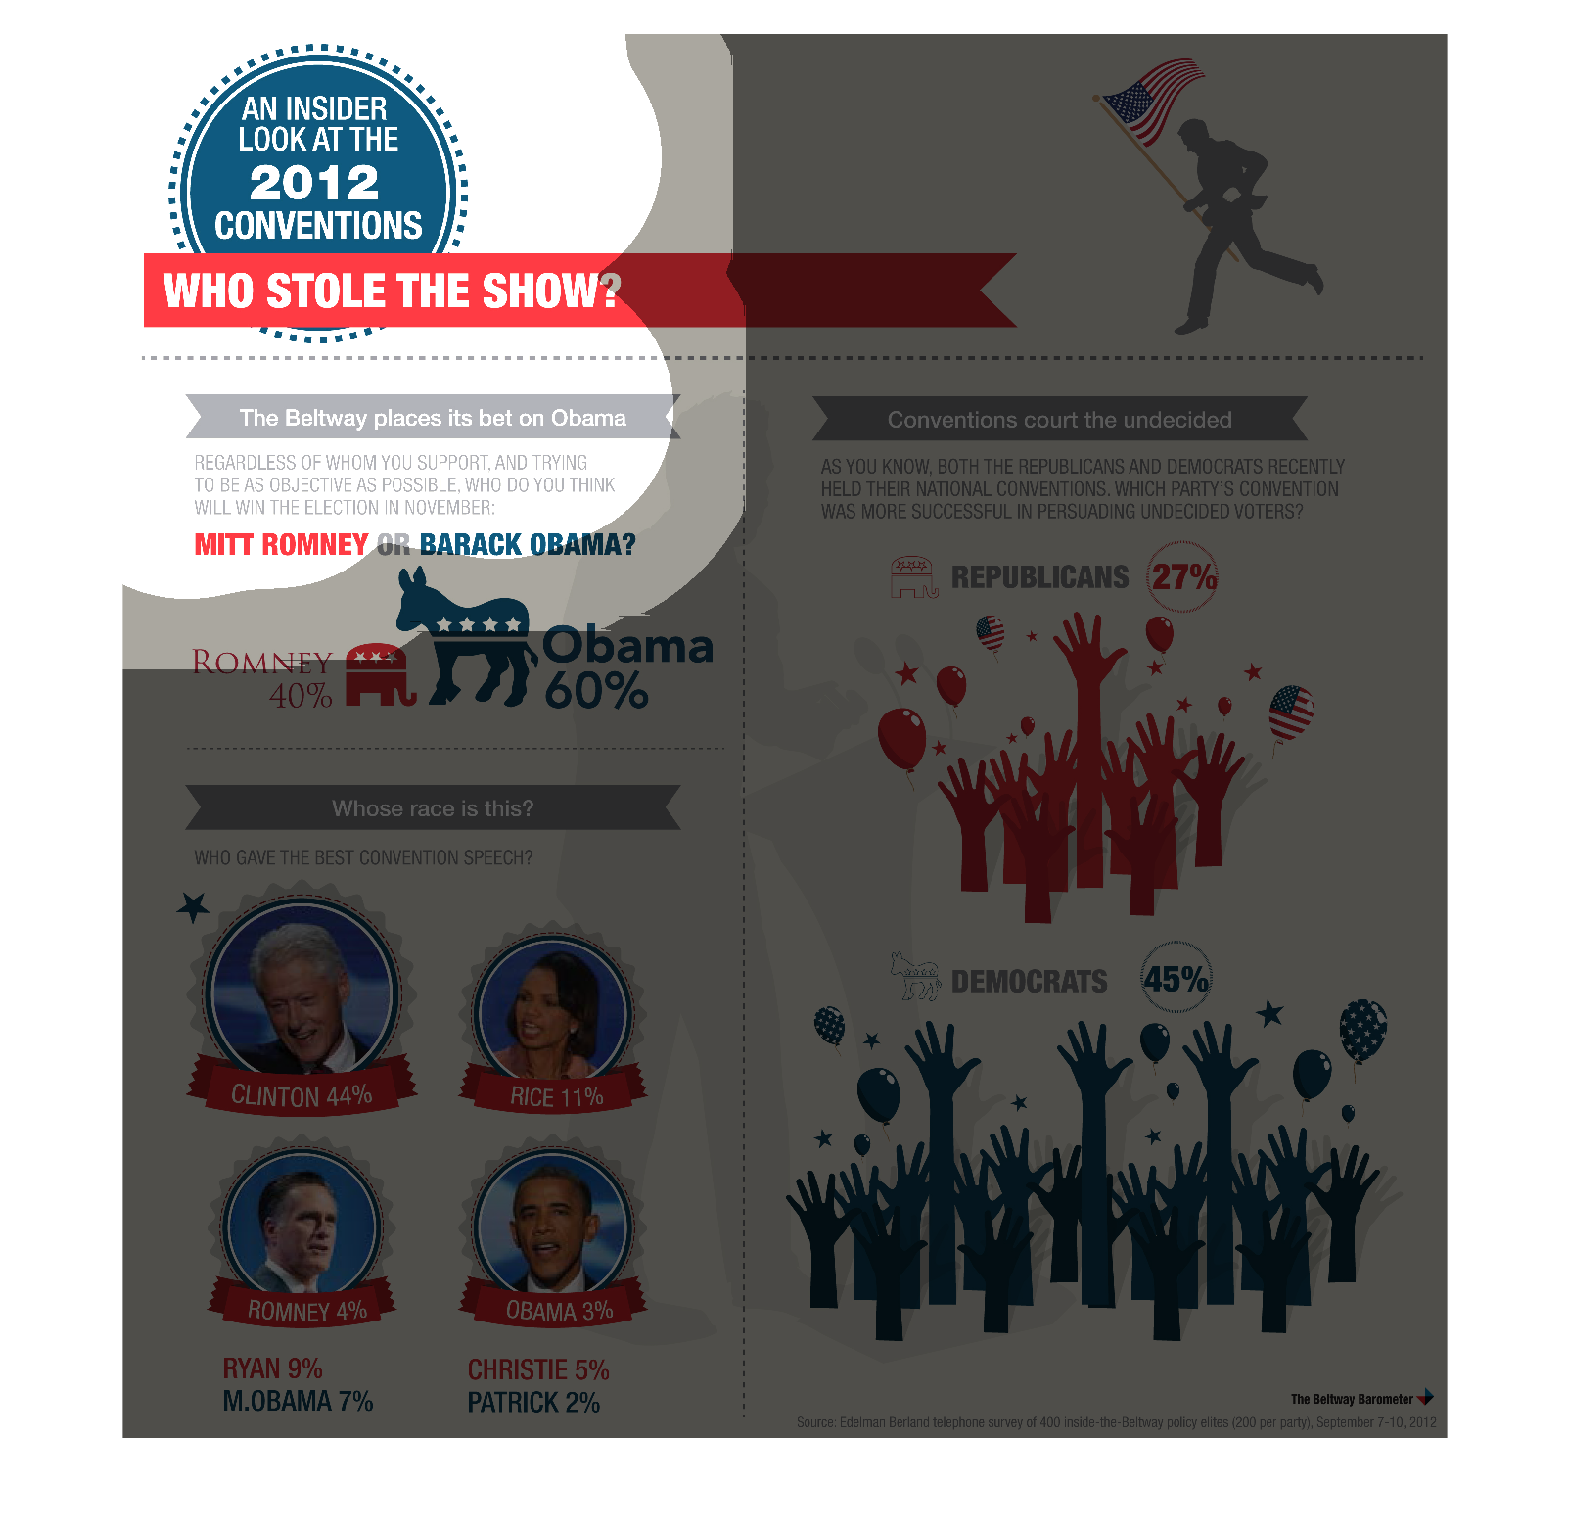
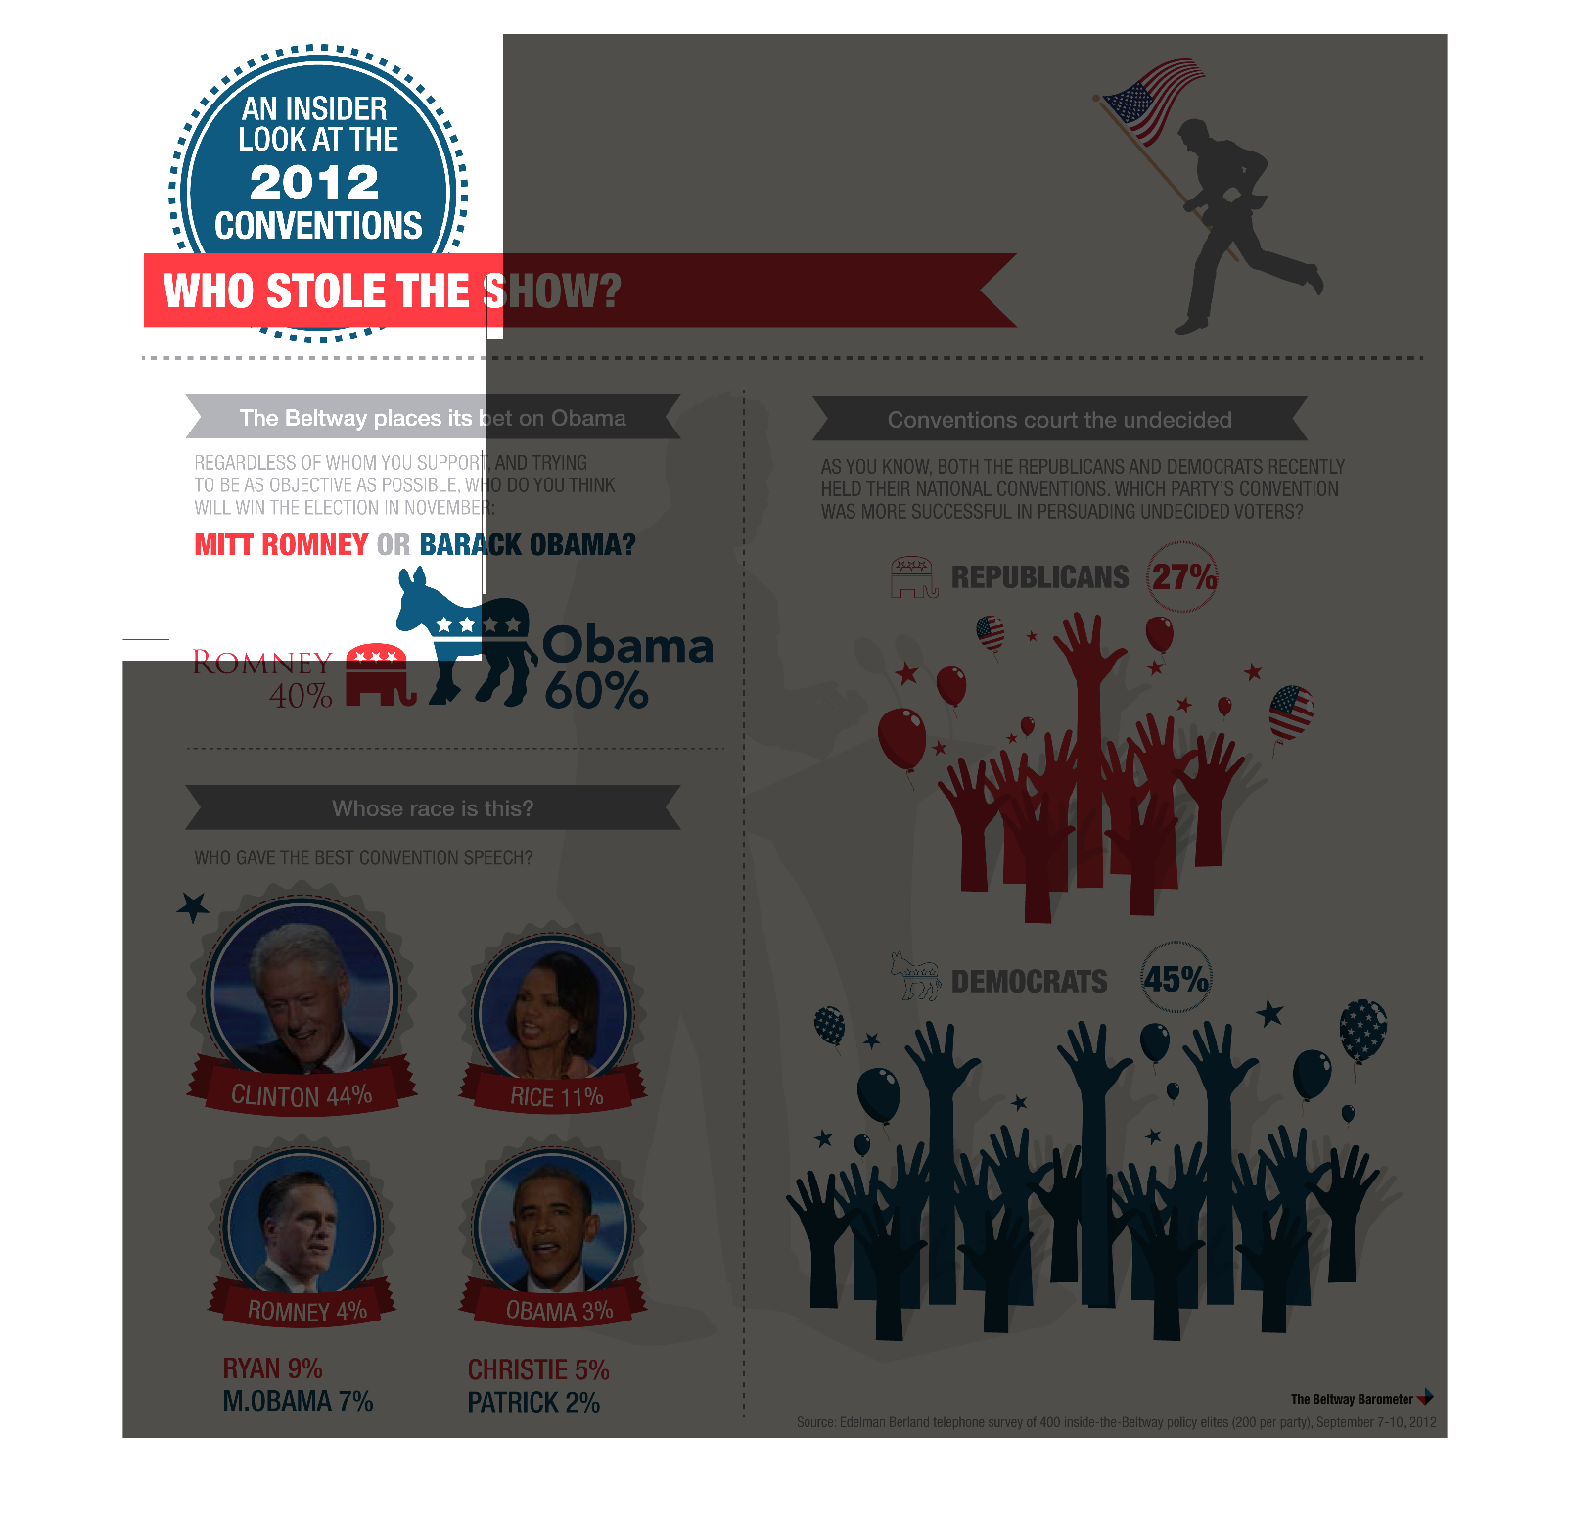
This graphic shows different highlights of the 2012 conventions in the United States, including
who gave the best speeches, who was generally more supported, and which party appealed more
to individuals who were undecided.
Warning: Image is too big to fit on screen; displaying at 50%
Warning: Image is too big to fit on screen; displaying at 50%
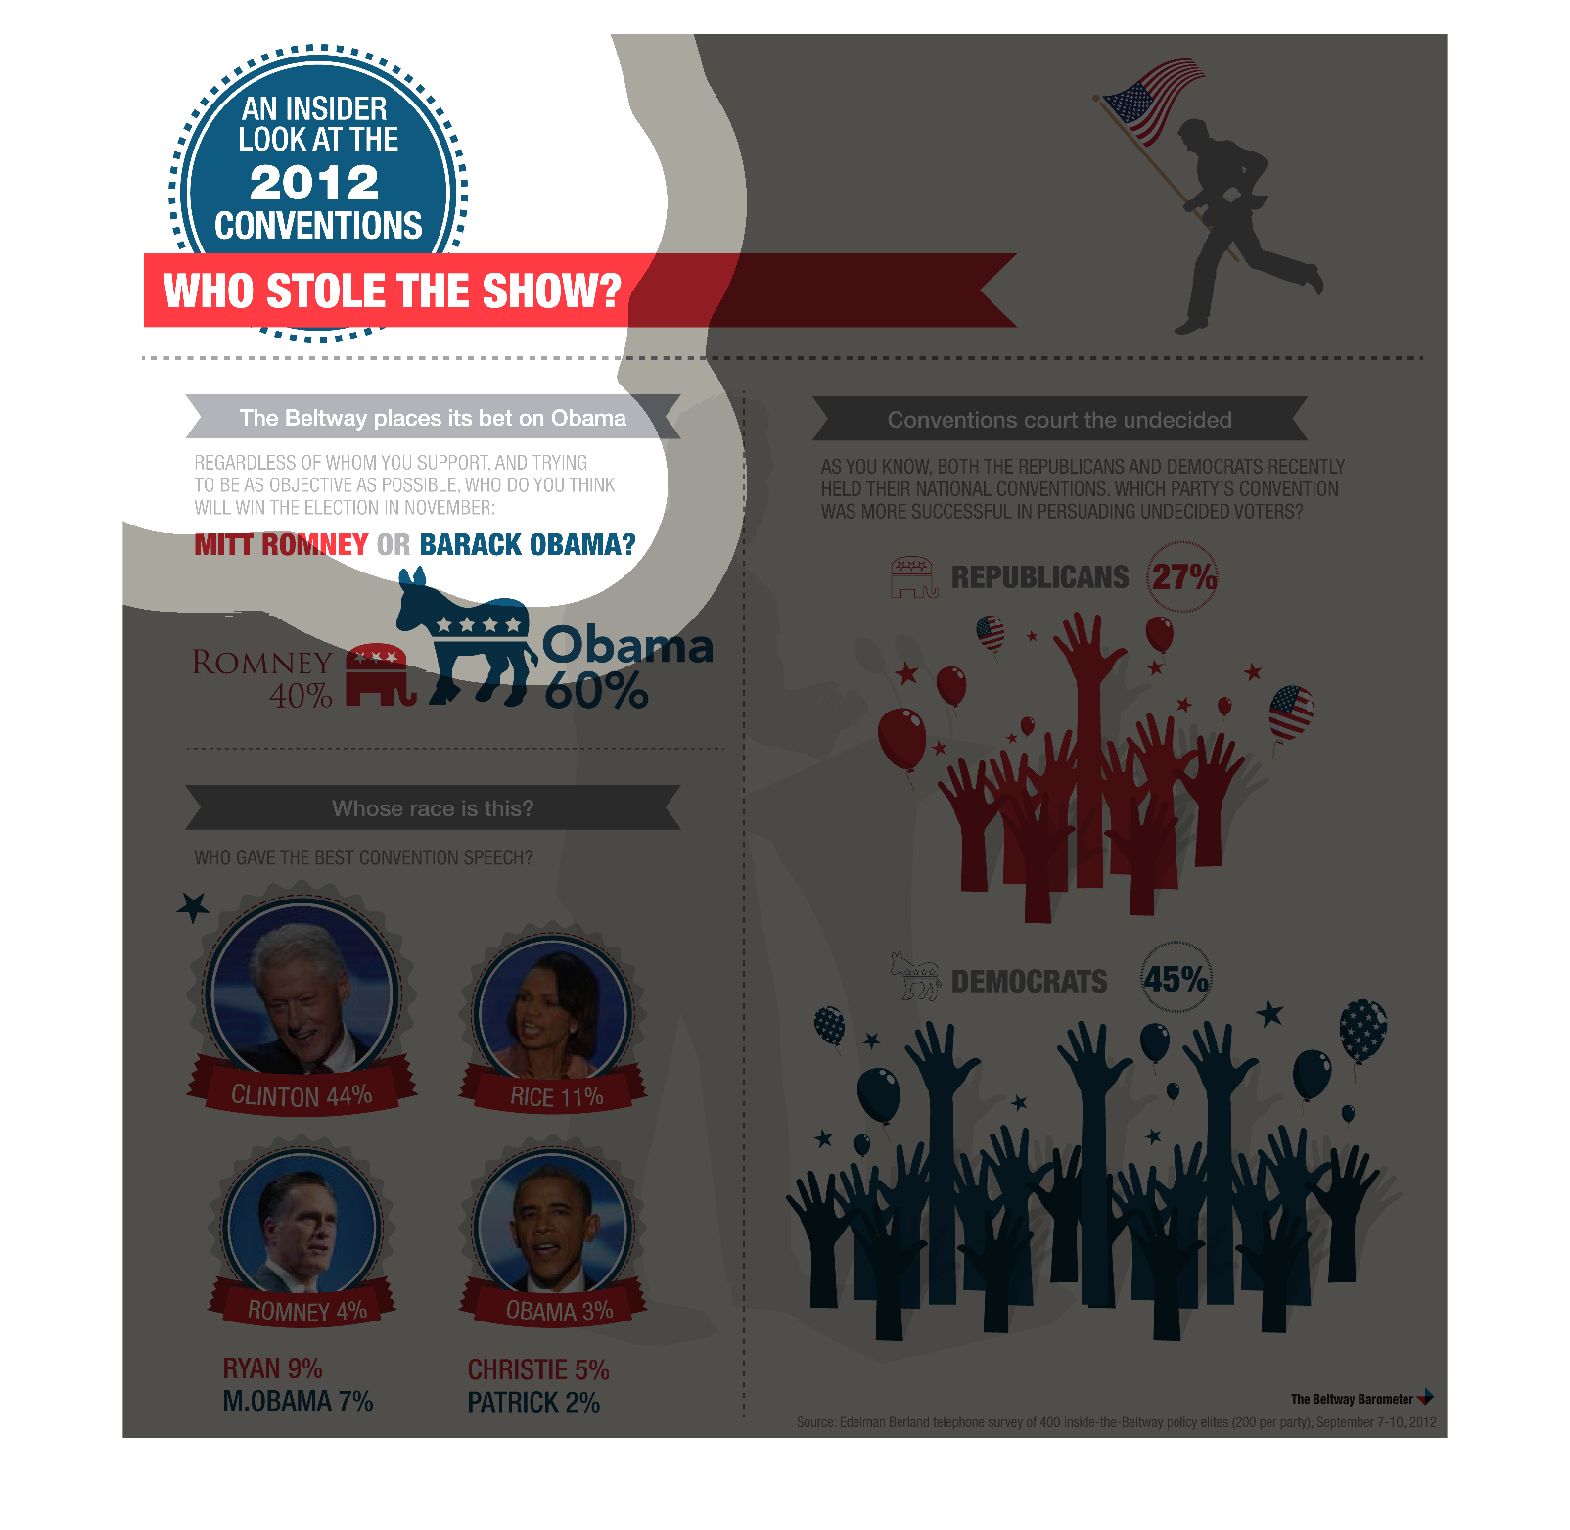
People were surveyed about the 2012 Presidential election. Among Beltway insiders, regardless
of their party affiliation, 60% thought that Obama was going to win the election. And as far
as winning over independents, Democrats were almost twice as successful as Republicans in
persuading reluctant independents to vote for the party candidate.
Warning: Image is too big to fit on screen; displaying at 50%
Warning: Image is too big to fit on screen; displaying at 50%
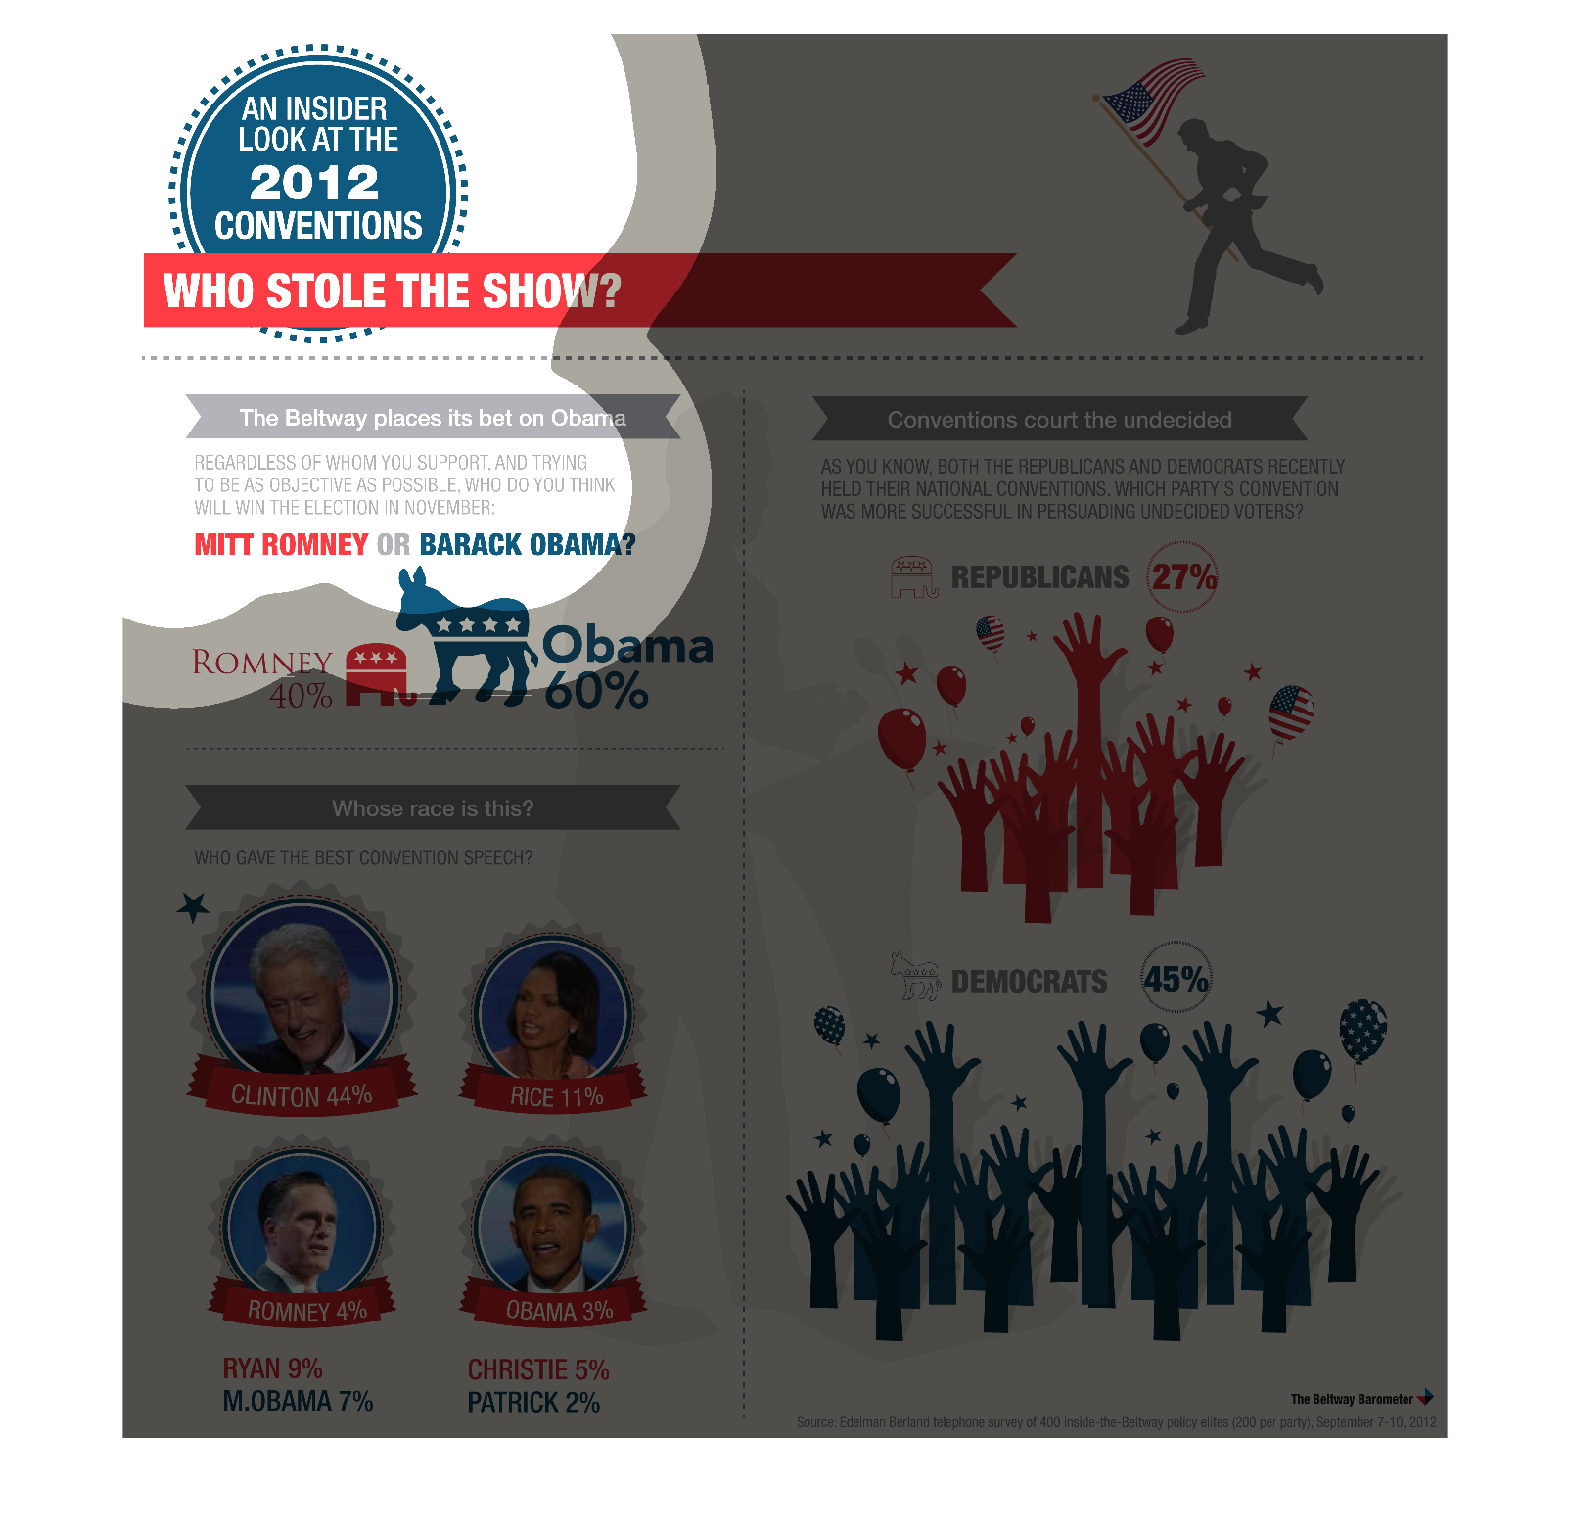
This chart shows which politicians did the best in the 2010 convention it is Broken down by
candidate Obama had 60 percent where Romney had 40. It also shows comparison of other canadates
Warning: Image is too big to fit on screen; displaying at 50%
Warning: Image is too big to fit on screen; displaying at 50%
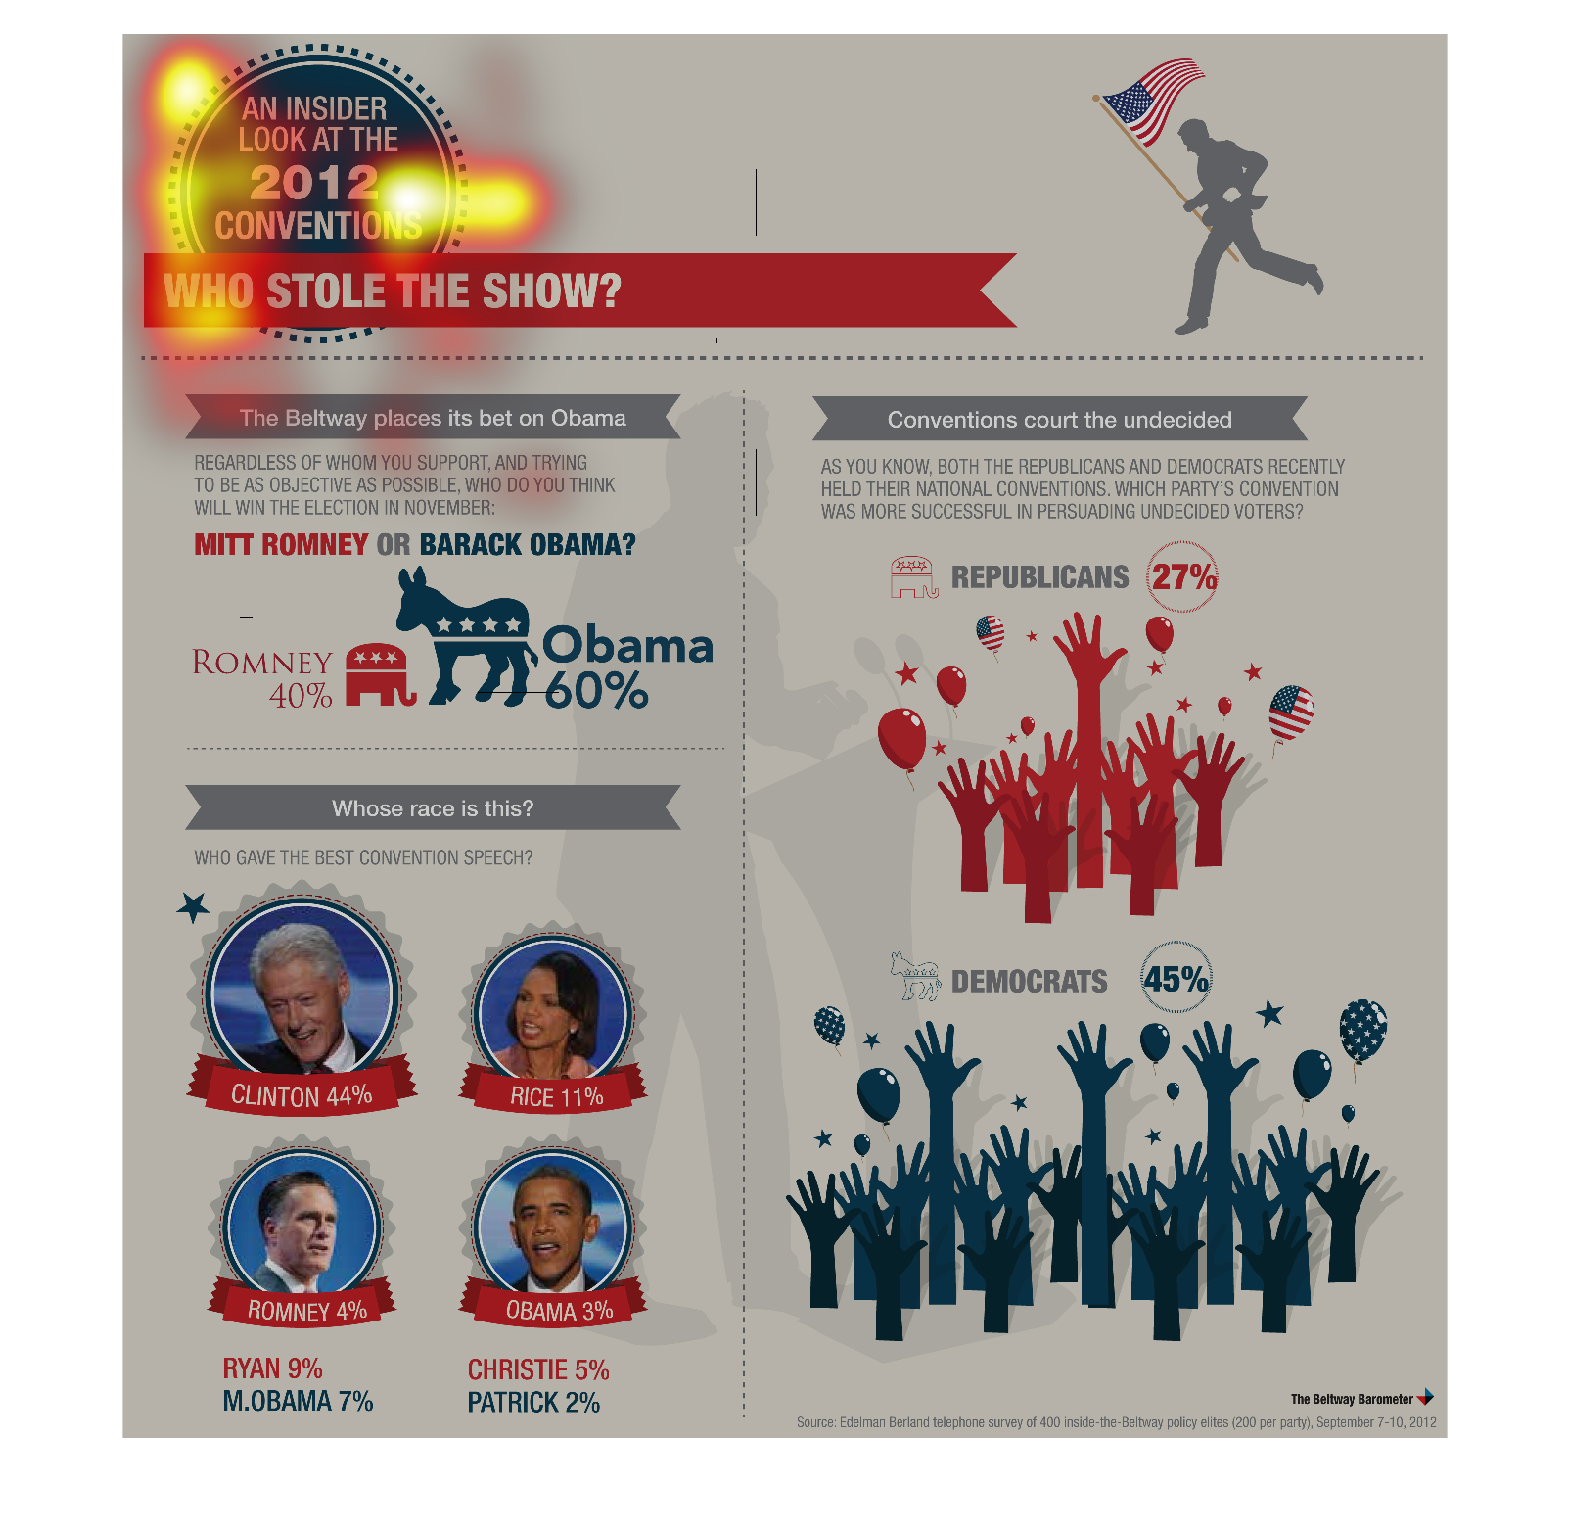
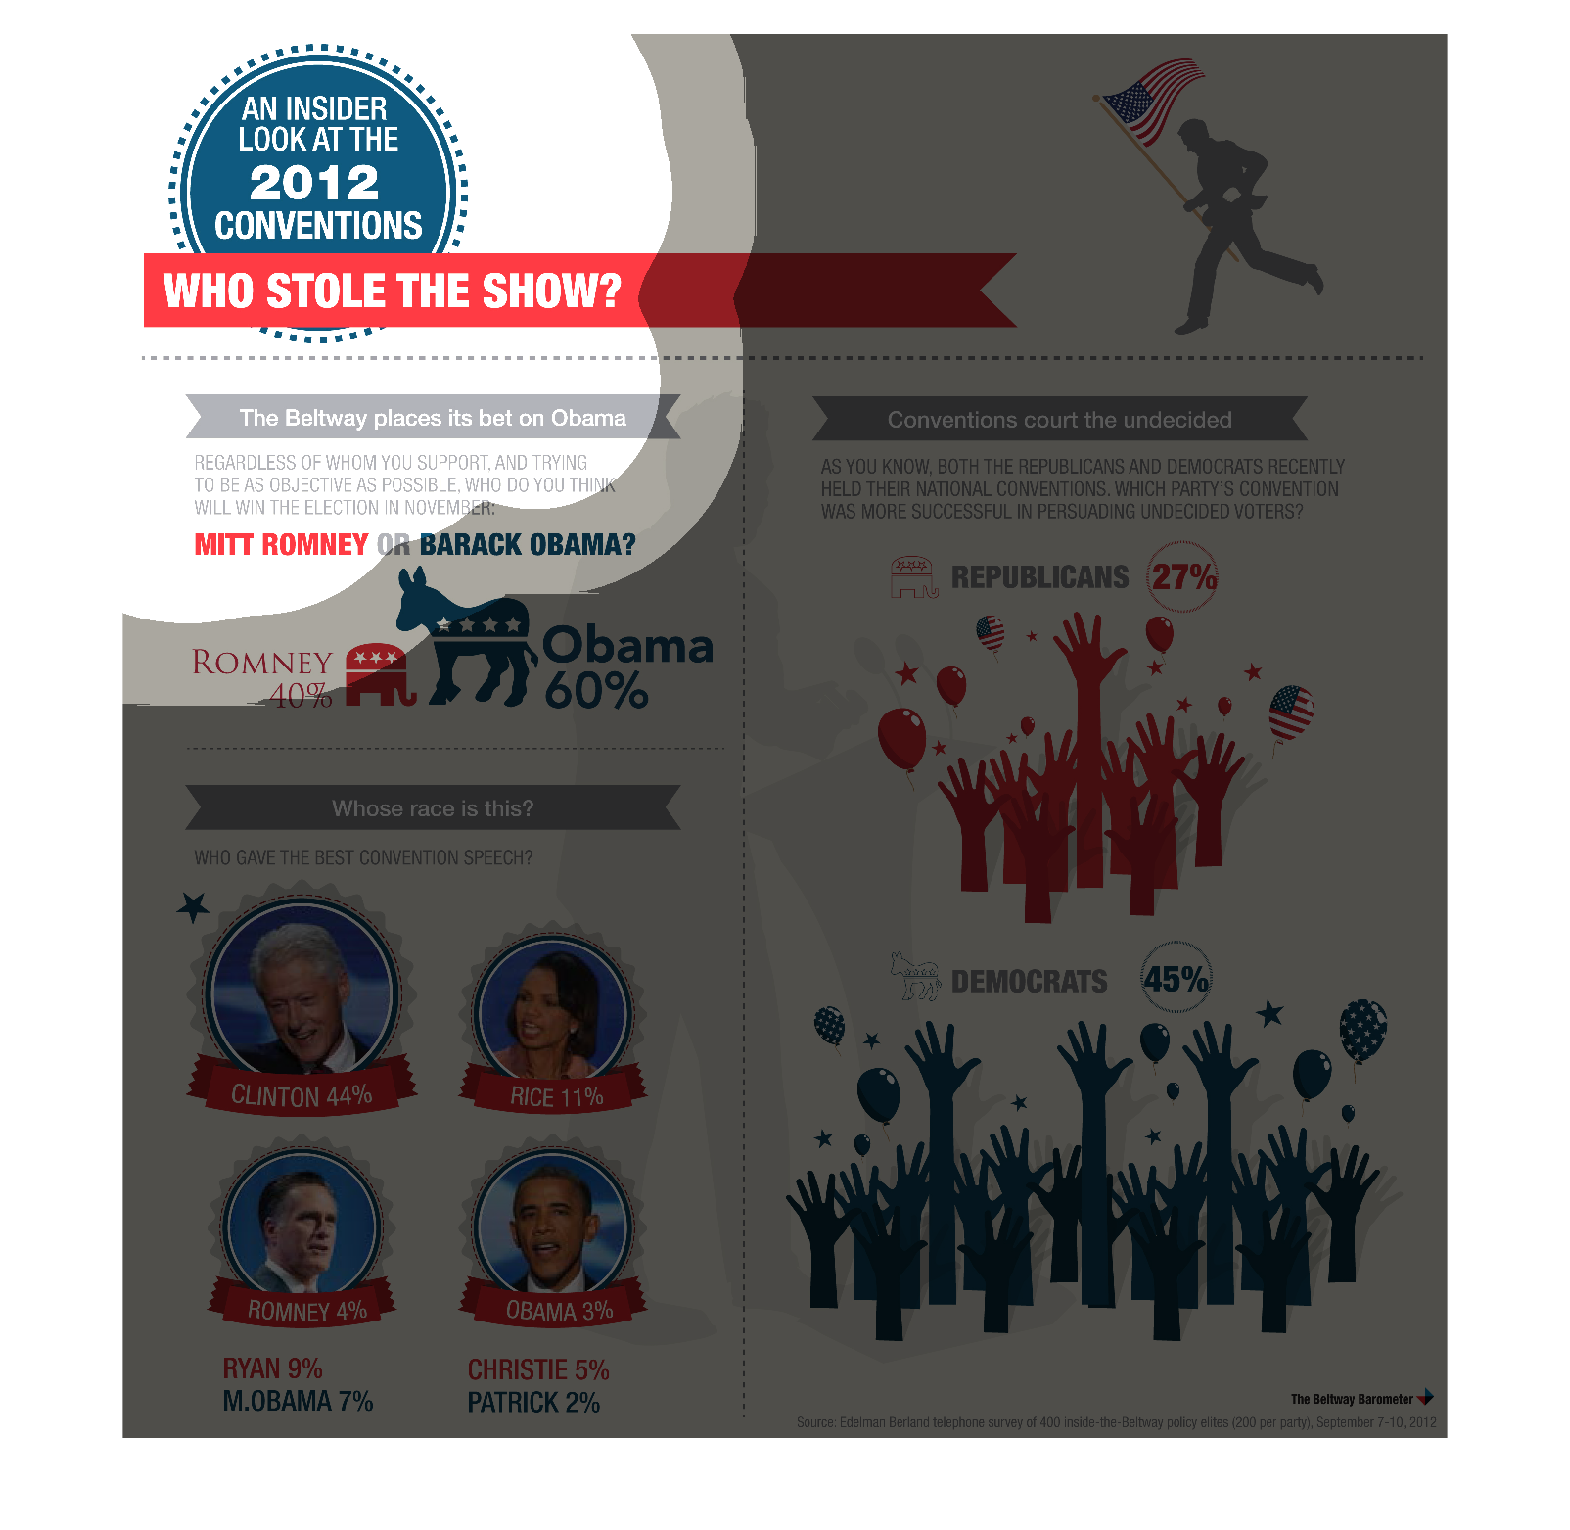
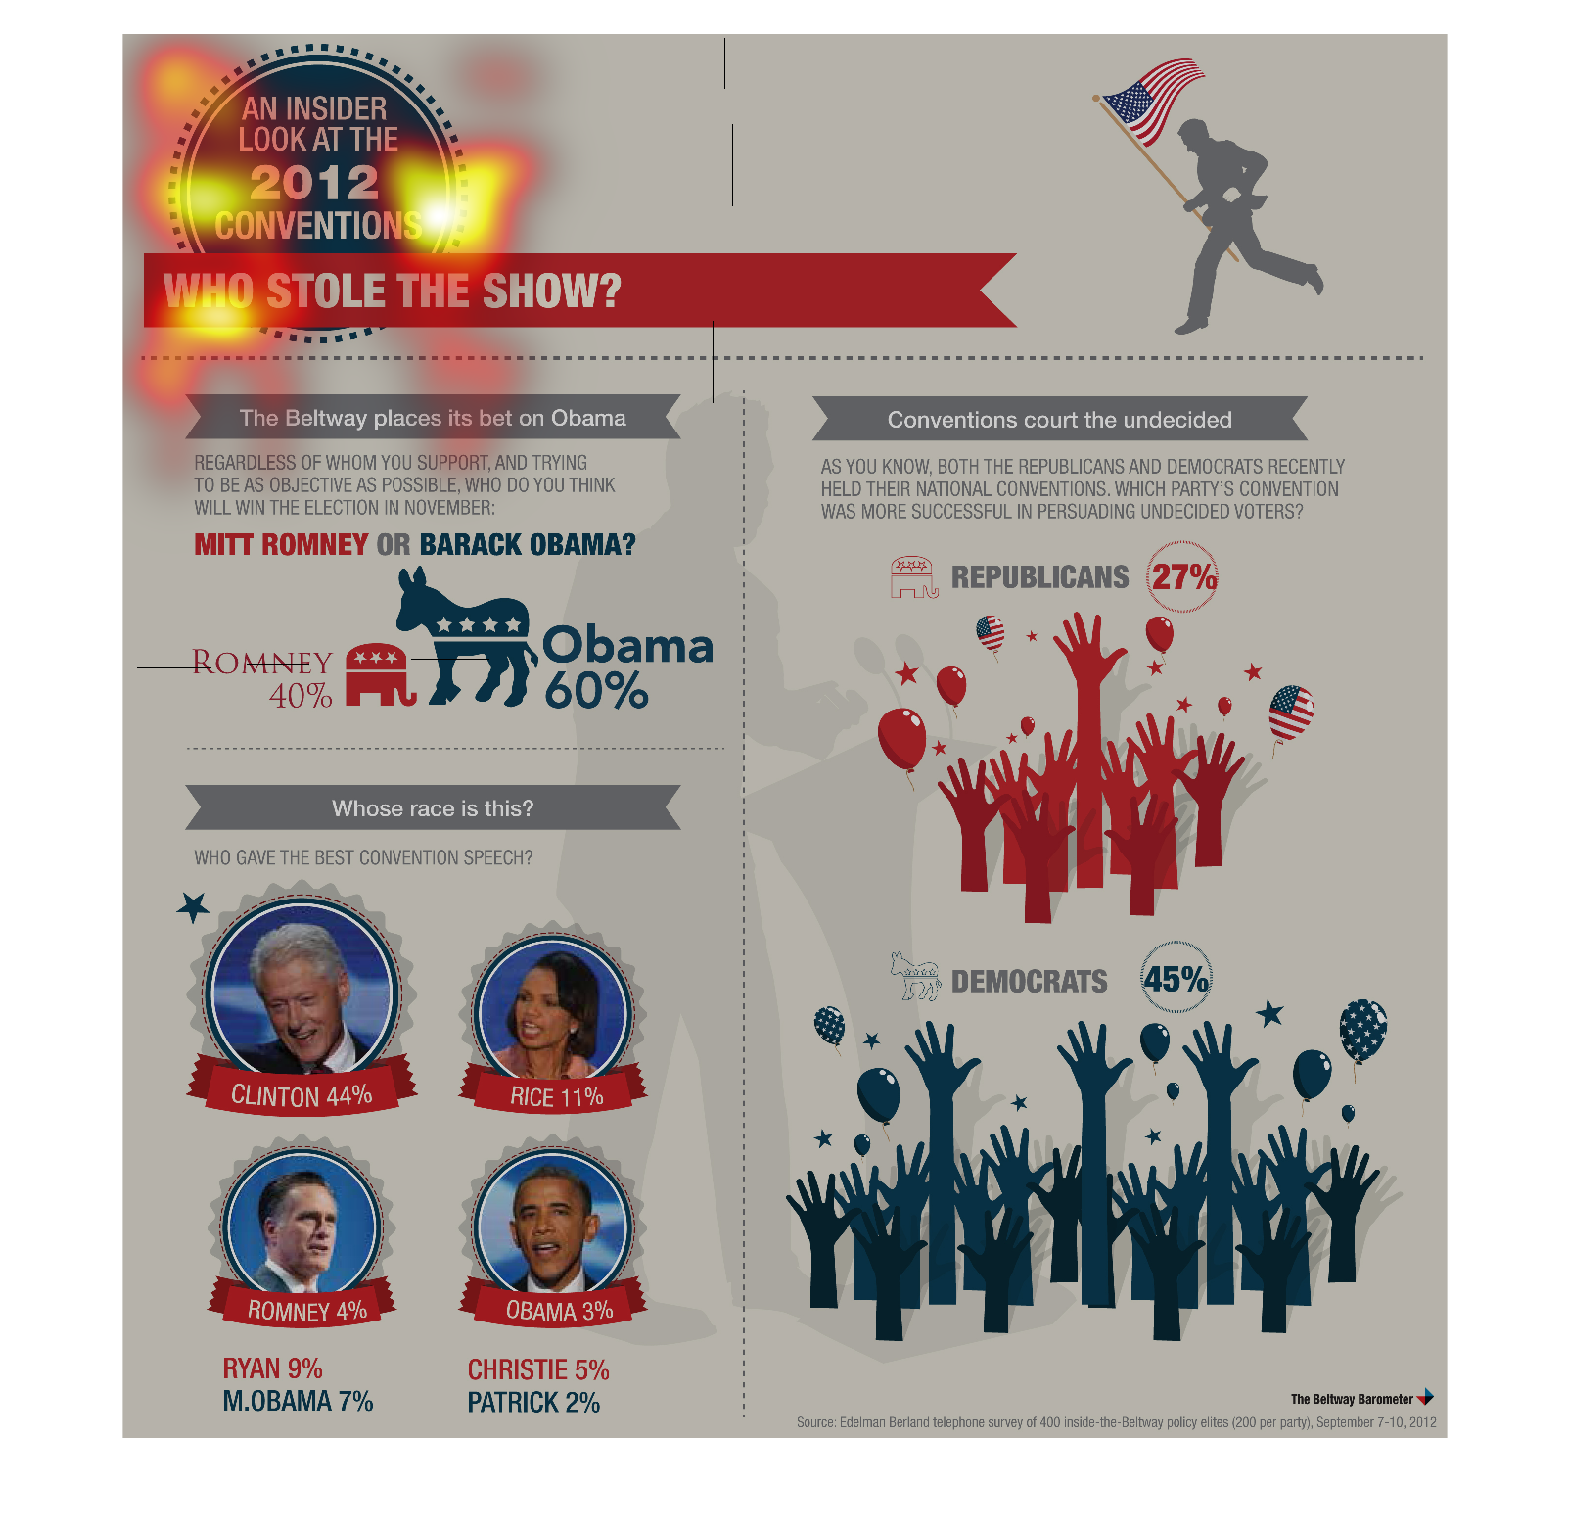
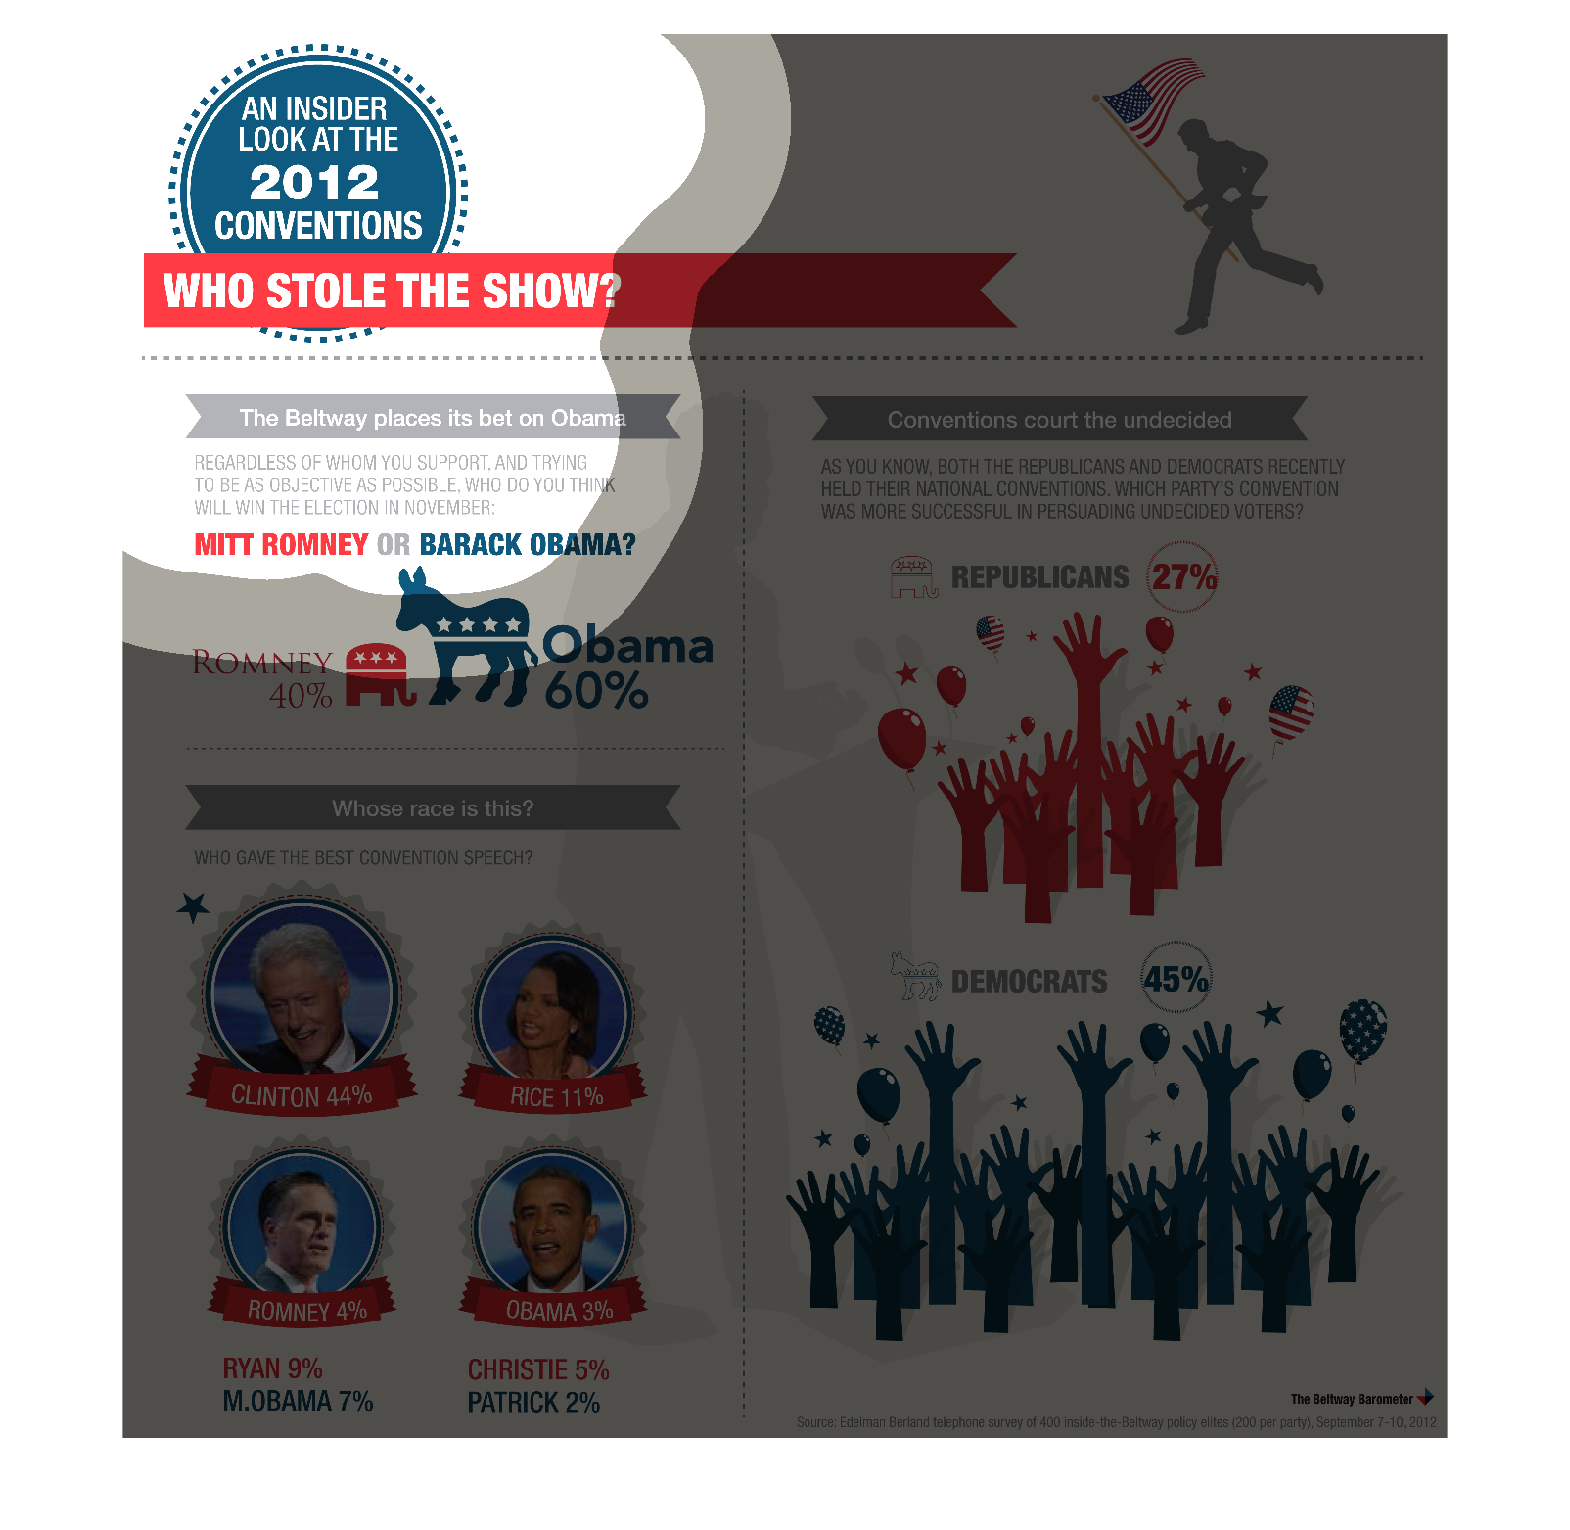
The graph on the left hand side is depecting how current President Barack Obama "stole the
show" during the 2012 convention.  It shows who gave the best speeches giving not much to
respect to the nominees of Obama and Romney.  Obama clearly won the nomination as one would
in tell later on.
Warning: Image is too big to fit on screen; displaying at 50%
Warning: Image is too big to fit on screen; displaying at 50%
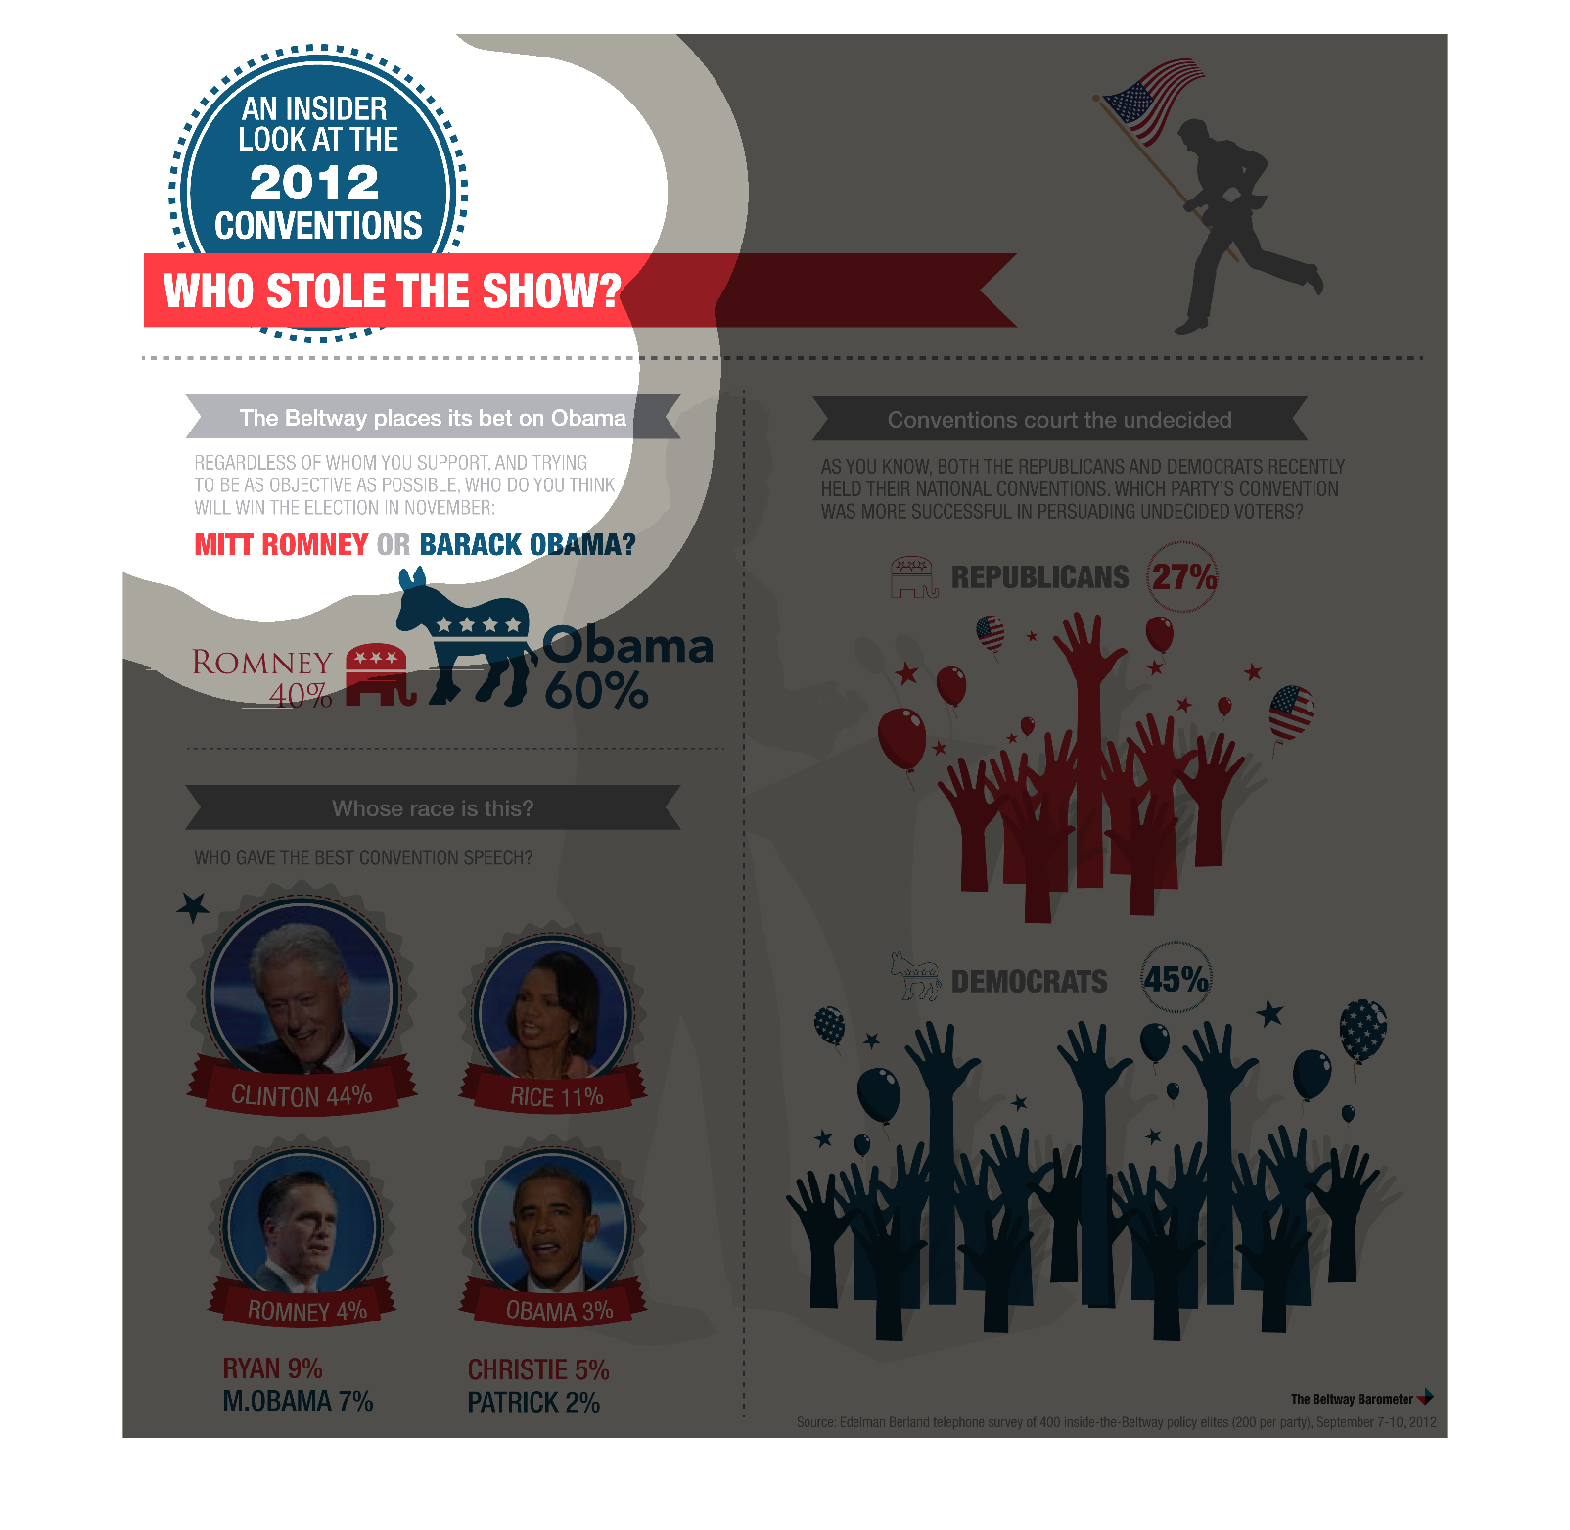
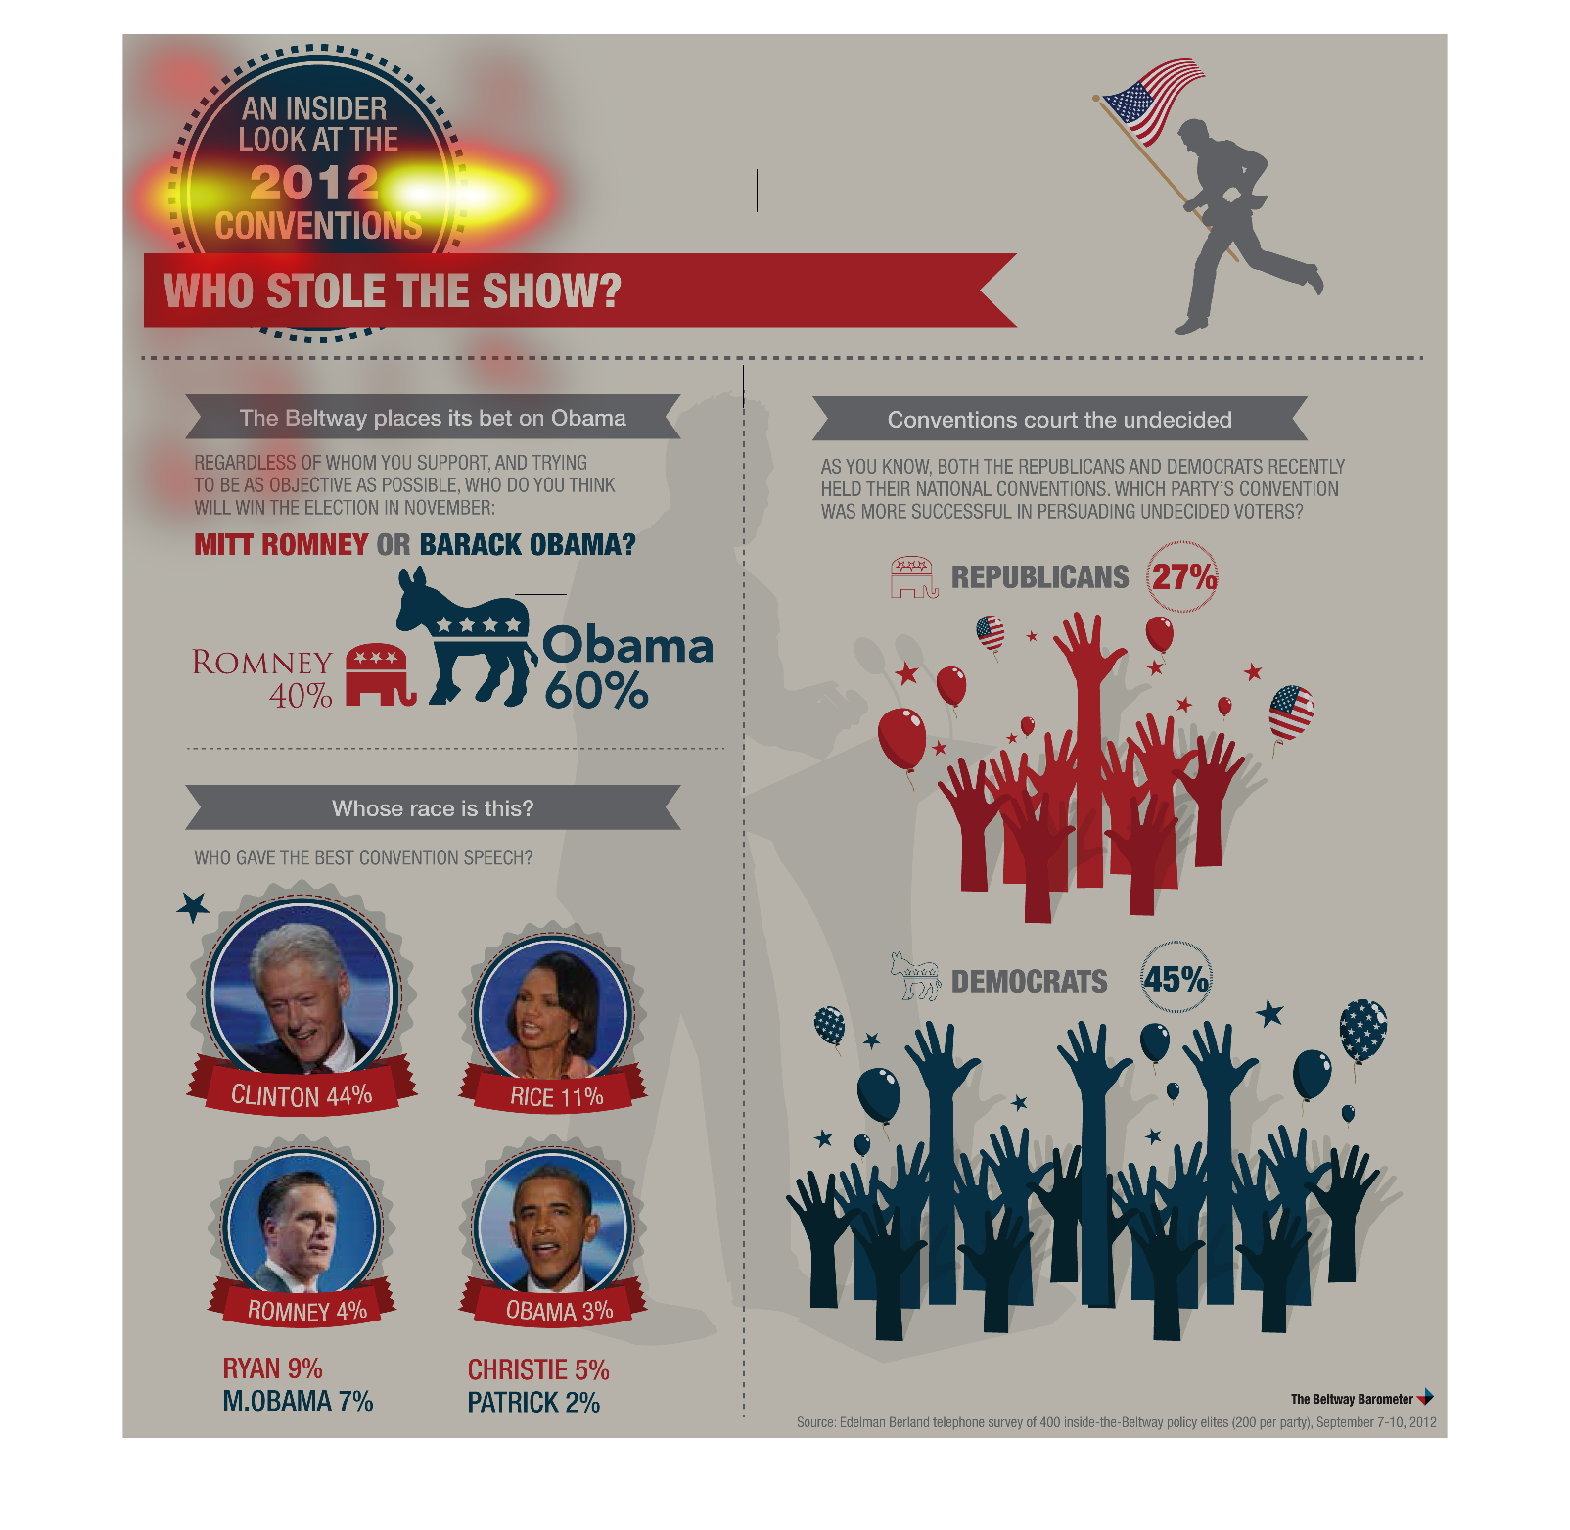
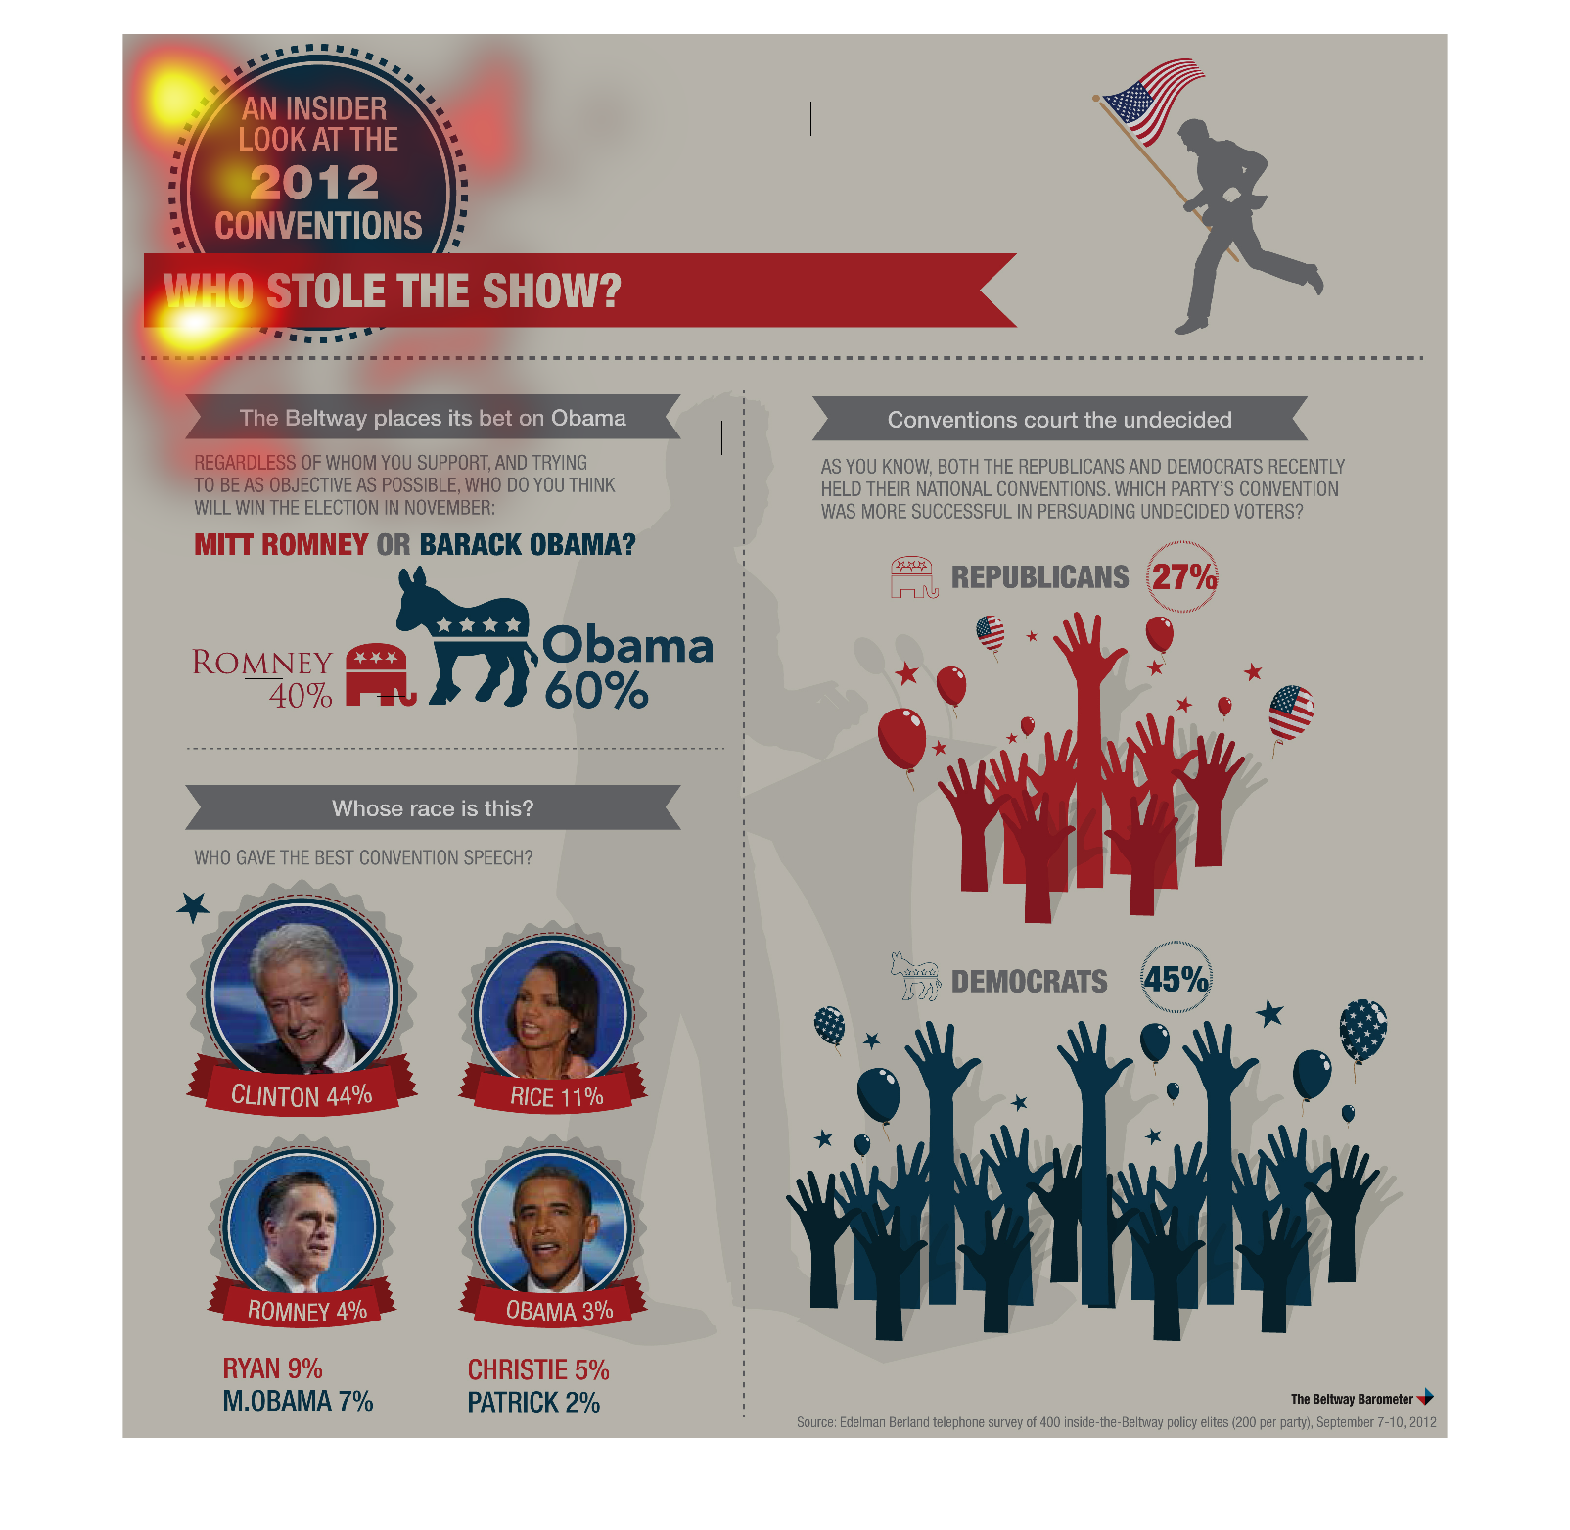
This is about the 2012 conventions in the presidential election. Obama had 60 percent and
Romeny had 40 percent of the votes. Bill Clinton is rated at 44 percent for having the best
convention speech. Republicans had 27 and democrats 45 percent.
Warning: Image is too big to fit on screen; displaying at 50%
Warning: Image is too big to fit on screen; displaying at 50%
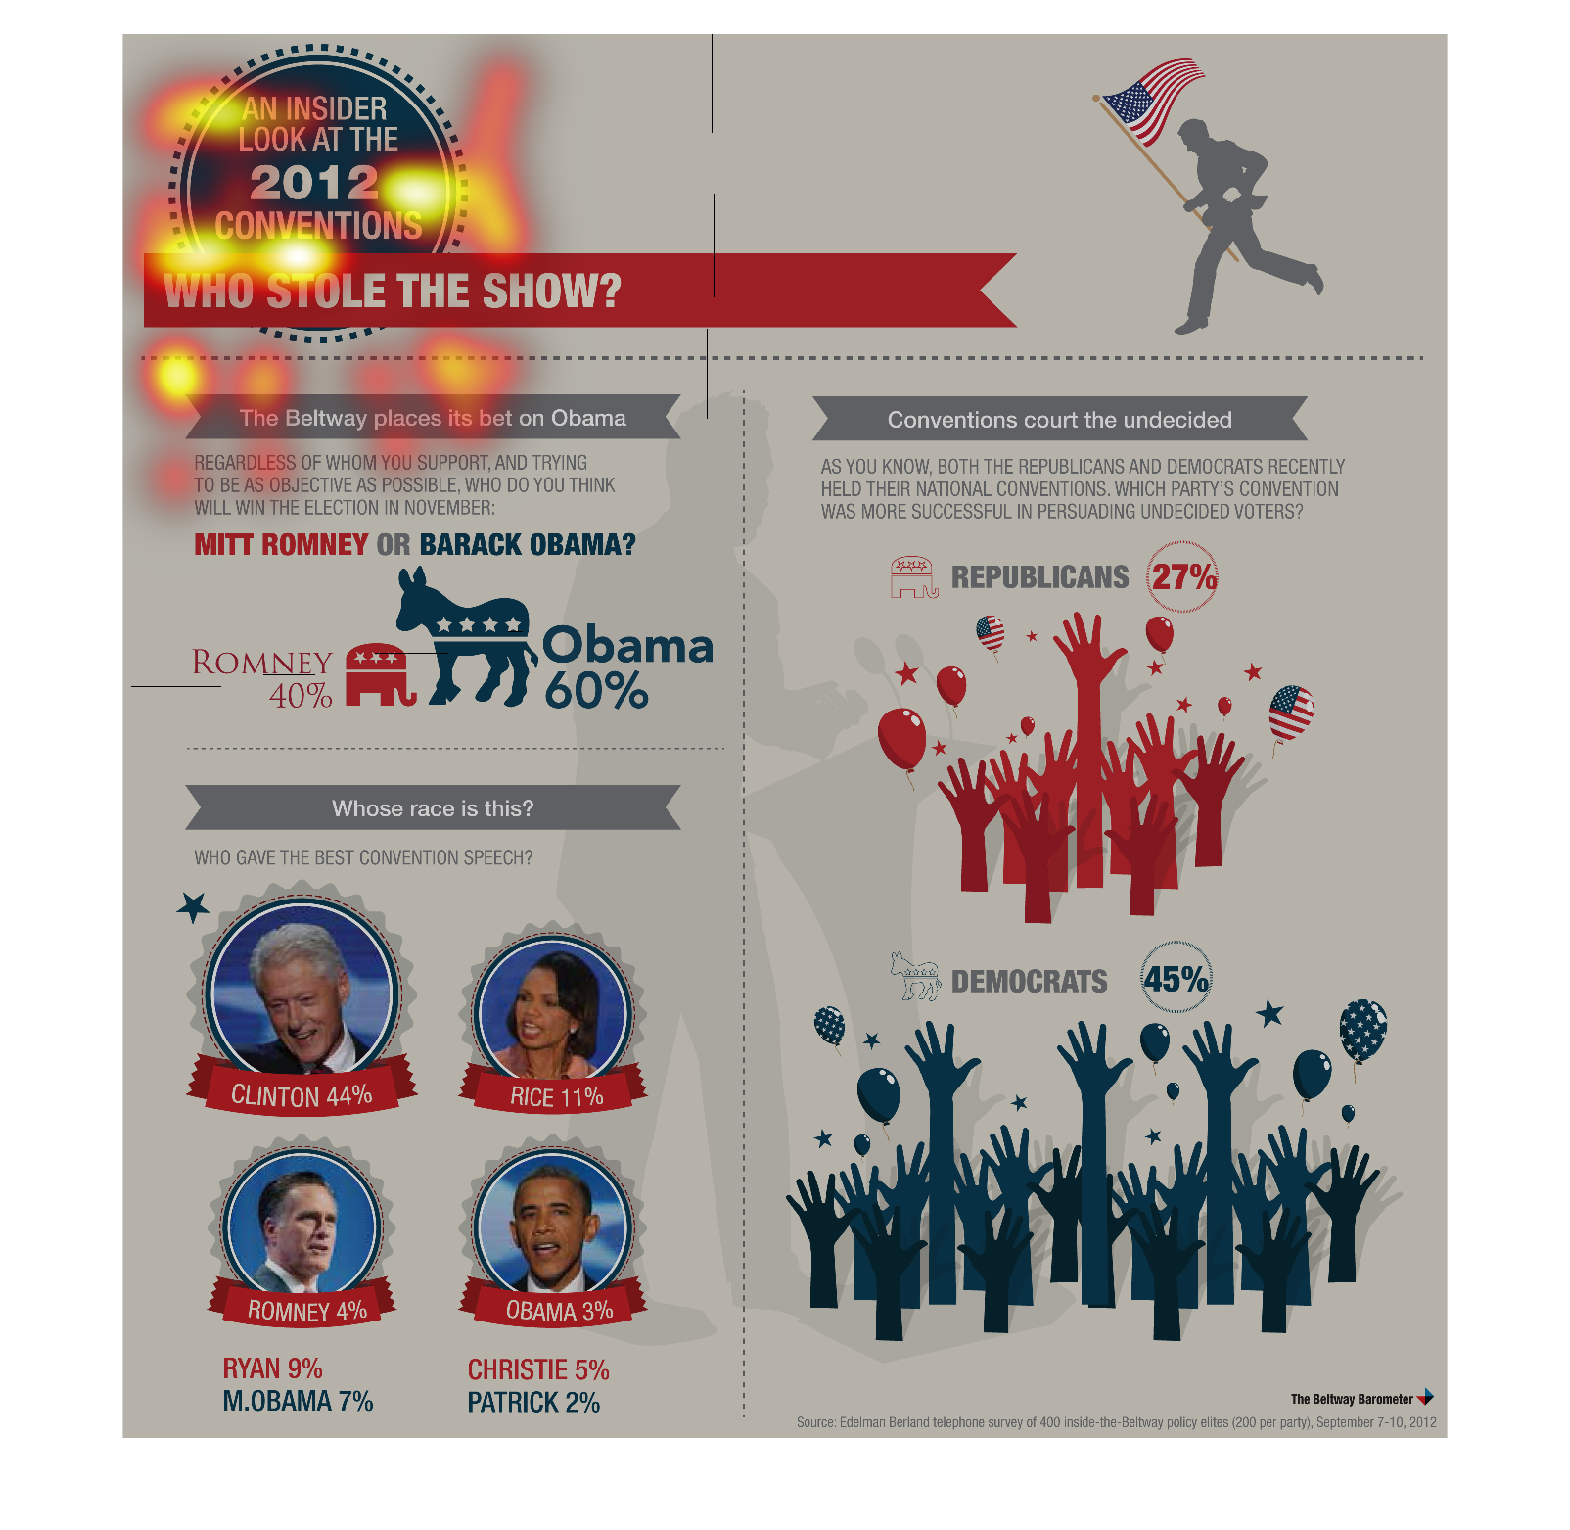
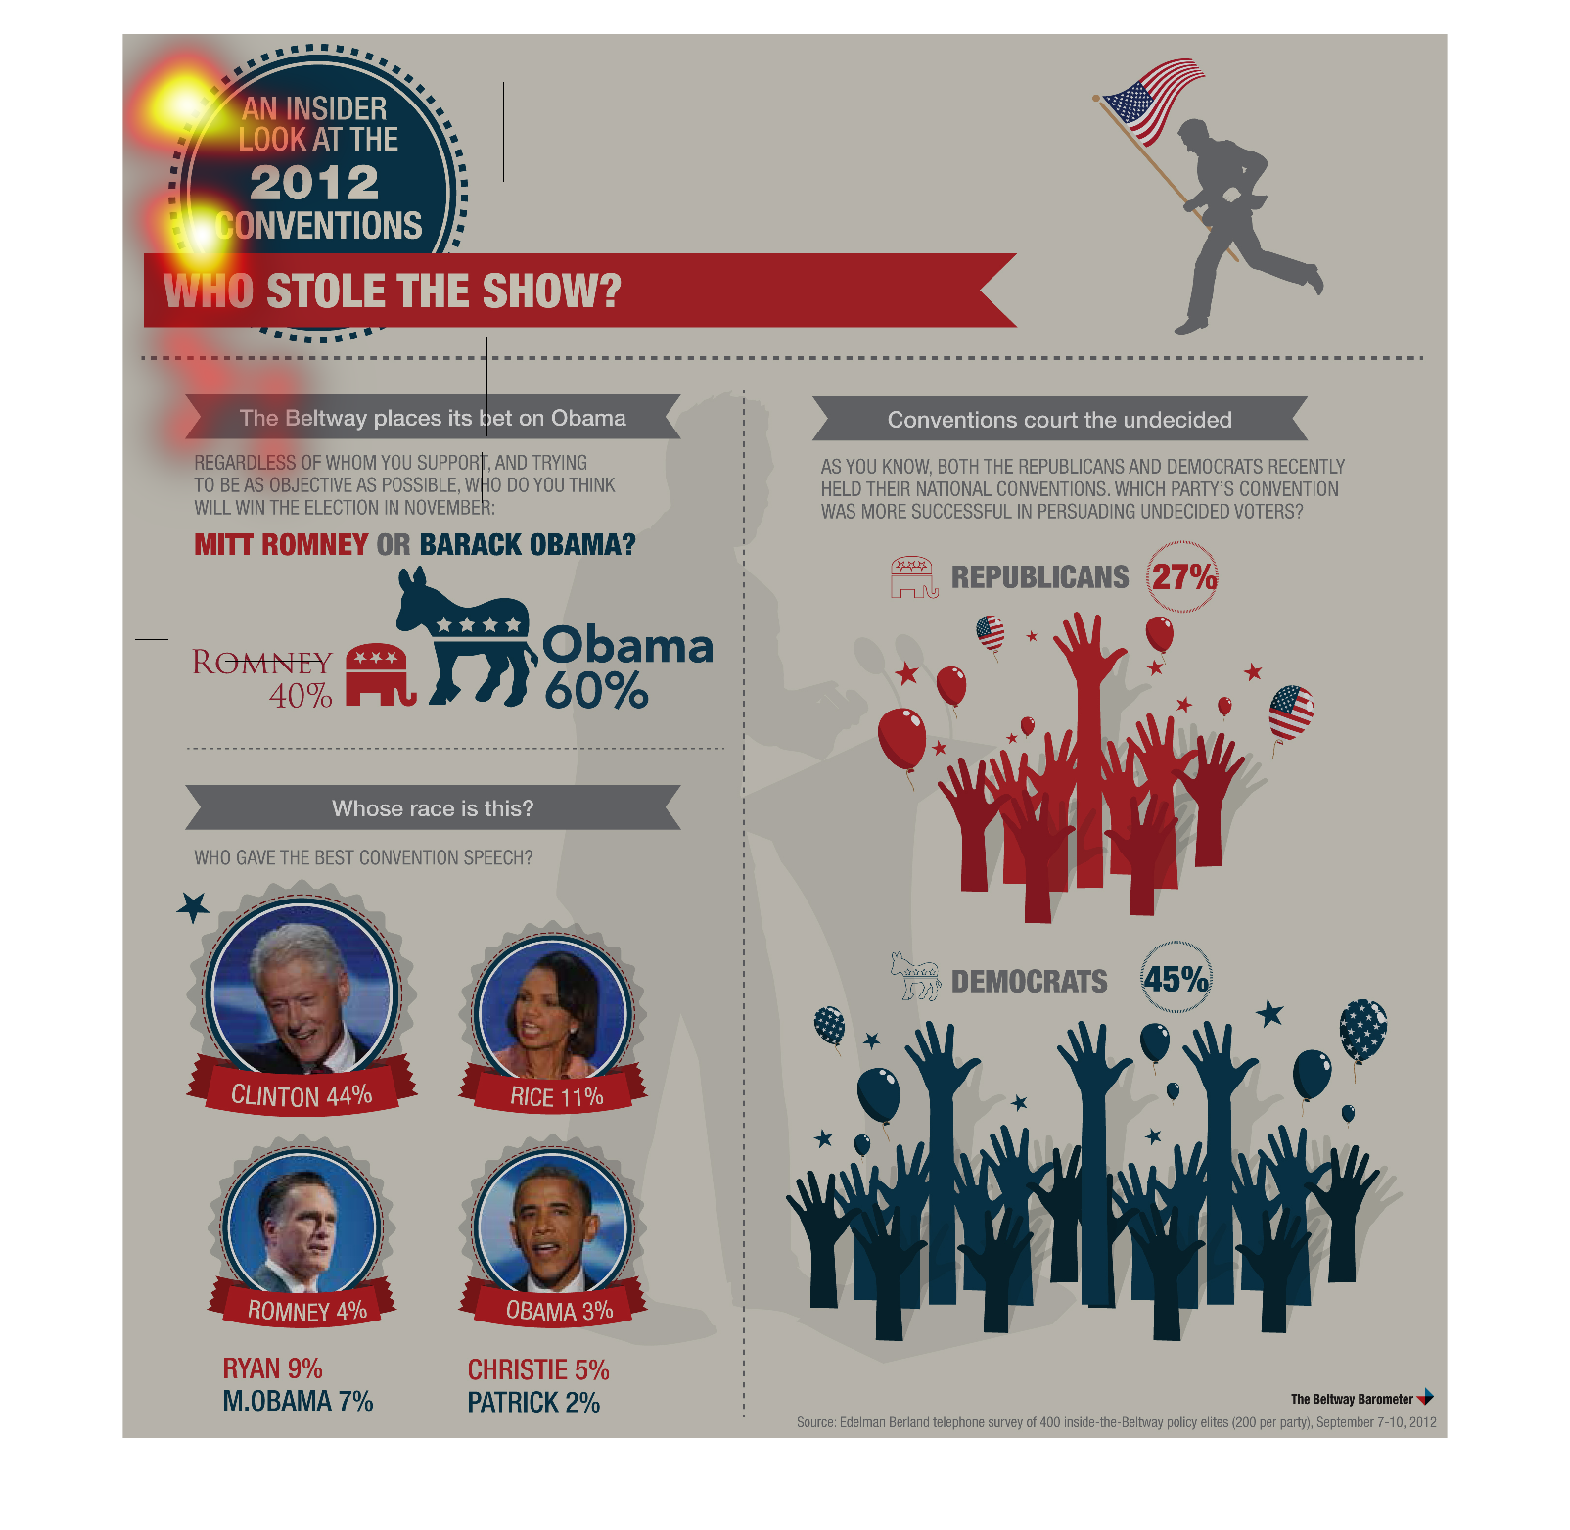
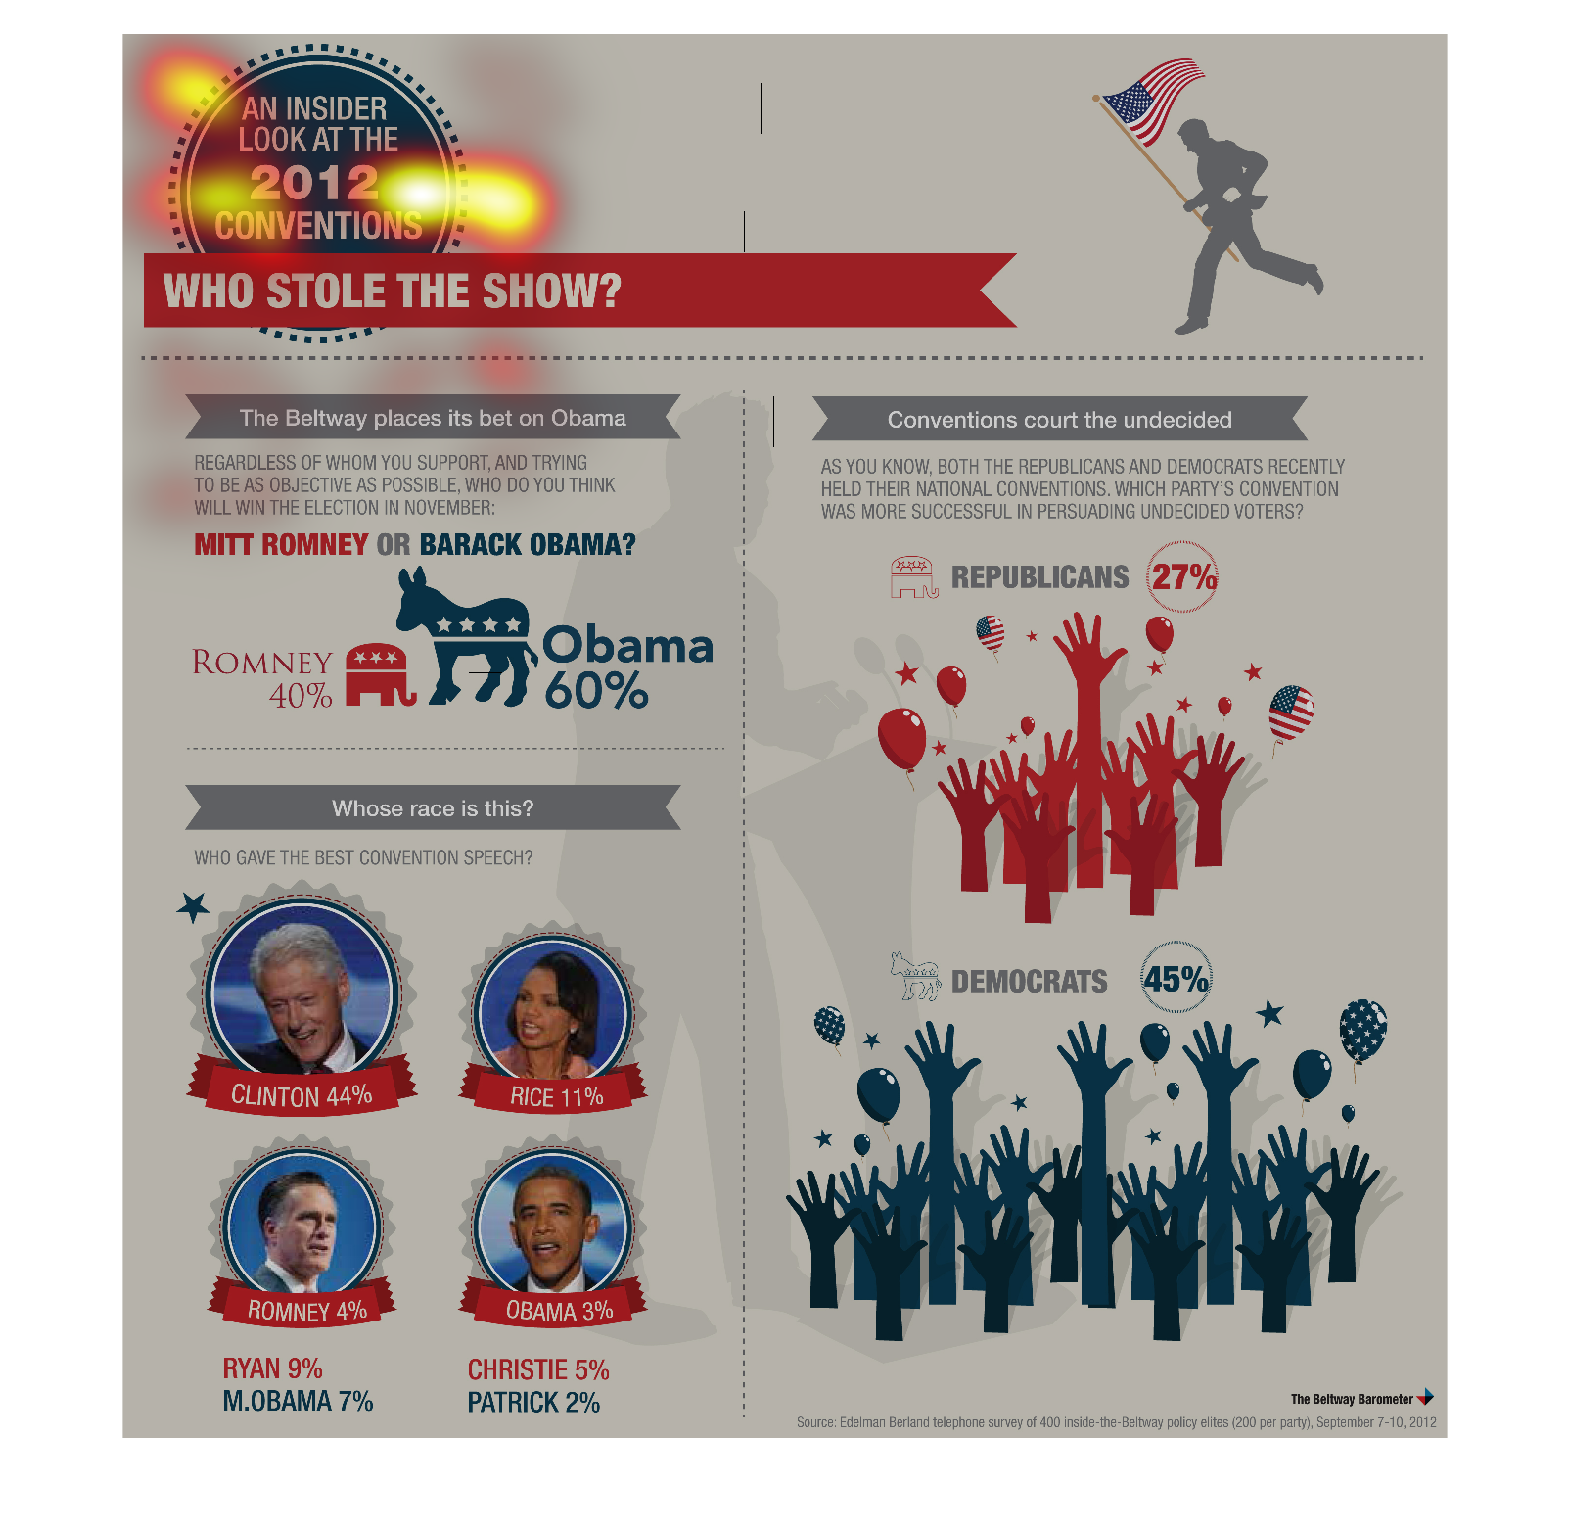
This image is about the 2012 election and the tension between both Democrats and Republicans.
The percentage of Democrats and Republicans who are heavily involved in the election or undecided,
as well as politicians (divided by party affiliation) and their influence on the election.
It also offers details about how many people supported Presidential candidates Obama and Romney.
Warning: Image is too big to fit on screen; displaying at 50%
Warning: Image is too big to fit on screen; displaying at 50%
This shows how each candidate fared in their respective party conventions during the 2012
U.S Presidential election period. The obvious favorite by a landslide- and ultimate winner-
was Barack Obama.
Warning: Image is too big to fit on screen; displaying at 50%
Warning: Image is too big to fit on screen; displaying at 50%
The following chart shows what president at the presidential convention gave the best presentation.
Actually out of the presidents the former one stole the show. Former President Bill Clinton
by a large percentage gave the best speech according to a poll.
Warning: Image is too big to fit on screen; displaying at 50%
Warning: Image is too big to fit on screen; displaying at 50%
This chart describes an insider look at the 2012 conventions. Specifically, who stole the
show. The chart includes photographs of several people, including Barack Obama.
Warning: Image is too big to fit on screen; displaying at 50%
Warning: Image is too big to fit on screen; displaying at 50%
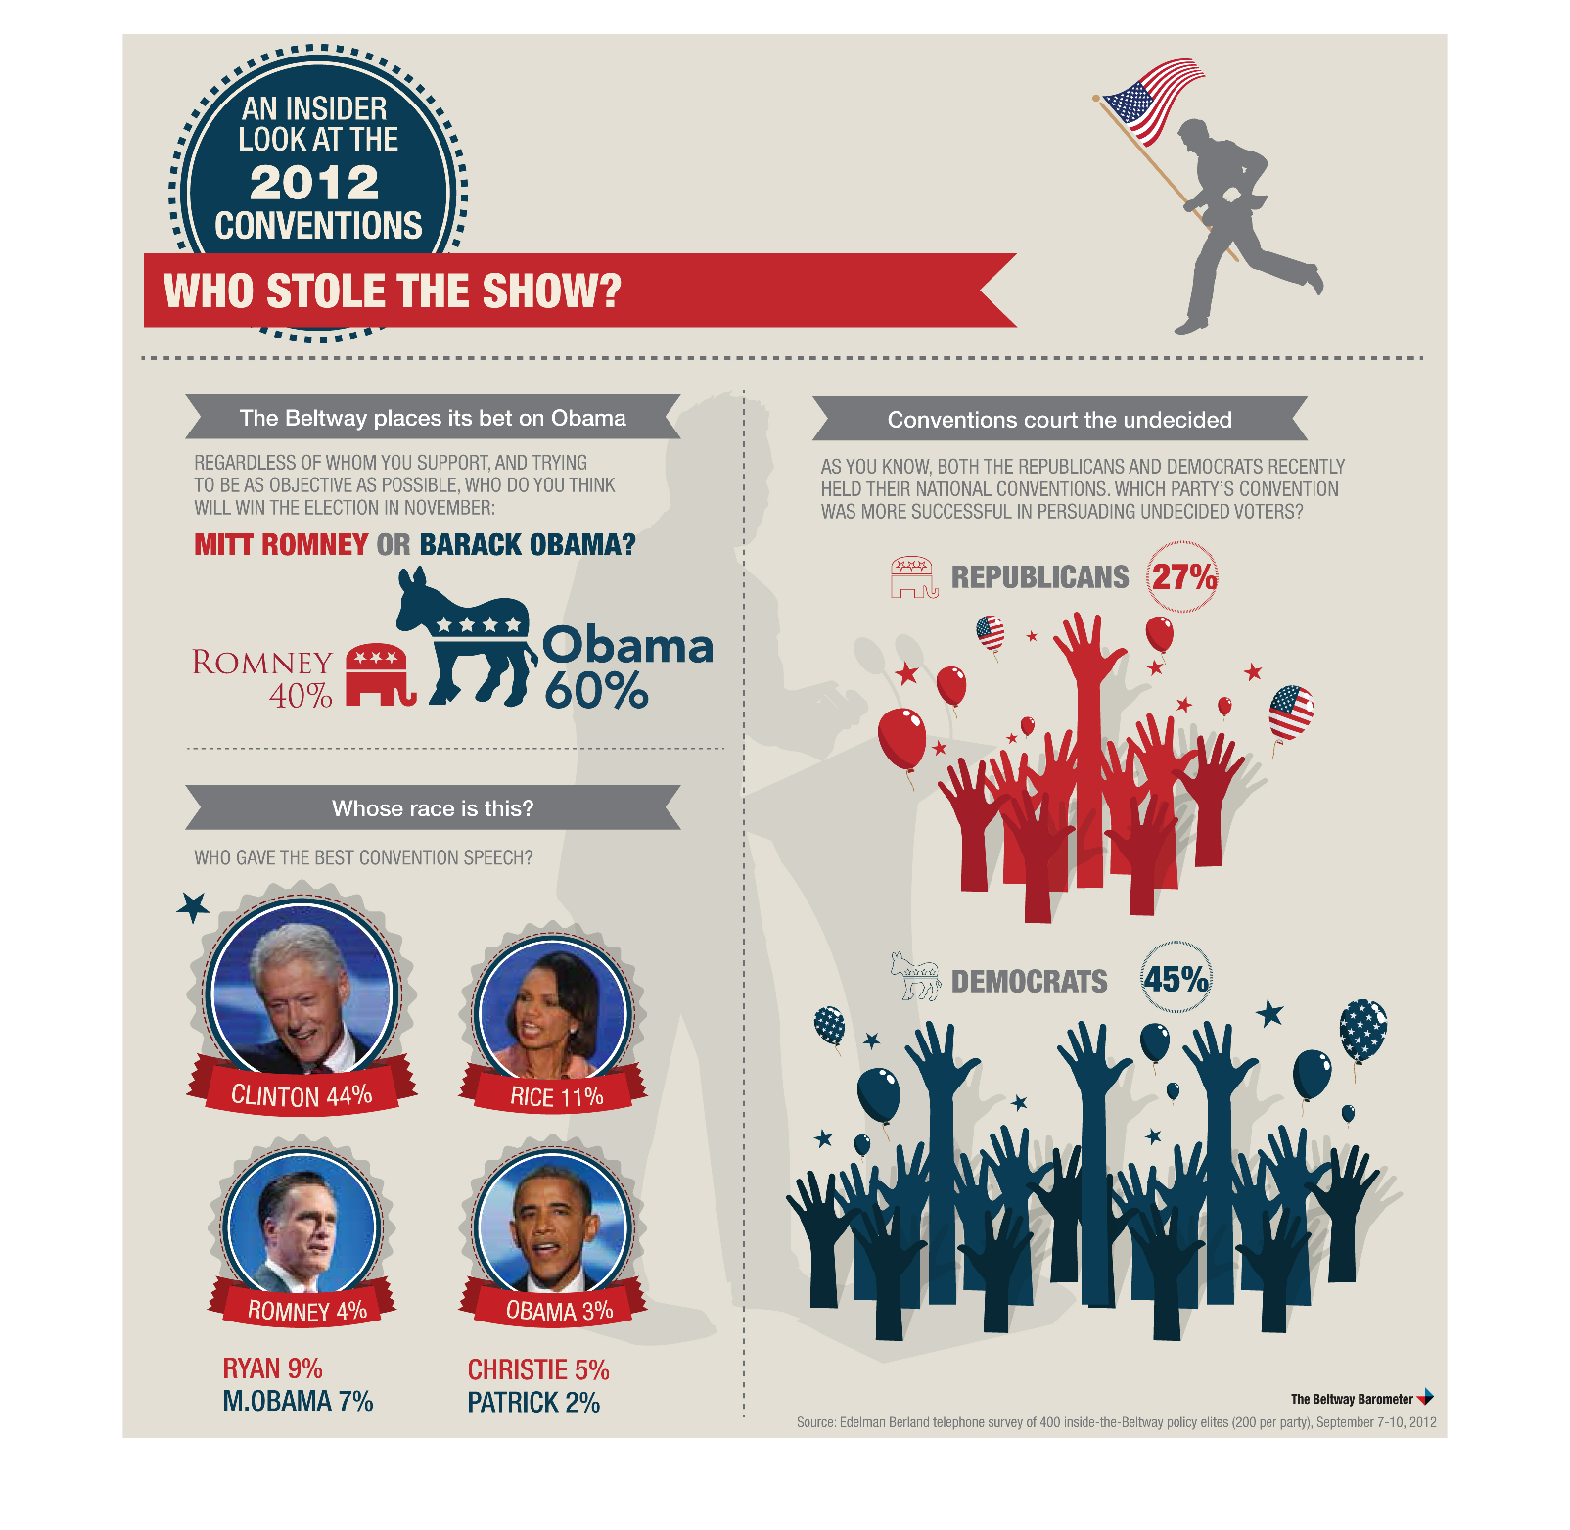
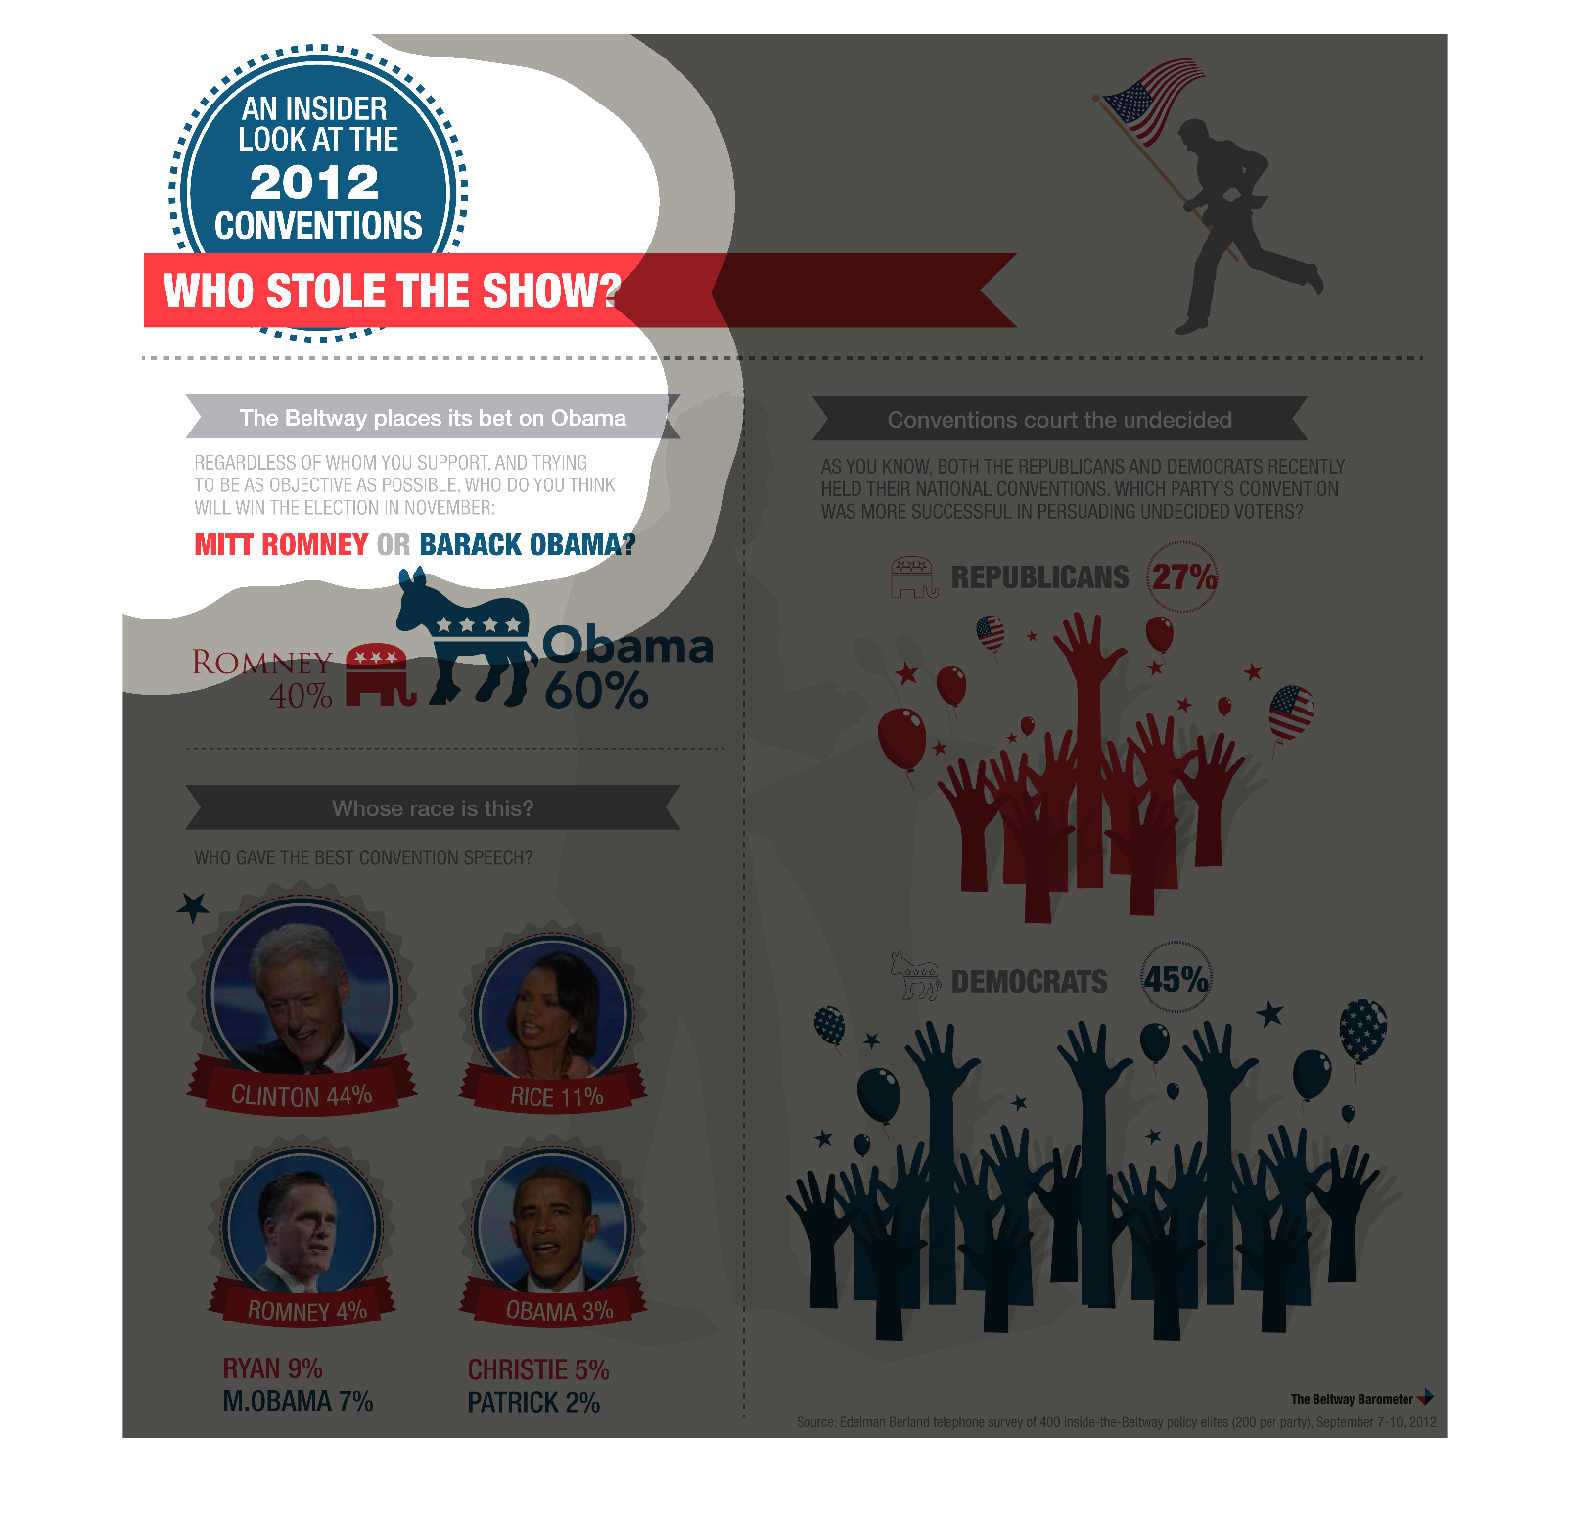
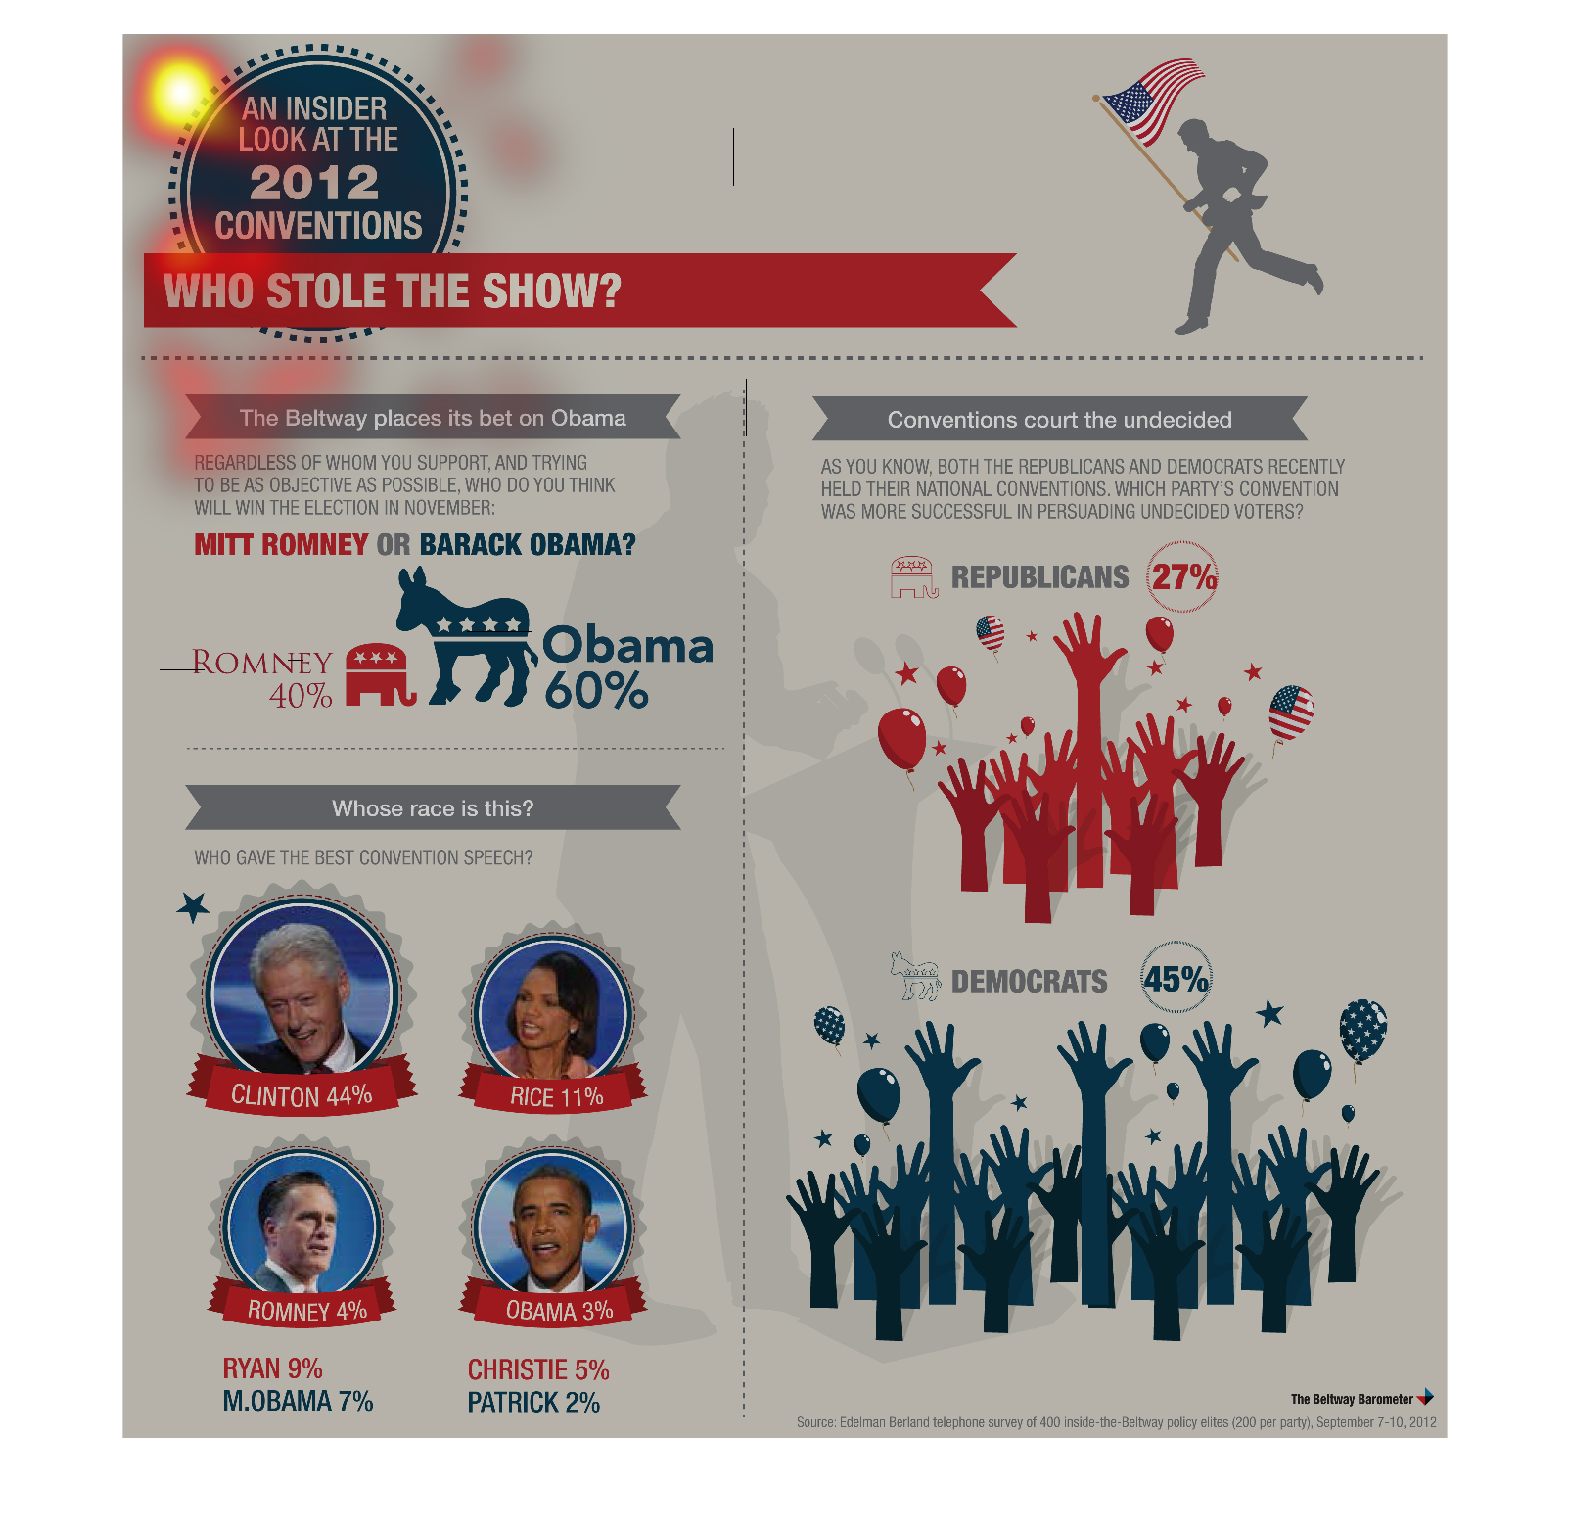
The image depicts the comparison of the 2012 democratic and republican conventions. The image
shows the likely nominee of both parties, with percentages favoring Obama and Romney. Random
fun facts such as who gave the best convention speech are included, among other things specific
to the individual conventions and basic kneed-to-know facts regarding both conventions.
Warning: Image is too big to fit on screen; displaying at 50%
Warning: Image is too big to fit on screen; displaying at 50%
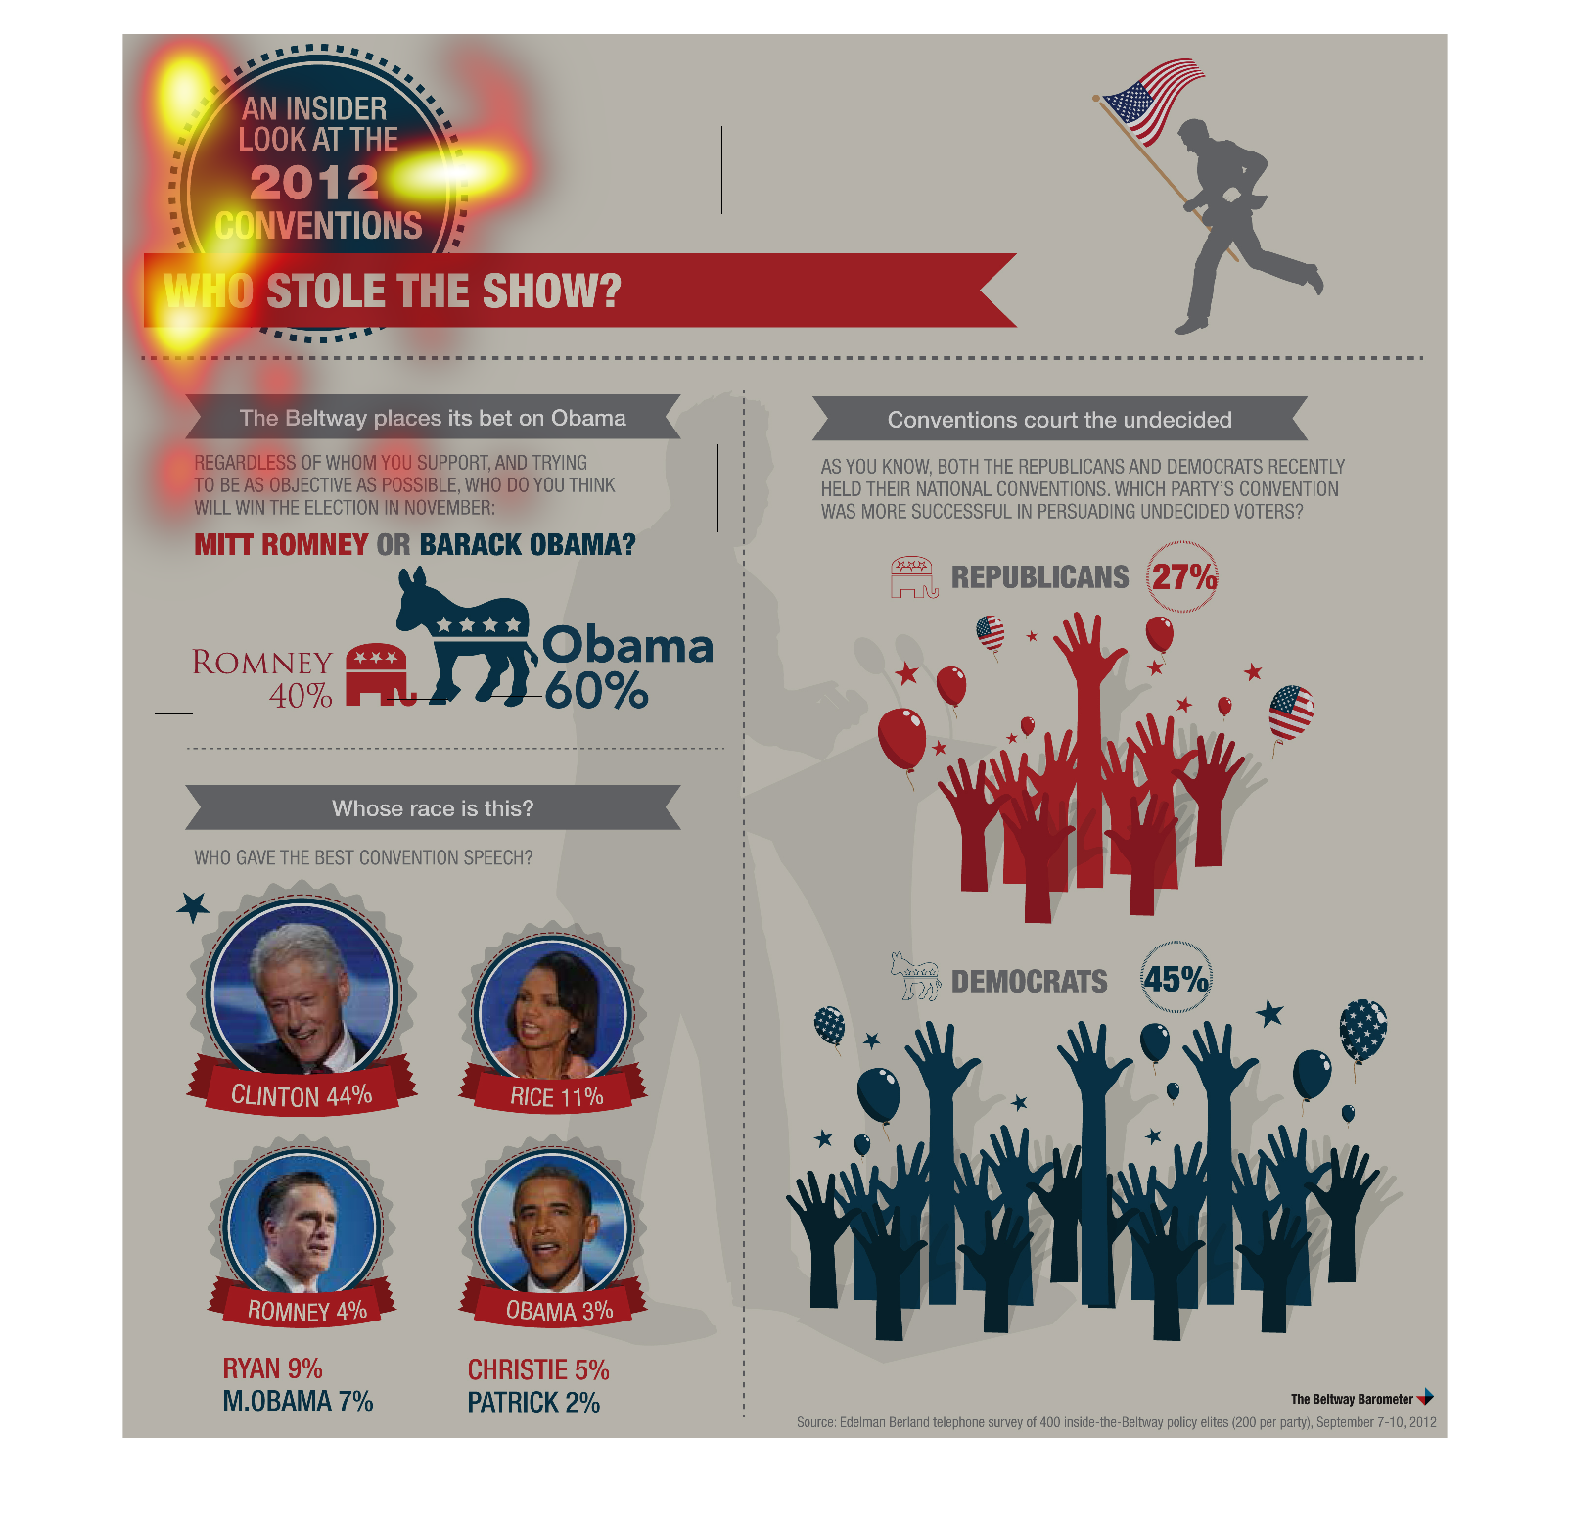
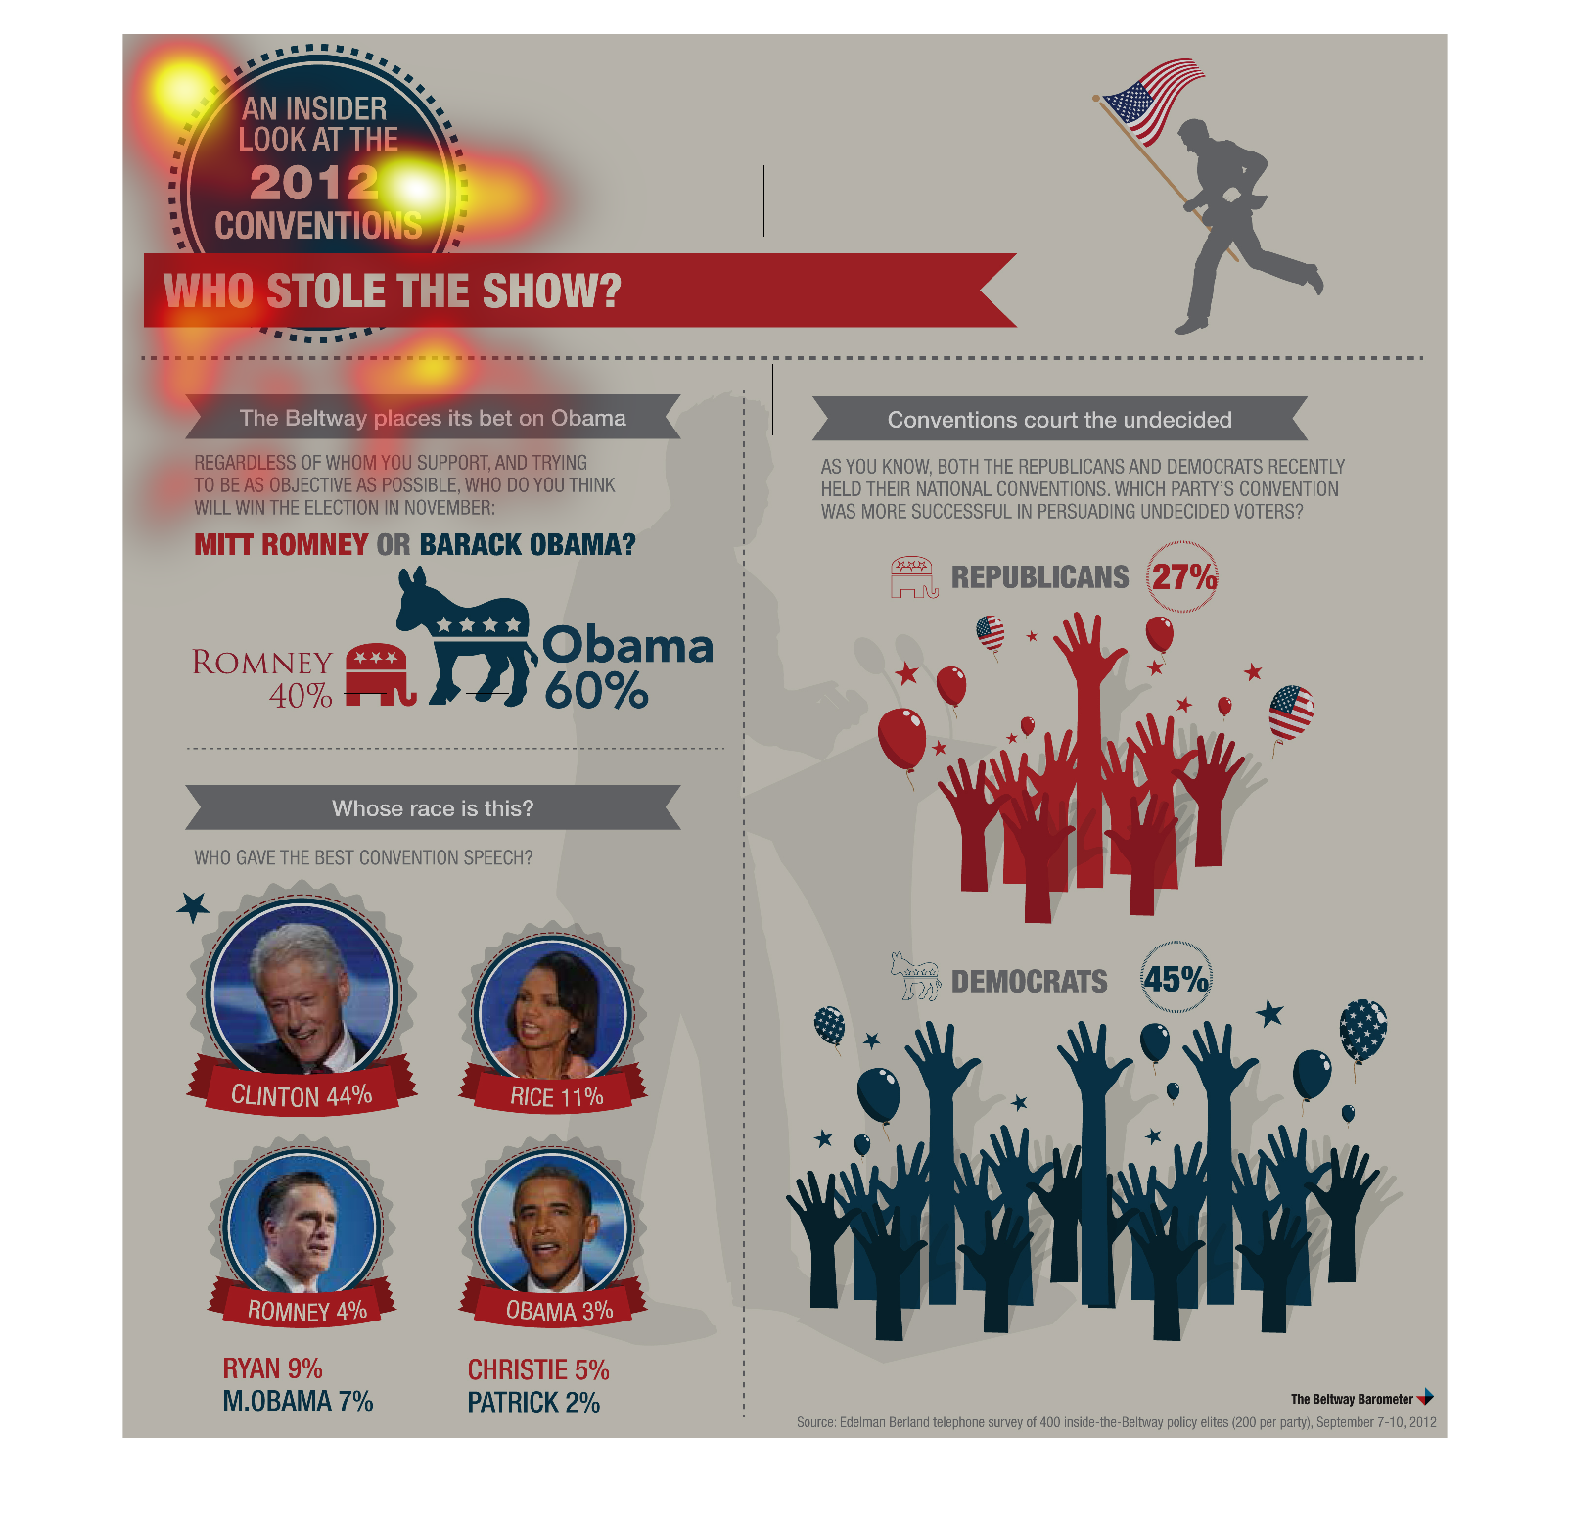
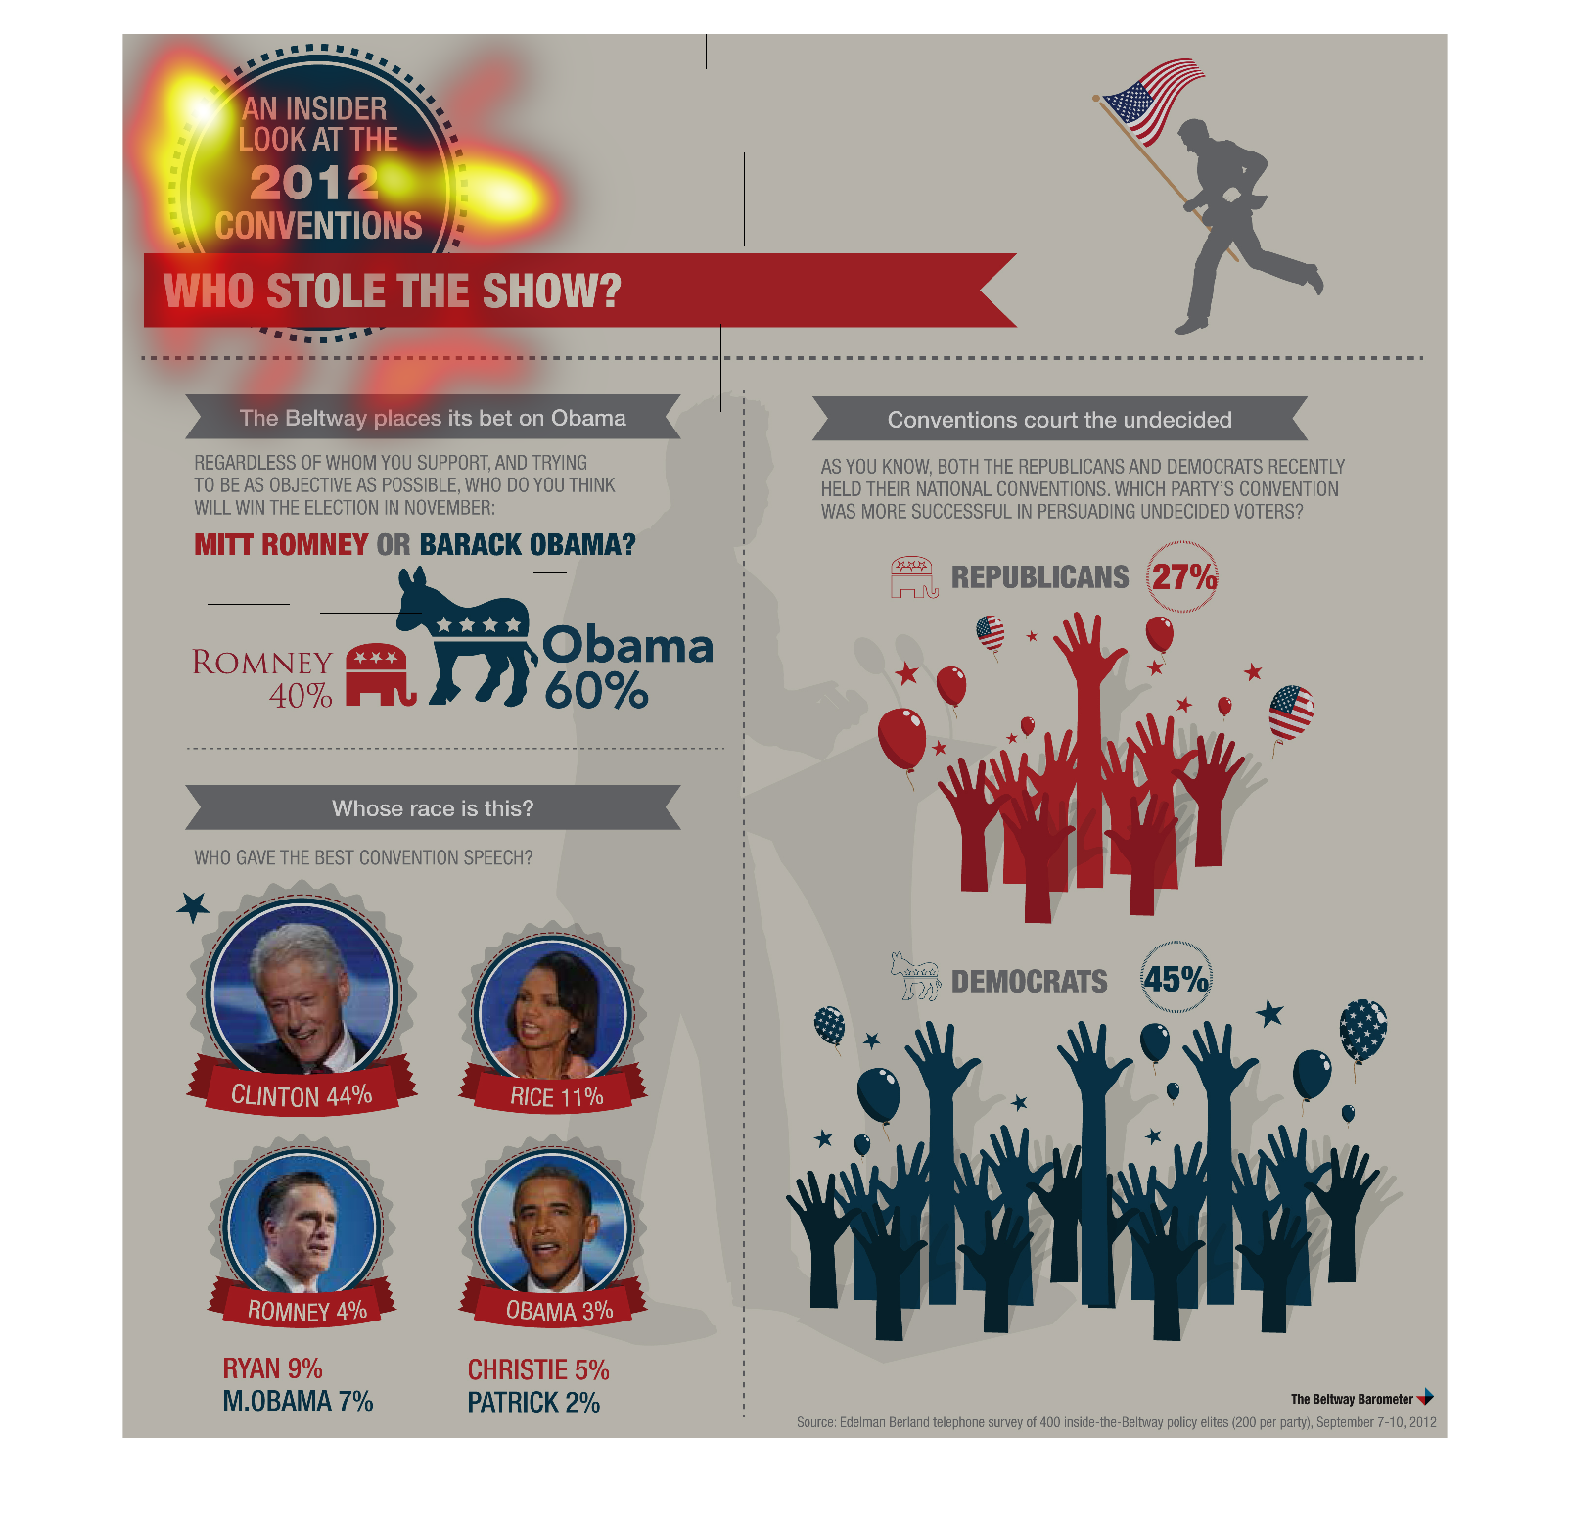
This chart is comparing the data for the 2012 presidential election, who was running, and
which candidate was most likely to win. It also shows the data for the which party persuaded
undecided voters. According to the chart Barack Obama was most likely to win above Mitt Romney
in the 2012 election. Also the Democratic party had persuaded 45% of undecided voters while
the Republicans had only persuaded 27 %.
Warning: Image is too big to fit on screen; displaying at 50%
Warning: Image is too big to fit on screen; displaying at 50%
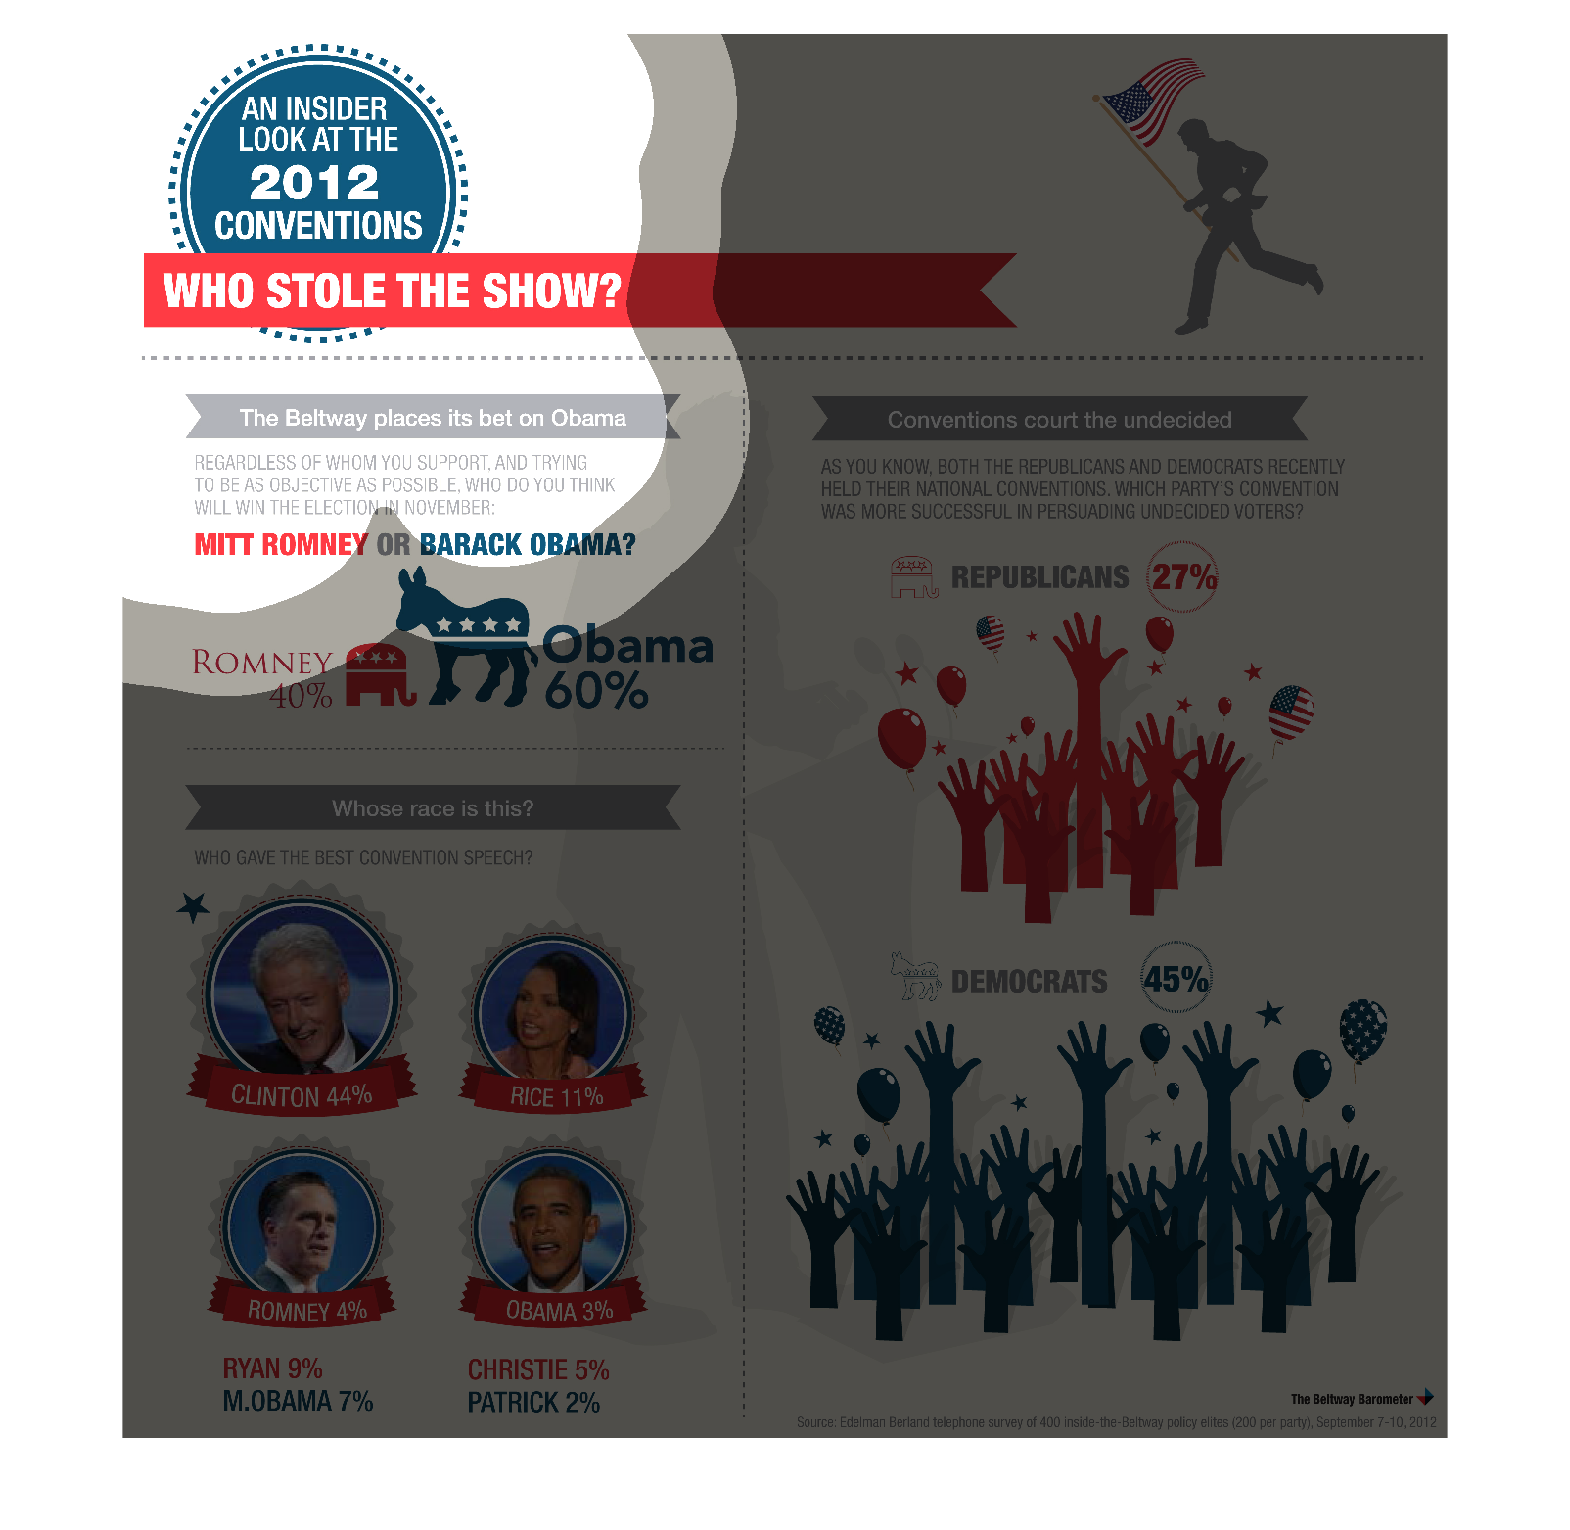
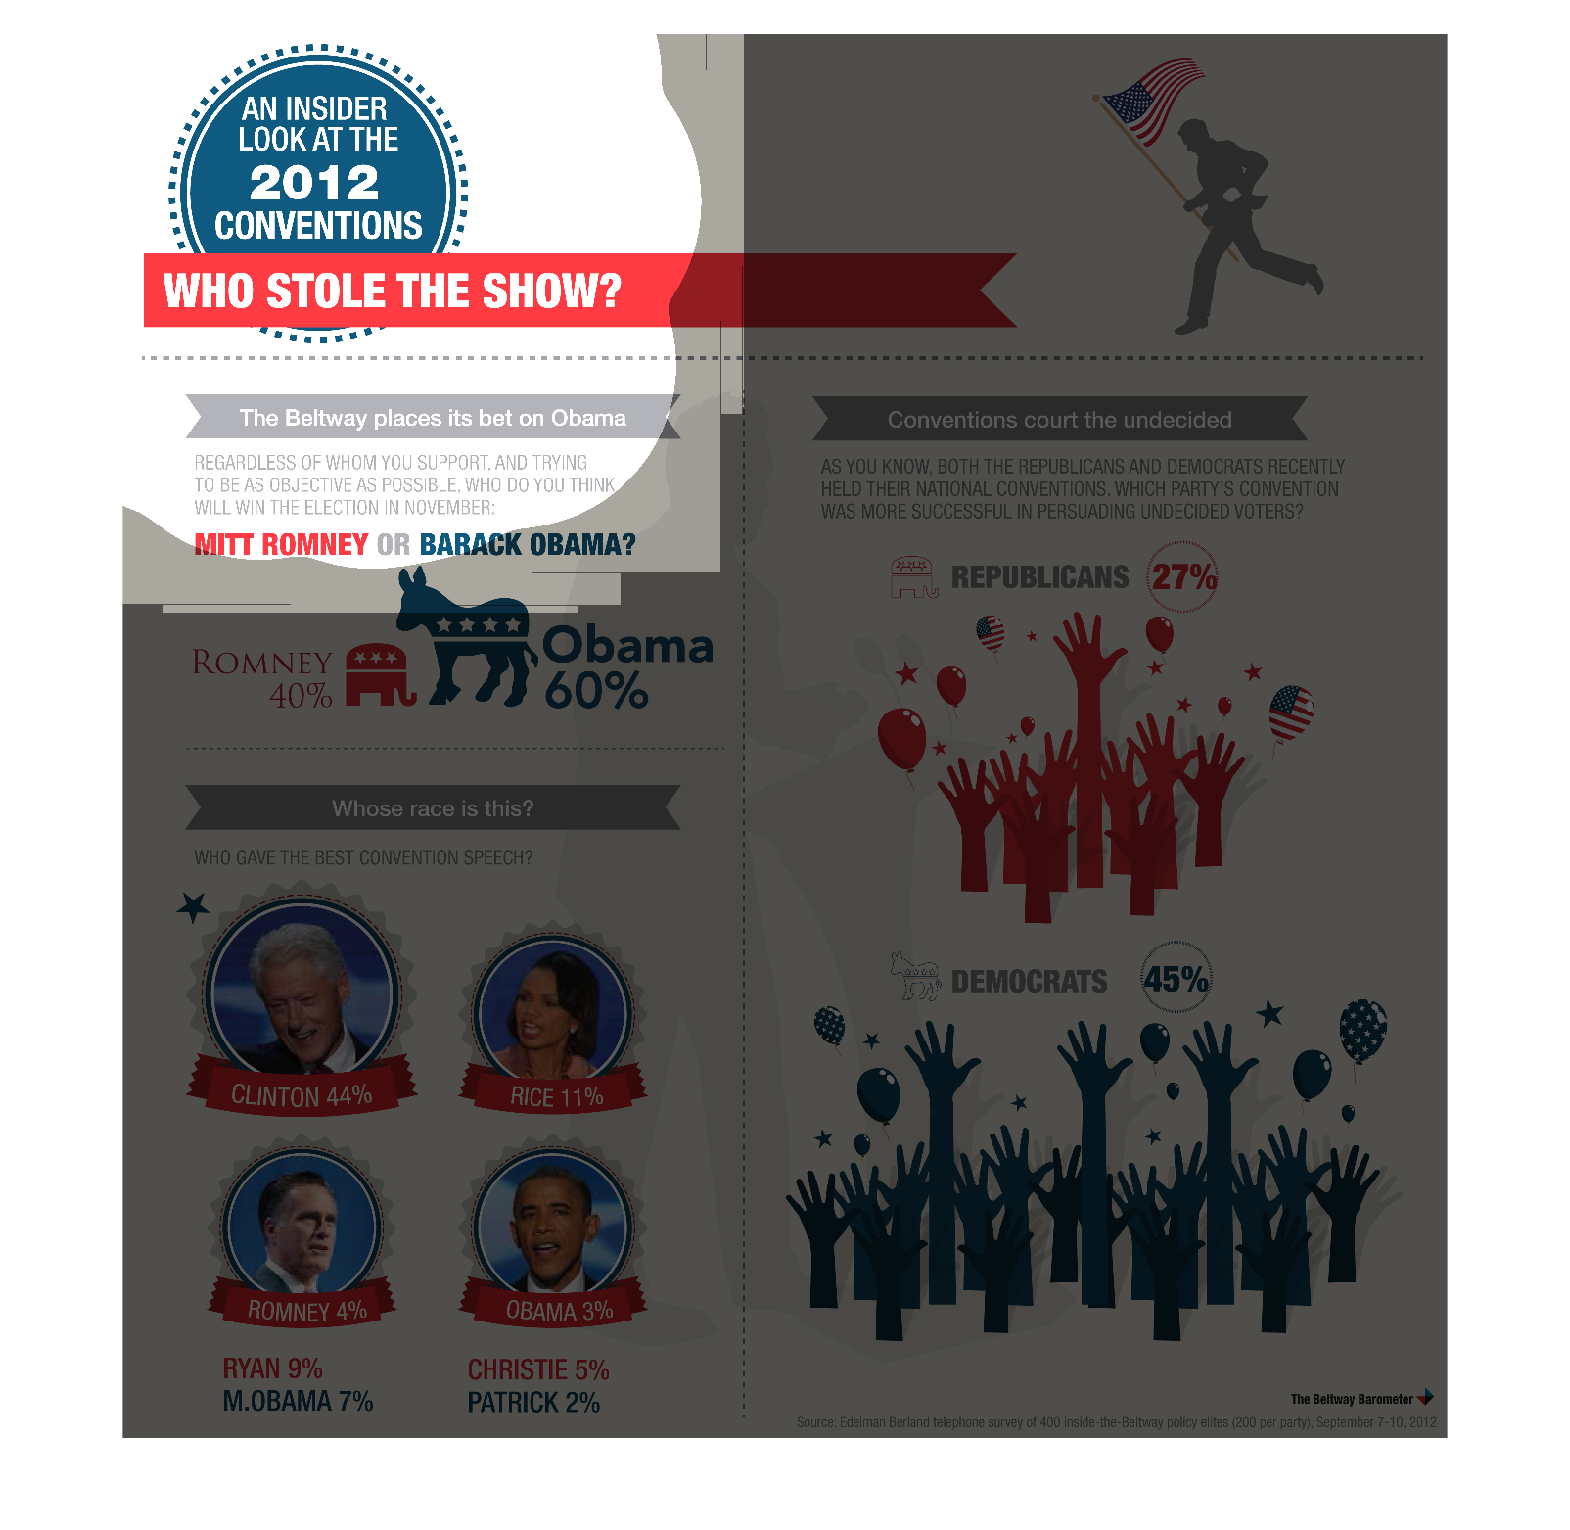
The chart describes a look at the 2012 Presidential election.  60% thought Obama would win;
40% thought Romney would win.  The bottom right showed that the Democrats were more successful
at persuading undecided voters than Republicans.The bottom left indicated that Bill Clinton
gave the best convention speech, followed by C. Rice, Romney, then  Obama.
Warning: Image is too big to fit on screen; displaying at 50%
Warning: Image is too big to fit on screen; displaying at 50%