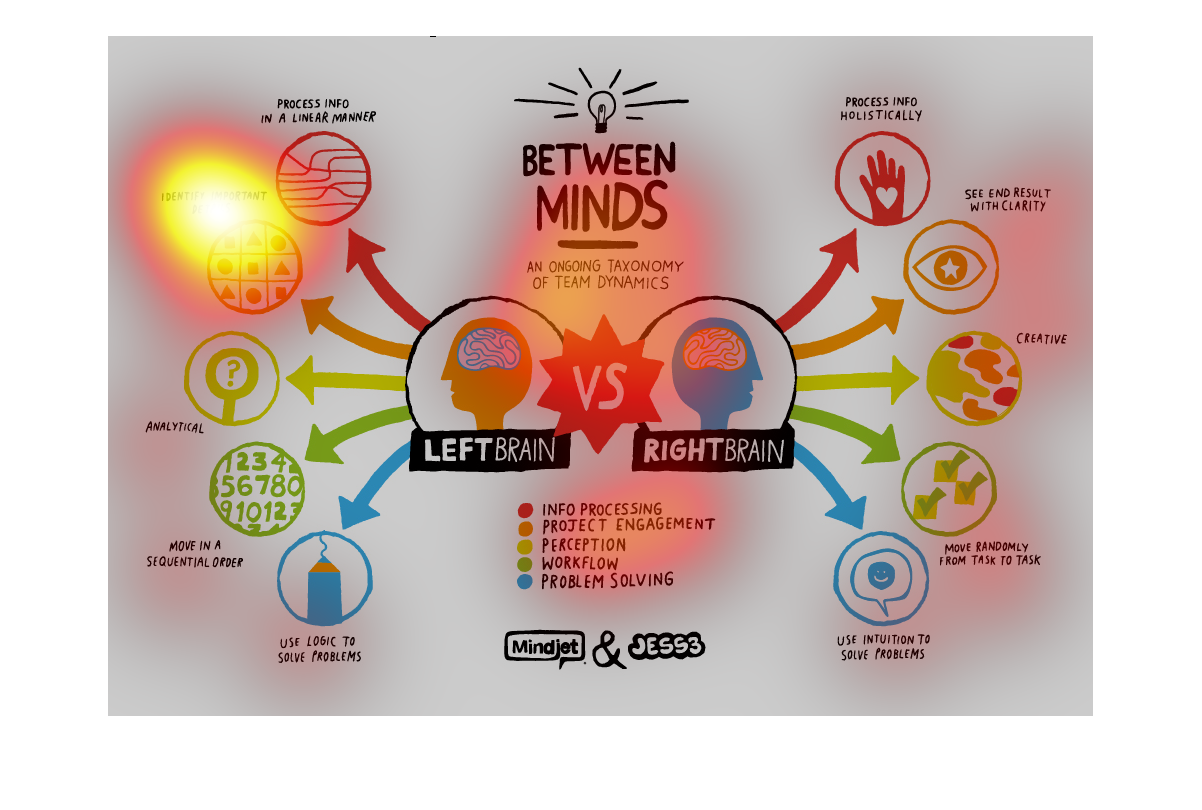
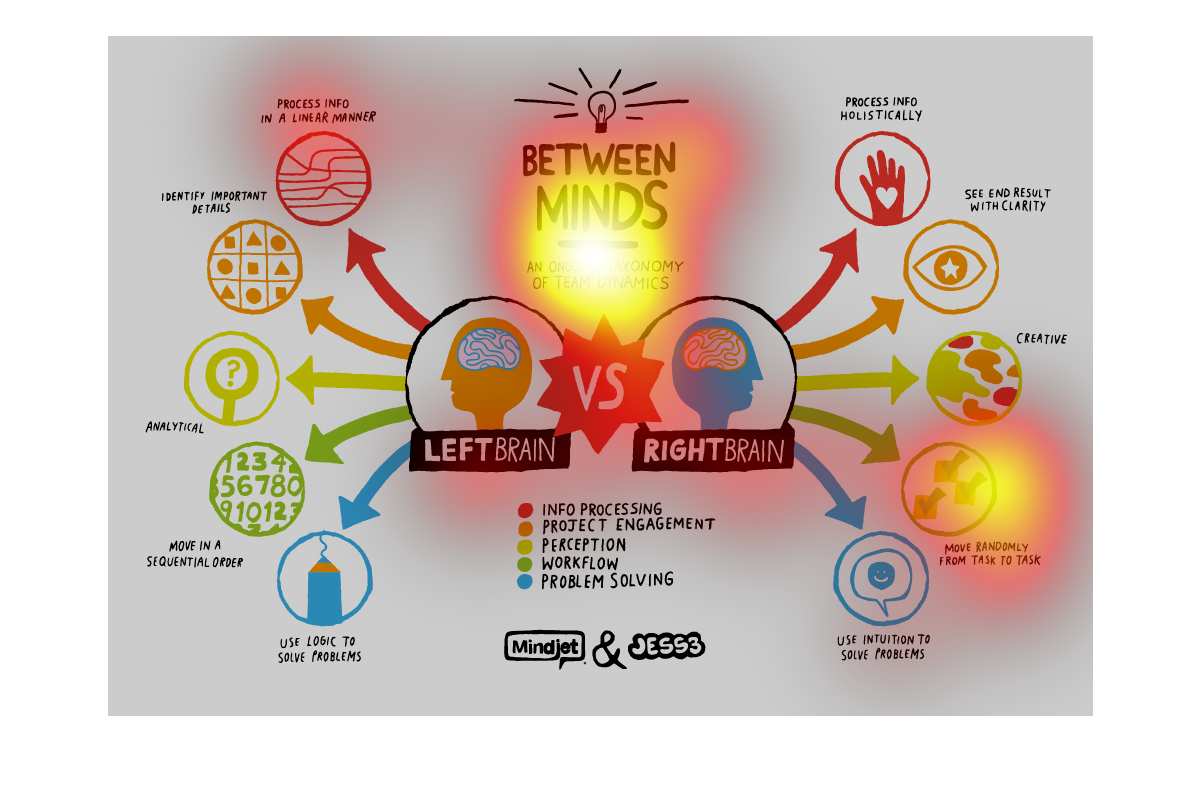
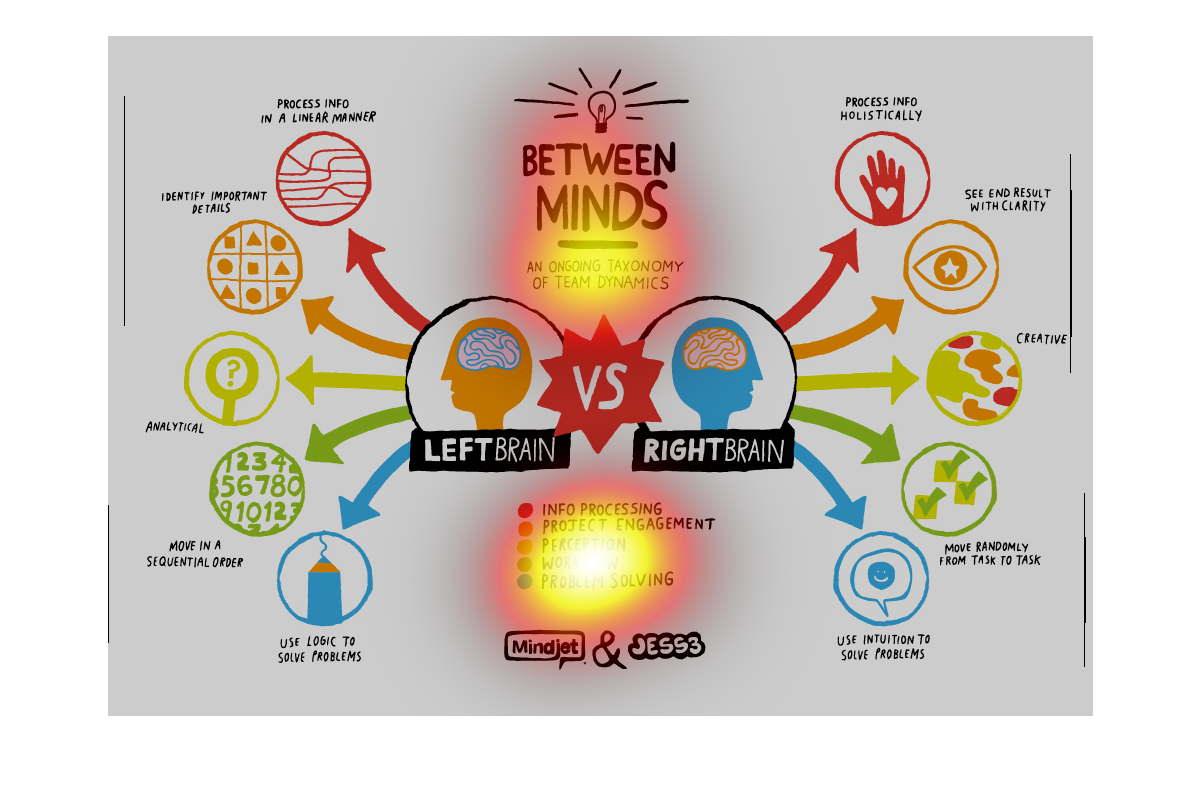
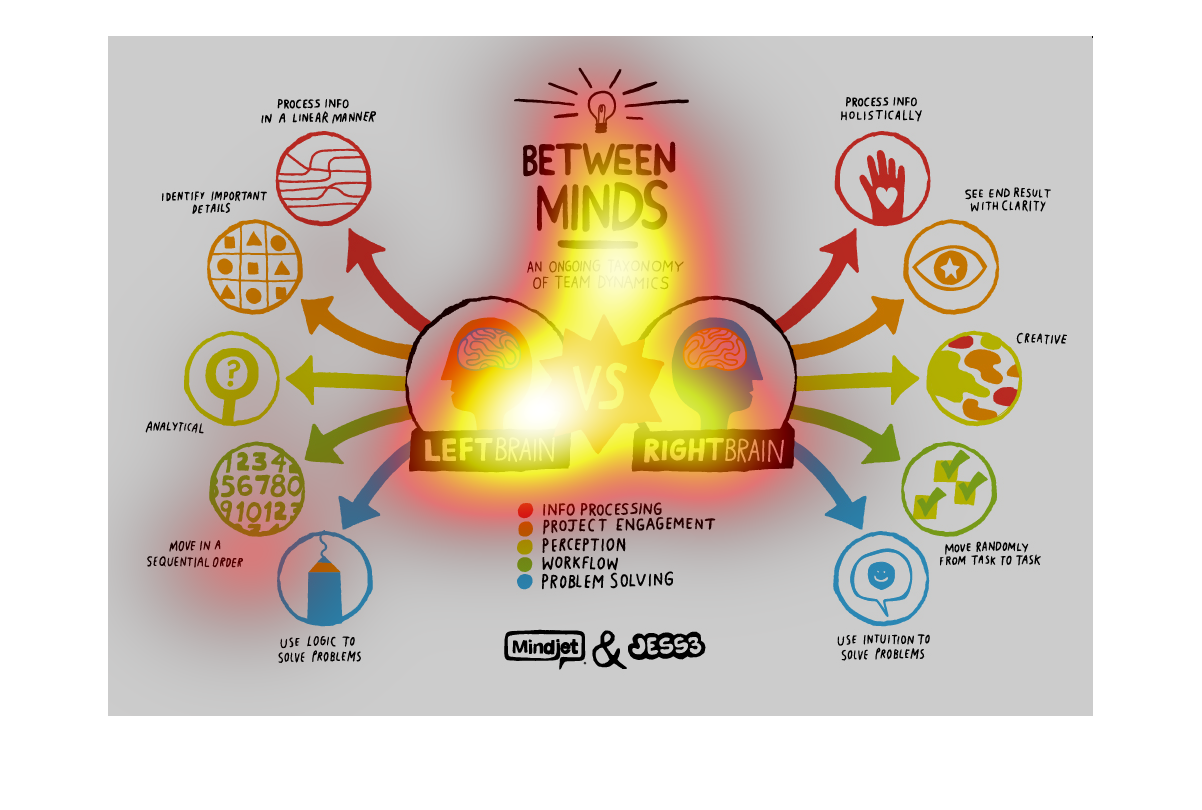
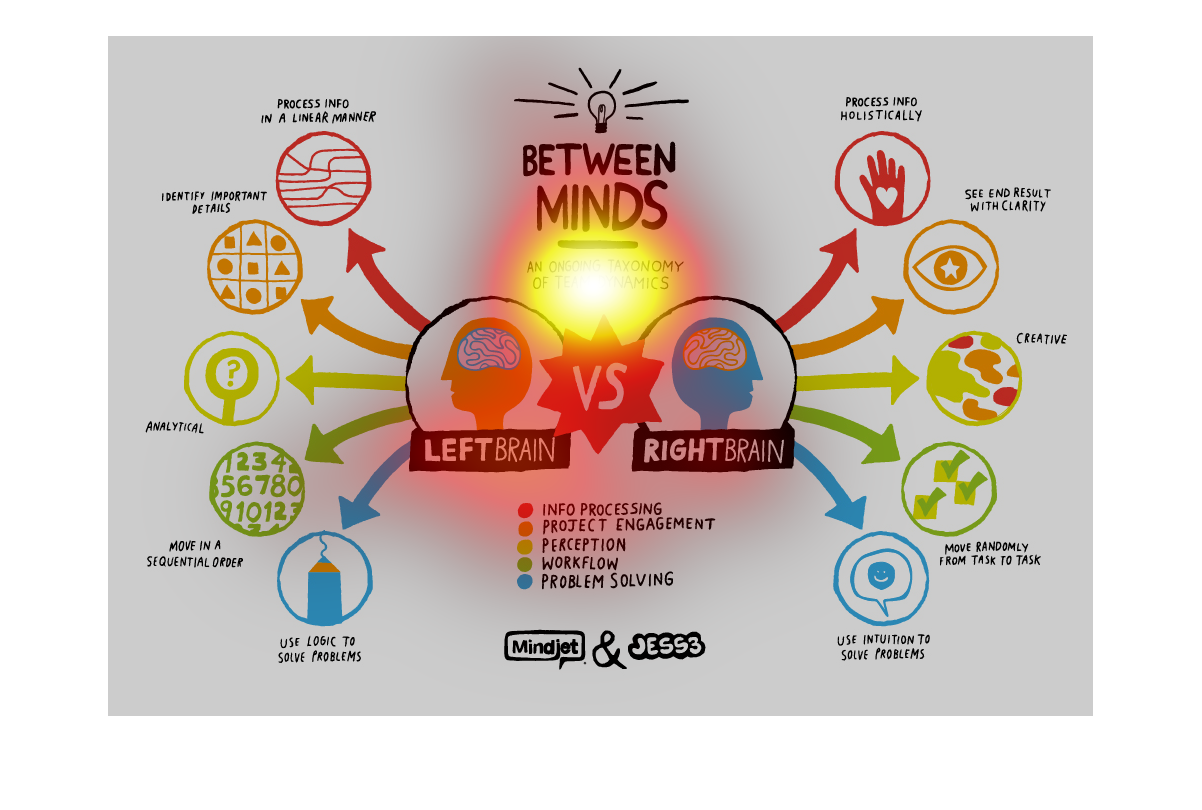
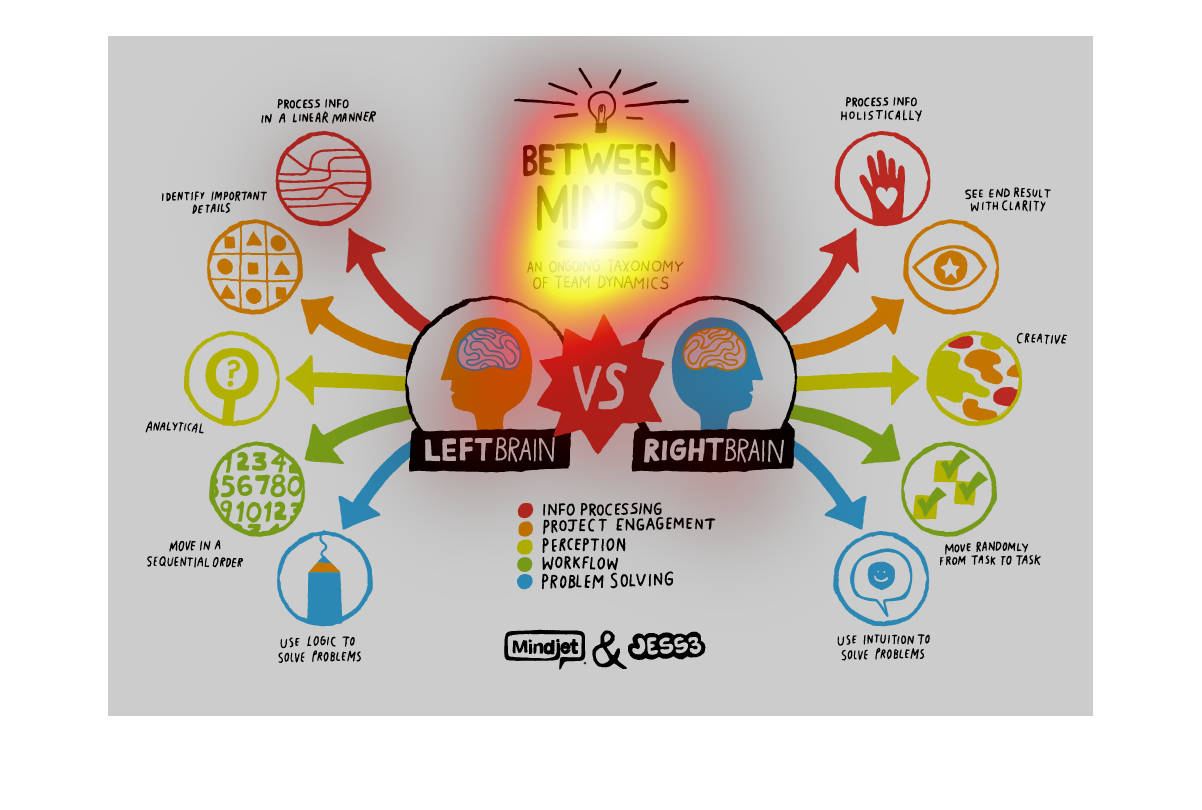
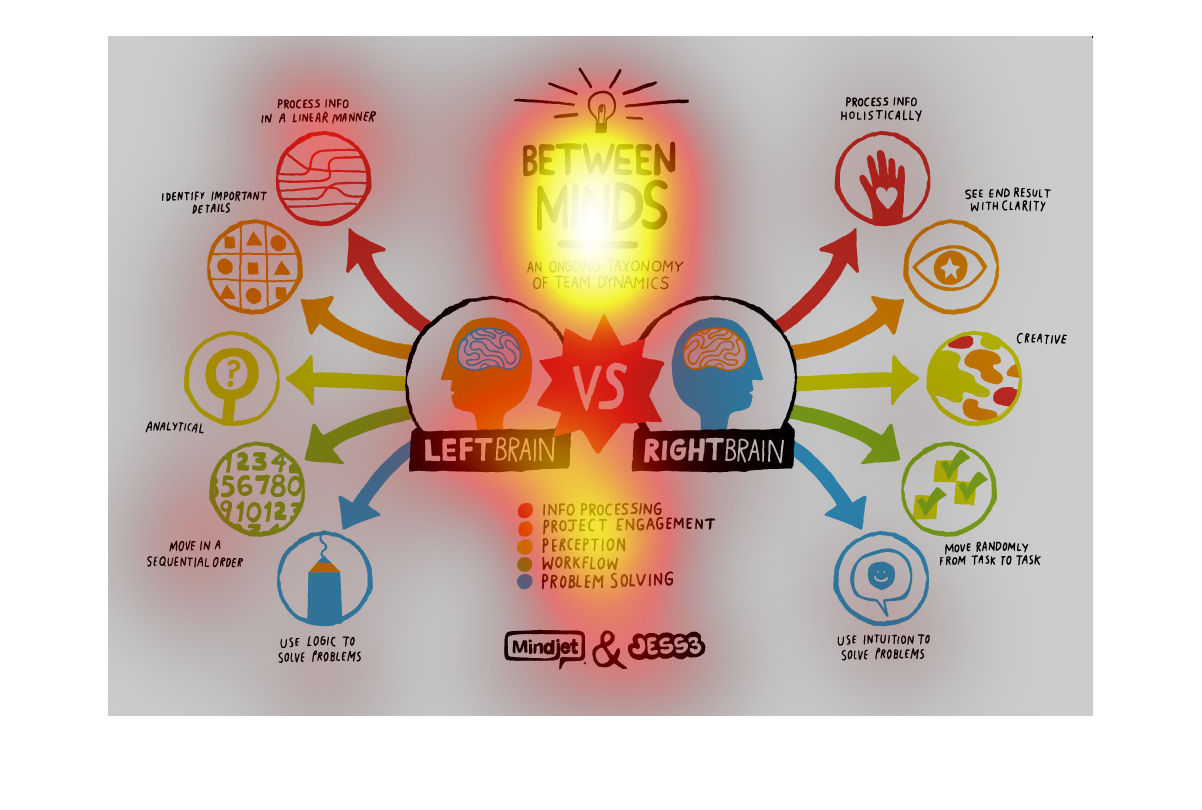
An image comparing left brain and right brain processes, as it relates to workplace productivity
and overall workplace team dynamics. Processes of both left and right brain being compared
in the image include: Info process, project engagement, perception, workflow, and problem
solving.

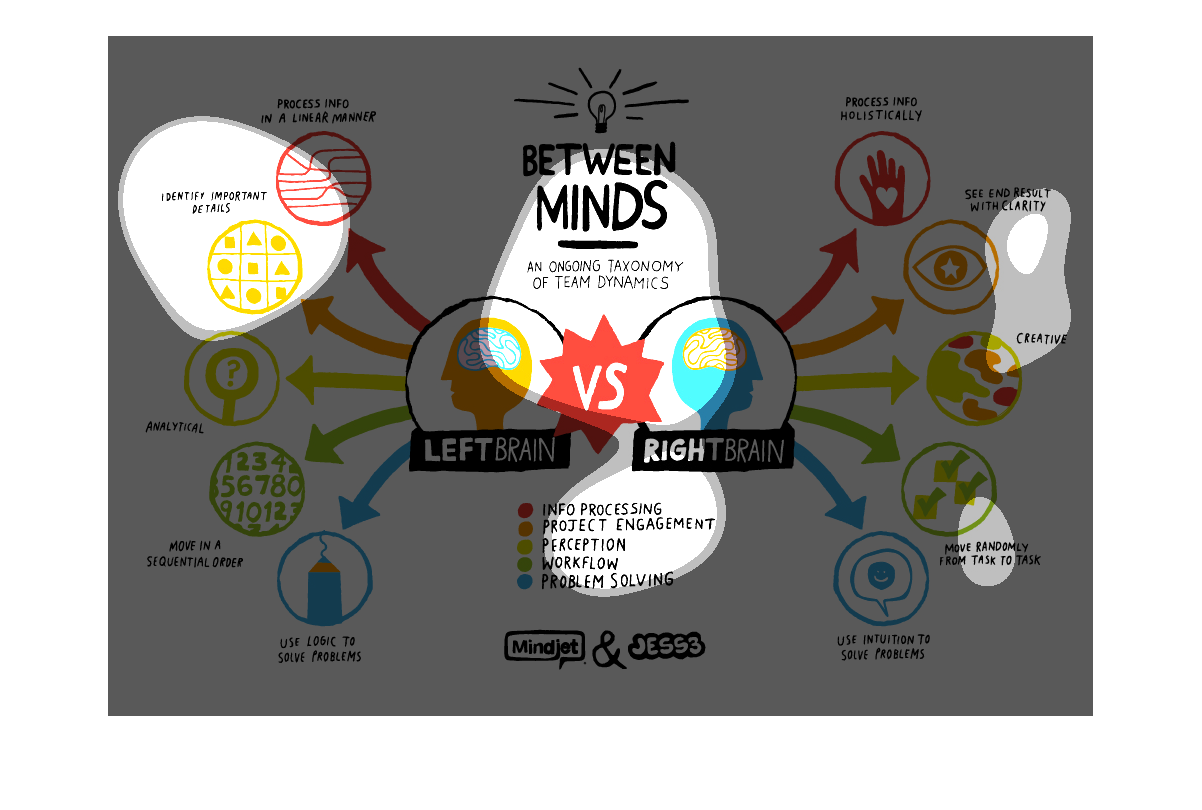
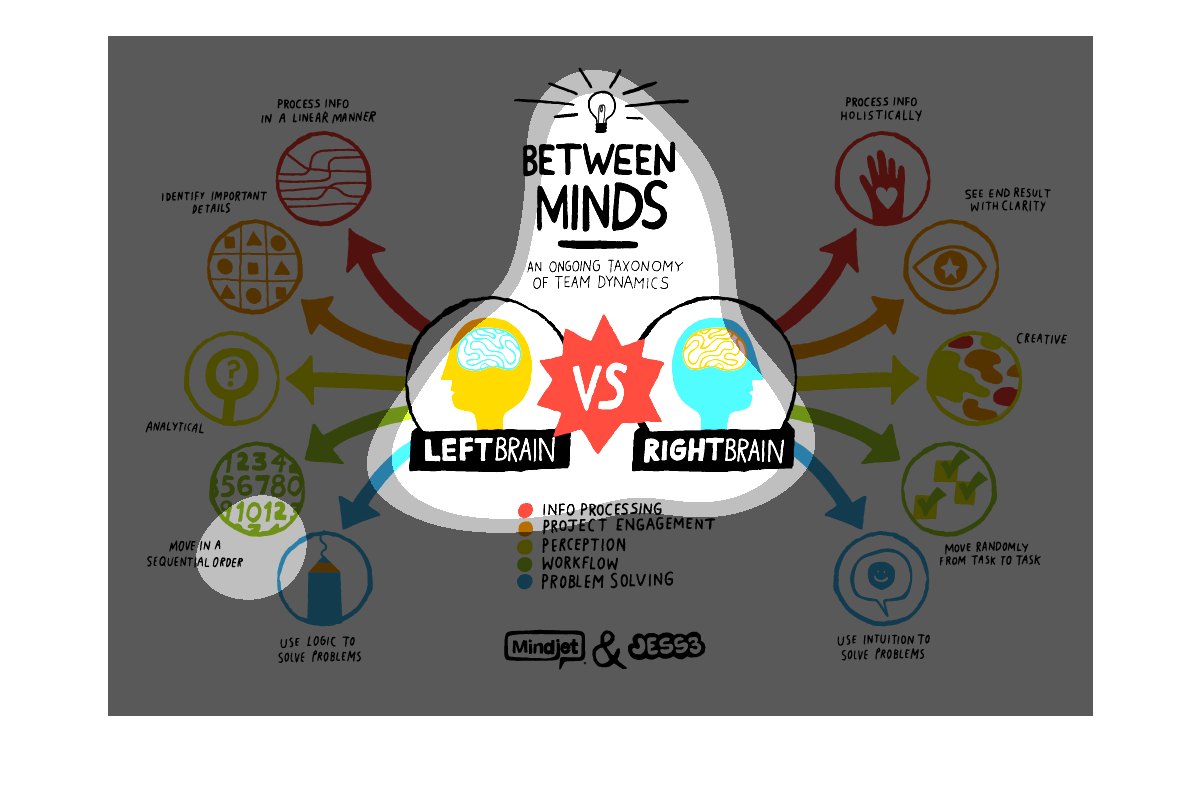
This graph describes the differences in working styles of right brain people versus left brain
people. It gives specific examples of the styles of both types of workers.
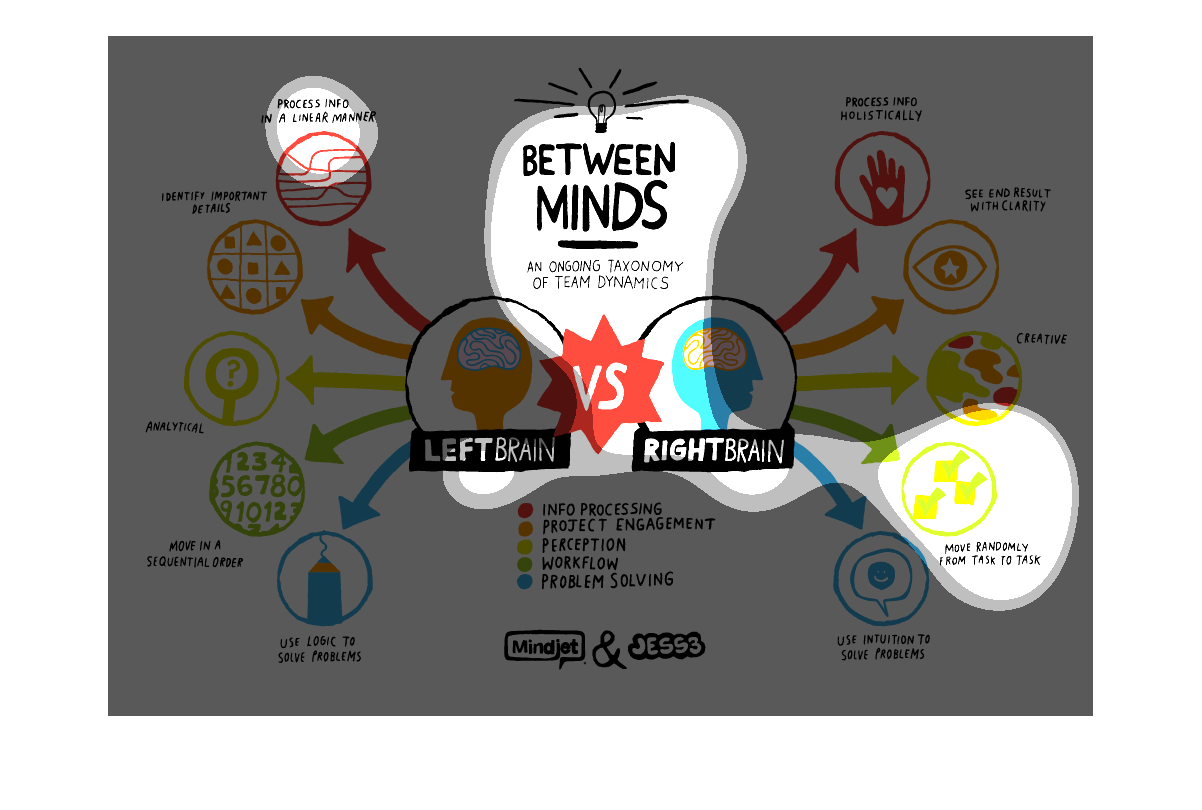
The image is a representation of the taxonomy of team dynamics. It splits the groups into
a left brain vs right brain then takes each of five skillsets a team member may have and gives
a descriptor normally associated with left or right brained thought processes.
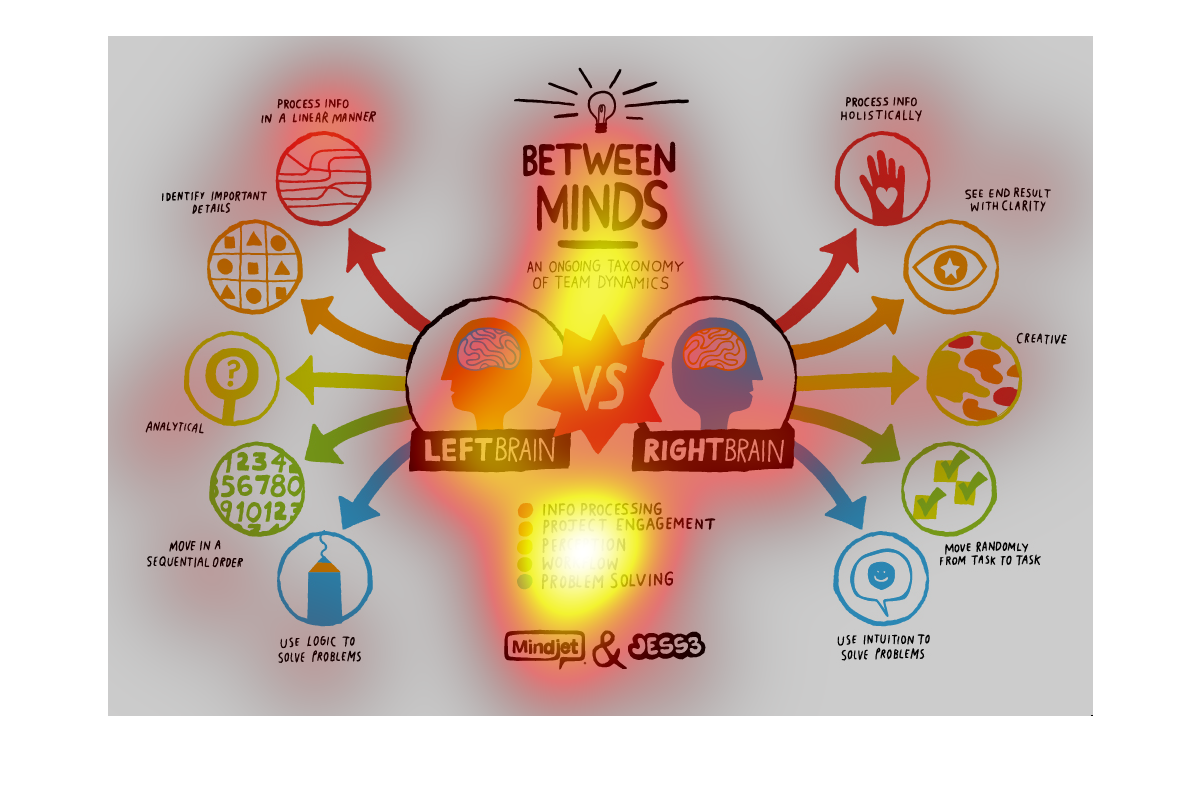
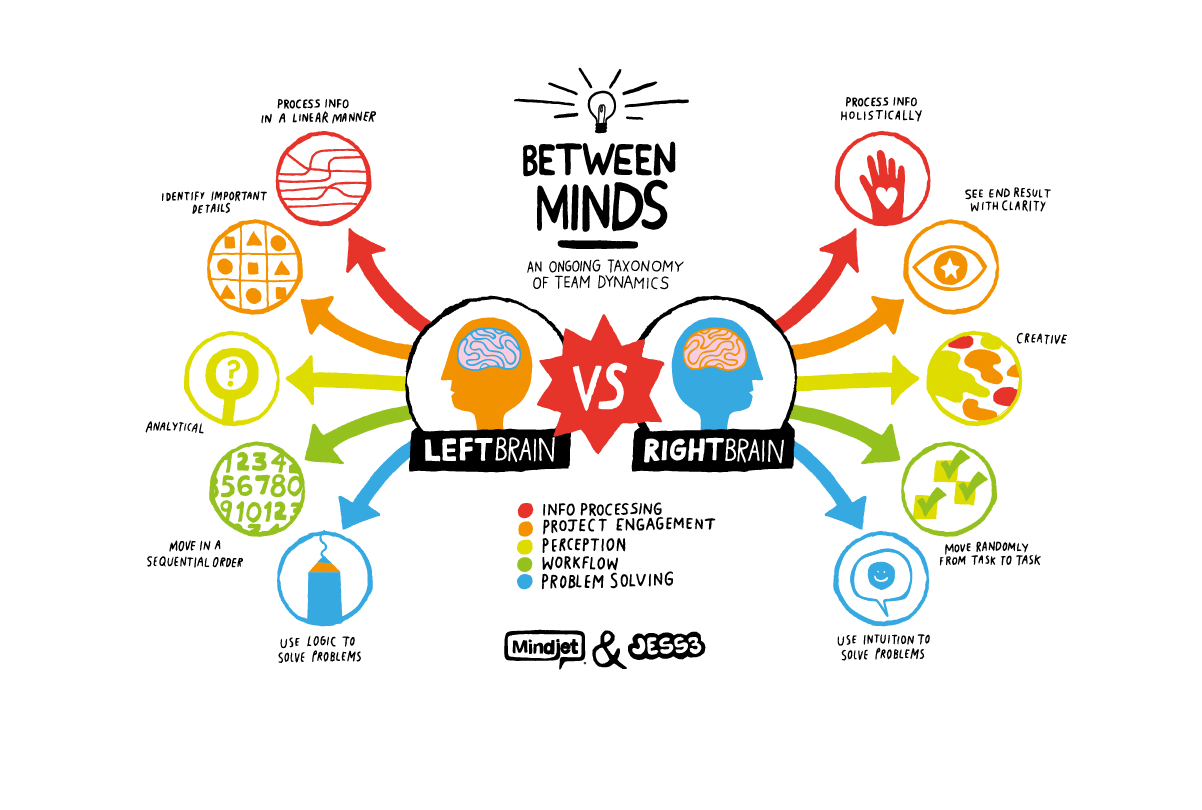
This is a graphical flow chart depicting the taxonomy of team dynamics. It's metrics include
info processed, project engagement, perception, workflow and problem solving.
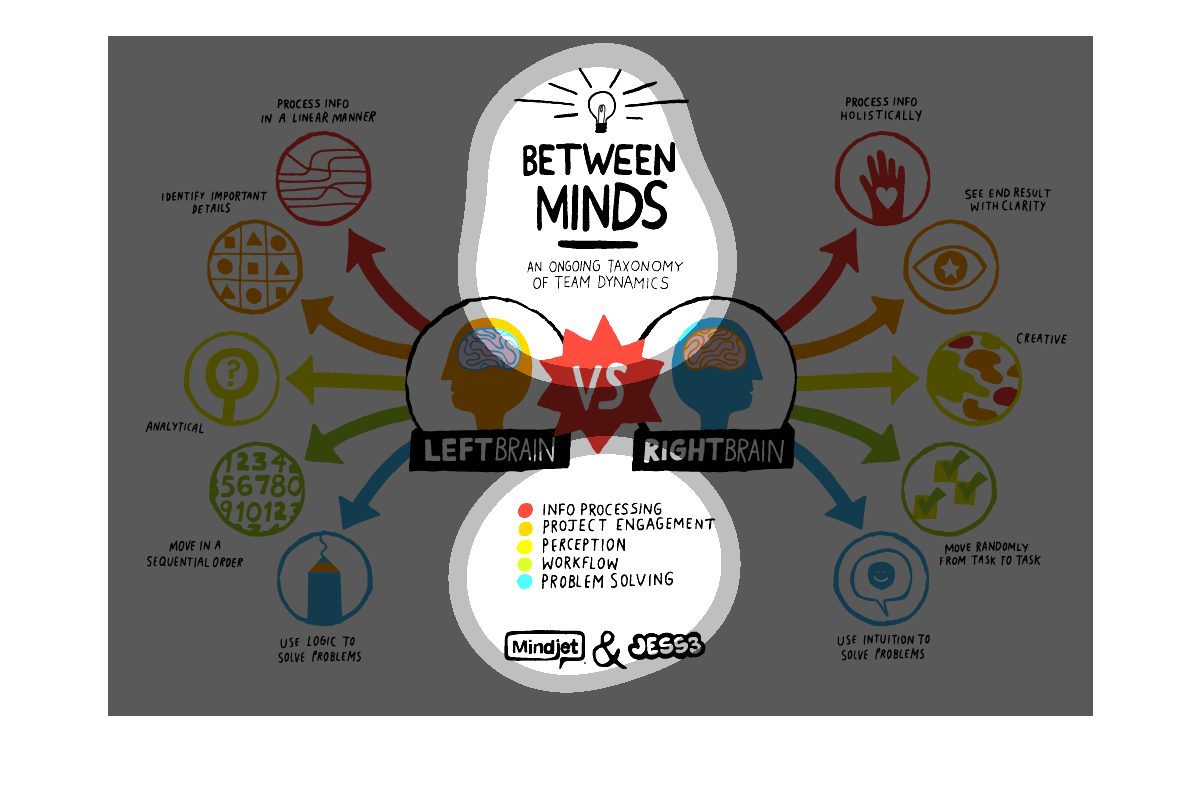
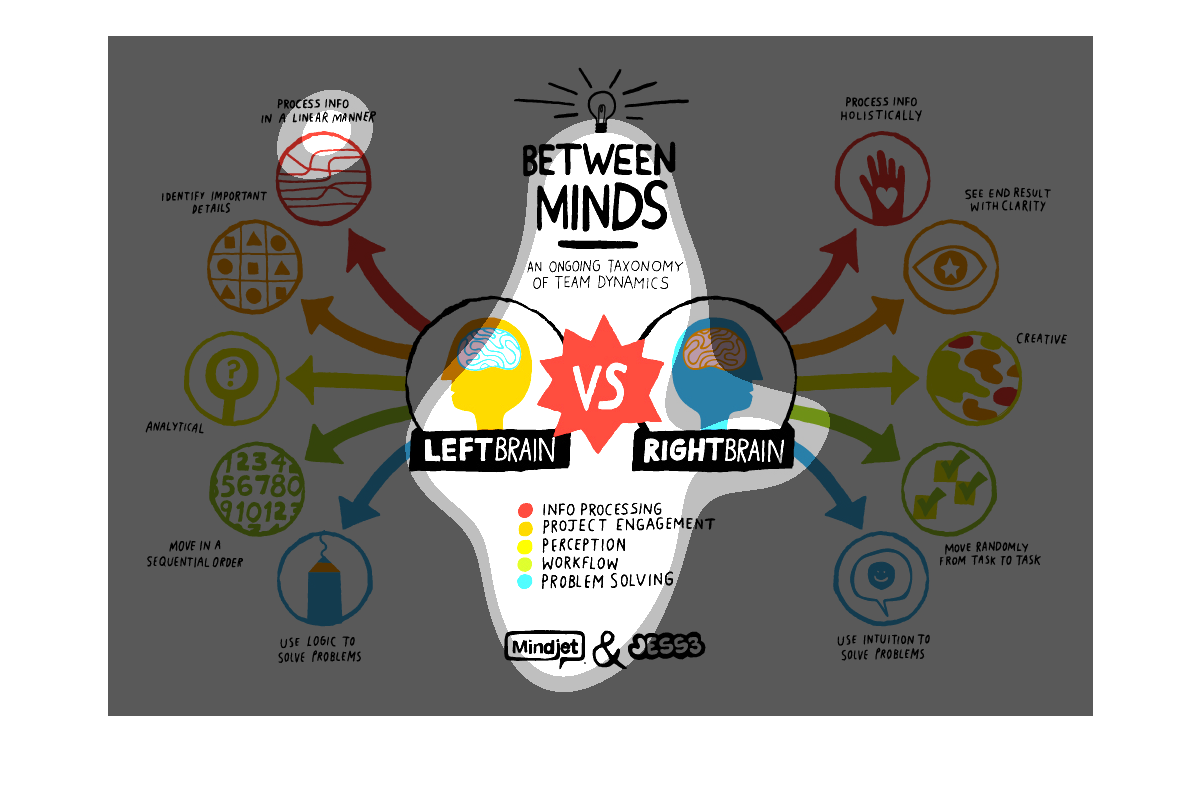
It shows a flow chart of the left brain vs the right brain.  Each brain is then connected
to different things that that particular side of the brain focuses on like the Creative side
is on the right and the Analytical side on the left.
The caption for this graph or image is, "Between the minds, an ongoing taxonomy of team dynamics".
 There are two icons of head profiles beneath this.  Each one with a caption, one reads, "Left
brain", another, " Right brain", and the letters, "VS" in between them.  Examples of left
brained and right brained activity is shown on their respective sides.
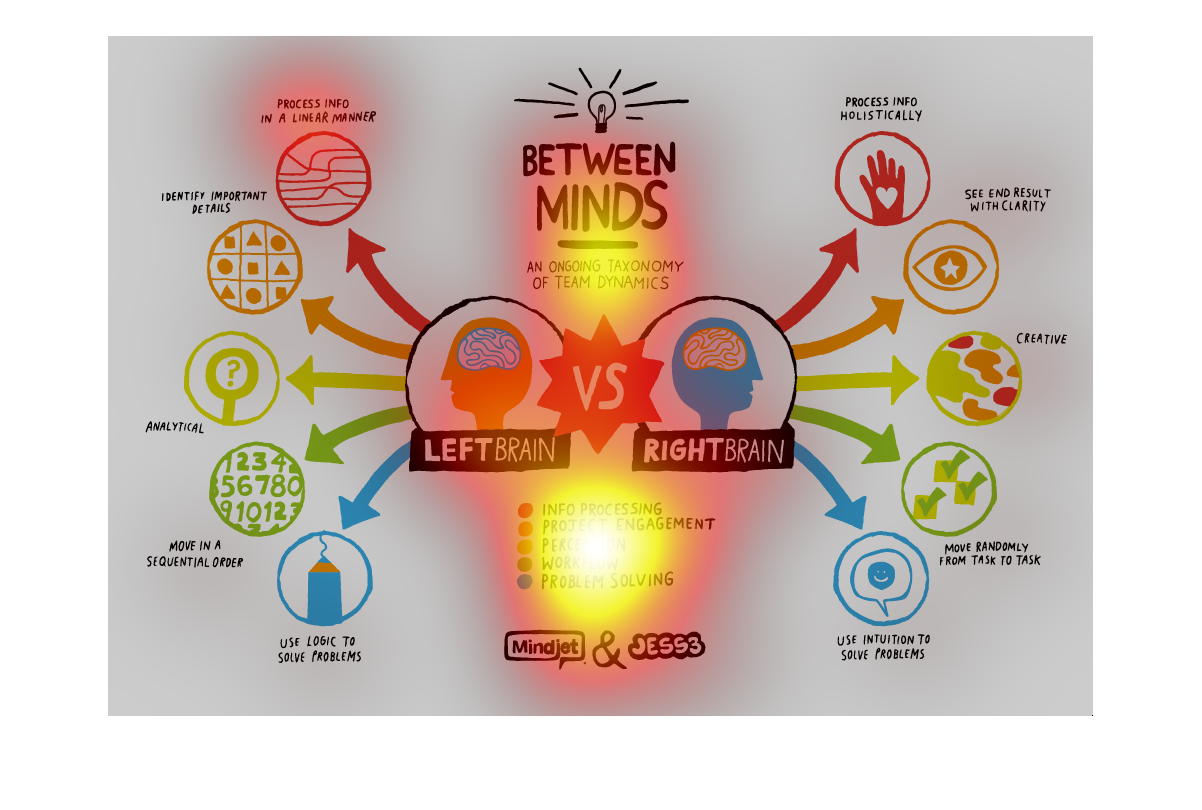
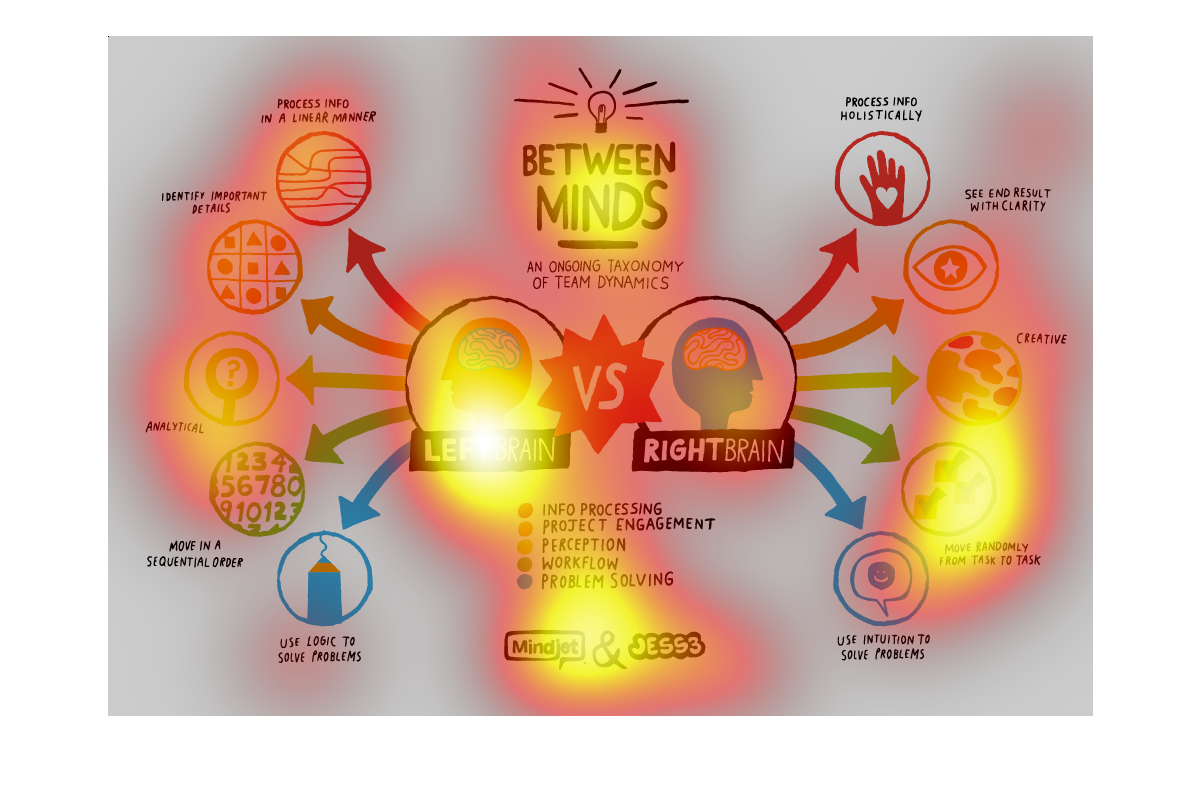
This illustration shows the rudimentary operations of the left and right halves over the brain,
how they interconnect with each other and are in charge of different functions.
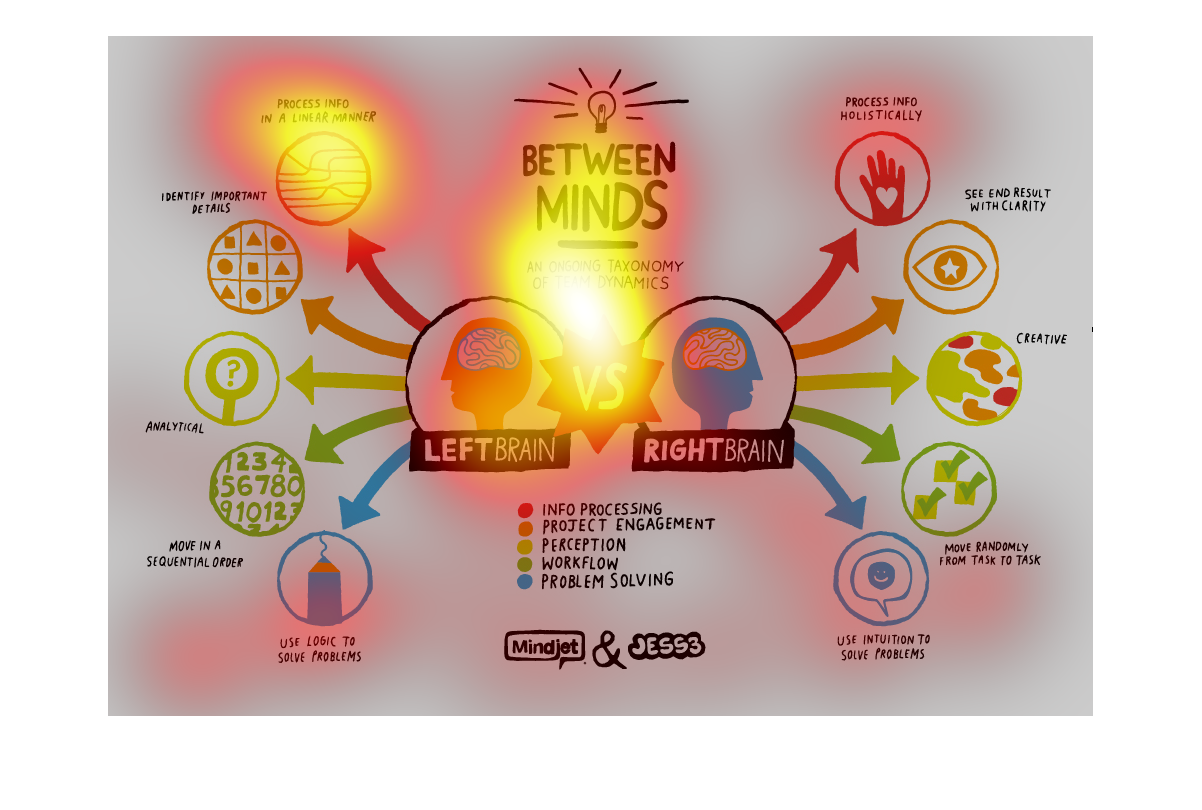
This chart describes between minds, left brain versus right brain. Specifically an ongoing
taxonomy of team dynamics. Categories on the chart include info processing.
The following poster depicts the battle of the two hemispheres of the human brain the left
and right side. The left side which is the side for logic and used to solved problems versus
the holistic right side used for creativity.
This fun chart is titled: Between minds, and it displays the ongoing taxonomy of team dynamics.
It shows the differences between the left brain, and the right brain.
between minds, a large colorful infographic with text that is too small to read, i like the
bright colors and branches though, really pretty stuff here.
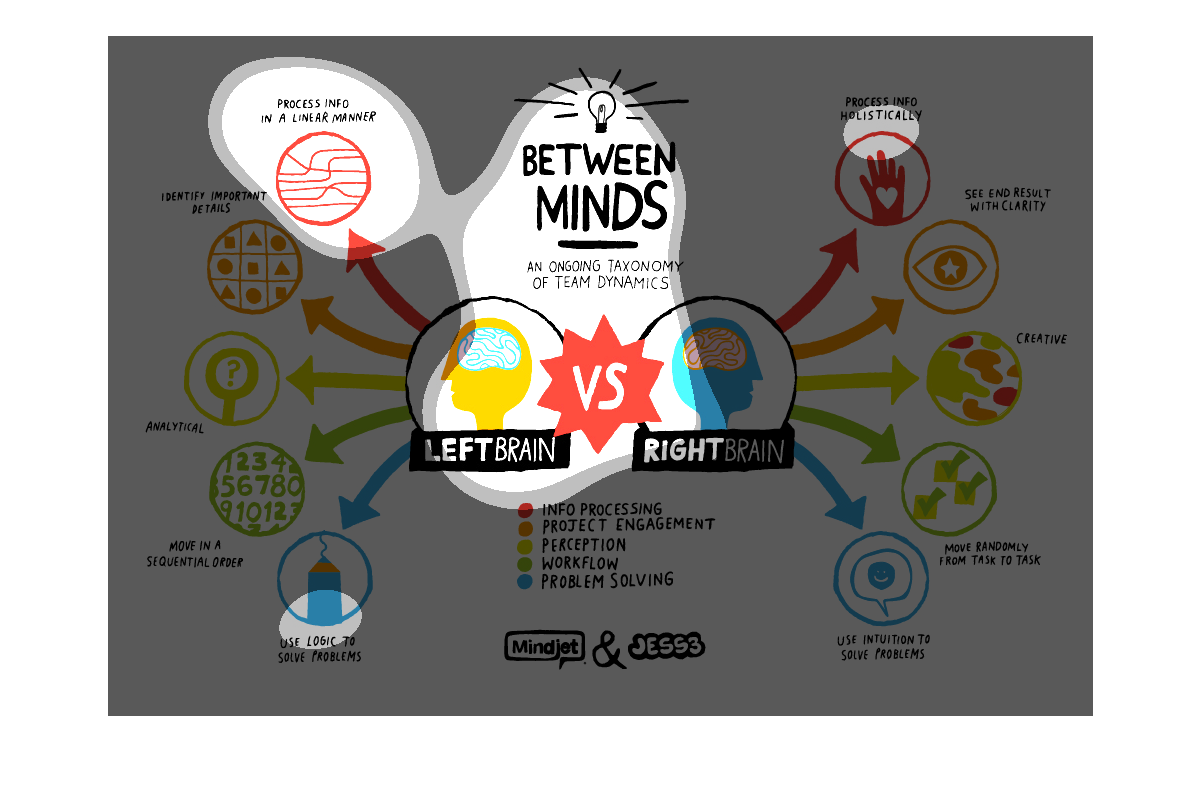
The information in this image promotes information presented by a project entitled "Between
Minds," which provides a study of an "Ongoing Taxonomy of Team Dynamics." An individual can
find information for the Left Brain and Right Brain as it relates to the mind.  Some of the
concepts listed in this image are as follows  Info Processing Project Engagement Perception
Workflow Problem Solving  In closing the information appears to have been compiled using MindJet
and Jess3 technologies. From personal experience, MindJet is a well known "Mindmapping" software
application.
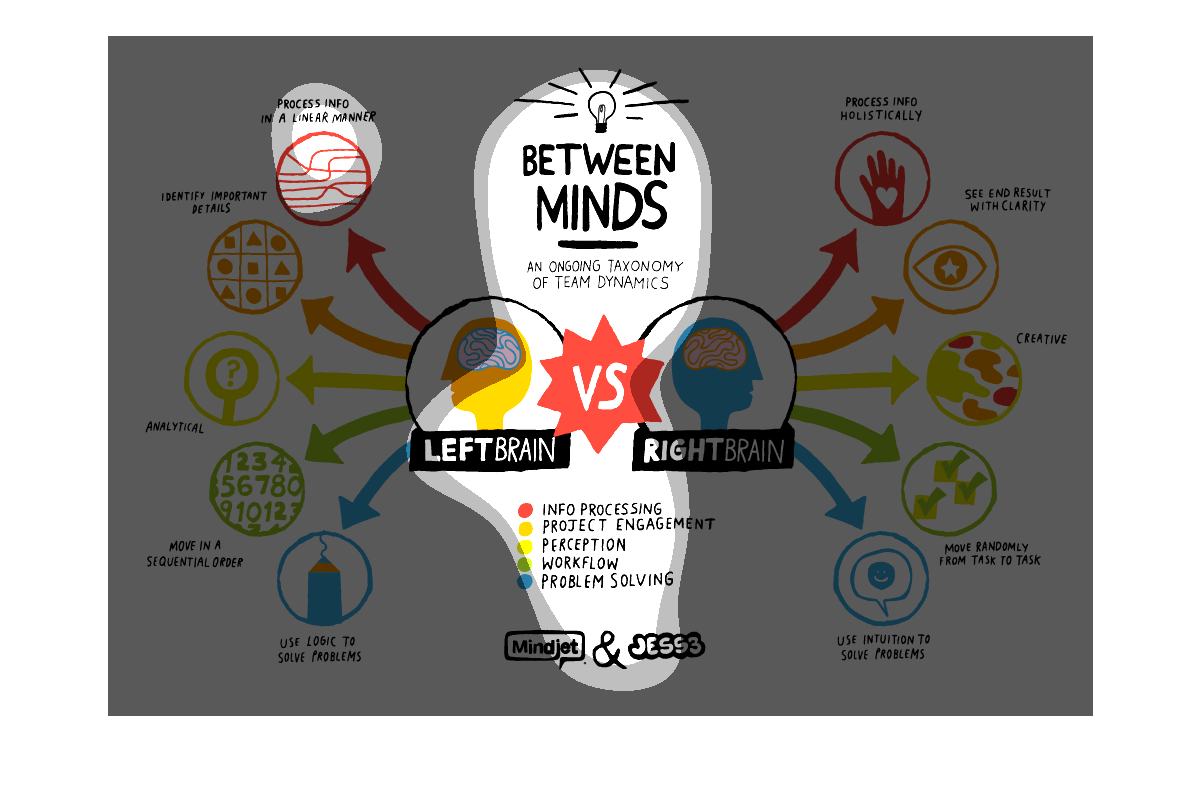
This shows a comparison between left and right brained people. It shows that left brain people
are more anilitical vs right brained people who are more creative