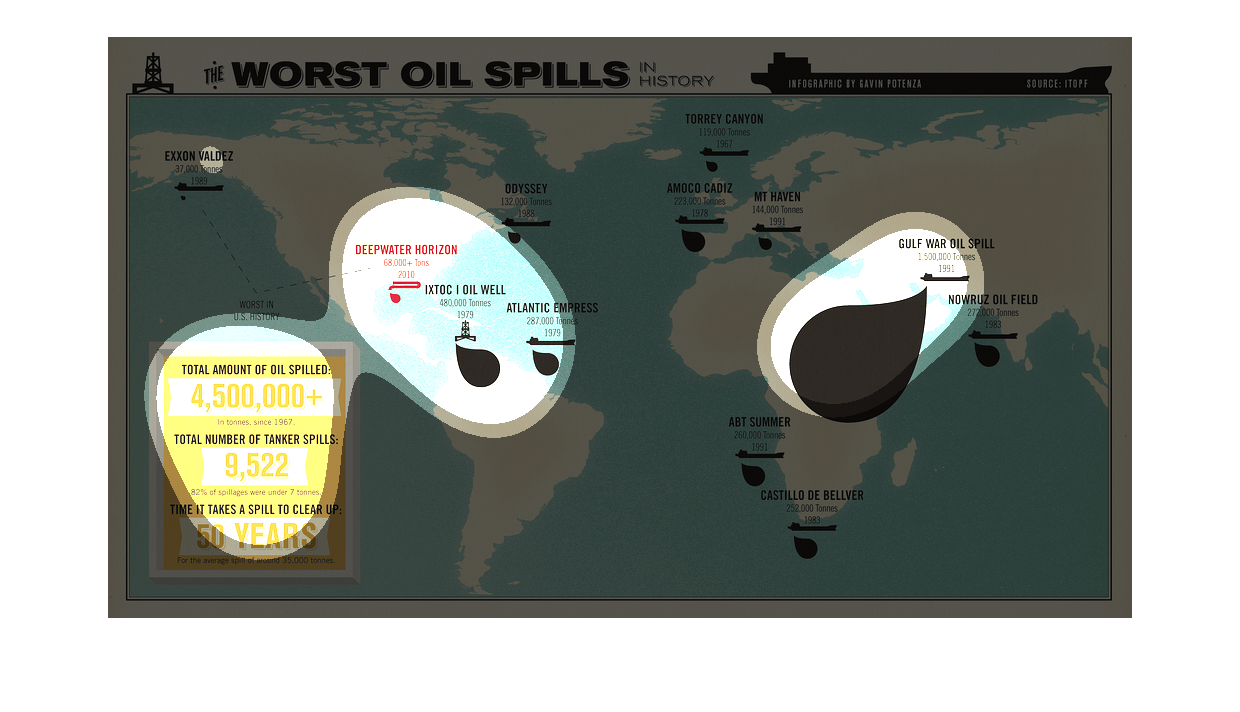
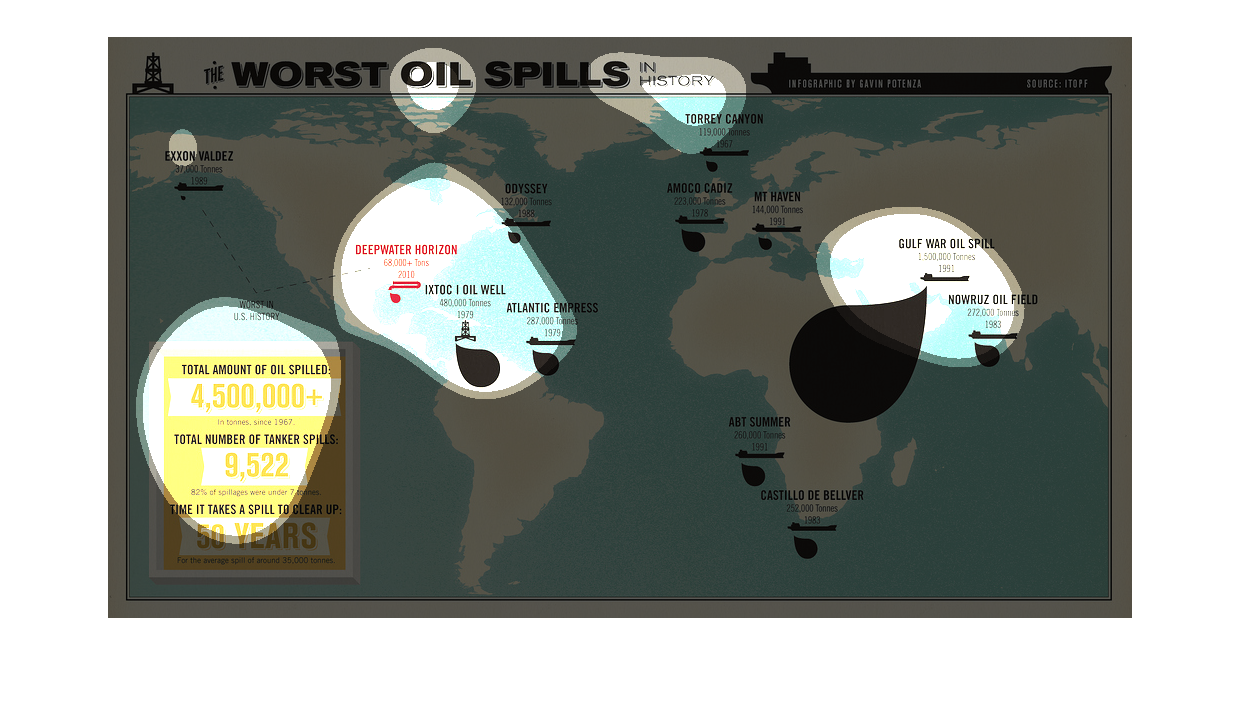
This picture is a map of all the continents on Earth. This map shows "The Worst Spills In
History". This map shows one big spill in Africa, and a couple off the north eastern coast
of South America.
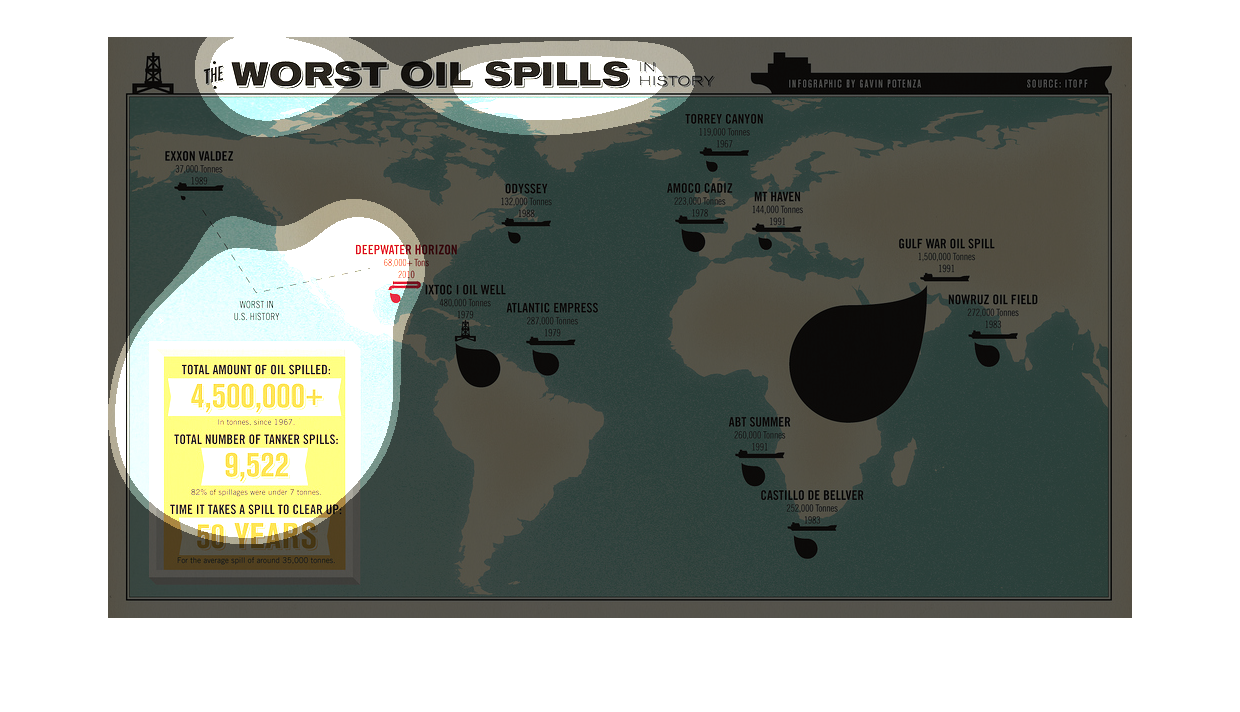
This graph illustrates the worst oil spills.  It is a global map that has locations of spills
and statistics such as how many gallons of oil spilled at that location and the amount of
time it takes to clean a spill.
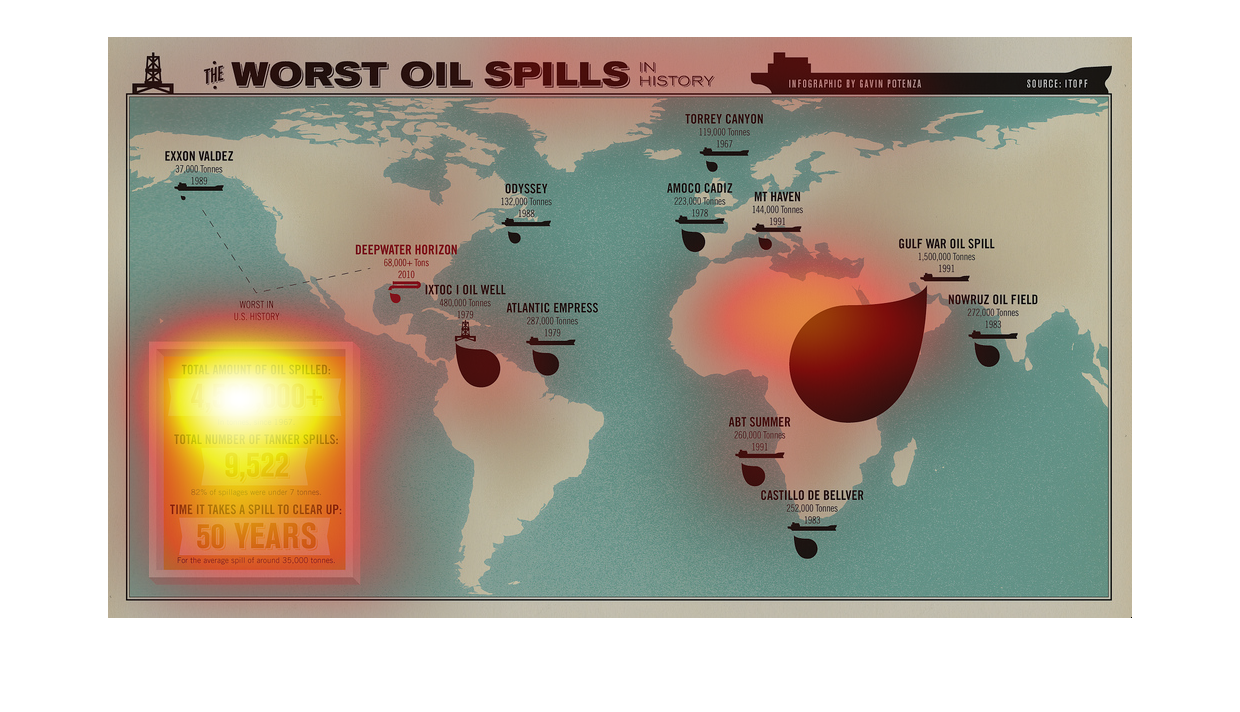
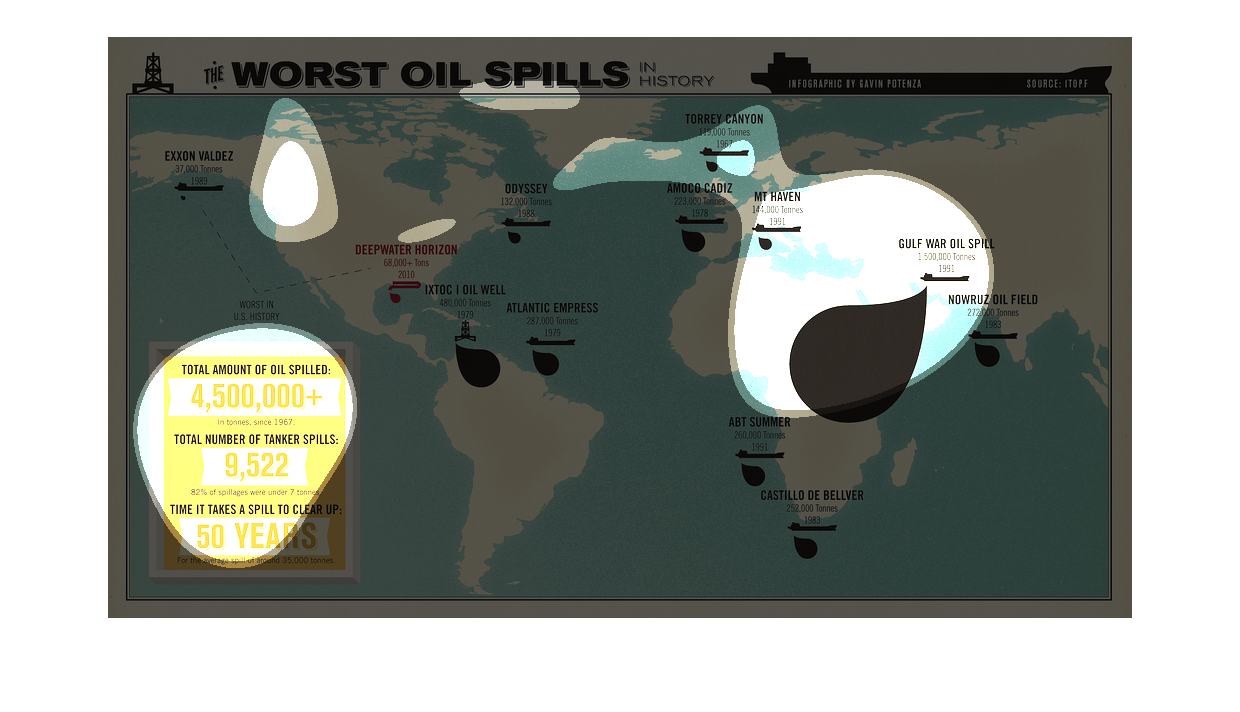
It is a map of the worst oil spills in history. The biggest spill on the map is in between
the continents of Africa and Asia. There were also some spills in and near the Gulf of Mexico.

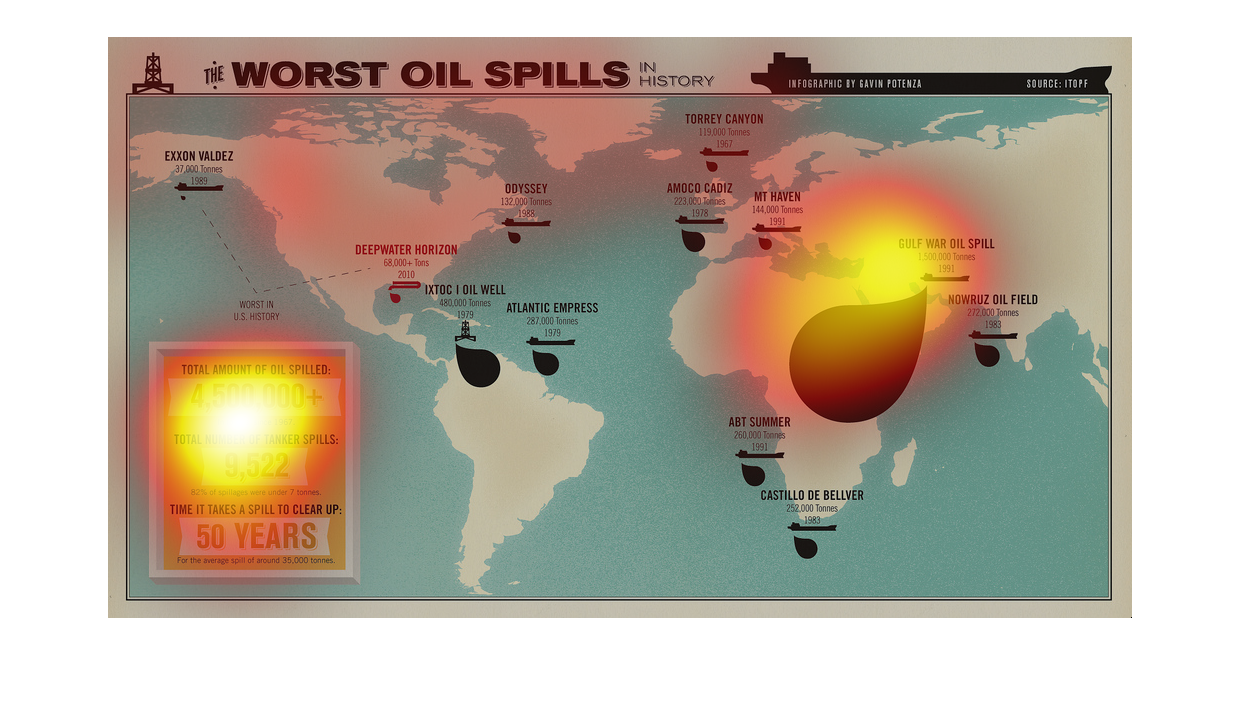
The graph on the left hand side is describing the biggest oil spills ever recorded in the
history.  From a quick glance at this graph/image one can easily point out that there was
a big oil spill off of the eastern coast of Africa.  Which is attributed to the Gulf War Oil
Spill.

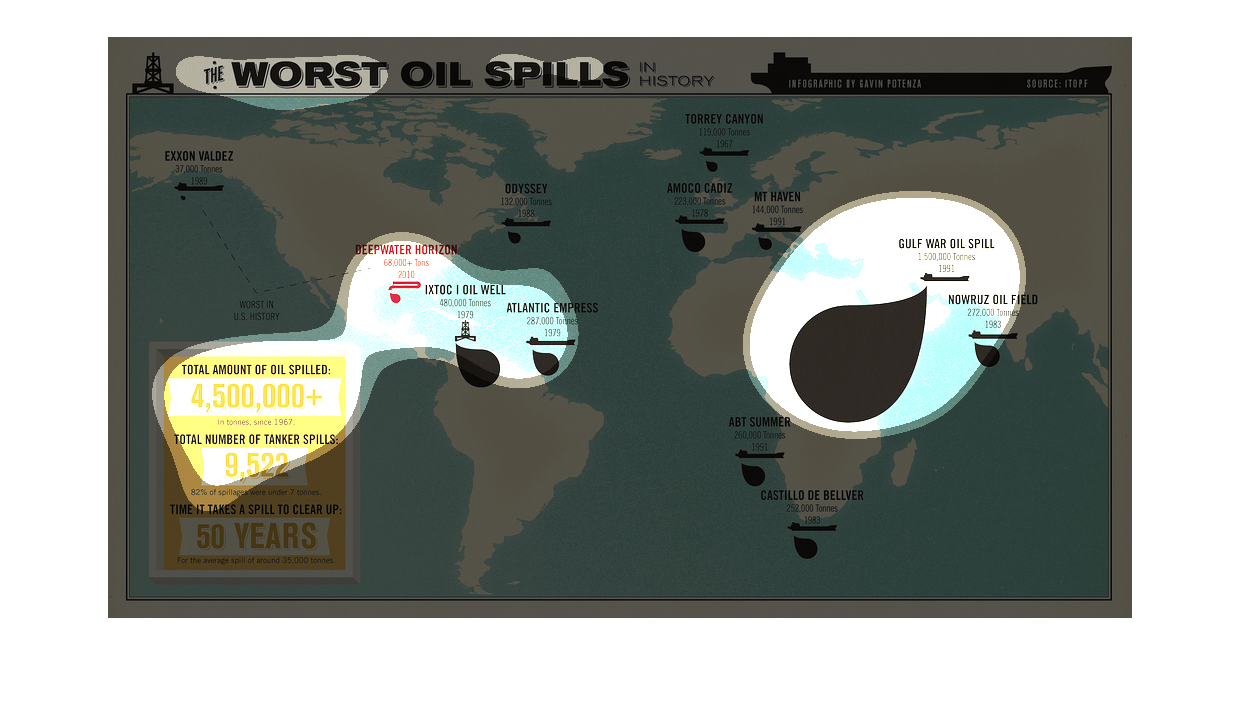
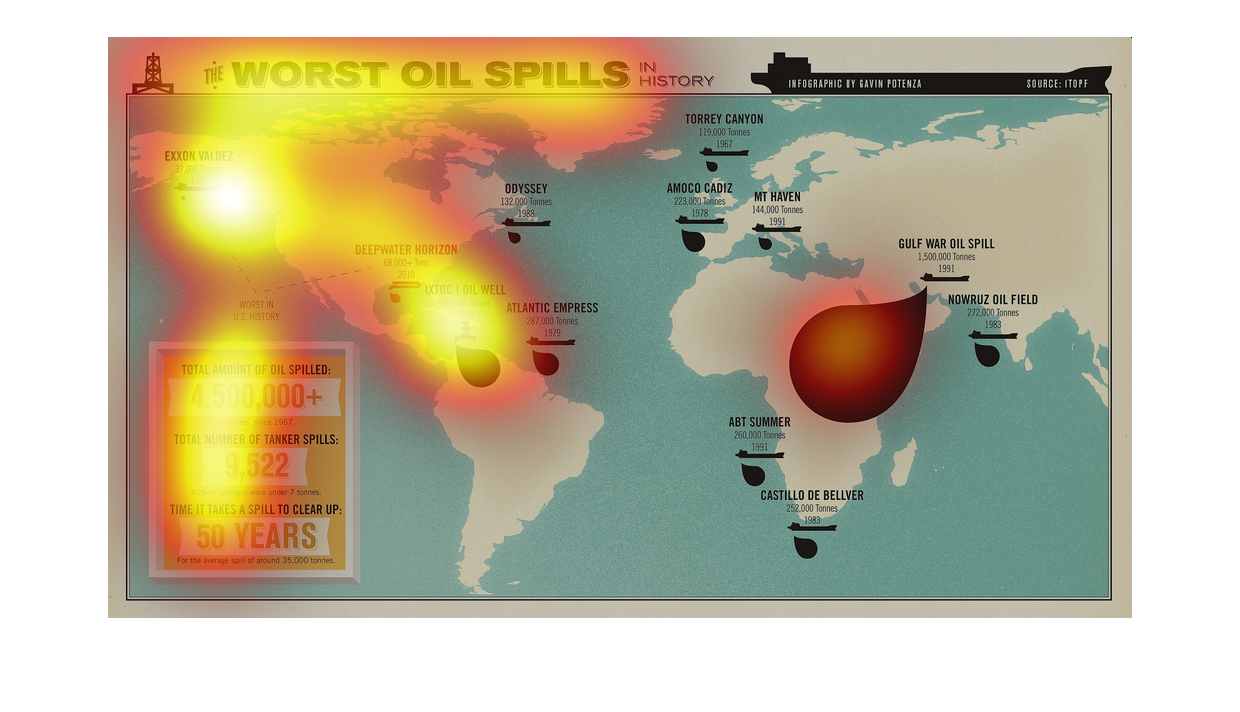
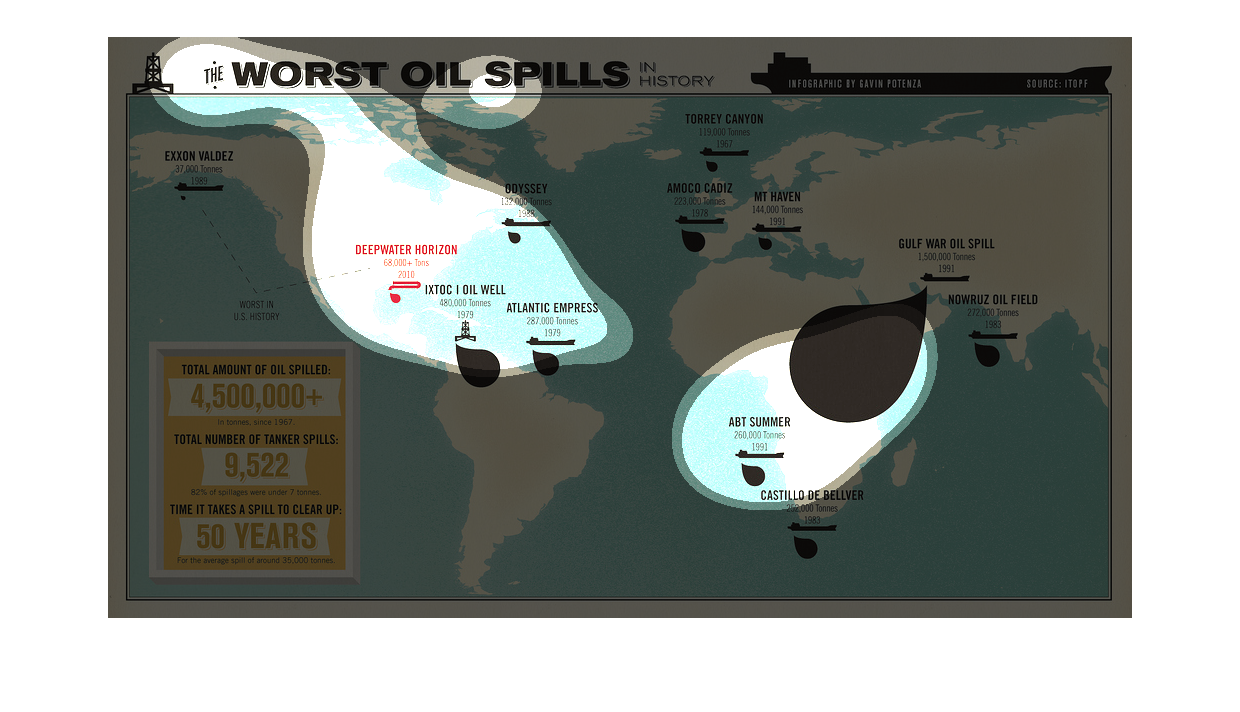
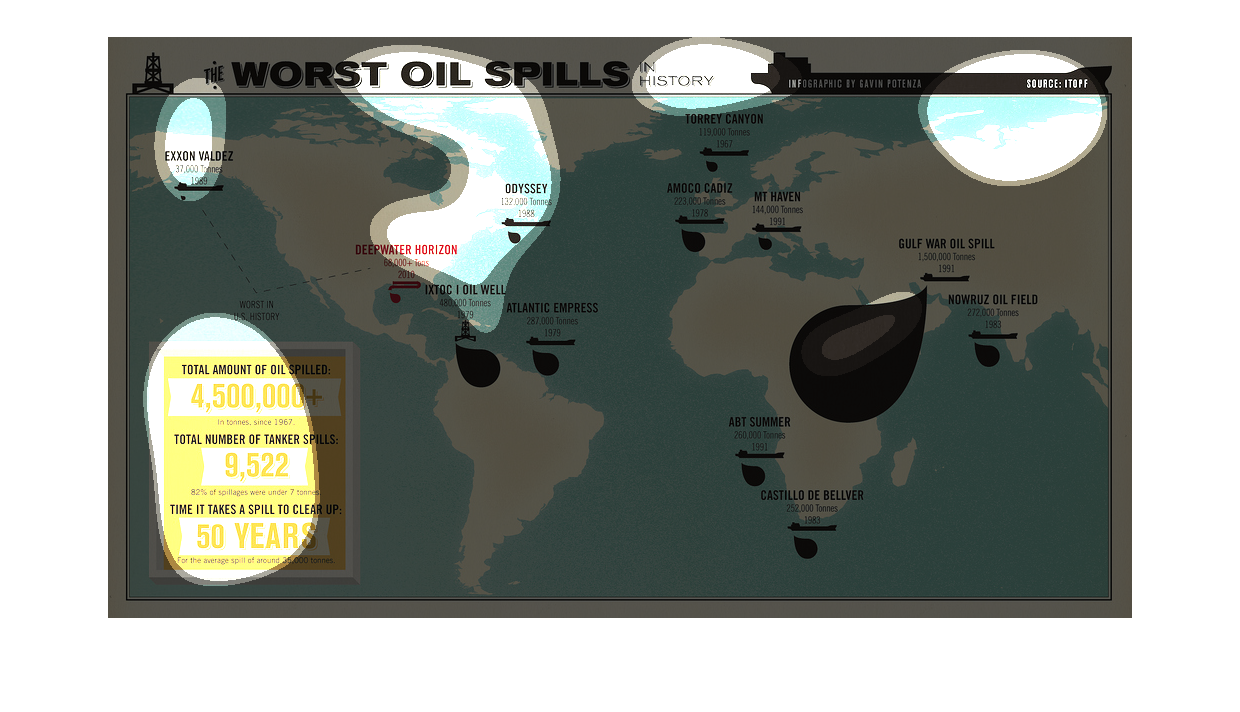
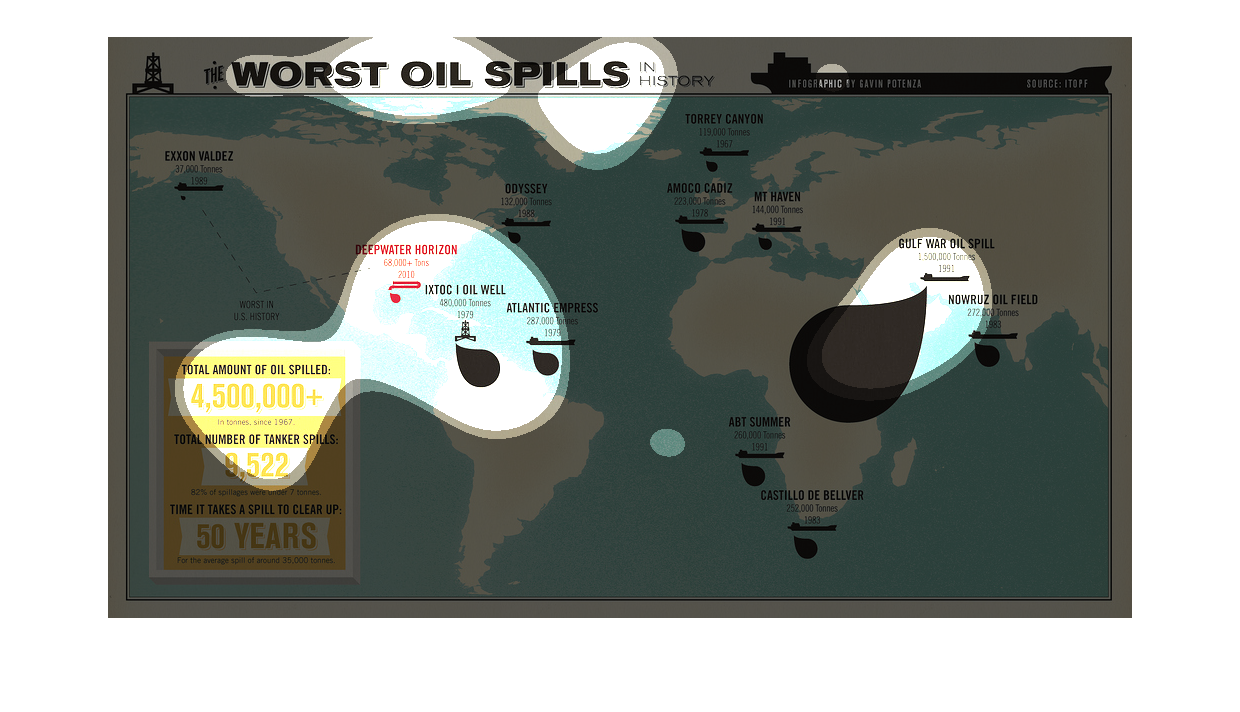
The image shows the worst oil spills in history with the severity of the spill displayed by
the size of the oil drip on the map. The map indicates oil spills are largest in the Middle
East and the Caribbean with the most frequent in the Caribbean. The map also relays the amount
of time the oil takes to clear, the amount of oil in each spill and the total number of tanker
spills in history.


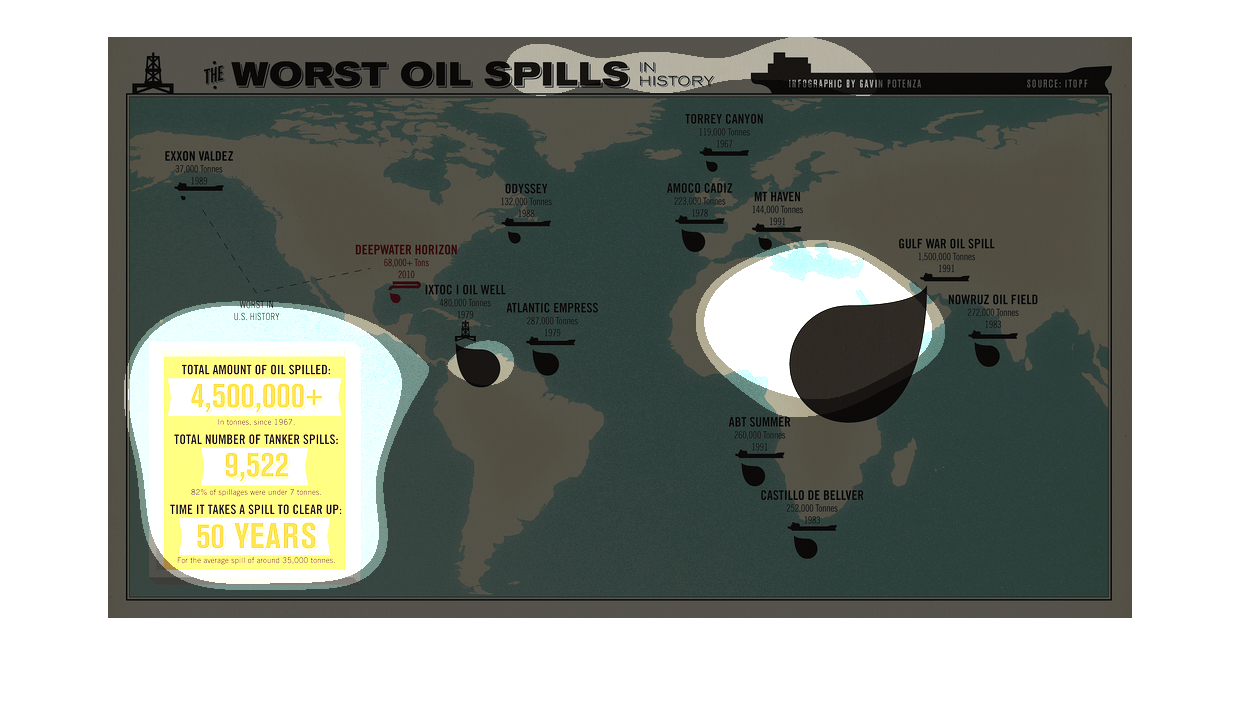
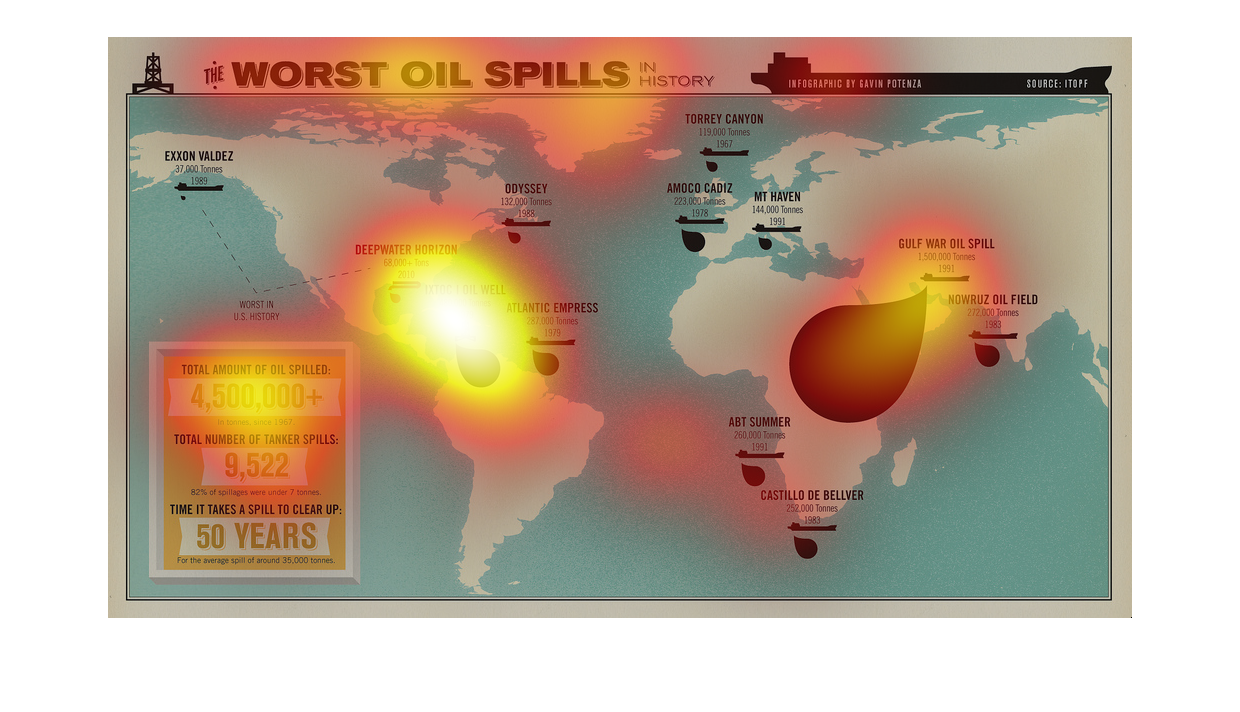
This chart shows a map of all of the most current oil spills and how much oil was spilled
on each occasion. It appears the the gulf war oil spill was the worst
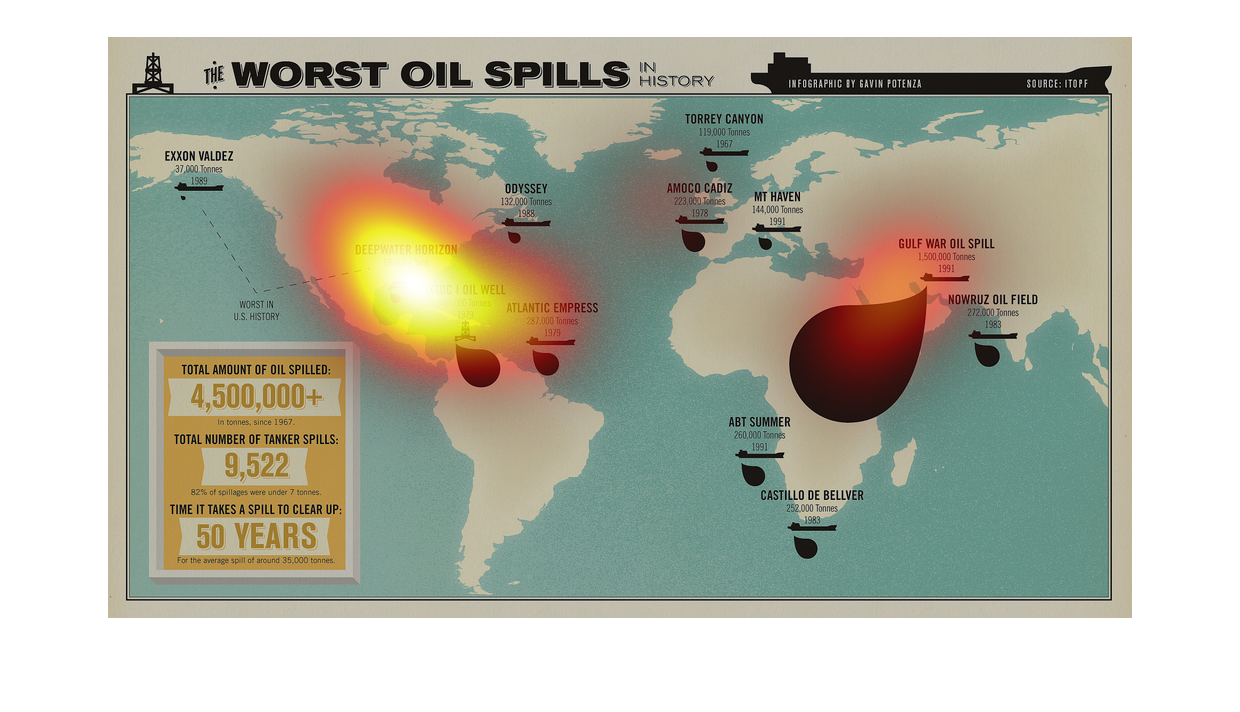
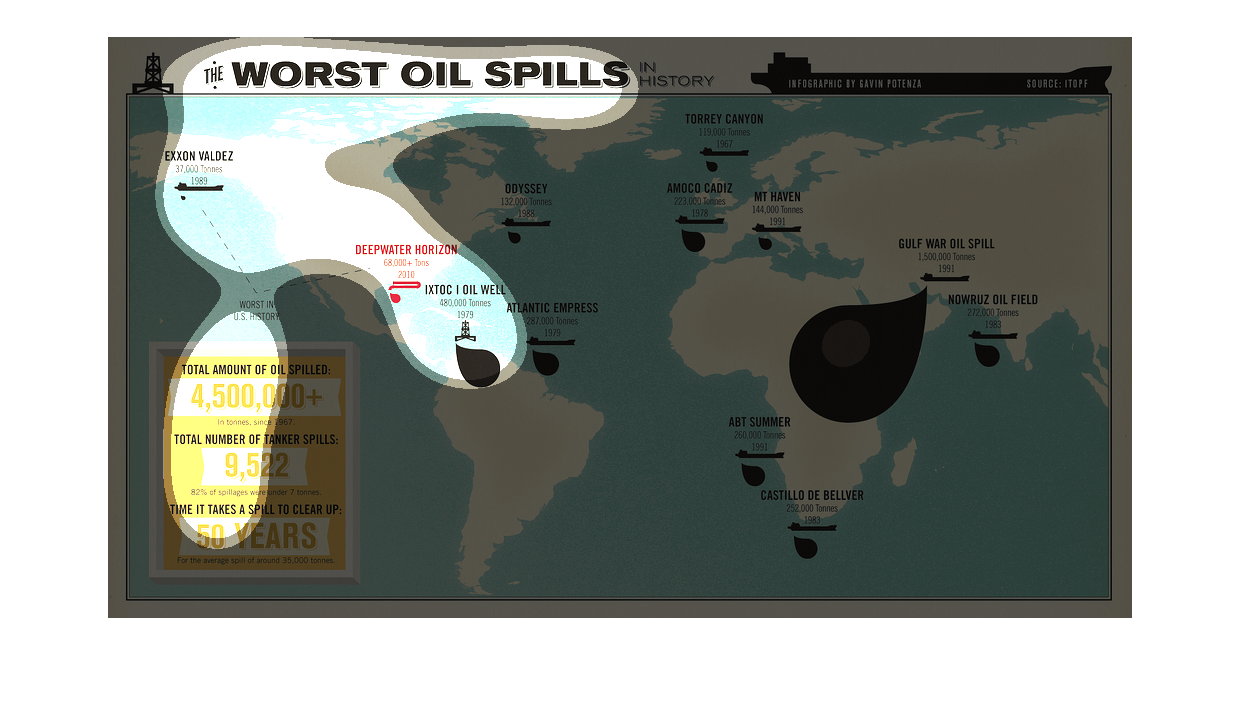
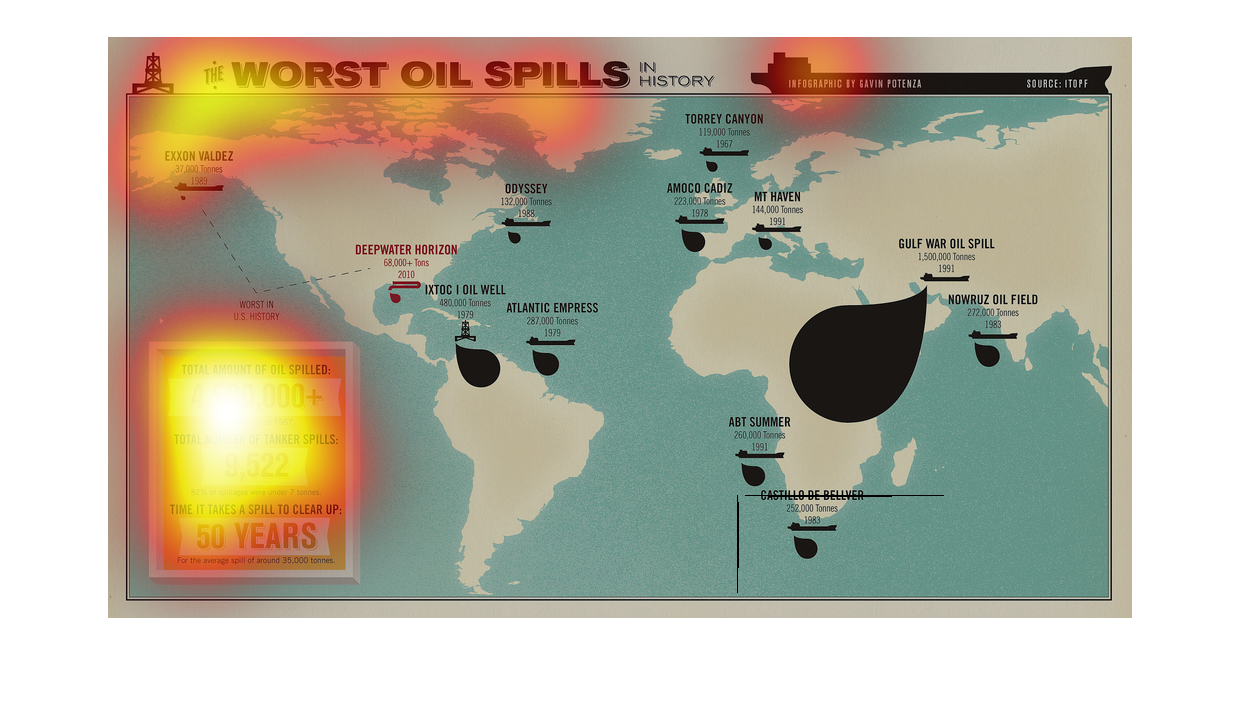
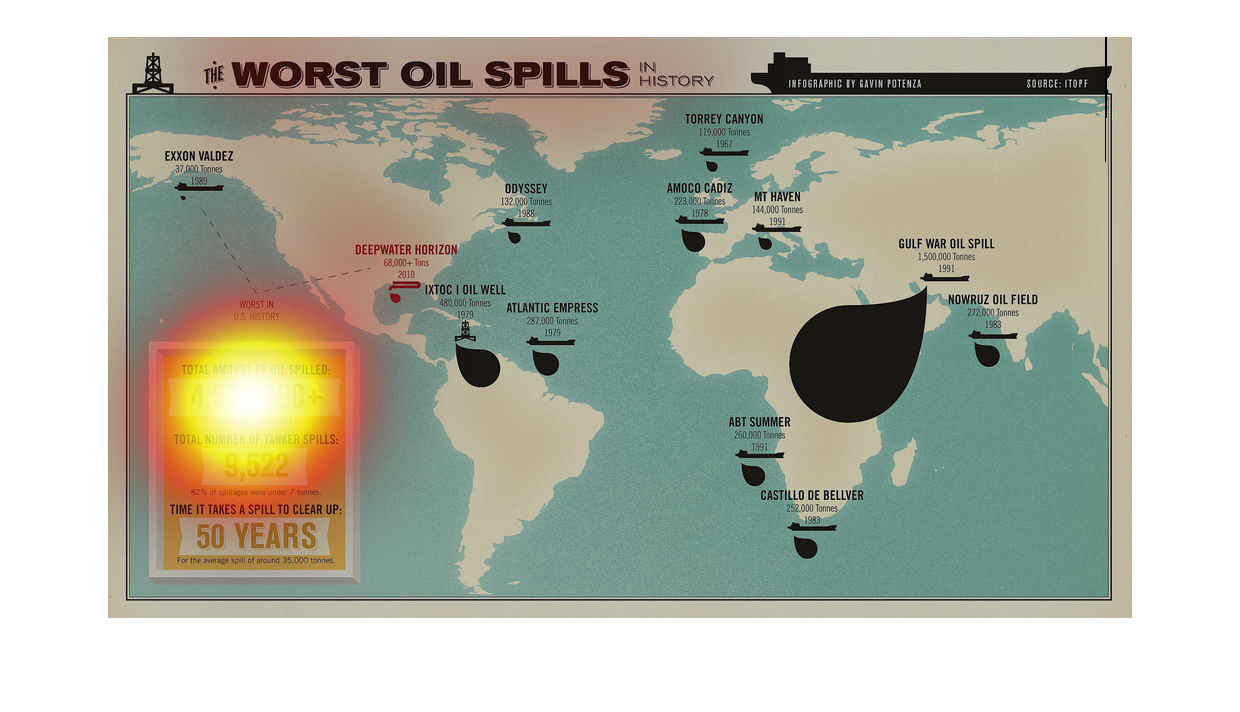
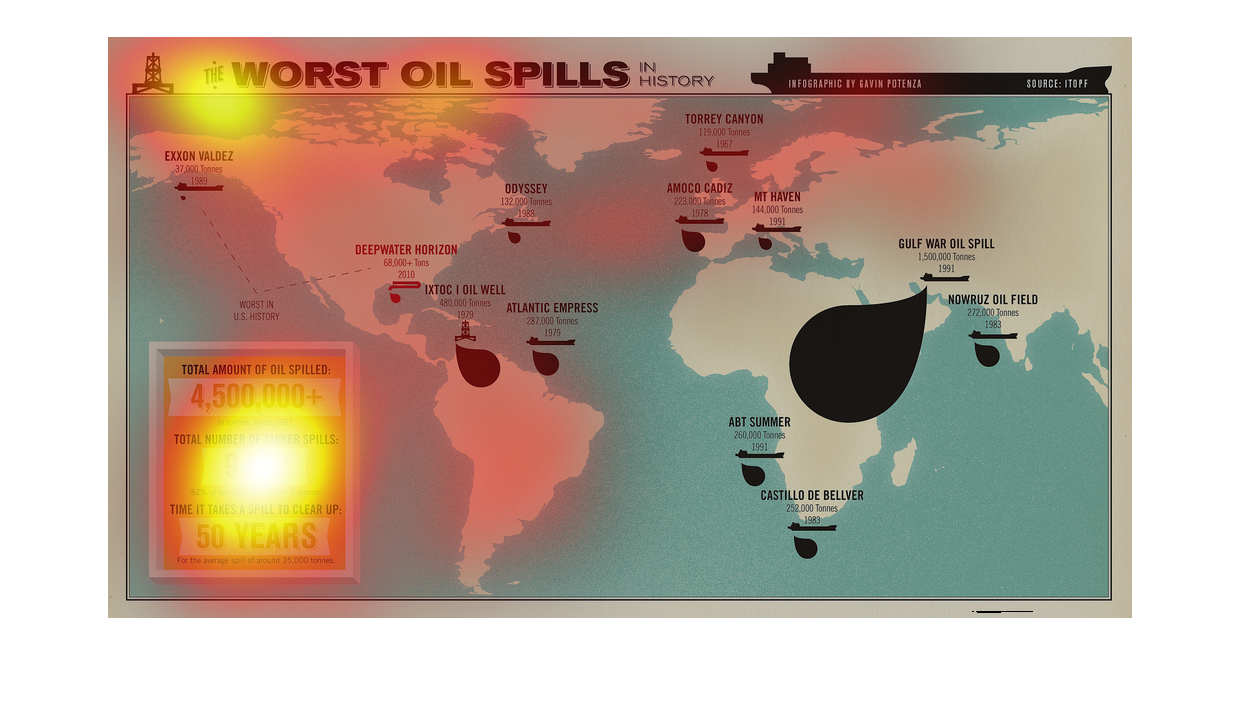
The image depicts the worst oil spills in history on planet earth. Total amount of oil spilled
= 4,500,000 (assumed gallons). Total number of tanker spills = 9,522. Time it takes a spill
to clean up = 50 years. Top contender for worst spill, according to this map, is the Gulf
War Oil Spill.
A map of the worst oil spills in history. Largest was off the coast of Africa in the Indian
Ocean. It took 50 years to clean up the worst spill. The total amount of oil spilled is over
4.5 million gallons.
If man continues to exploit and harm mother nature, it is highly unlikely we will be here
in another 300 years. This illustrations shows all the great oil spills in history, and it
is quite gruesome.
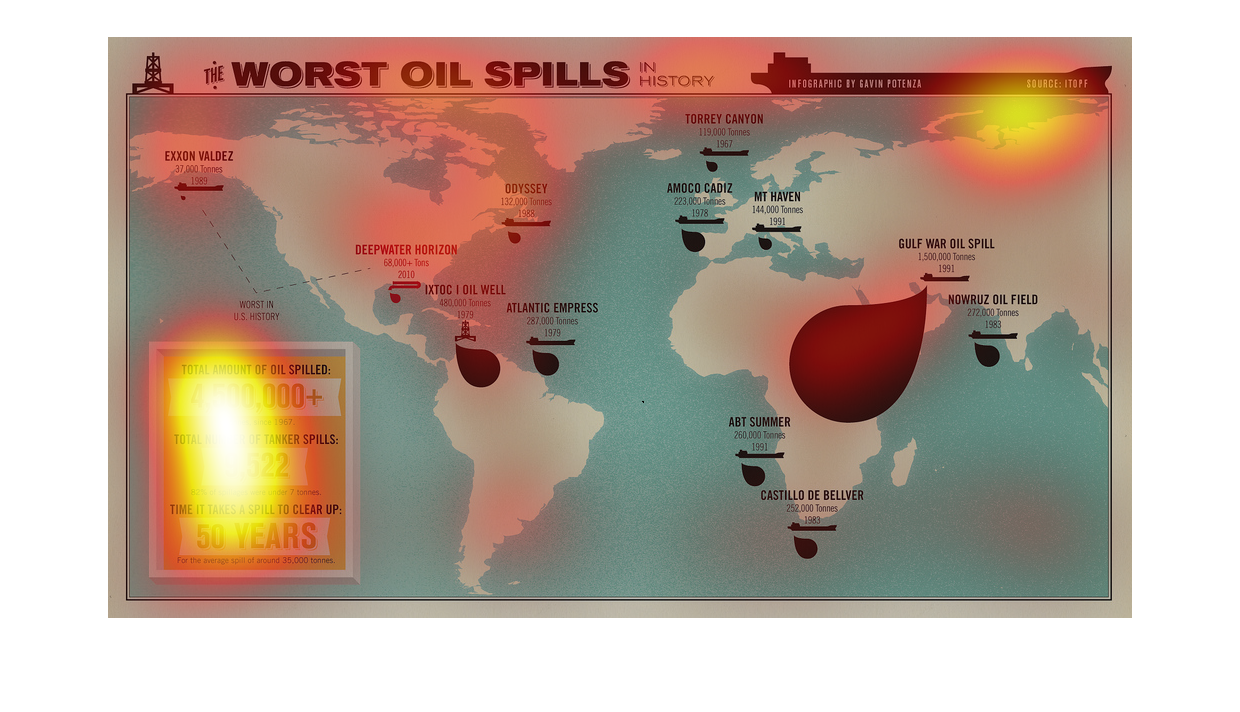
The graph gives details about the worst oil spills on every continent. From the graph it appears
that the worst oil spill occurred during the Gulf War. Overall there were over 4.5 million
oil spills total with 9522 of them occurring from tanker spills taking 50 years to clear the
spills.
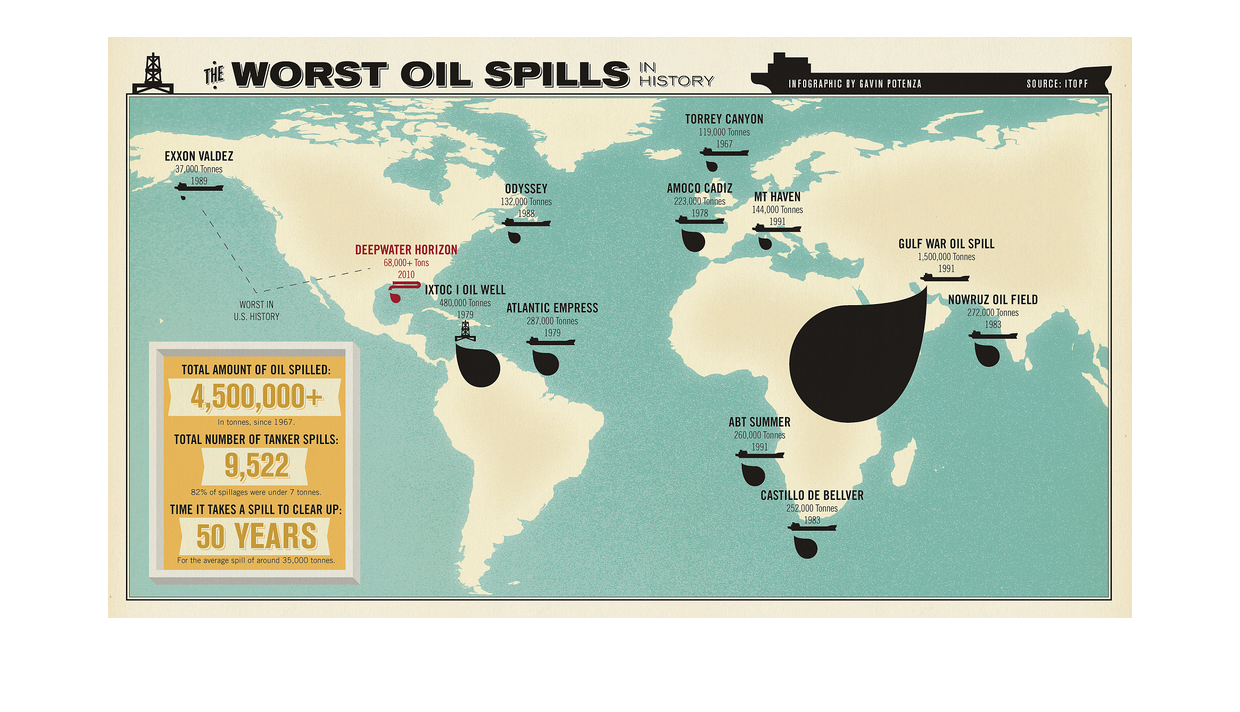
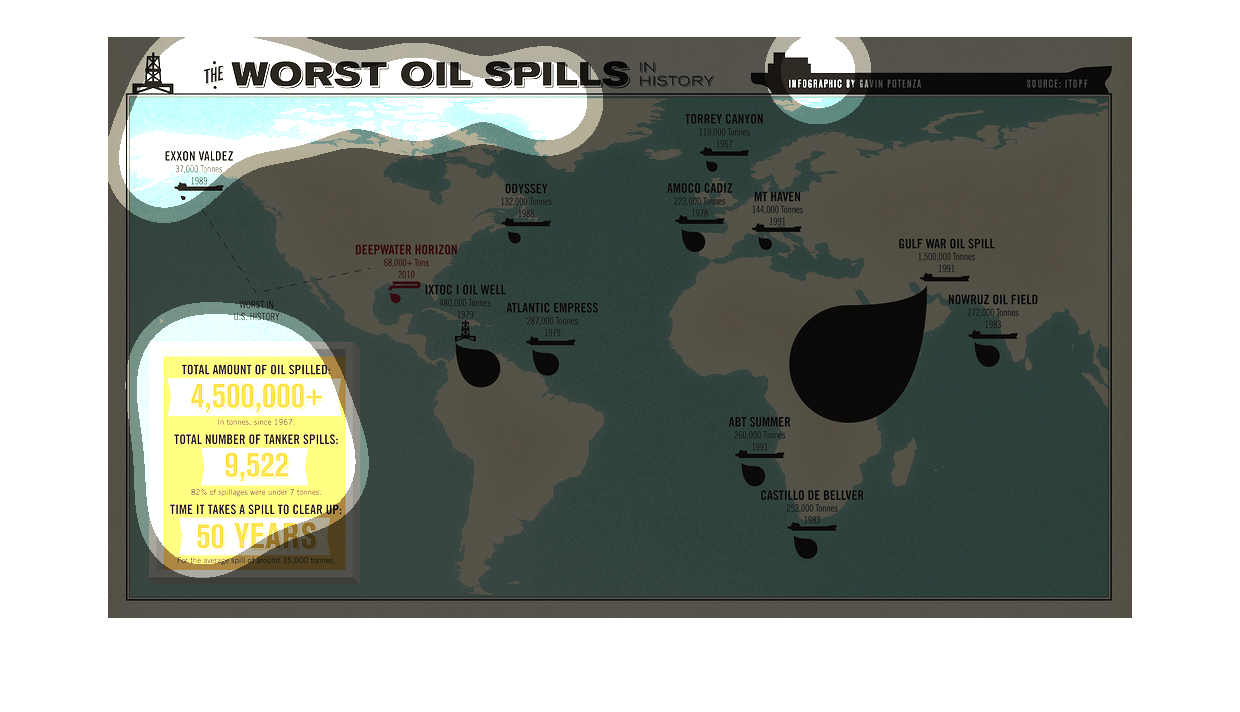
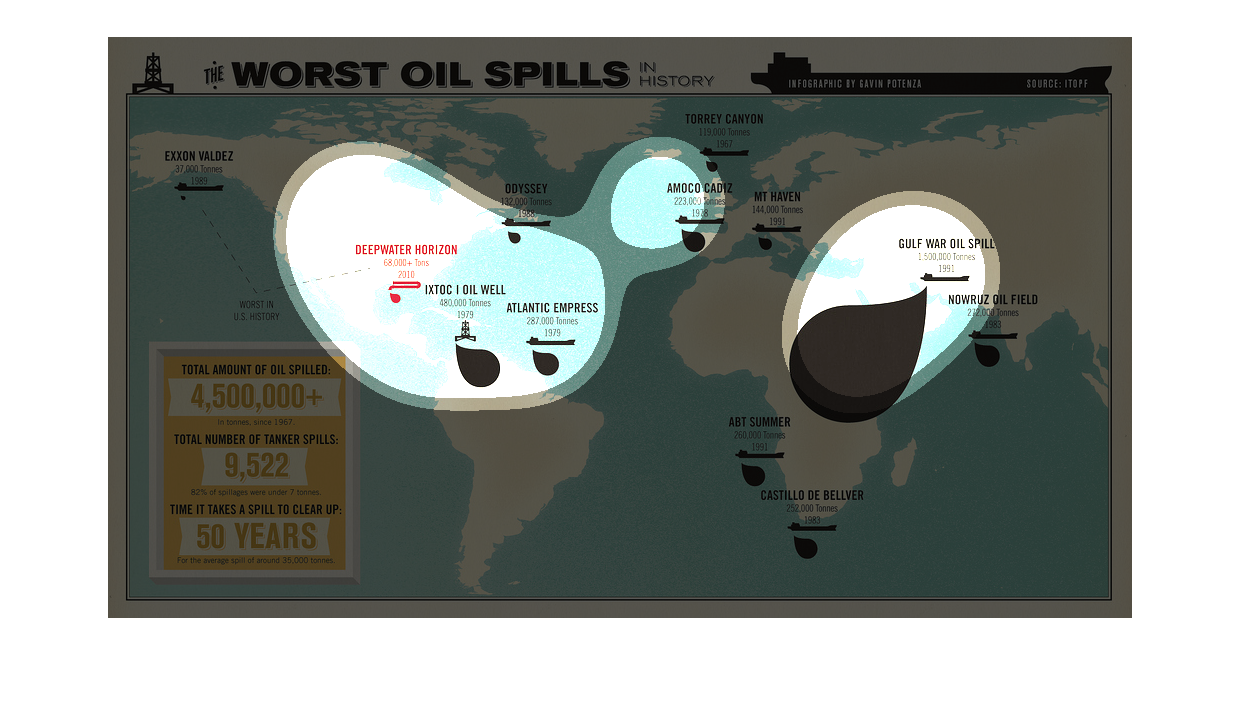
This chart describes the worst oil spills in history. The chart describes that the total amount
of oil spilled is 4,500,000 plus, and the total number of tanker spills is 9,522
The chart shows the worst oil spills in history. Totaling the amount spilled at 4,500,000+,
9,522 from tankers which in total will take 50 years to clear up. The Gulf War Oil Spill appears
to be the largest and Exxon Valdez the smallest.
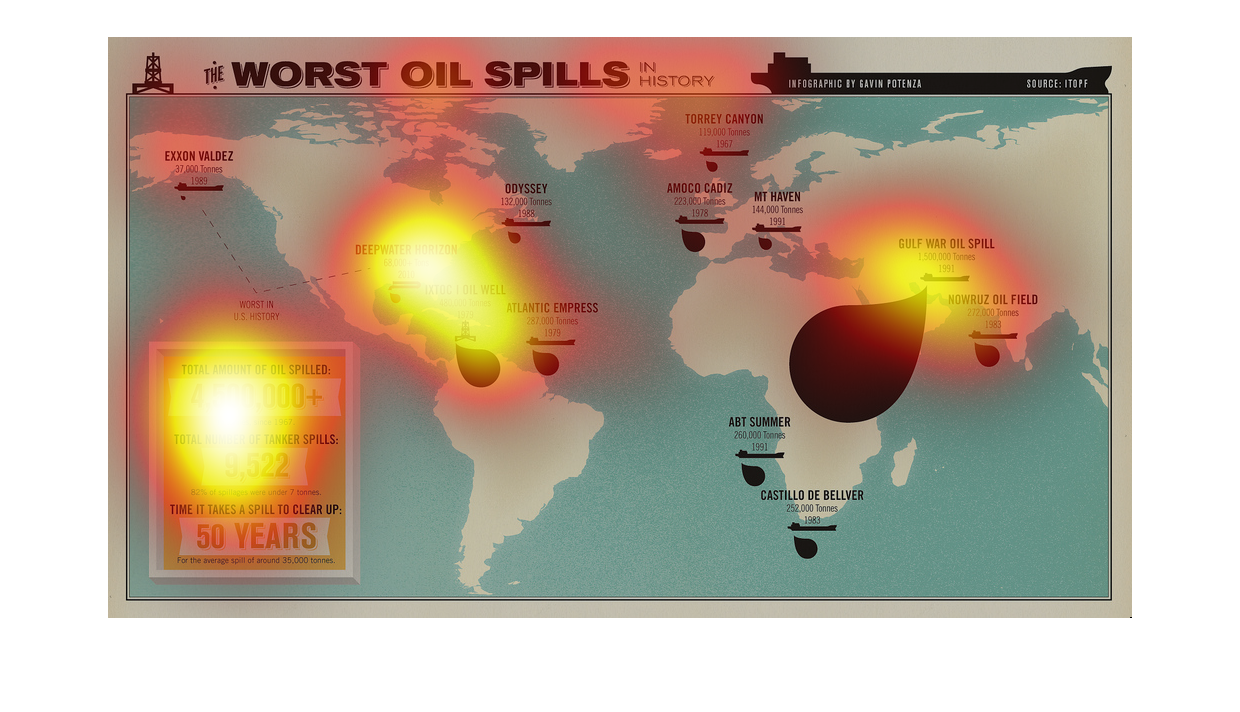
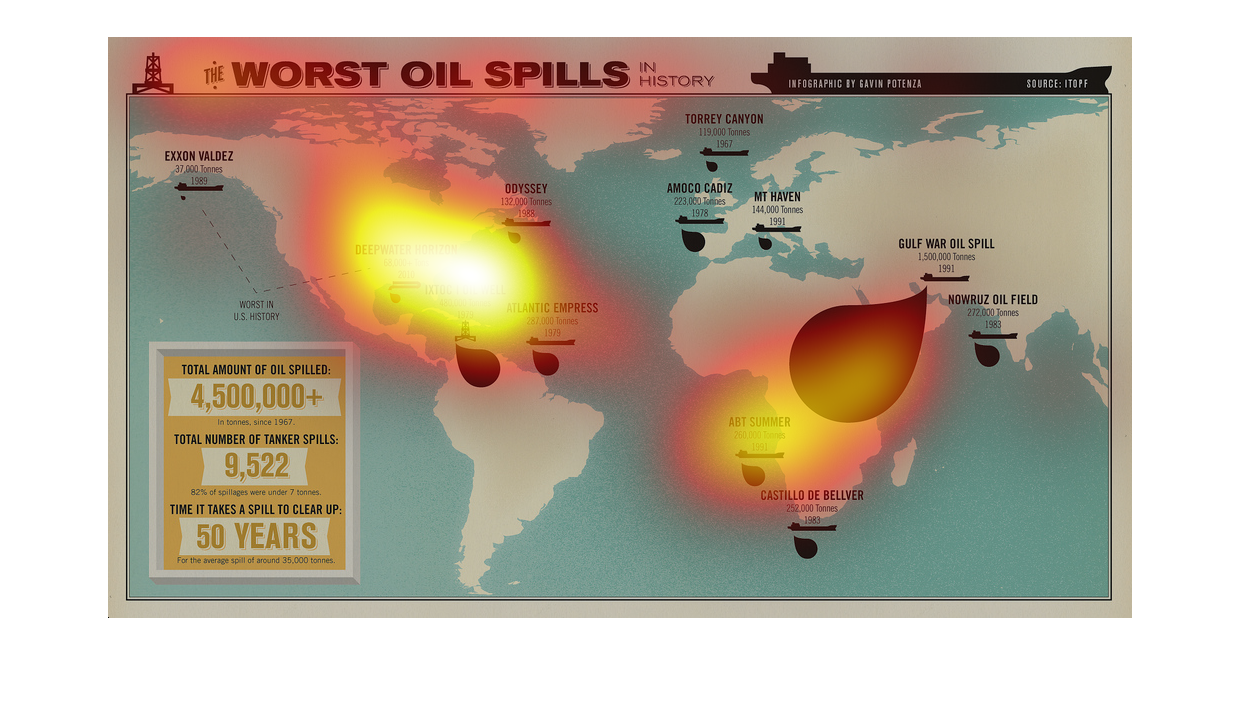
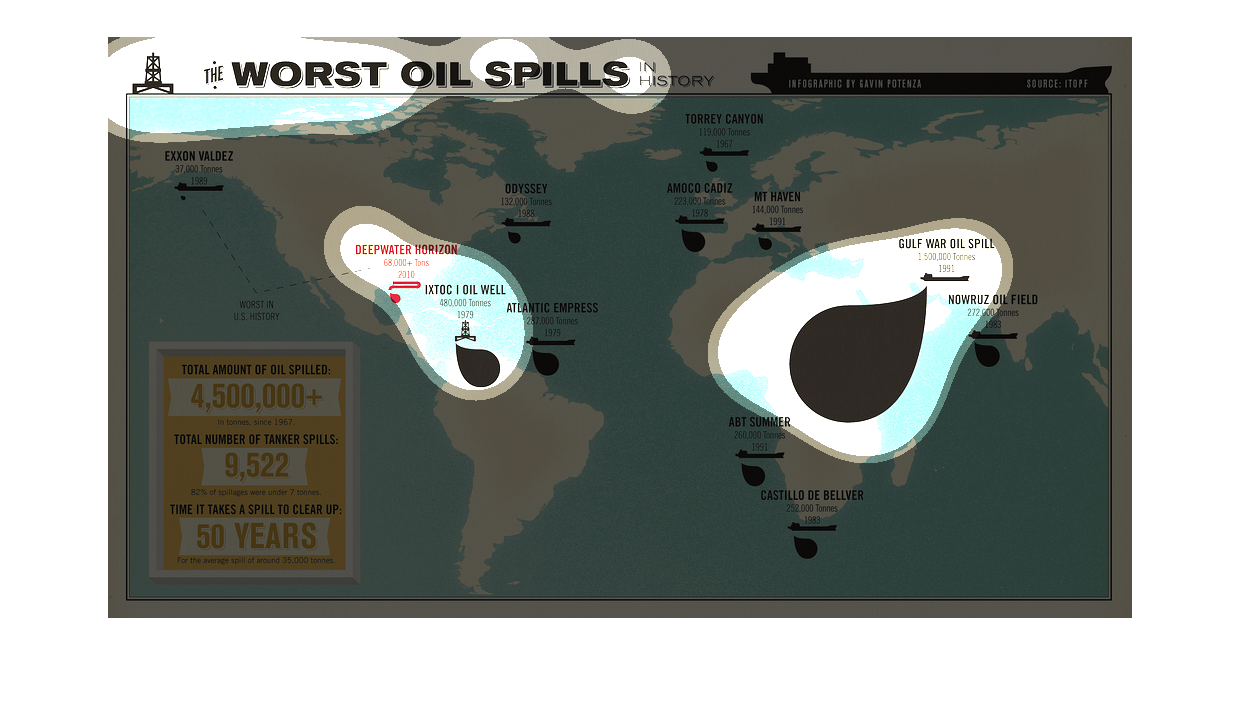
The following chart shows the worst oil spills in the history of the world. By far the worst
ever is the Gulf War Oil Spill with the affected region being extremely large.
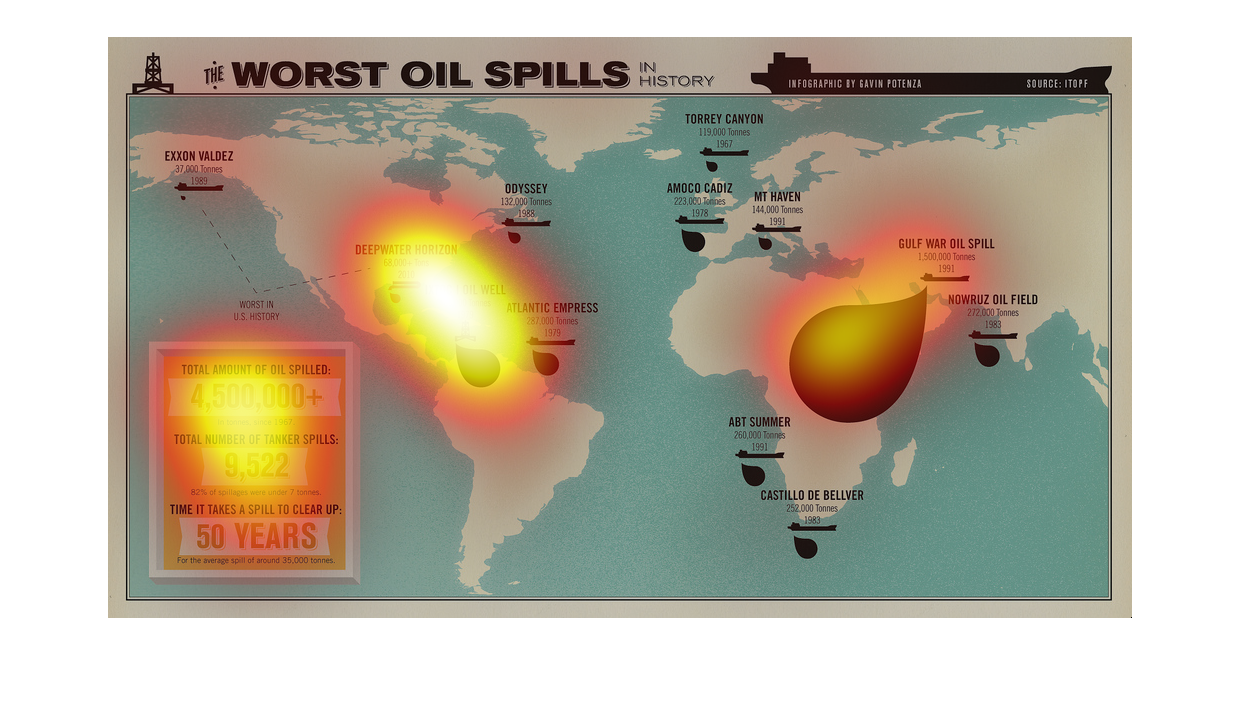
This is a map depicting the worst oil spills in history and their resulting statistics in
terms of amount spilled, total number of spills and how long it takes to clean up a spill.

This is a world map denoting the worlds worst oil spills, with the effects denoted by the
size of black drops on the map. A small graphic in the lower left gives relevant statistics
and facts.