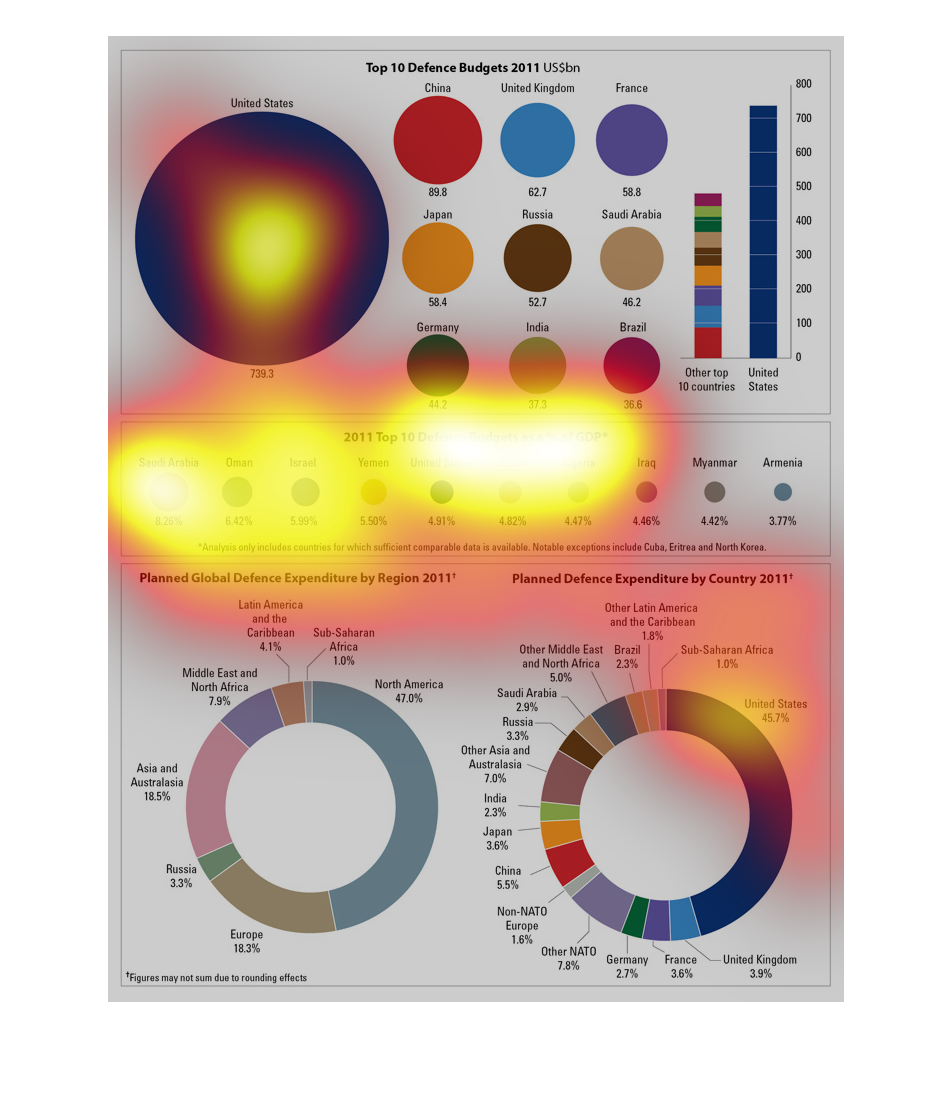
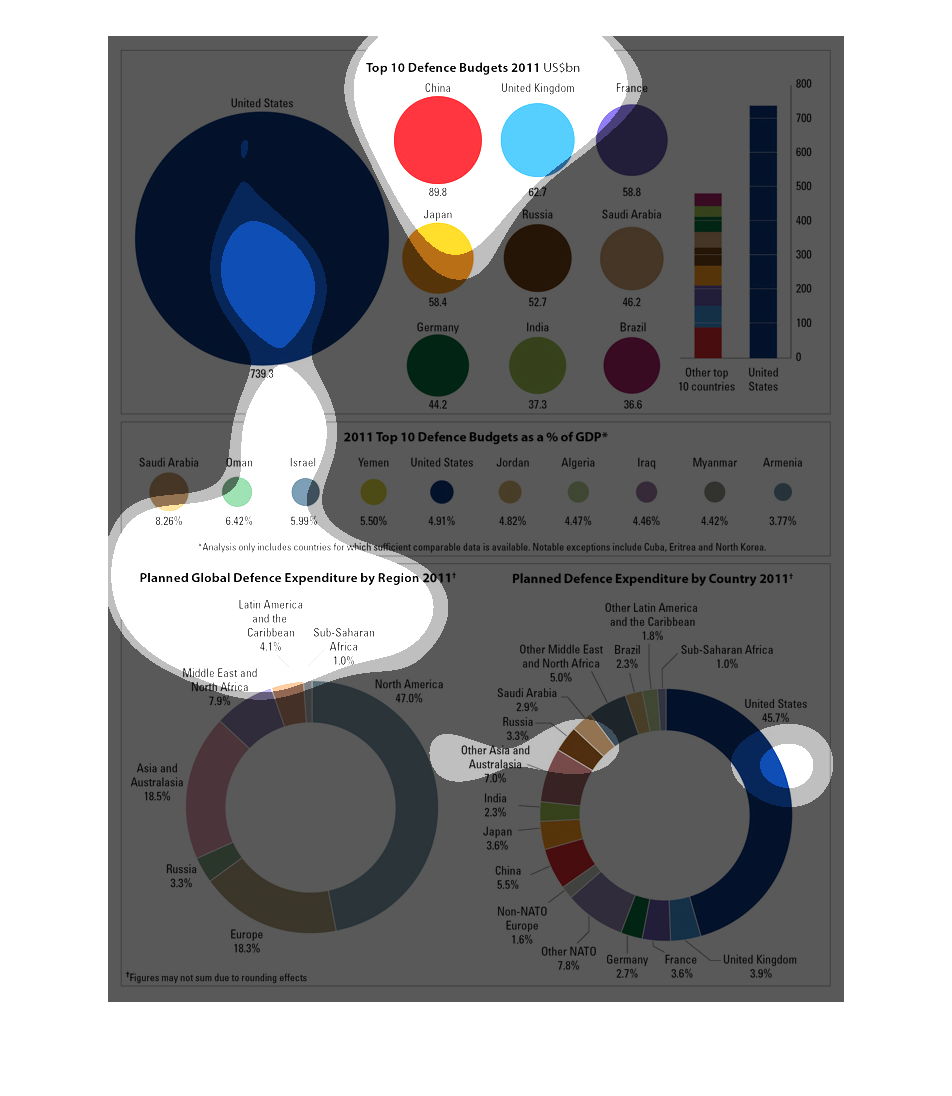
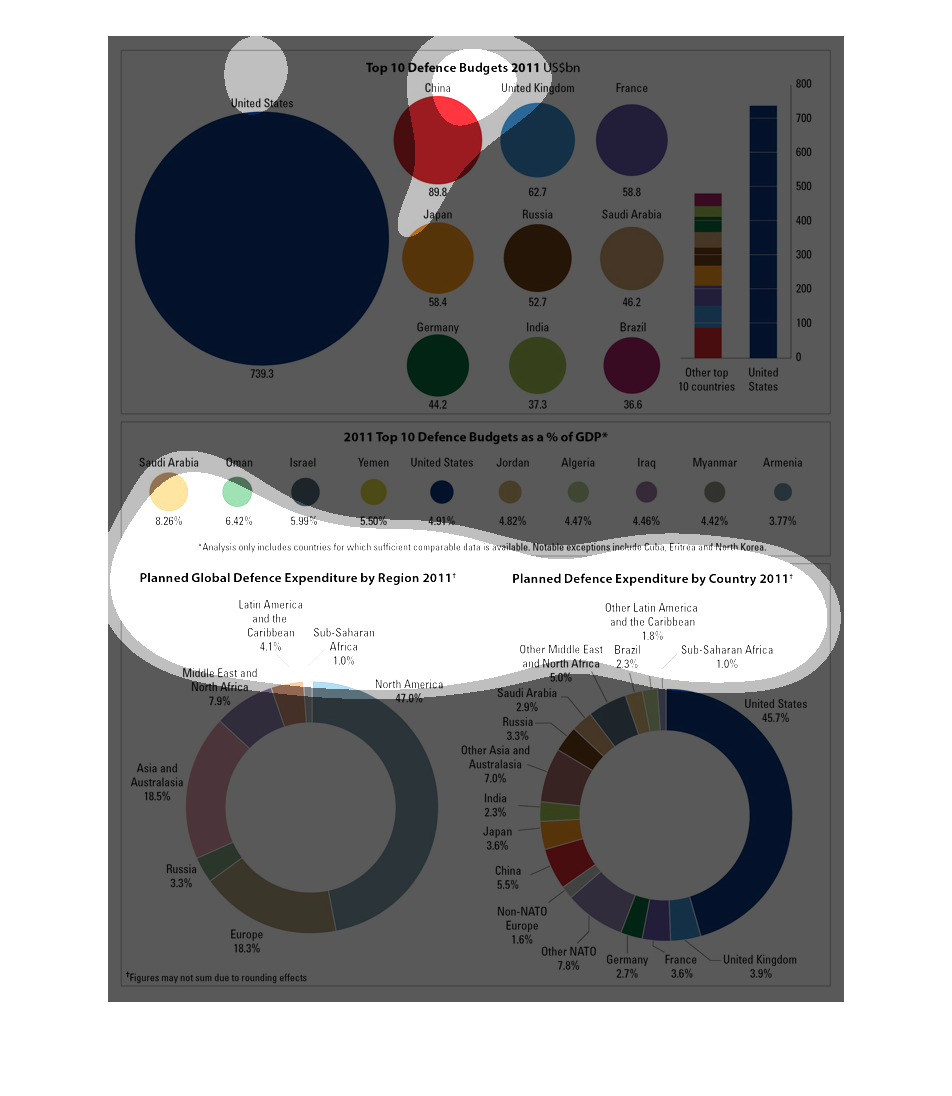
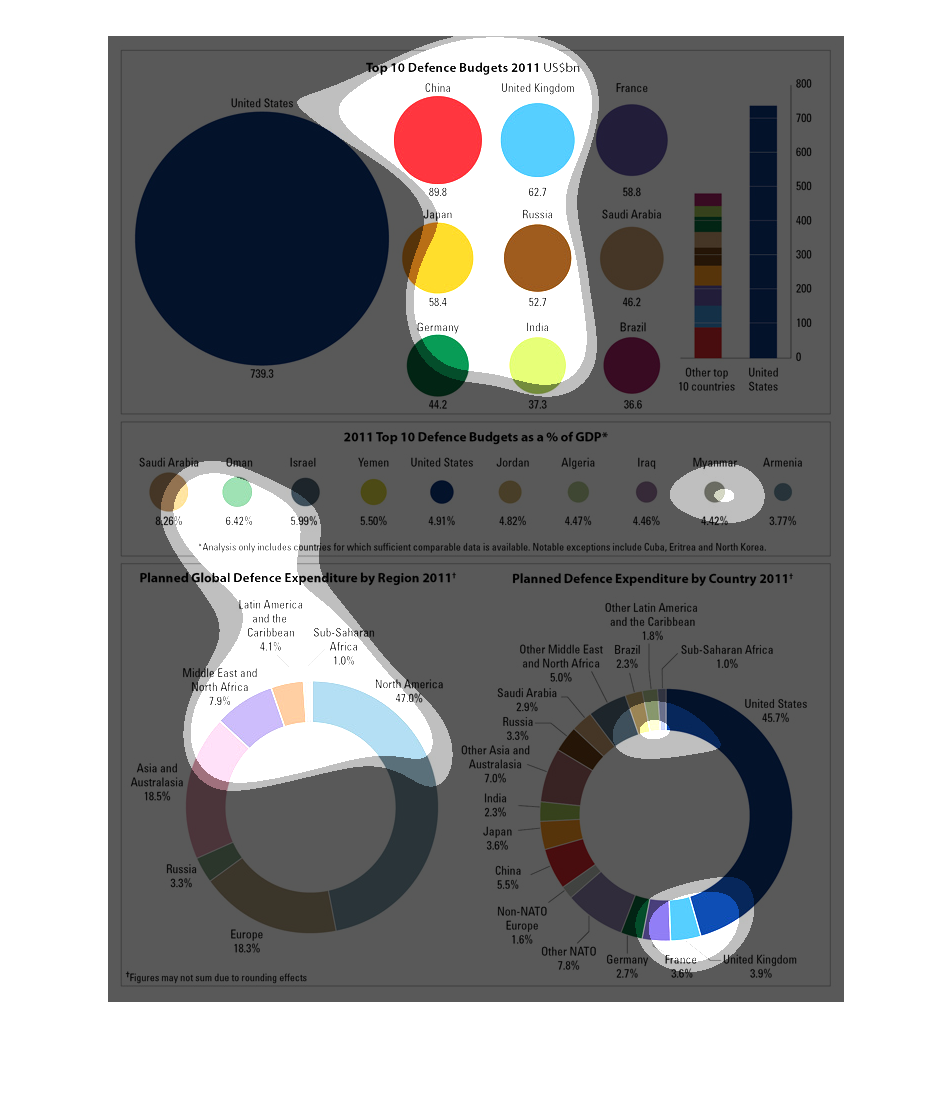
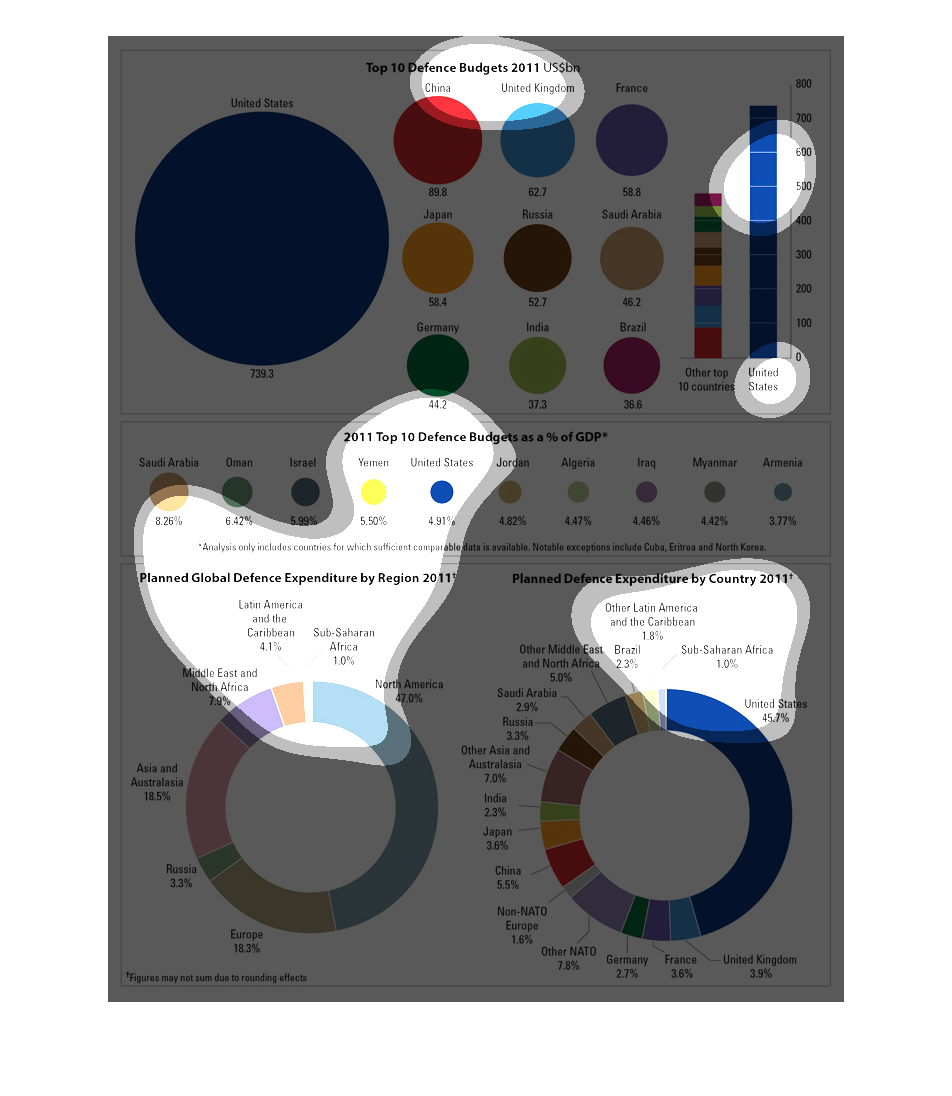
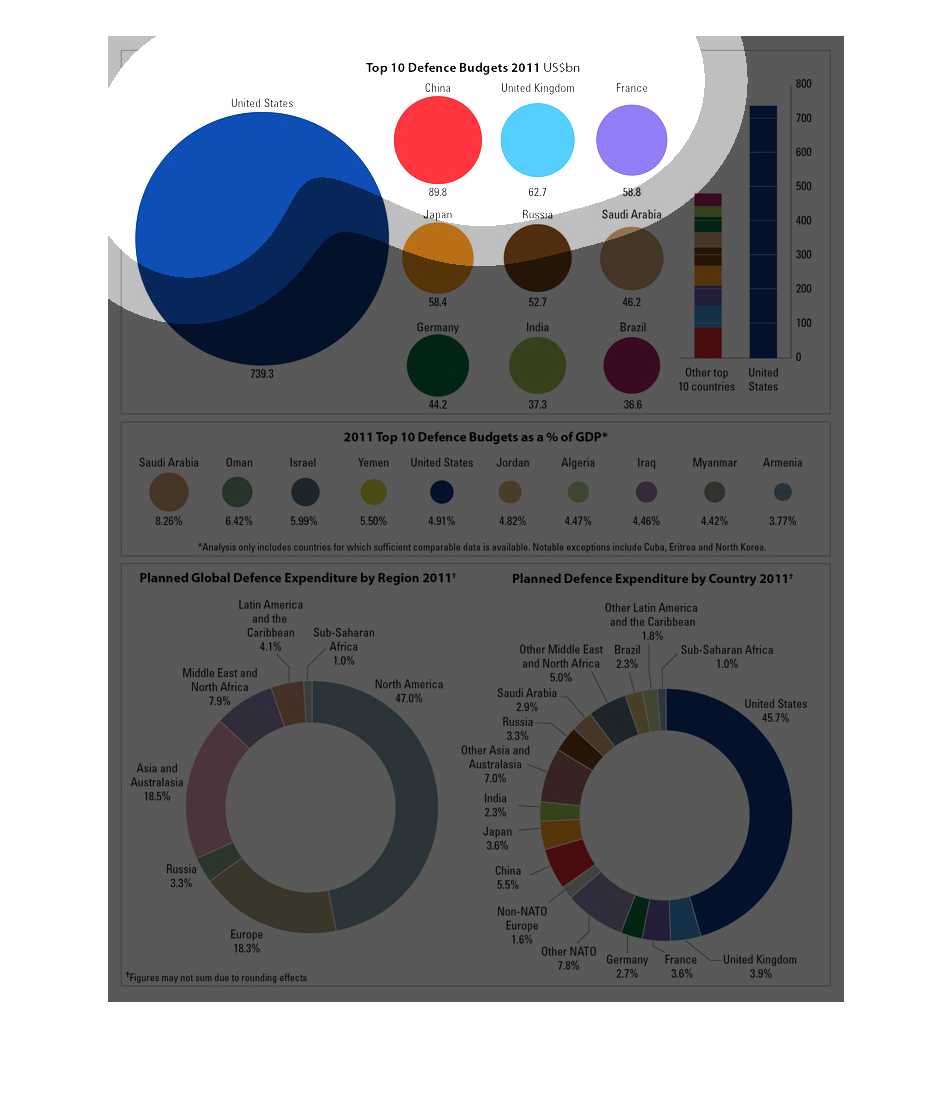
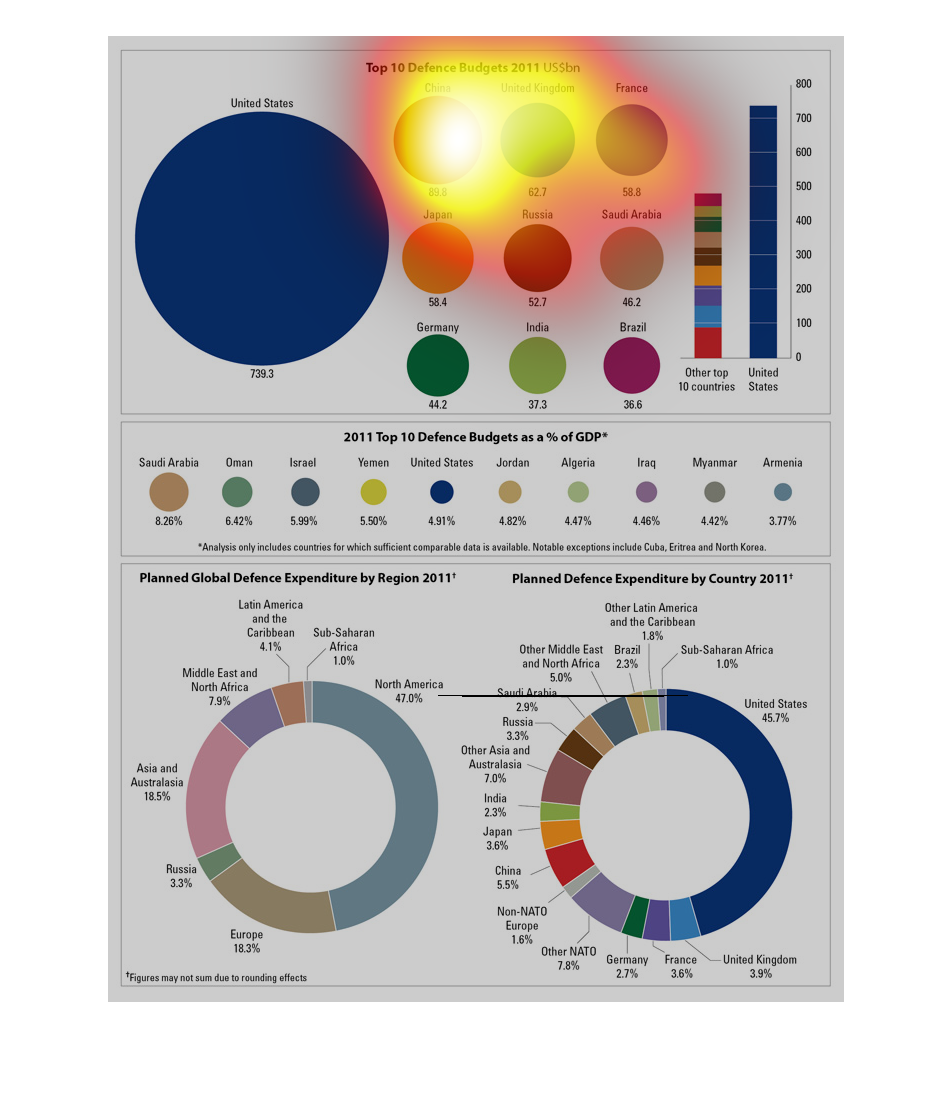
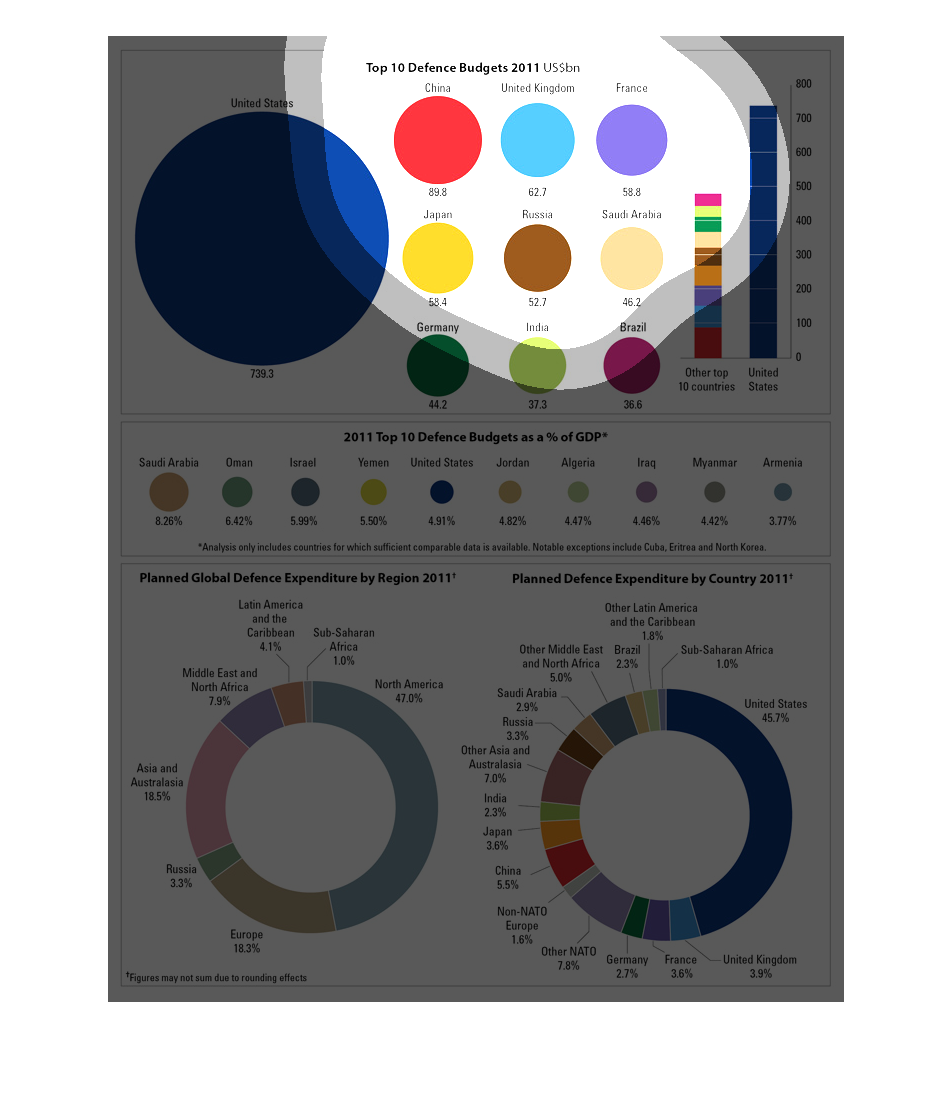
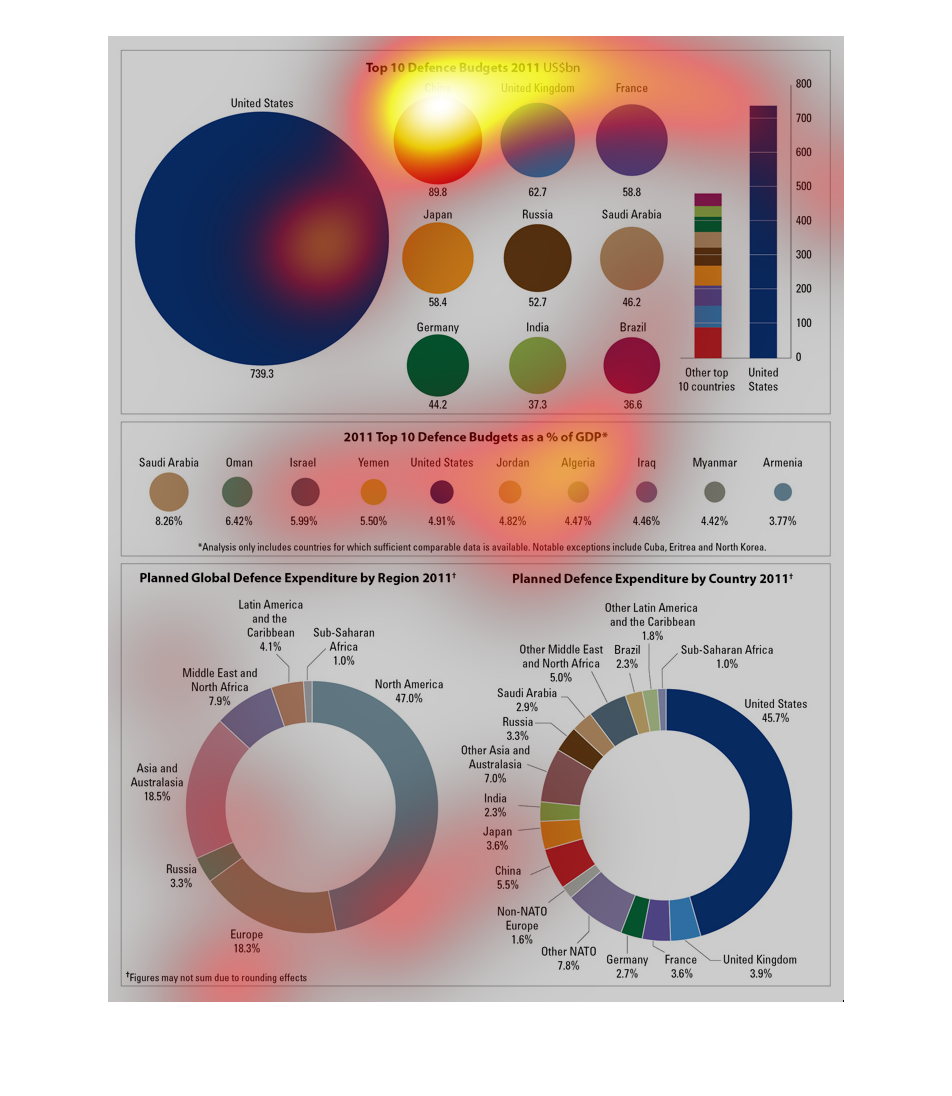
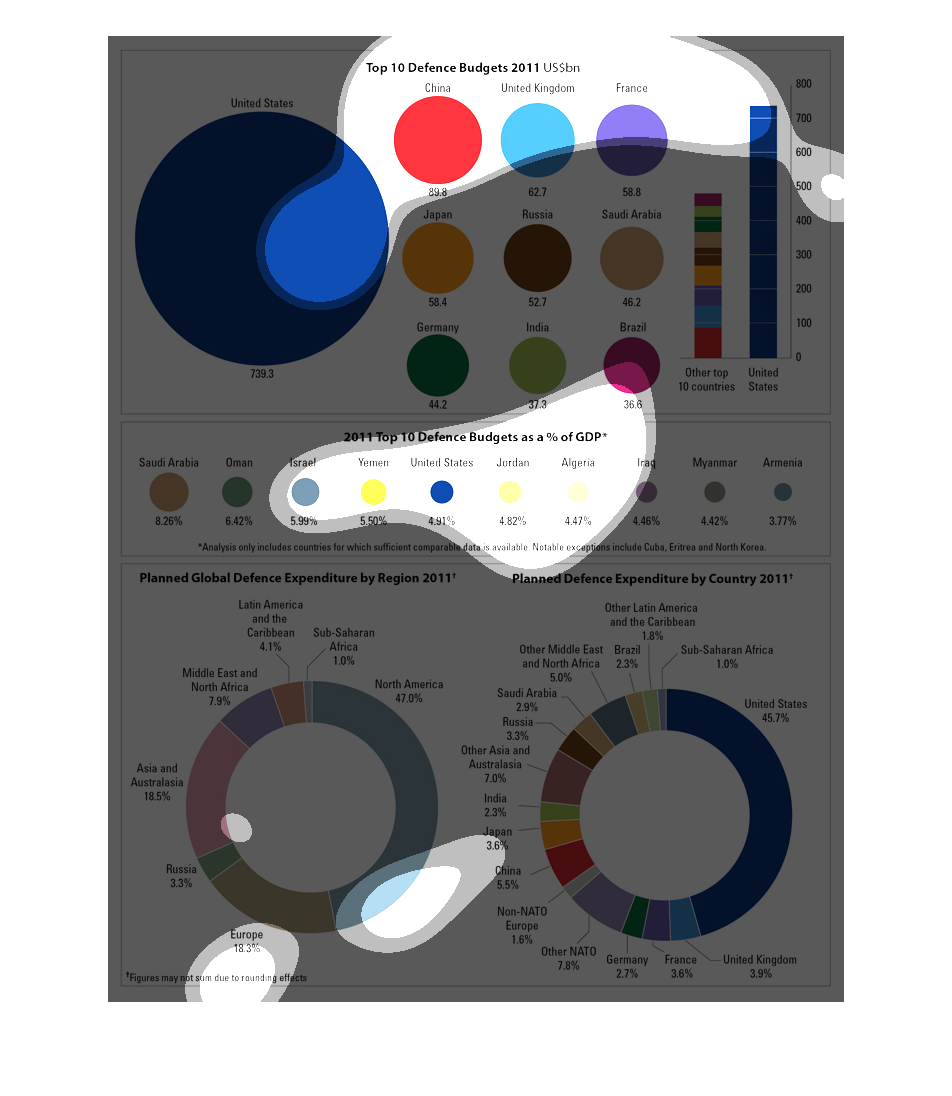
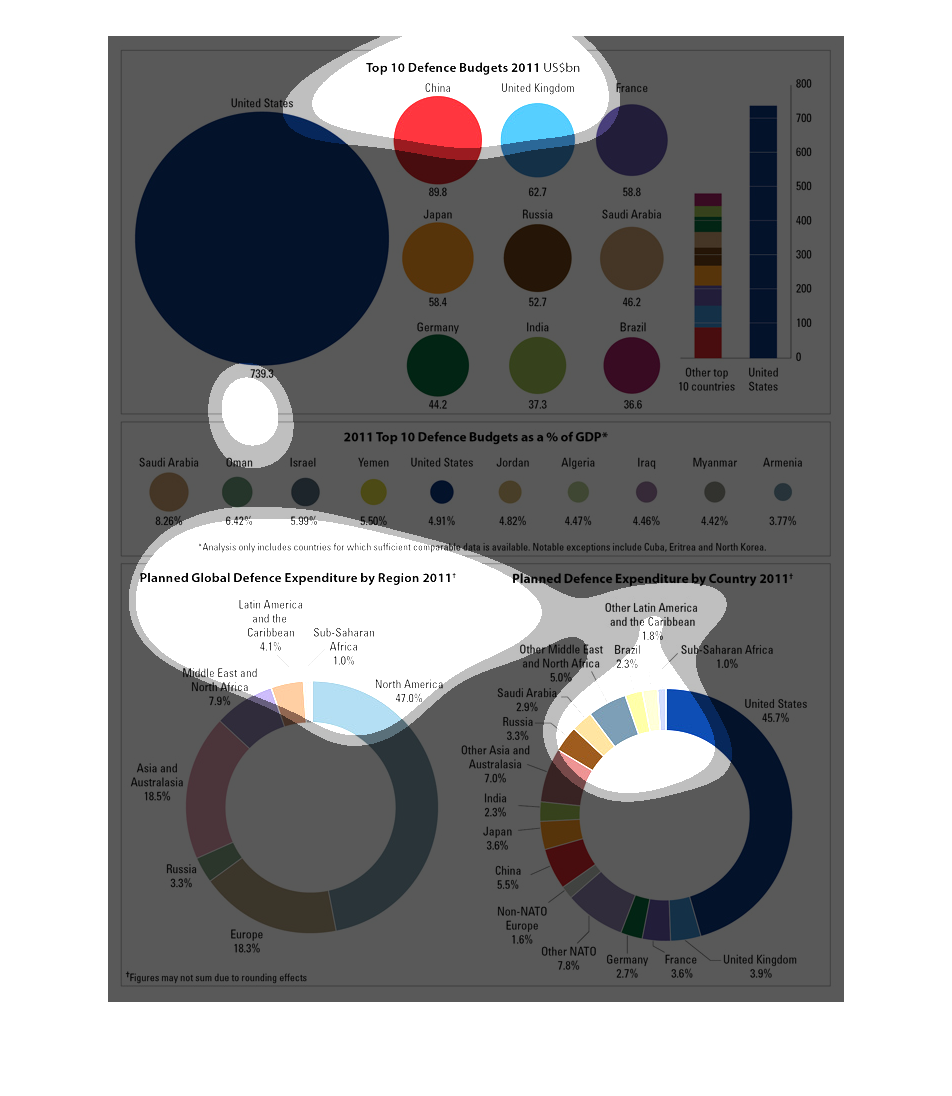
The image depicts the top ten defense budgets around the world, from data compiled in 2011.
The United states spends the most on defense, with China, United Kingdom and France following
closely behind in that order. The image also shows planned global defense expenditures by
region as well as by country in 2011. North America/United states takes the top spot with
highest expenditures.
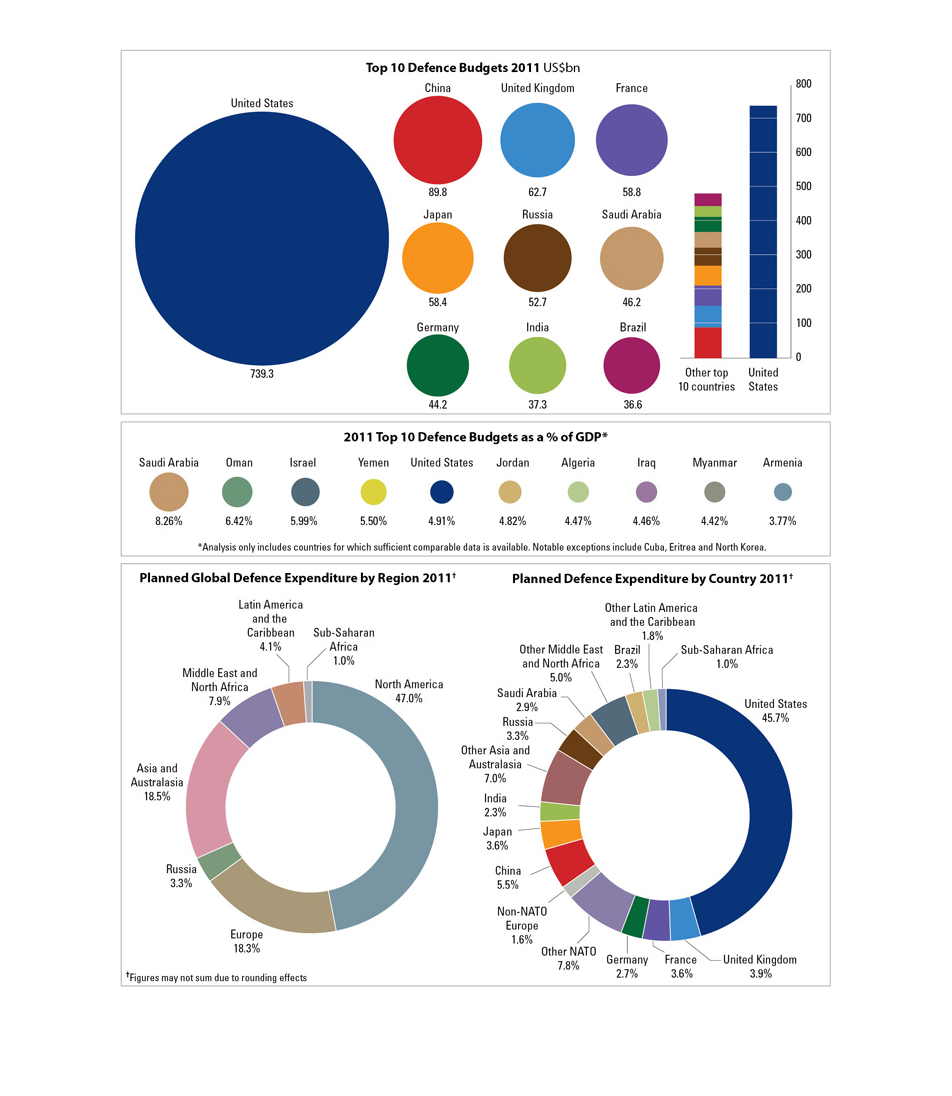
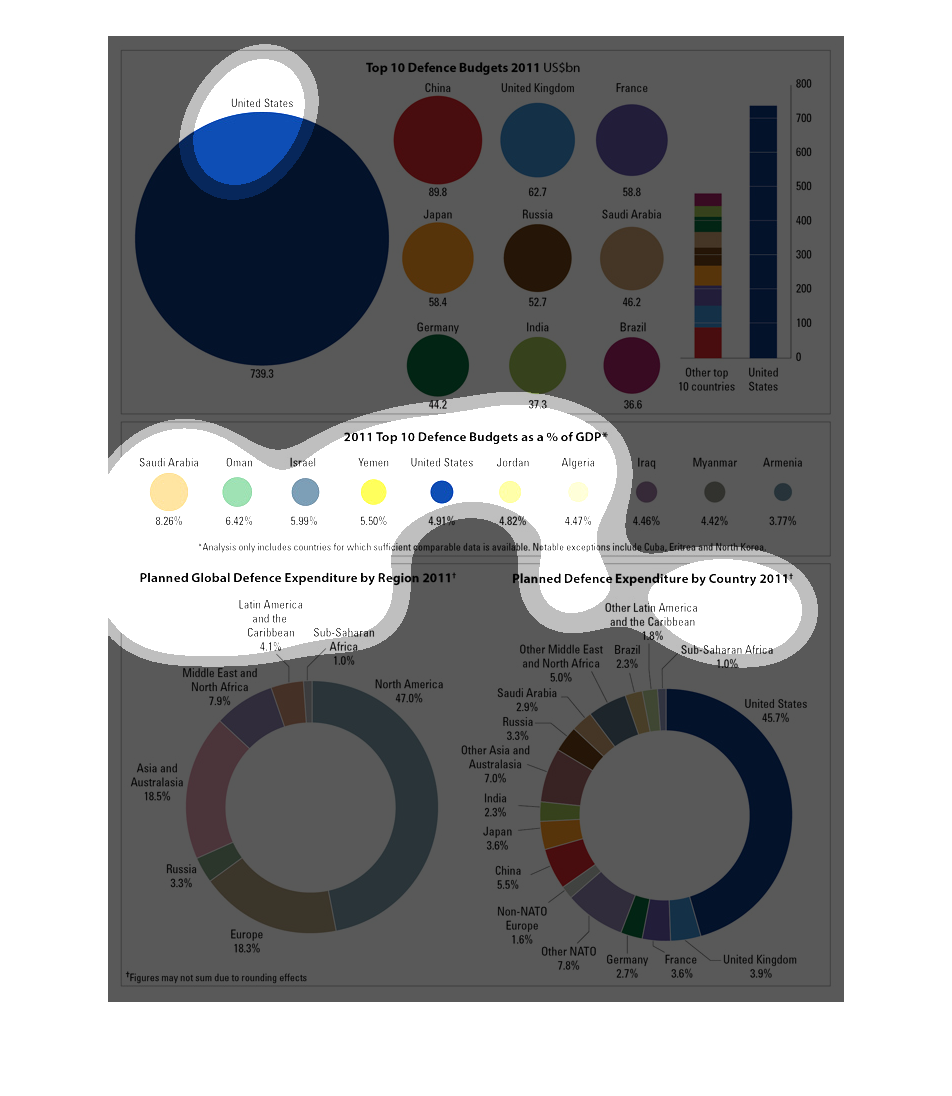
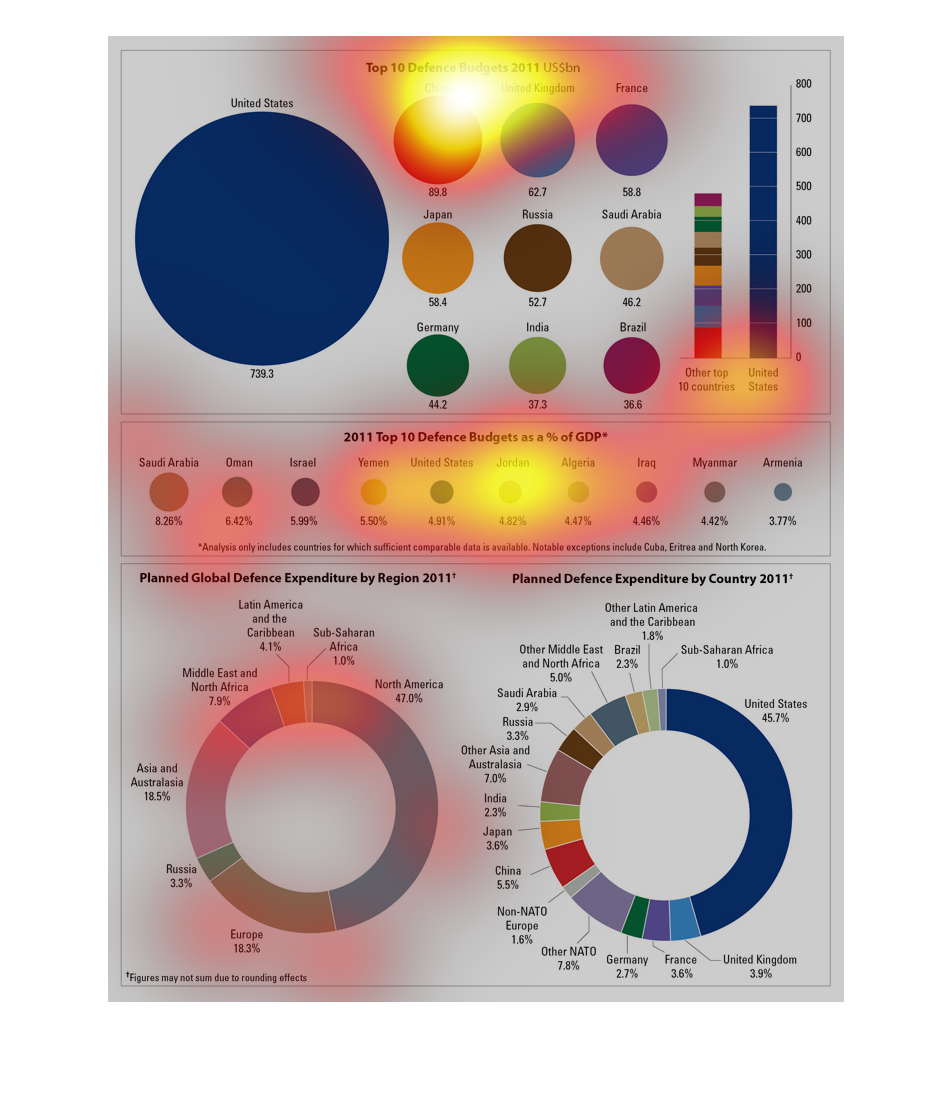
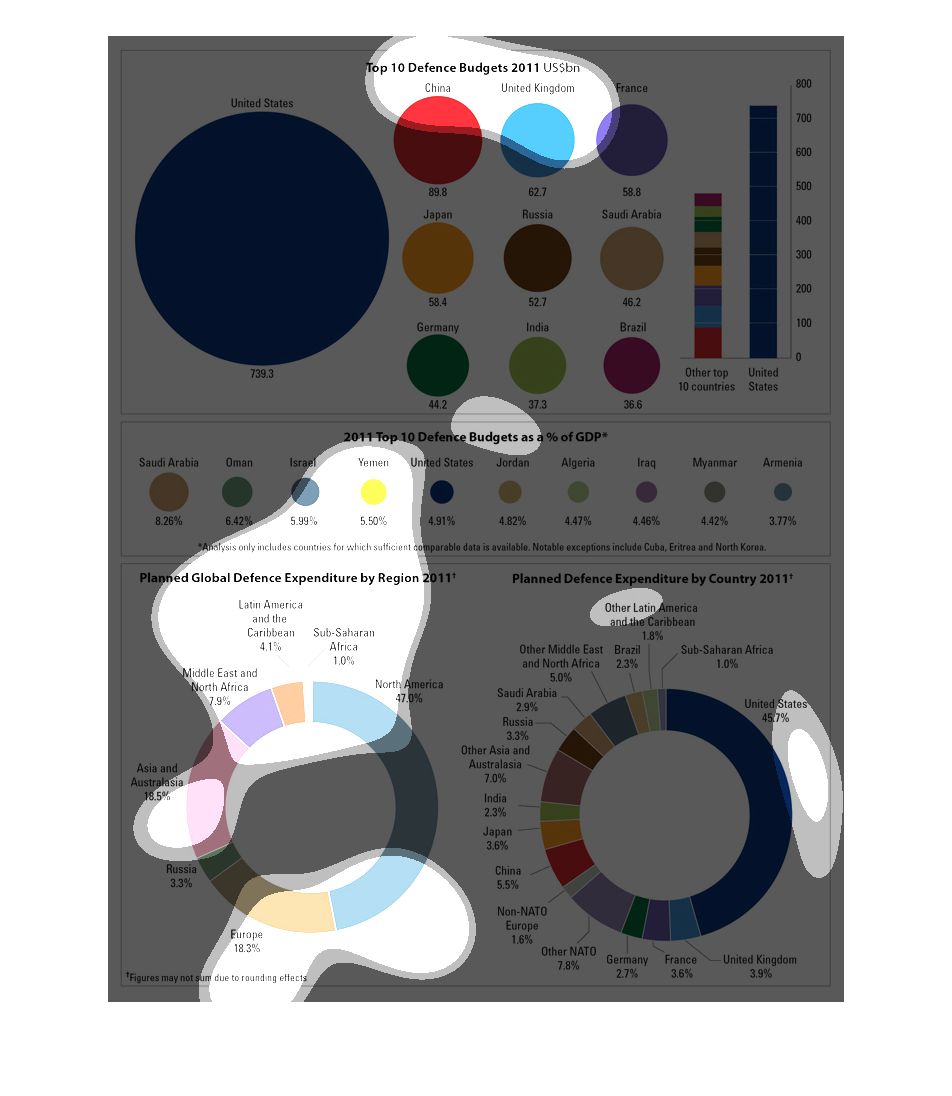
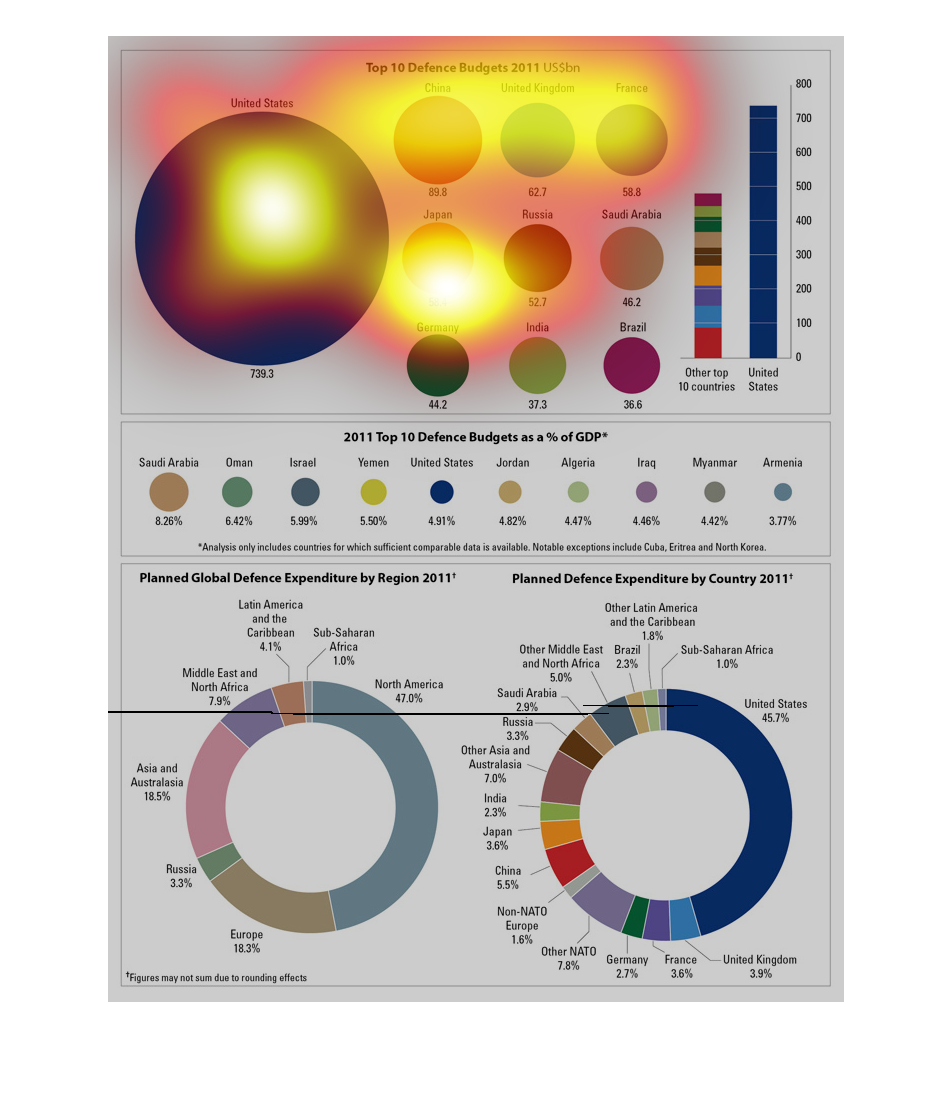
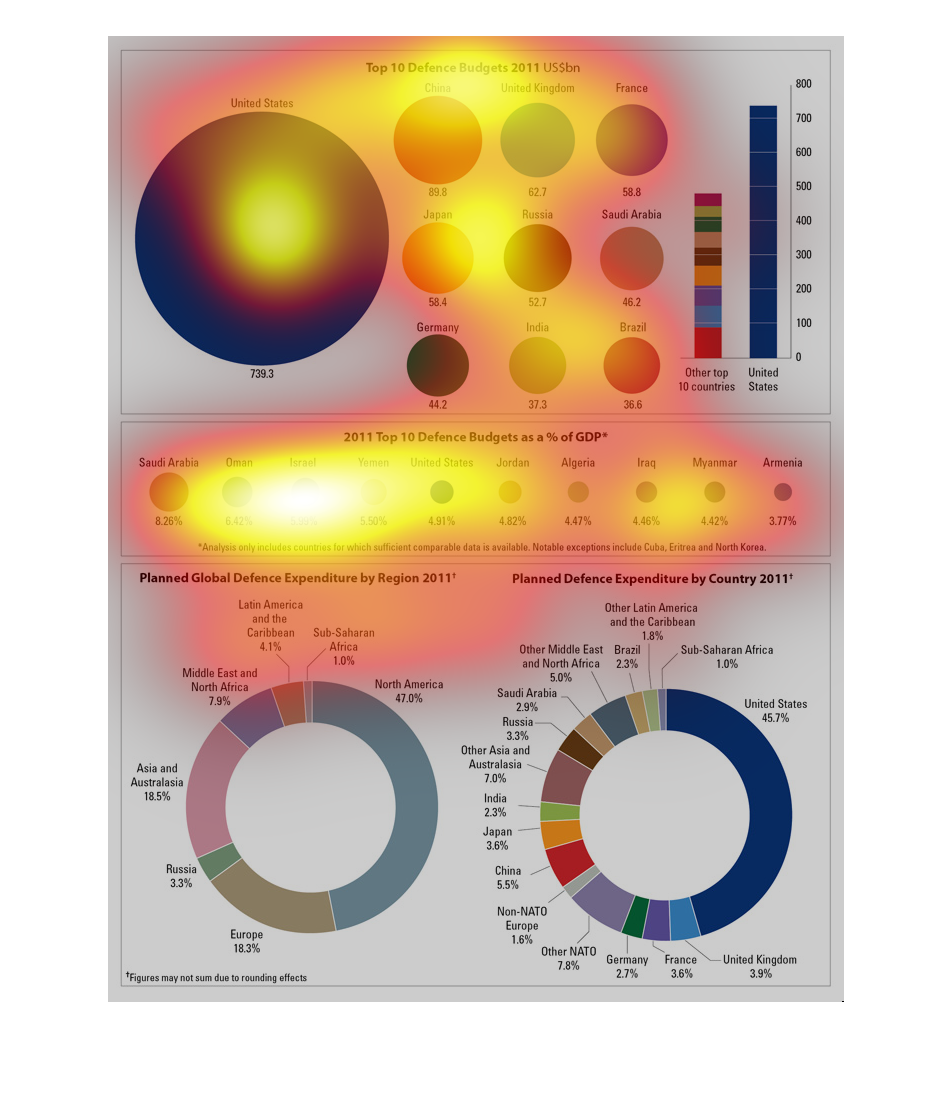
This graph shows the top 10 defense budgets in 2010 as a percentage of GDP with the United
States having the largest budget.  the bottom left has planned global defense expenditures
by region and bottom right shows the same by country
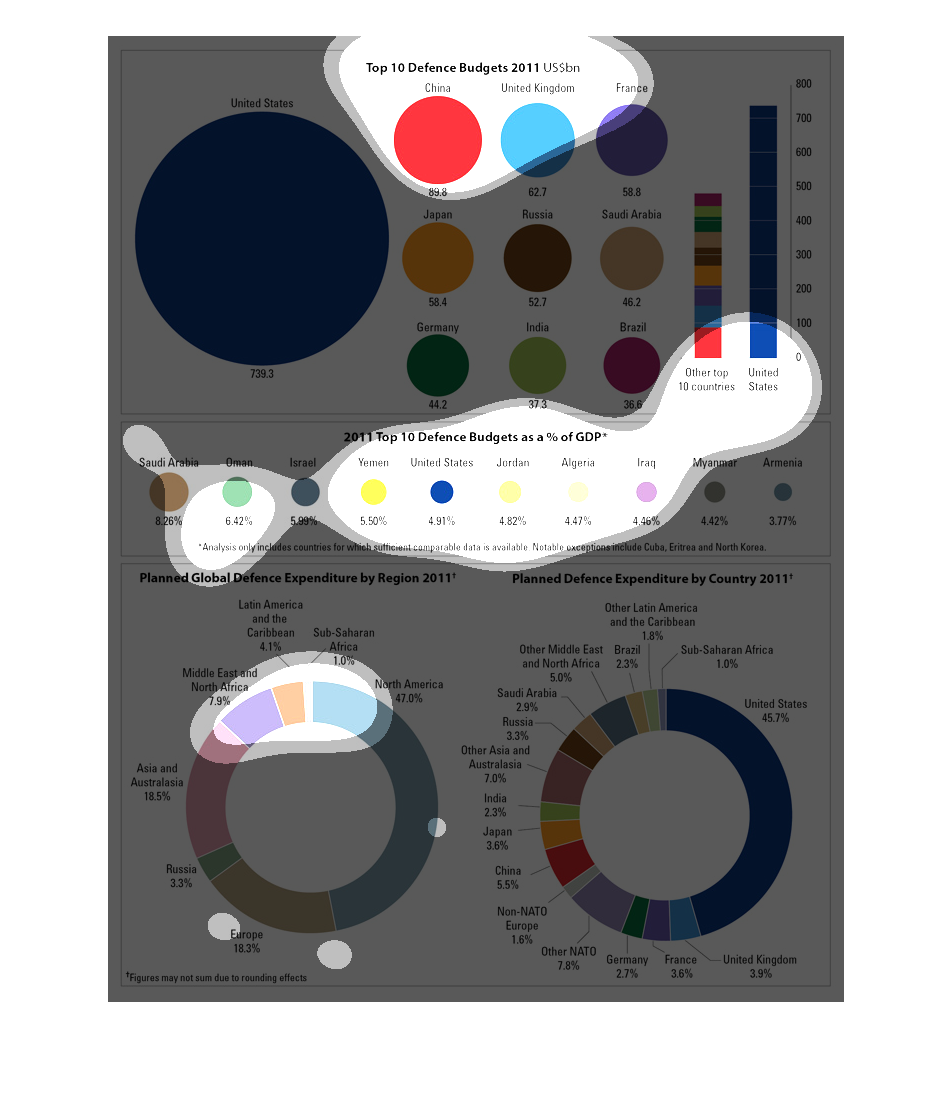
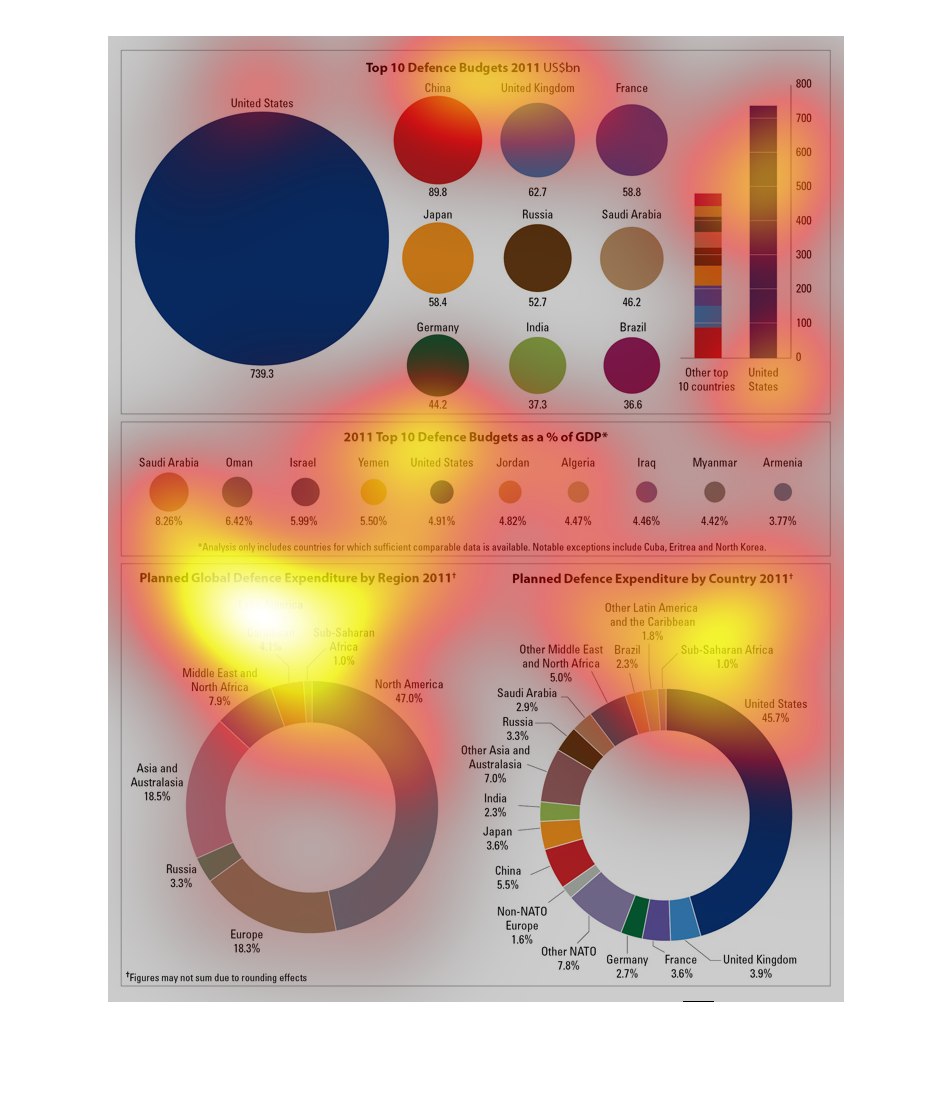
This chart describes and depicts ten of the most largest defense budgets on the planet. It
also gives the planned defense expenditure for the year two thousand and eleven.
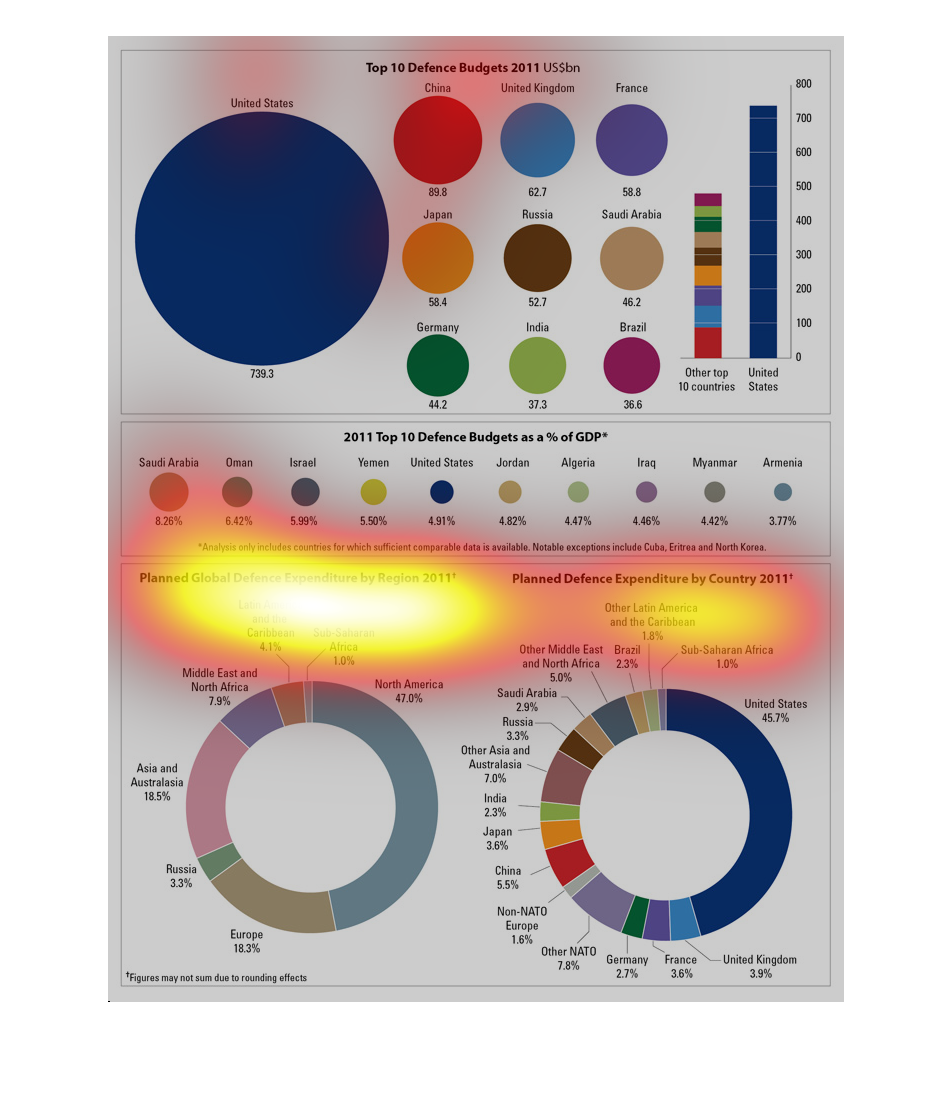
The graphs to the left describe a nations defense spending.  At the top it configures each
countries spending as a dollar amount.  With out a doubt the United States takes the lead
in this category.  Then in the middle of the graph it shows defense spending as a percentage
of GDP.  At the bottom of the graph it describes spending by continent.
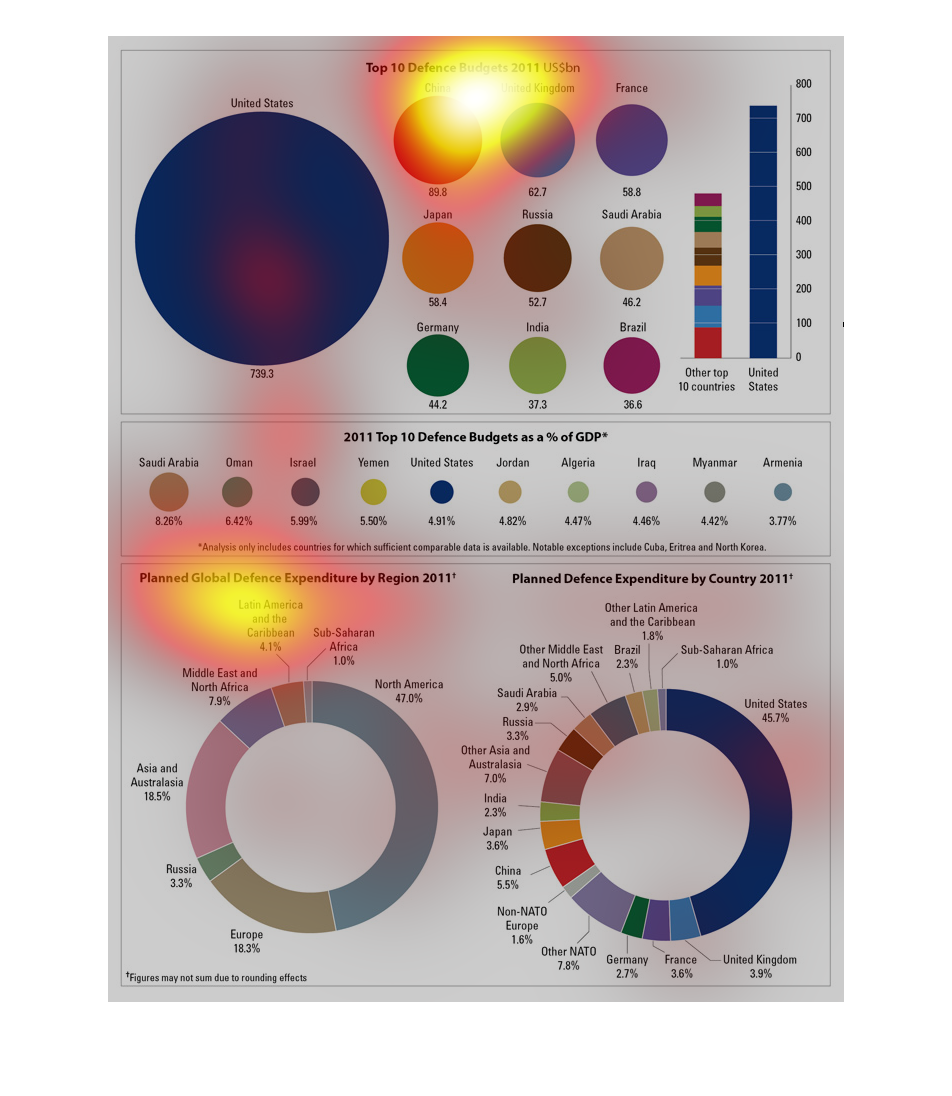
This is a graphic showing the relative sizes of the military budgets of several countries.
The military budget of the United States is greater than that the next ten countries combined,
which include China, Japan and Germany. In fact, the military budget of the United States
is almost half of the combined military budgets of all the countries of the world, combined.
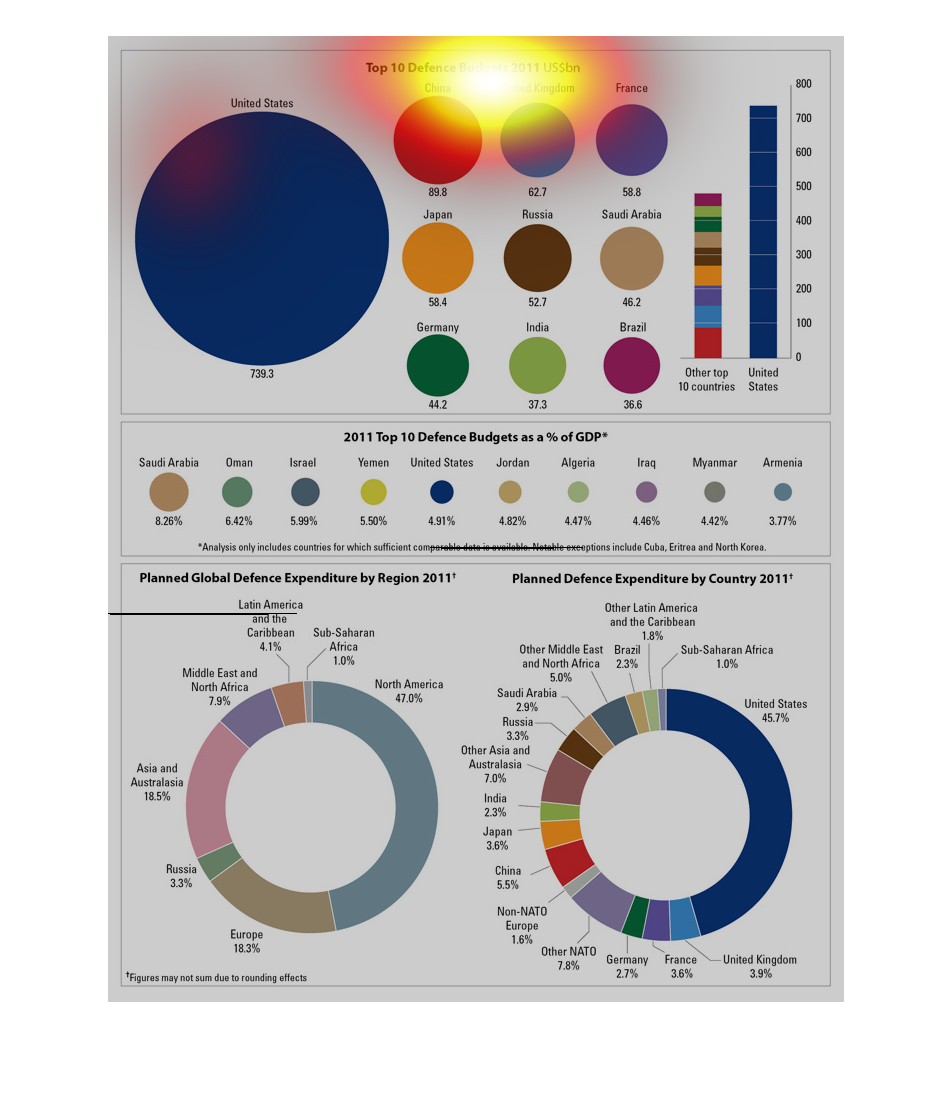
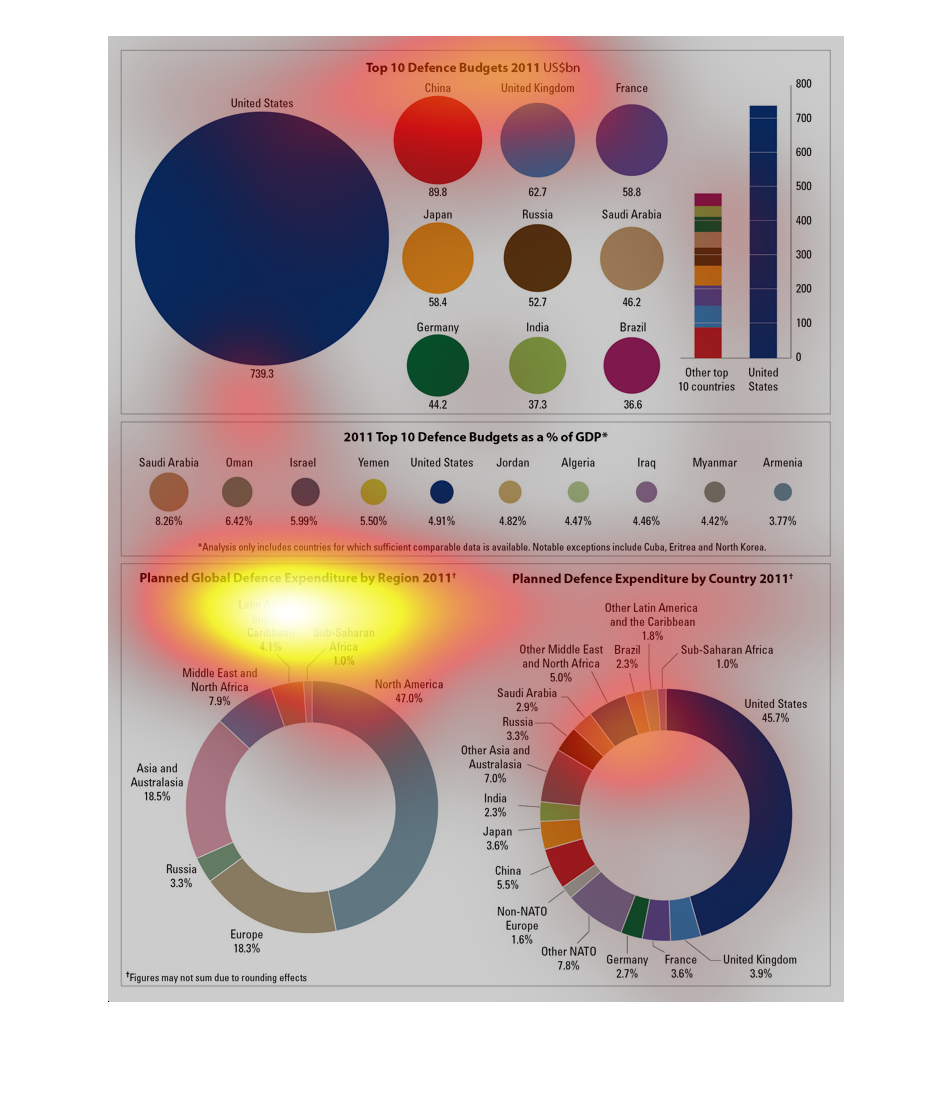
This image shows how much money is spent on military funding throughout the world based on
a regionally global map.  The largest being North America, due to the United States spending
habits.
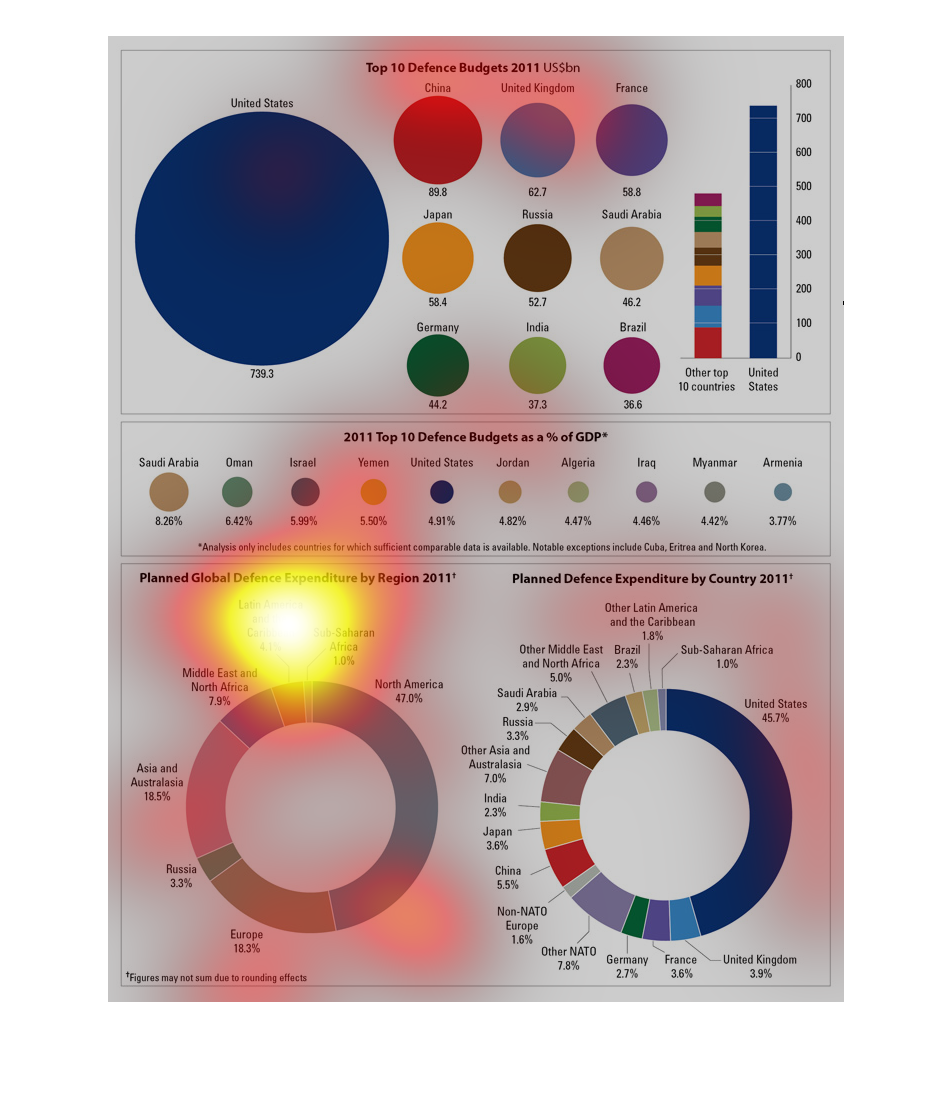
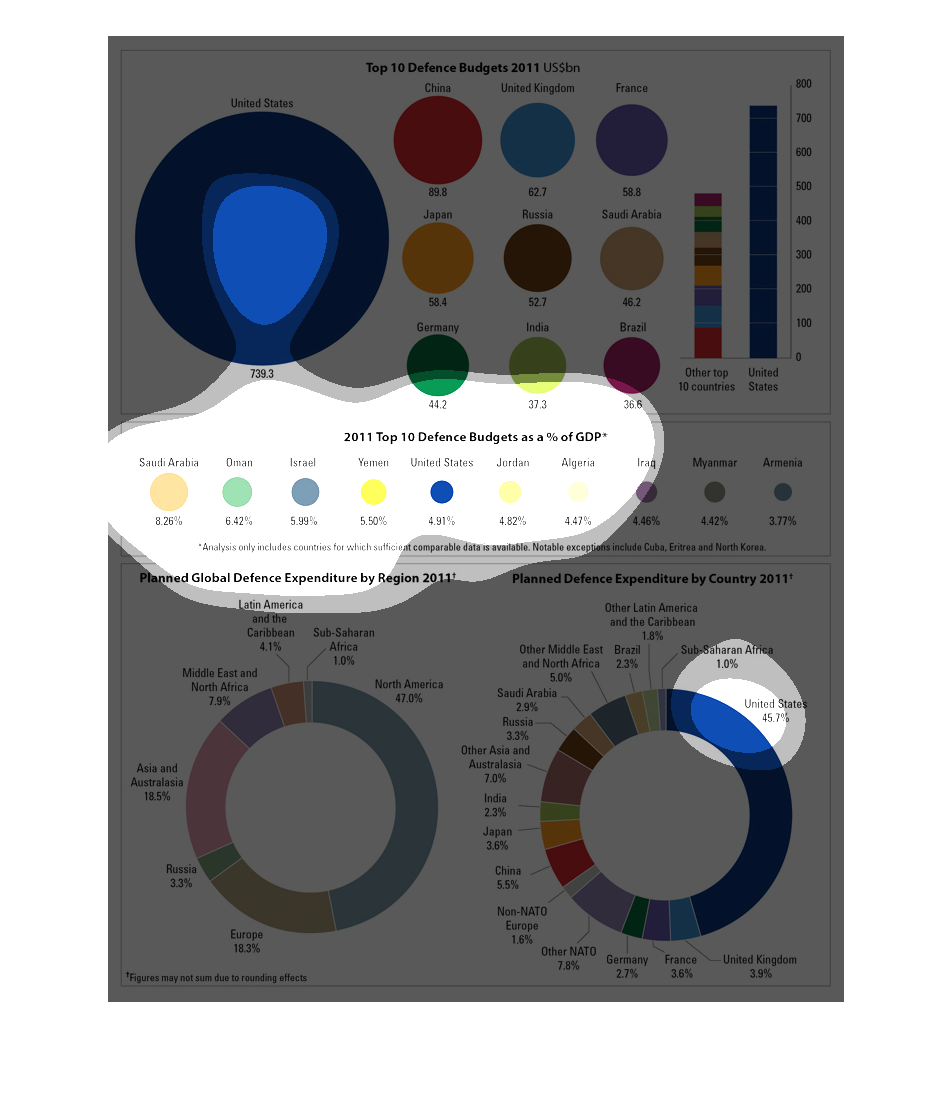
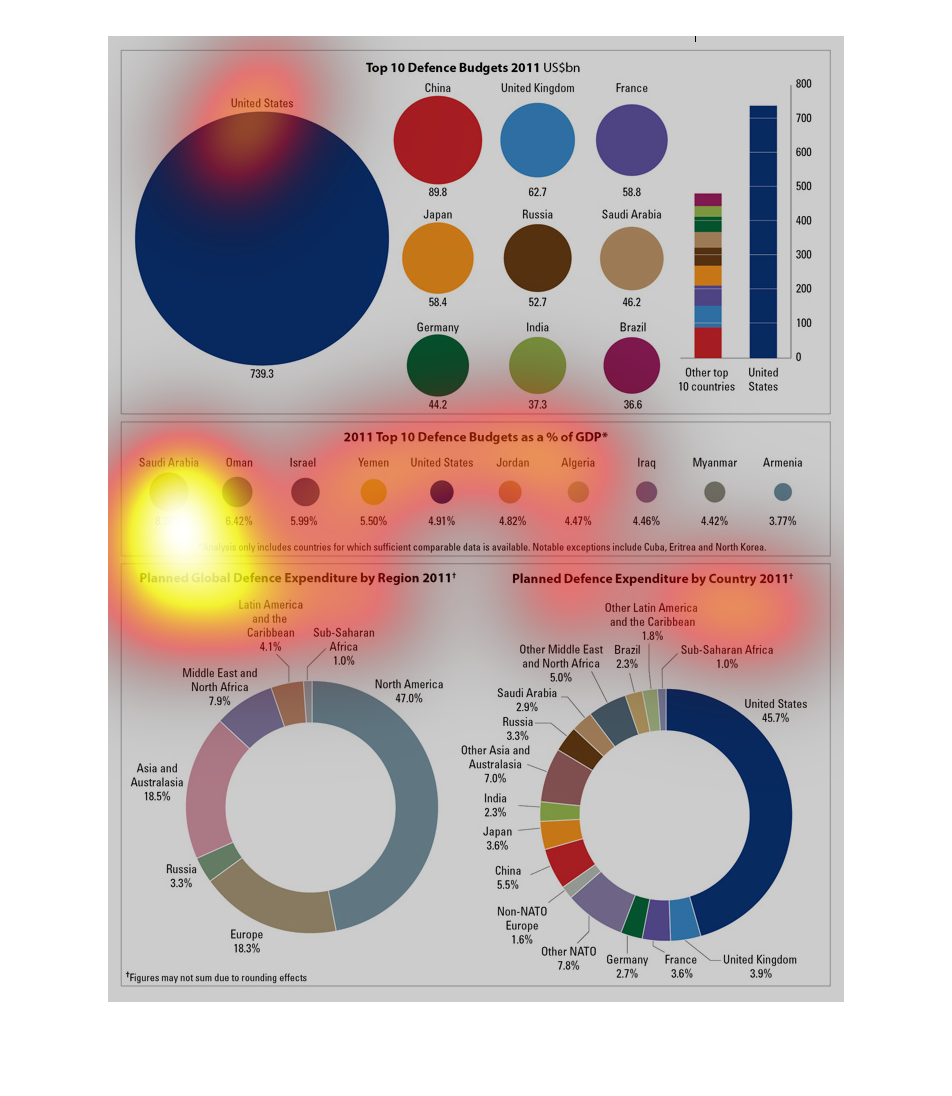
At the top of the graphic, the top 10 defense budgets are displayed as circles of varying
sizes with the United States' circle being the largest. On the right, the US's Defense budget
is compared directly with many other countries, revealing that it is much higher than all
others put together. Toward the middle is another set of circles depicting the Defense Budgets
as a percent of the GDP. This time Saudi Arabia has the biggest circle. Below this and on
the left is a circular graph depicting the Planned Global Defense Expenditure by Region 2011.
North America was the largest portion with 42.8%. To the right of this is another circle graph
on the Planned Defense Expenditure by country. The United States was the largest portion at
45.7%. Overall this gives various looks at the defense budgets and expenditures throughout
the world, most of which is topped by the US.
This is a graph that shows the top ten defense budgets for different countries around the
world.  Each colored circle represents a different country and the dollar amount that each
country has for defense.
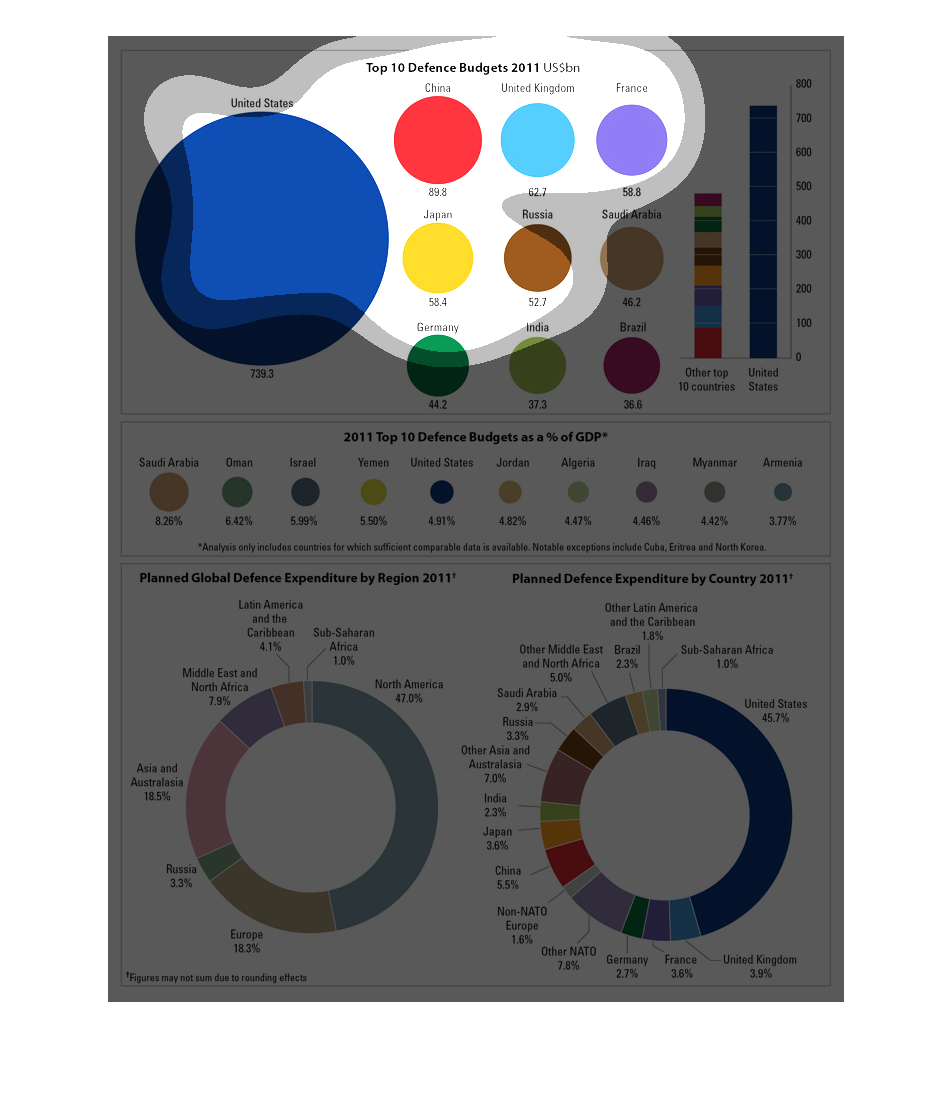
This chart is the representation of the top ten defense budgets from 2011.  It has statistics
and data from many of the different countries around the world.
This chart describes the top ten defense budgets for the year 2011. Countries on the chart
include Russia, Japan, France, the united Kingdom, and China.
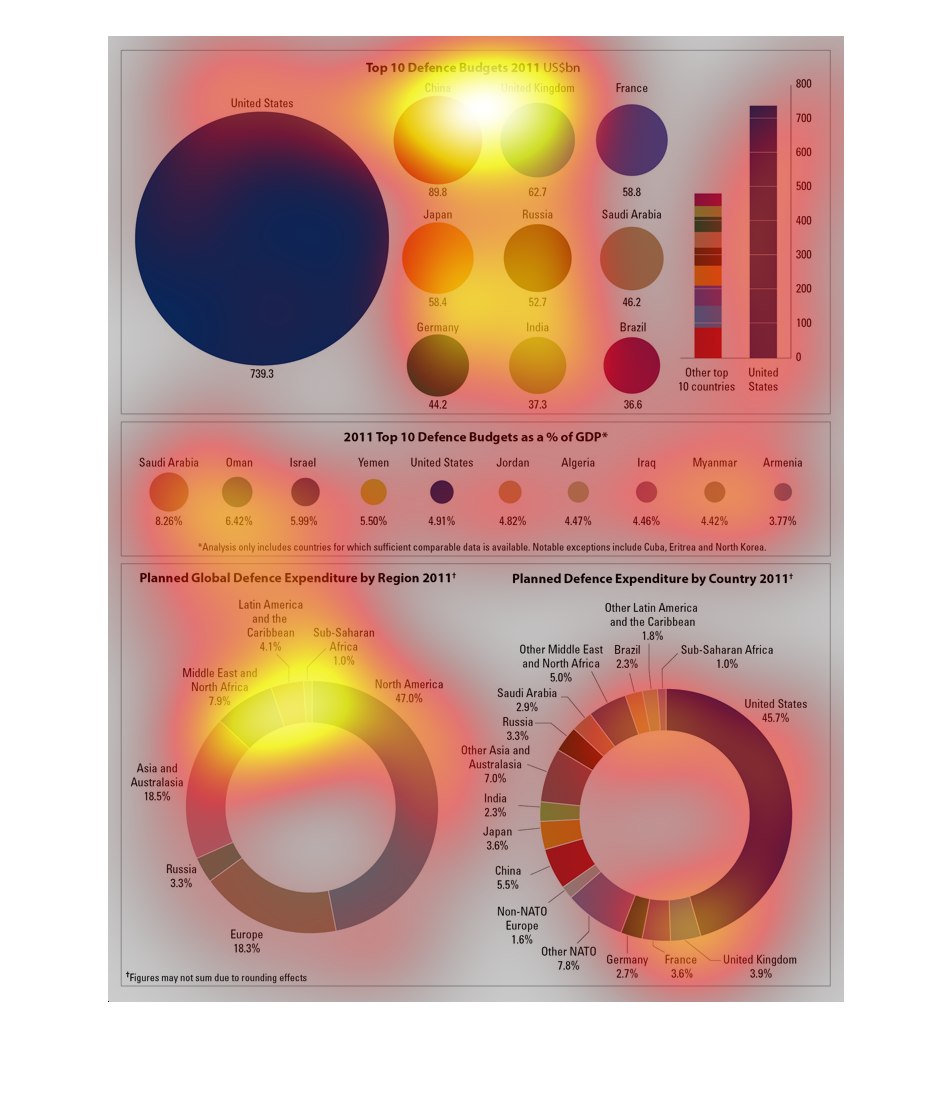
It is important to stick to a budget, and how more important if its a national one? This illustration
showcases how every single cost in tallied up to secure a prosperous financial future.
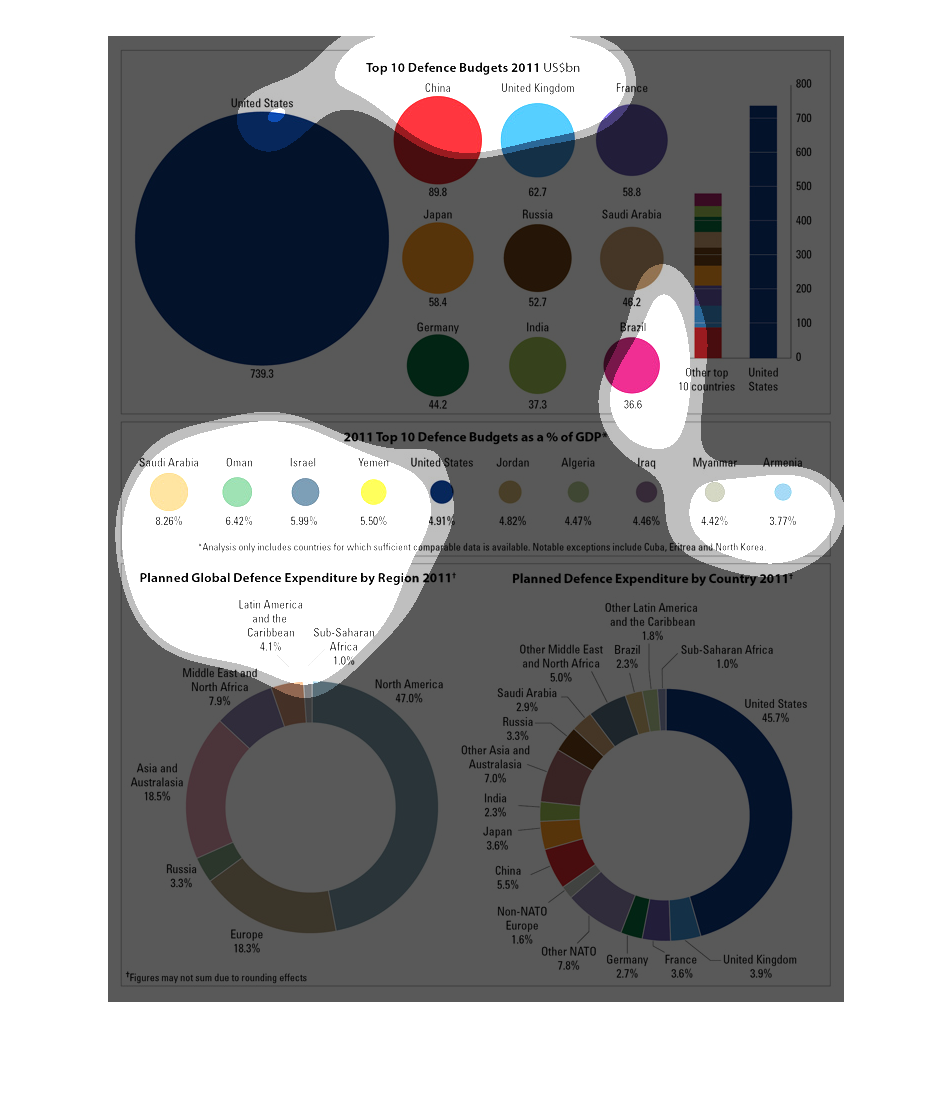
The following chart gives the top 10 countries in regards to military spending. It also breaks
the data down into military spending as a percentage of GDP.
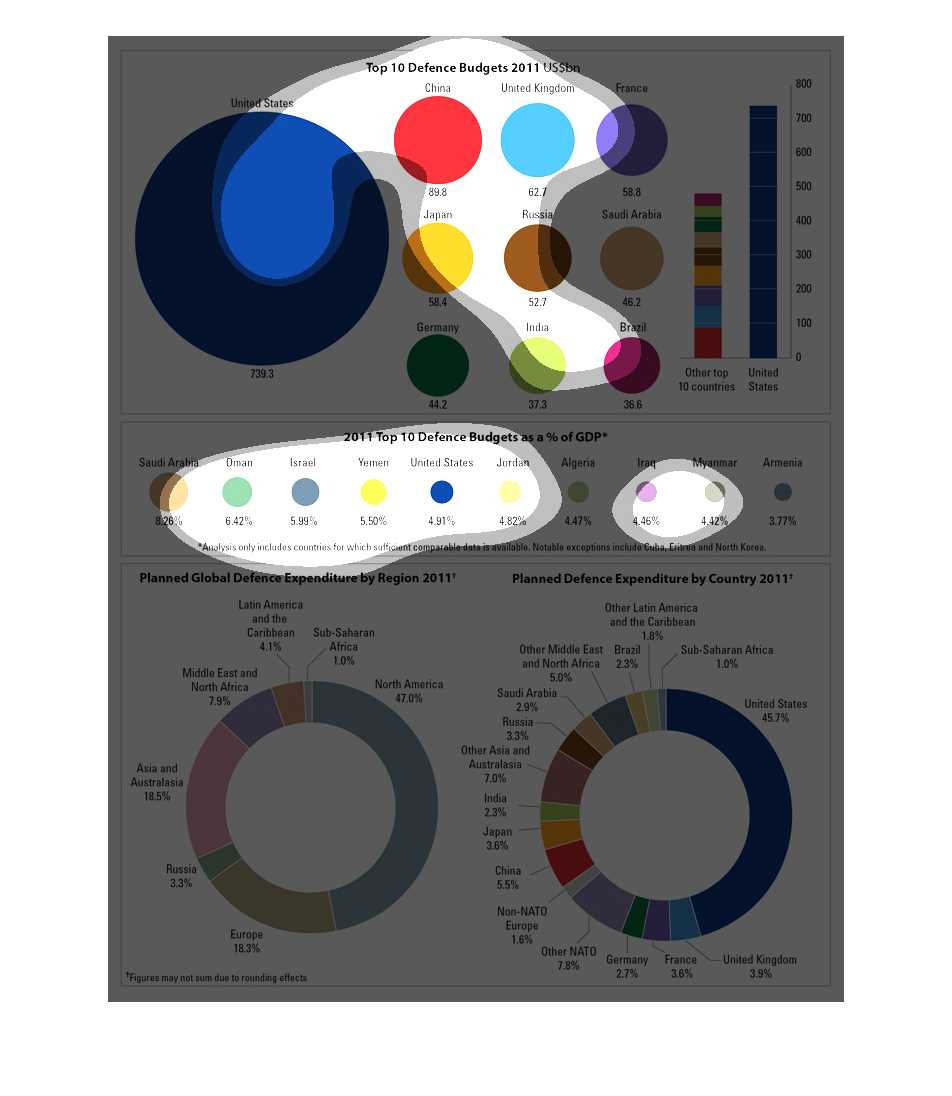
This image describes the top defense budgets of 2011. Each top 10 country is represented by
a colored circle relative to the size of its budget with the US being the largest by far.
The two graphs on the bottom describe Planned Global Defense Expenditure by Region and Planned
Global Defense Expenditure by Country.
This chart is the 10 top defense budgets in 2011. The countries are made up of brightly colored
circles. With America at the highest. And Brazil is the lowest.
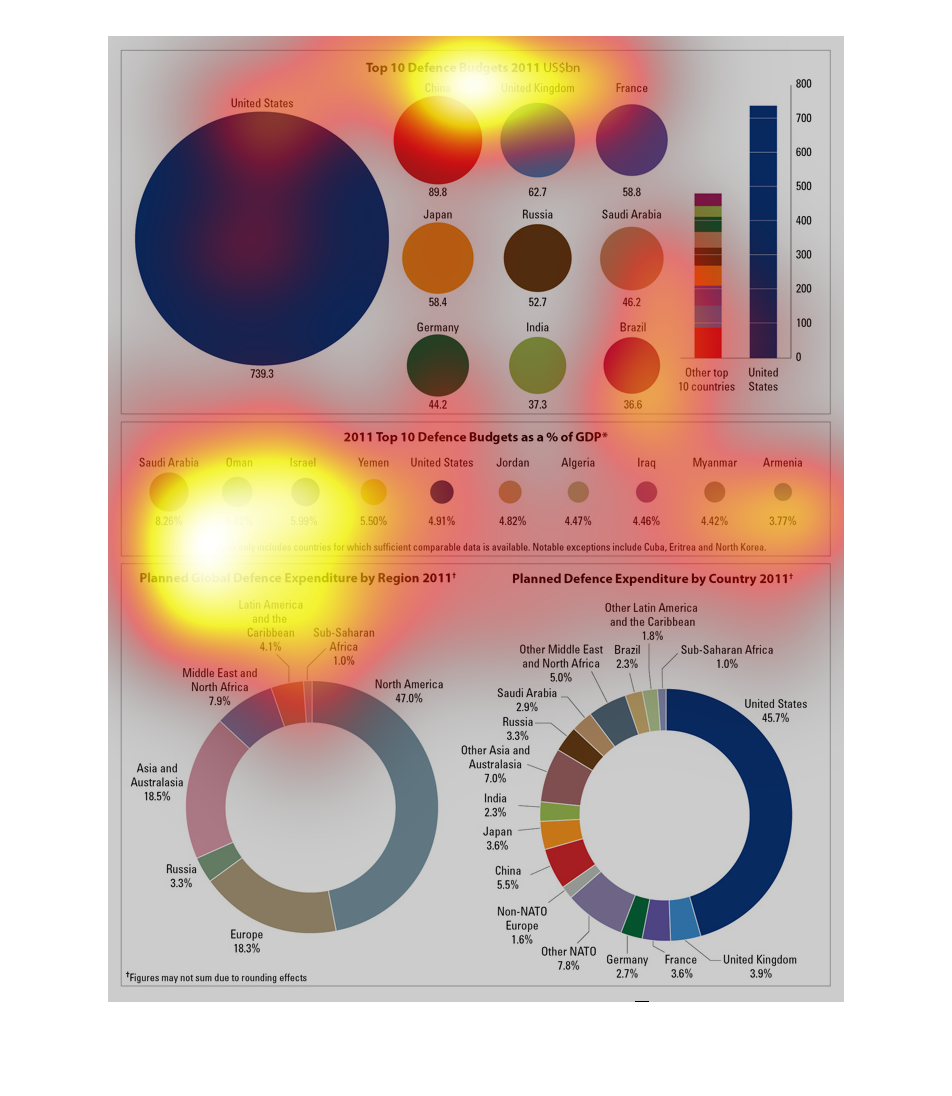
This chart depicts the relative defense expenditures of various countries.  The top part of
the chart provides examples of nations' defense spending as function of their respective GDP.
 The bottom part accumulates the data, and shows the defense spending by world region, and
nations' share of the total defense spending in the world.