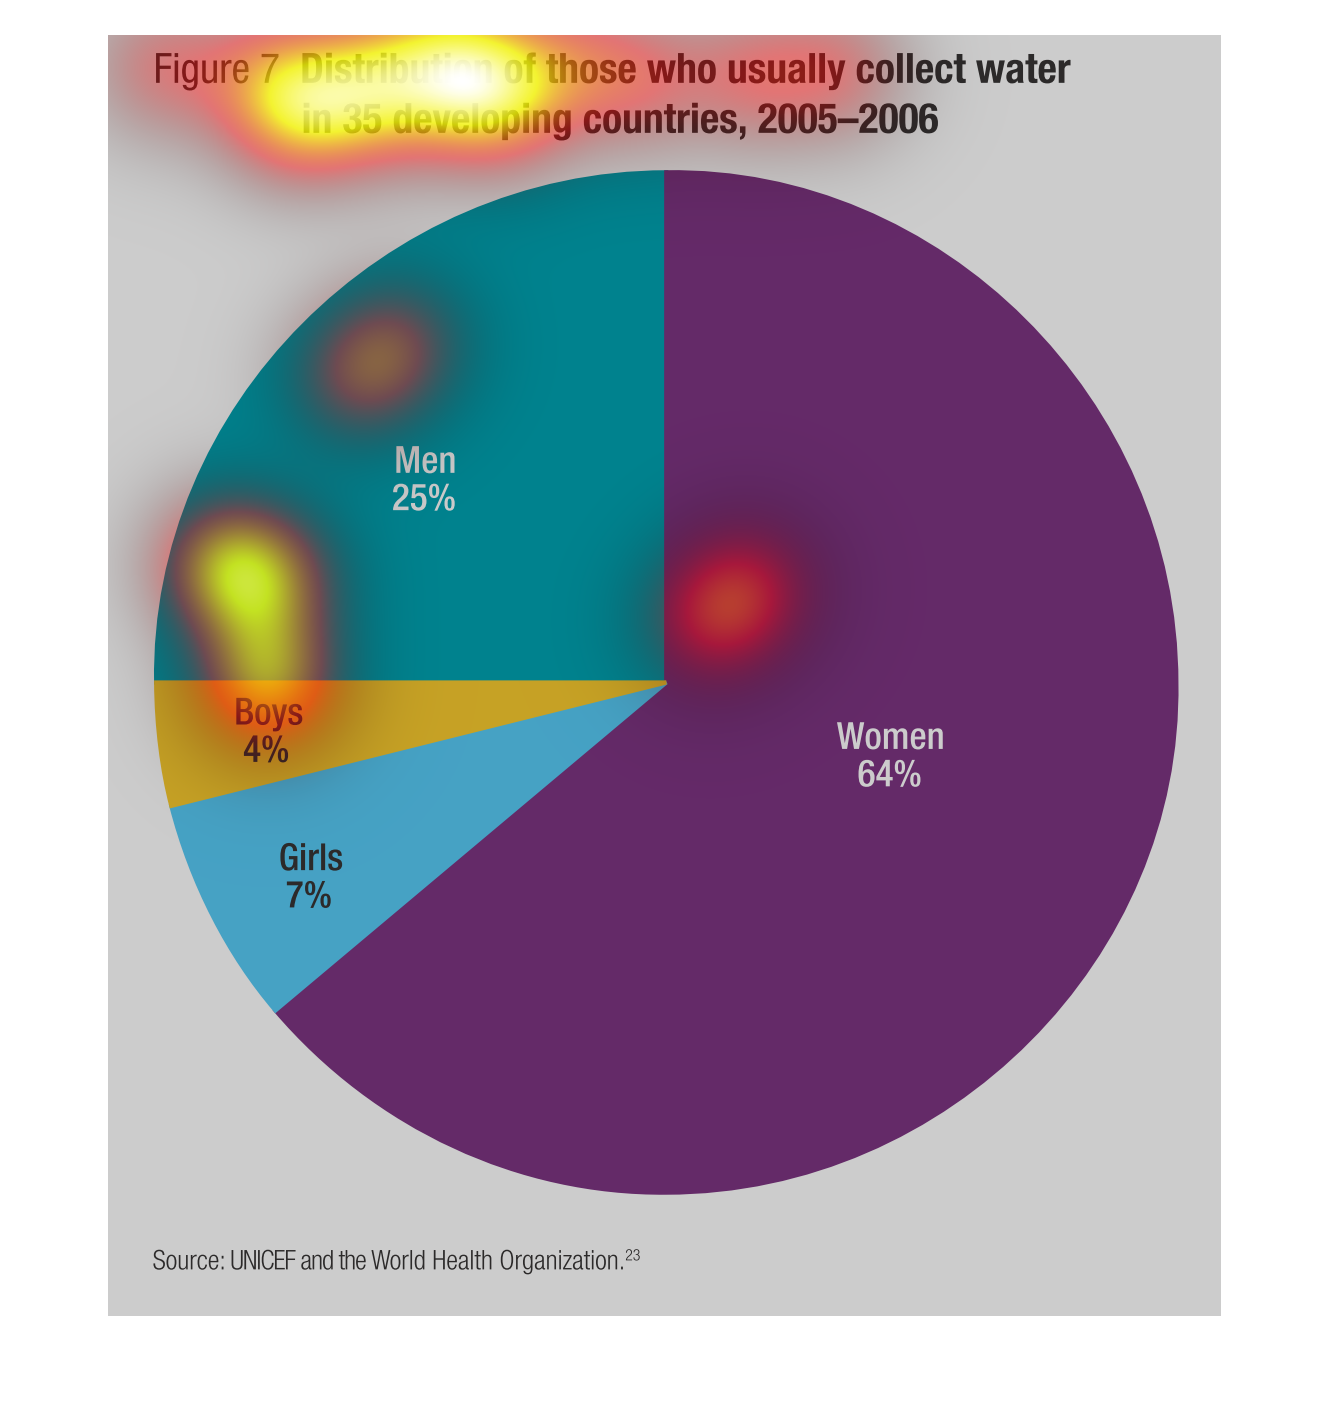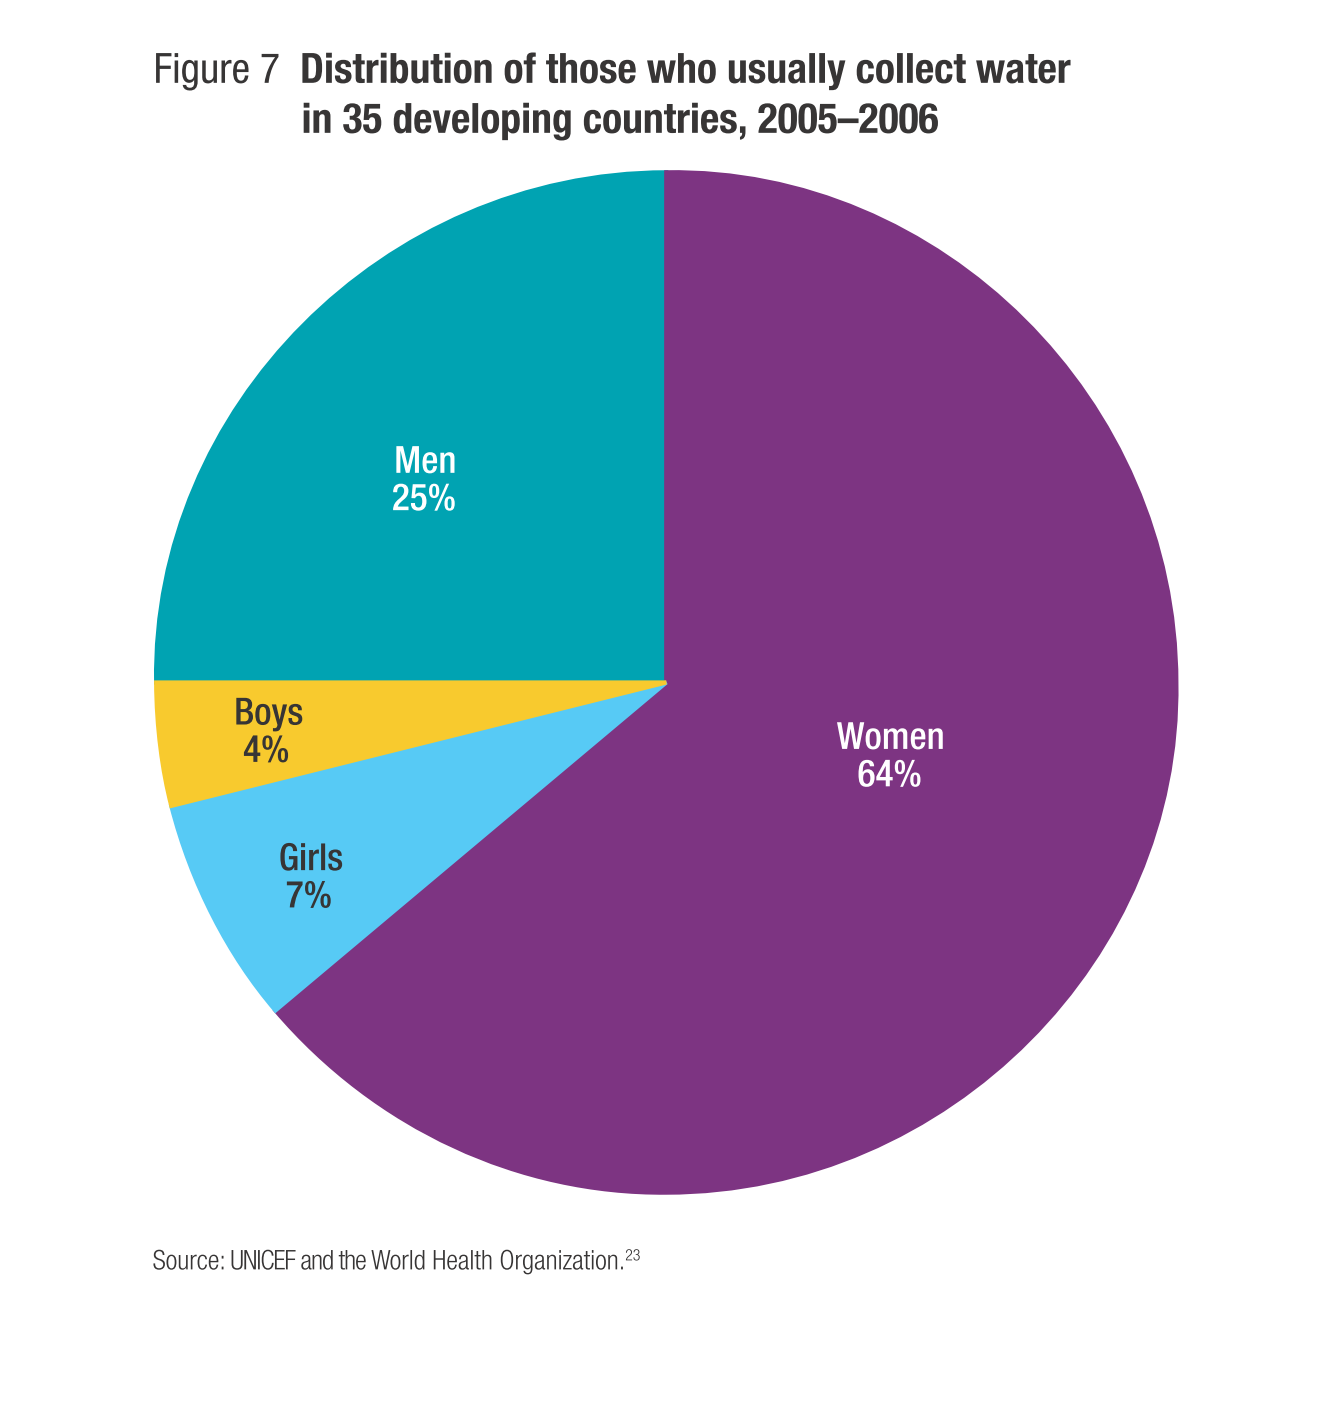
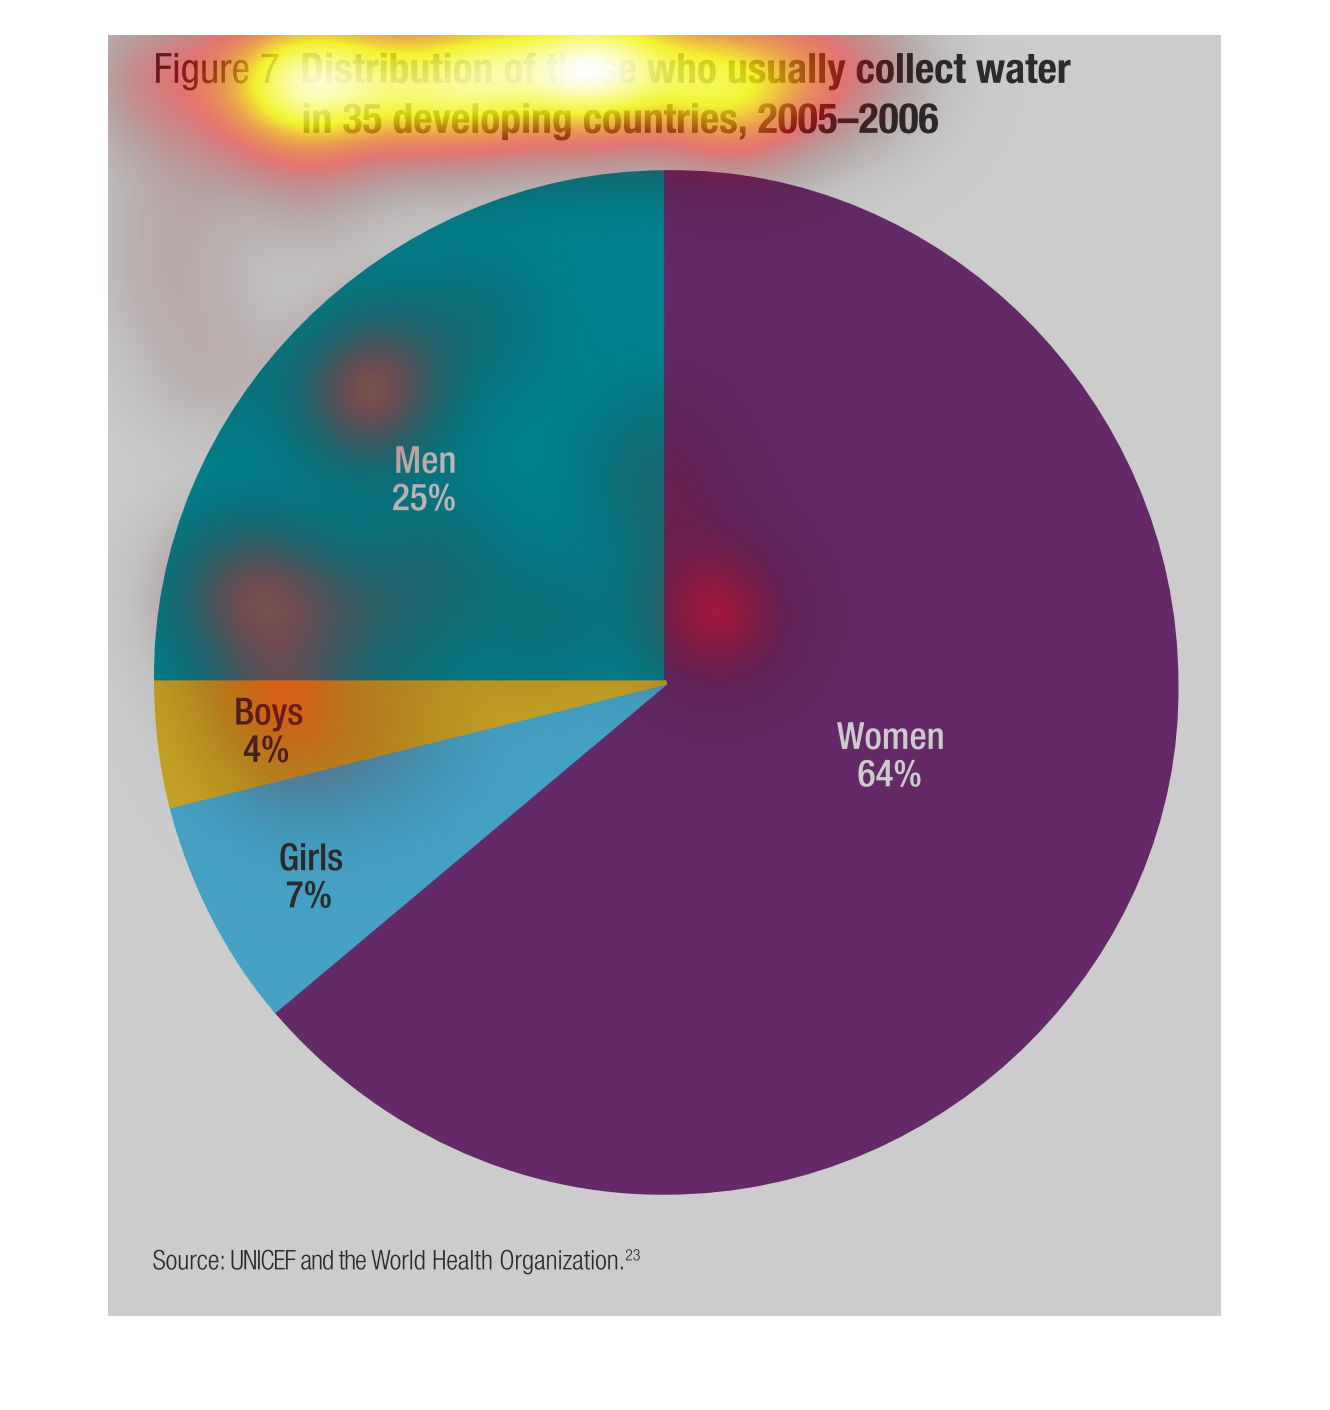
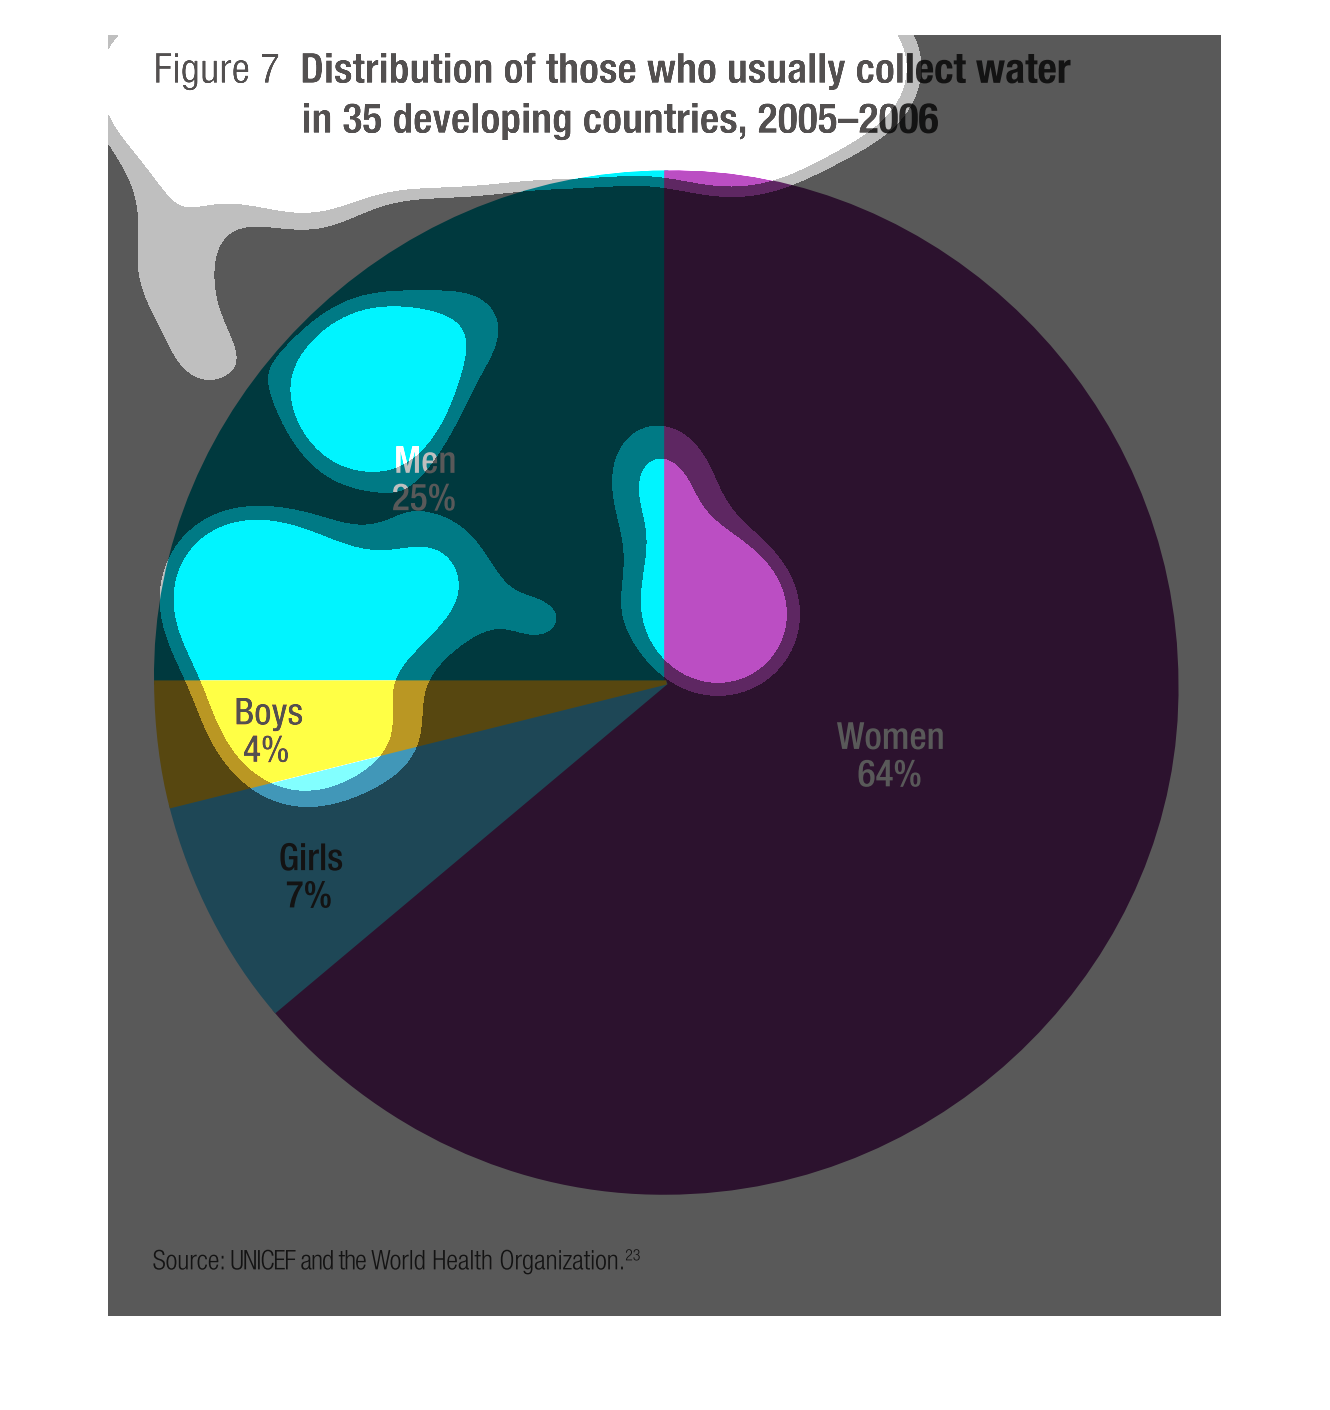
This chart describes and depicts the distribution of those who usually collect water in thirty-five
different and developing countries from 2005 to 2006.


The following chart depicts on average in developing countries what gender and what age of
the gender collects water for use. In most developing countries Women are the primary ones
to collect water.
This pie chart is comparing men boys girls and women on a health topic. You can't tell what
the topic is without the key. Women have the highest percentage of this health problems
This pie chart shows the "Distribution of those who usually collect water in 35 developing
countries from 2005-2006. 25% were men,4% were boys, 7% were girls, and 64% were women. This
was done by UNICEF and WHO
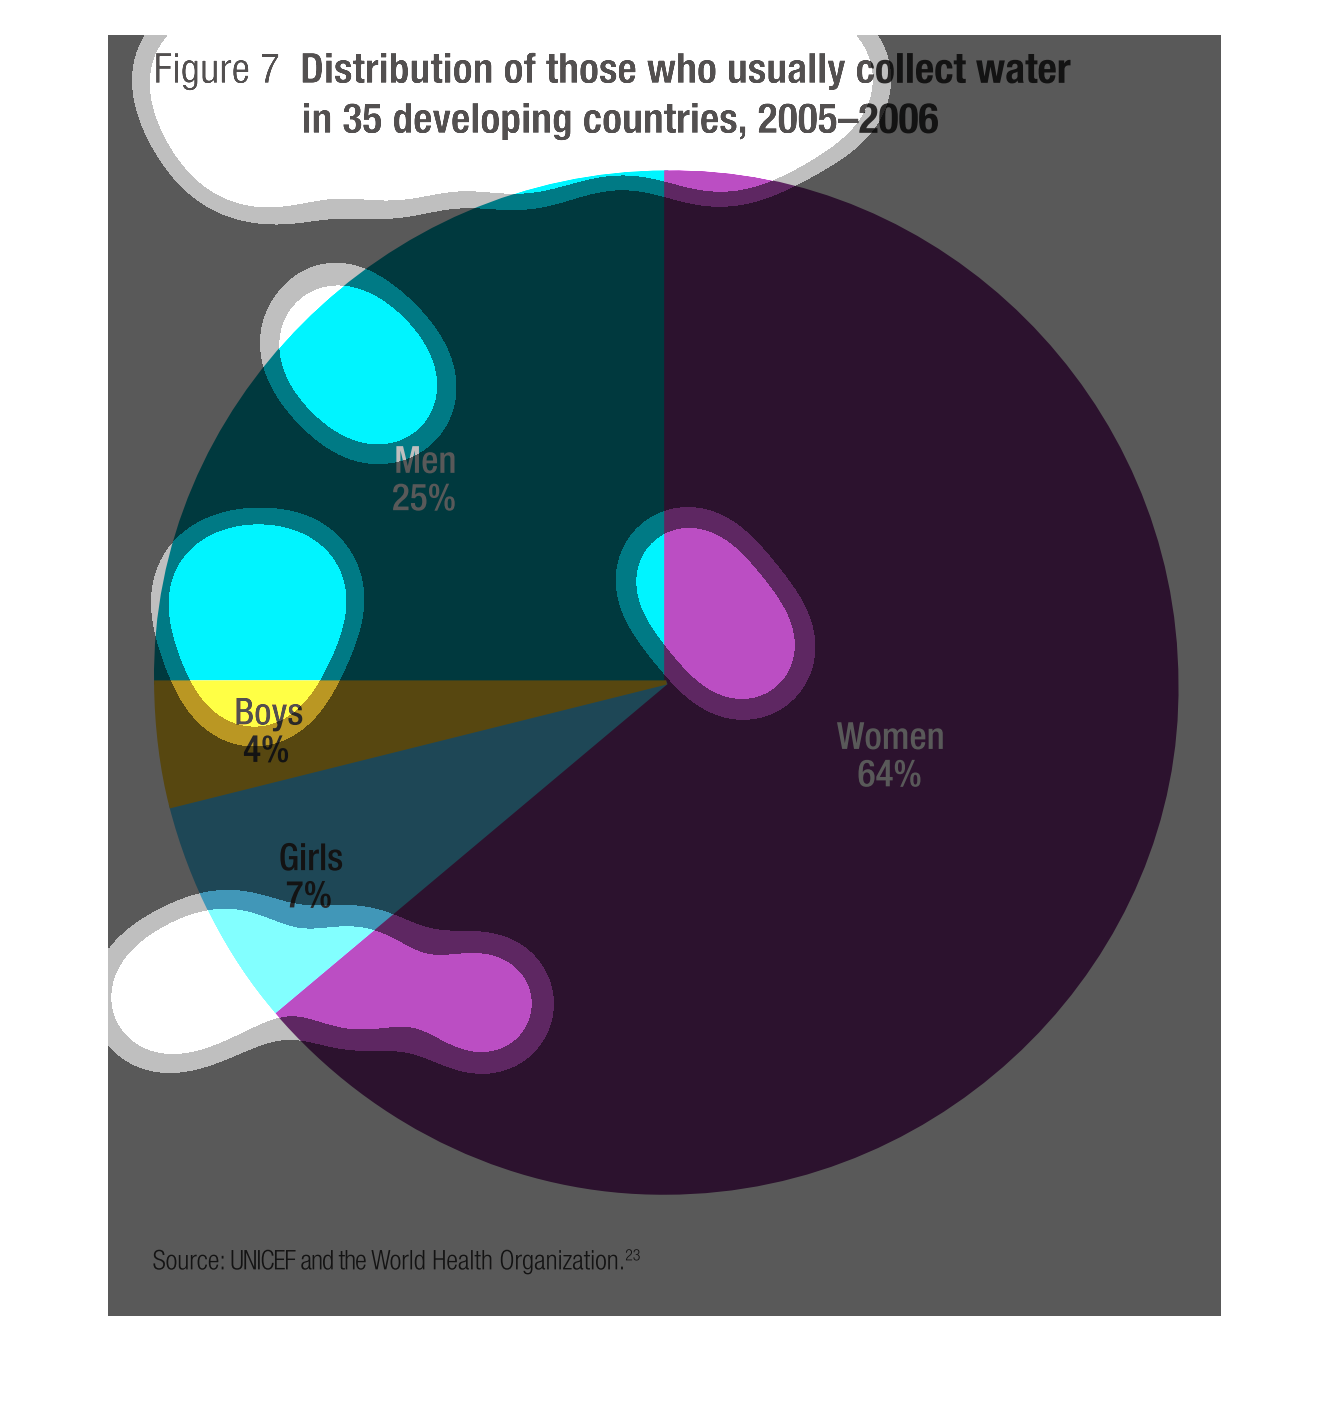
This figure is titled Distribution of those who usually collect water in 35 developing countries,
2005-2006.  It is a pie chart of these different countries water collections.
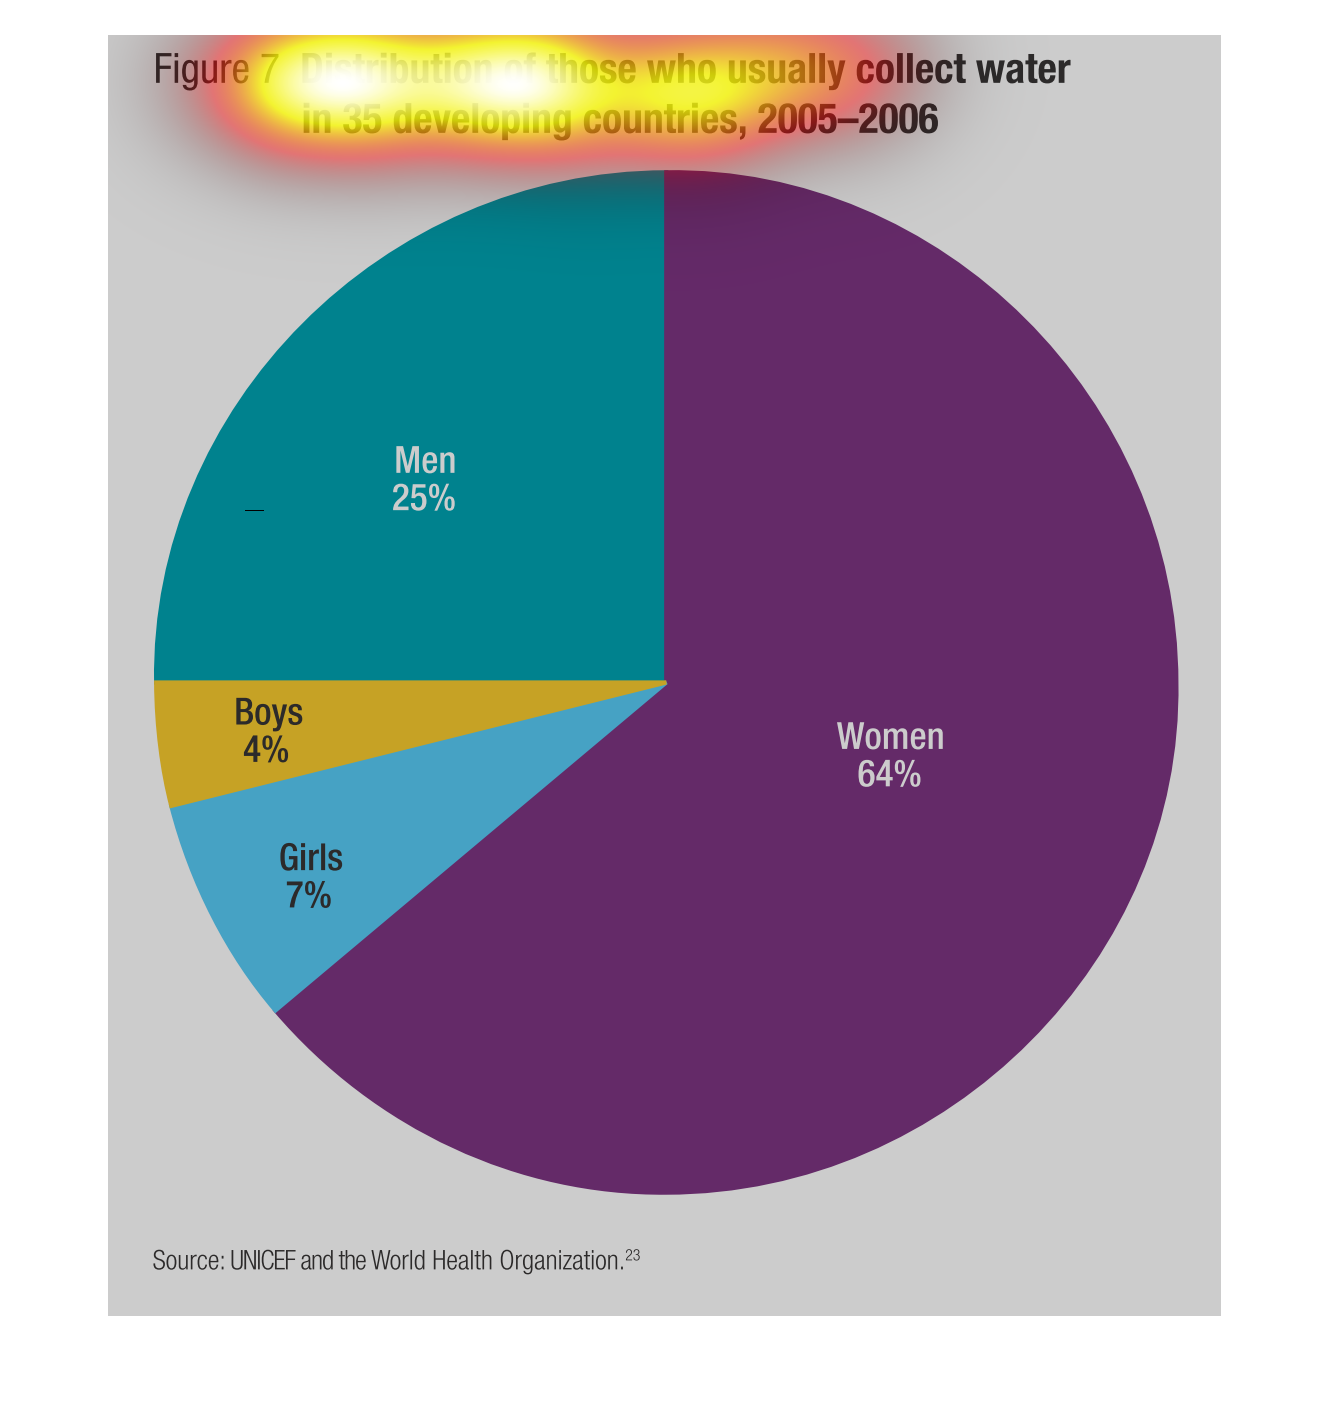
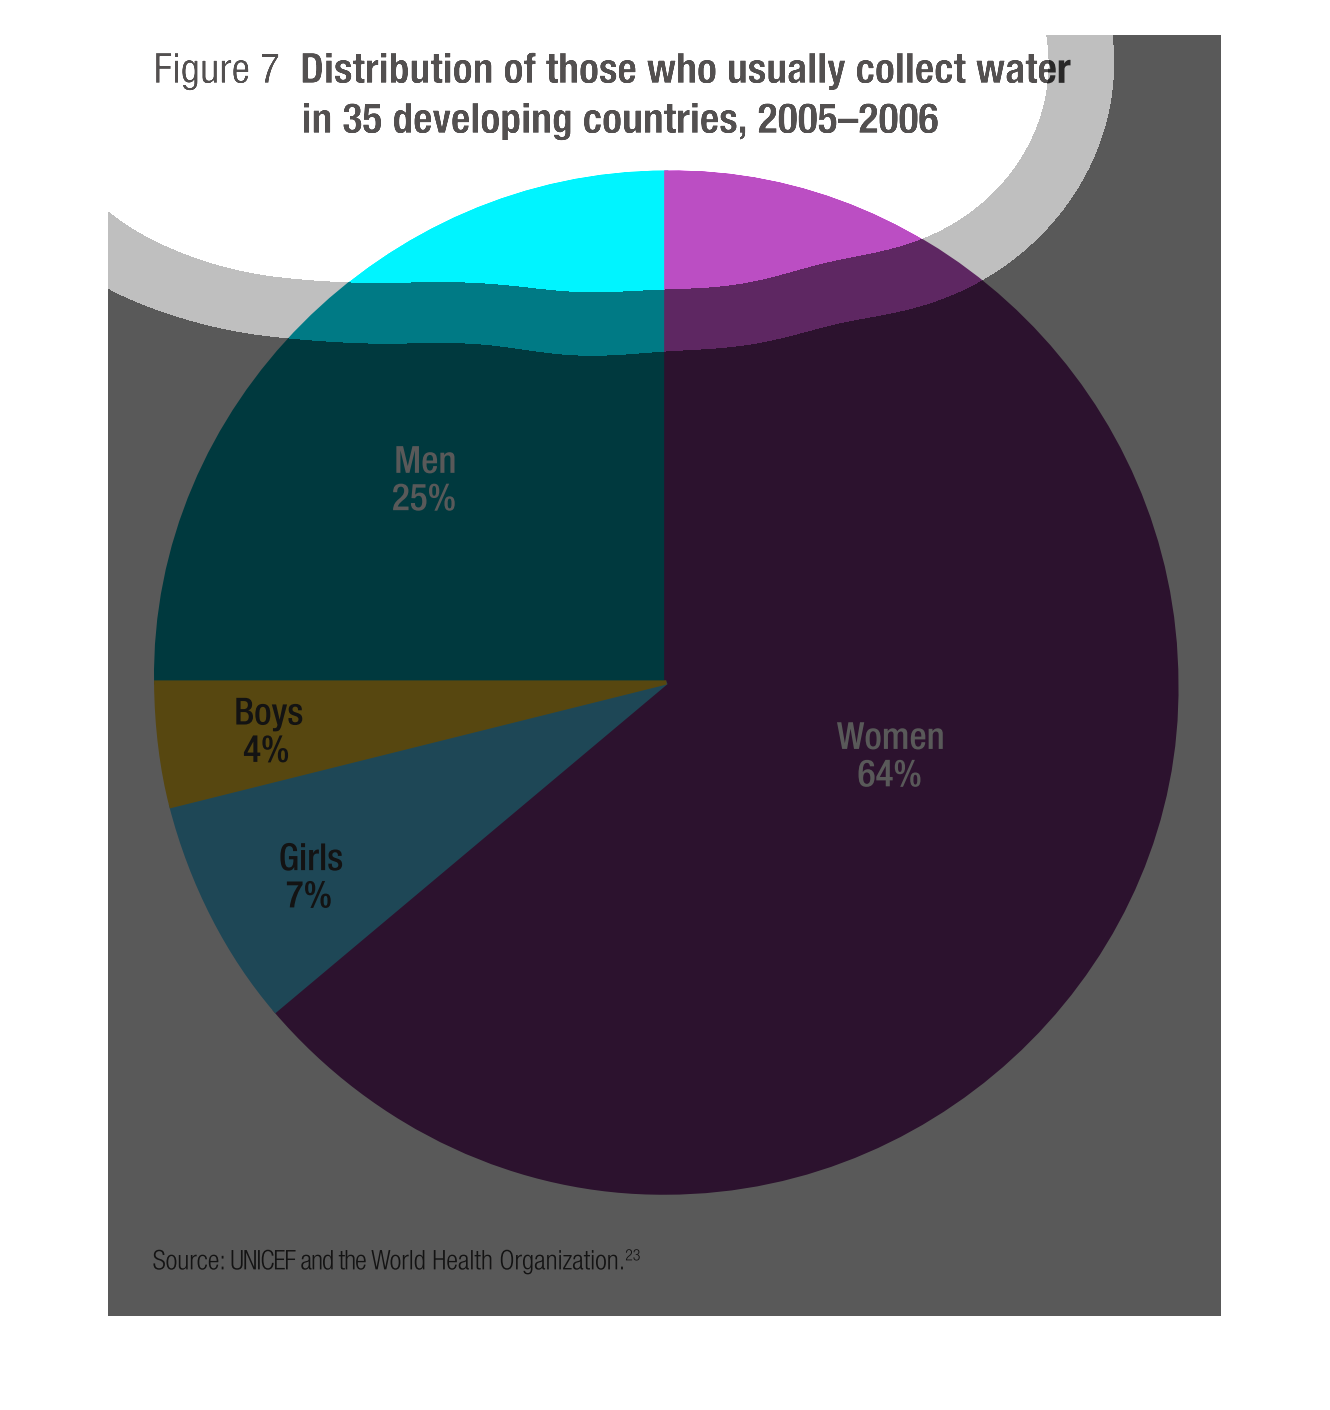
THIS PIE CHART BREAKS DOWN THE DISTRIBUTION OF WHO COLLECTS WATER IN DEVELOPING COUNTRIES
BY PERCENTAGE INTO CATEGORIES OF MEN, WOMEN, BOYS, AND GIRLS.
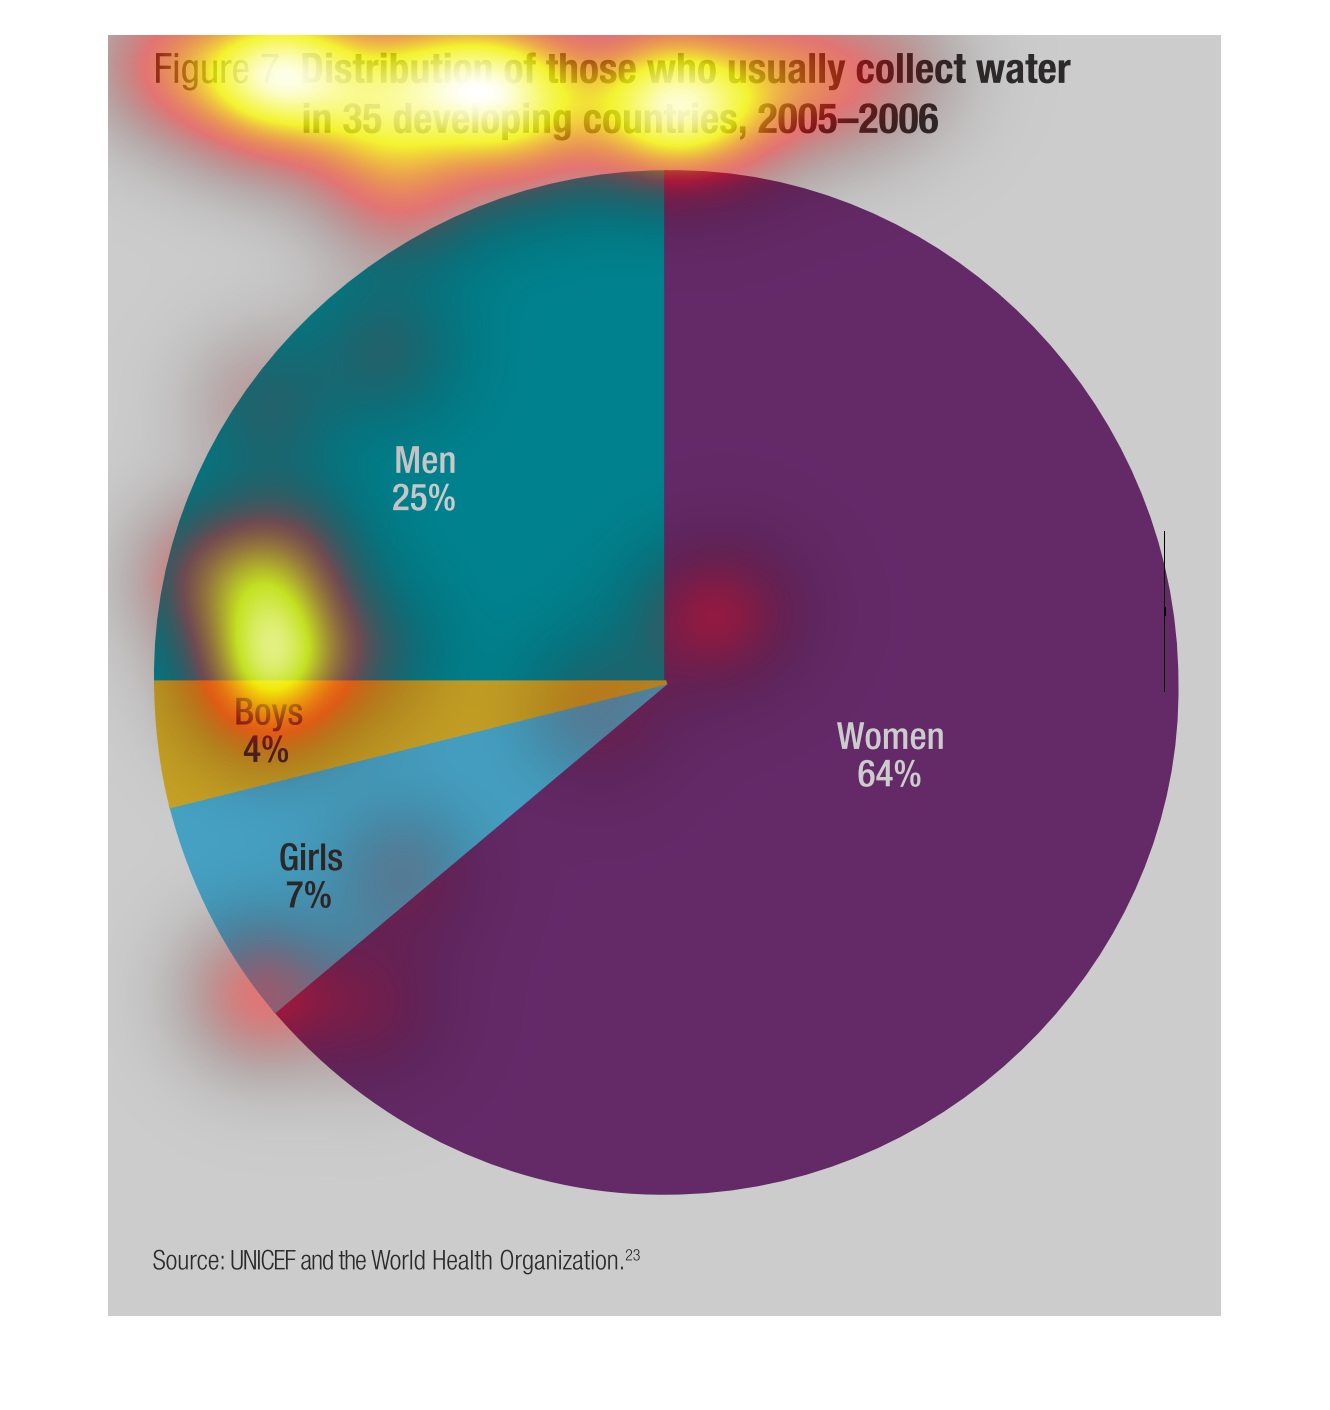
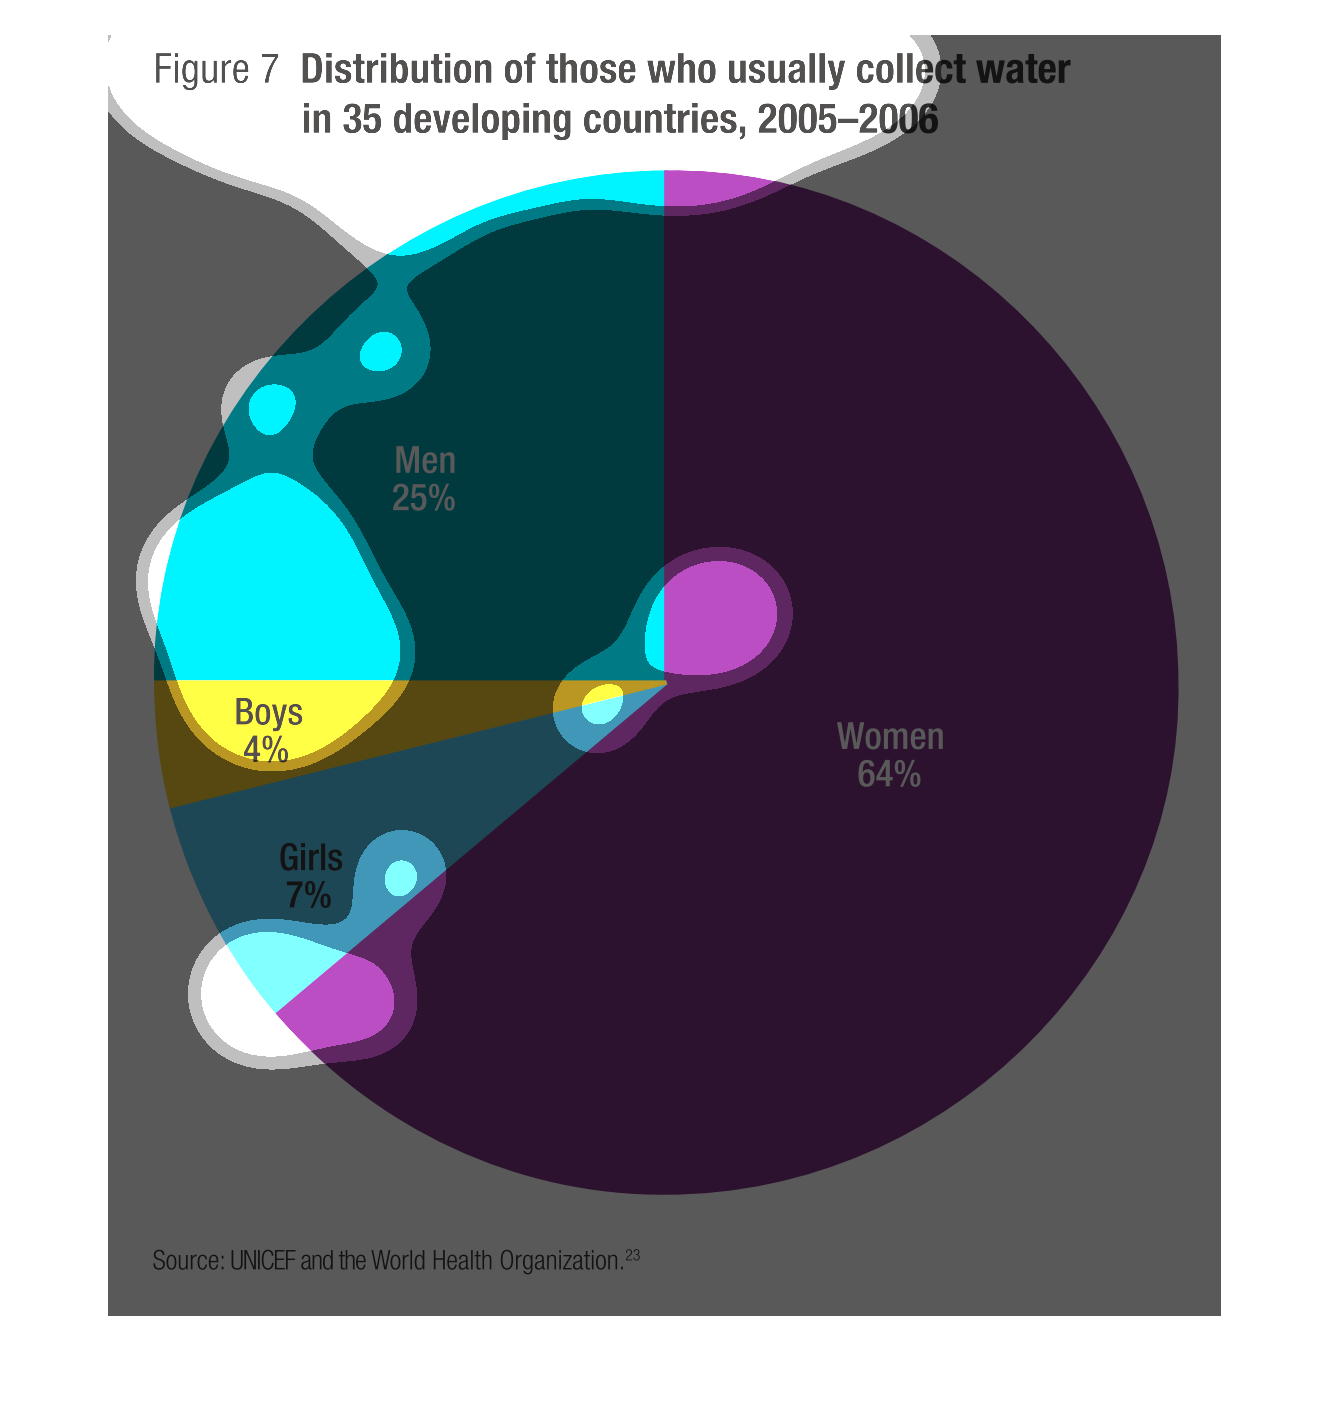
This image shows or depicts in a statistical pie chart format distribution of those who usually
collect water in 35 developing countries for years 2005-2006.
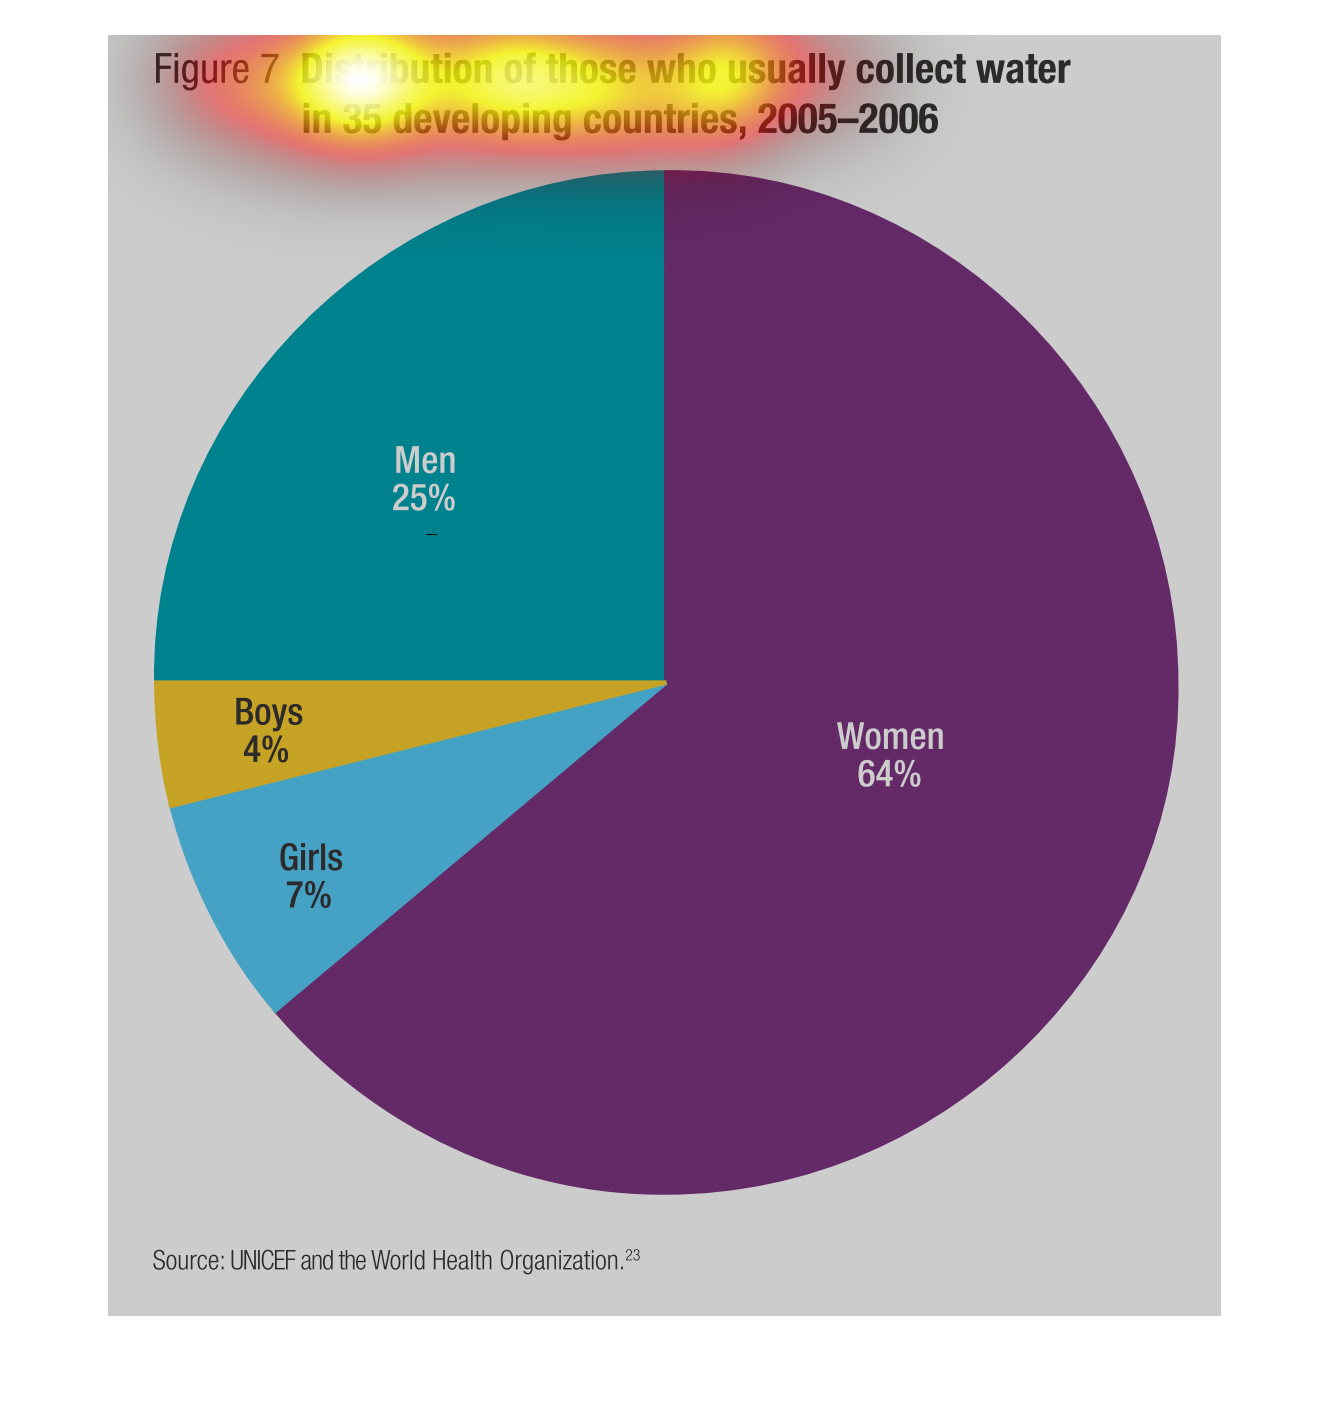
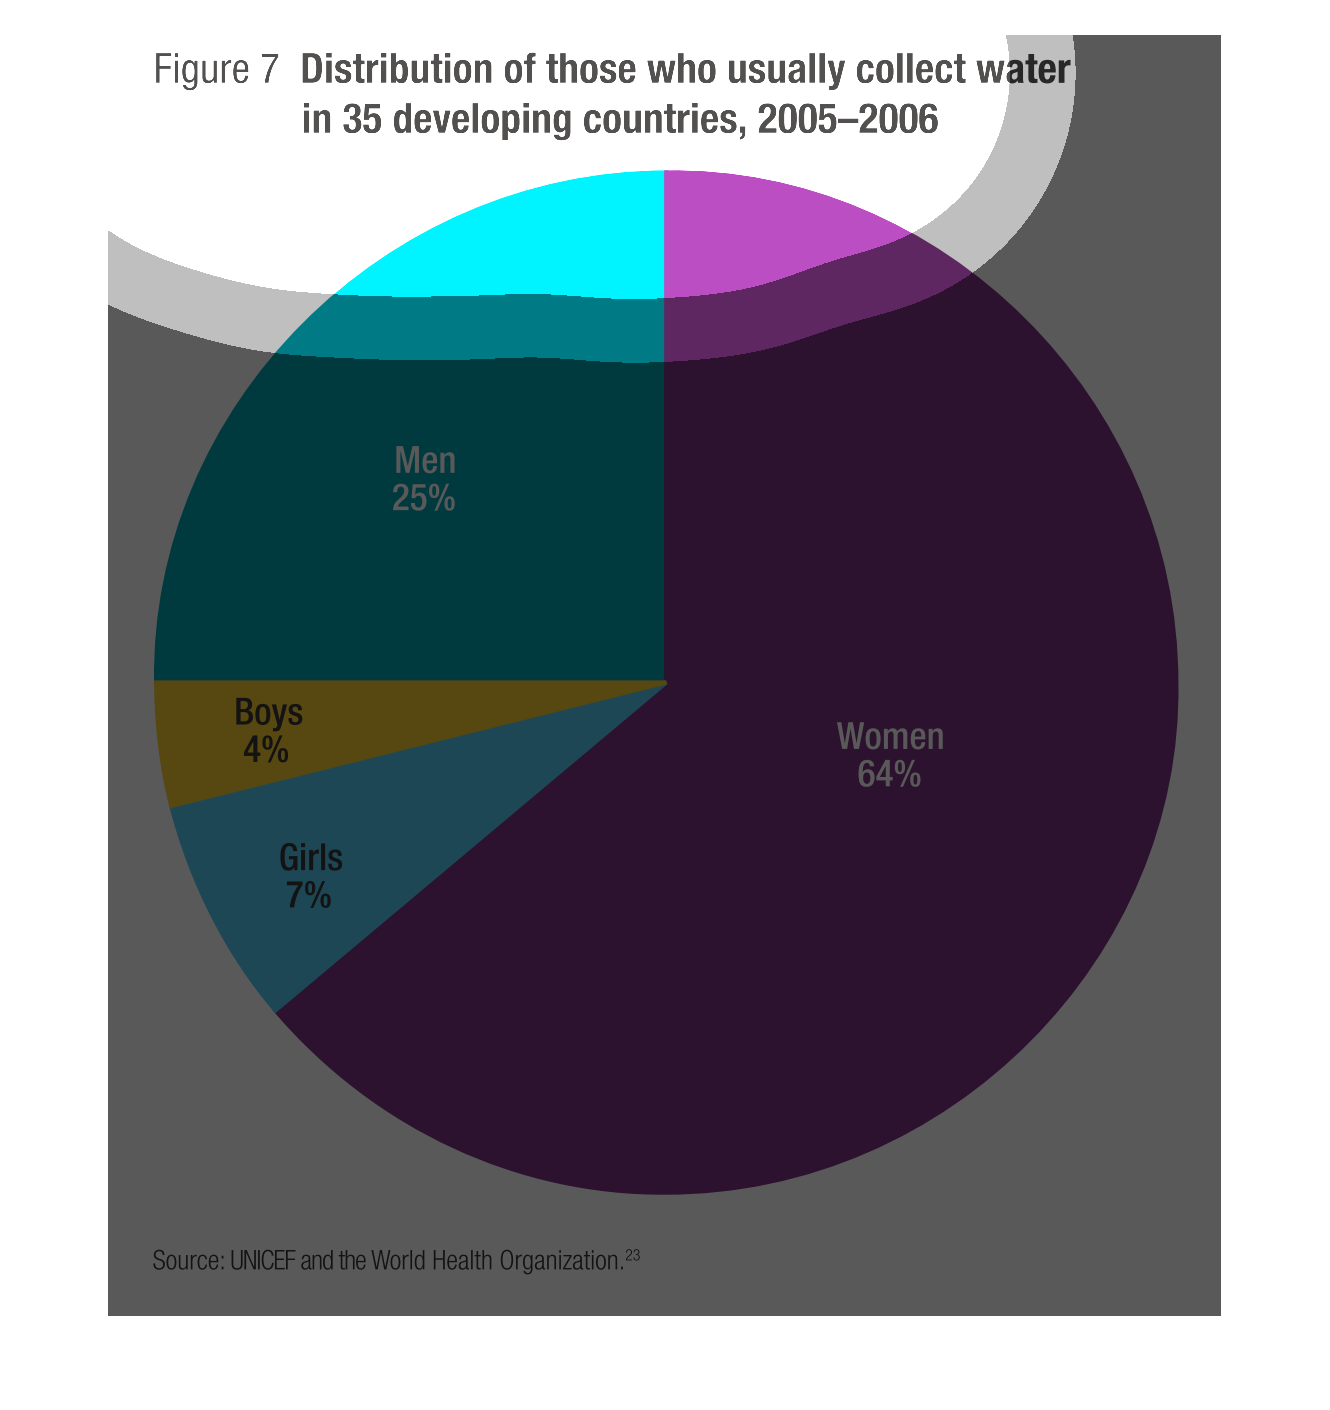
This is a pie chart depicting the distribution of those who usually collect water in 35 developing
countries from the years 2005 to 2006 and it shows that the vast majority is done by women.
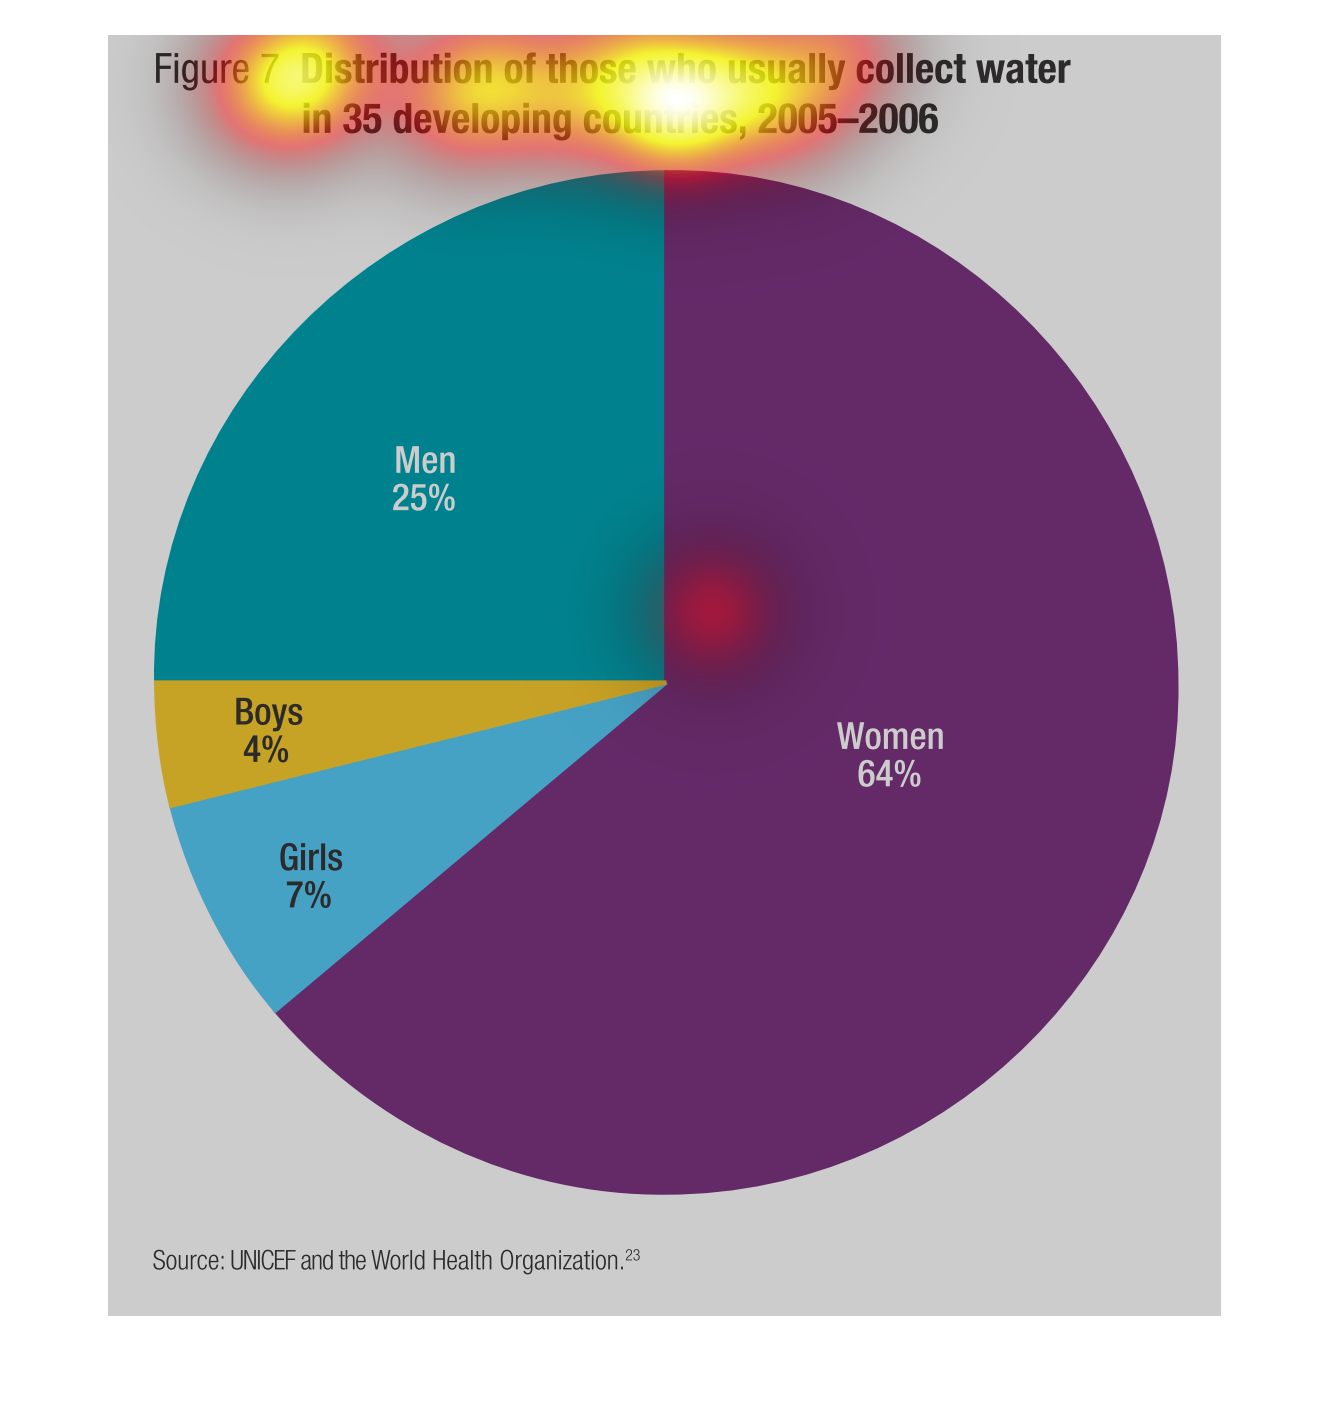
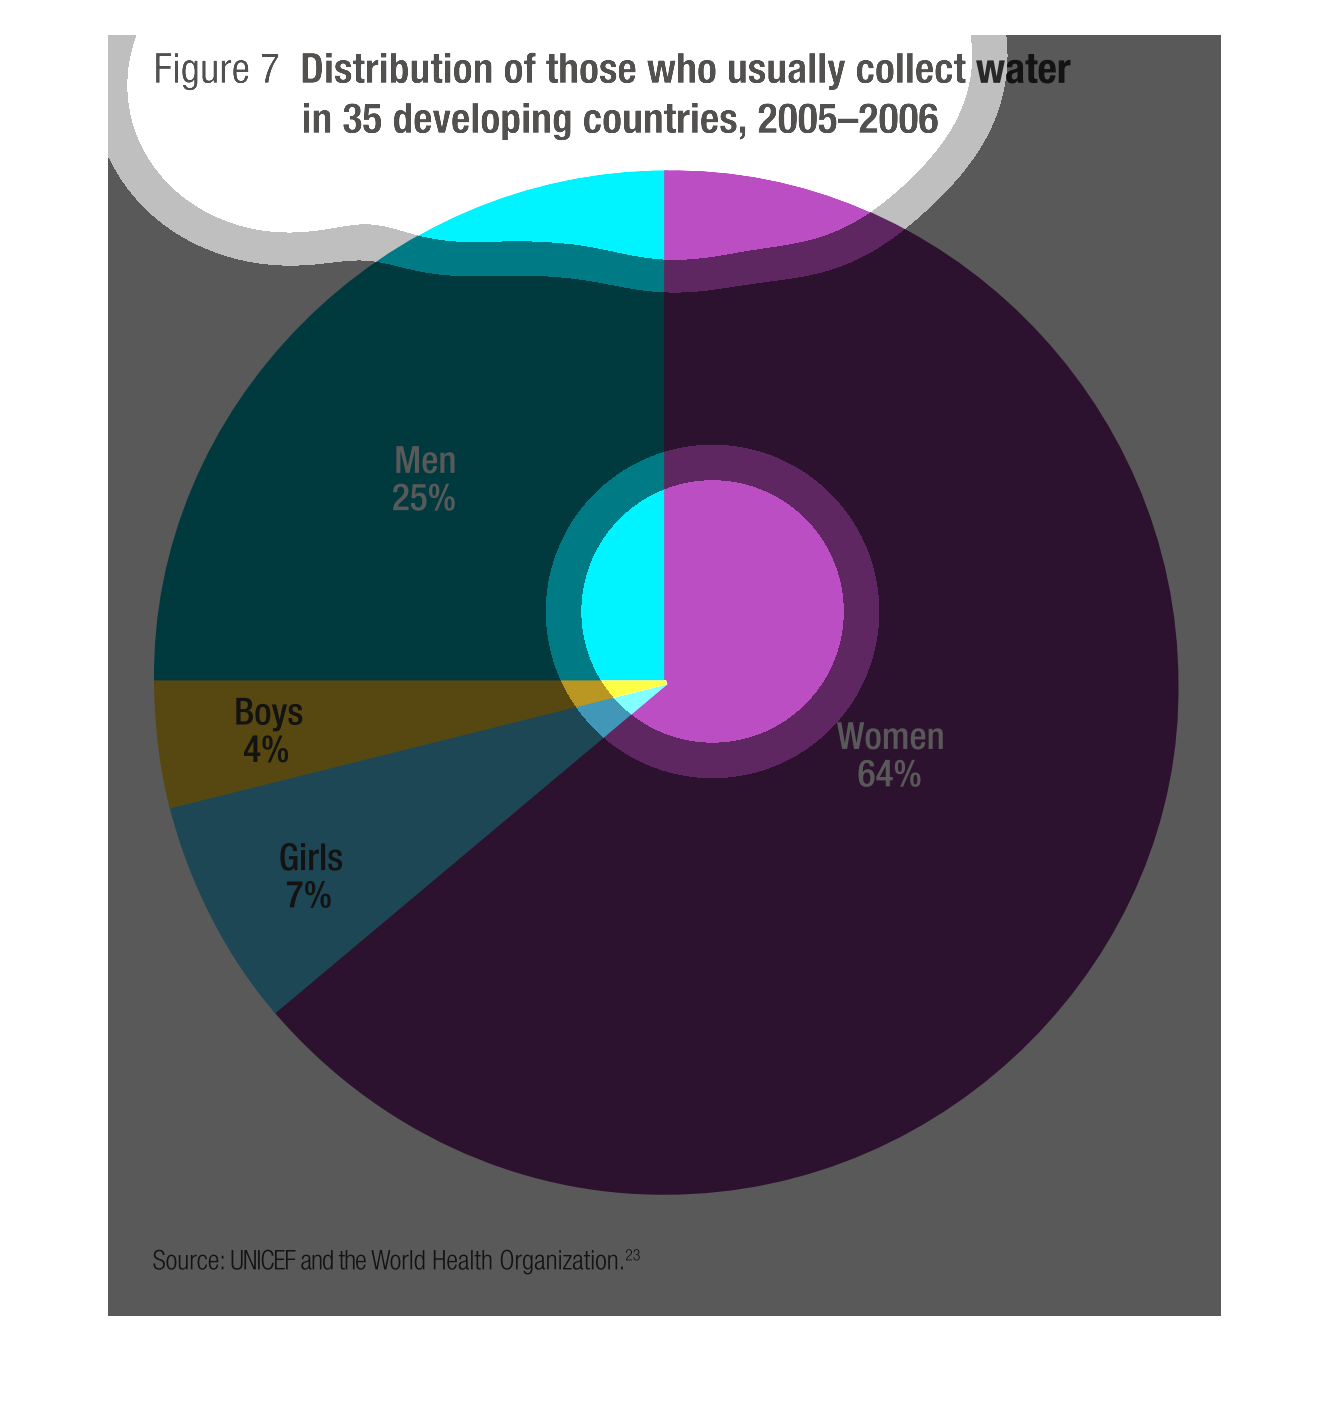
The image is a pie chart which describes what percentage of men, women, girls, and boys usually
collect water in 35 developing countries. The chart shows that the majority of water is collected
by women, followed by men, then girls, then finally boys. The pie chart was created by UNCEF
and the World Health Organization.
This pie chart illustrates the distribution of those who usually collect water in developing
countries in the years 2005 and 2006.  The largest percentages are women followed by men,
girls, and boys.
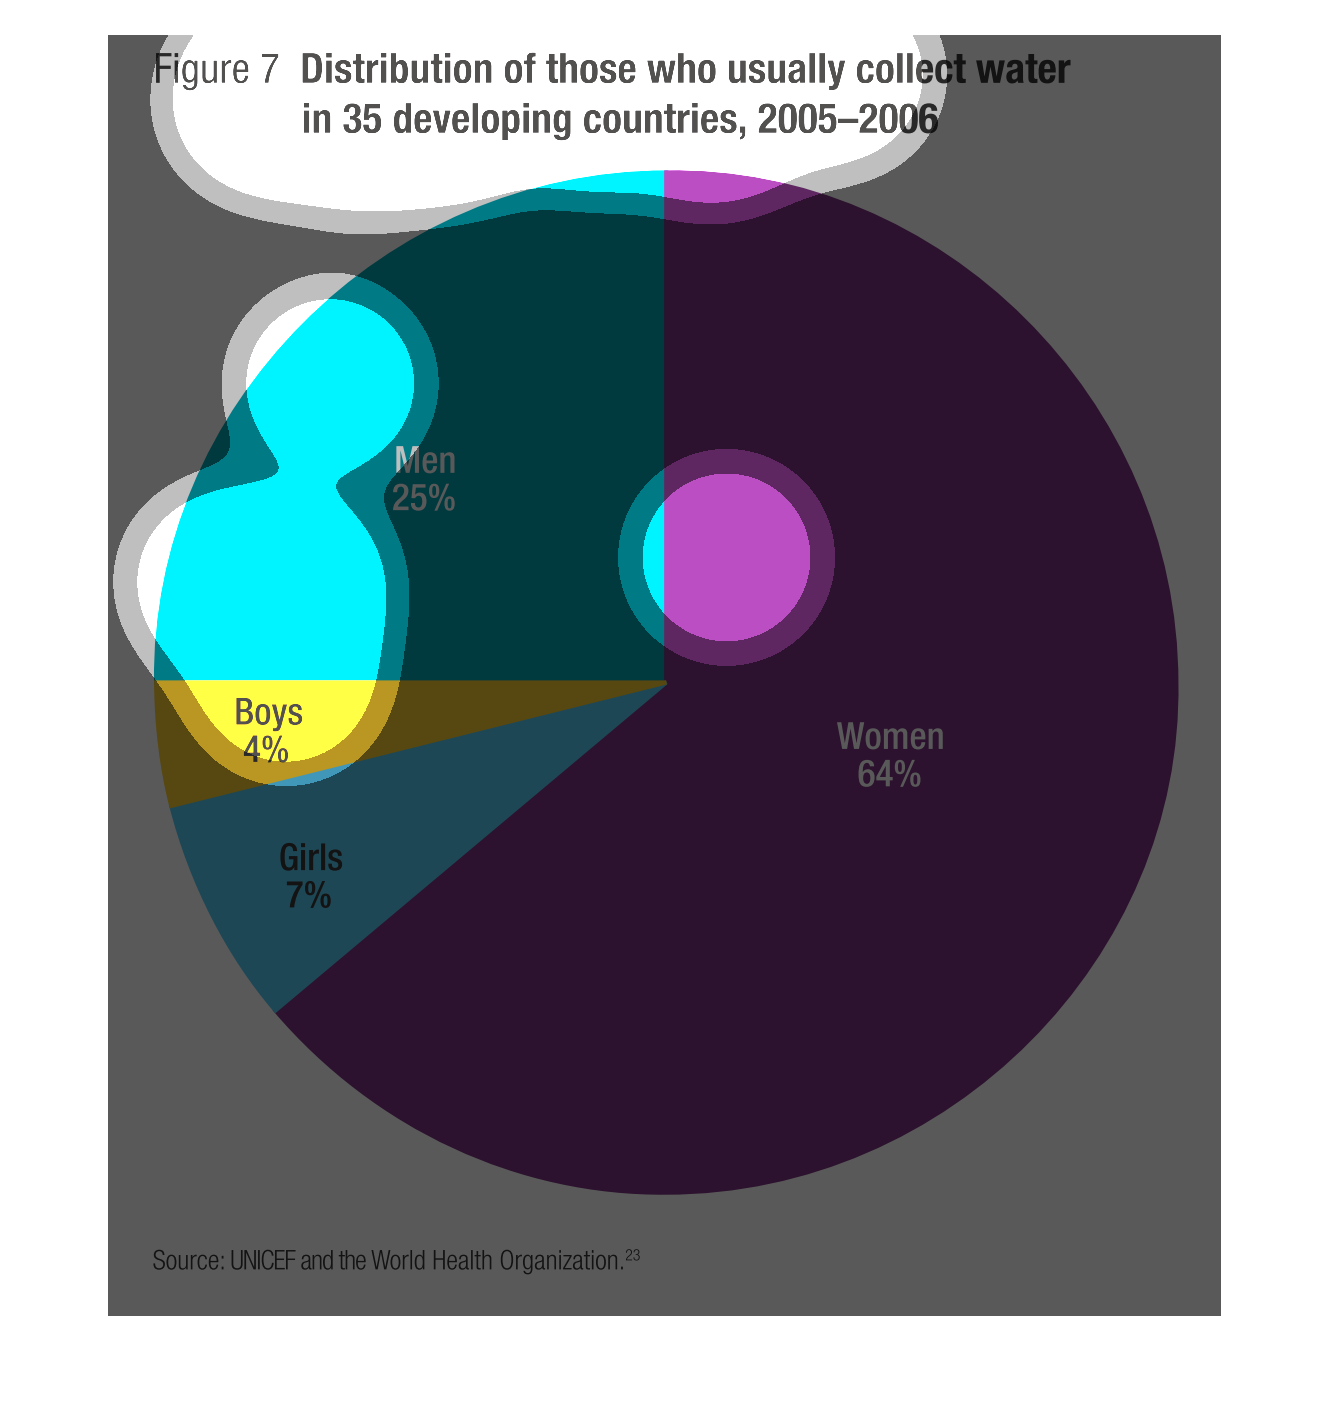
This chart describes distribution of those who usually collect water in 35 developing countries
for the years 2005 through 2006. The chart is divided between men, women, boys and girls.
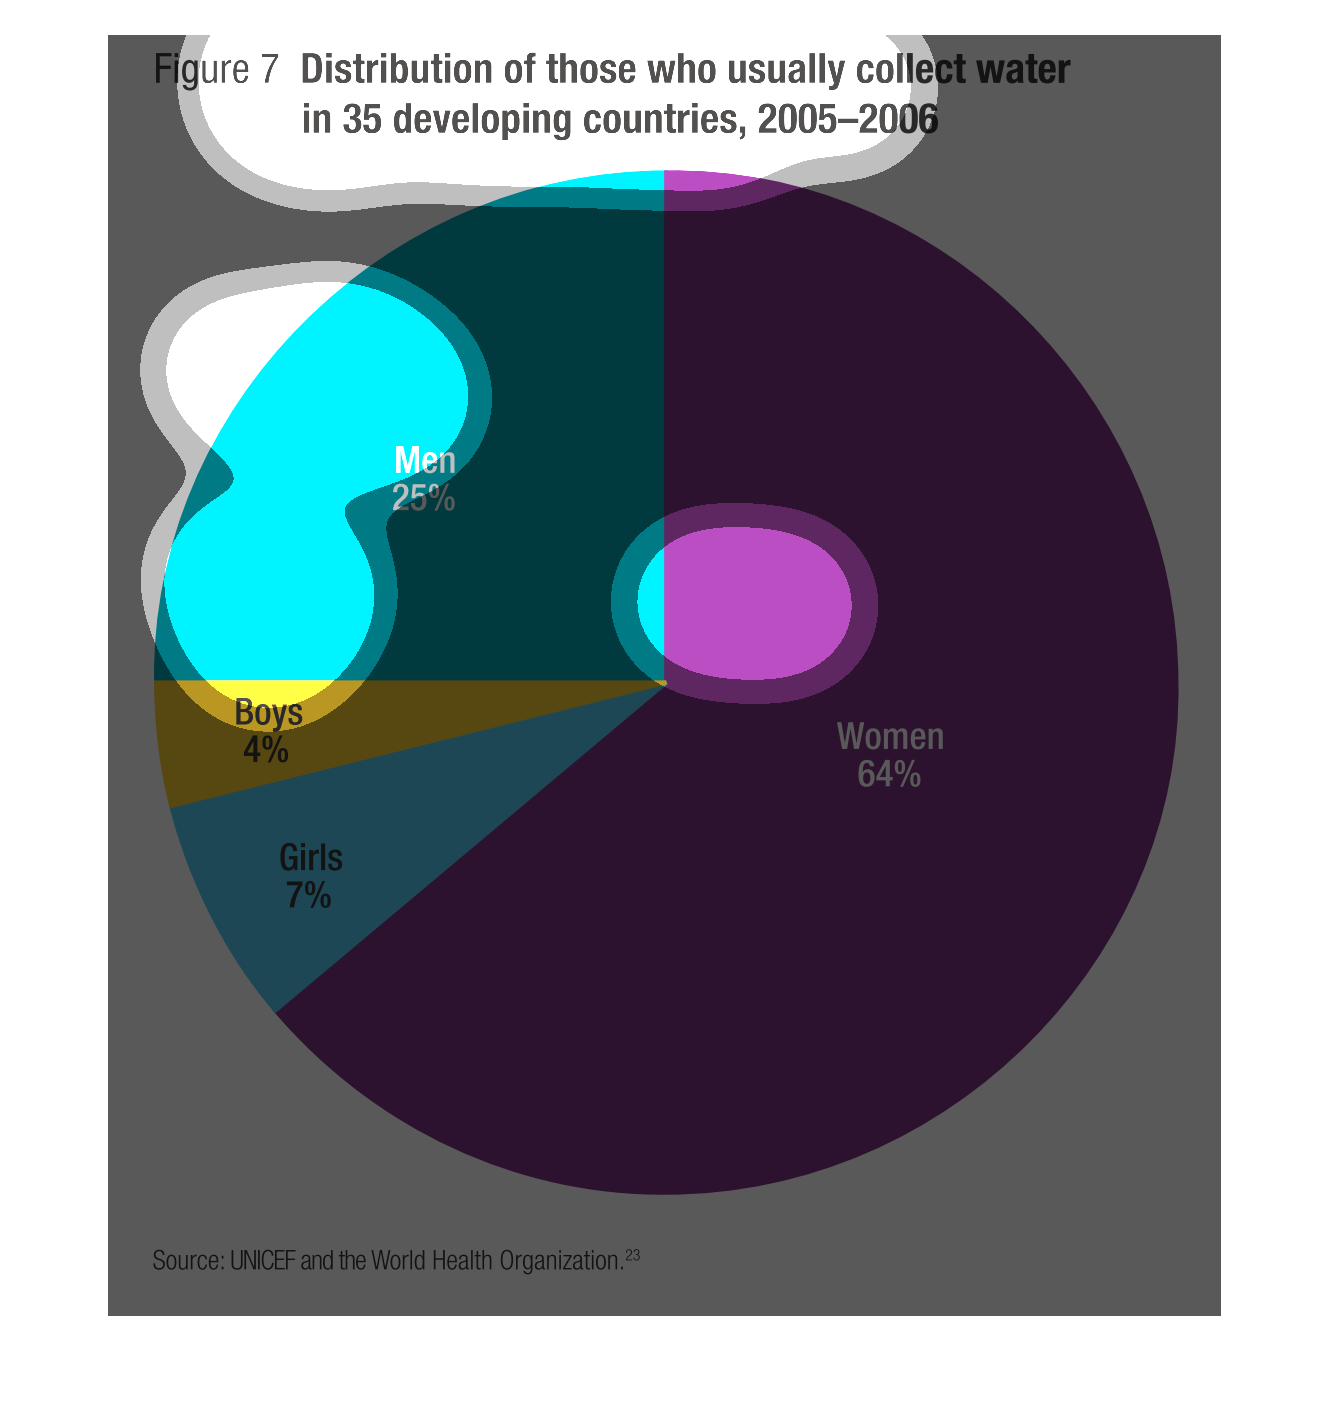
This circle graph shows Distribution of those who usually collect water in 35 developing countries
for the years 2005-2006. Women are the biggest collectors. They collected 64% of the water.
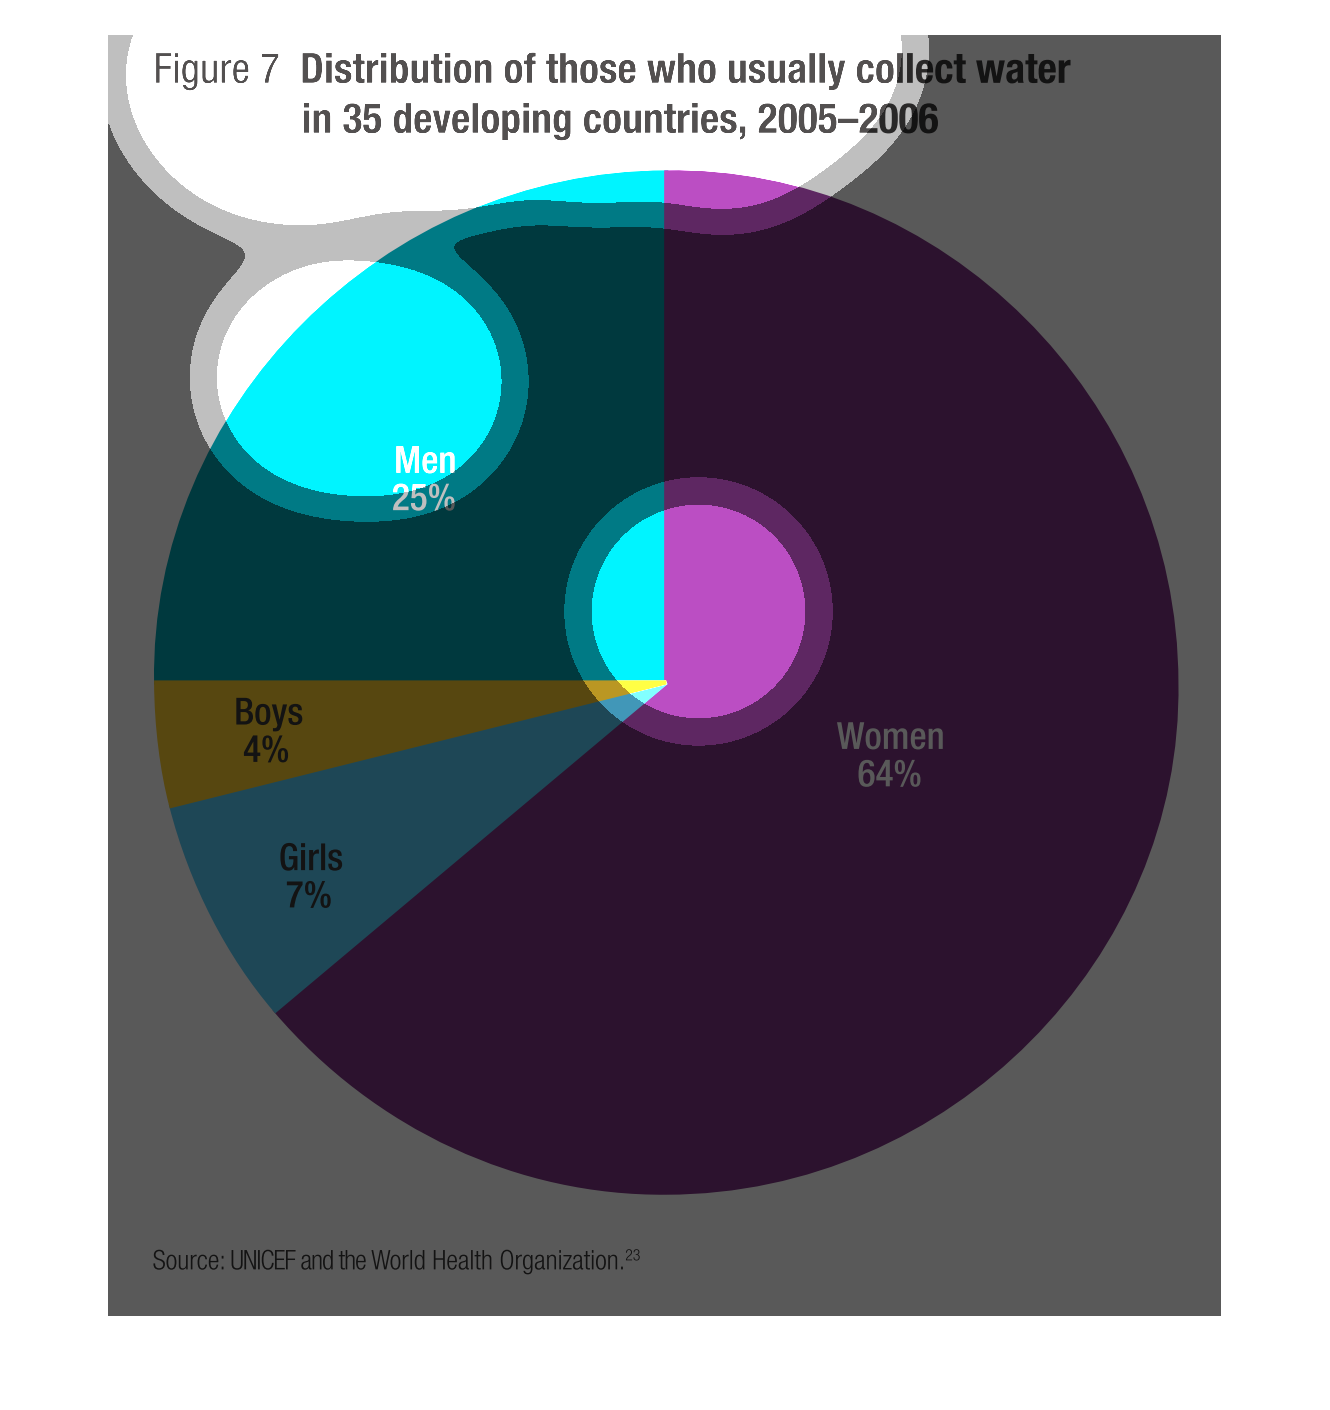
The pie-chart graphical image shows the percentages of individuals whom collect water in developing
countries. Nearly 90% of water collectors are adults while 11% are children. Females collect
significantly more water than males whether women or youth girls.