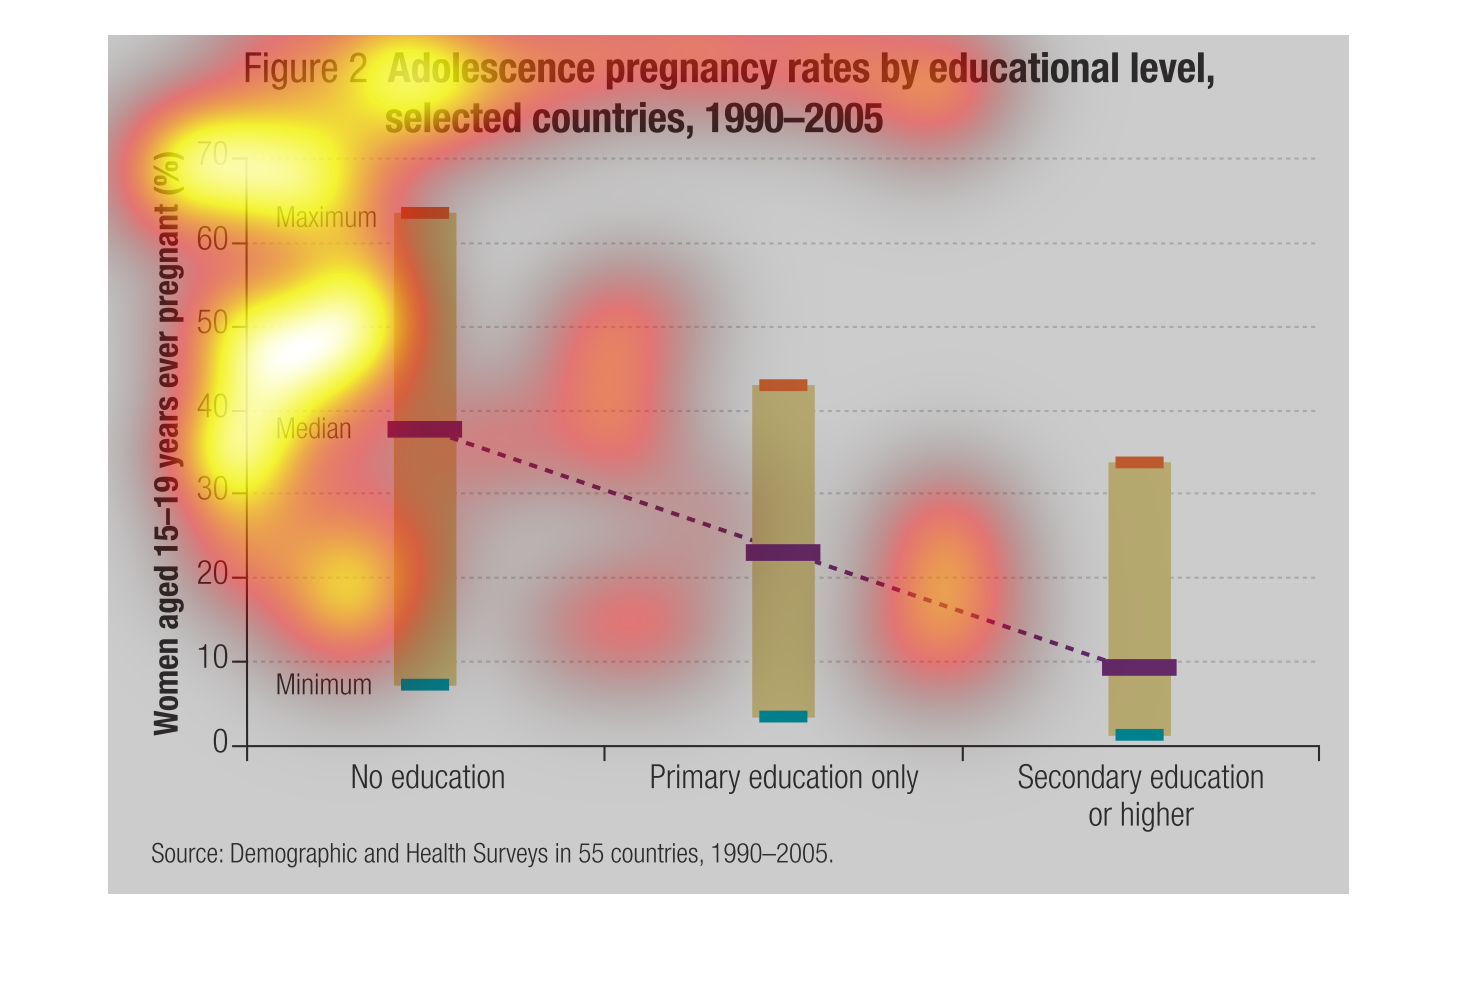
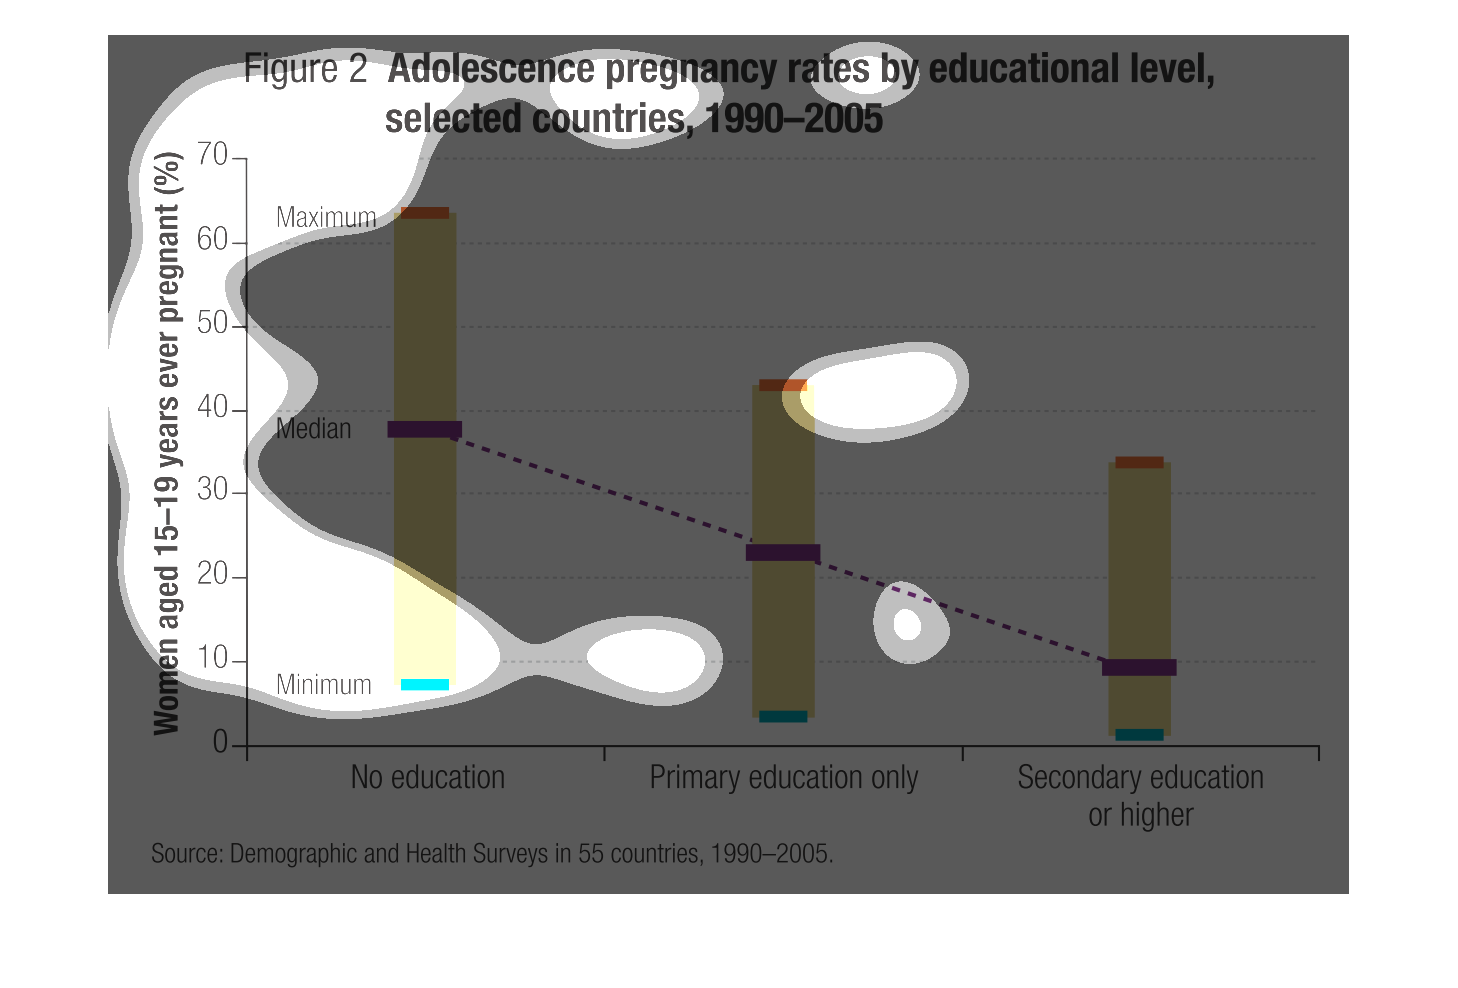
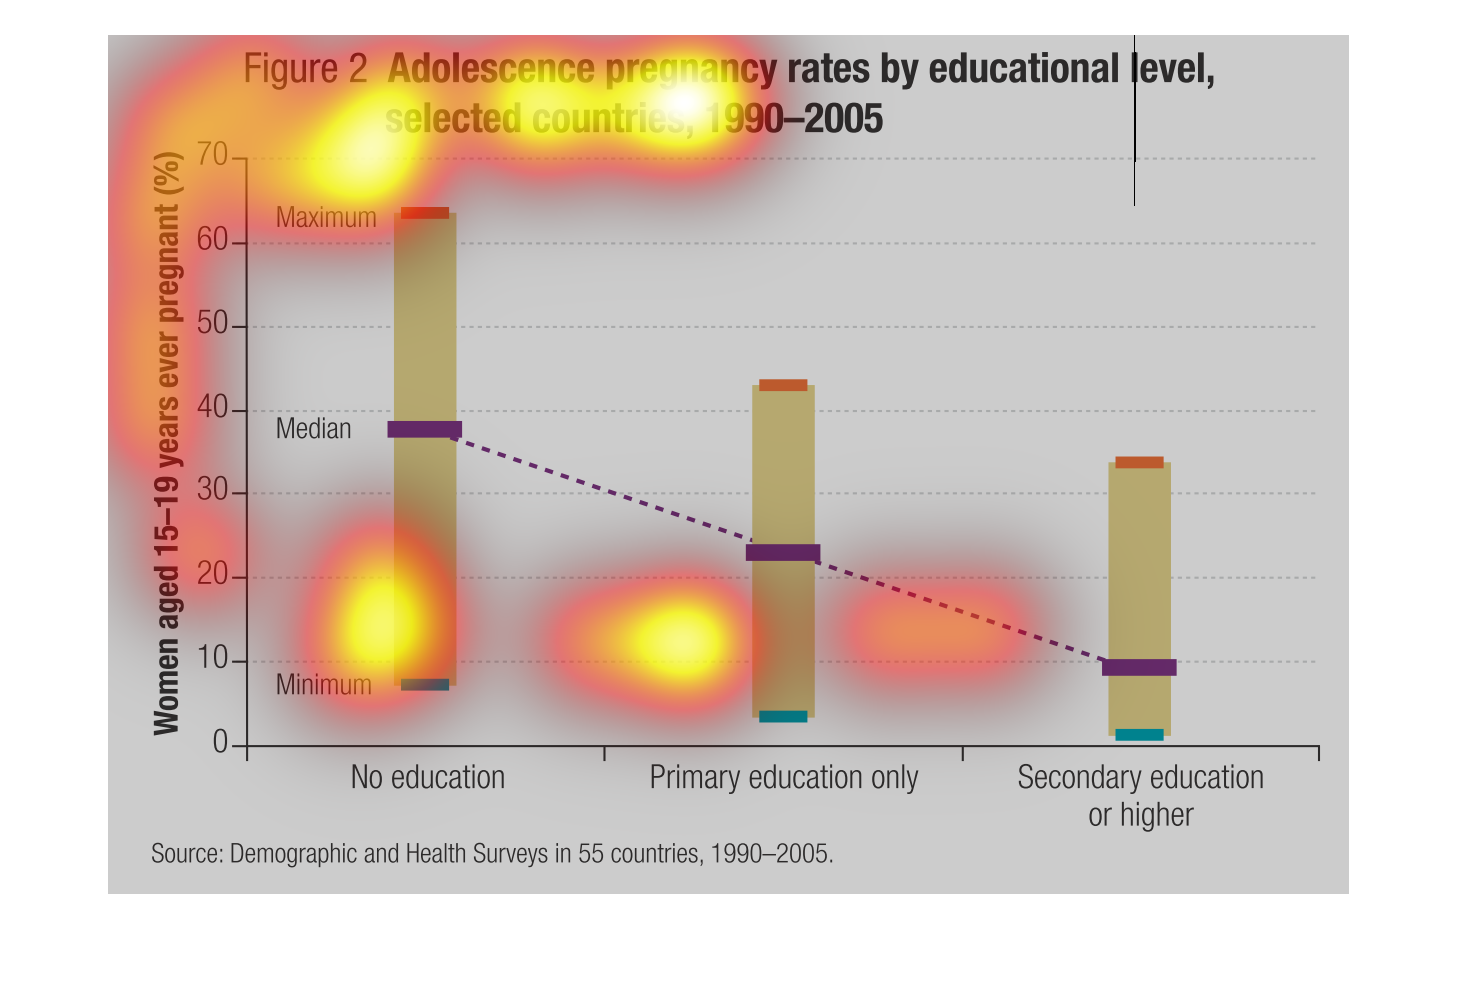
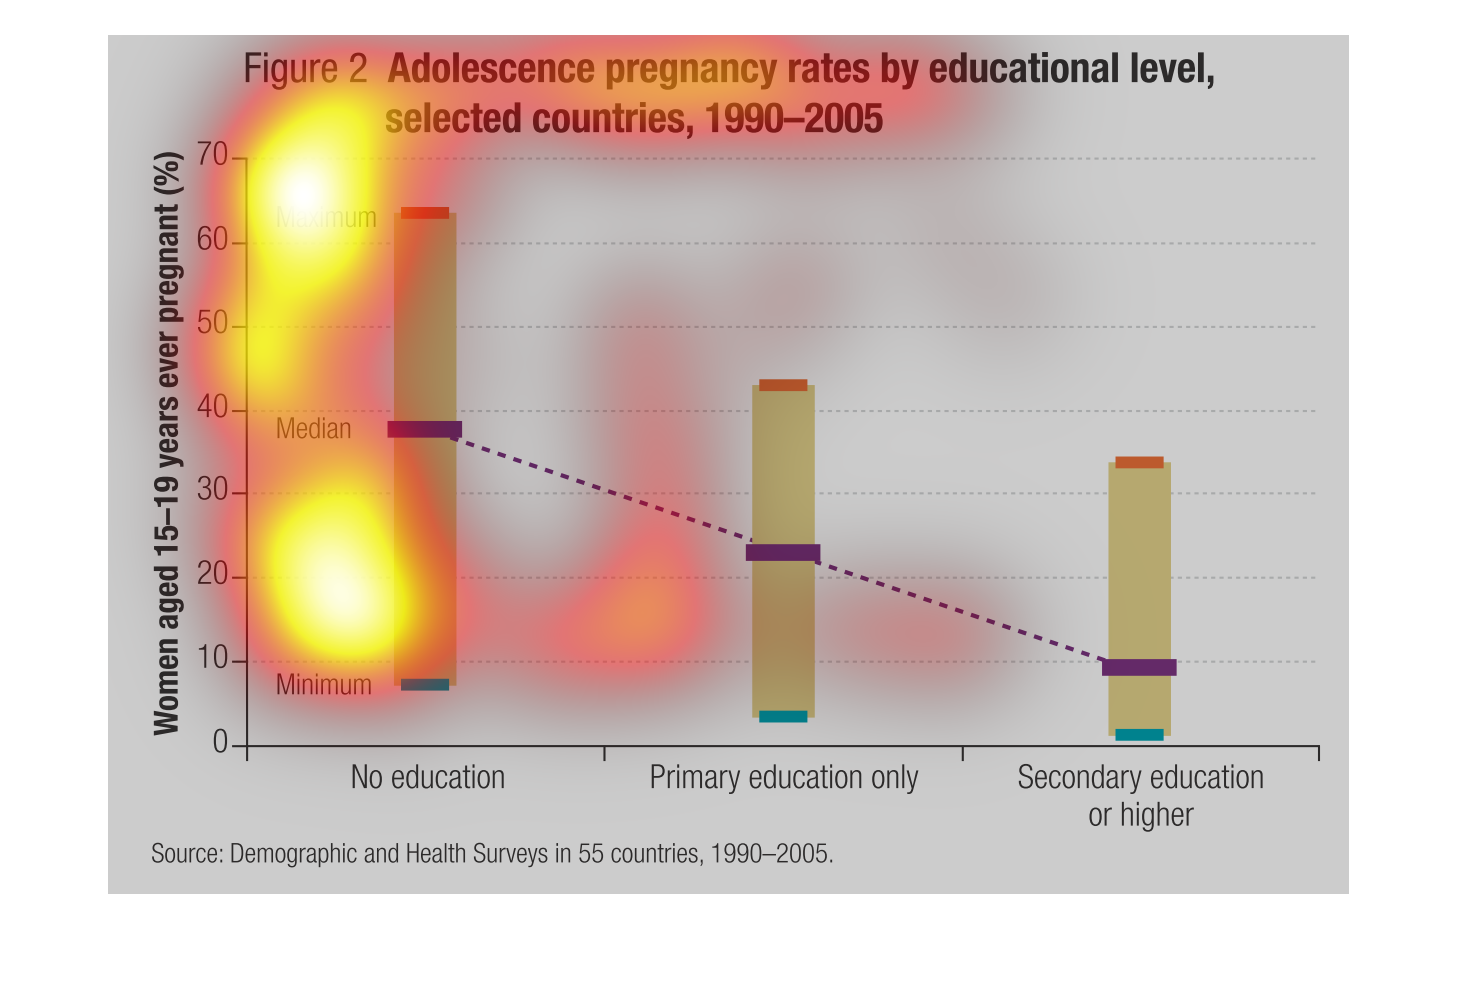
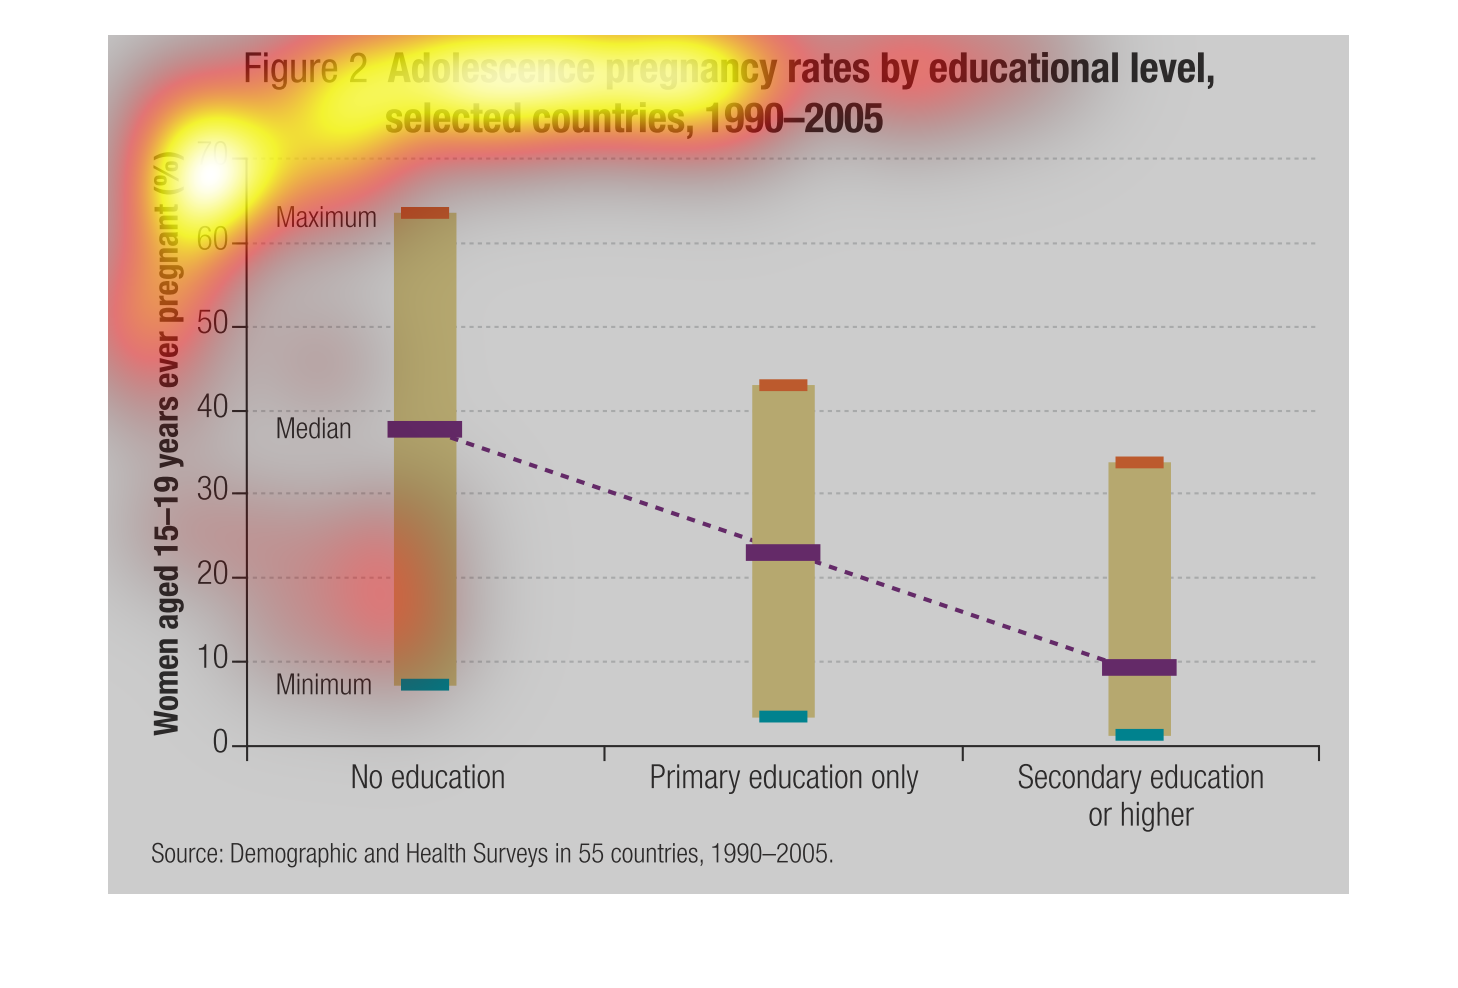
Shows the rate of adolescent pregnancy by level of education, between 1990 and 2005. More
education is correlated with lower pregnancy rates. Rates for those women with no education
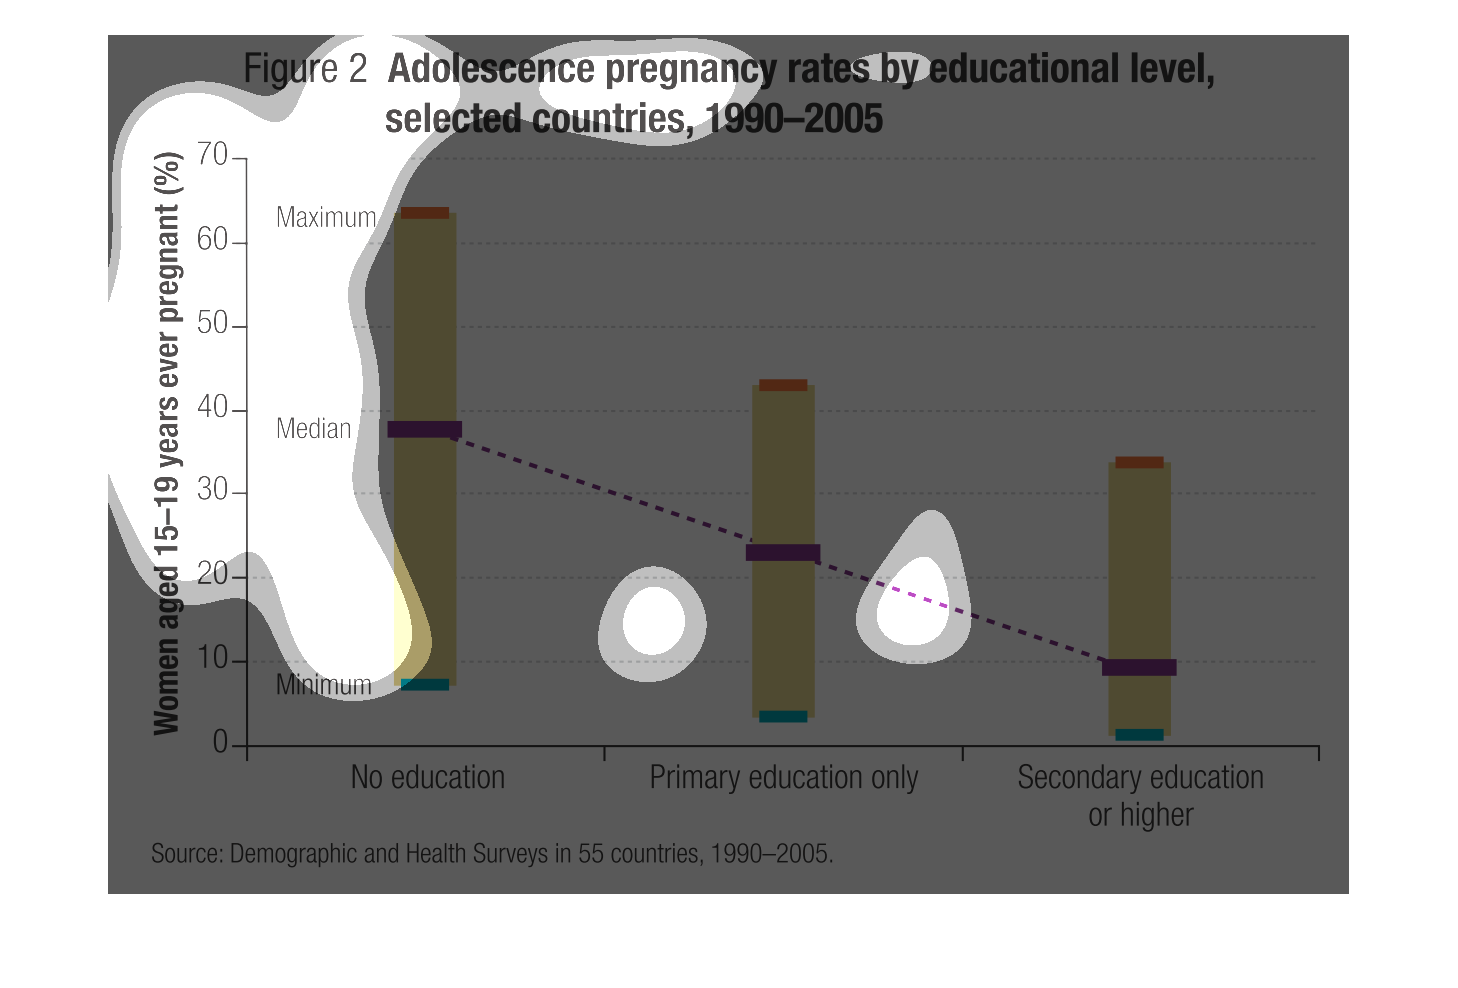
ranged from a minimum of about 5% to a maximum of about 65%. Rates for those women with secondary
education or better ranged from a minimum of about 1% to a maximum of about 35%.
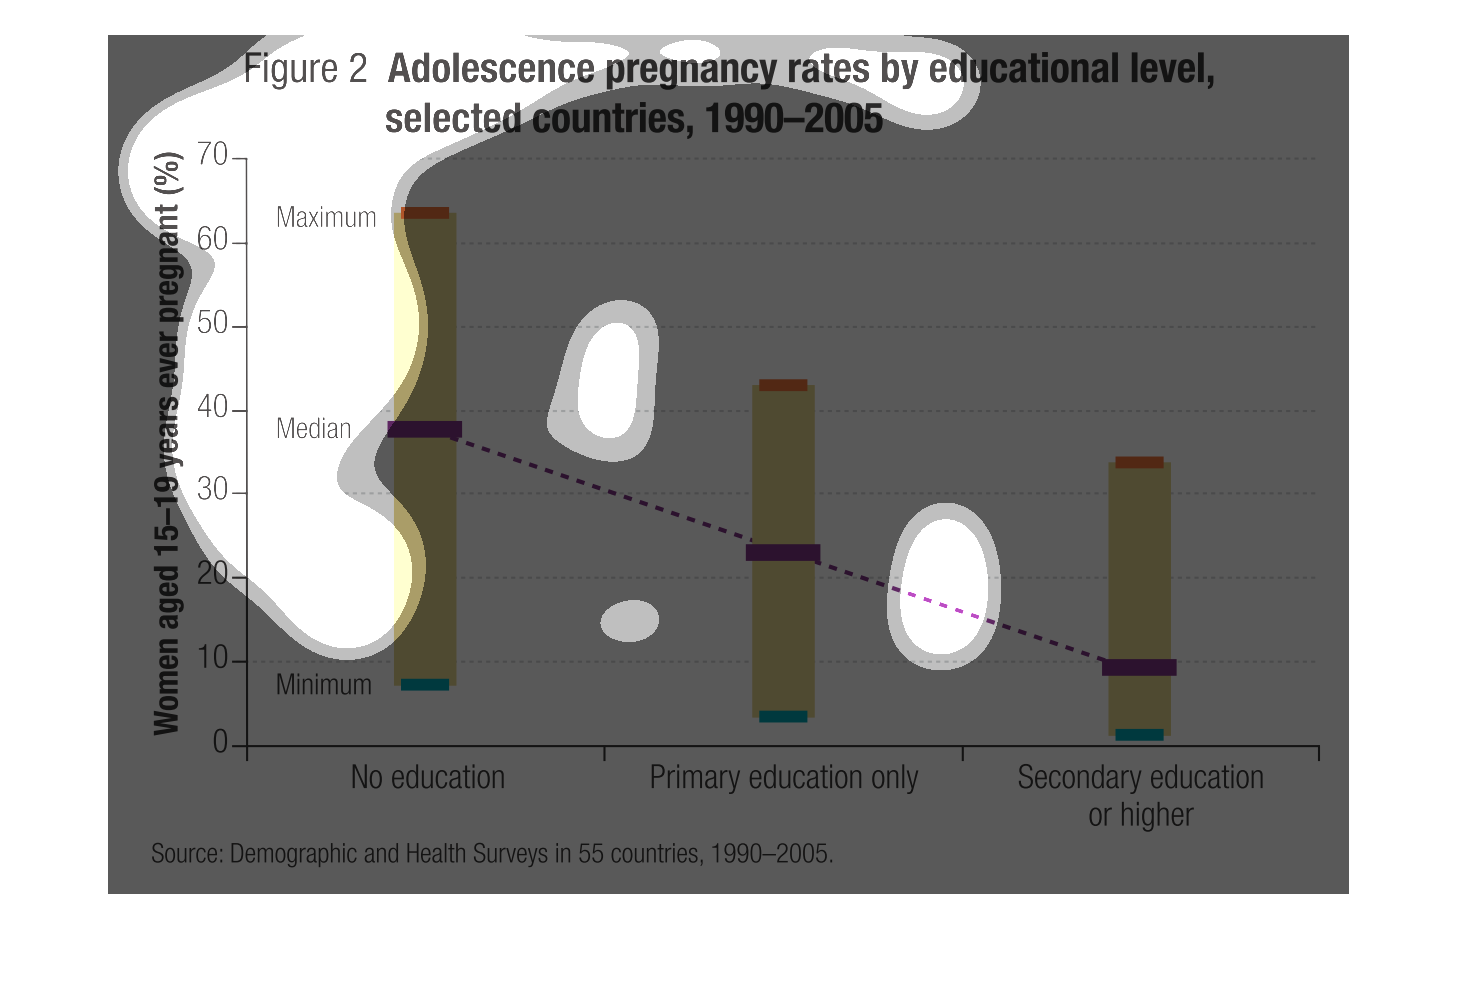
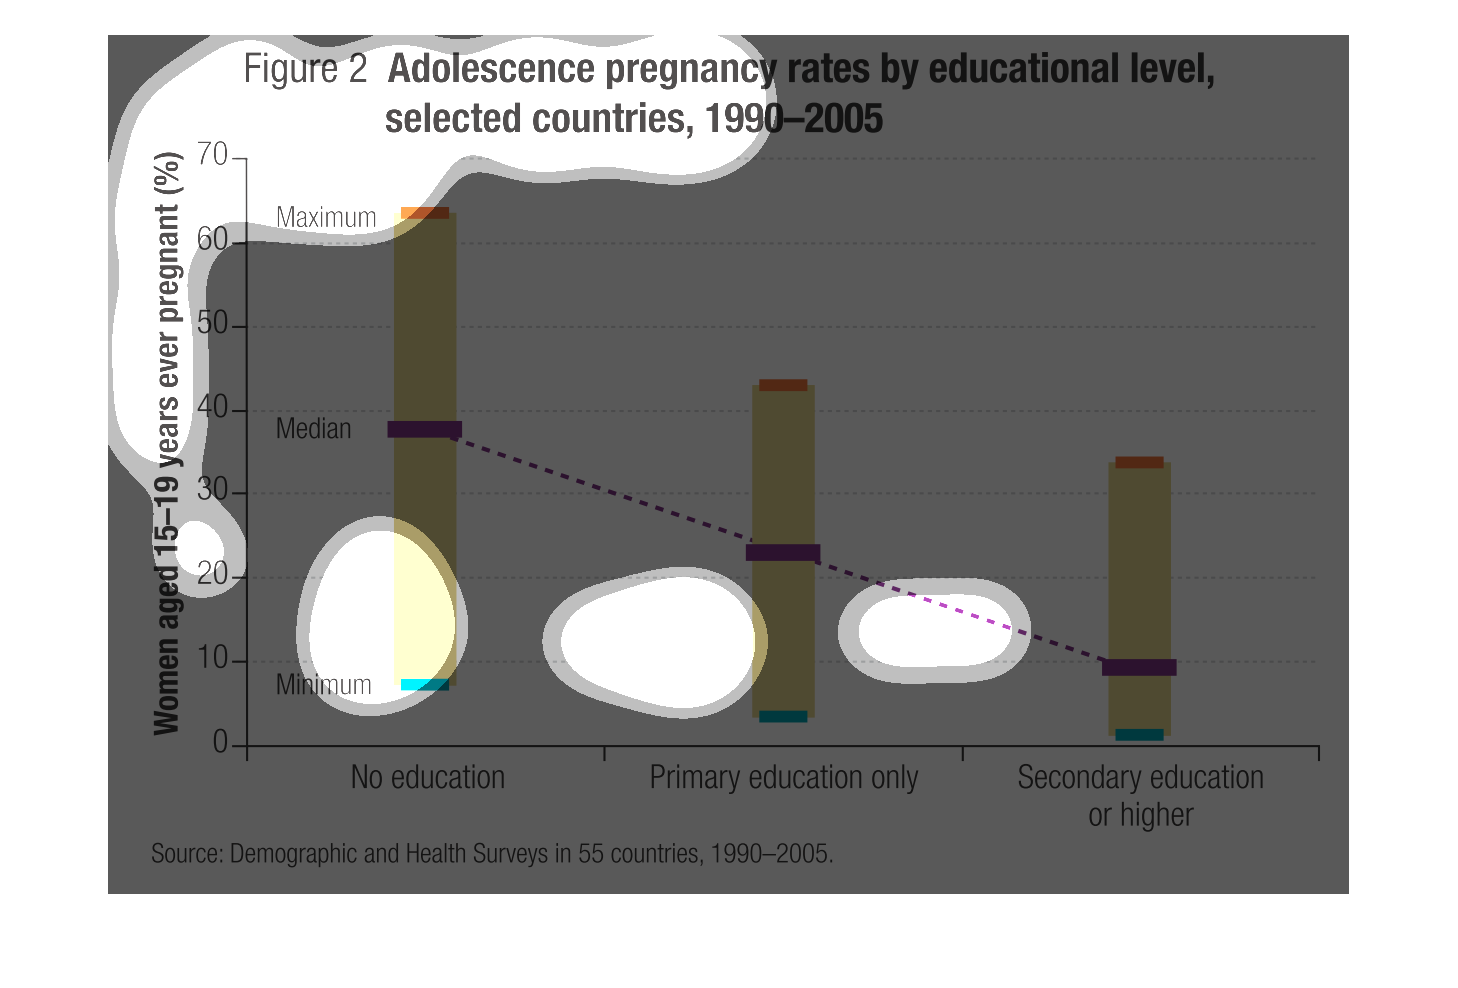
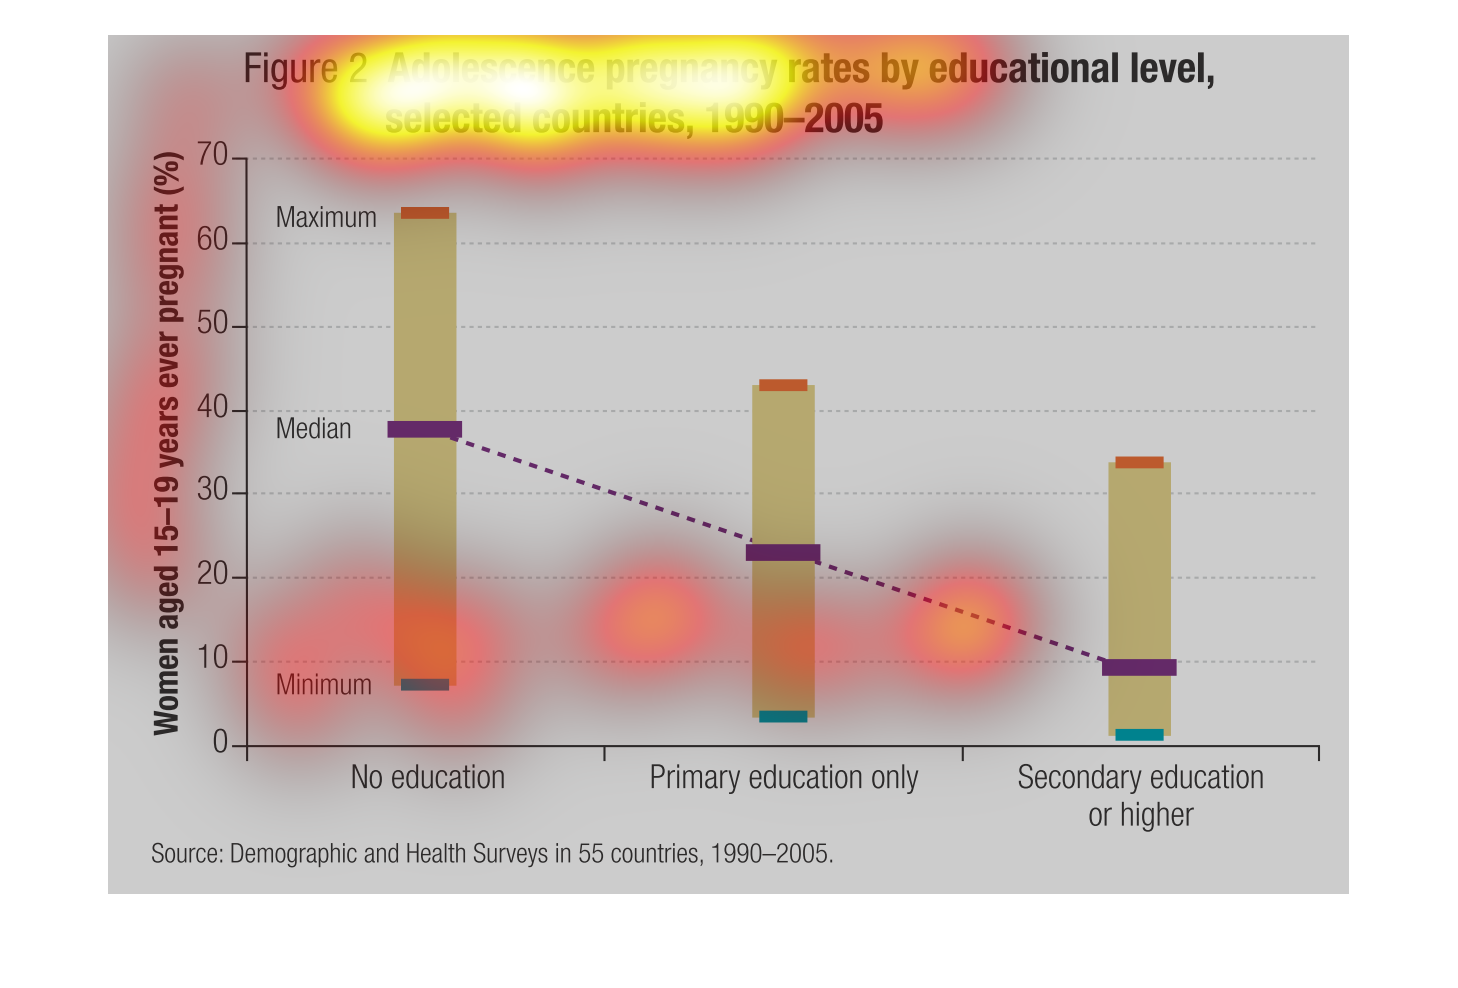
This chart is about adolescence pregnancies rates by educational level between 1990-2005.
Women between the ages of 15-19 that also have no education, have the highest pregnancy rates.
The rates decrease as women get a higher education.
This chart describes adolescence pregnancy rates by educational level in selected countries
for the years 1990 through 2005. The chart is divided into categories, including no education.
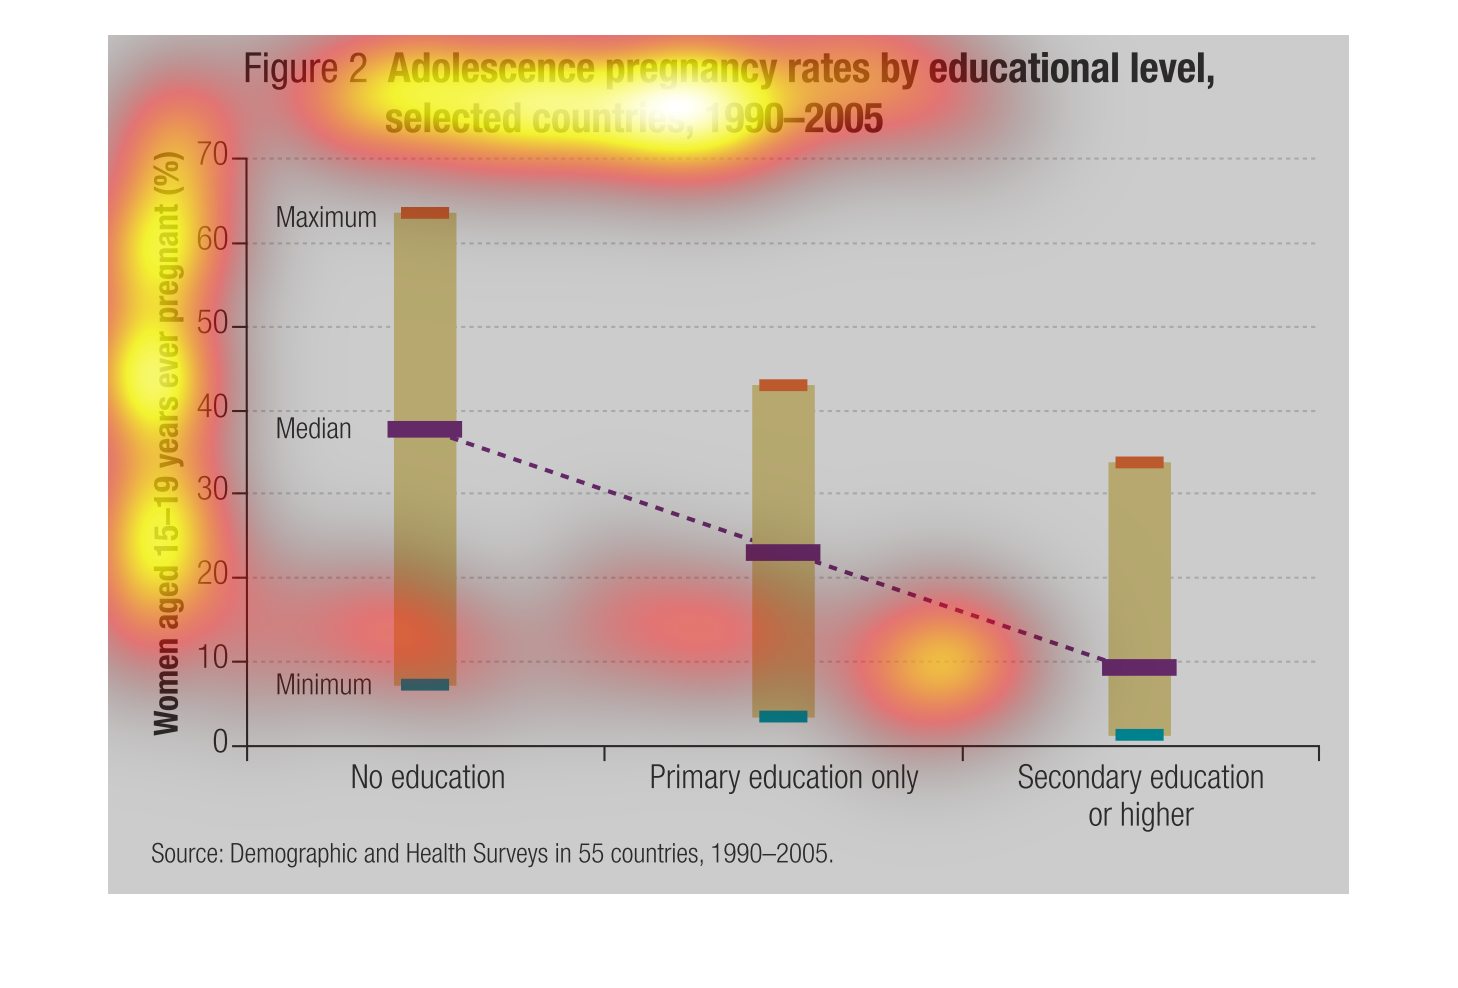
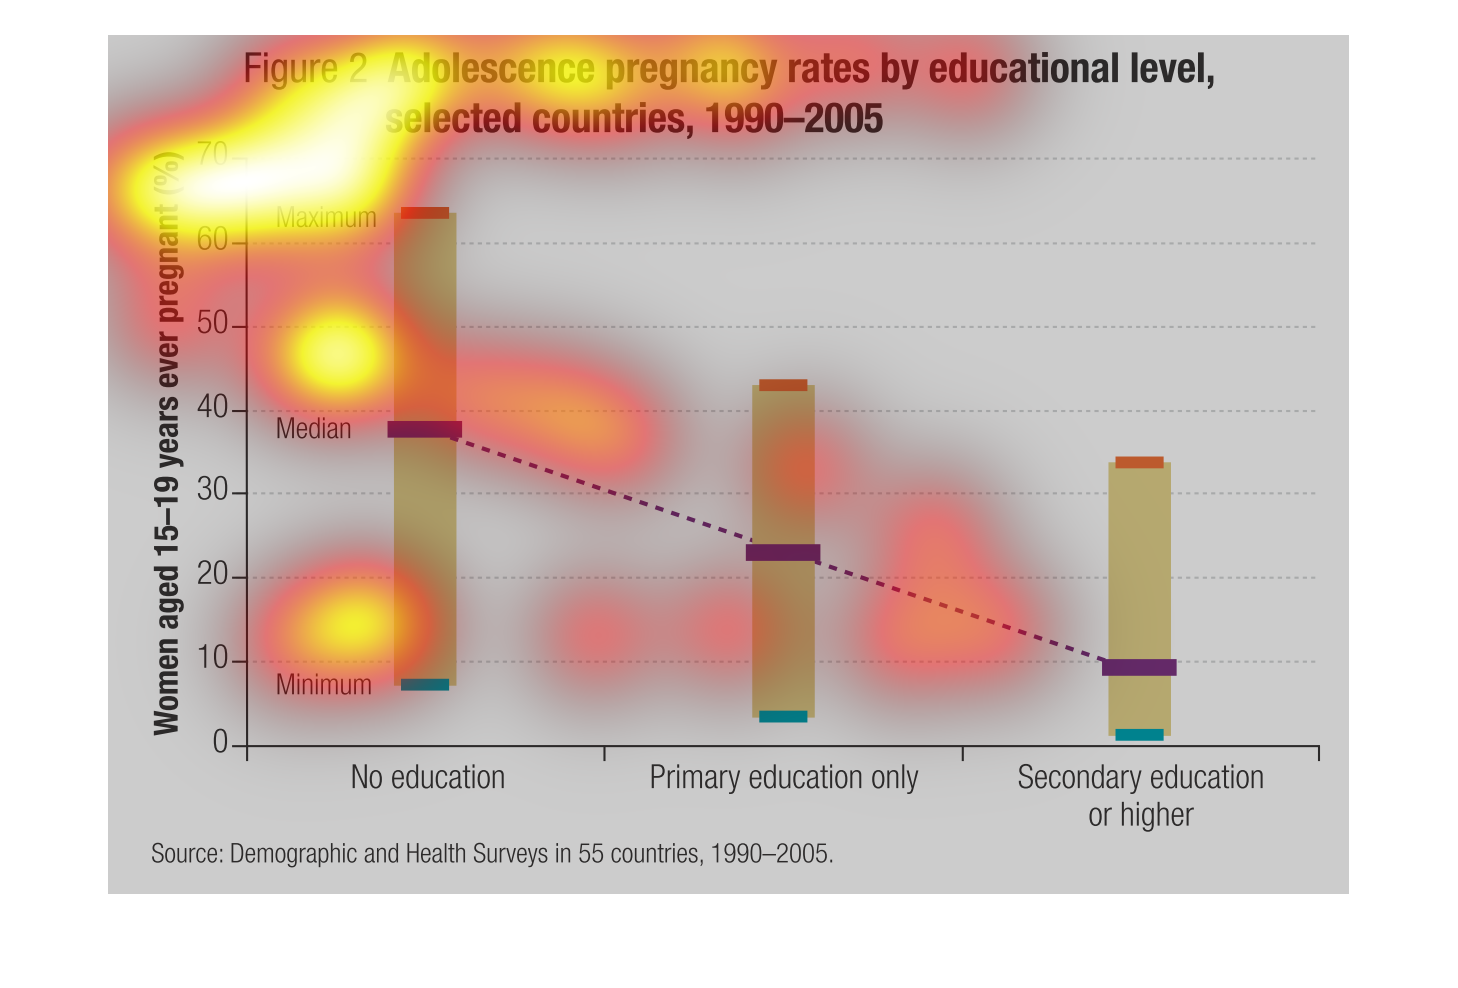
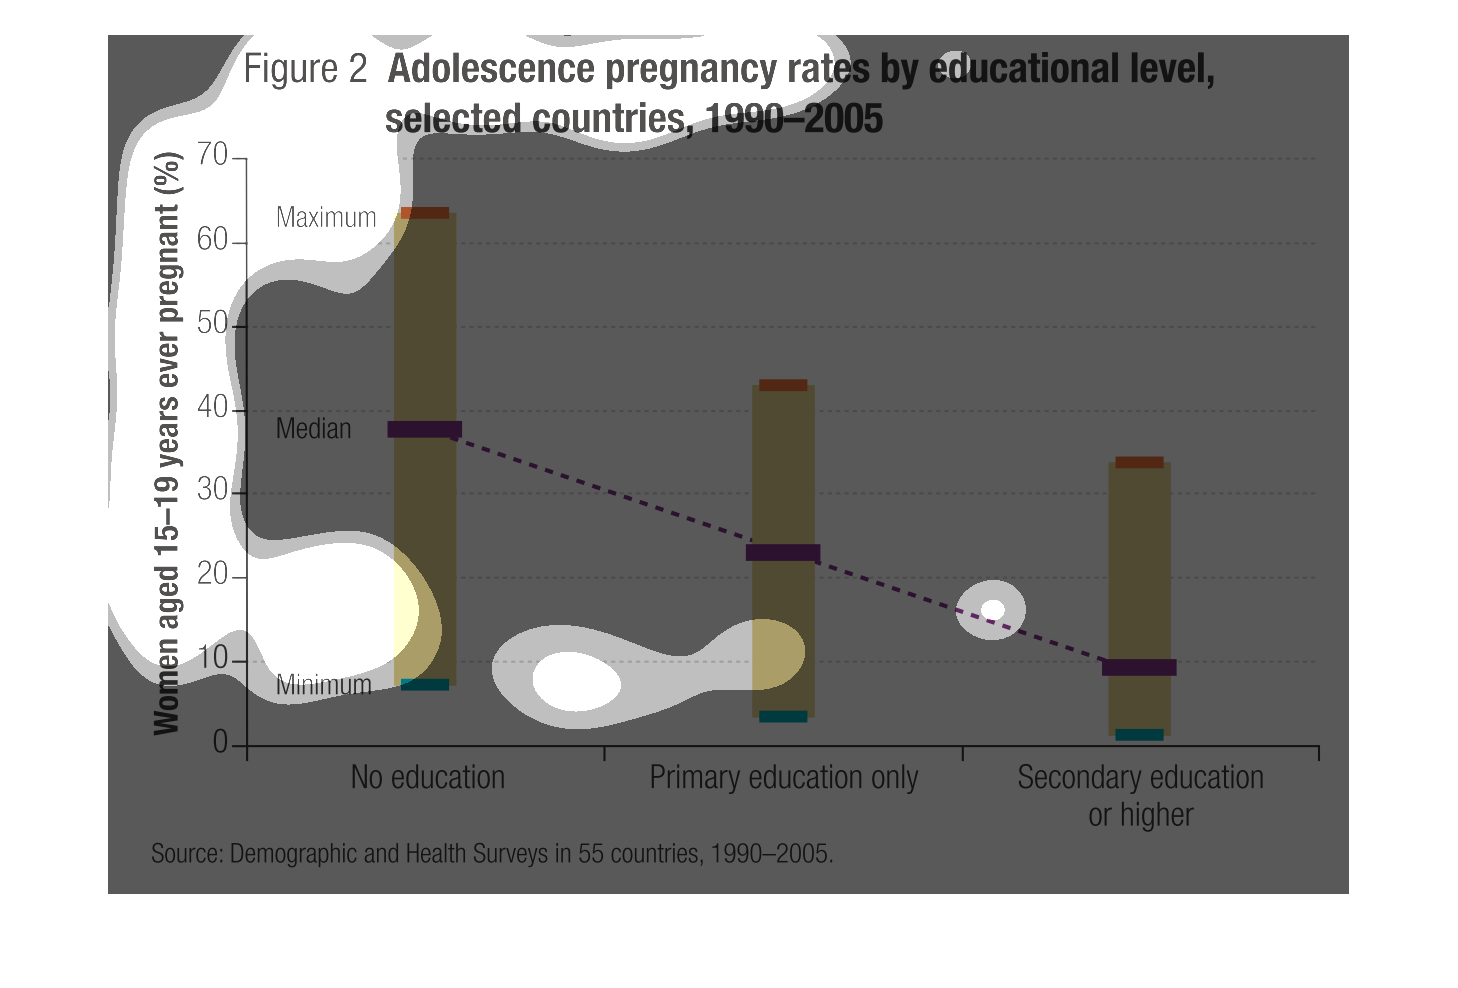
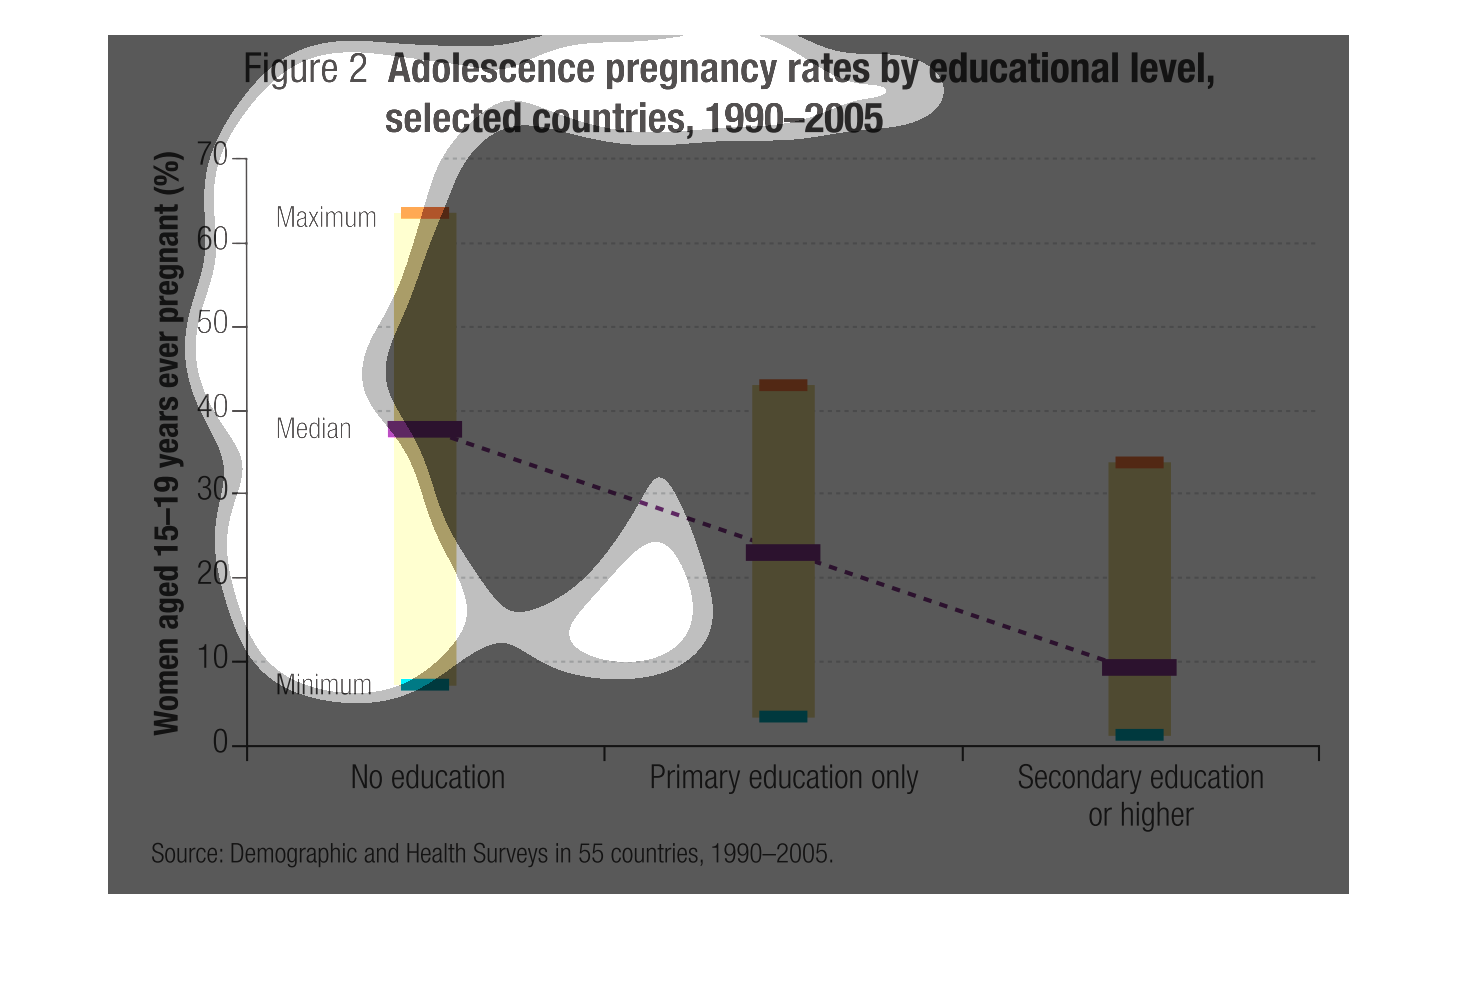
rates of teen pregnancy (age 15-19) by education level for 55 countries between 1990 and 2005.
Young women with no education show rates of pregnancy at least 20% higher during this time
than women with primary education or better.
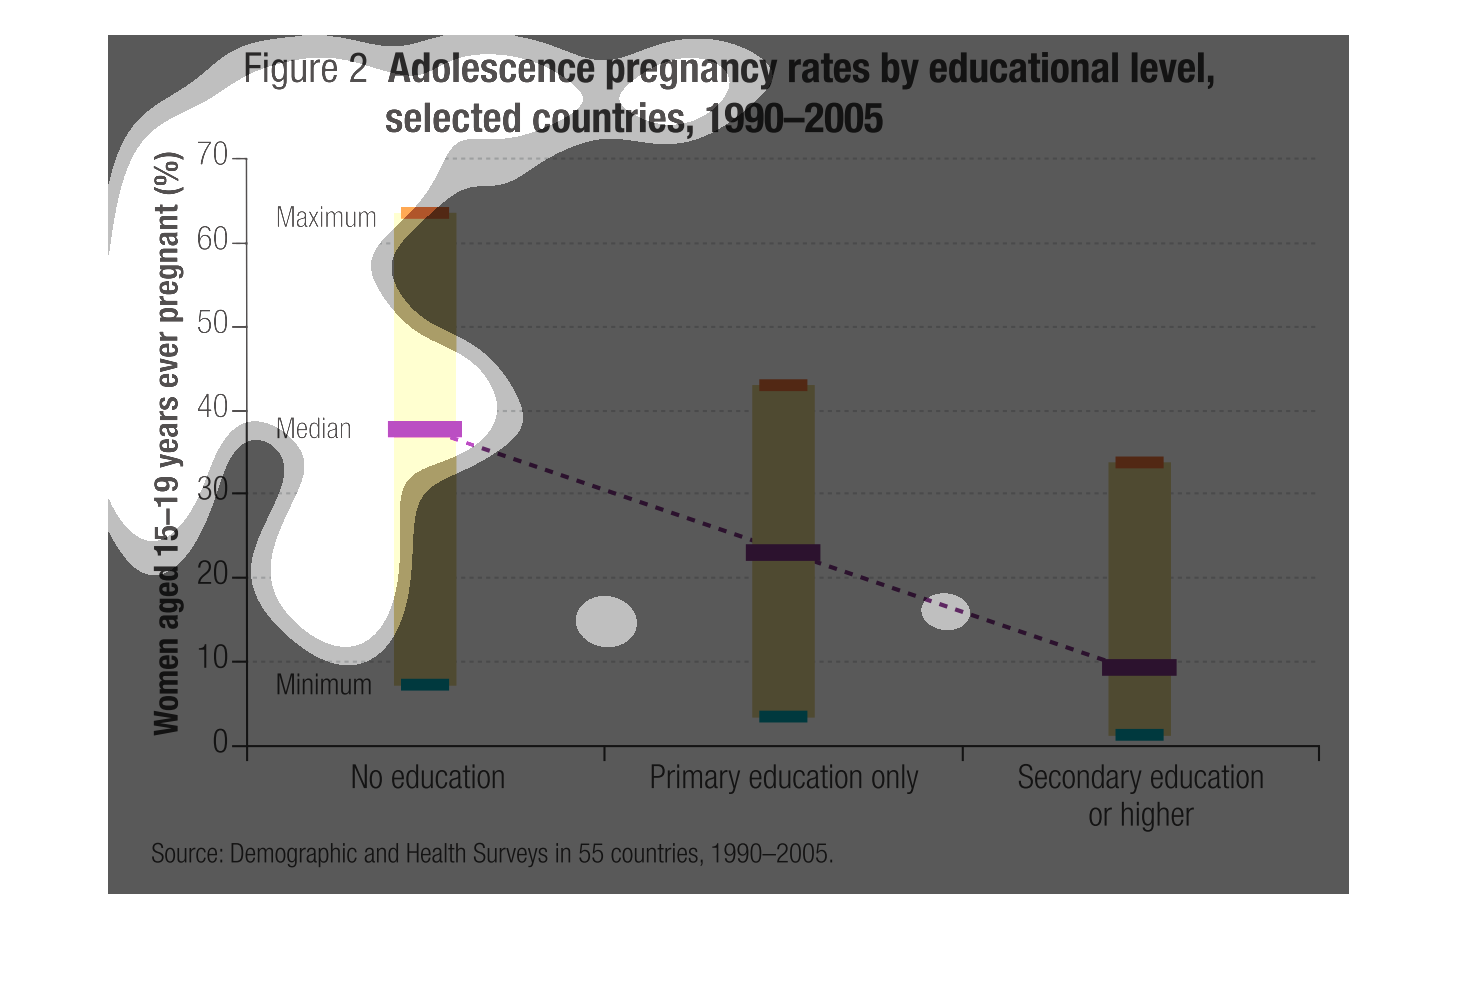
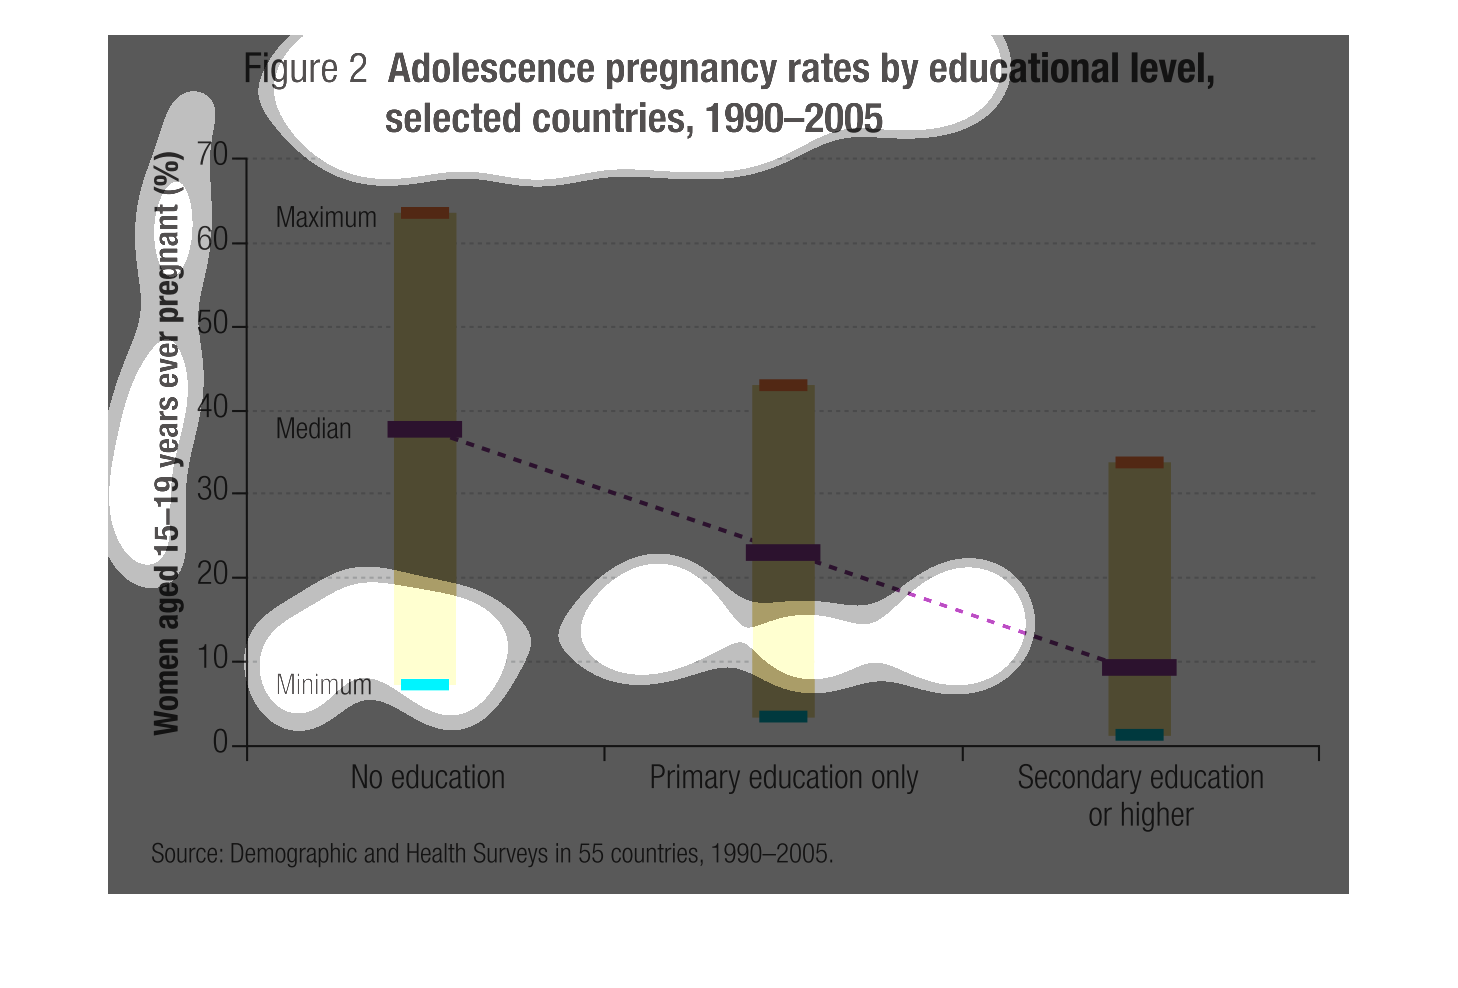
This graph shows the rates of adolescent pregnancy in relation to the educational level achieved
by the teens.  As educational level increases, the rates of adolescent pregnancy goes down.
This graph illustrates adolescent pregnant rates by selected countries from 1990 to 2005.
 IT shows the amount of women form age 15-19 that got pregnant by education level with no
education having the highest percentage of pregnancy.
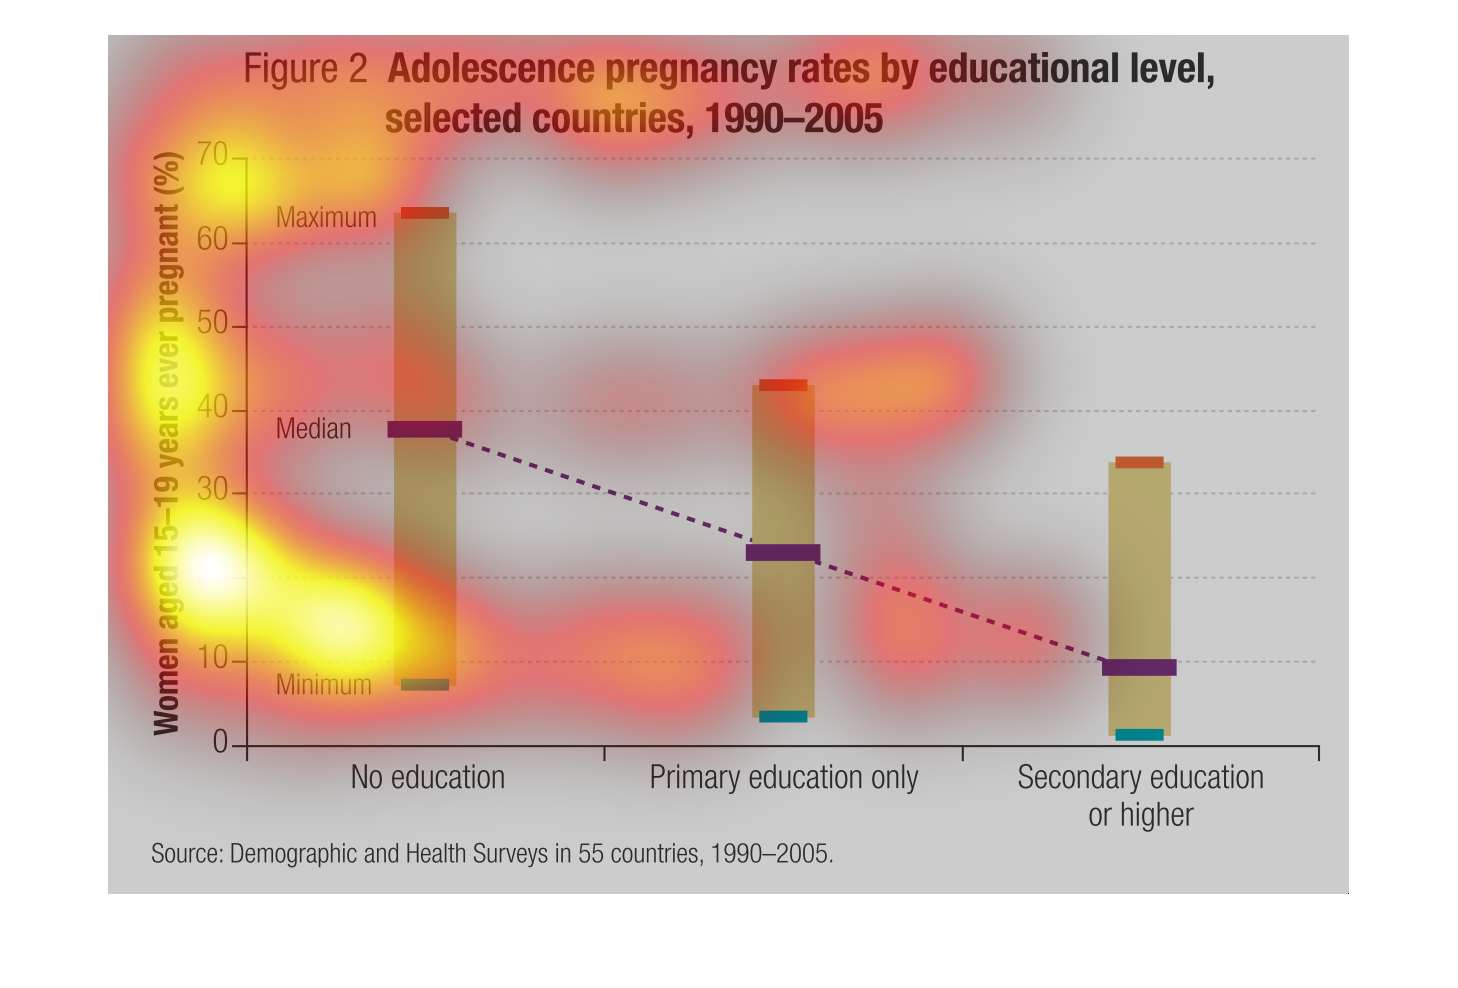
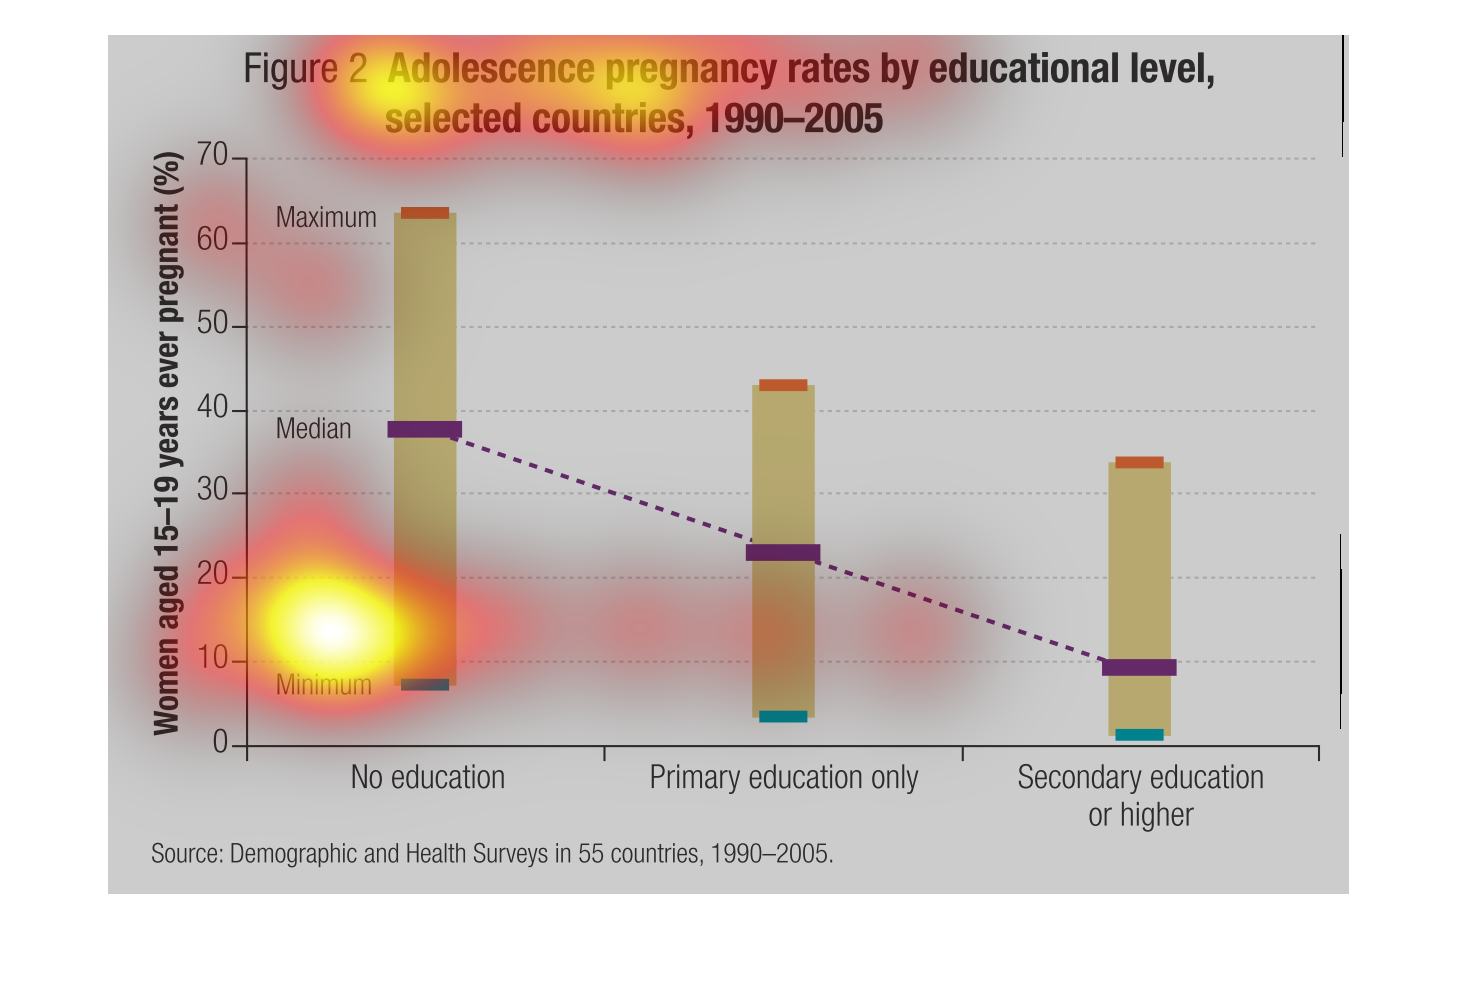
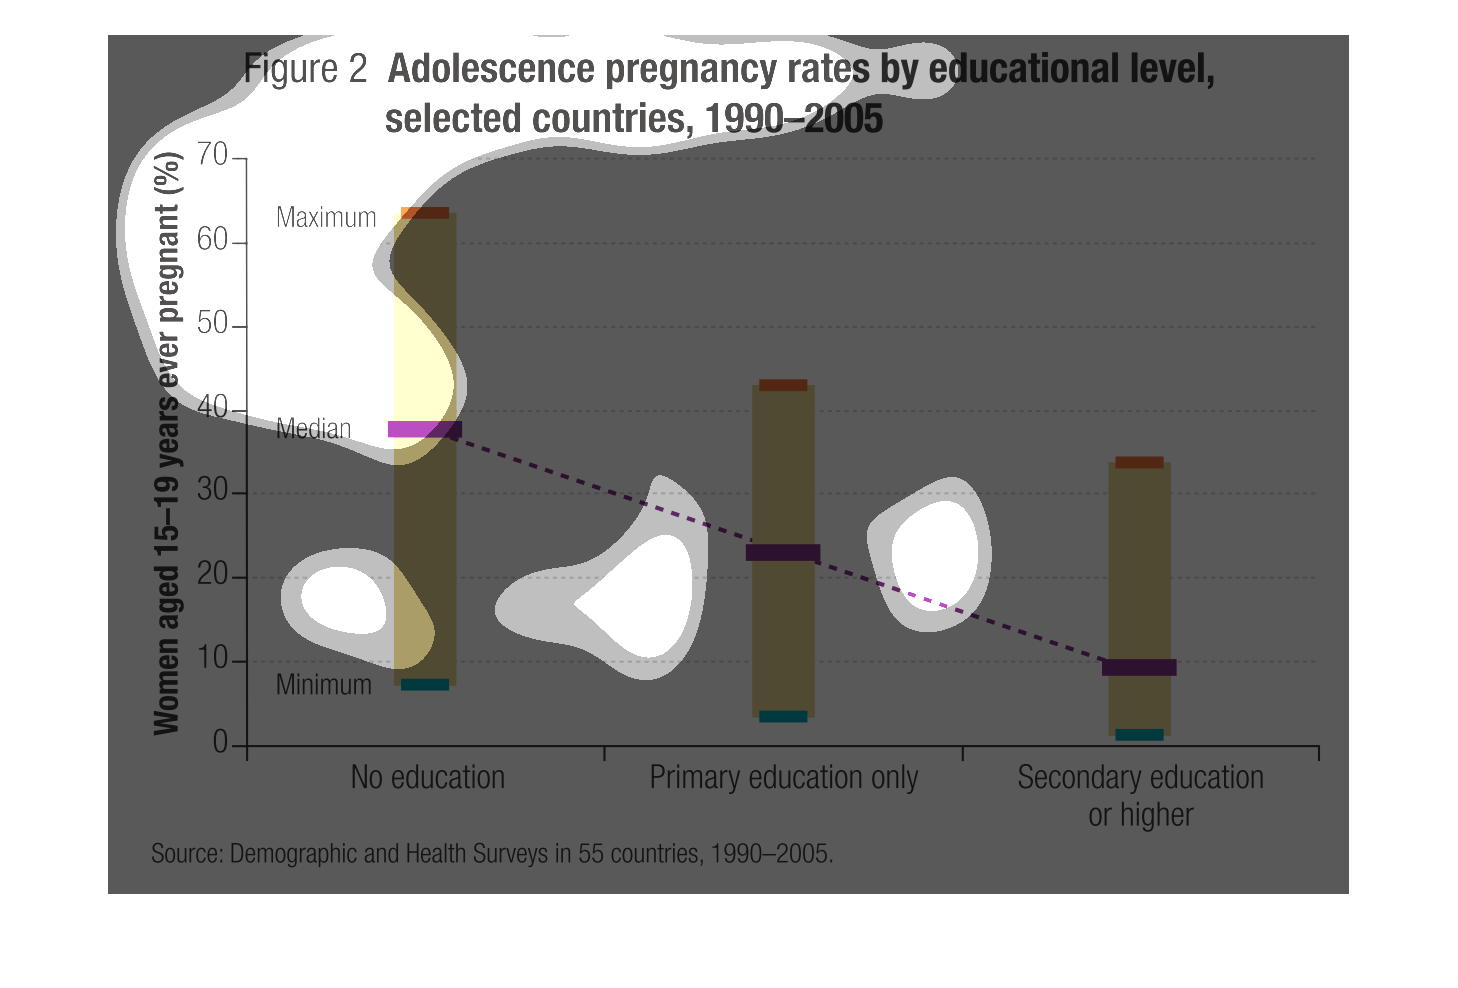
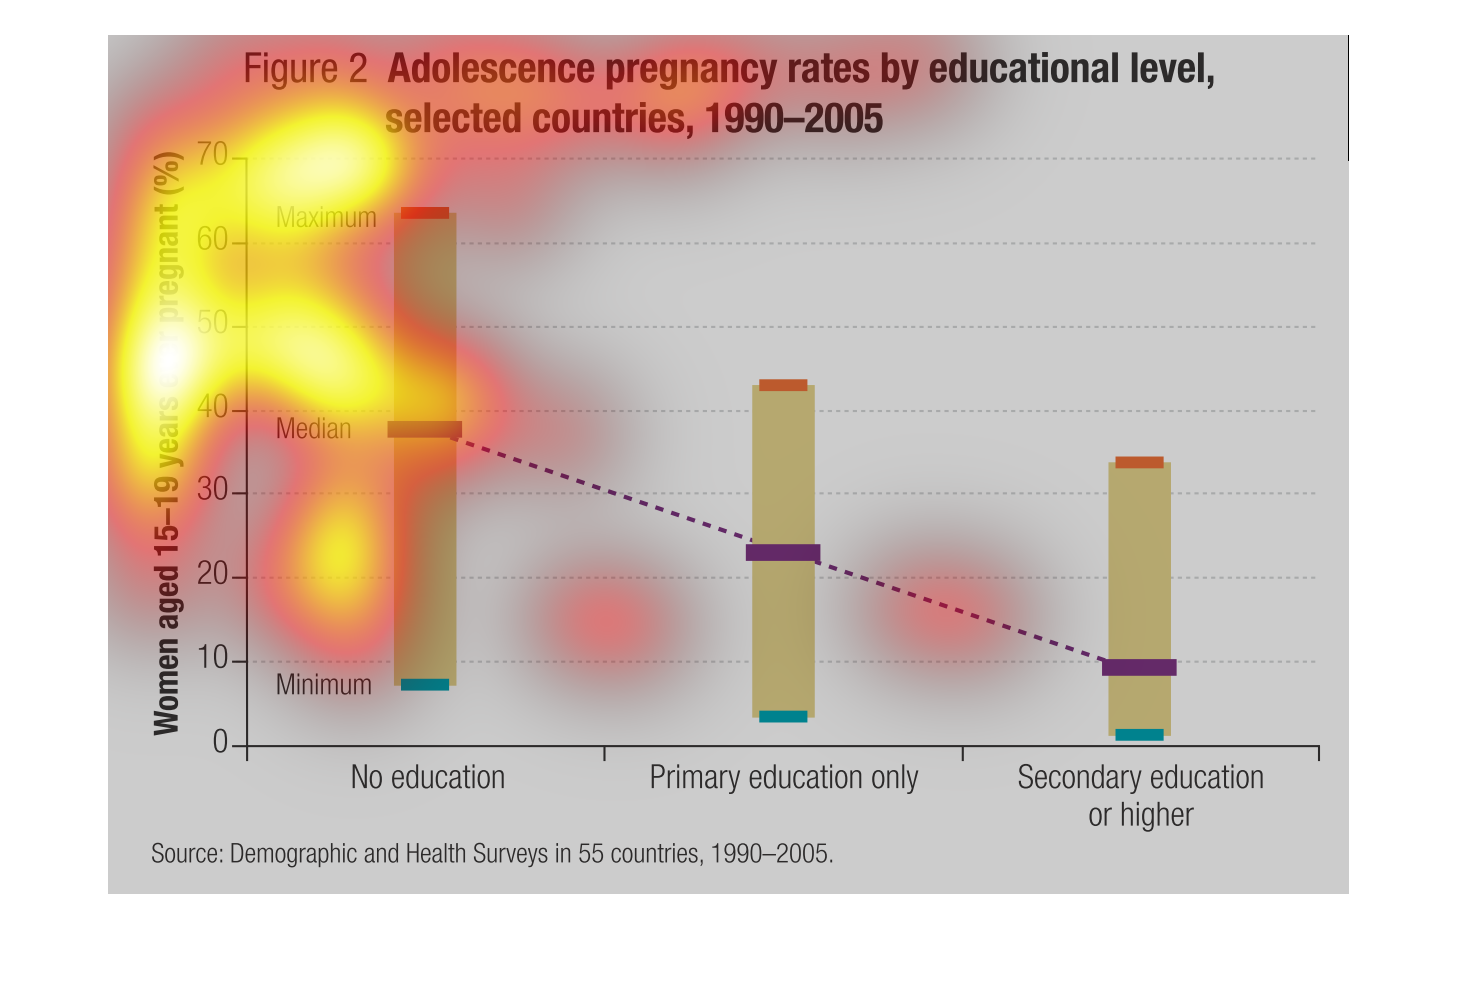
The graph looks at the prevalence of adolescent pregnancy based on educational levels in different
countries between the years of 1990-2005.   It measures the percentage of women between 15-19
that have ever been pregnant.  The graph depicts that there is a direct relationship between
lower levels of education and higher occurrences of pregnancy.

Adolesence Pregnancy rates by educational level, selected countries 1990-2005. This shows
the percentage of women aged 15-19 ever pregnant byt their educational levels.
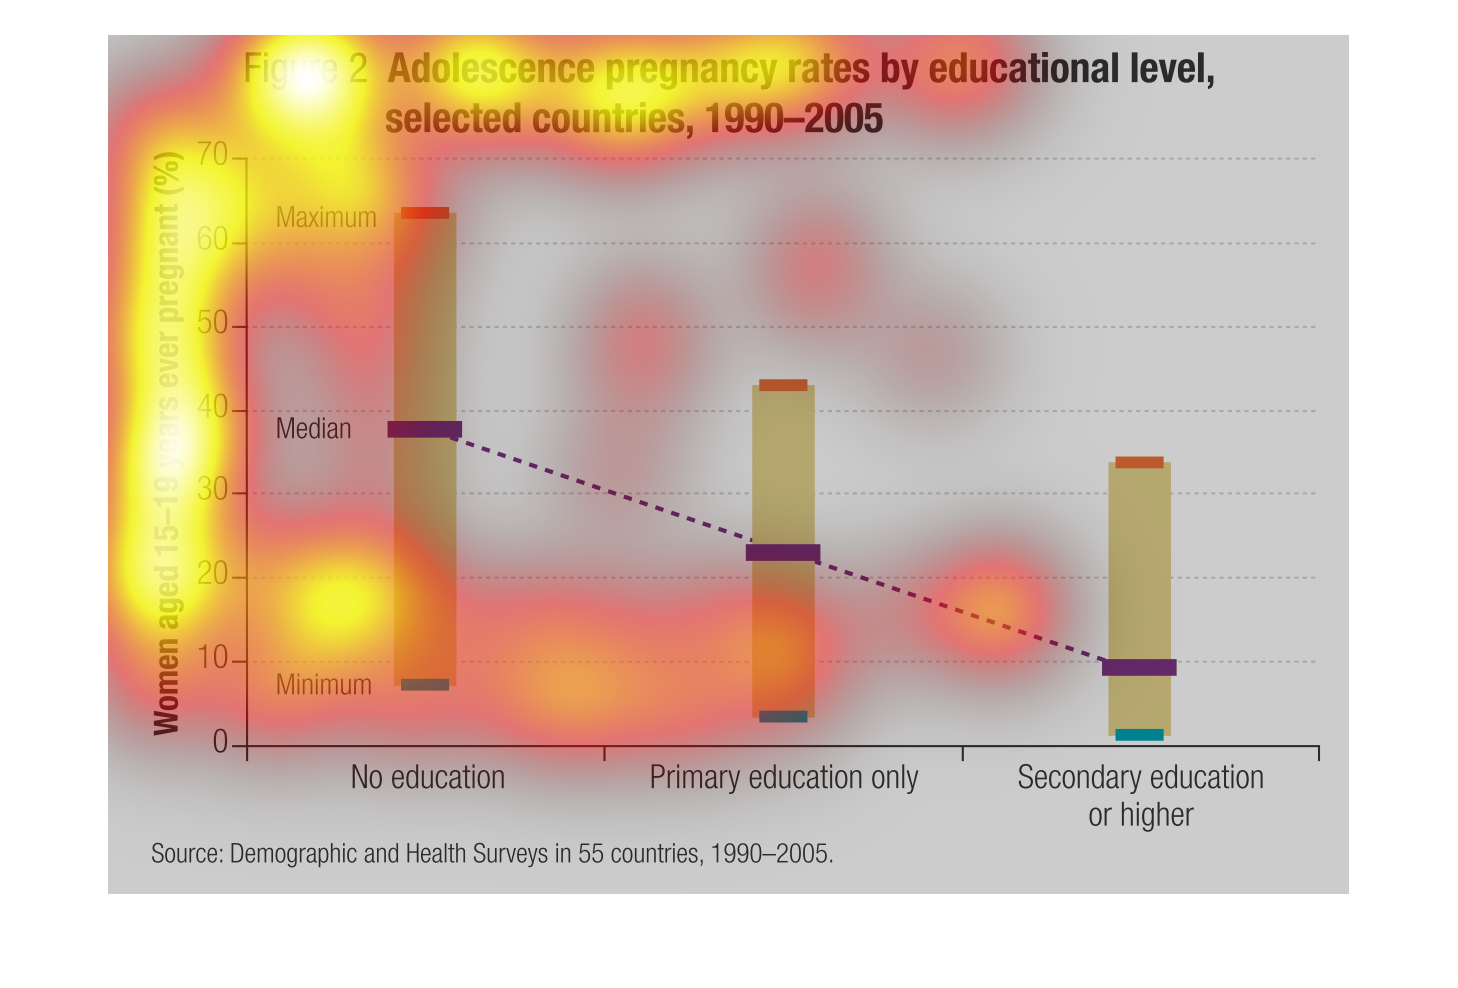
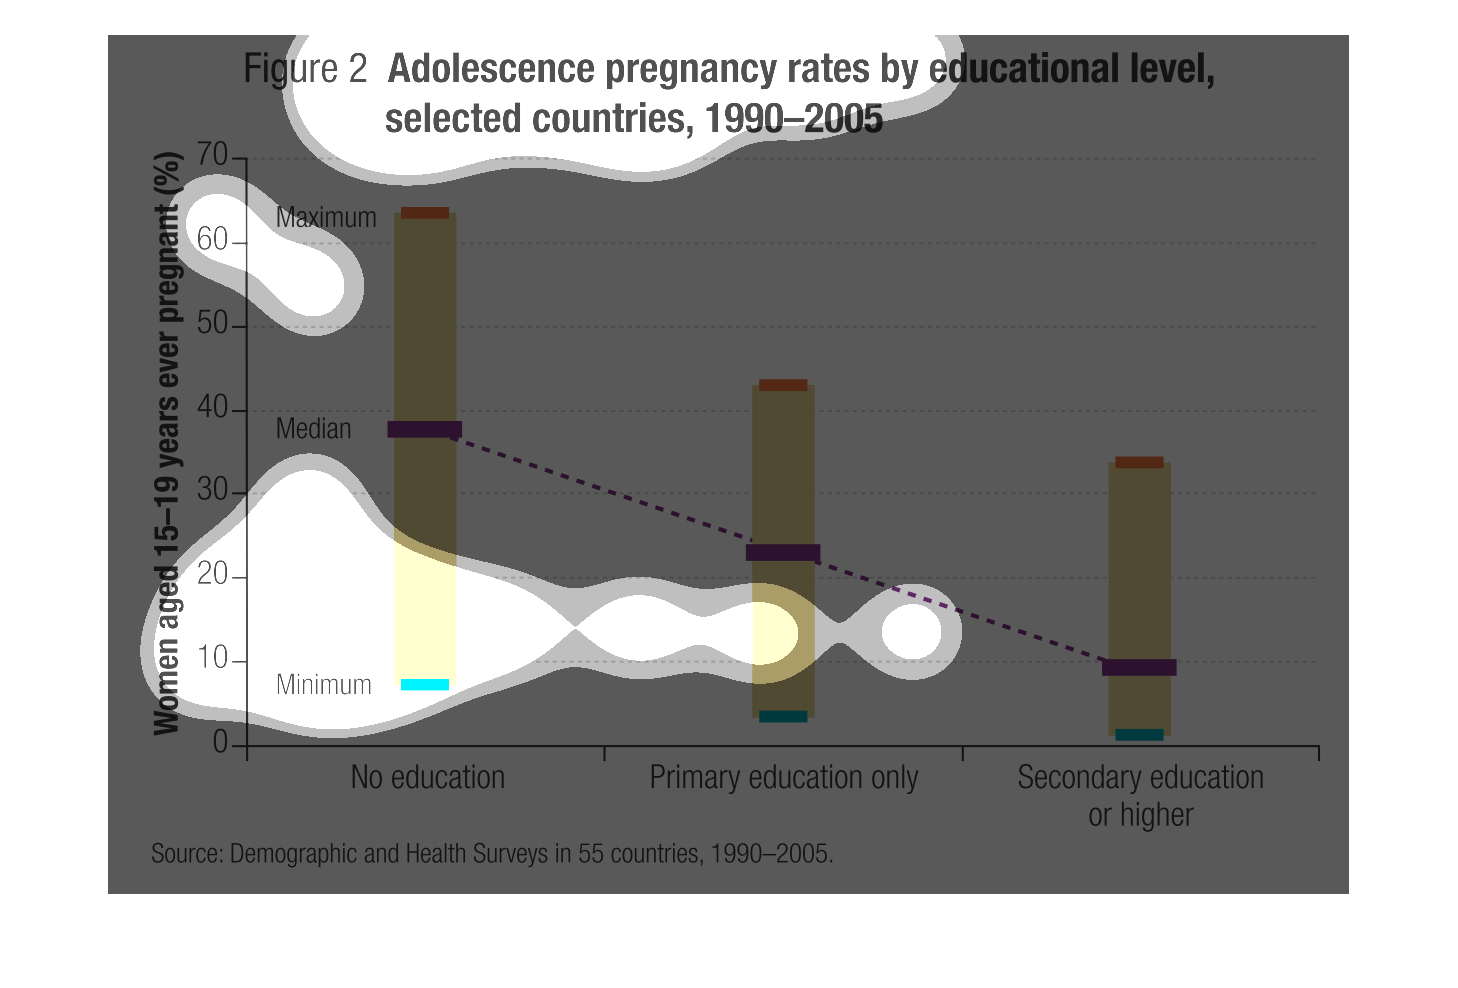
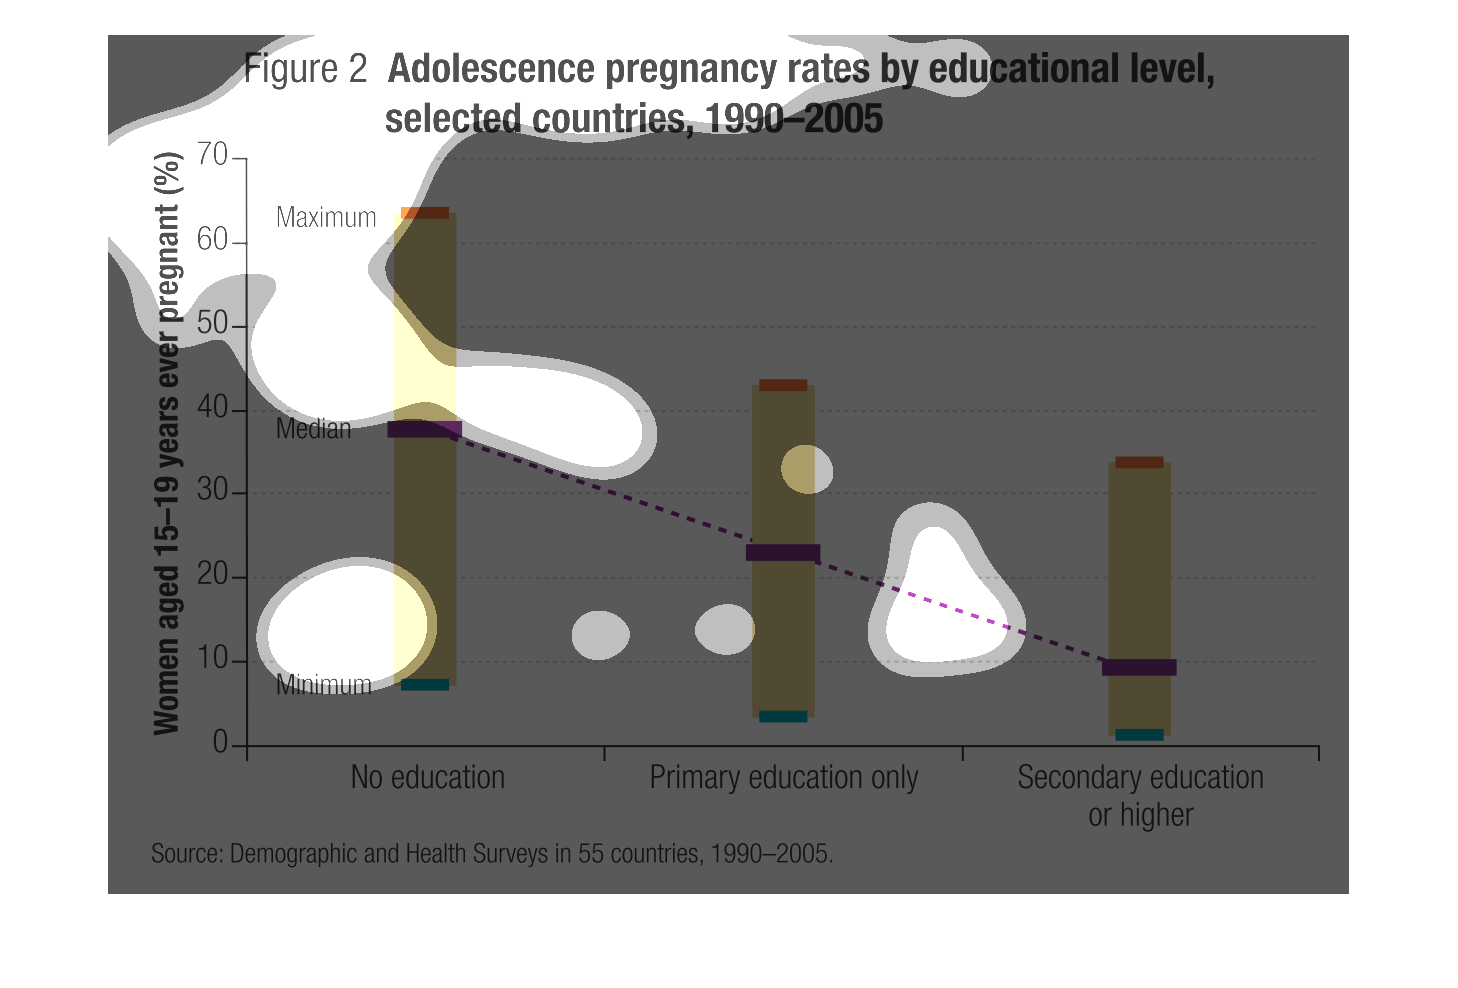
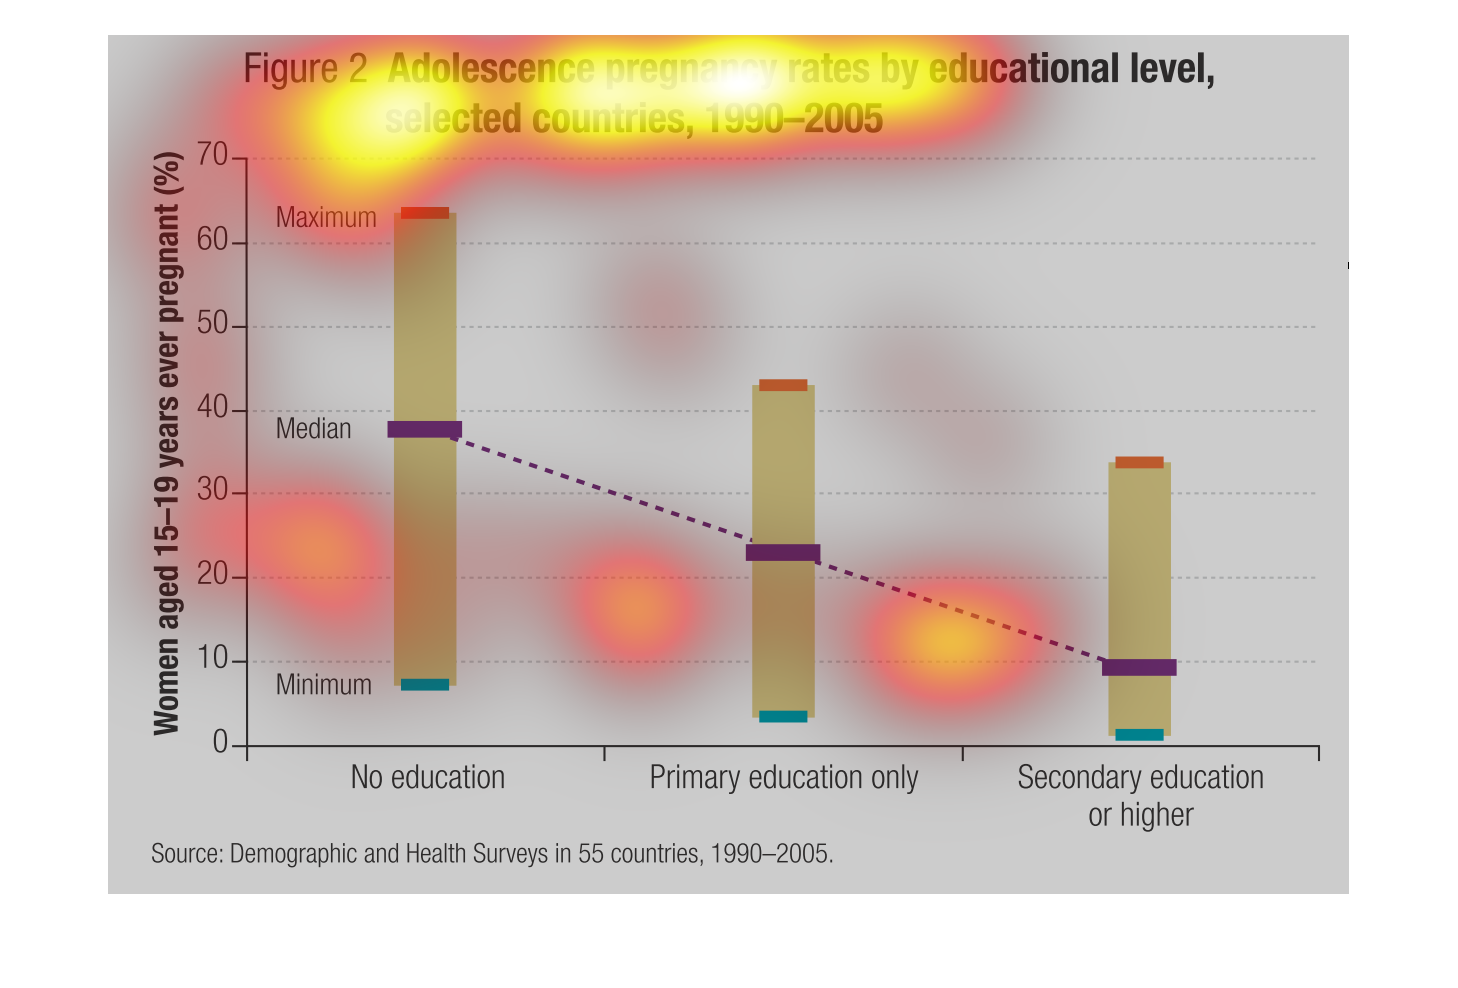
This bar graph shows pregnancy rates in adolescents from 1990-2005. The 3 groups are no education,
primary education, and secondary education or higher. The yellow bars shows the percentage
of 15-19 year old women who are pregnant and the purple dashed line shows the median. Overall,
the graph shows that more highly educated women tend to get pregnant as teenagers less often.
The following chart gives the adolescent pregnancy rate for different ages. The survey was
poled in different countries from the years 1990-2005. The highest rate was for those with
 no  education.
This graph shows pregnancy rates in adolescences by educational level in selected countries.
The graph shows the percentage of women pregnant based on their levels of education.
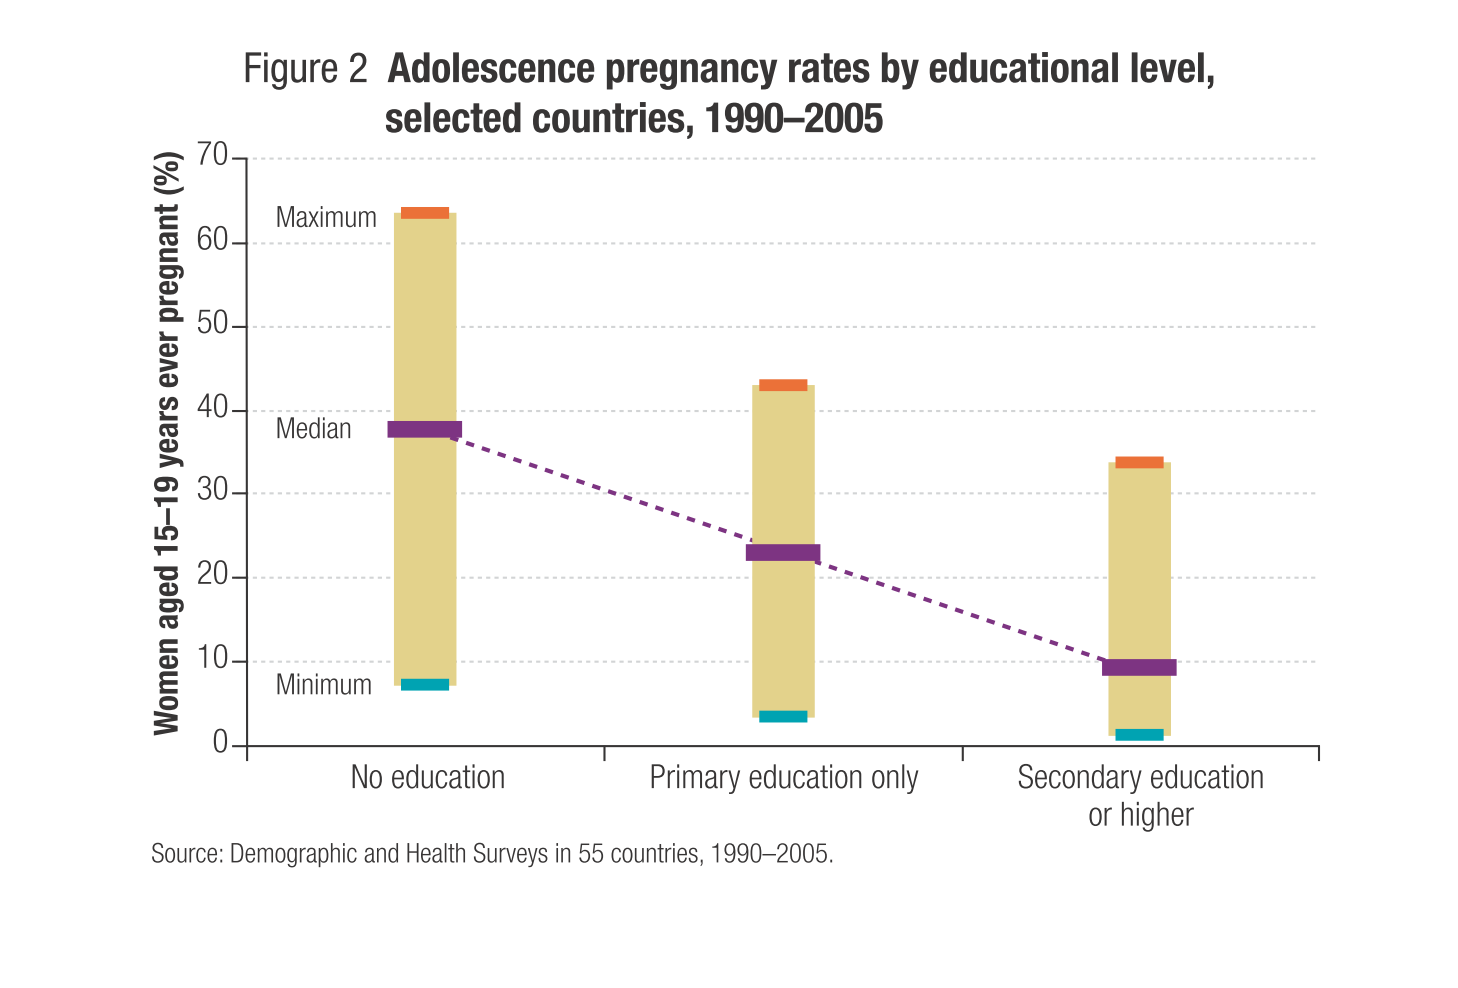
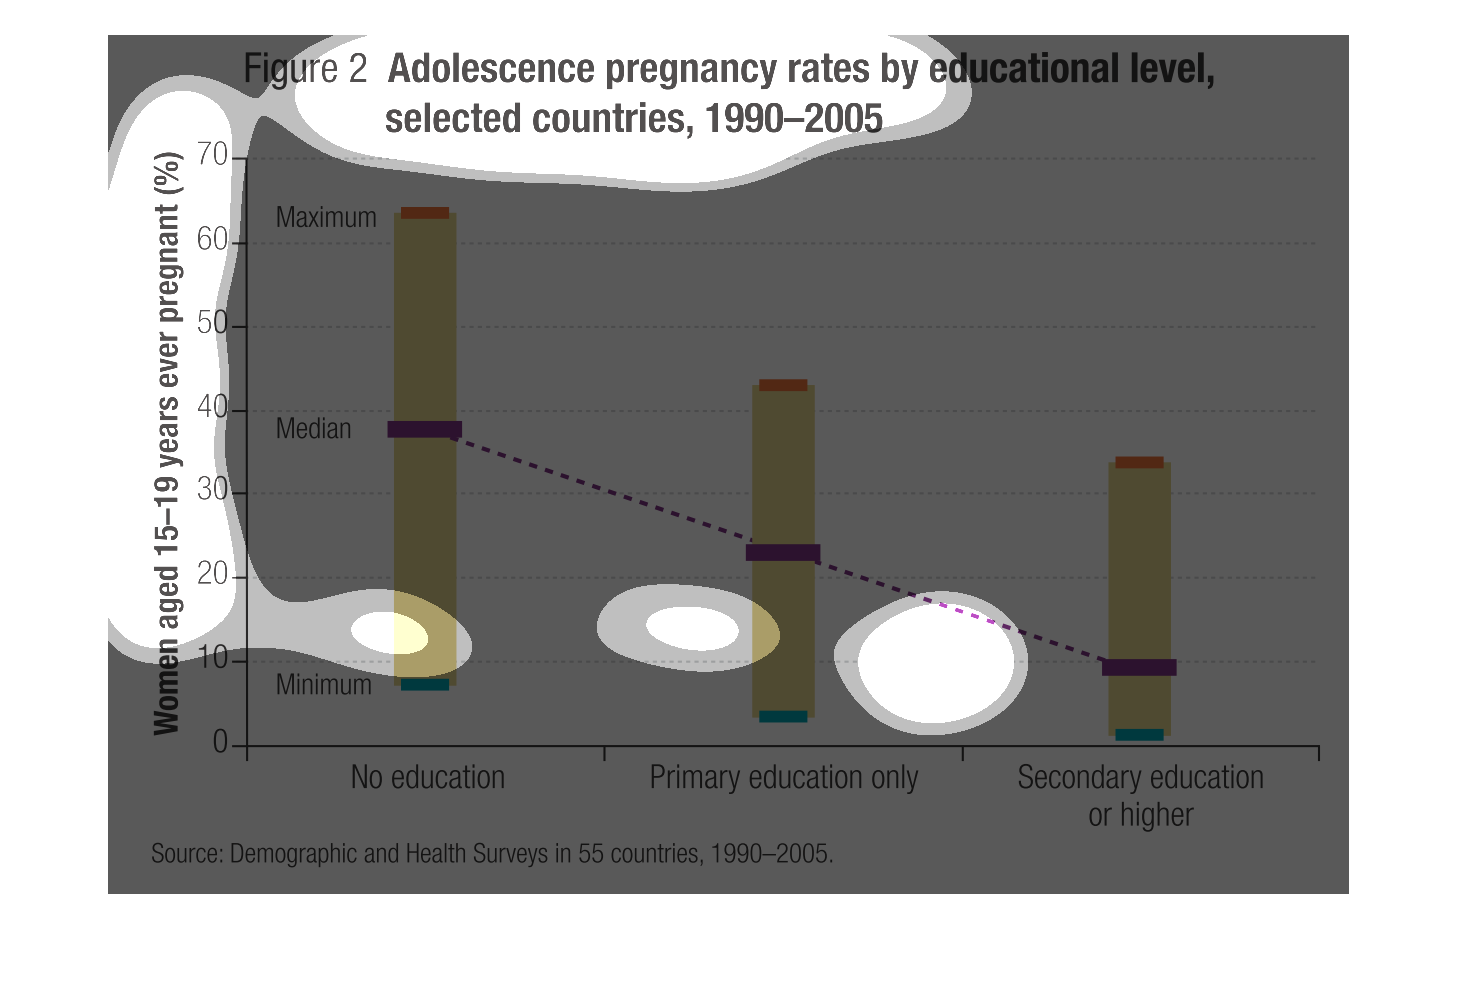
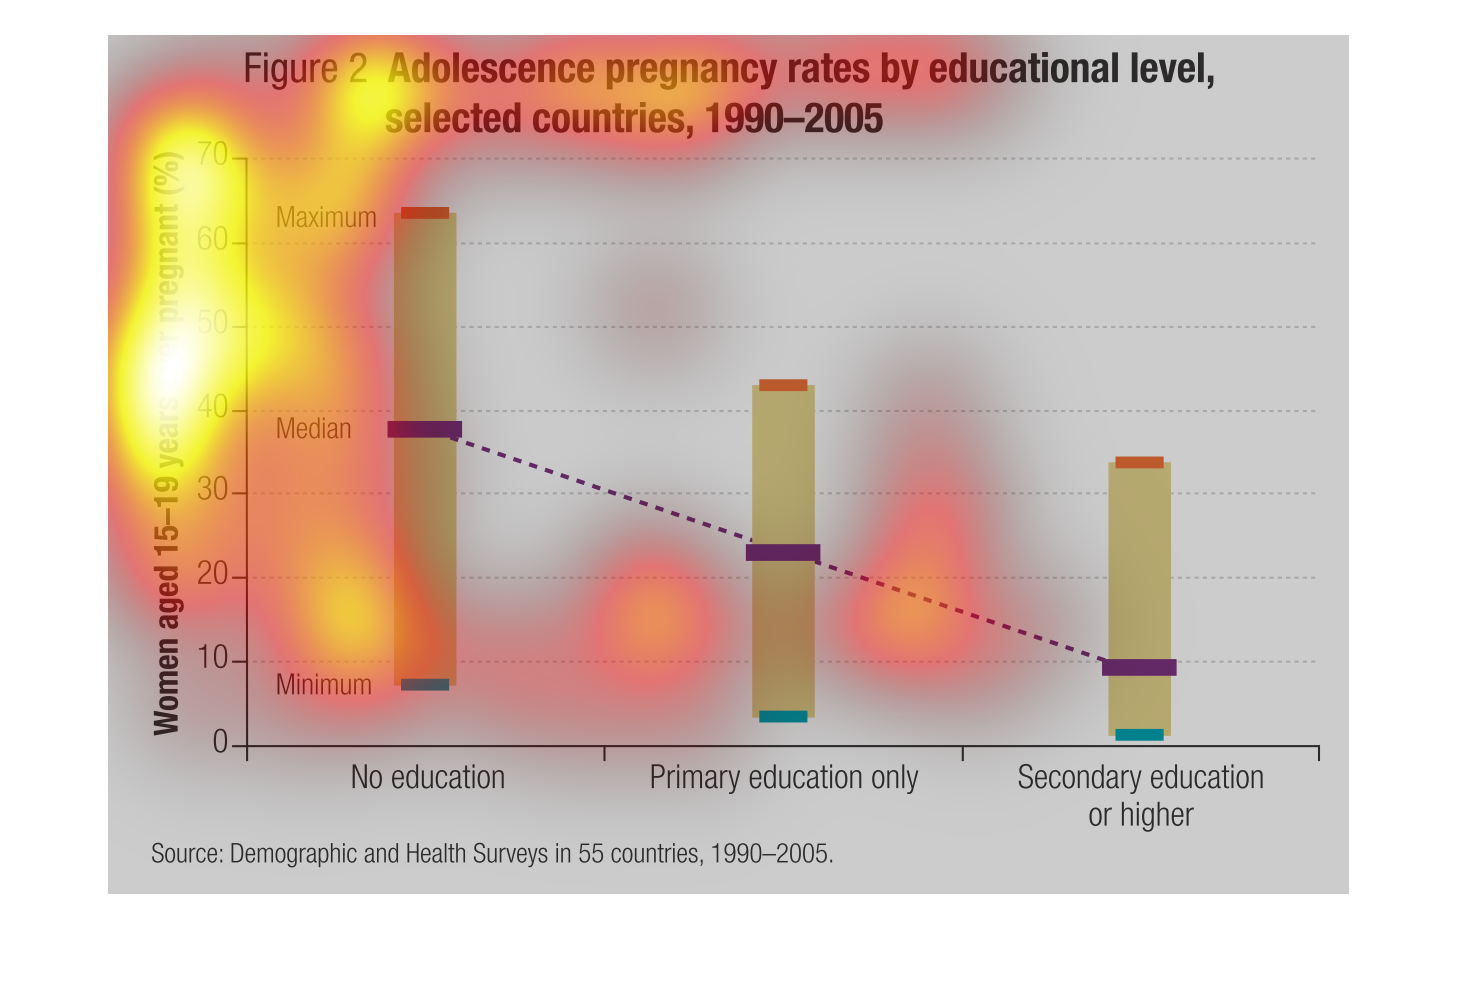
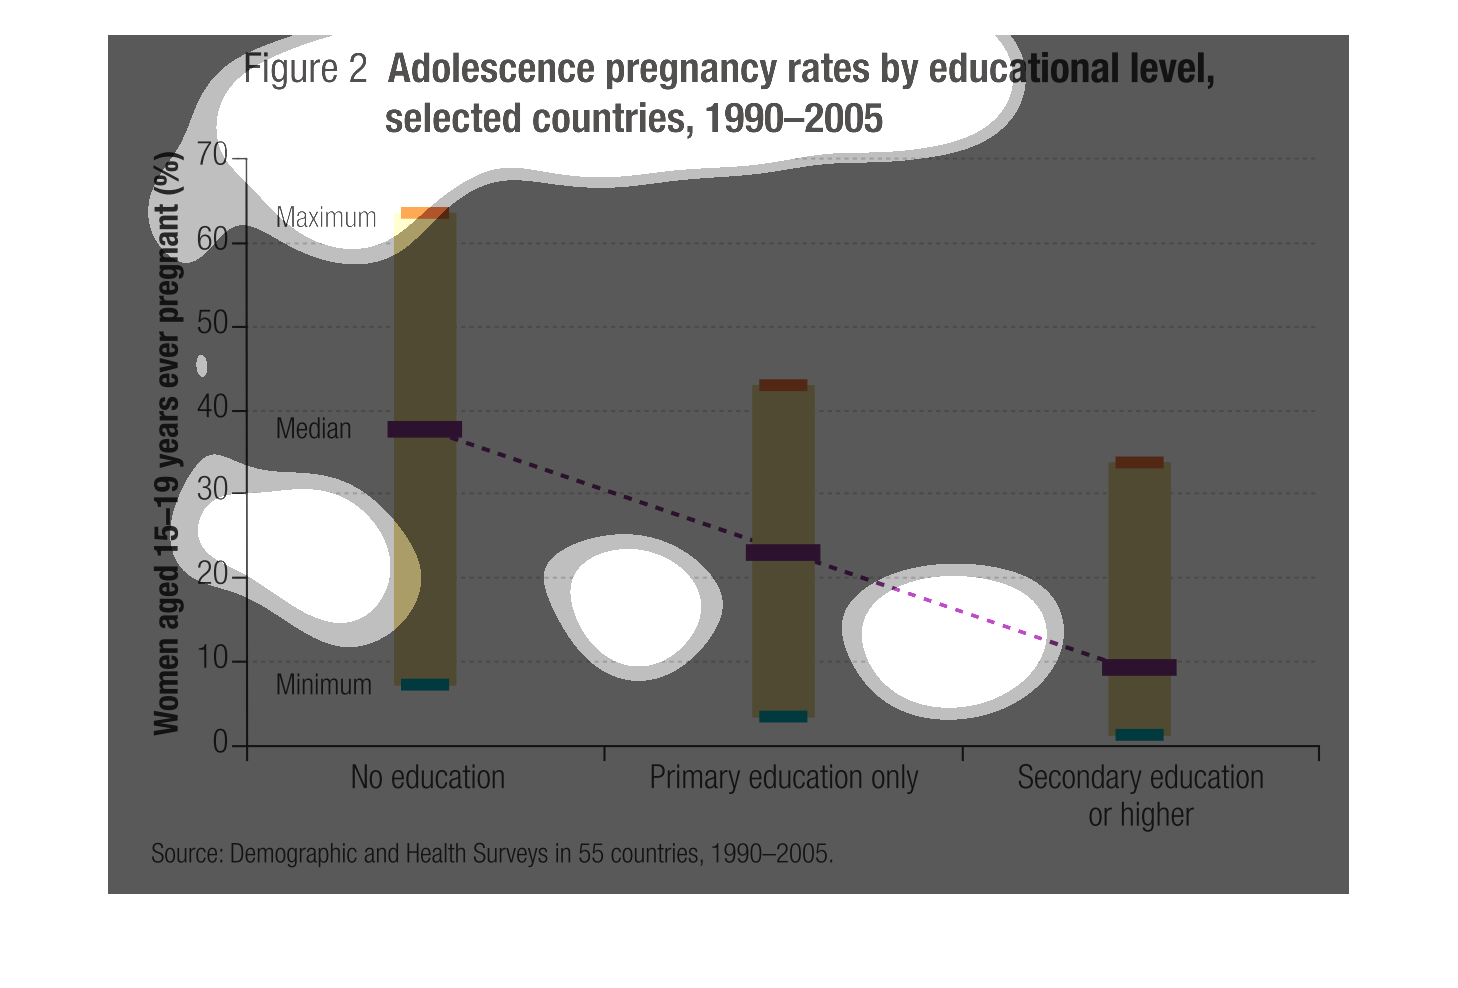
The caption for this graph is, "Adolescent pregnancy rates by educational level, selected
countries, 1990-2005".  There are three vertical columns representing the three educational
levels and the rate of pregnancy for these adolescents.  The highest level of pregnancy levels
being found where the adolescents had no education.  In the middle column at a lower rate
is adolescents with at least a primary education.  And the lowest pregnancy levels being found
where adolescents had access to secondary education or higher.
The graph shows adolescence pregnancy rates by educational levels in selected countries ranging
from 1990 through 2005. Those with no education have the highest rate for pregnancy.
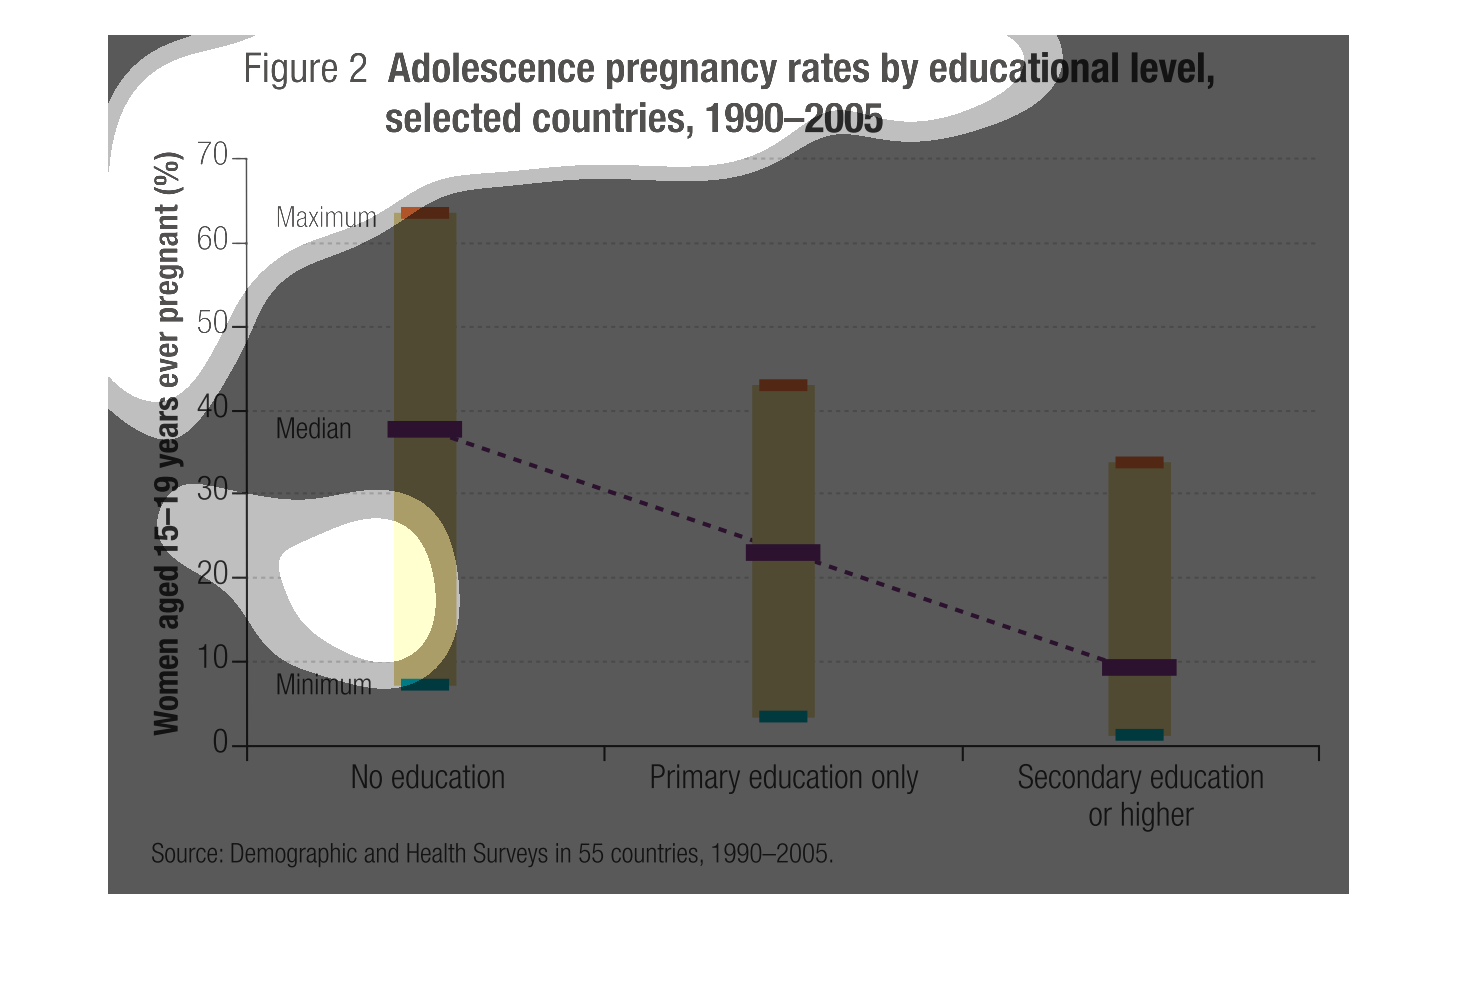
This is a graph about adolescence pregnancy rates by educational level in select countries.
It shows that pregnancy rates average about 40 percent in people with no education, about
20 percent in people with primary education only, and less than 10 percent in people with
secondary education or higher.