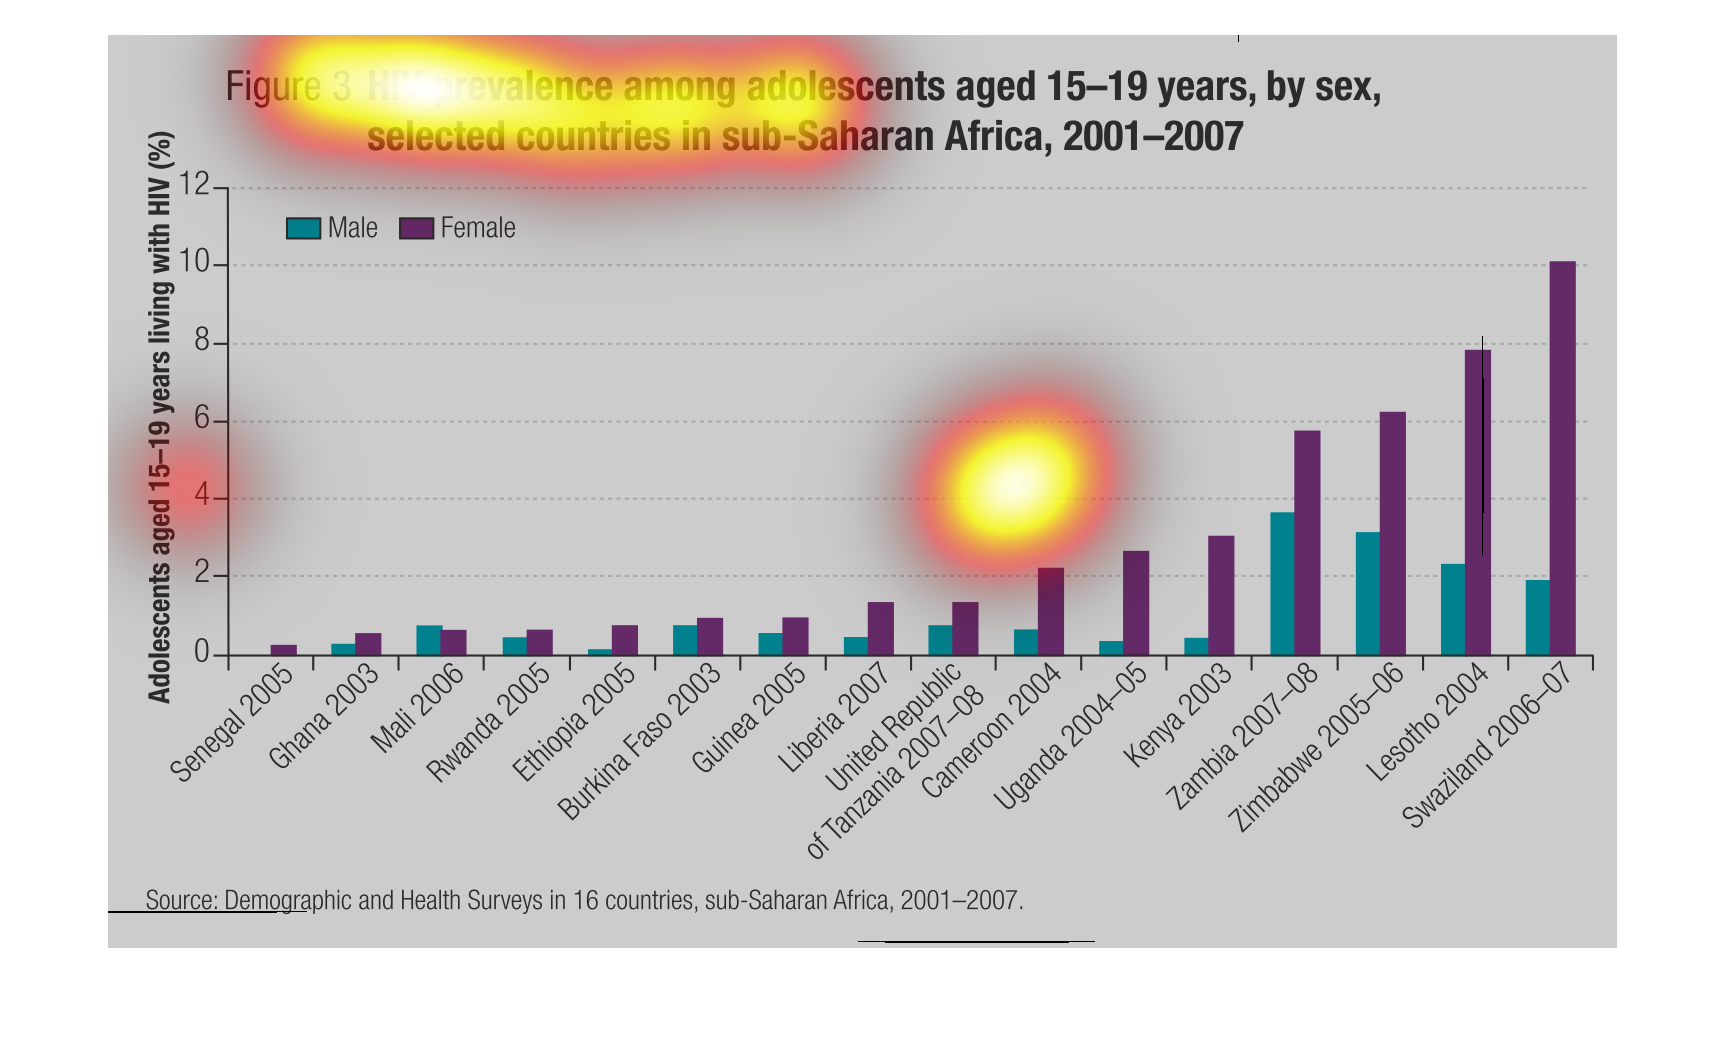
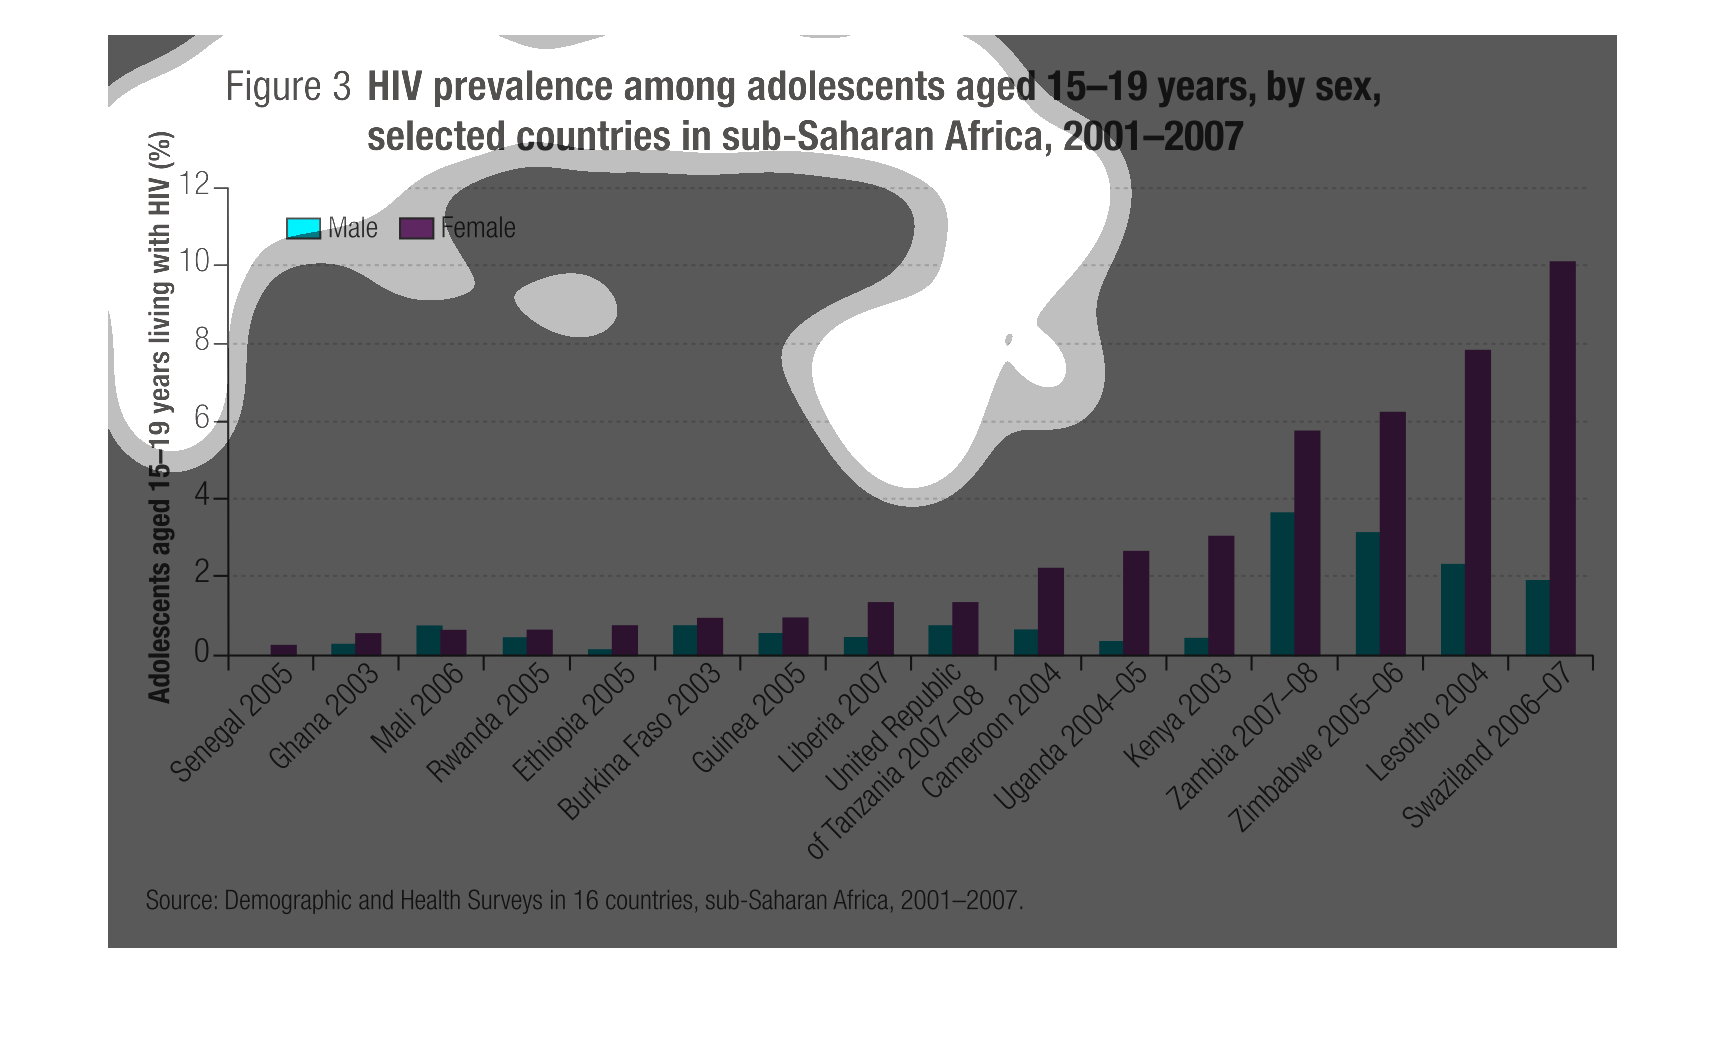
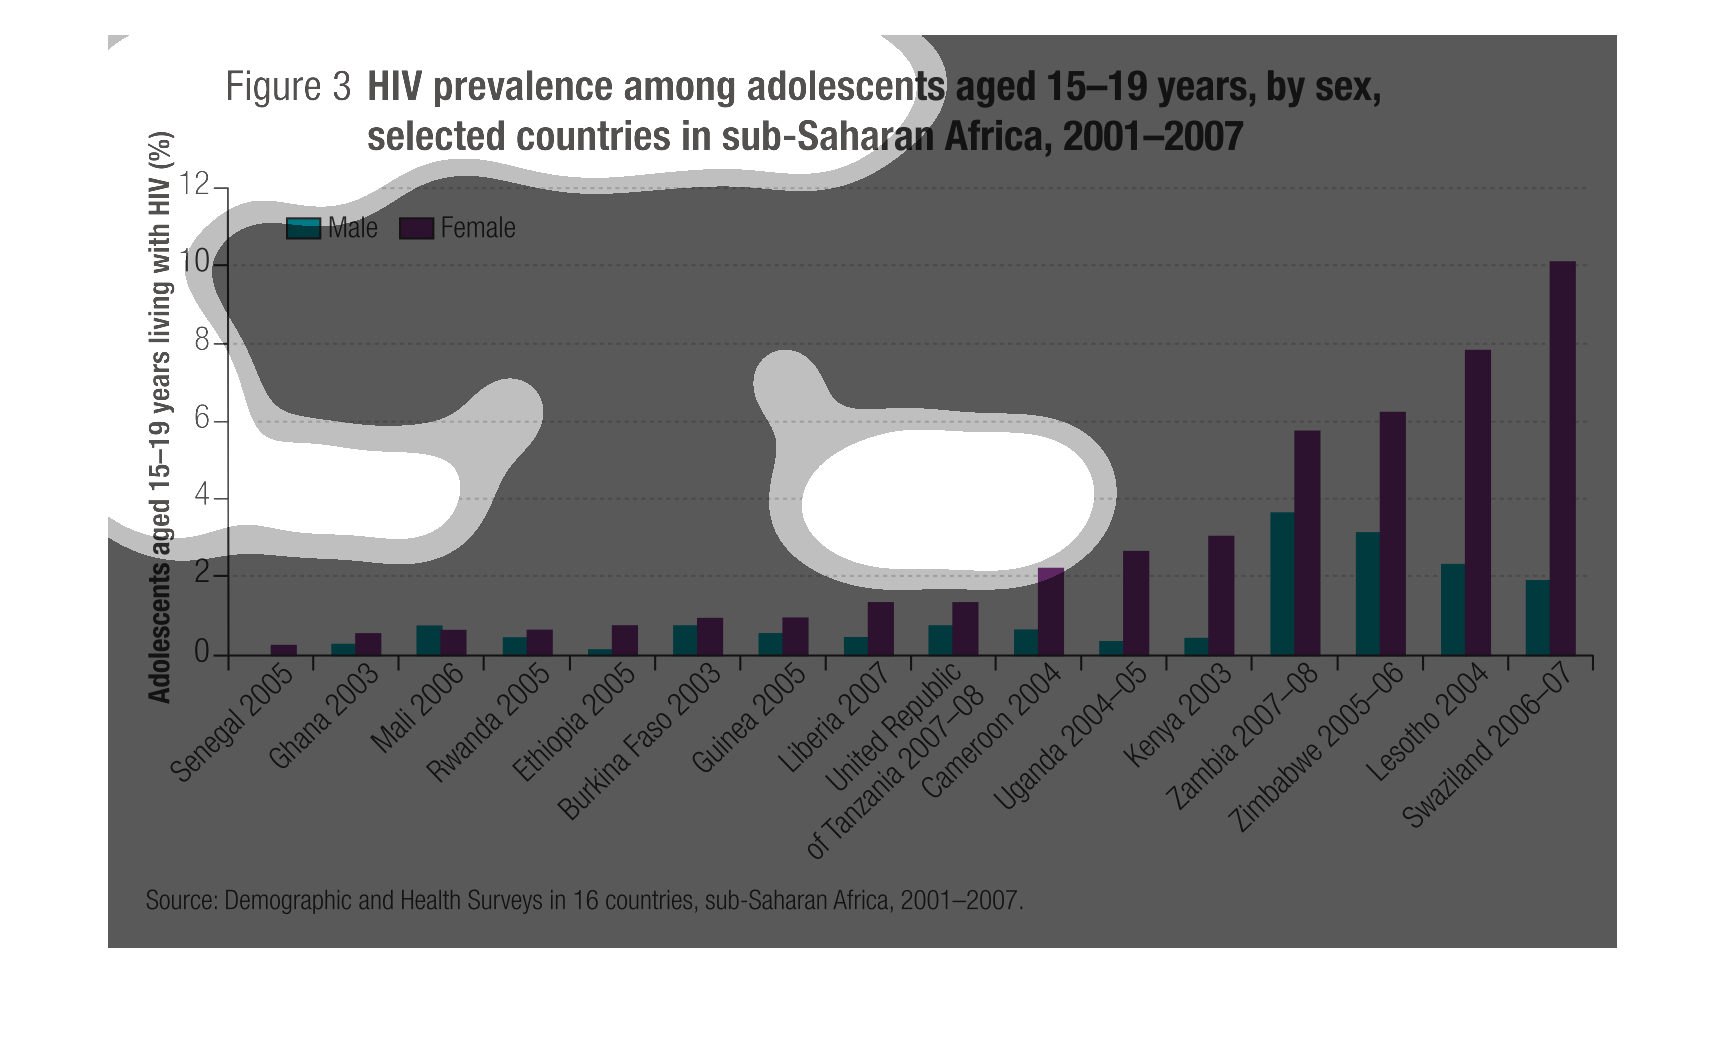
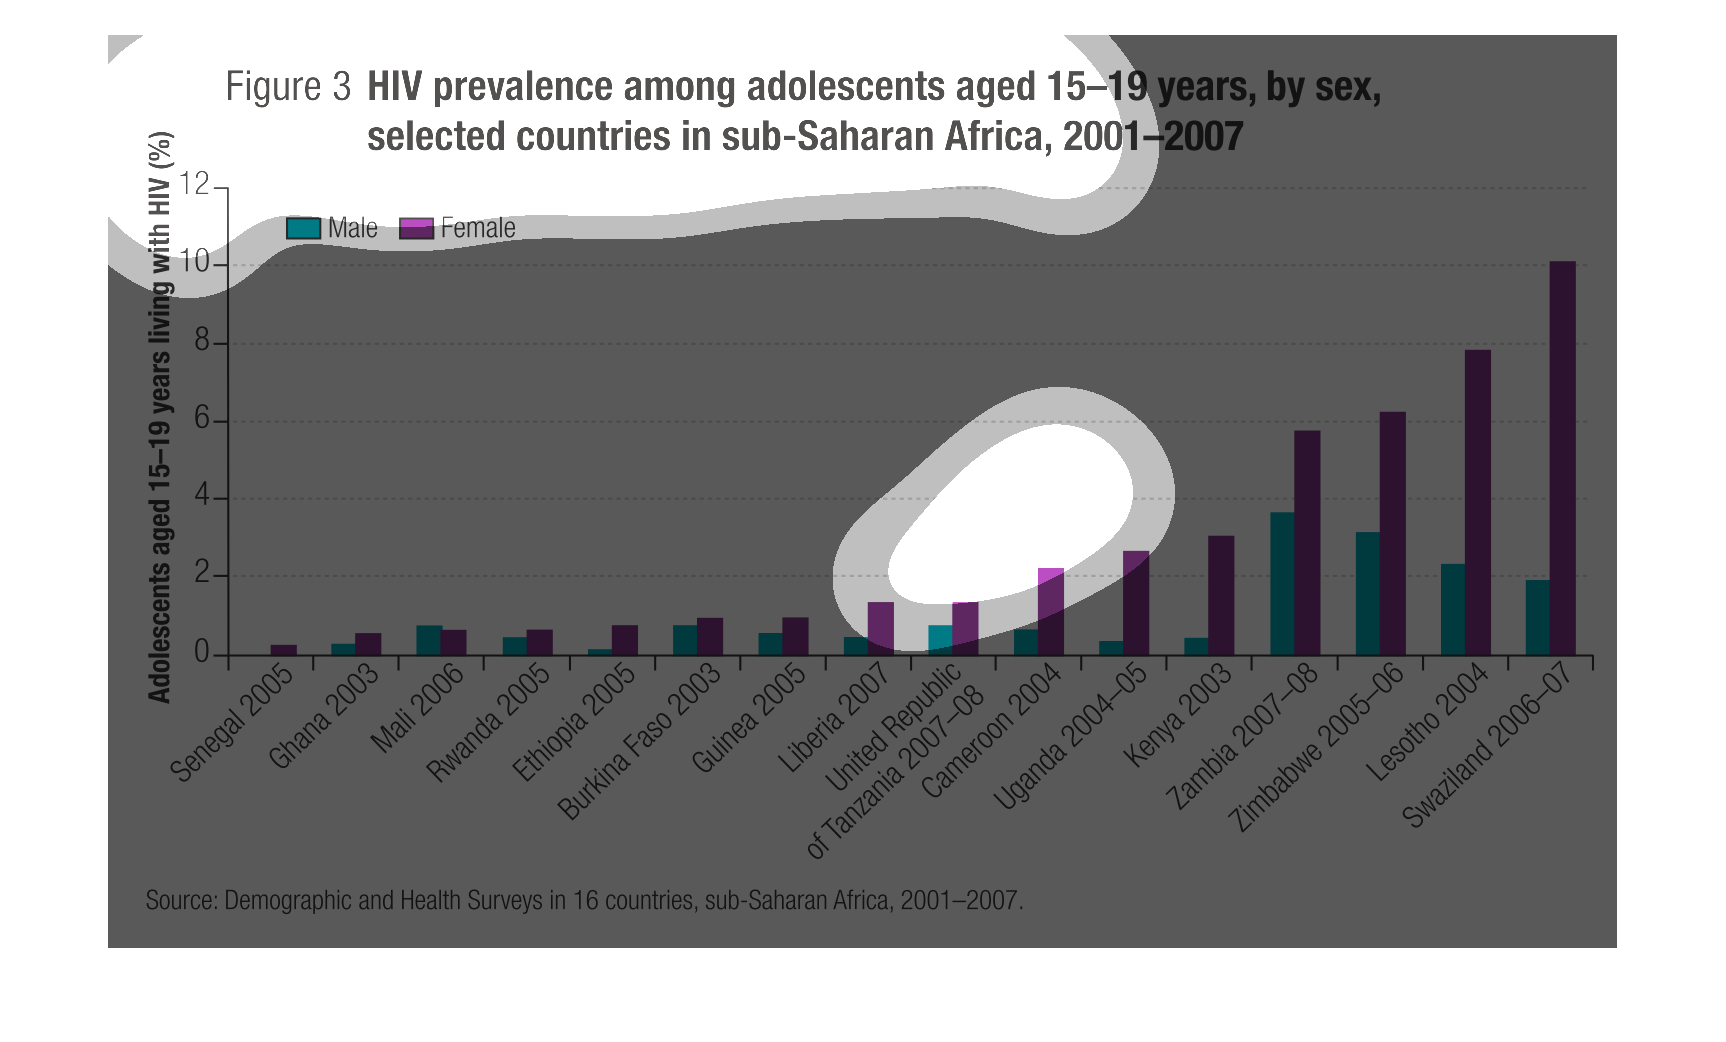
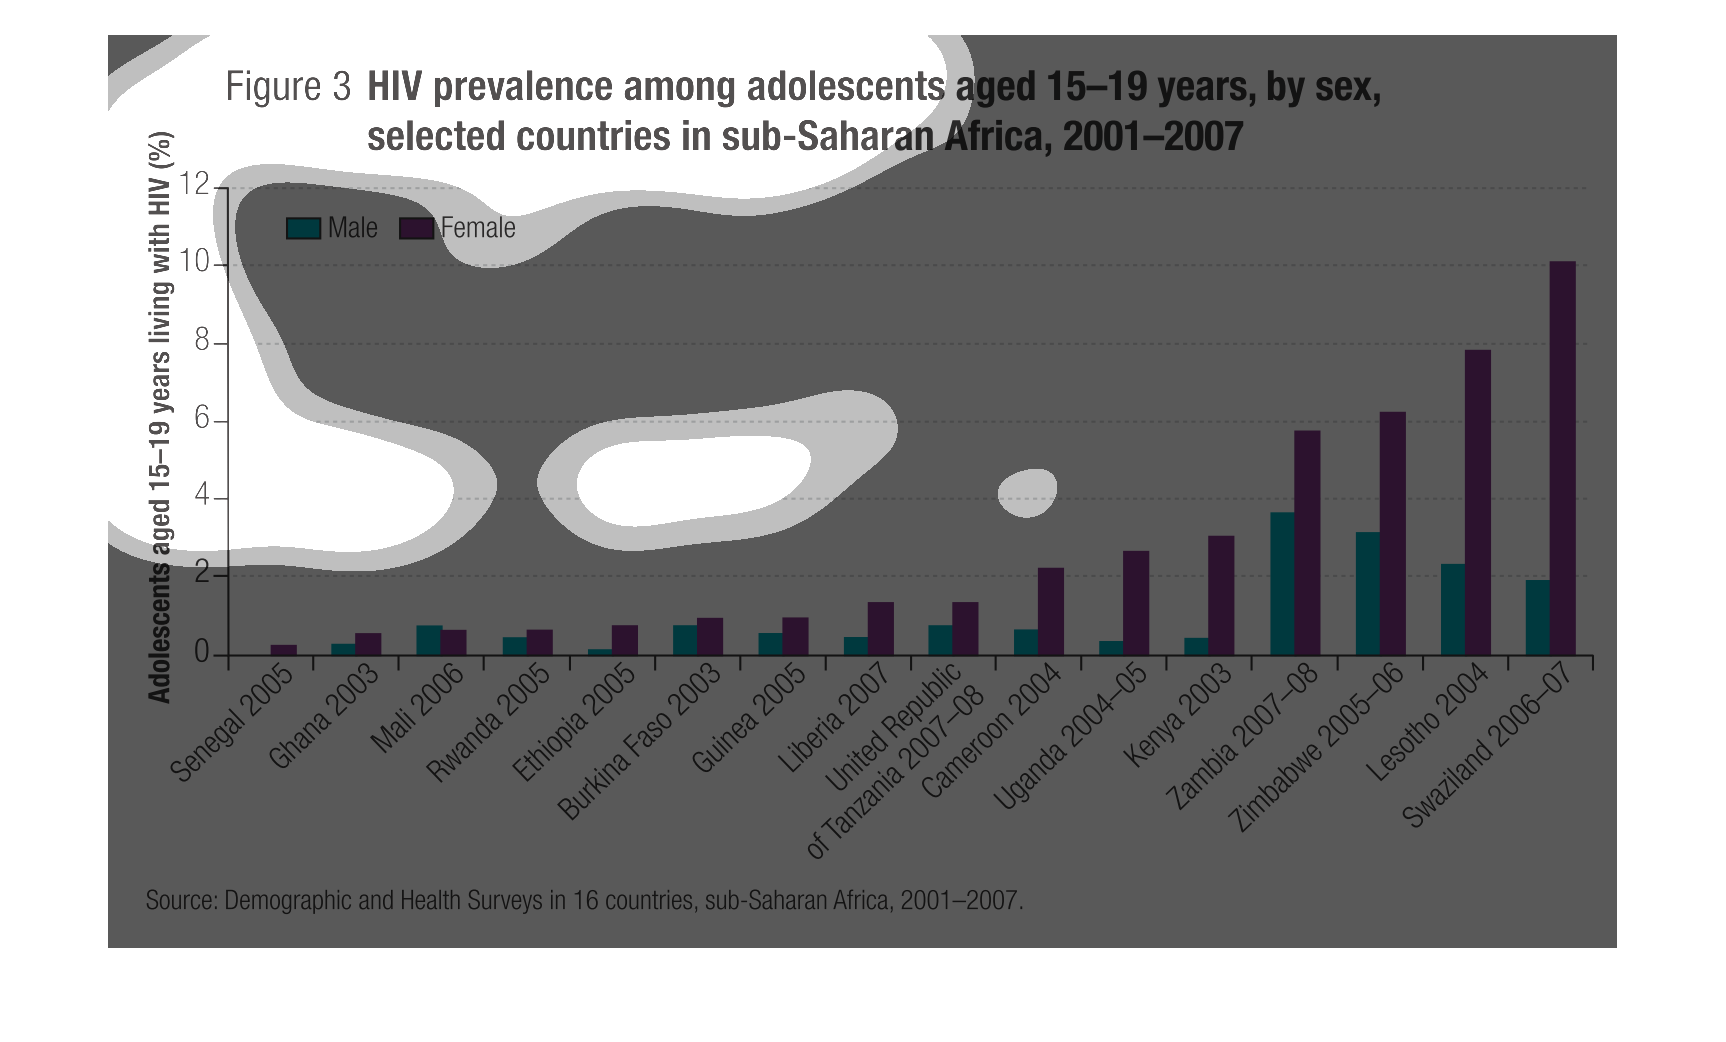
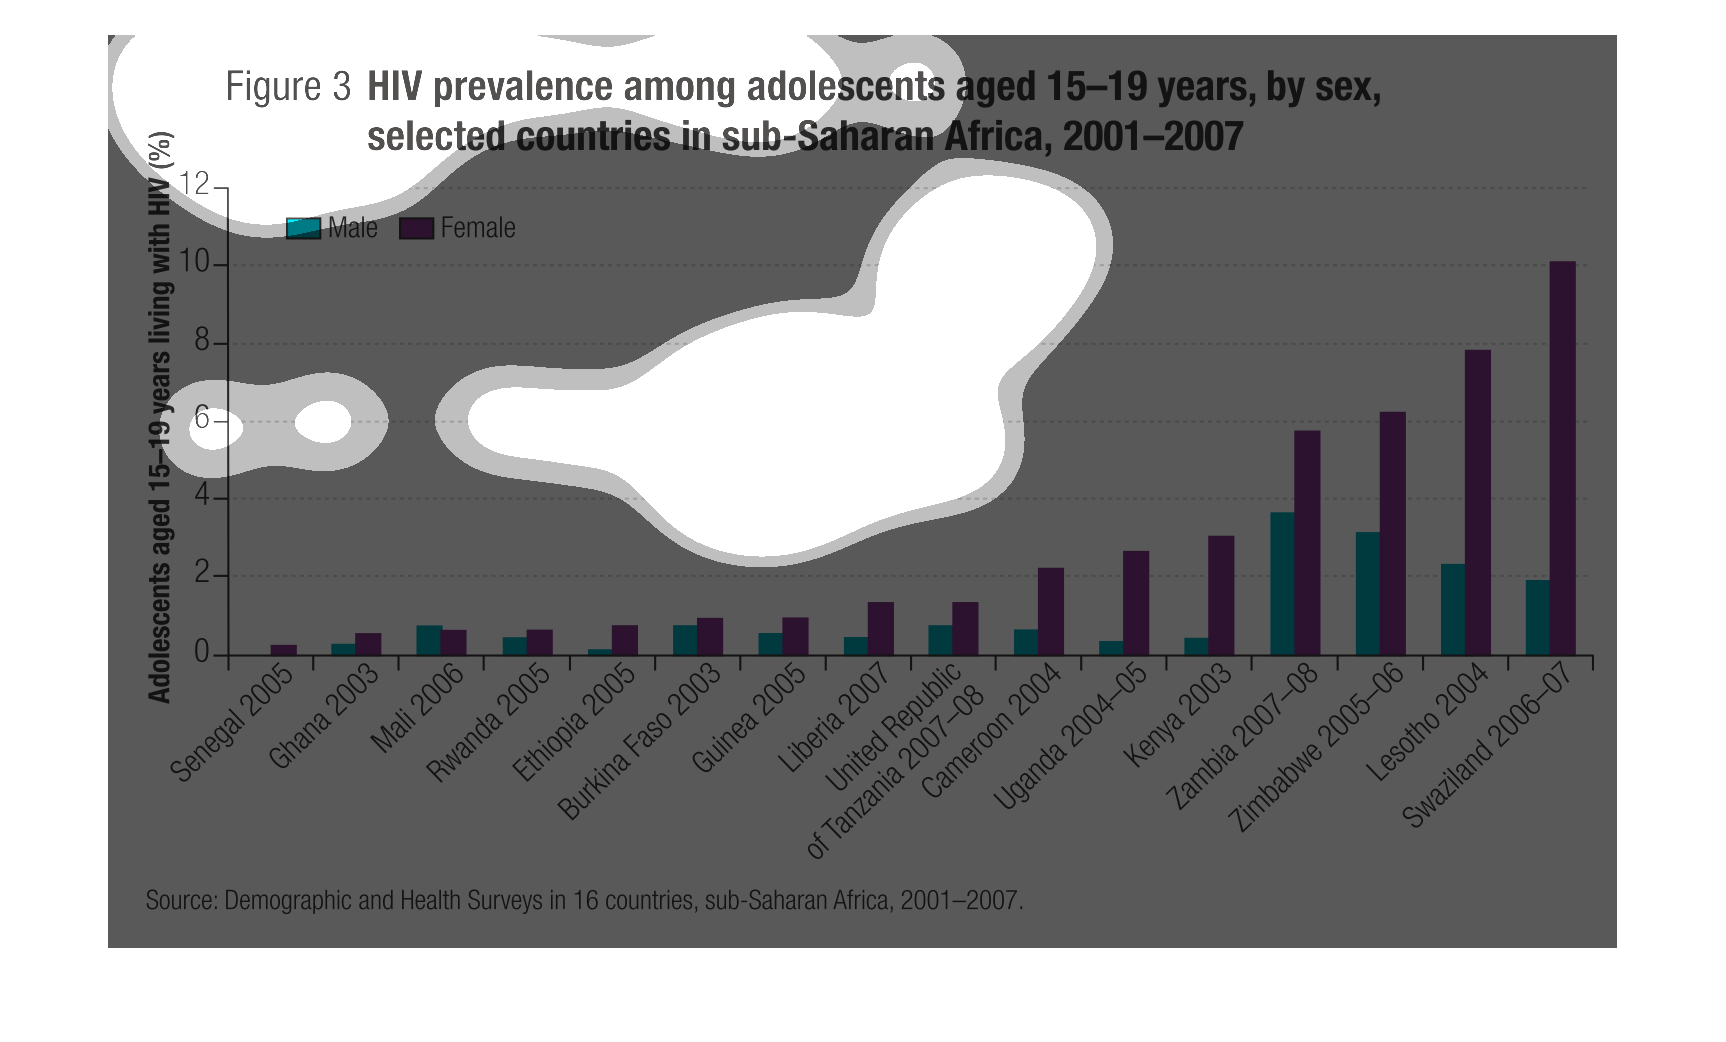
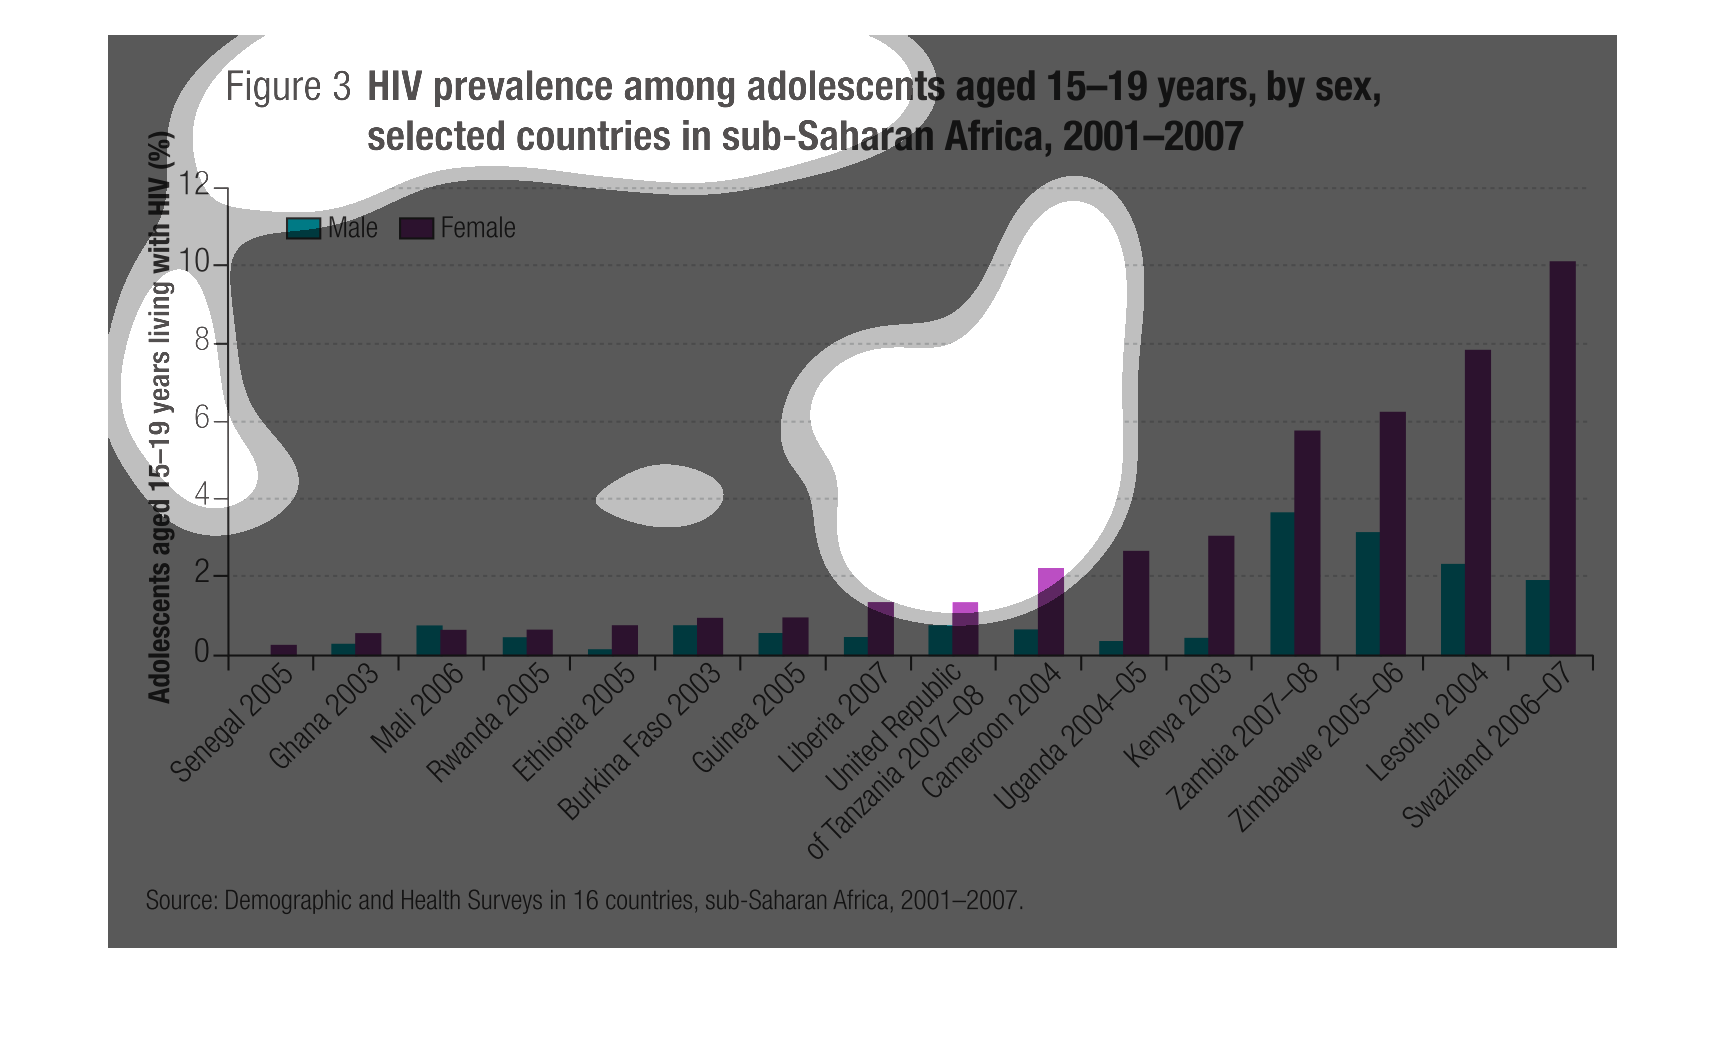
This graph is a bar graph that shows HIV prevalence among adolescents, between the ages of
15 and 19, based on sex, in some countries in sub-Saharan Africa from 2001-2007. The countries
are: Senegal, Ghana, Mali, Rwanda, Ethiopia, Burkina Faso, Guinea, Liberia, United Republic
of Tanzania, Cameroon, Uganda, Kenya,  Zambia, Zimbabwe, Lesotho, and Swaziland.  Swaziland
had 10% of females ages 15-19 living with HIV in 2006-2007, while Zambia had almost 4% of
males ages 15-19 living with HIV in 2007-2008.
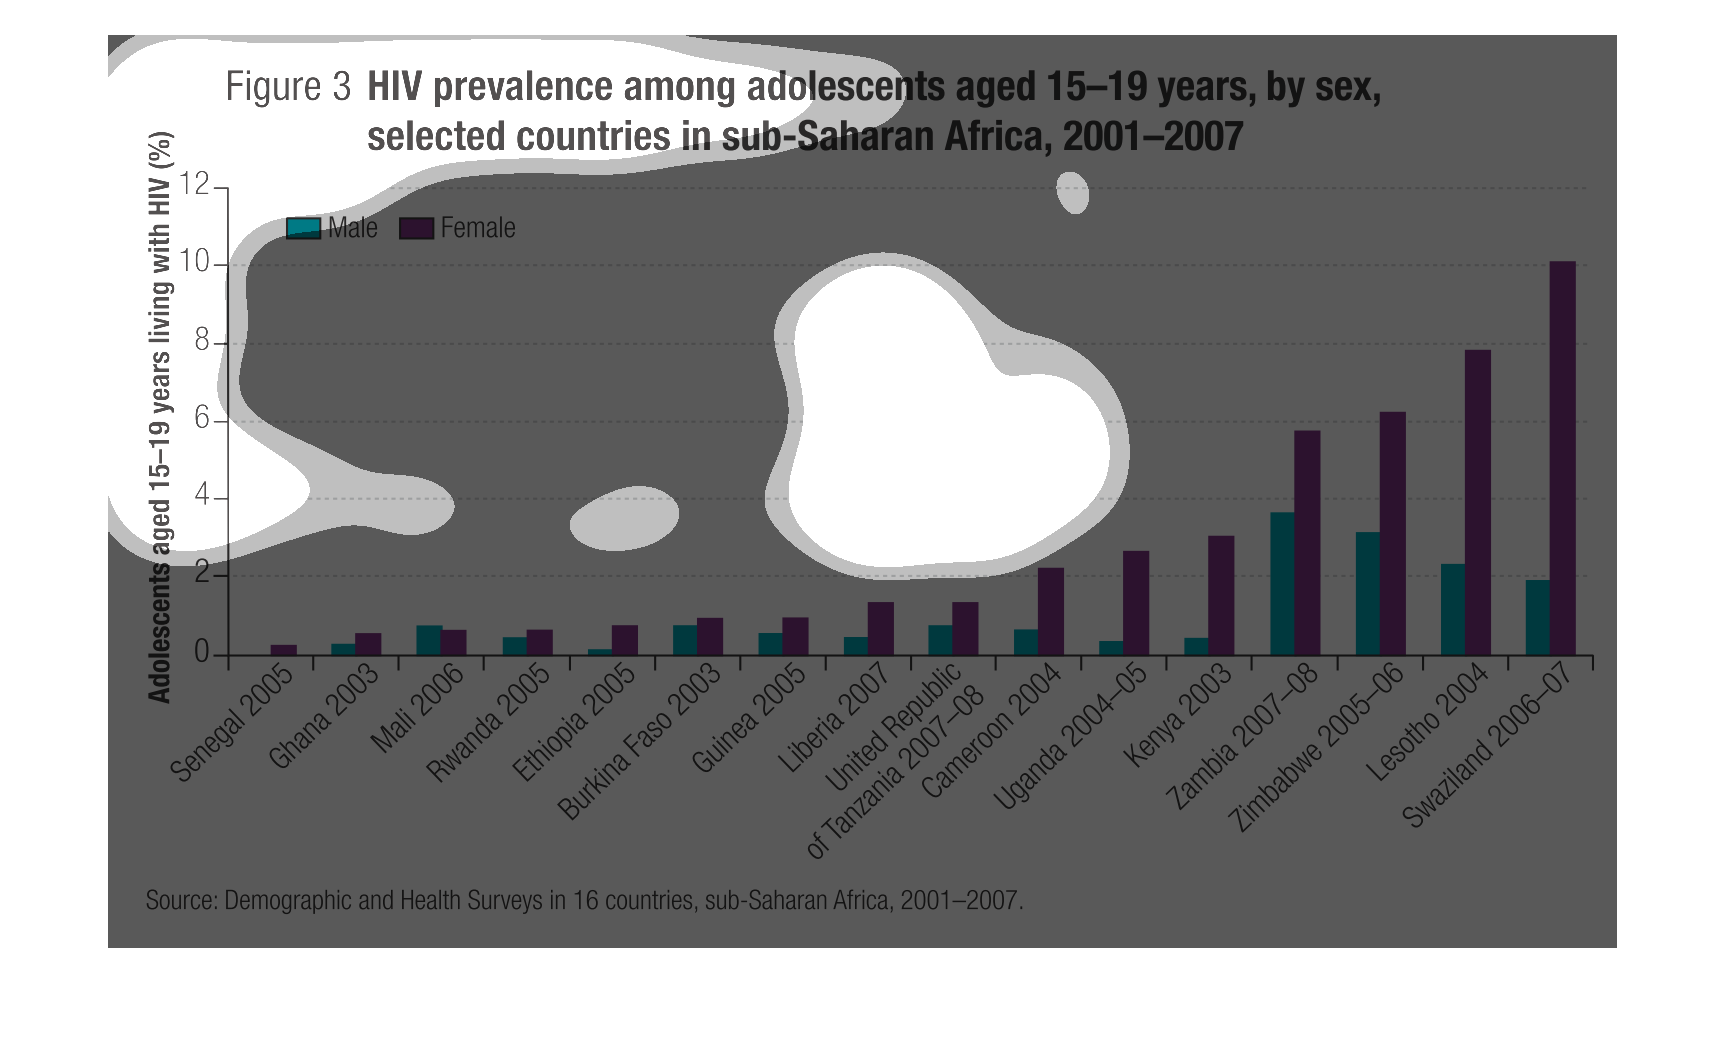
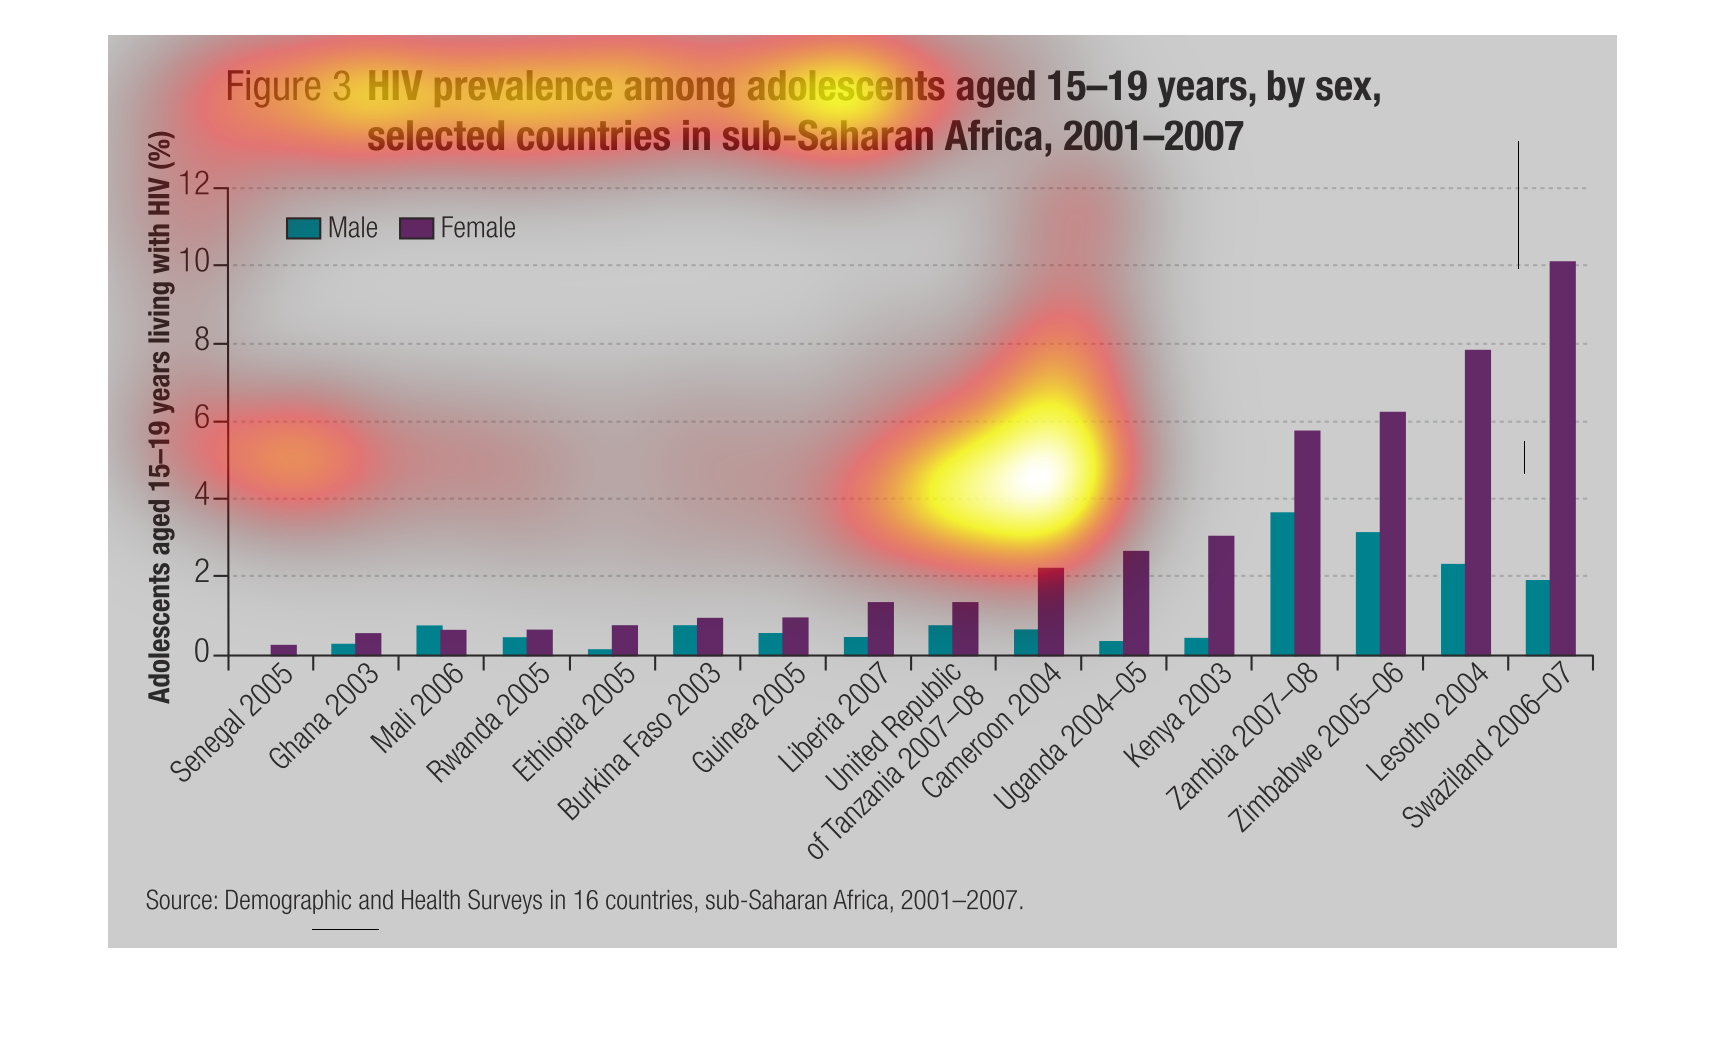
It is a graph that compares HIV prevalence in 15-19 year old individuals versus country in
Sub-Saharan Africa in a given time period.  The graph supports that females tend to have a
significantly higher prevalence to HIV in these countries.
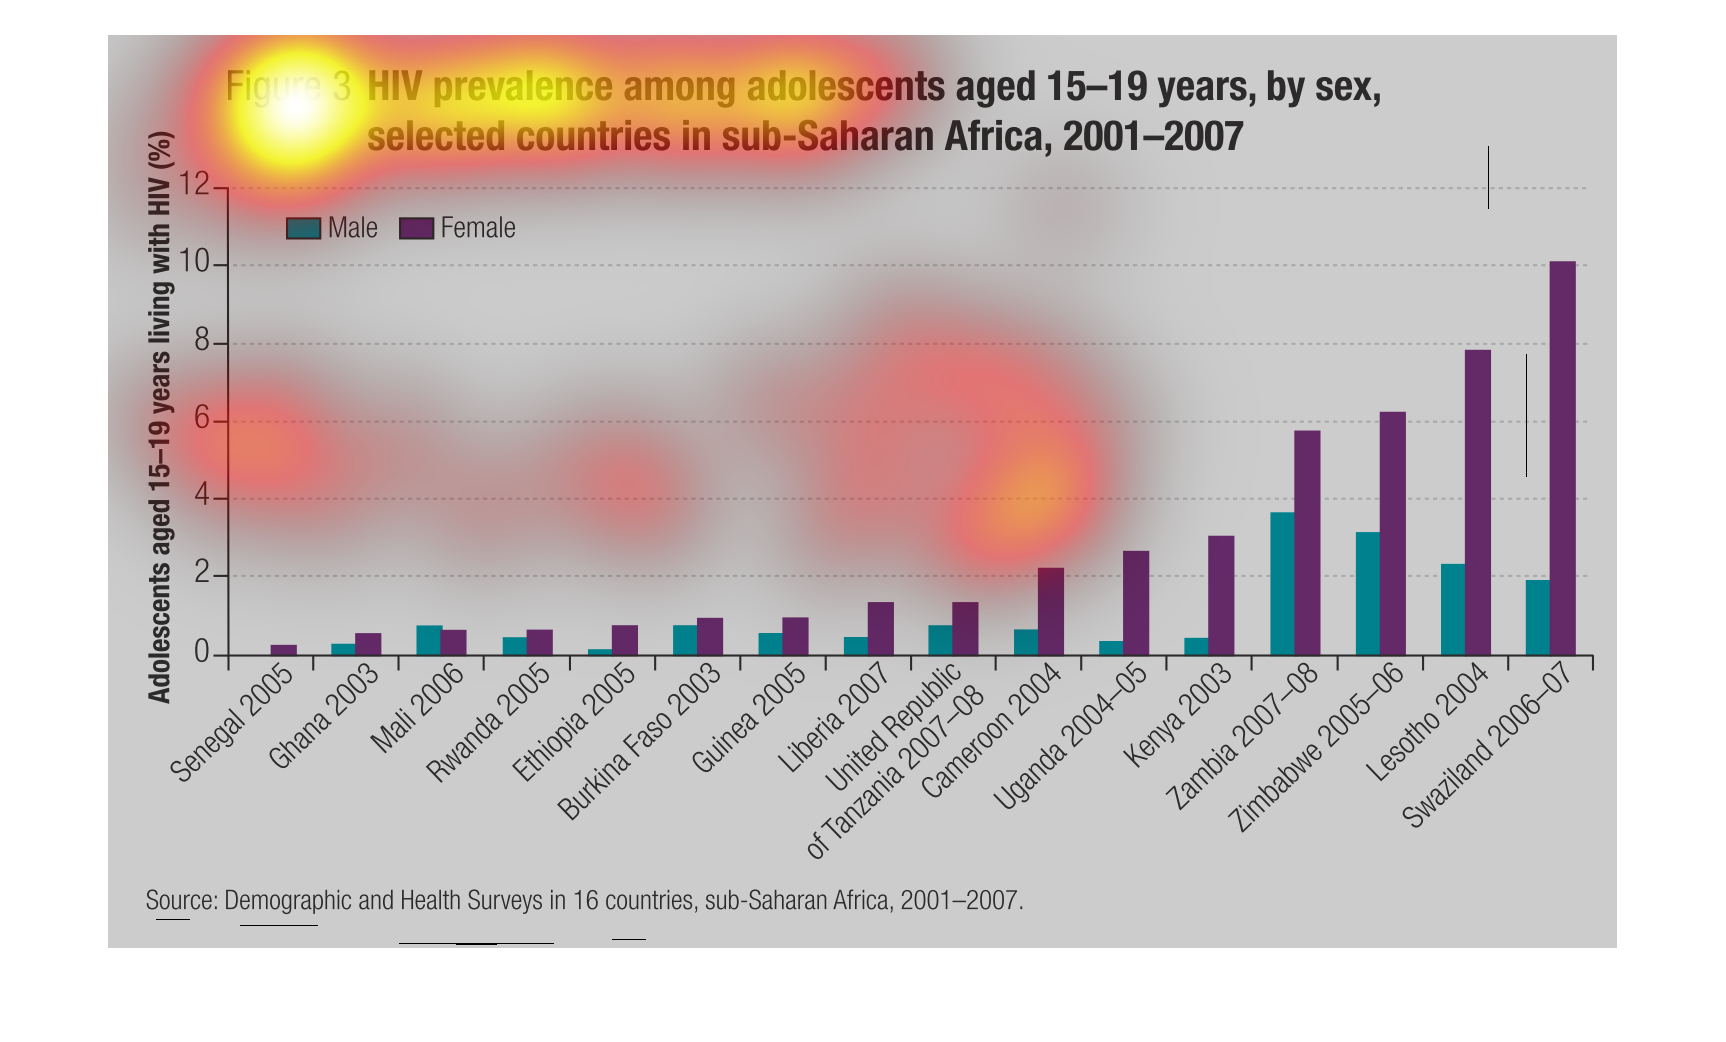
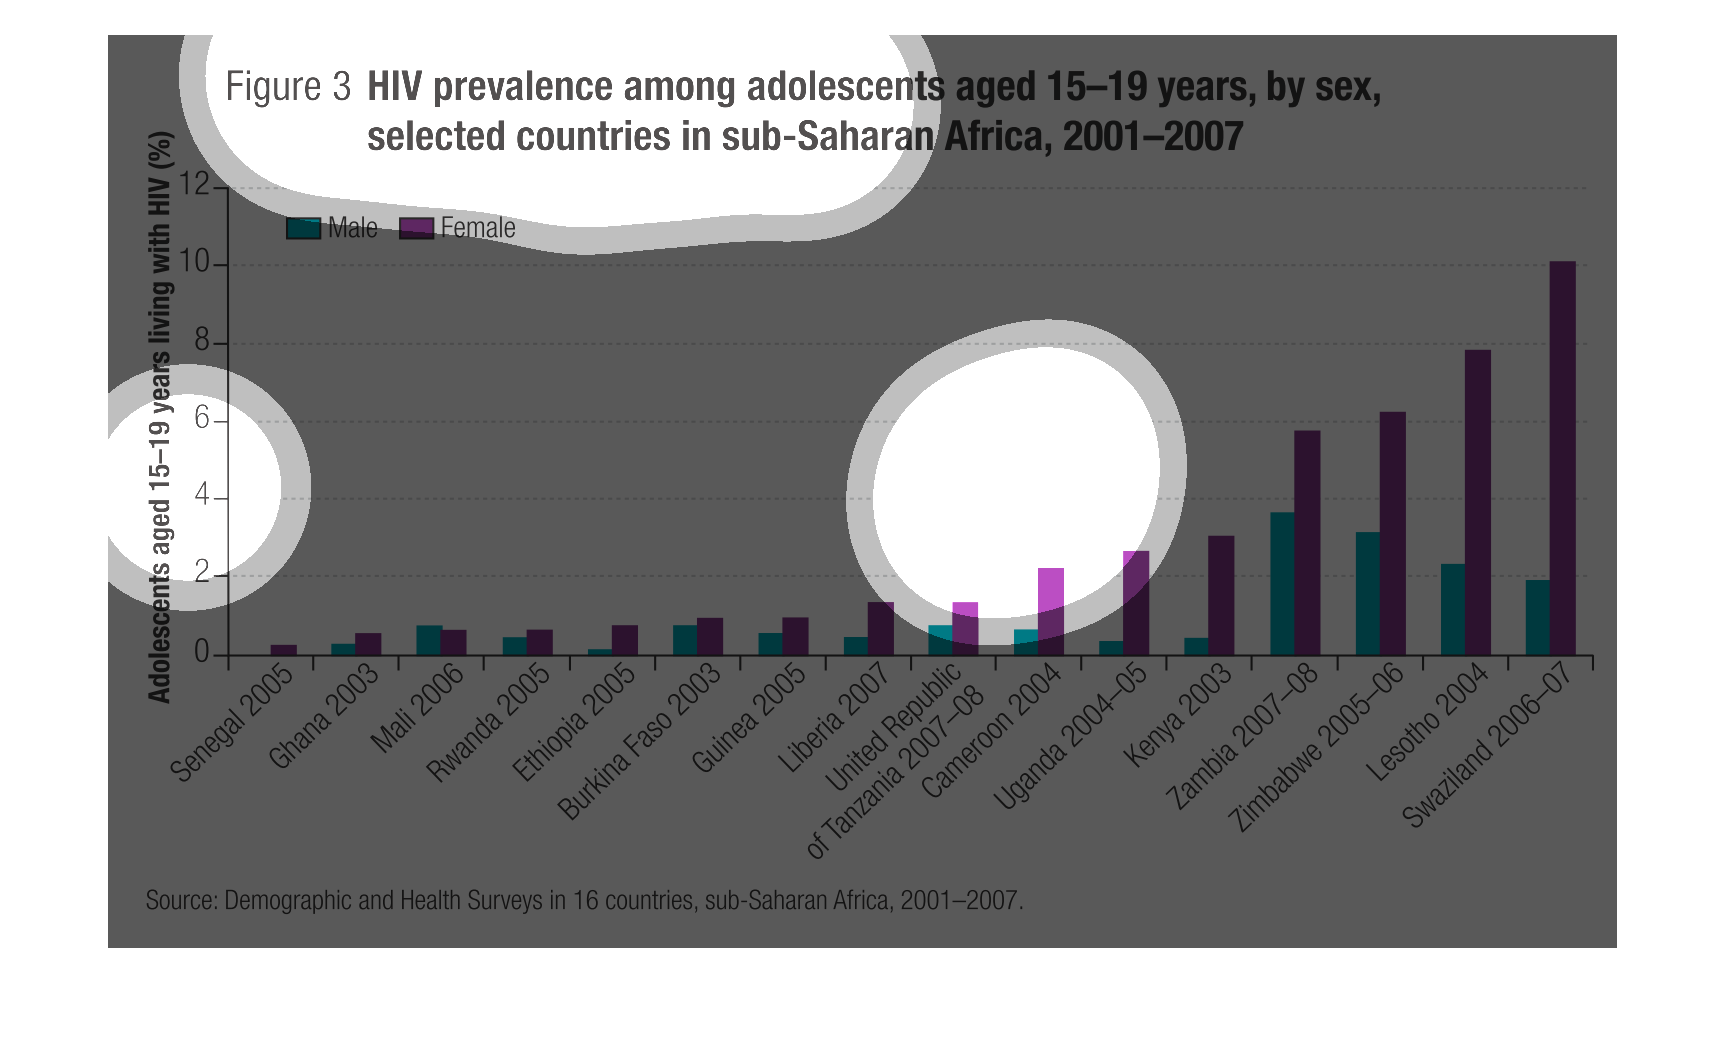
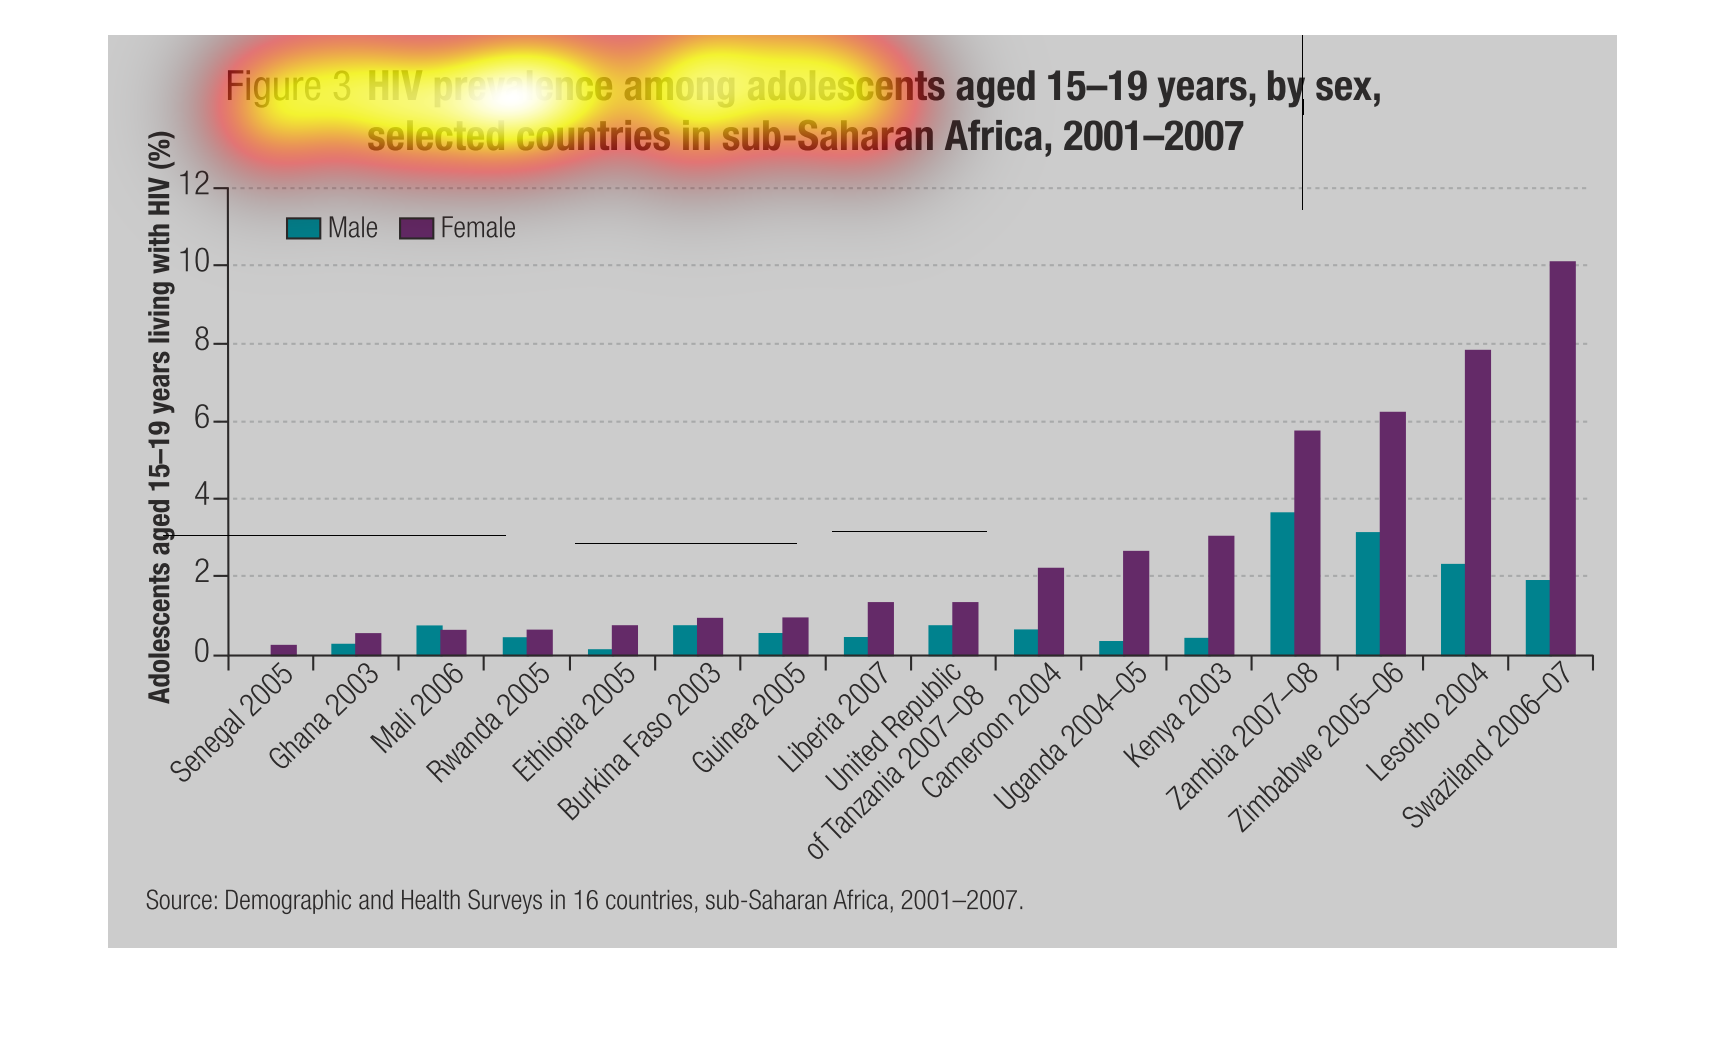
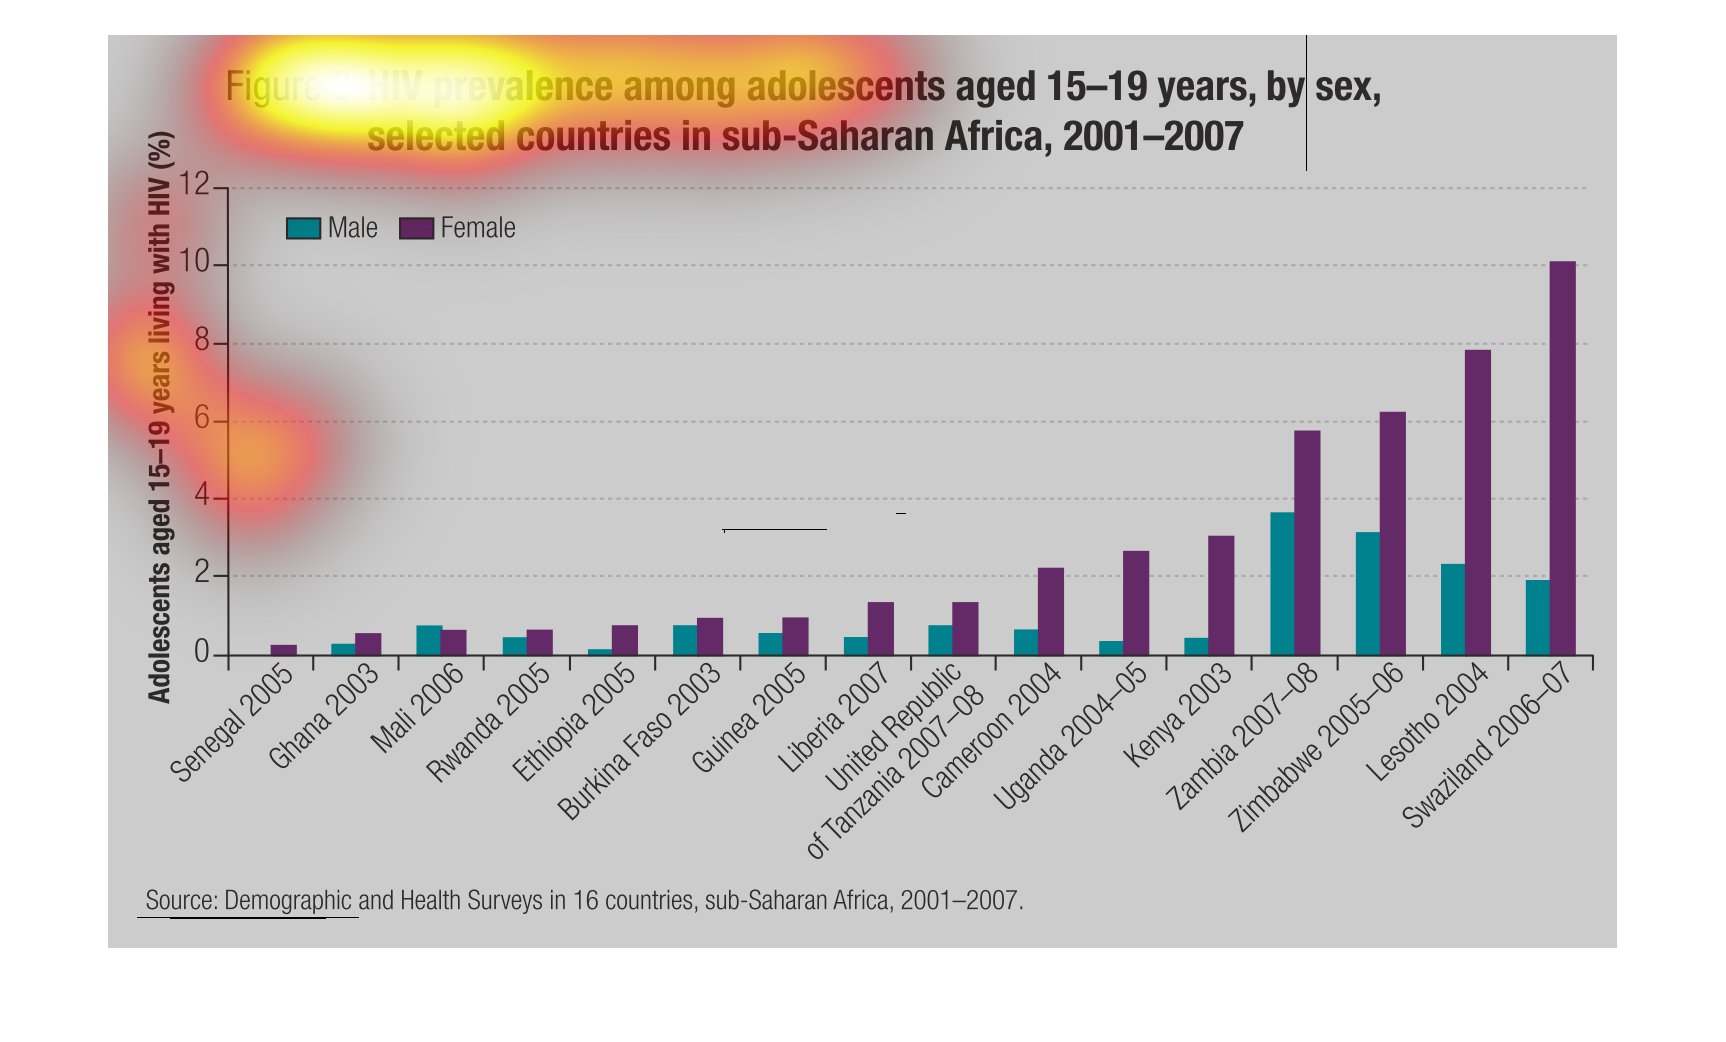
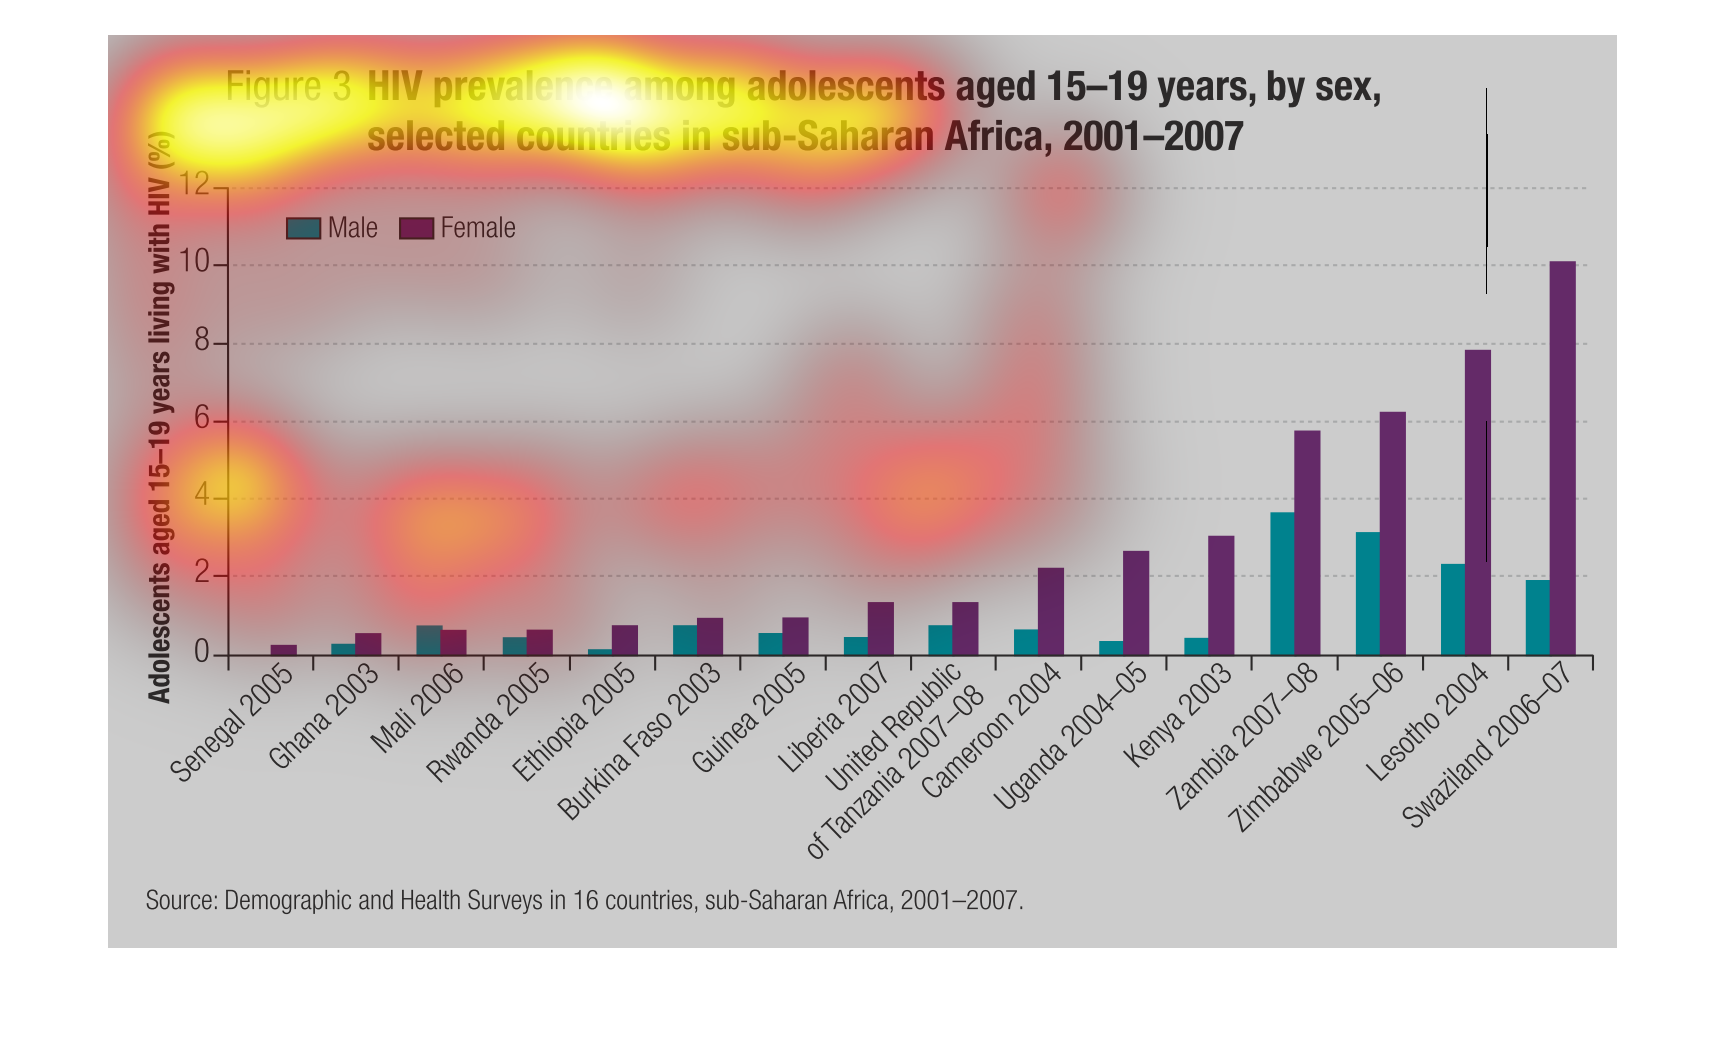
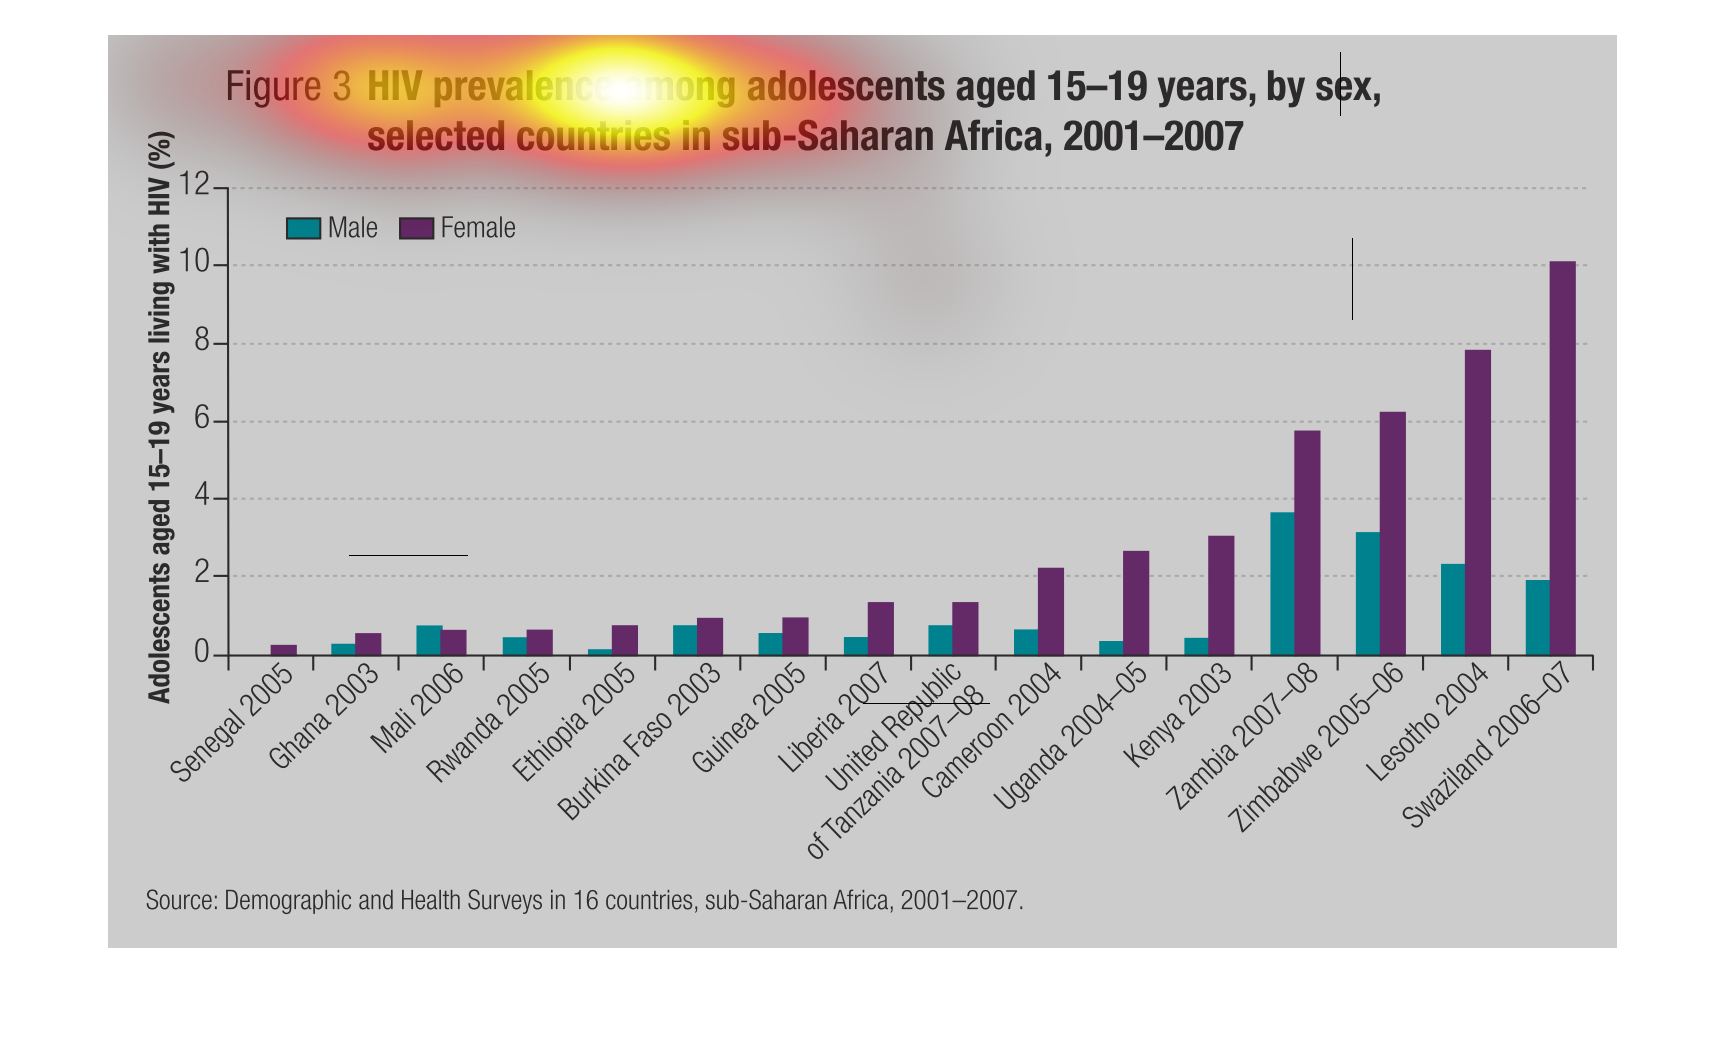
The following chart gives the number of people aged 15-19 living in sub Saharan Africa living
with HIV the chart is broken down by male and female and has a substantially higher number
of females than males listed with infection. It also shows a strong year over year increase
in those that are infected with the virus.
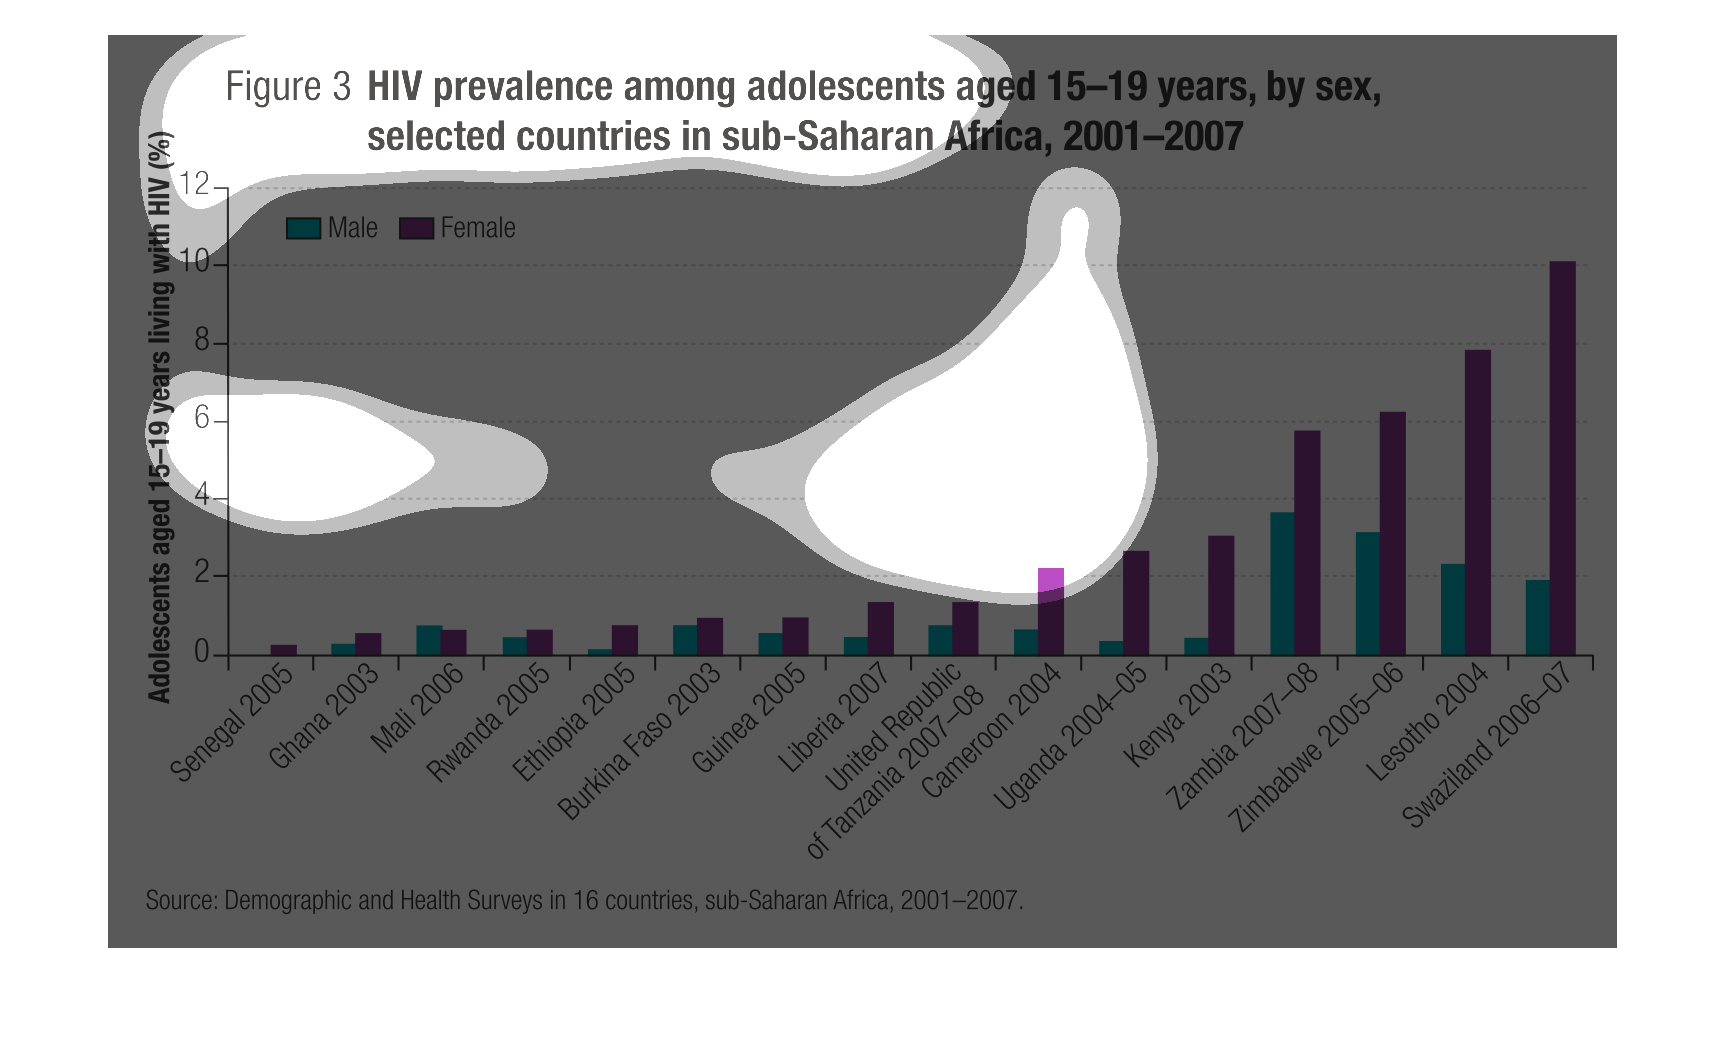
This chart shows the HIV prevalence adolescents aged 15-19 years old for selected countries
in sub-Saharan Africa for the years of 2001-2007. I really learned a lot from this chart.
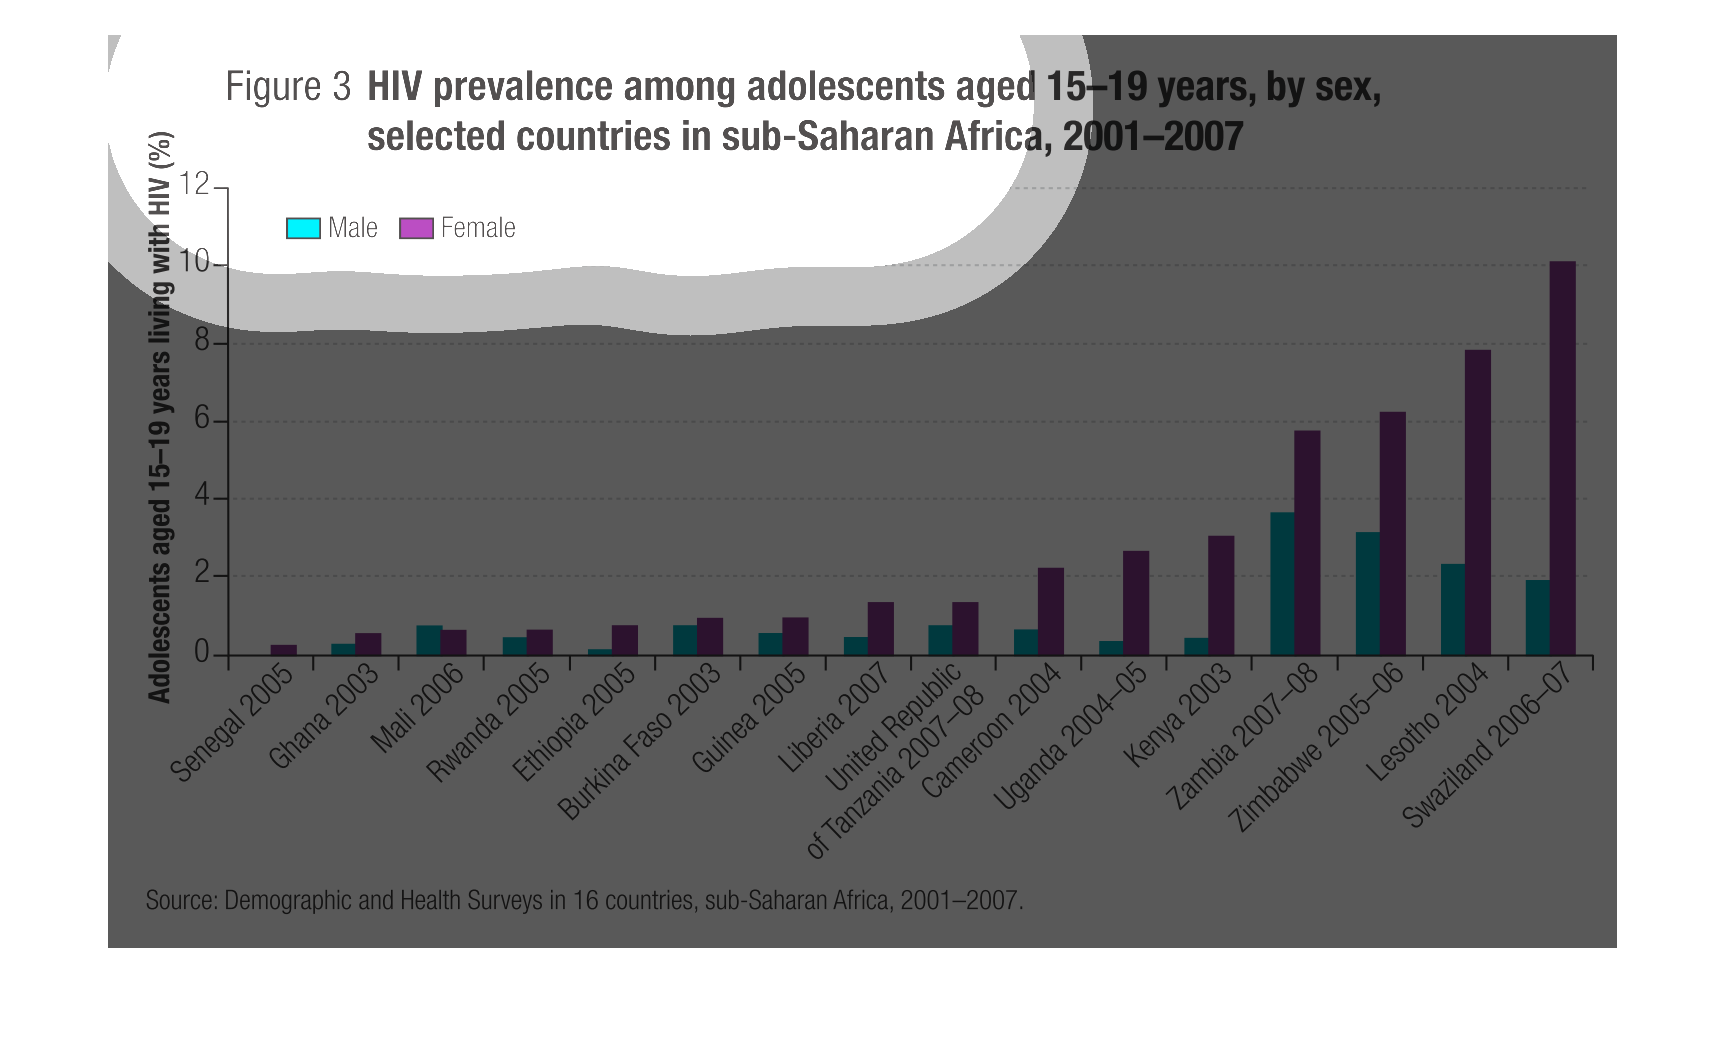
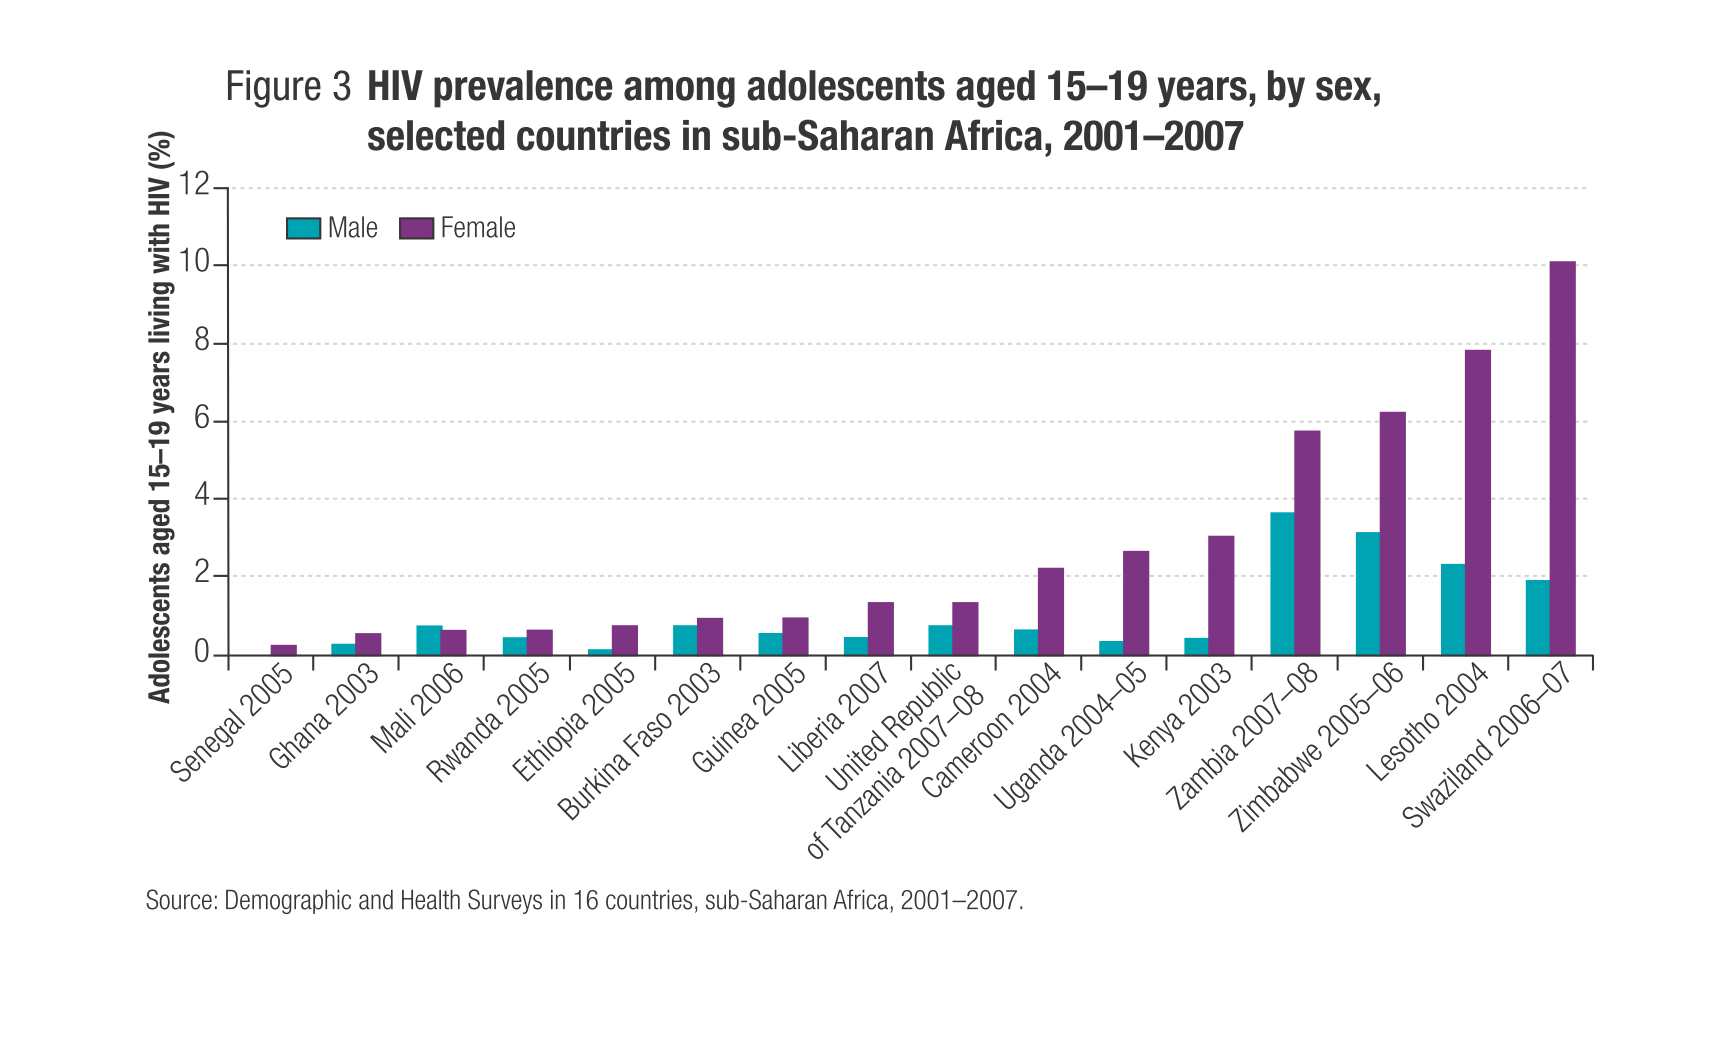
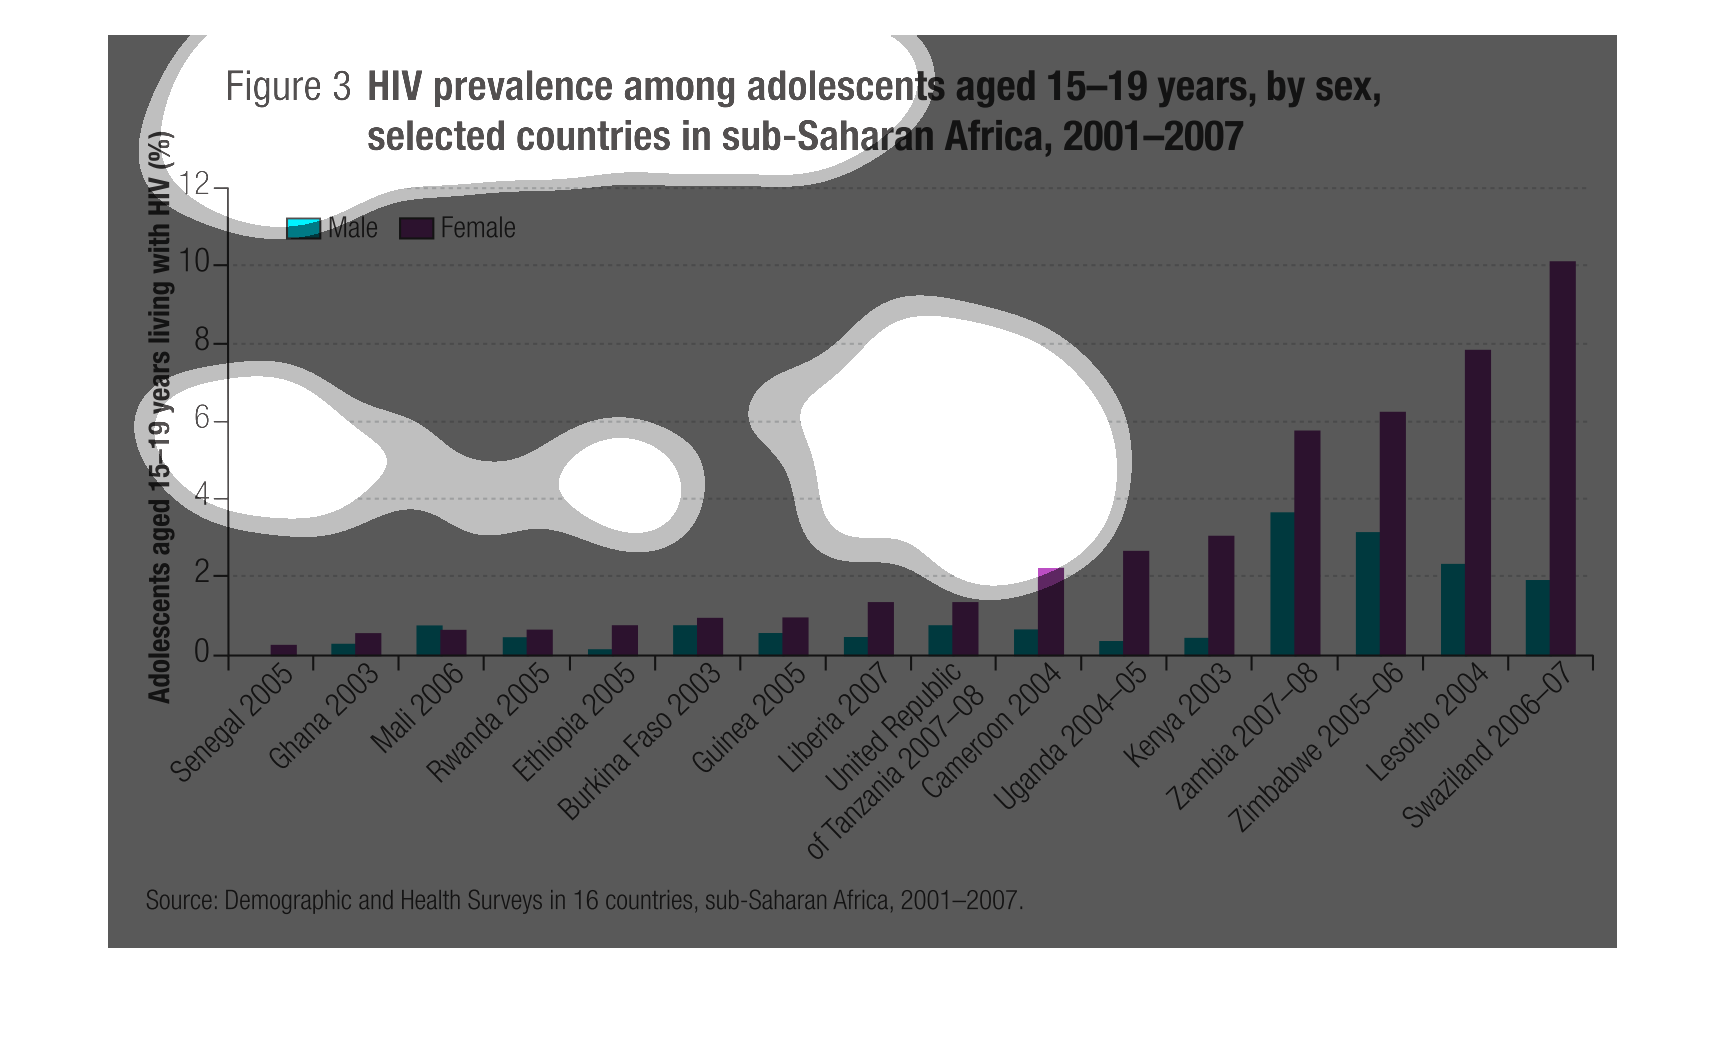
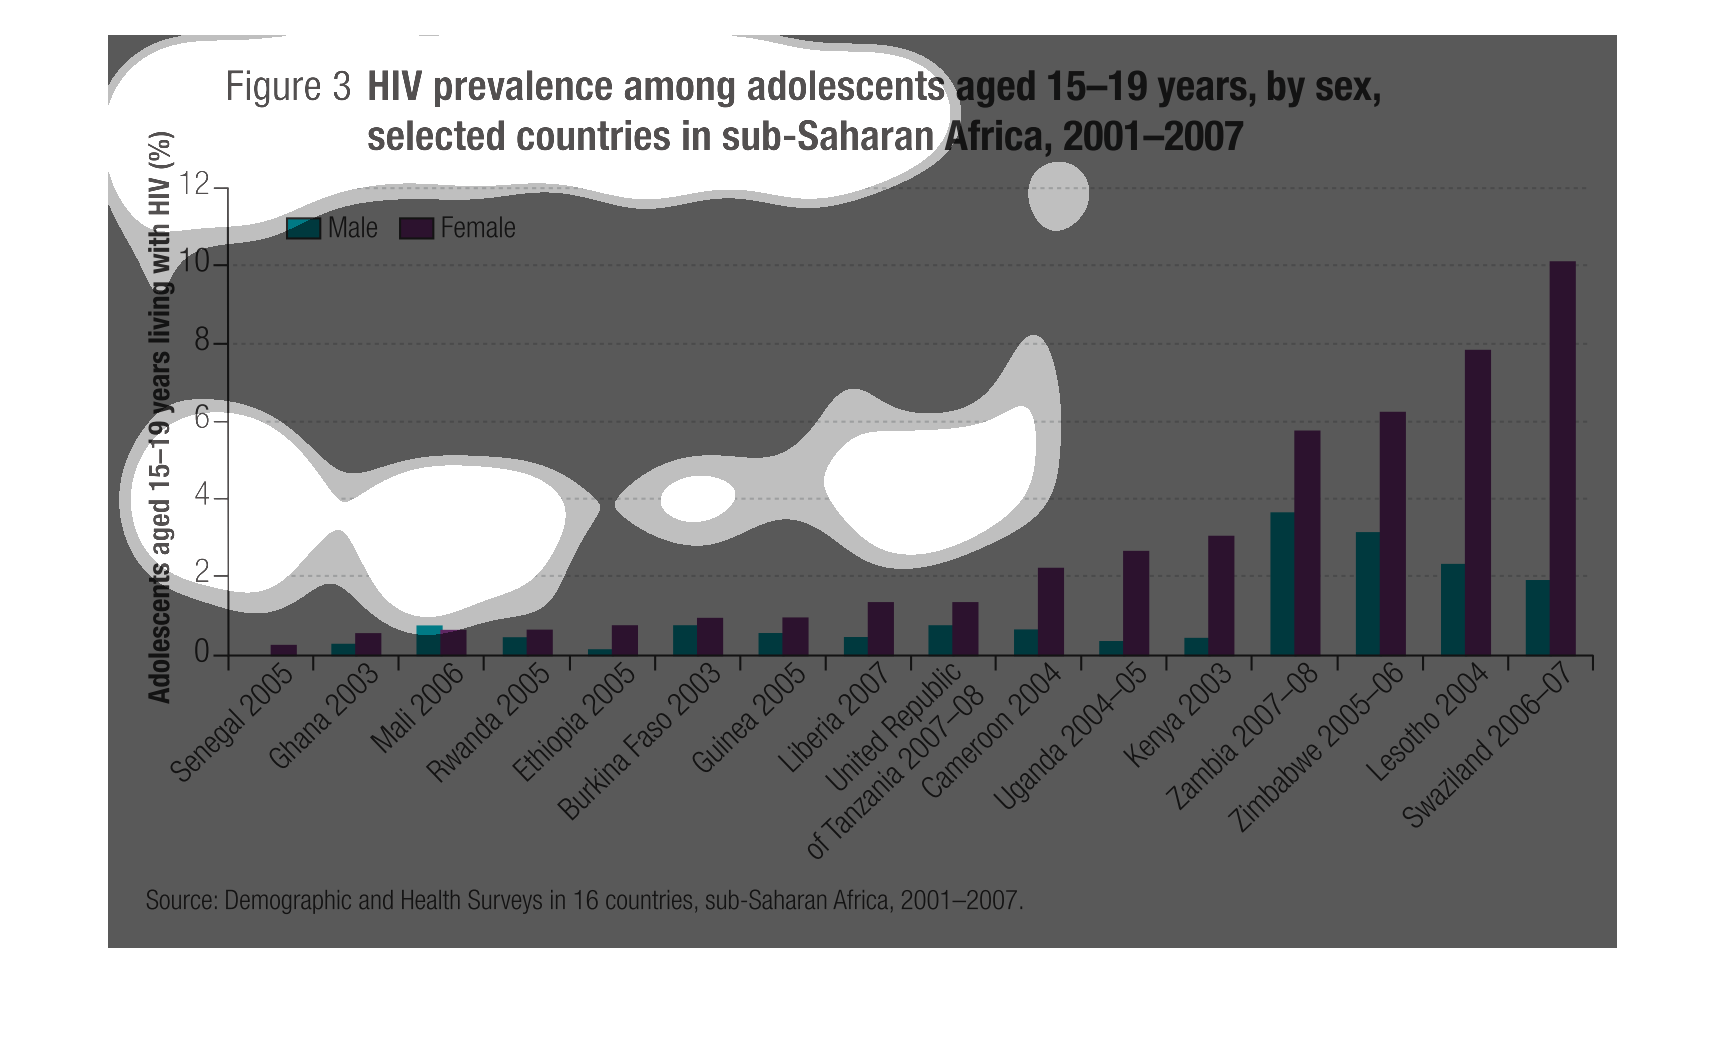
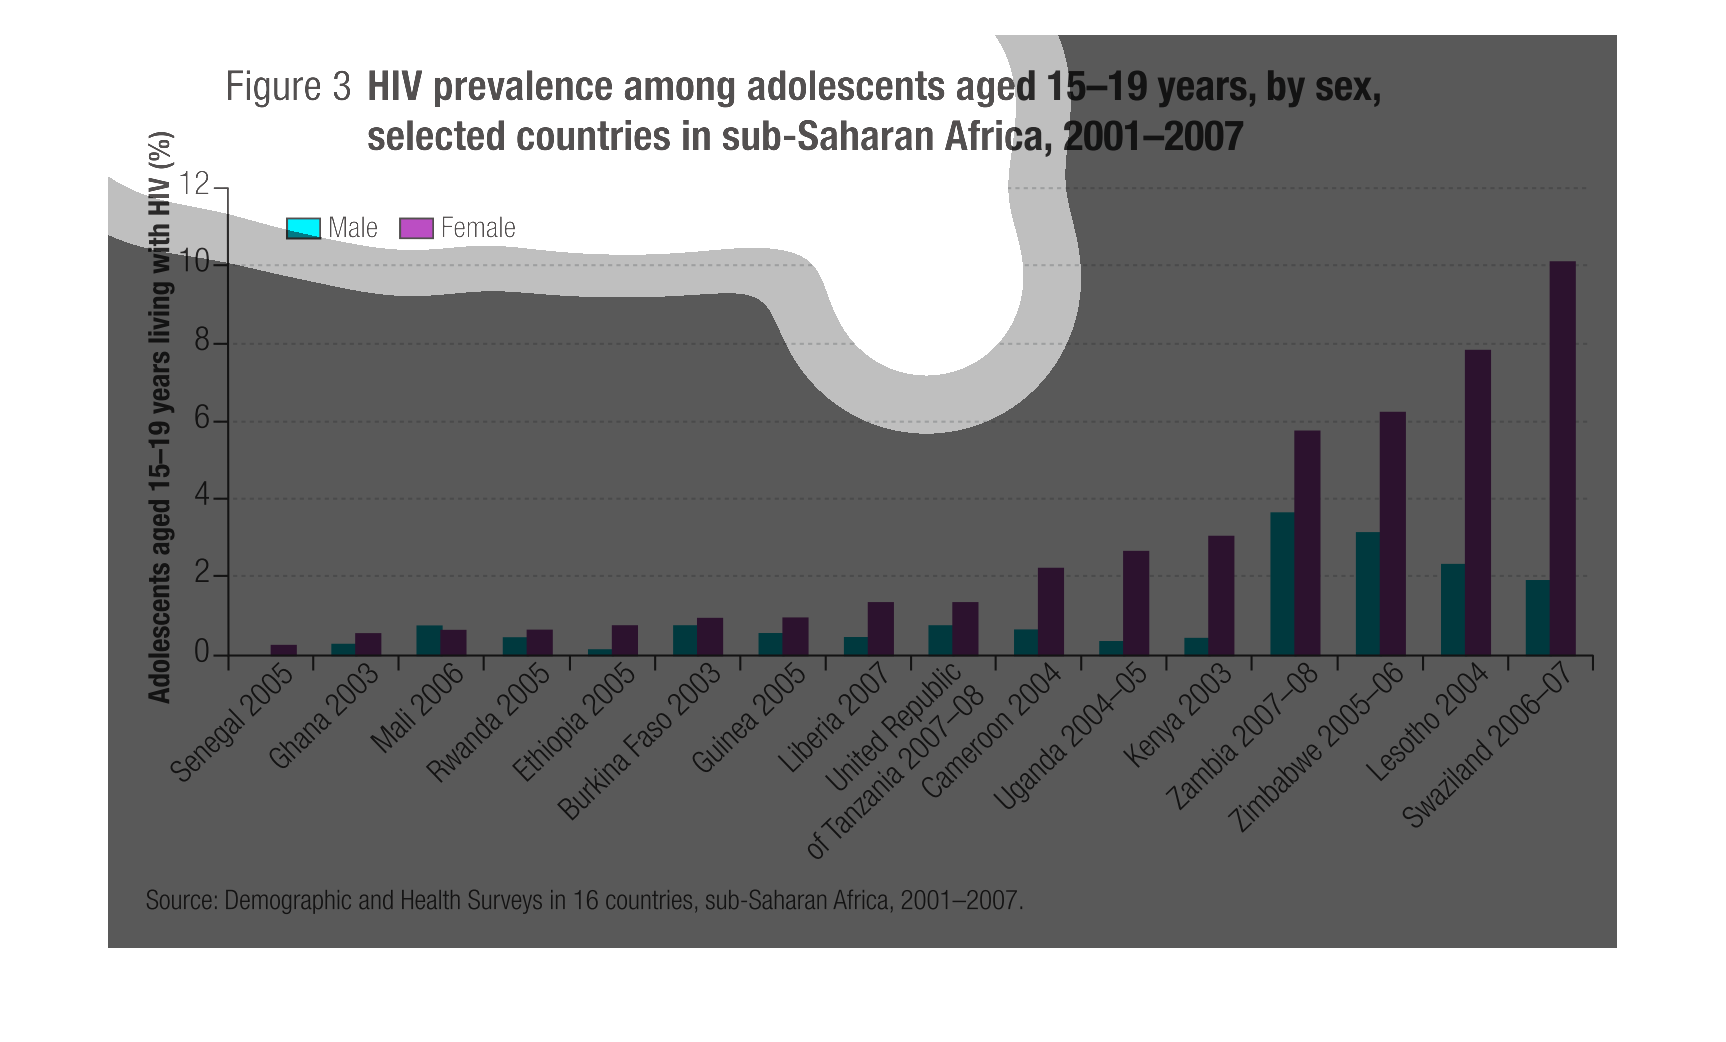
This bar graph shows the amount HIV found in adolescence aged 15-19 in the sub-Saharan part
of Africa between 2001-2007. In countries like Kenya, Zambia, Zimbabwe, Lesotho and Swaziland
the number of adolescence living with HIV is about three to four times larger than countries
like Ghana and Mali. Also, in the countries like Ghana and Mali, the number of males and females
living with HIV is about the same whereas in the countries like Zimbabwe and Kenya, there
are way more females living with HIV than males.
This chart describes HIV prevalence among adolescents aged 15-19 years, by sex and selected
in sub-Saharan Africa for the years 2001 through 2007. Countries include Mali.
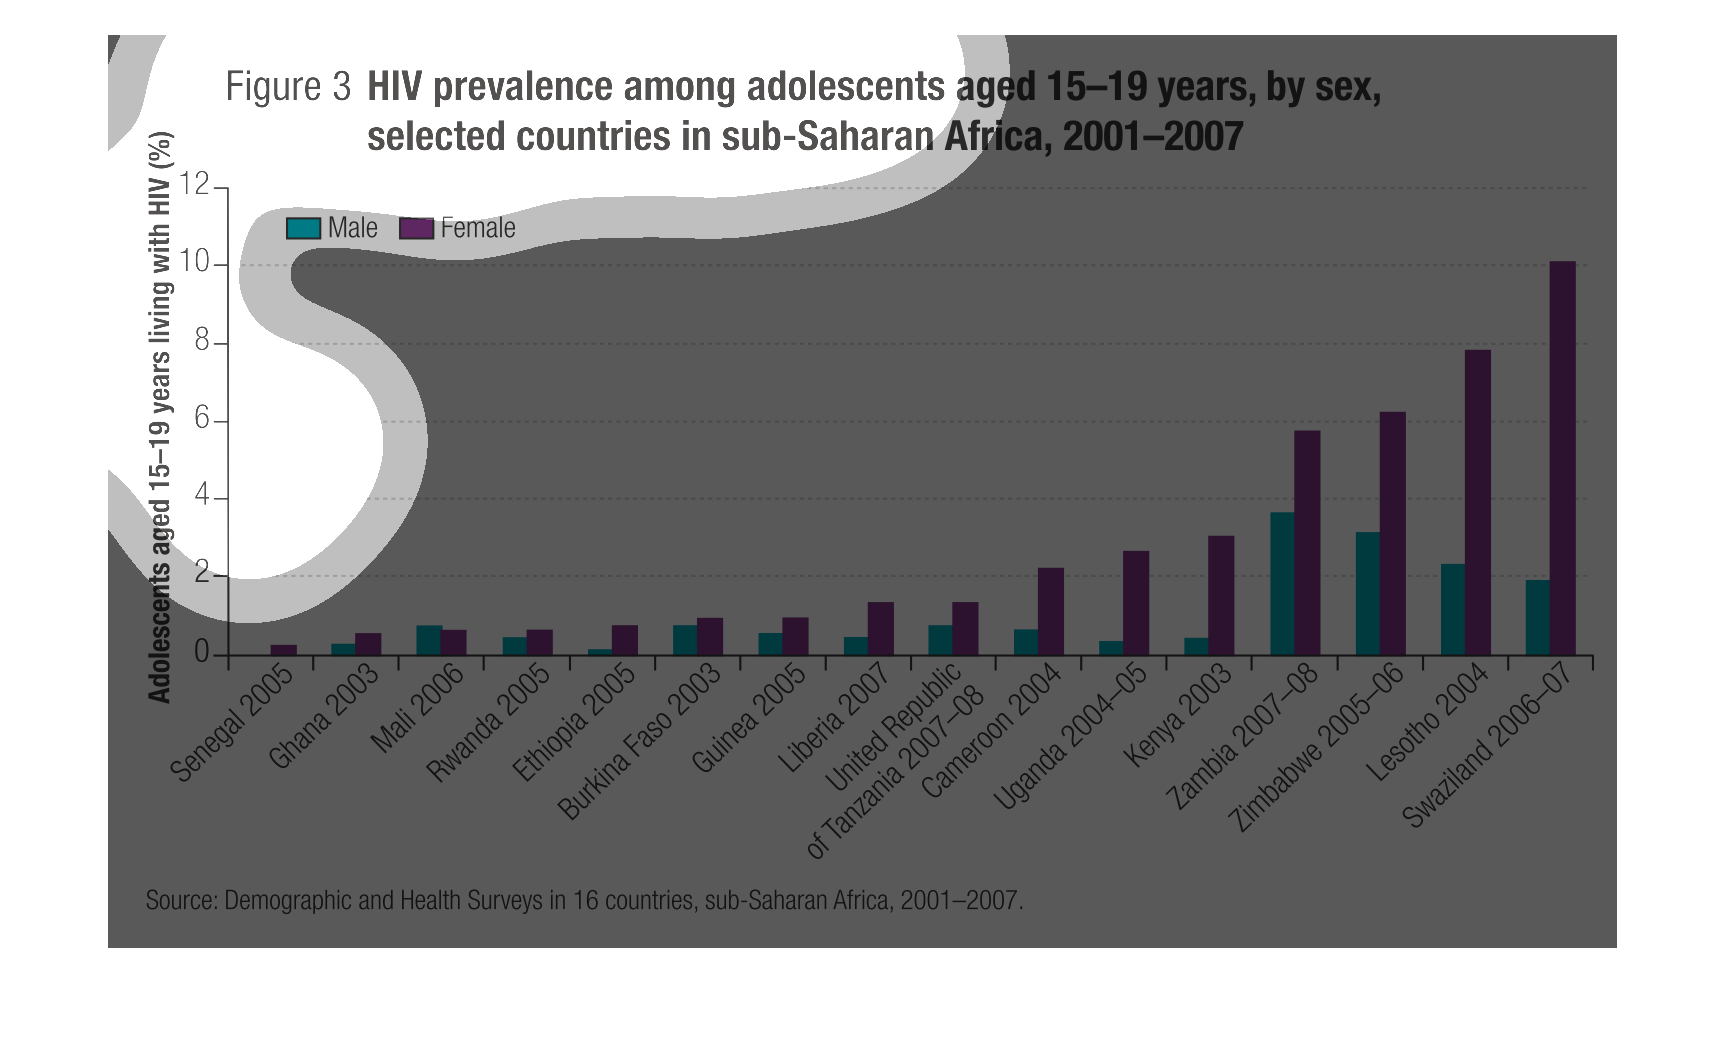
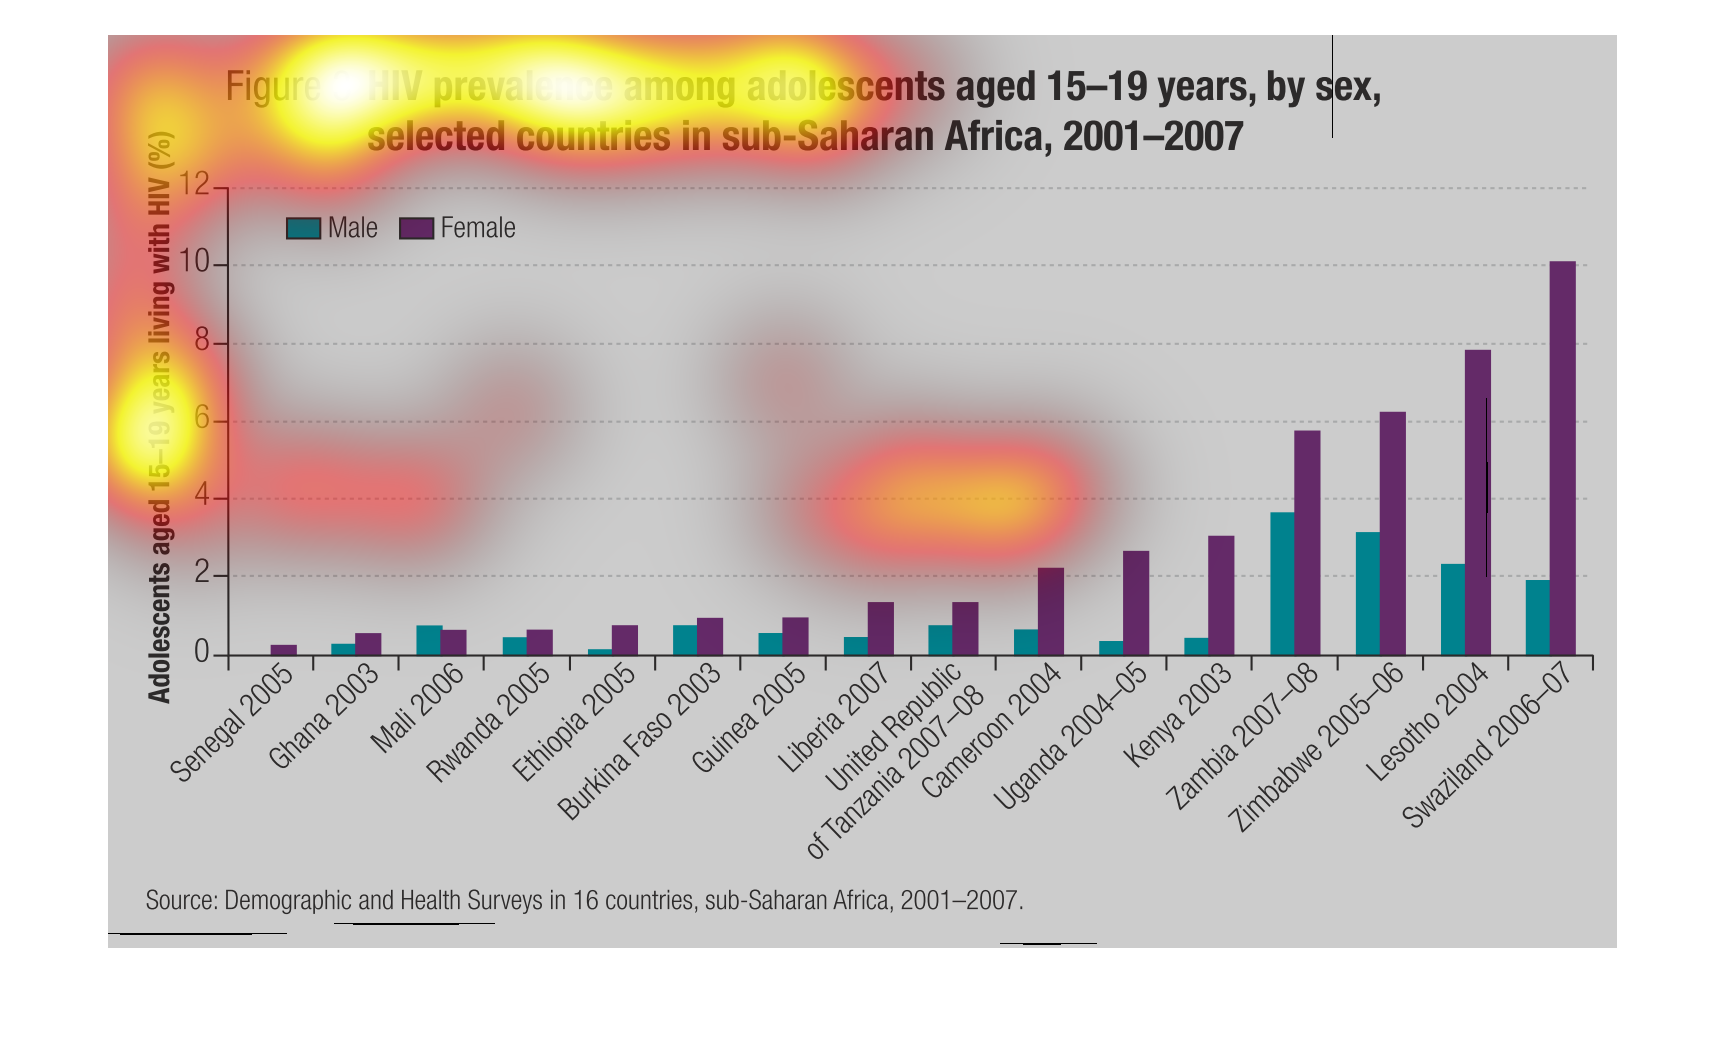
This chart describes and depicts the prevalence of HIV among adolescents age fifteen to age
nine-teen by sex and country of sub-saharan africa from 2001-2007.
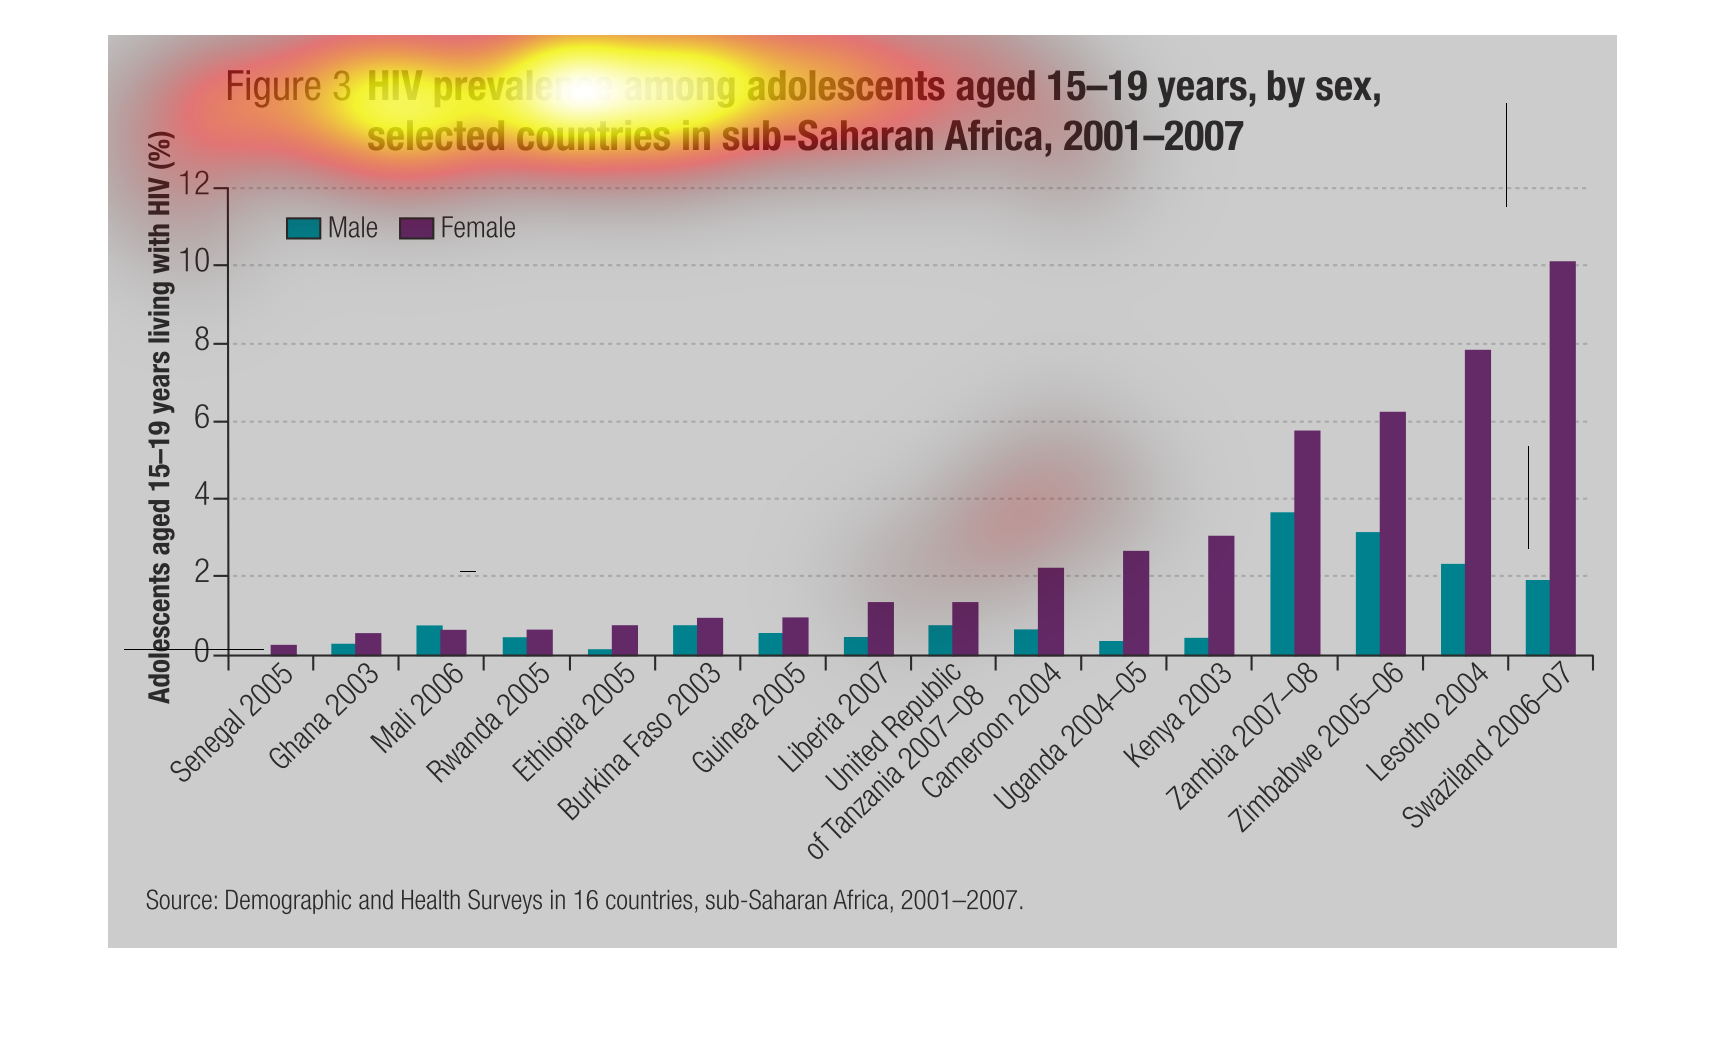
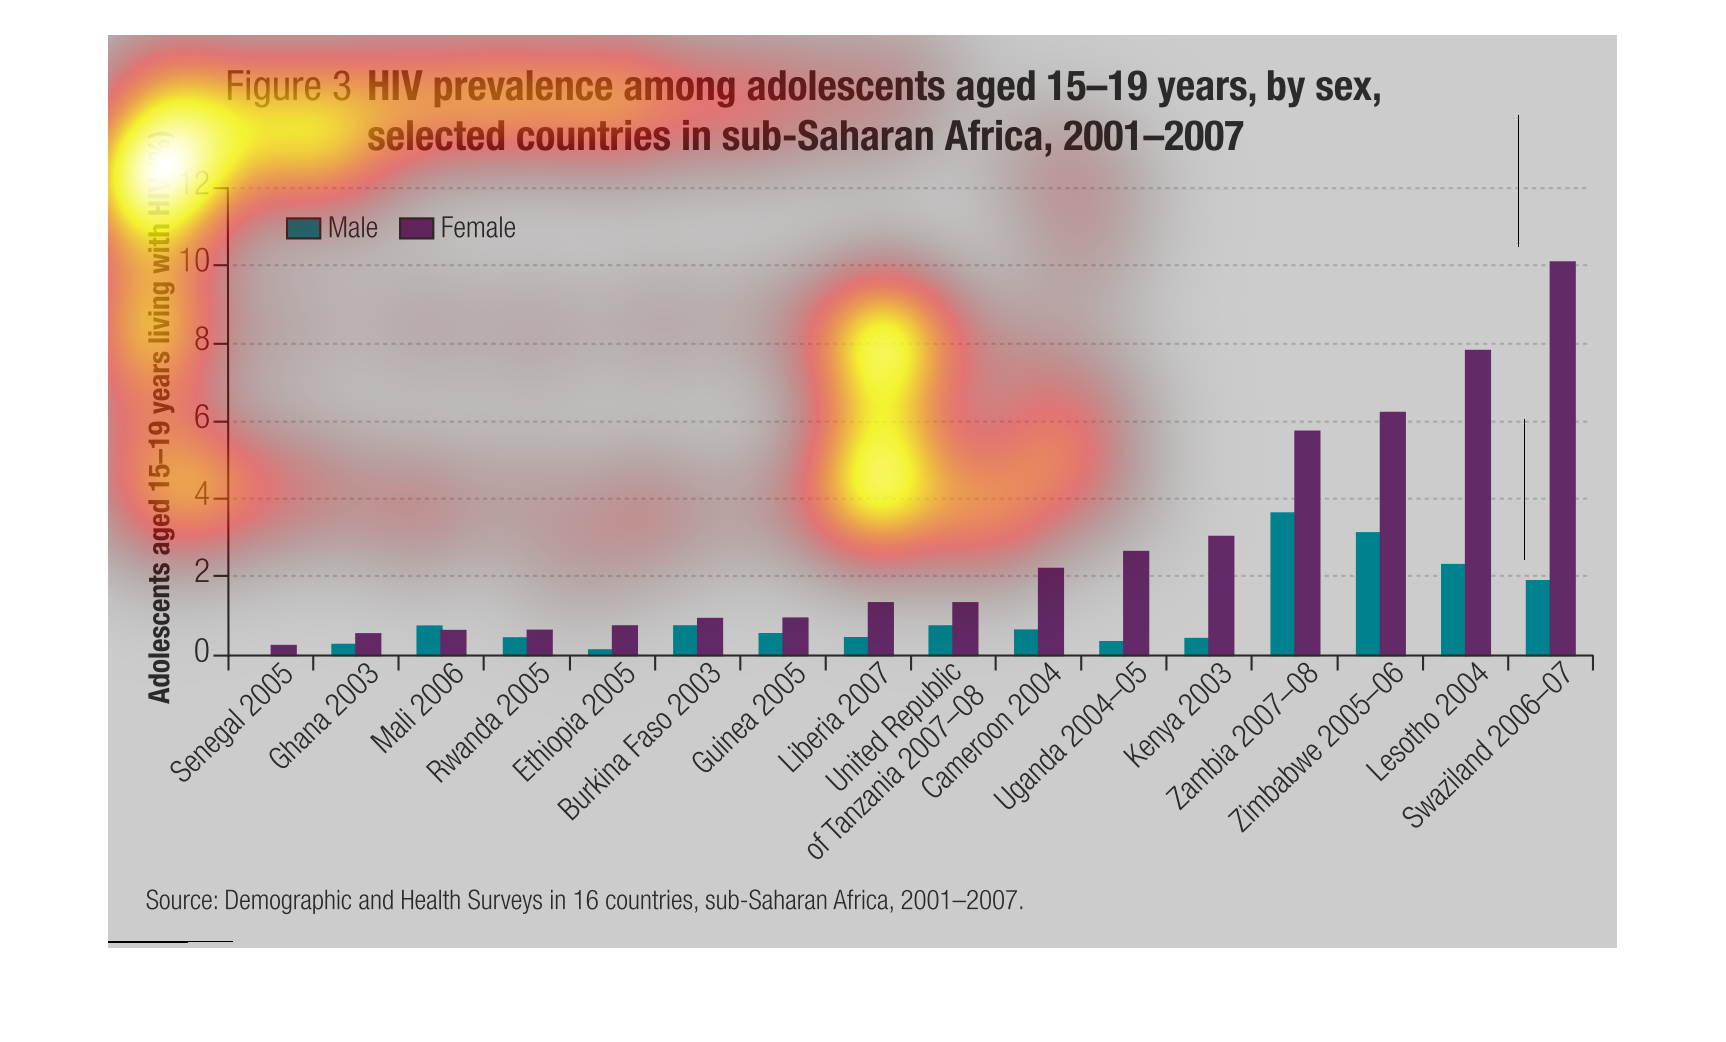
This graph shows the prevalence of the HIV virus between male and female young people between
the ages of 15-19. It shows how more and more cases are reported as the years go on.
This graph describes the hiv factor over a period of  6 years between 2001 to 2007 years in
adolesence 15-19 years of age. sex between the age group of 15- 19 in the sahara dessert to
Africa.
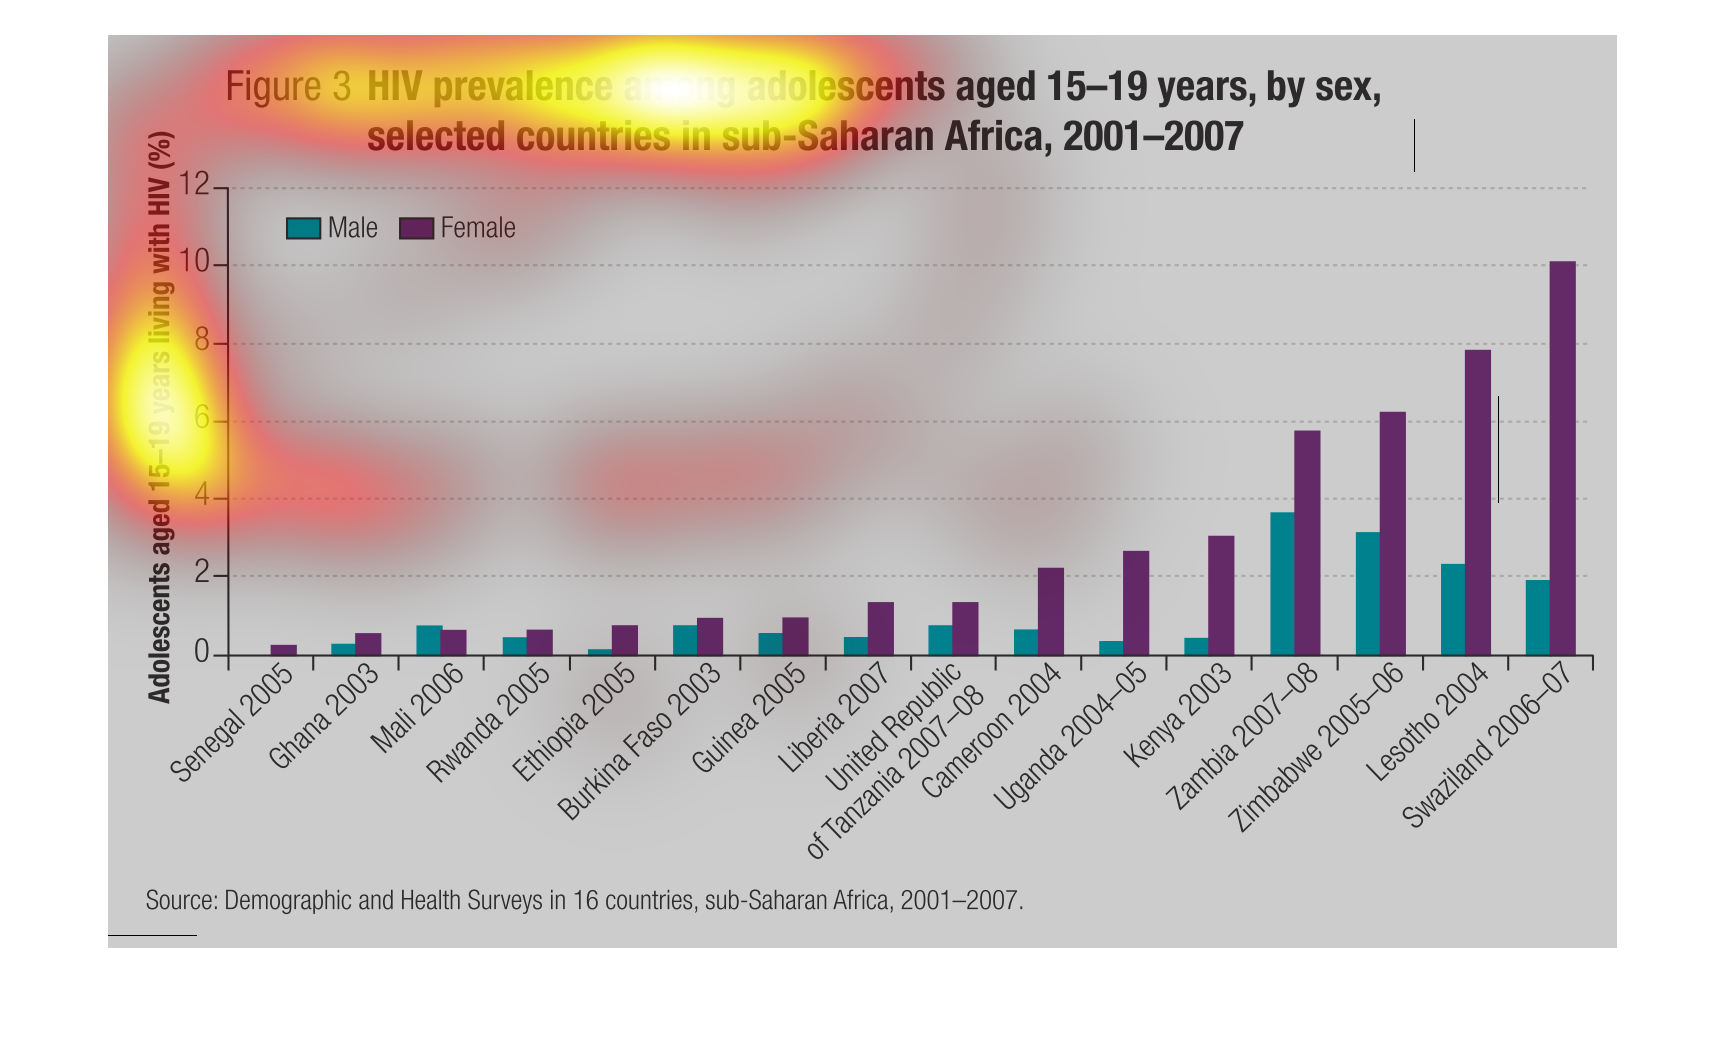
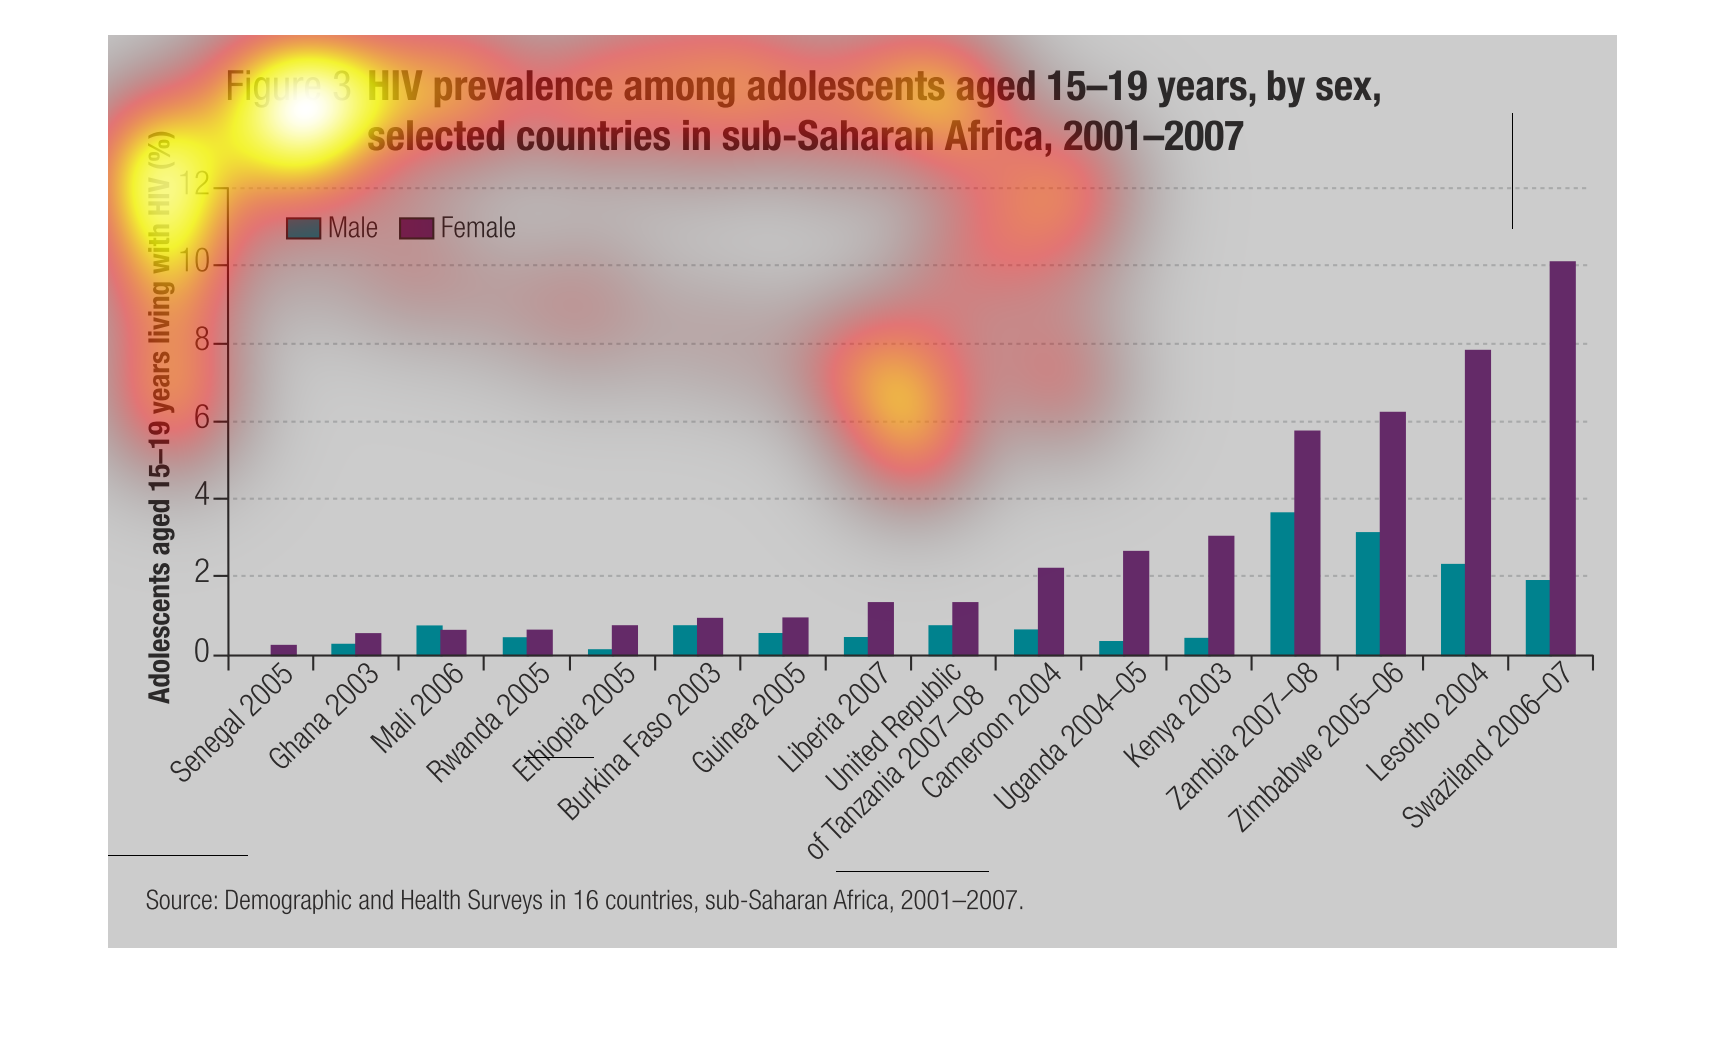
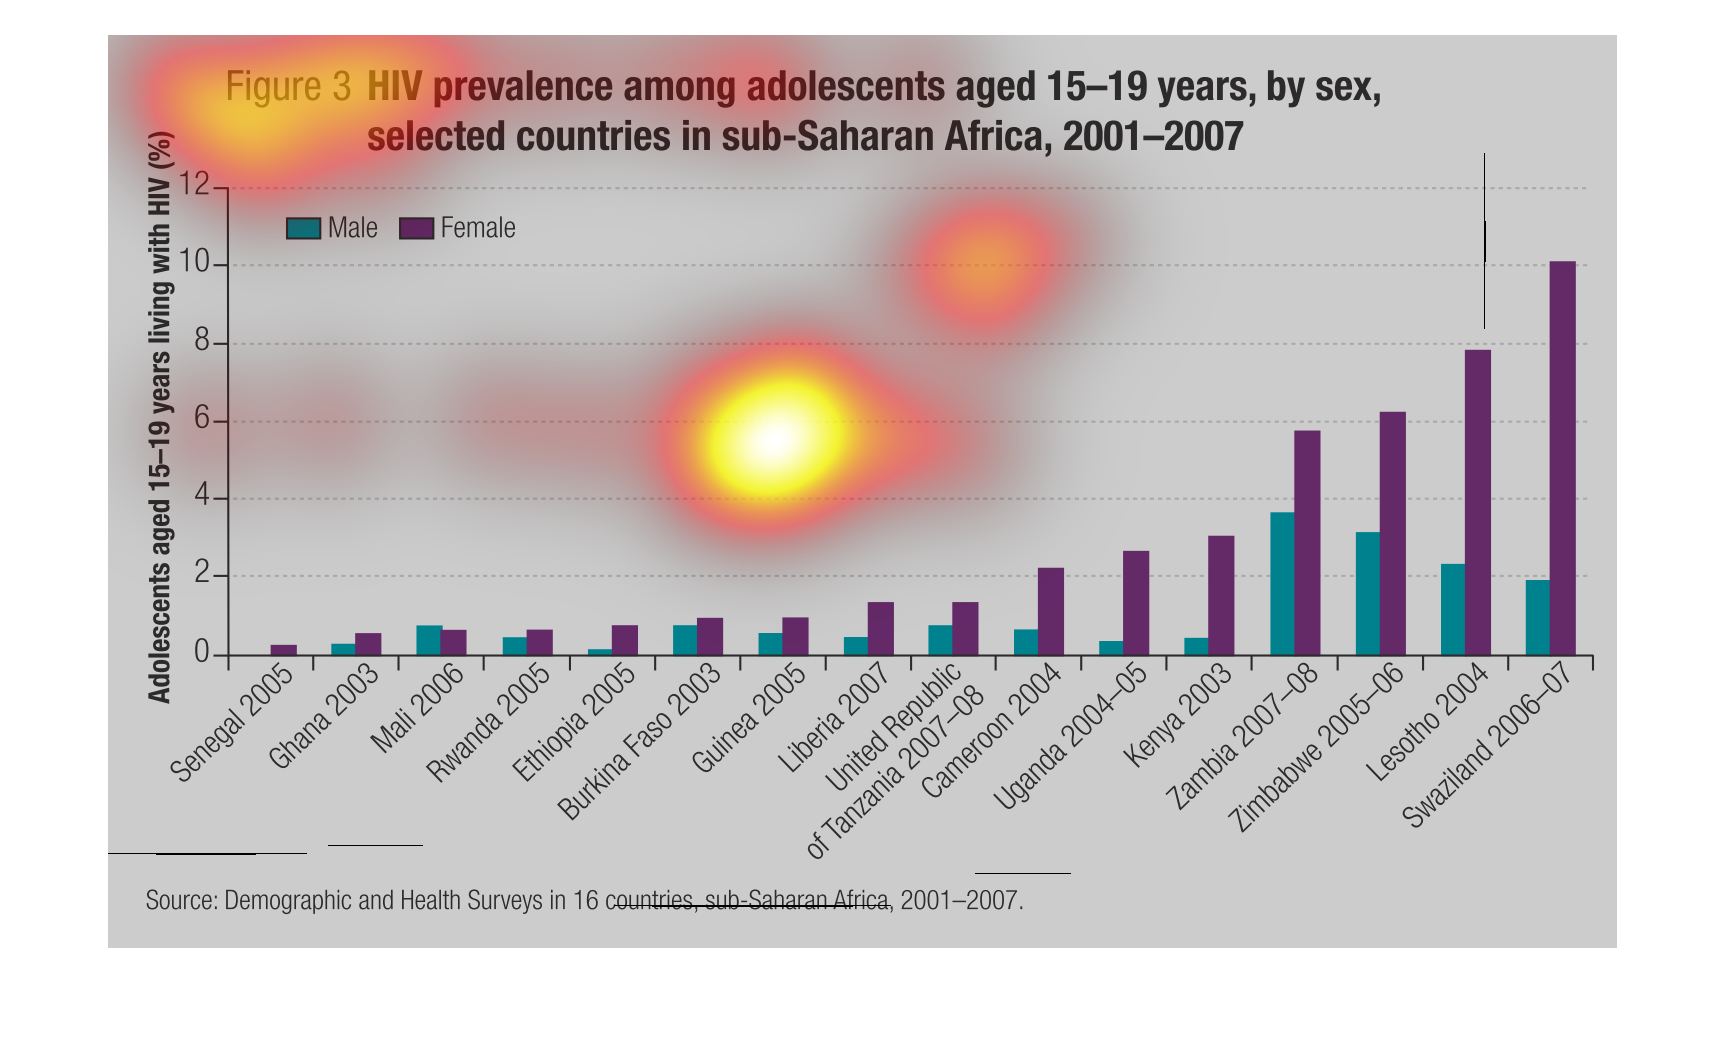
This graph shows the prevalence of HIV among adolescents between males and females. Women
are far more likely to be carriers of HIV then men.The only year that men had more cases of
HIV, was in 2006. A staggering amount of women have HIV compared to men and Swaziland.
The chart show HIV prevalence among people aged 15-19 years from 2001-2009. The graph appears
to be growing in exponentially, with the biggest gain in pace from 2004-2005.  In recent years,,
it appears that prevalence has been increasing in females dramatically, and falling in males.
This image describes the prevalence of HIV among adolescents between the ages of 15 and 19.
The information is this image is based upon results from the sub-Saharan region of Africa.
This study was based upon results found between 2001 and 2007.
This is a bar graph that shows by country the percent of adolescents aged 15-19 that have
HIV. It shows that in several county's famales with HIV vastly out number men with HIV the
worst country being Swaziland.
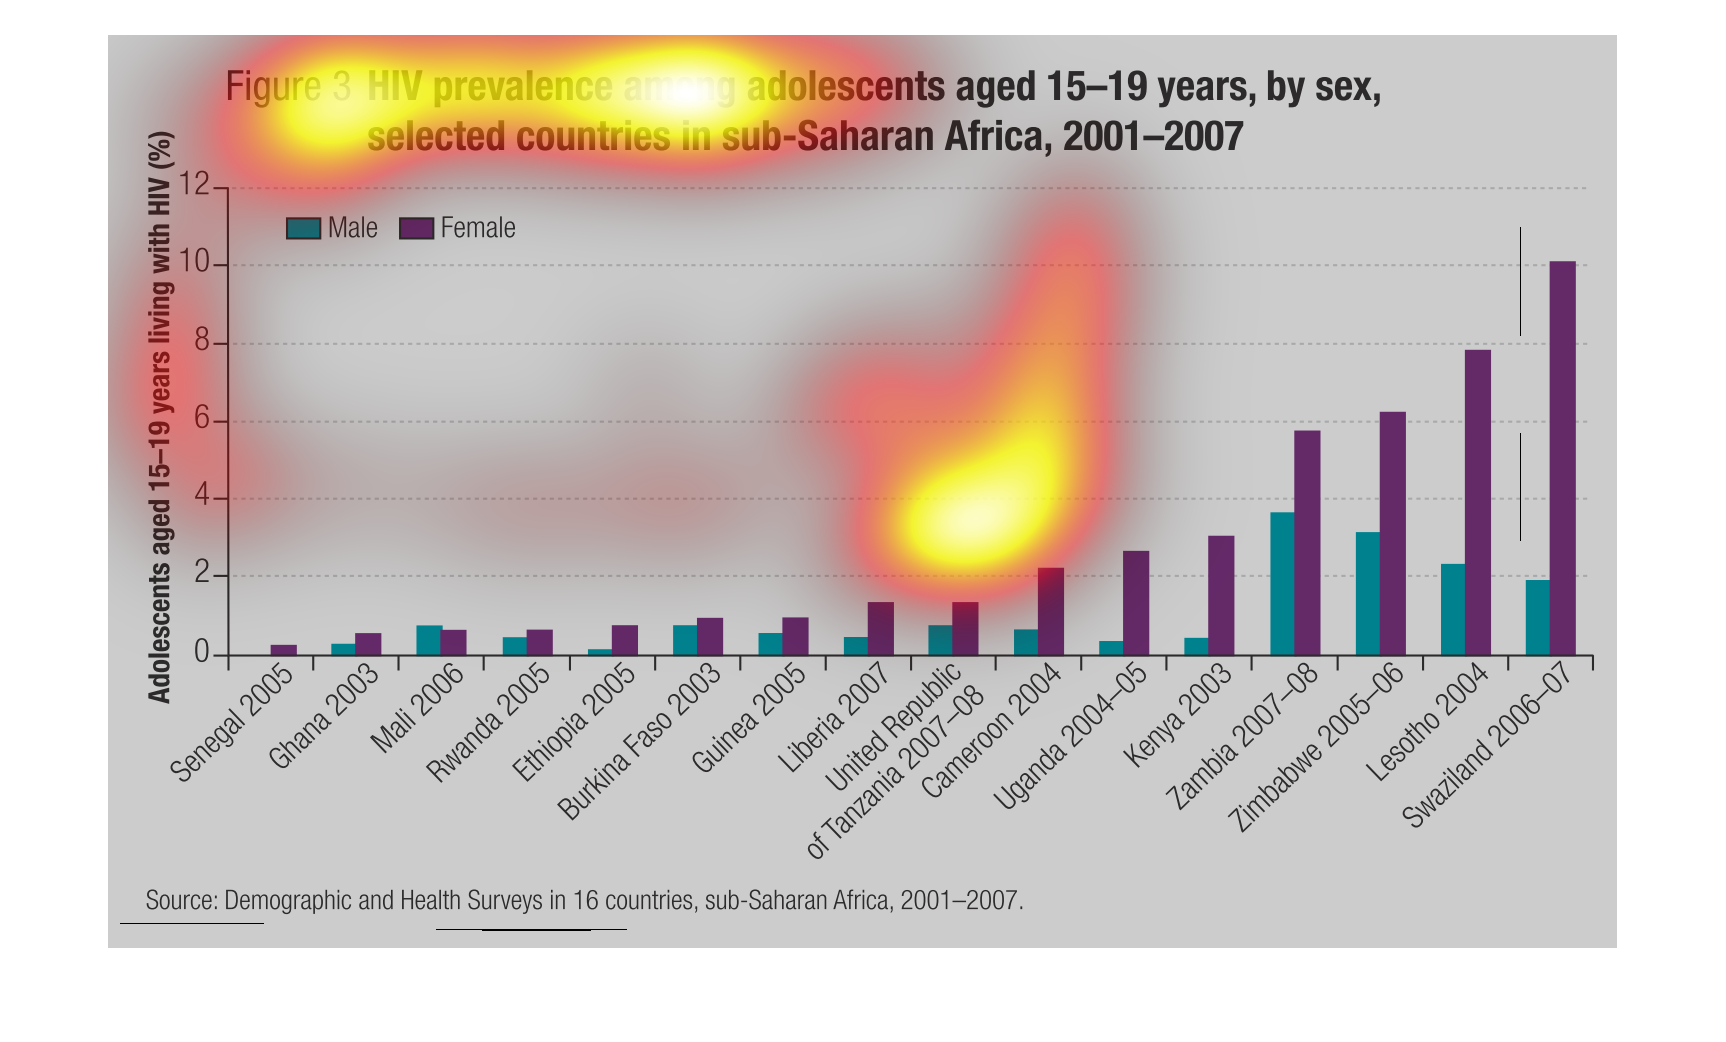
This graph shows HIV prevalence in adolescents aged 15 to 19 years in sub-Saharan Africa in
2001 to 2007.  Swaziland in 2006 and 2007 is the highest rate in the area.