Unmet need for family planning in married women aged 15-49 by region.  Running down the left
side is a list of countries associated with the study. Next to each countries name is a bar
chart showing how prevent lent the statics occurred either in 2005 and 1995. At the bottom
it reading the proportion of married women 15-49 with an unmet need for family planning.
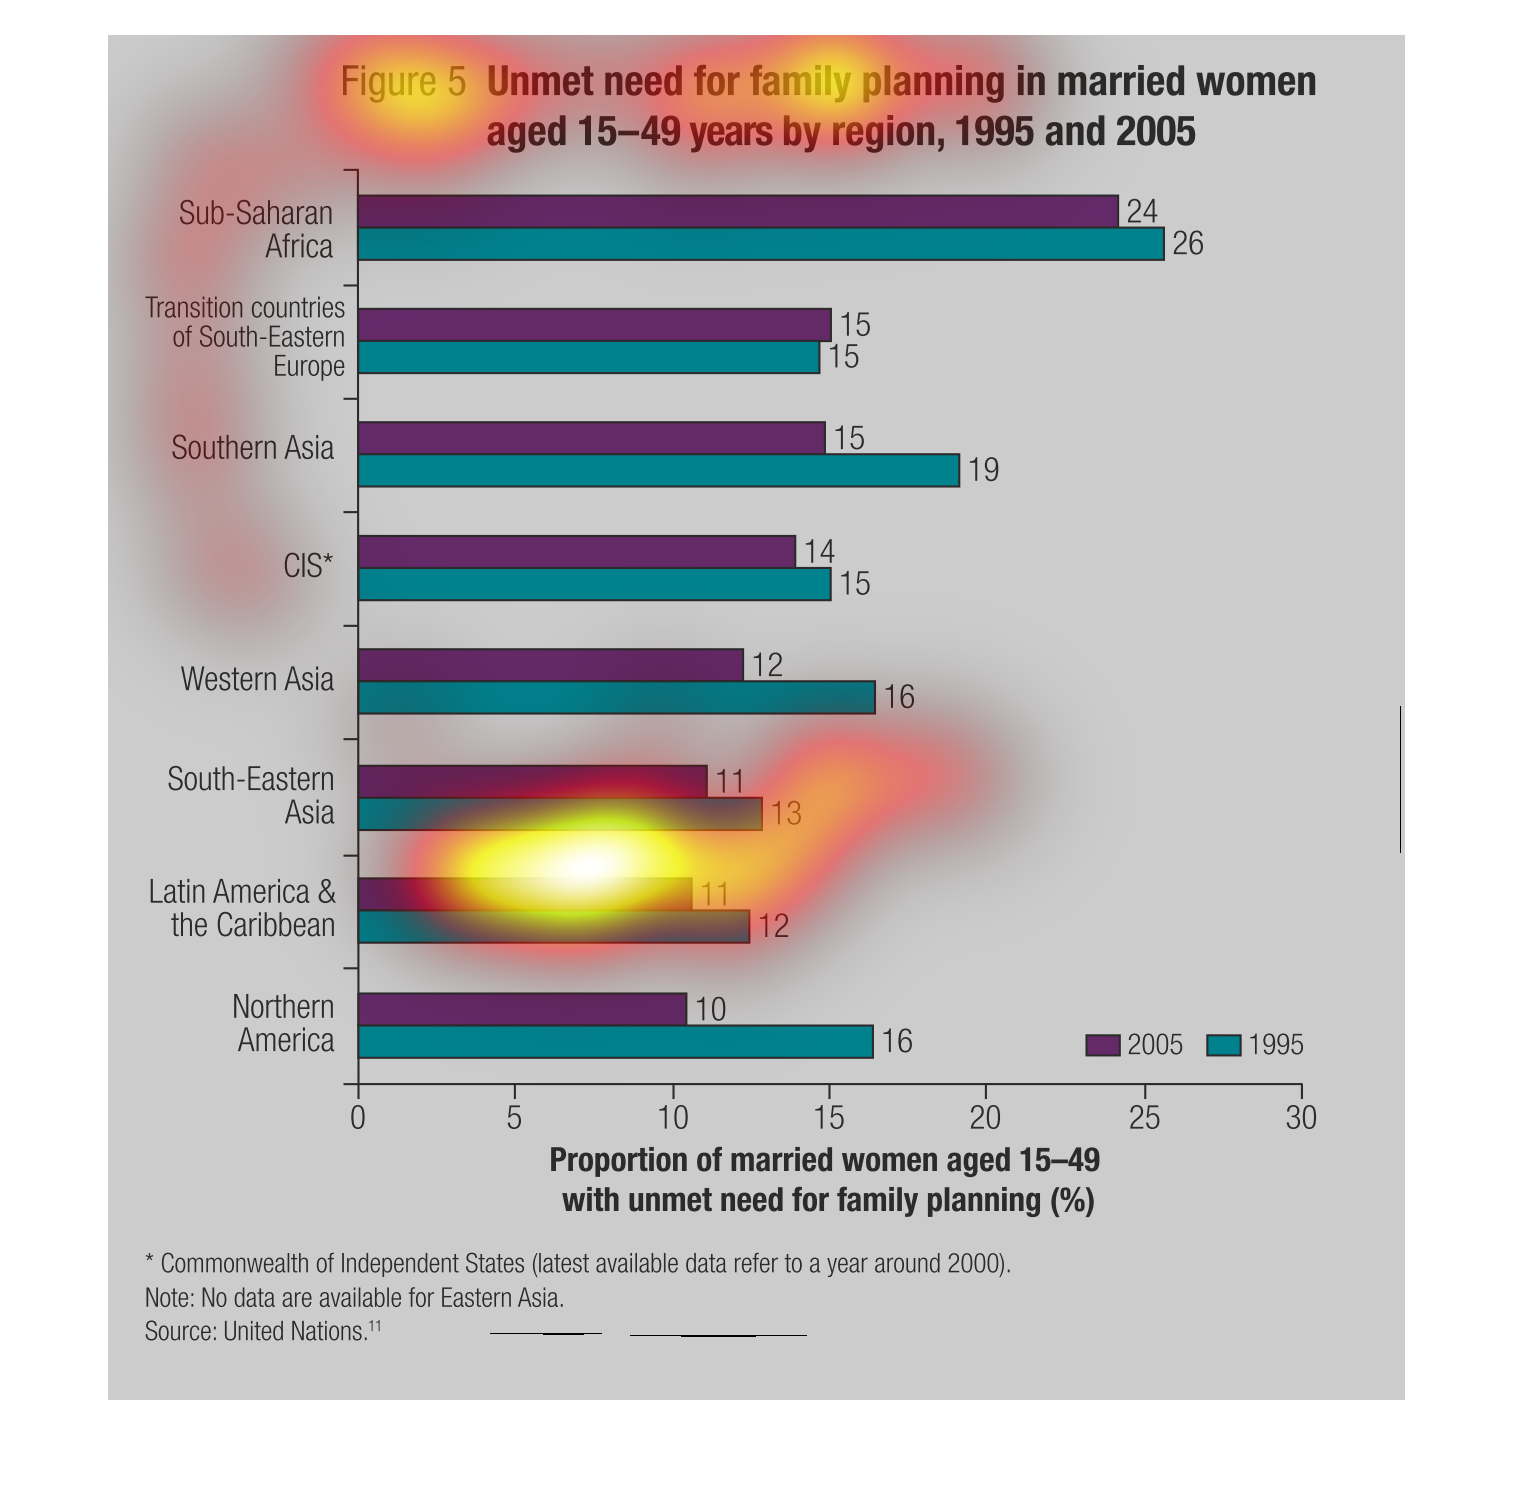
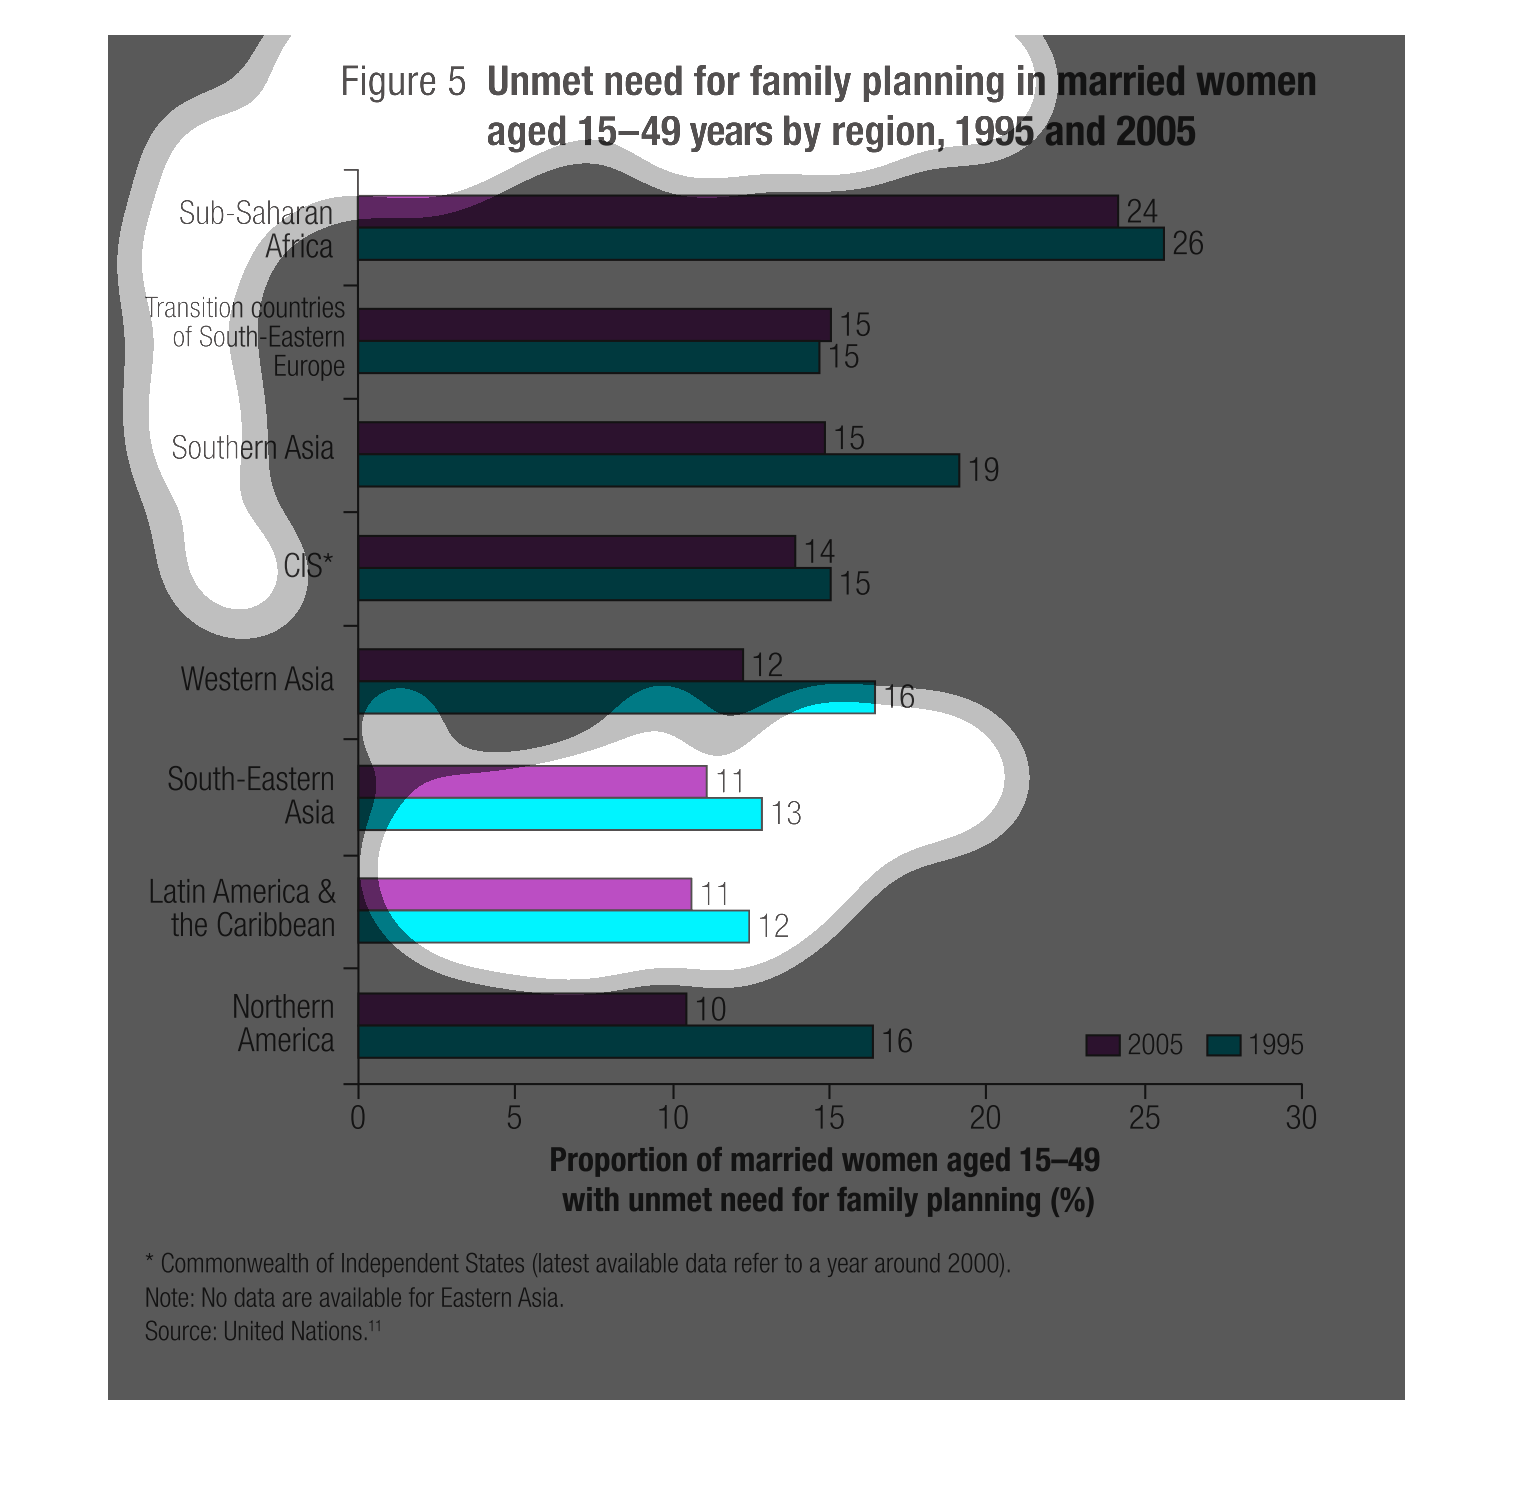
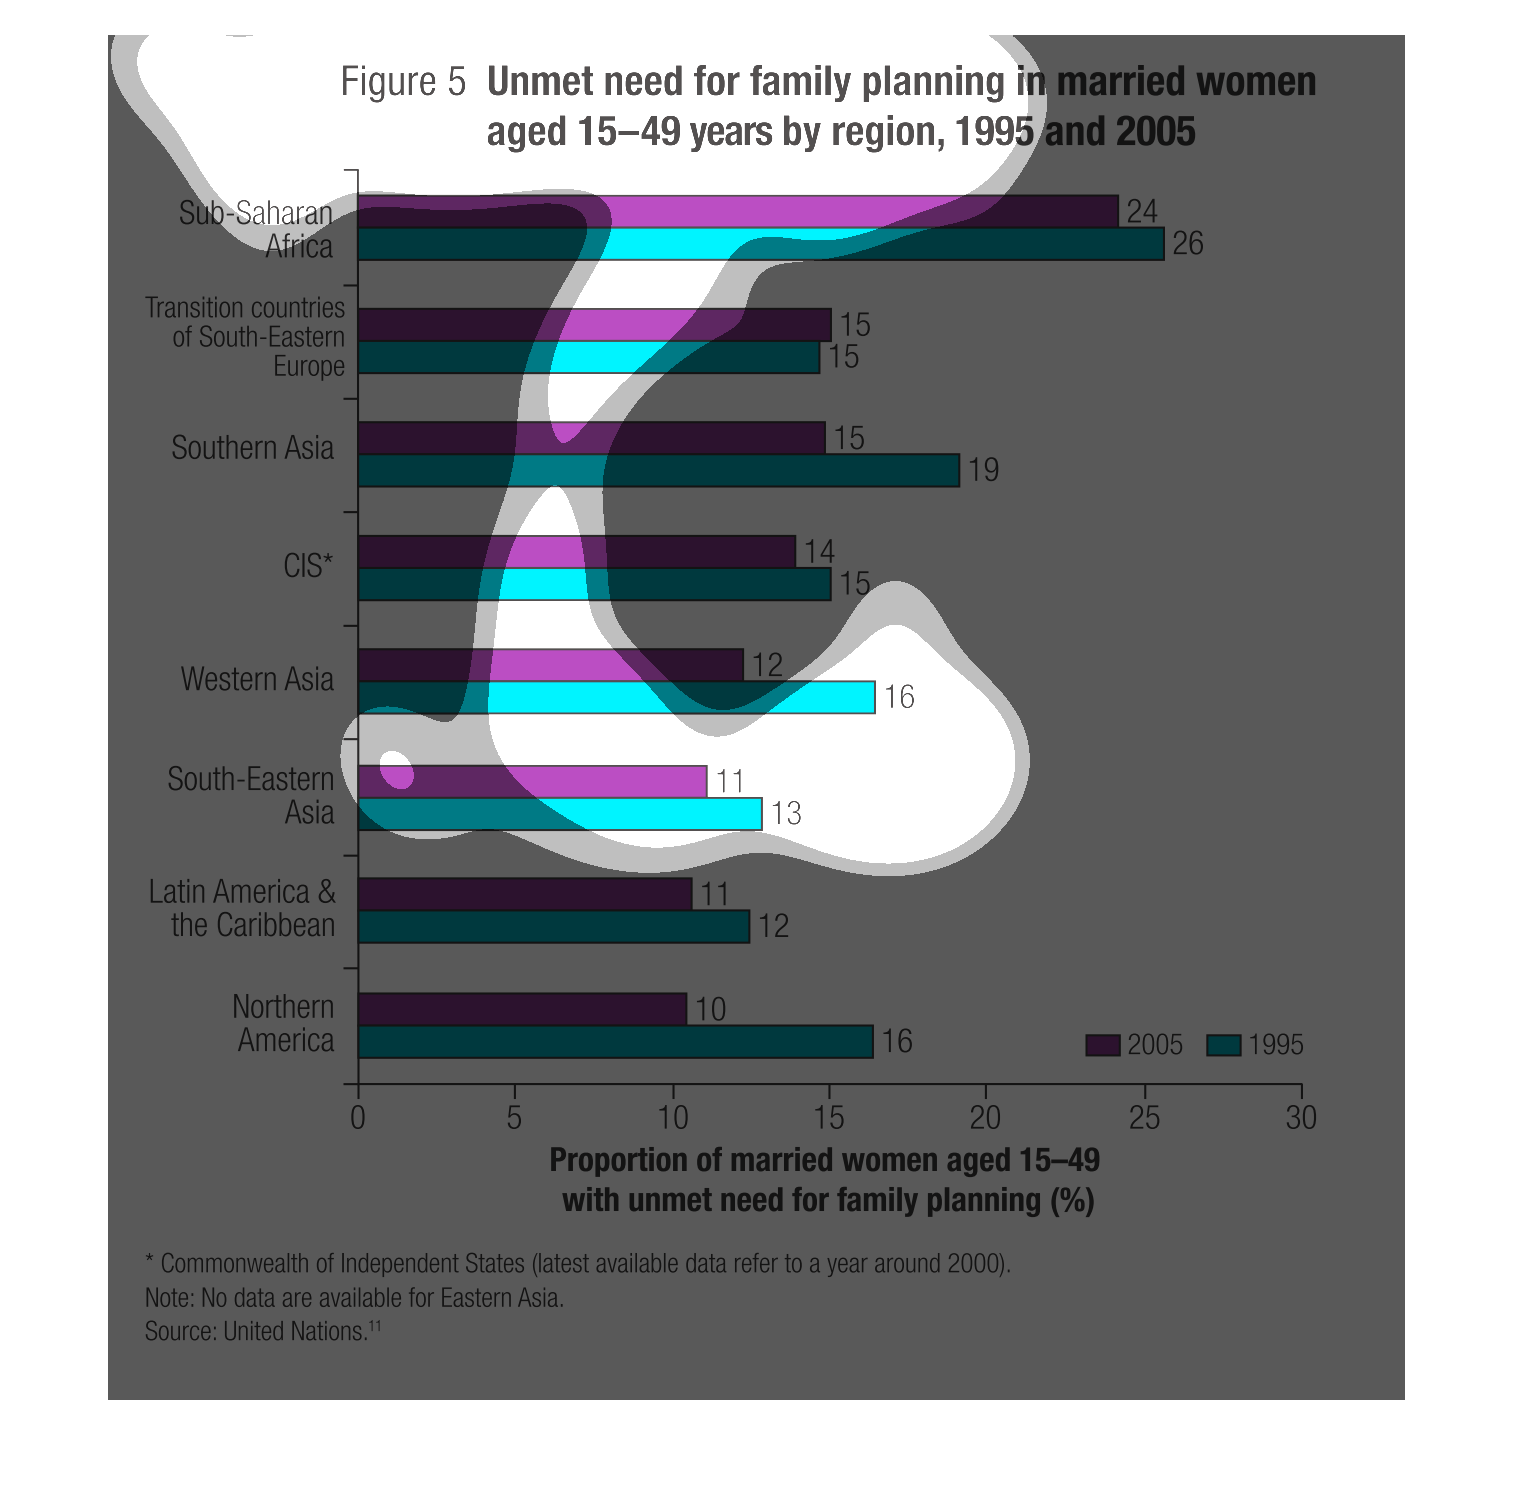
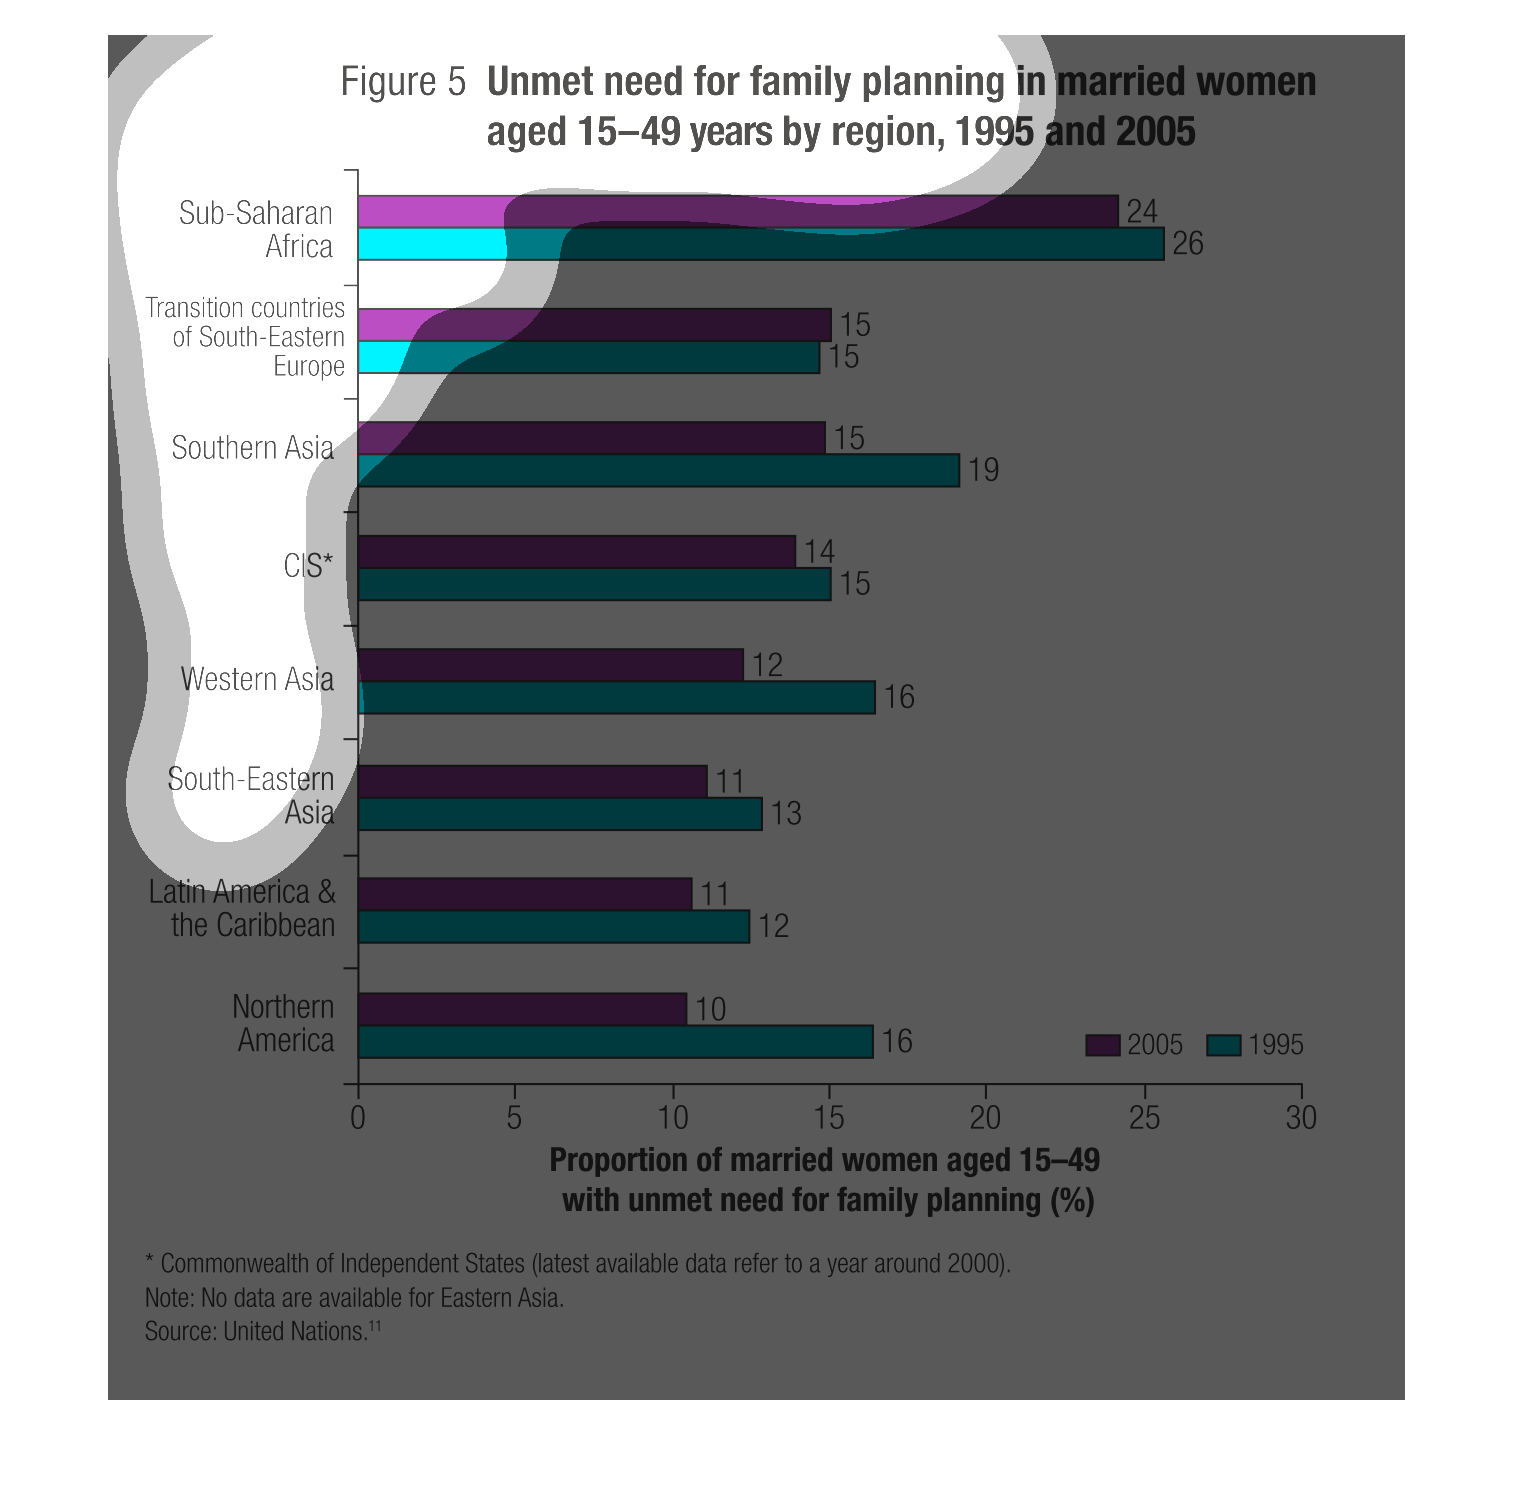
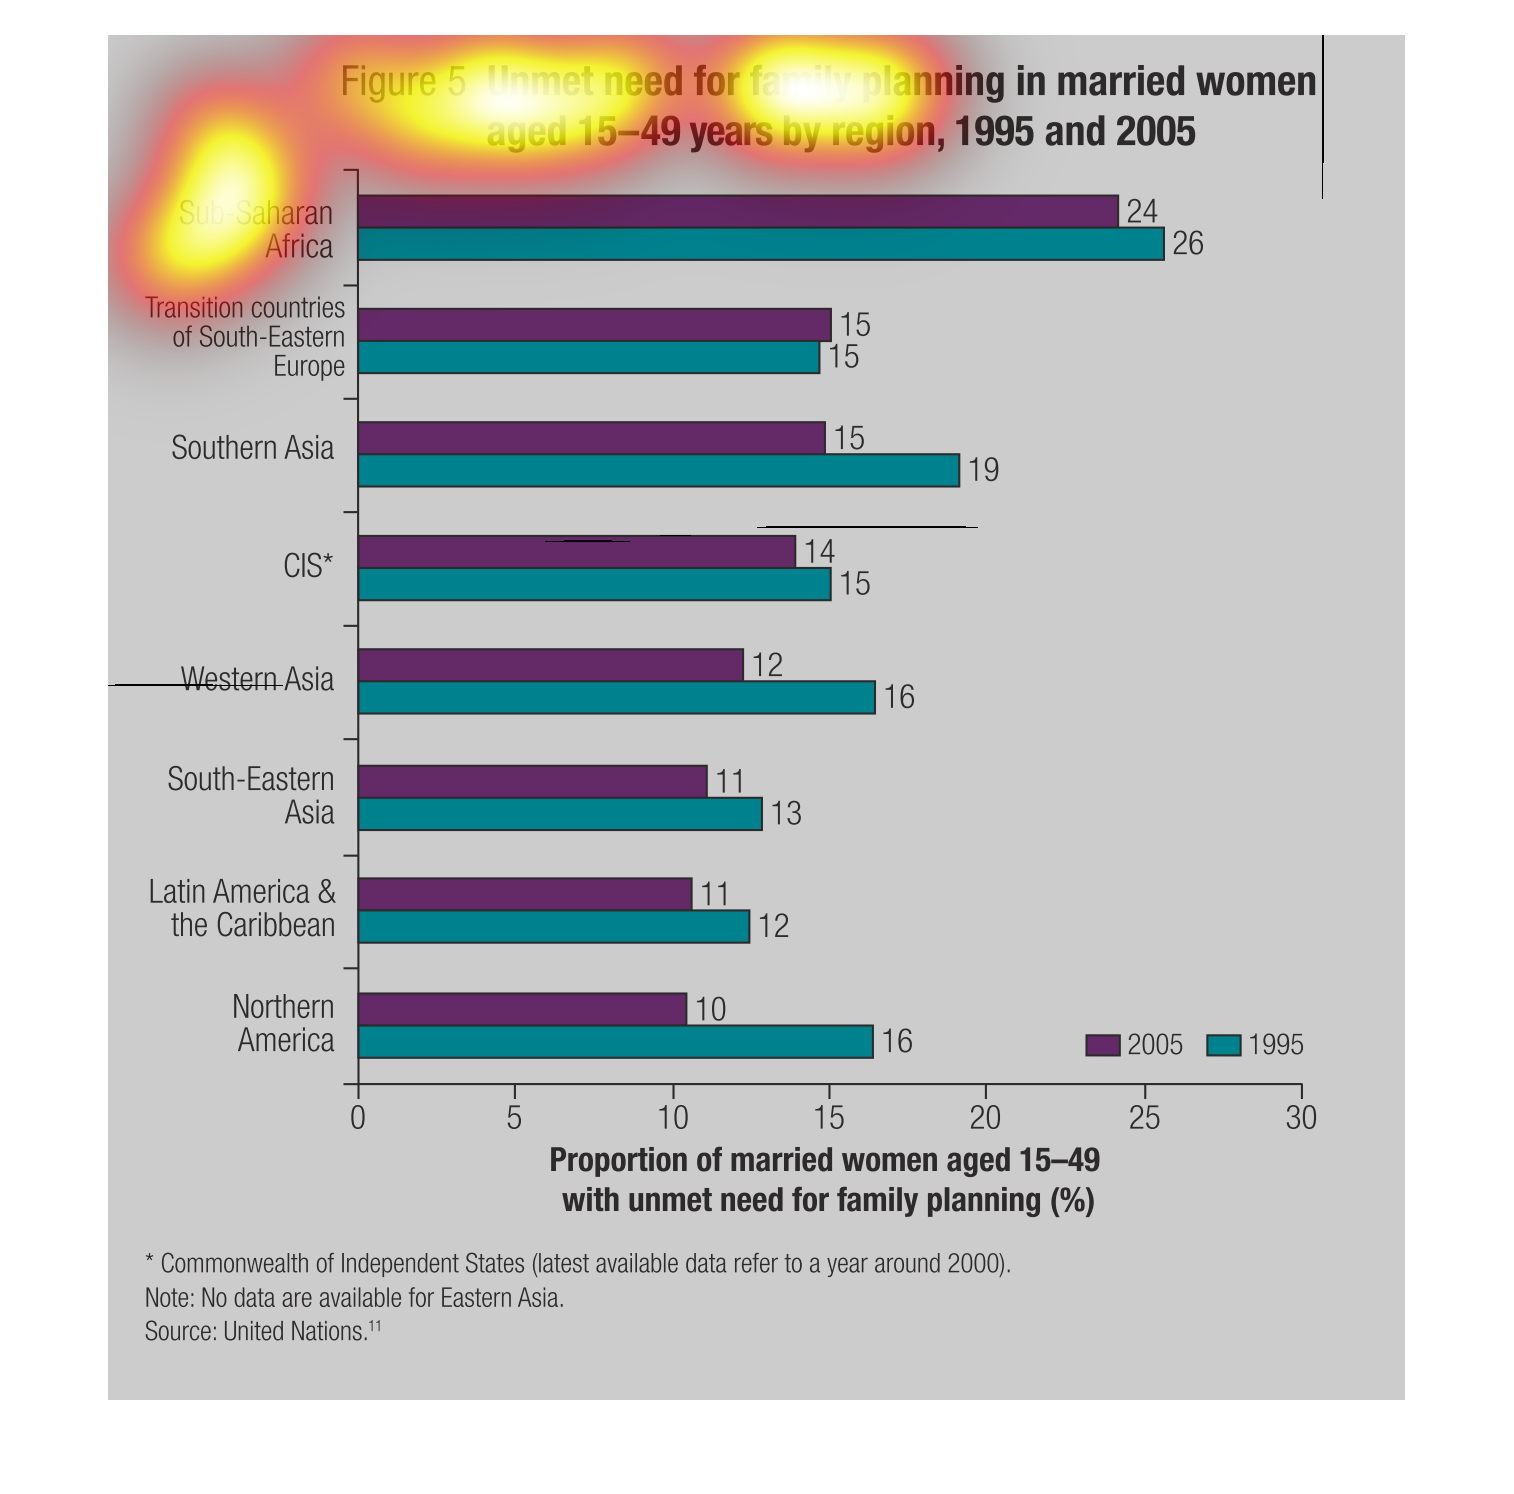
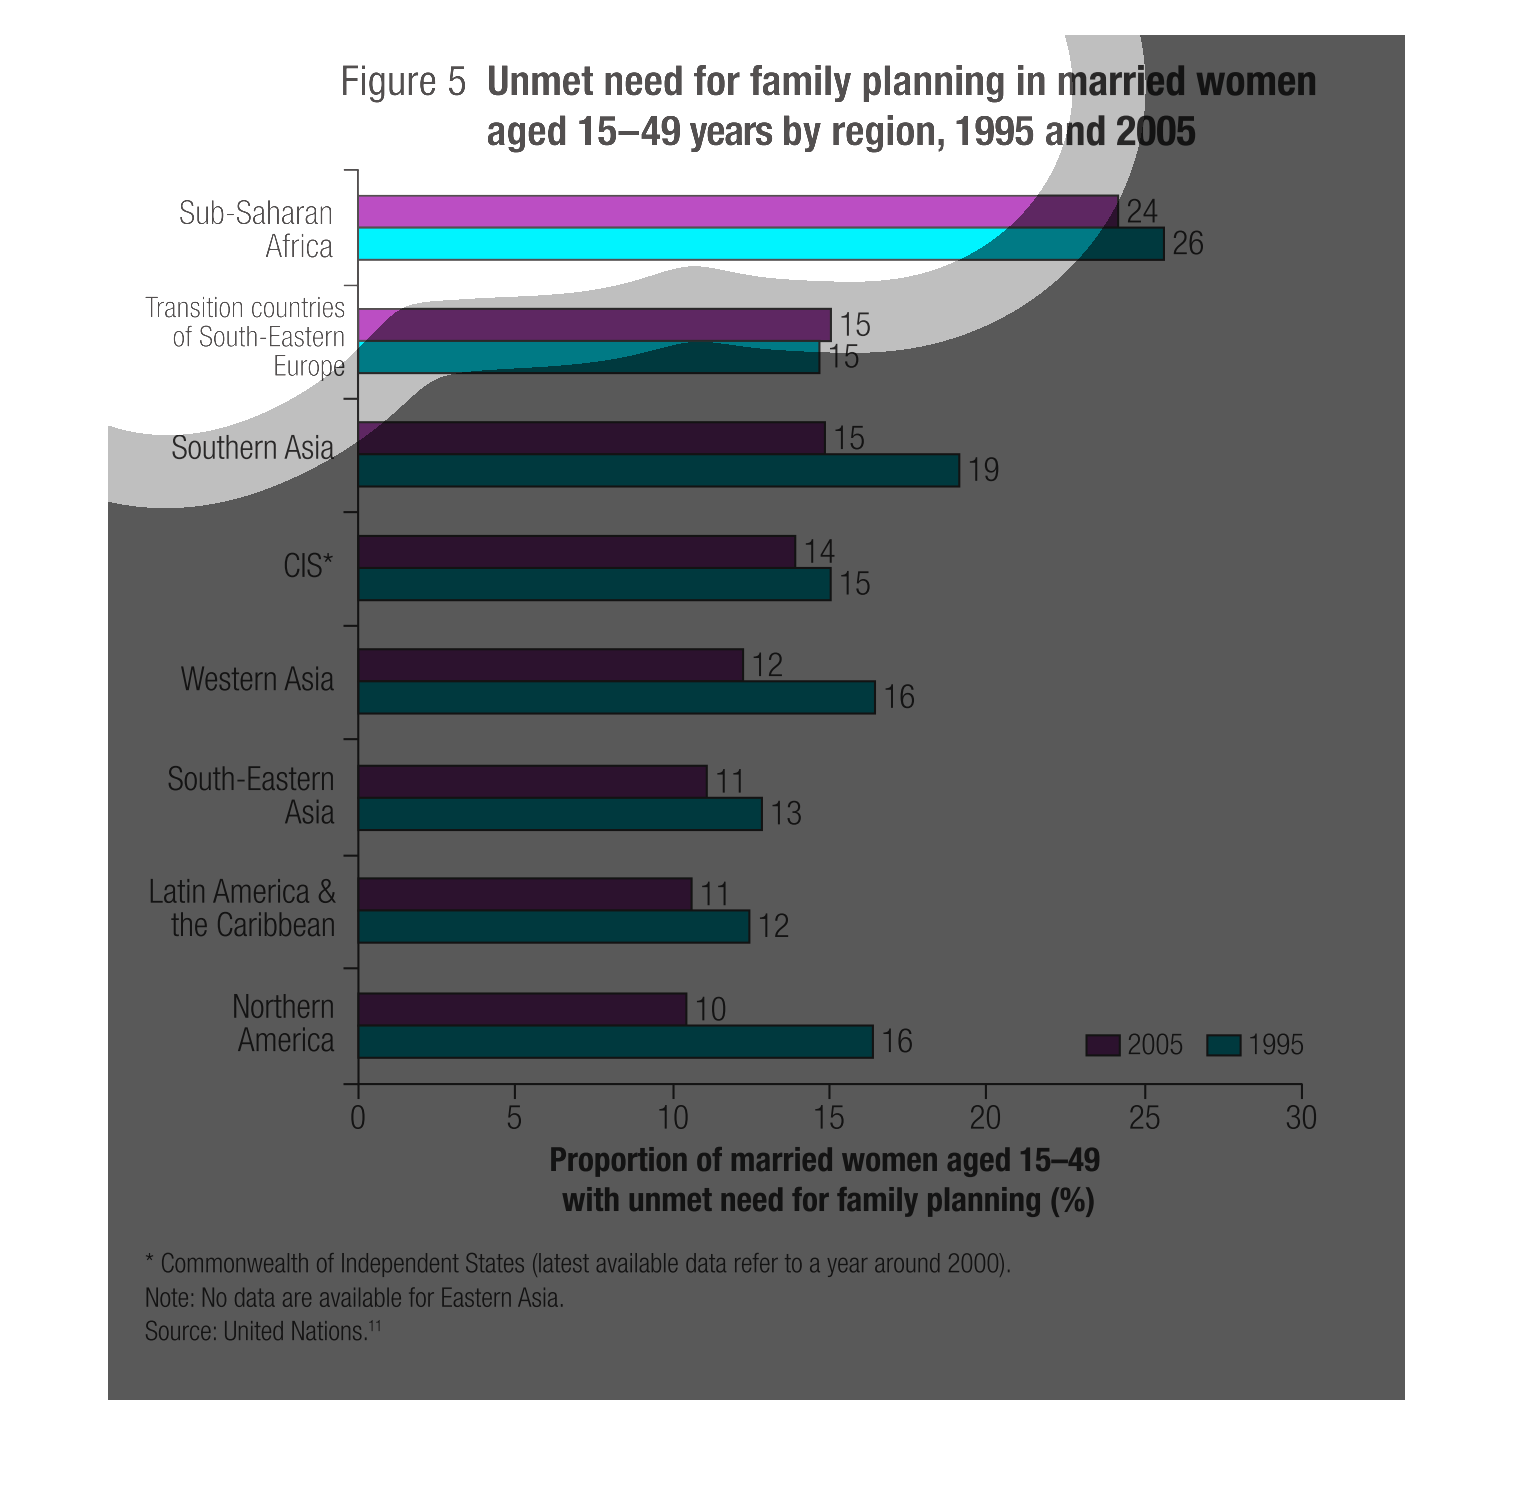
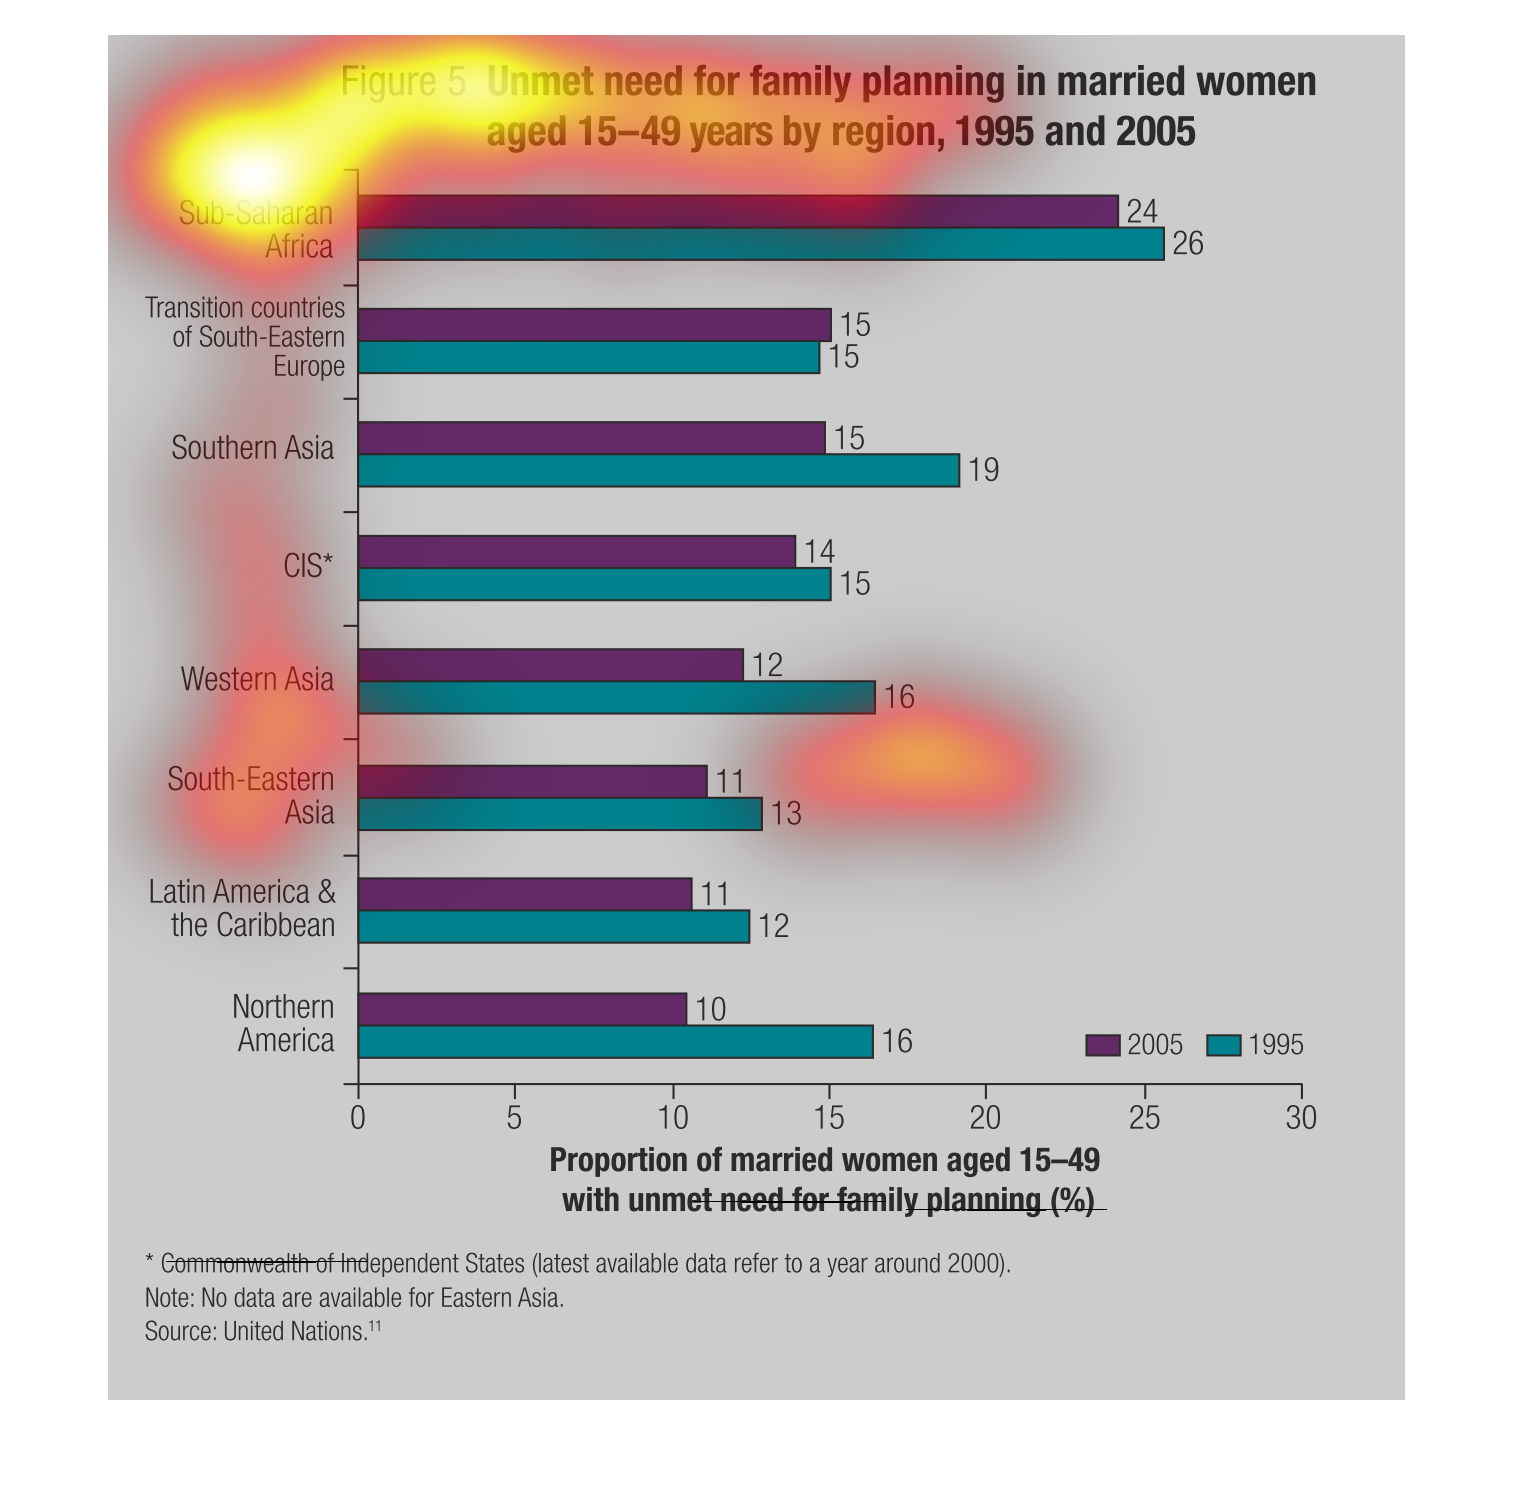
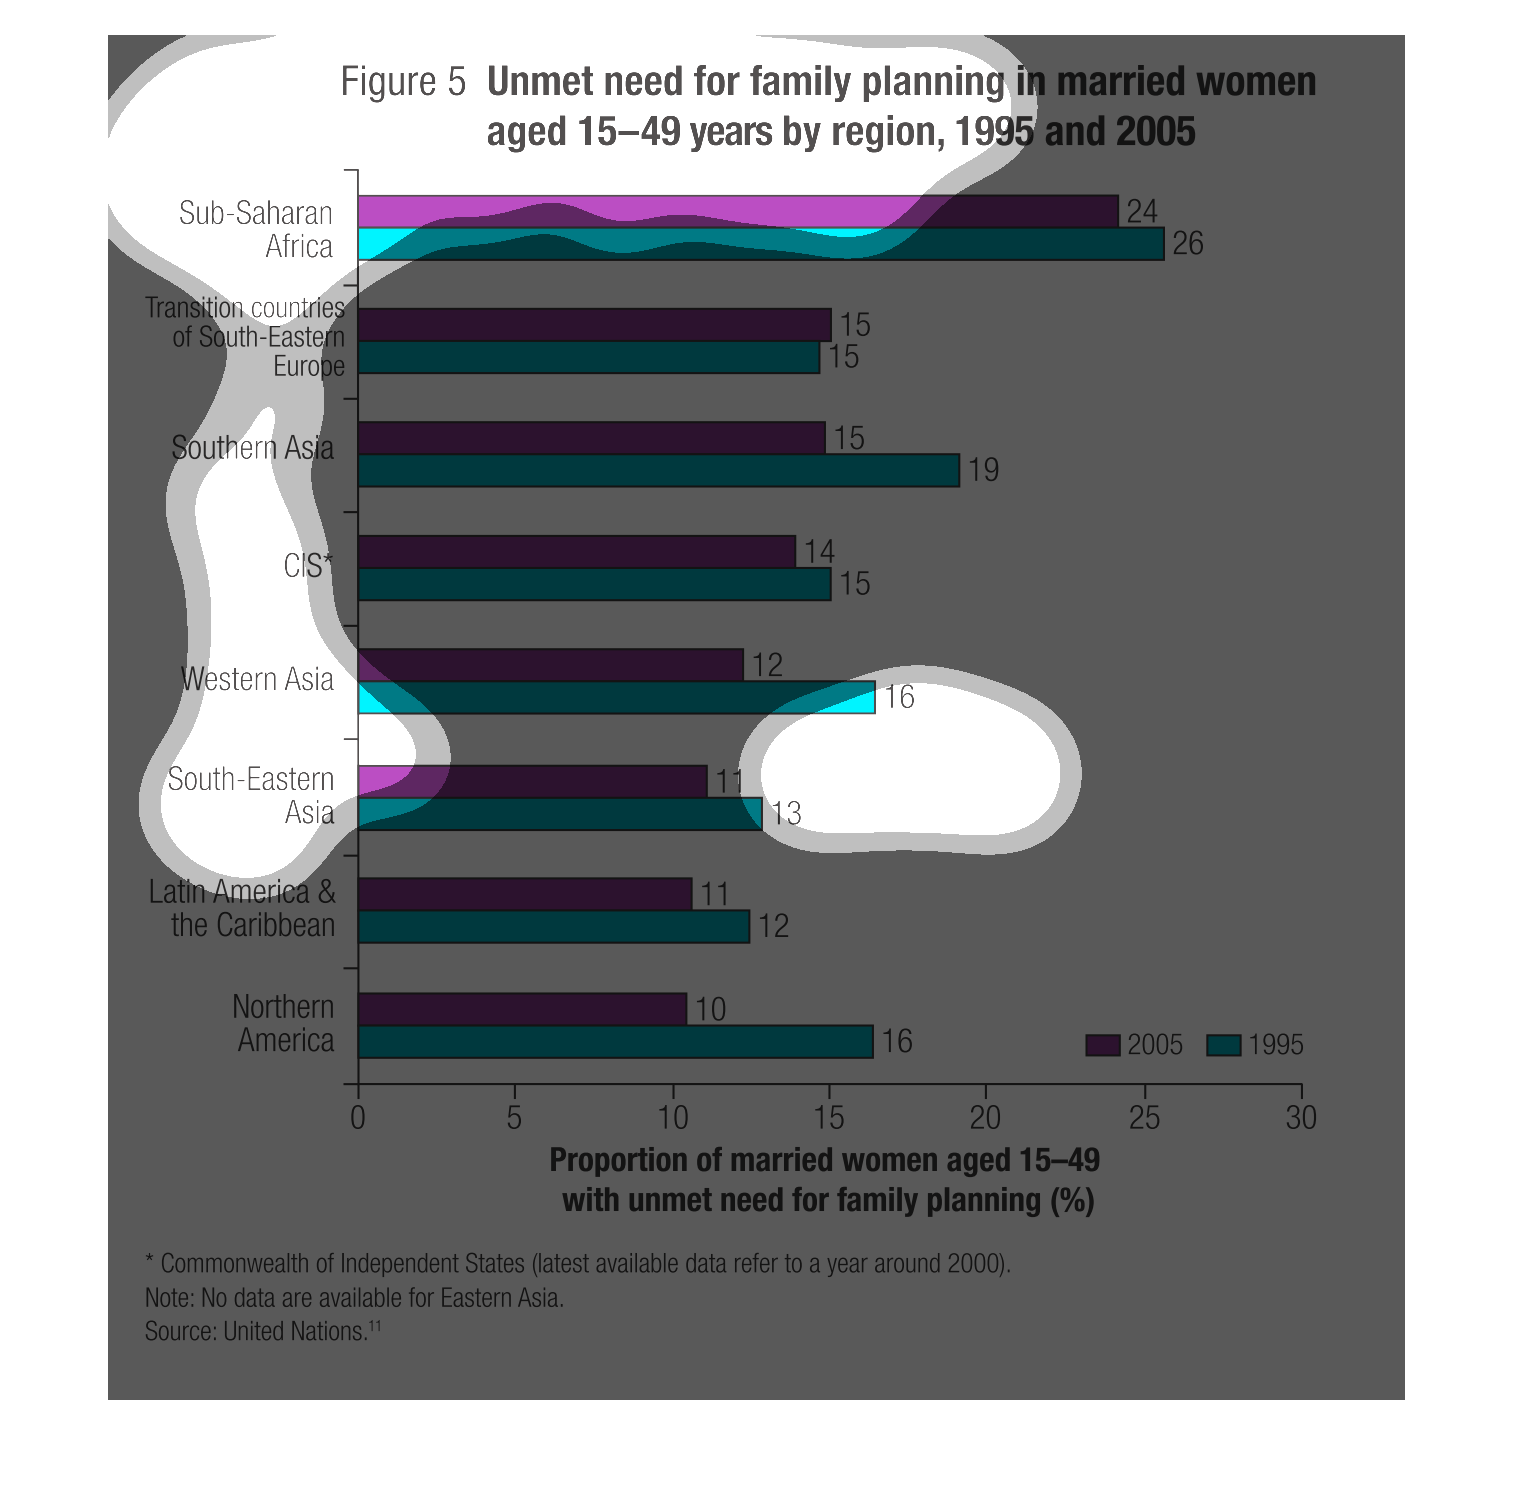
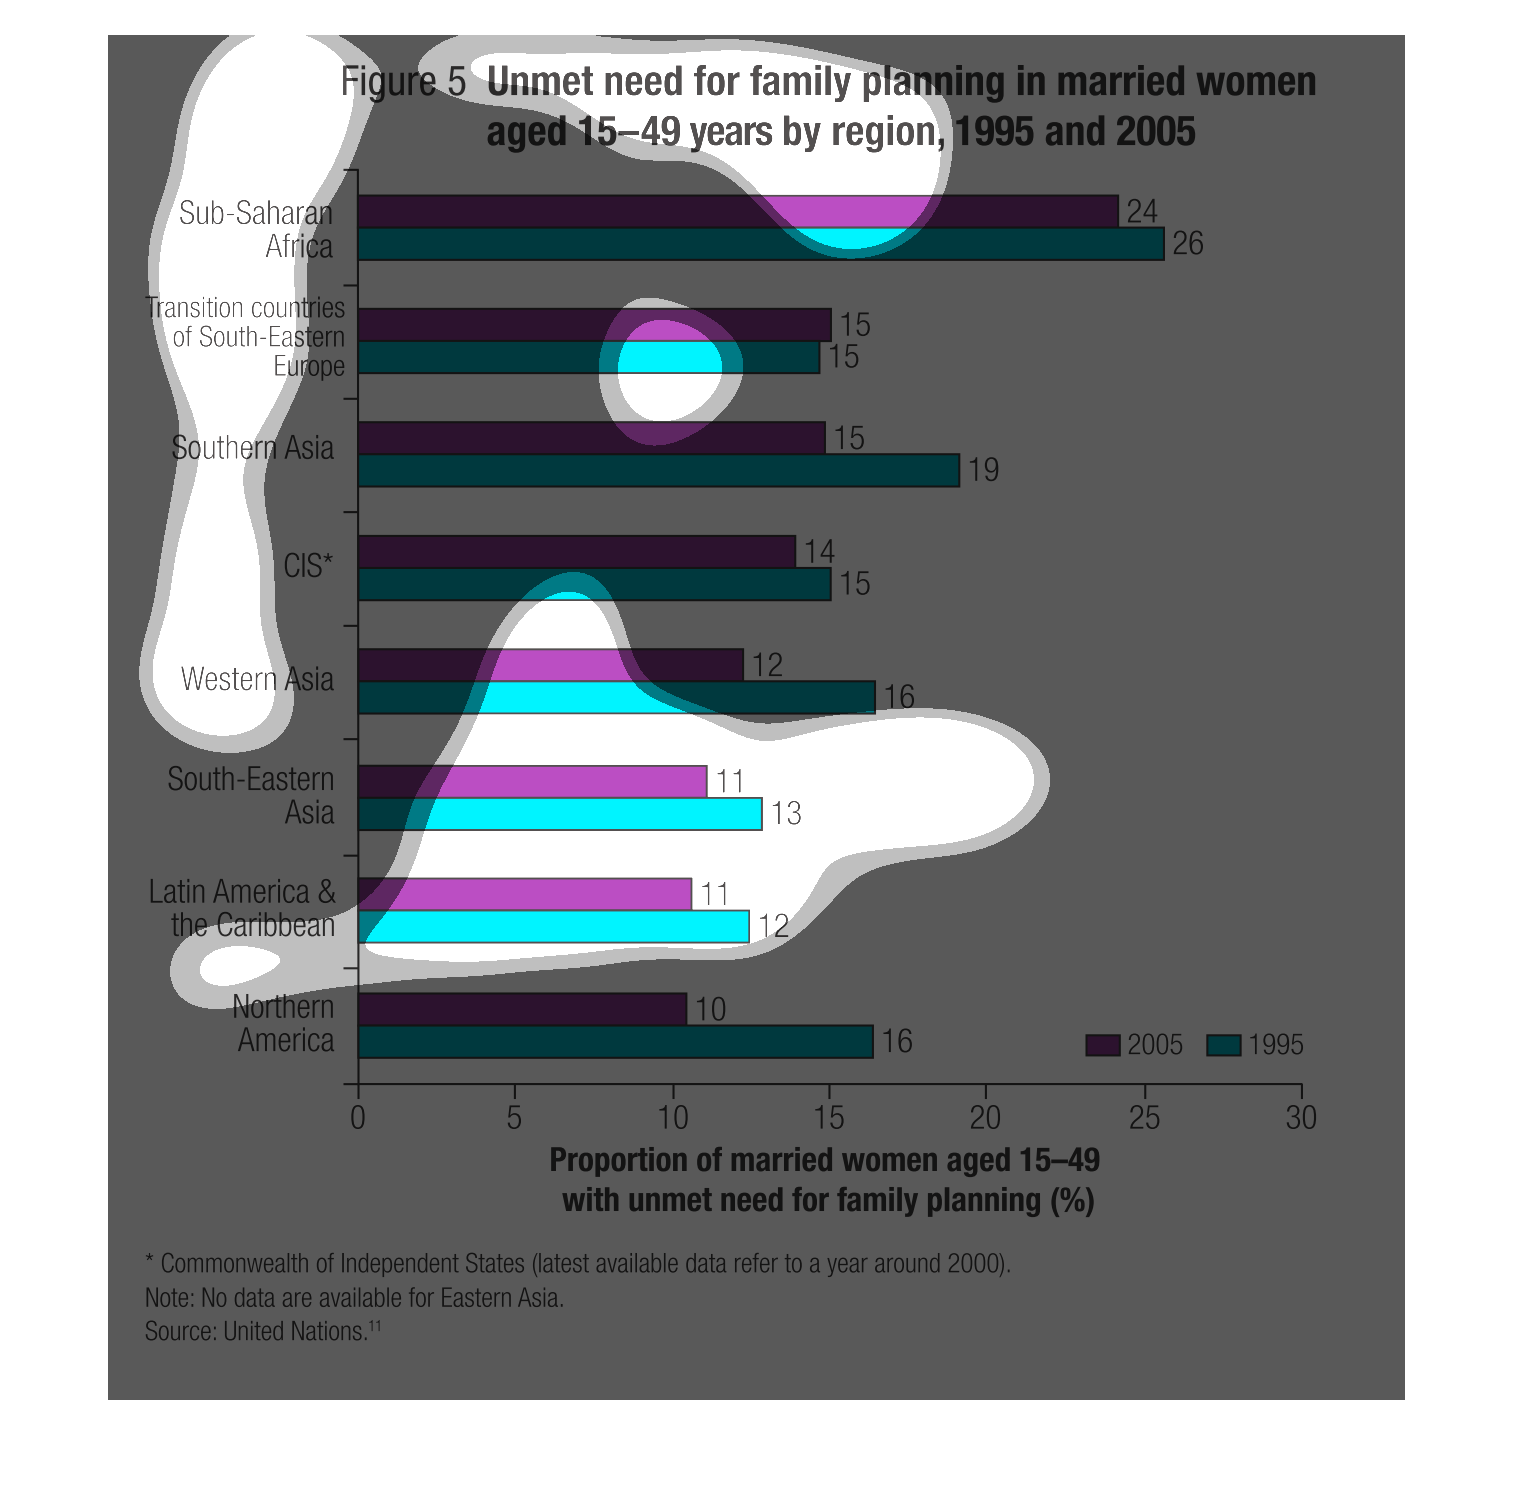
The graph depicts unmet needs for family planning in married women age 15-49 by region in
1995 and 2005. Sub Saharan Africa has the most unmet needs by far. Latin America and the Caribbean
have the least. A major trend in 7 of the 8 regions is an increase in unmet needs from 1995
to 2005.
The following chart shows an unmet need for family planning with women aged 15-49 years of
age by region in the year 1995 and 2005. For the vast majority there is a downward trend.
This chart describes unmet need for family planning in married women aged 15-49 years by region
for the years 1995 and 2005. Regions on the chart include Southern Asia.
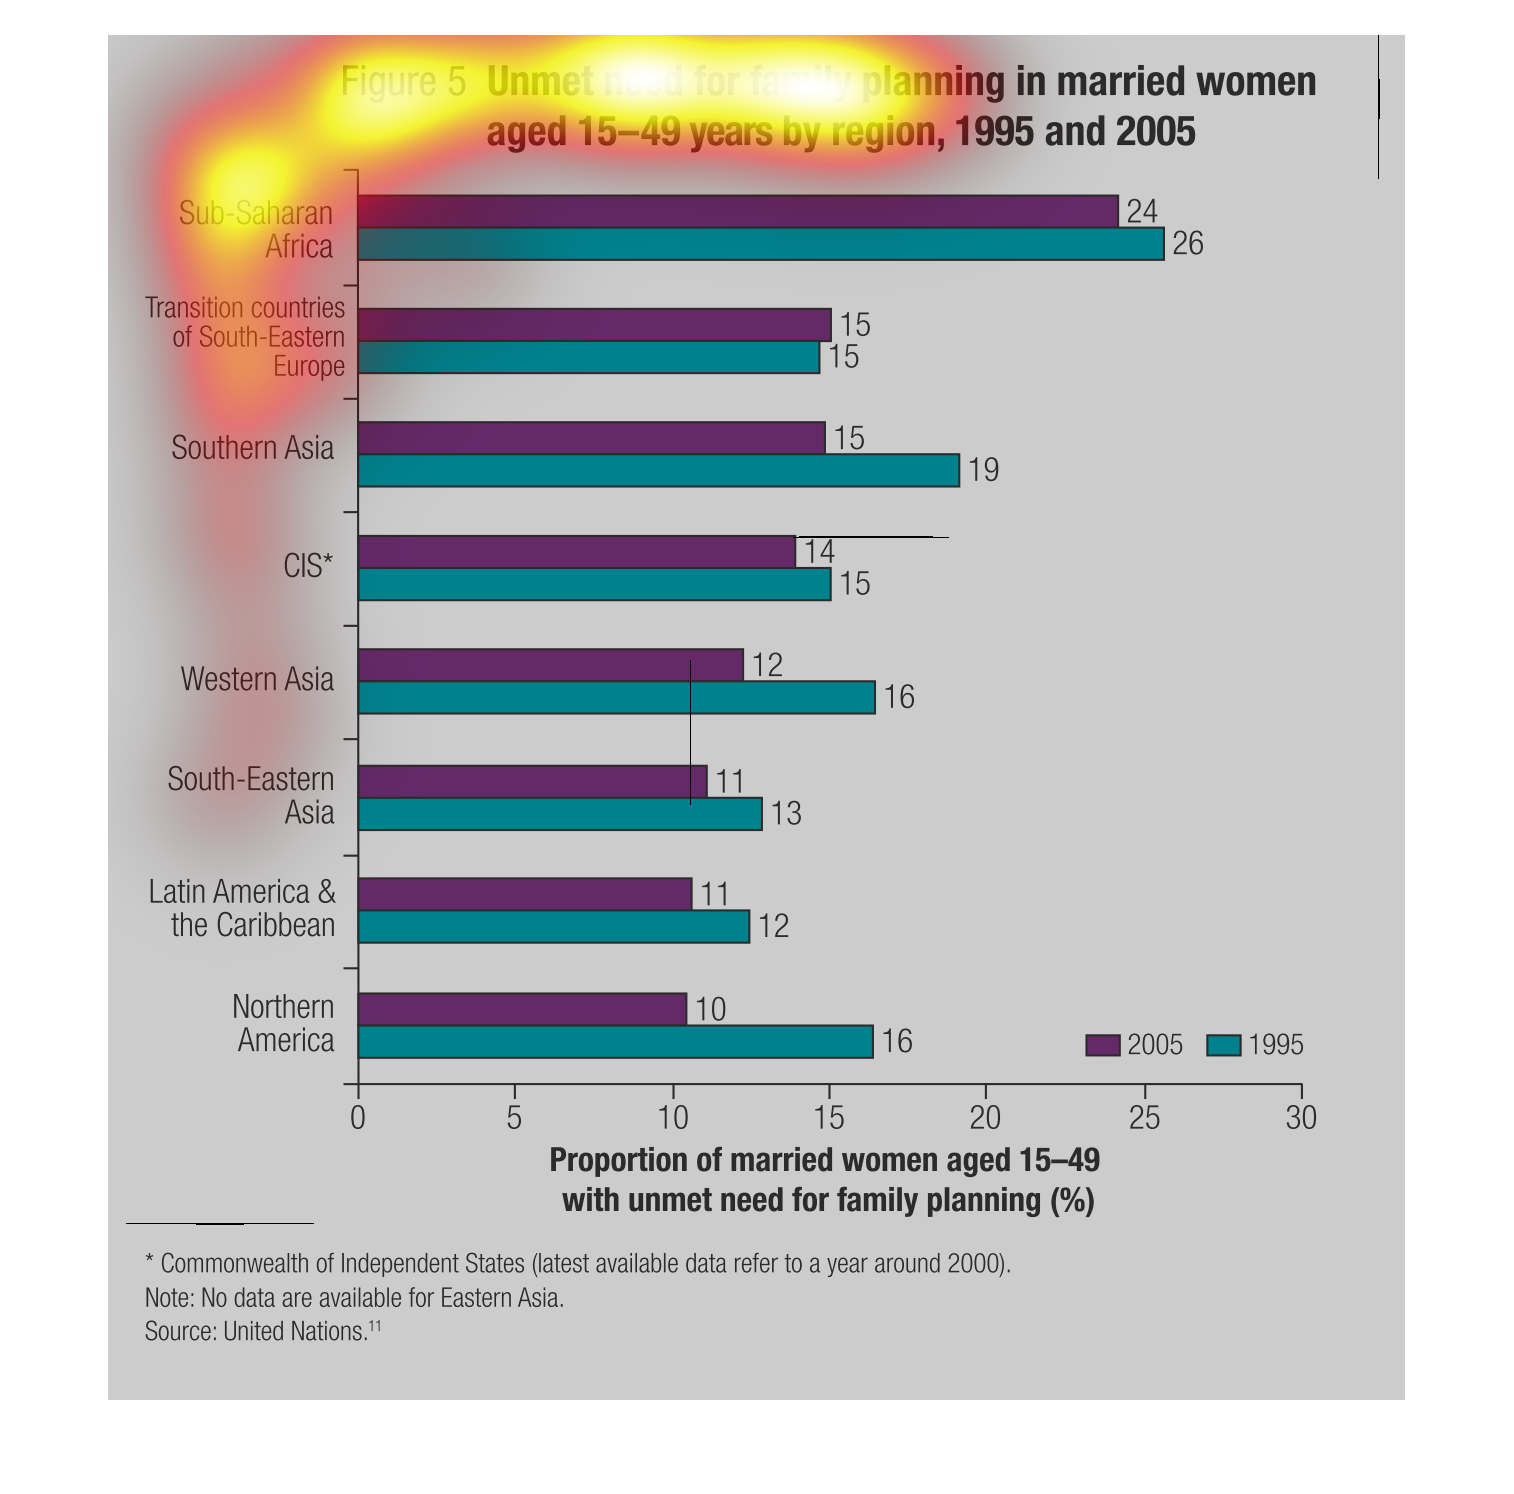
This graph depicts the progression in the still unmet needs for family planning in 2005 vs.
1995.  A key point is that the needs of family planning really haven't progressed to being
met.  Sub-Saharan Africa has the worst situation.
The image on the left hand side is a column chart helping to identify the change women have
found in unmet need for family planning.  From the data collected by different region one
can point out that, this need by women has slowly declined from the first collection of data
in 1995 to the later 2005 data collected.
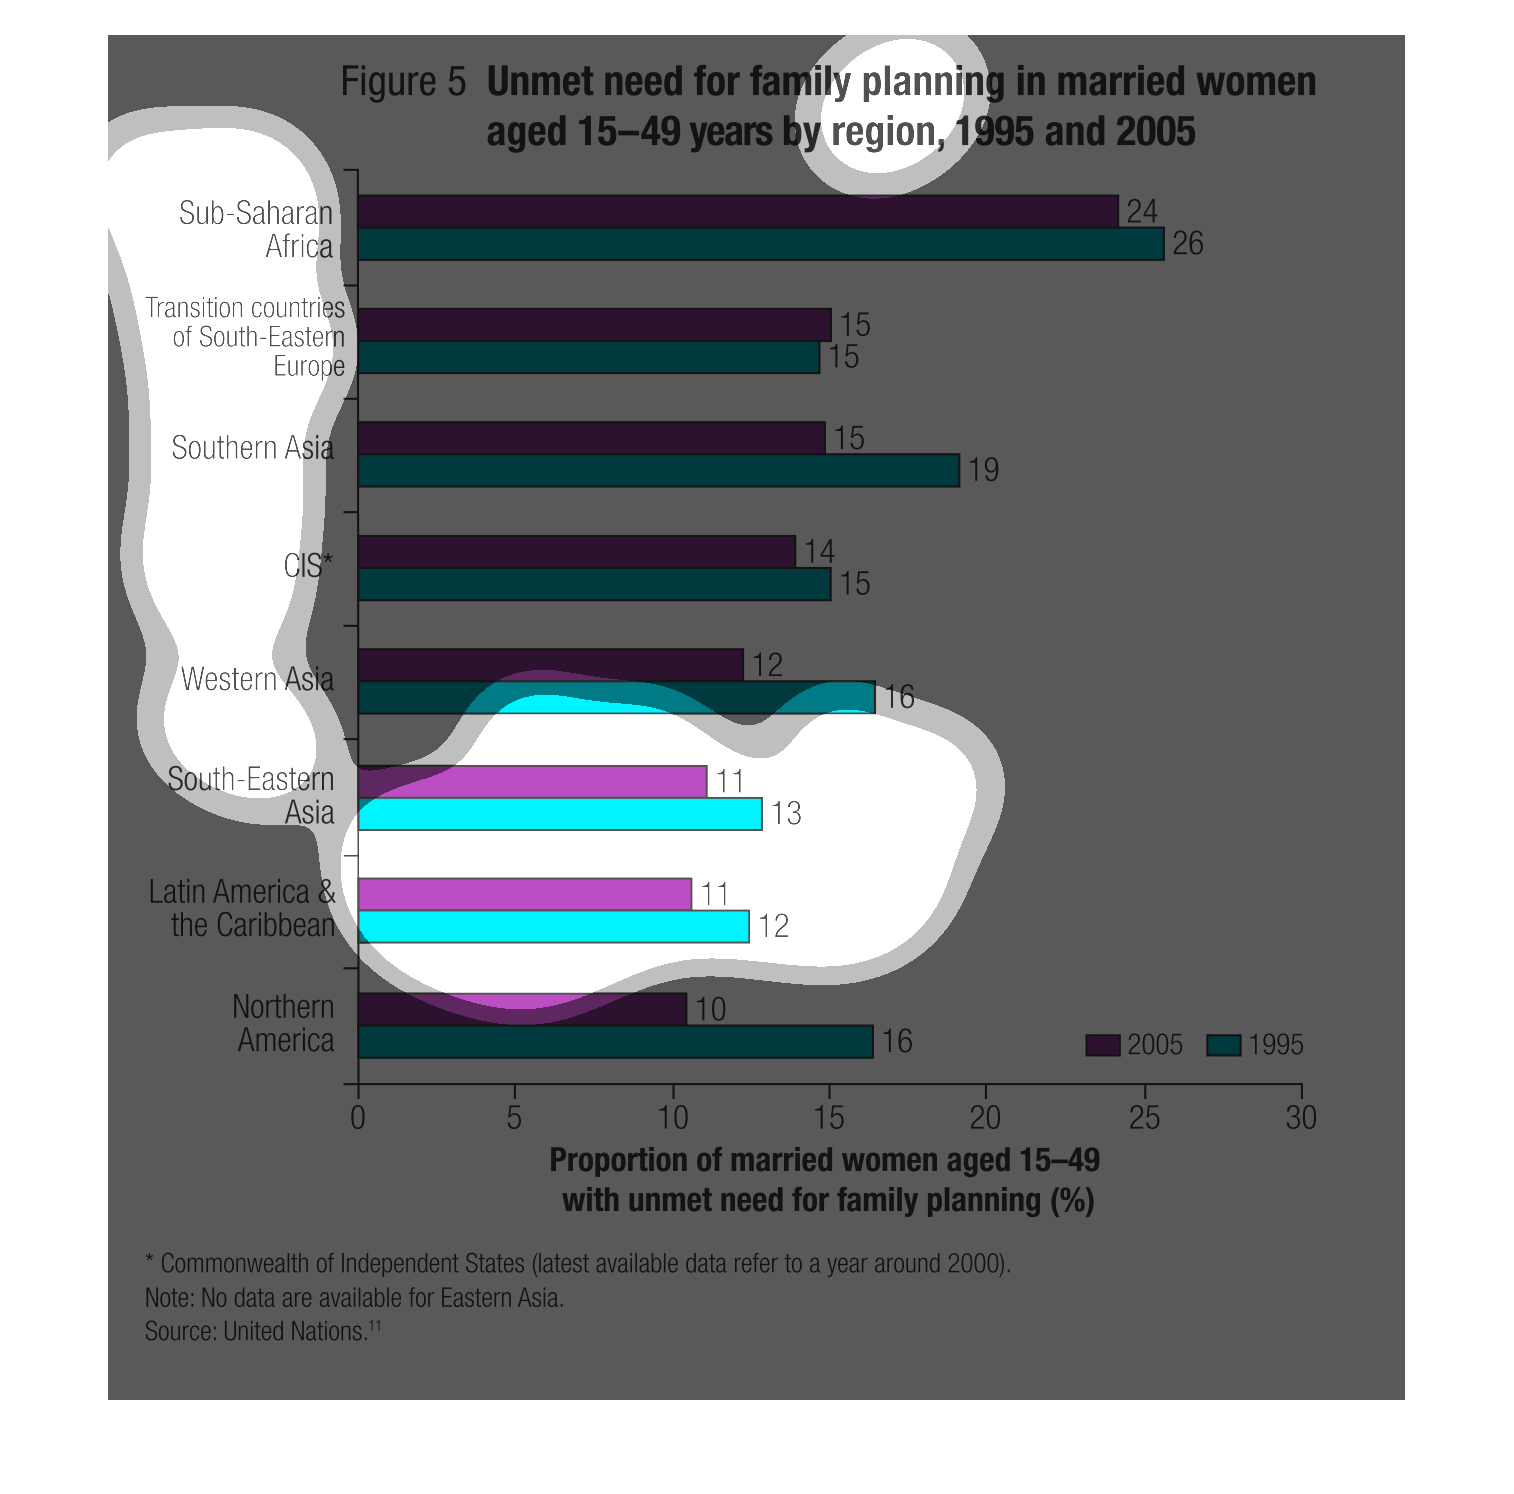
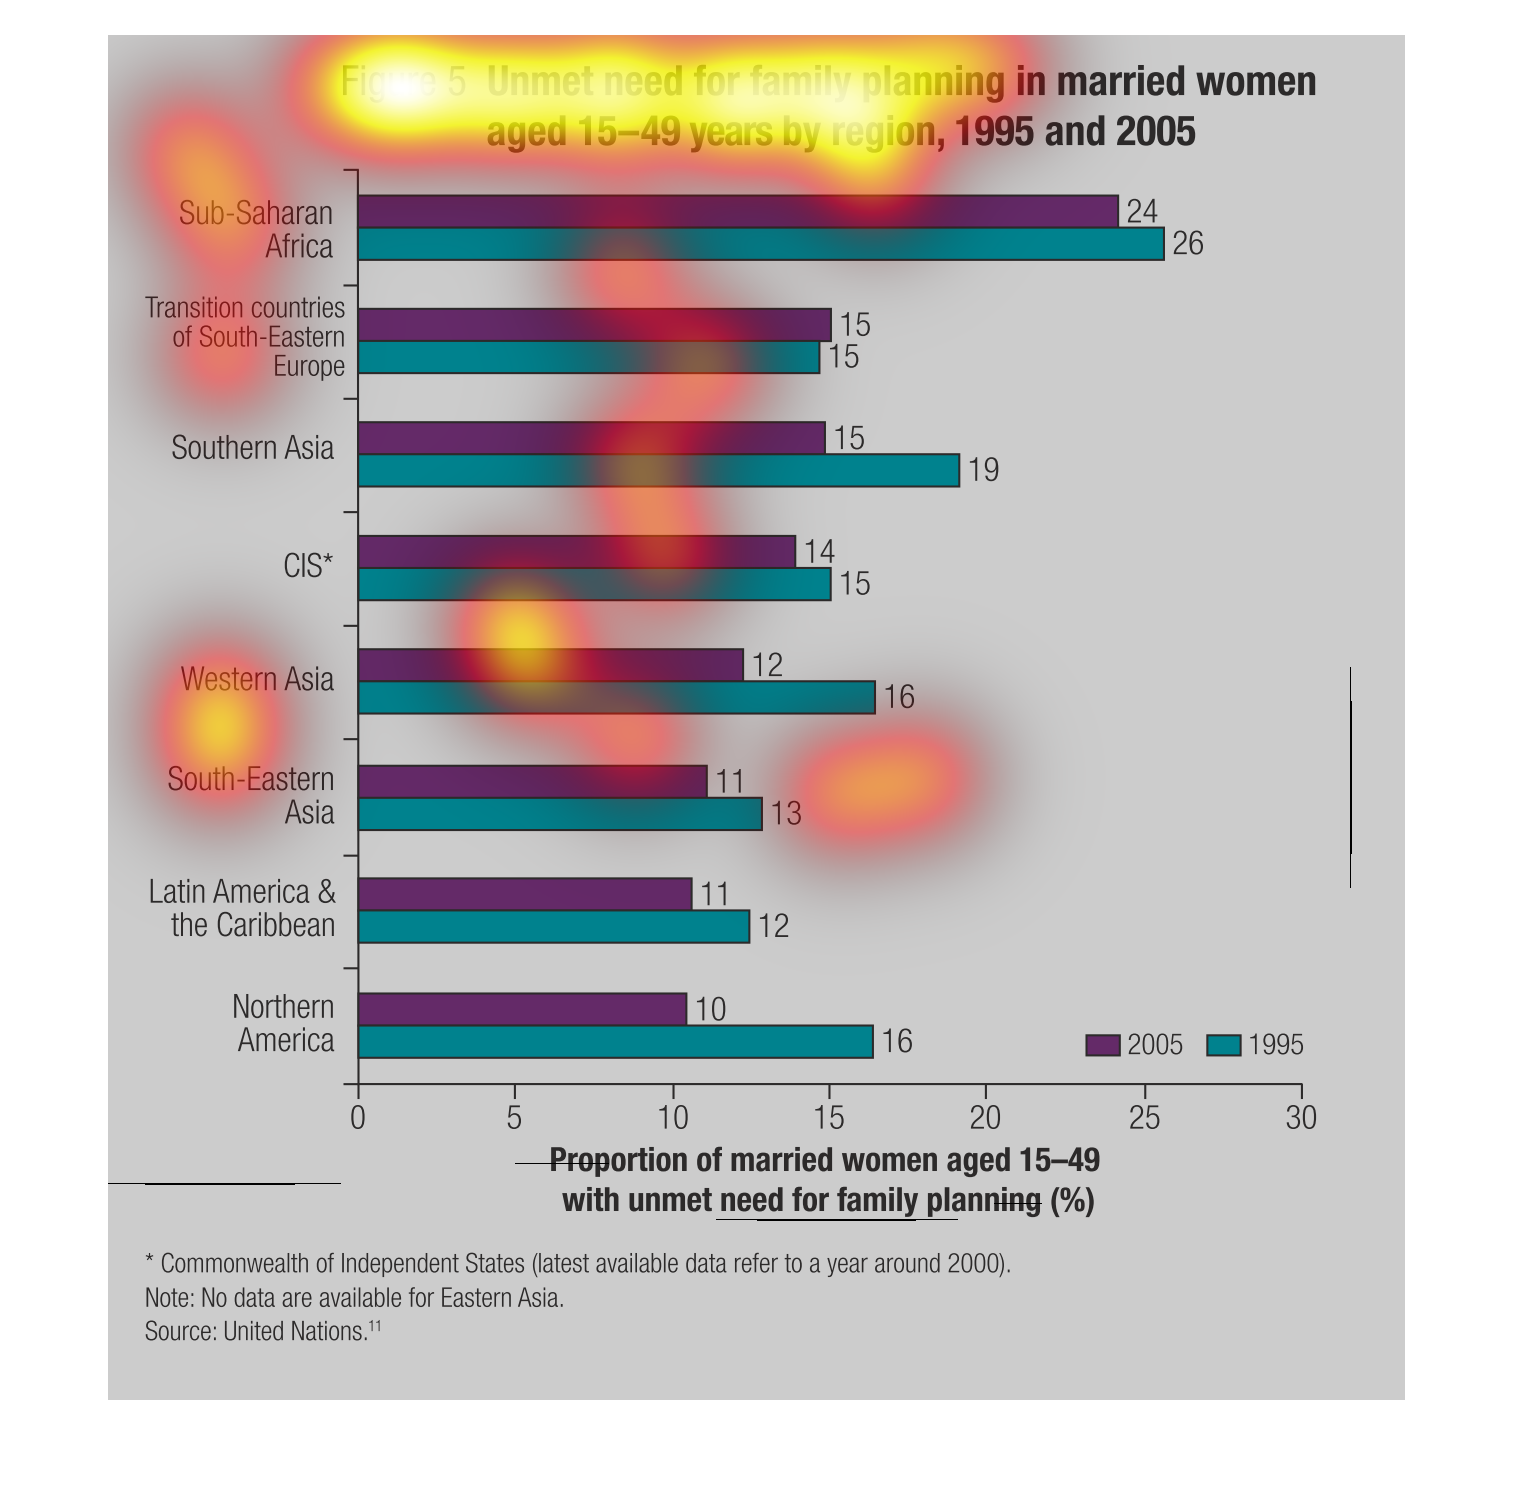
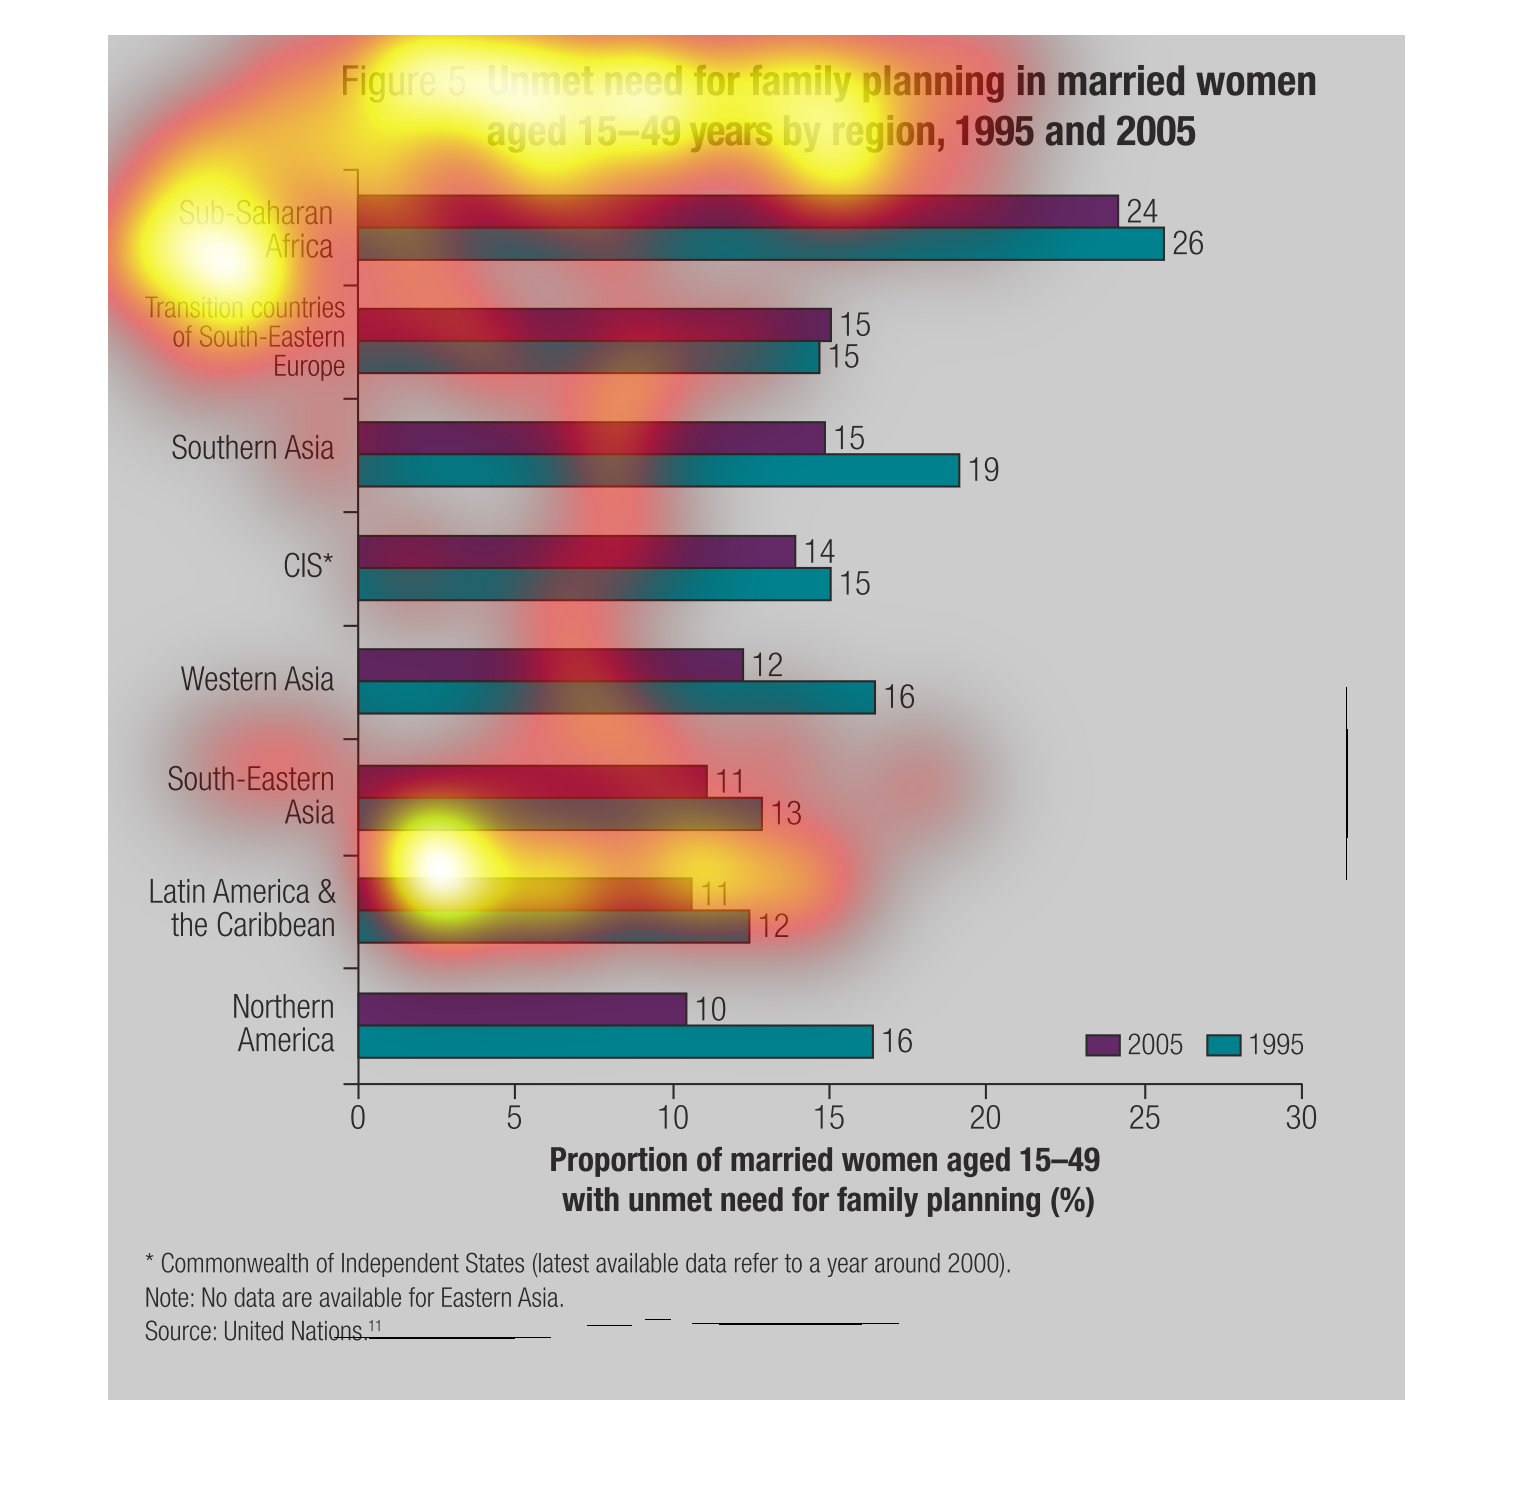
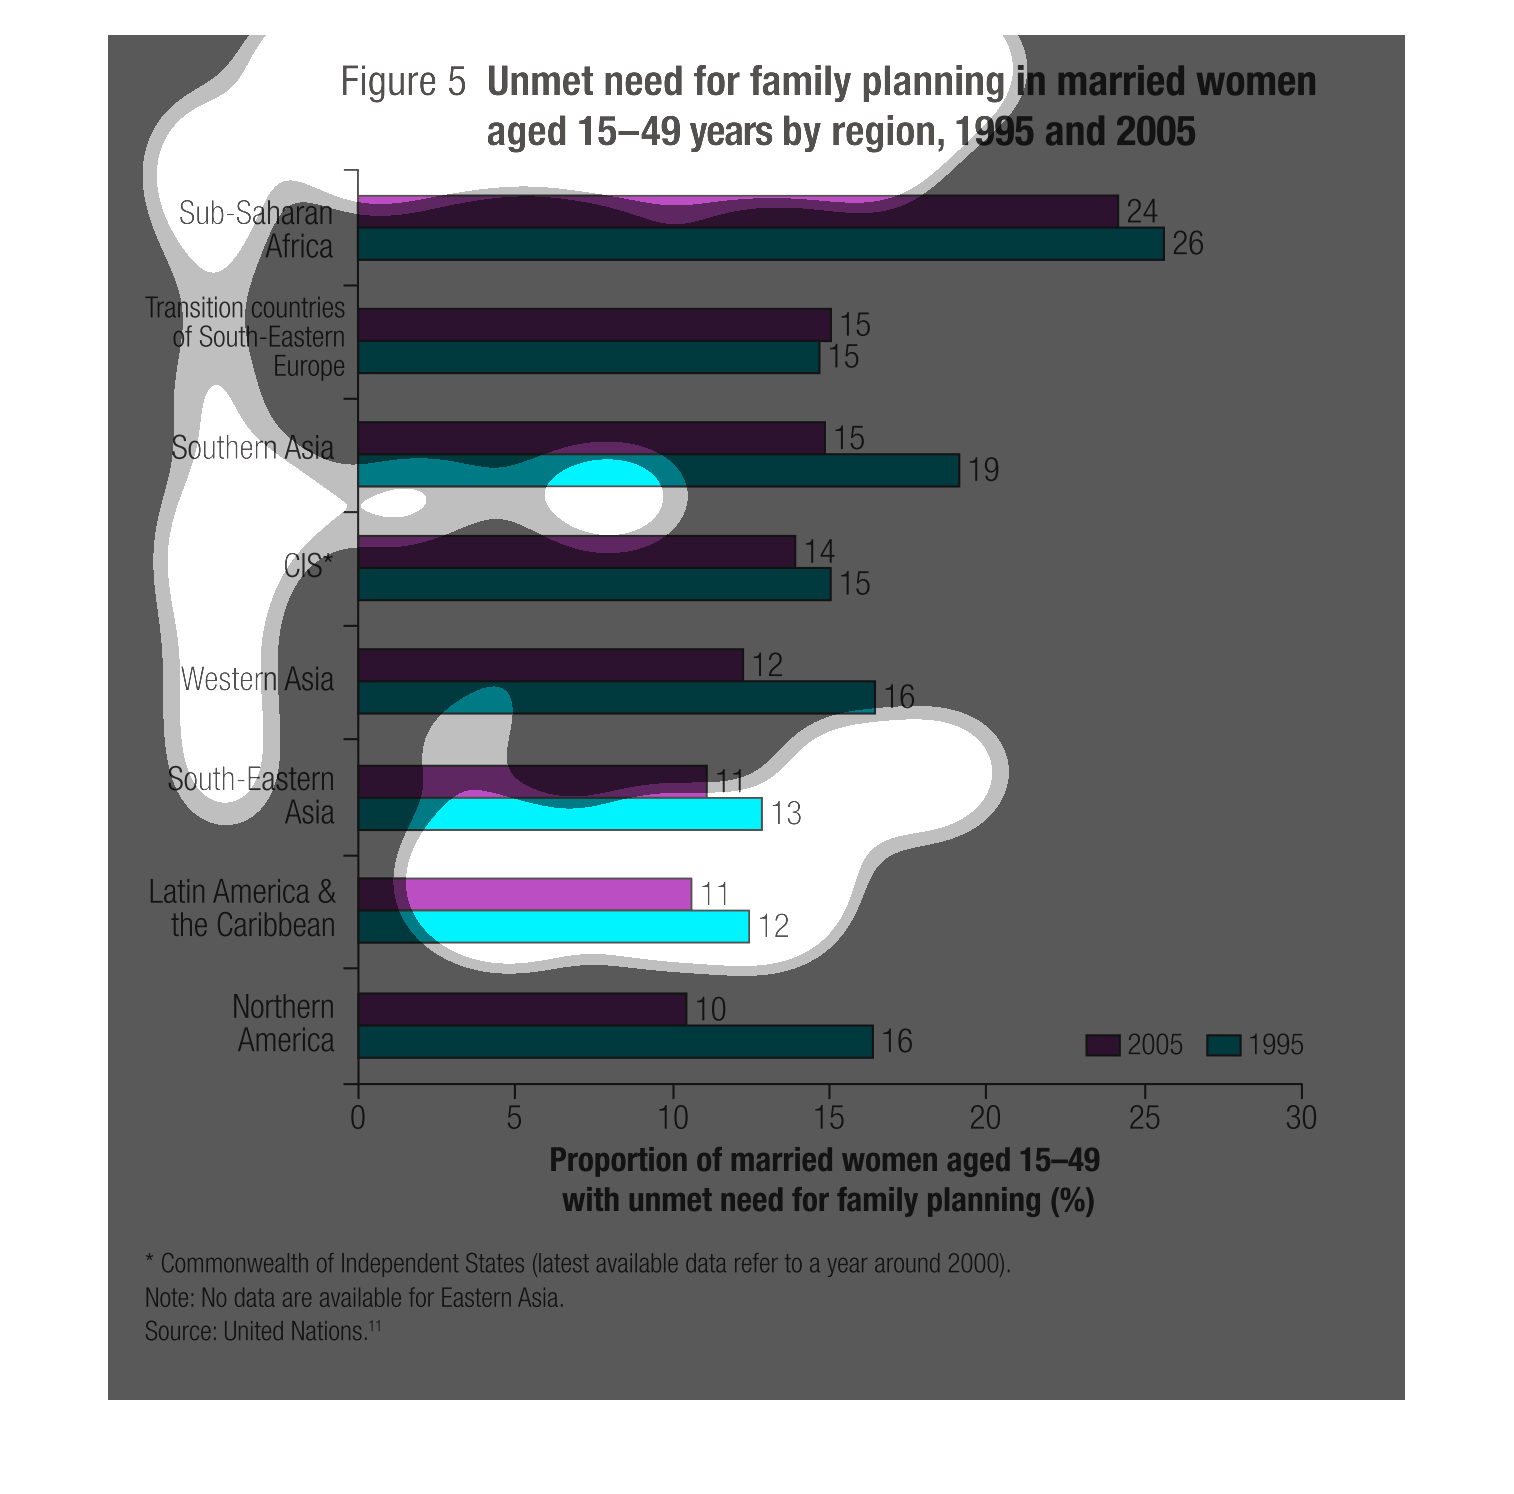
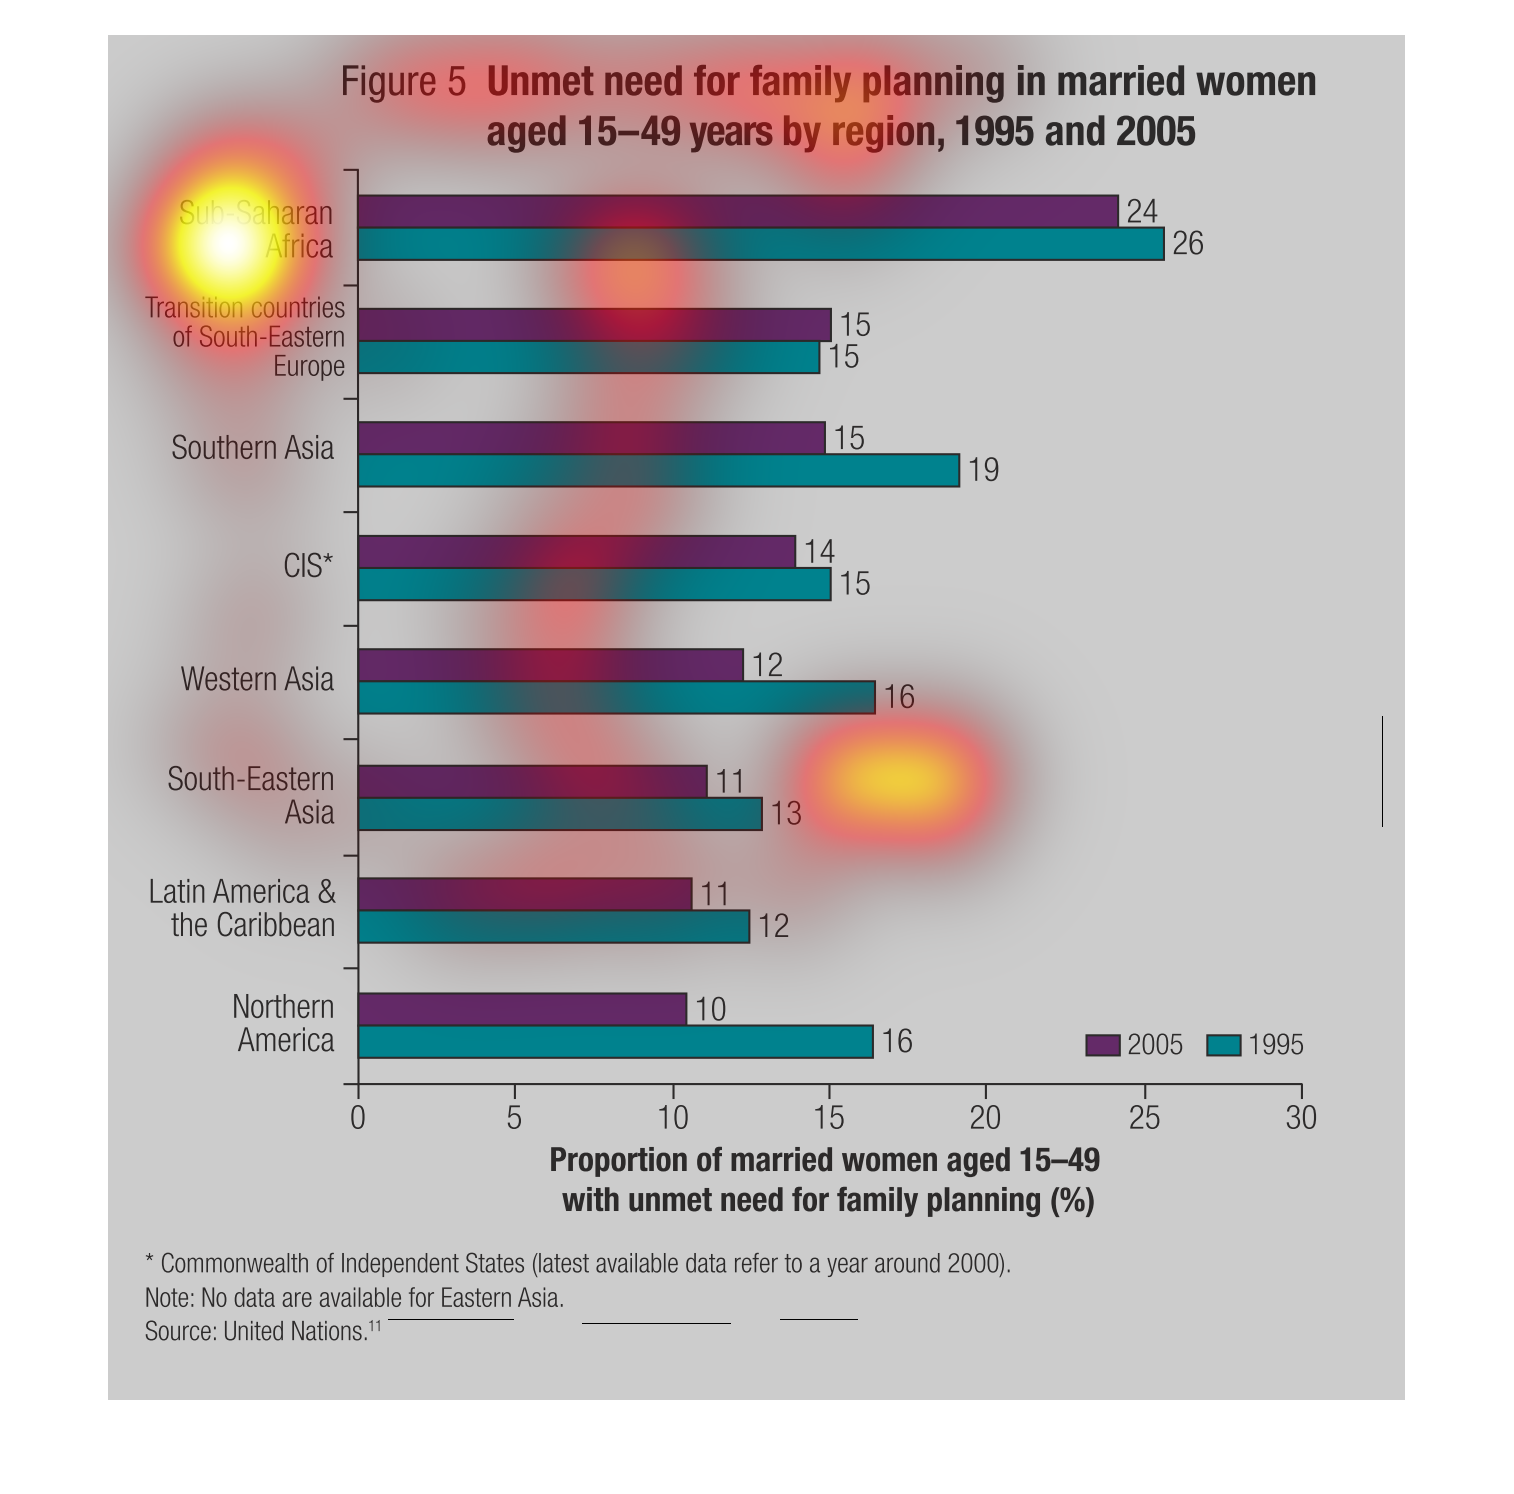
This chart shows the change in percentage of married women 15-49 with an unmet need of access
to family planning between 1995 and 2005. There has been an average change of just a 2 or
3 percentage points with Northern American having the greatest success with a change of 6
percentage points.
The graph shows the unmet needs for women around the world and by region who are aged 15-49
in terms of family planning and compares 1995 to 2000 in a horizontal bar graph format
This is showing the unmet need for family planning in married women between the years 1995
and 2005. All of the different major continents are listed and info for both year is shown.
The most need for family planning is in sub-saharan Africa.
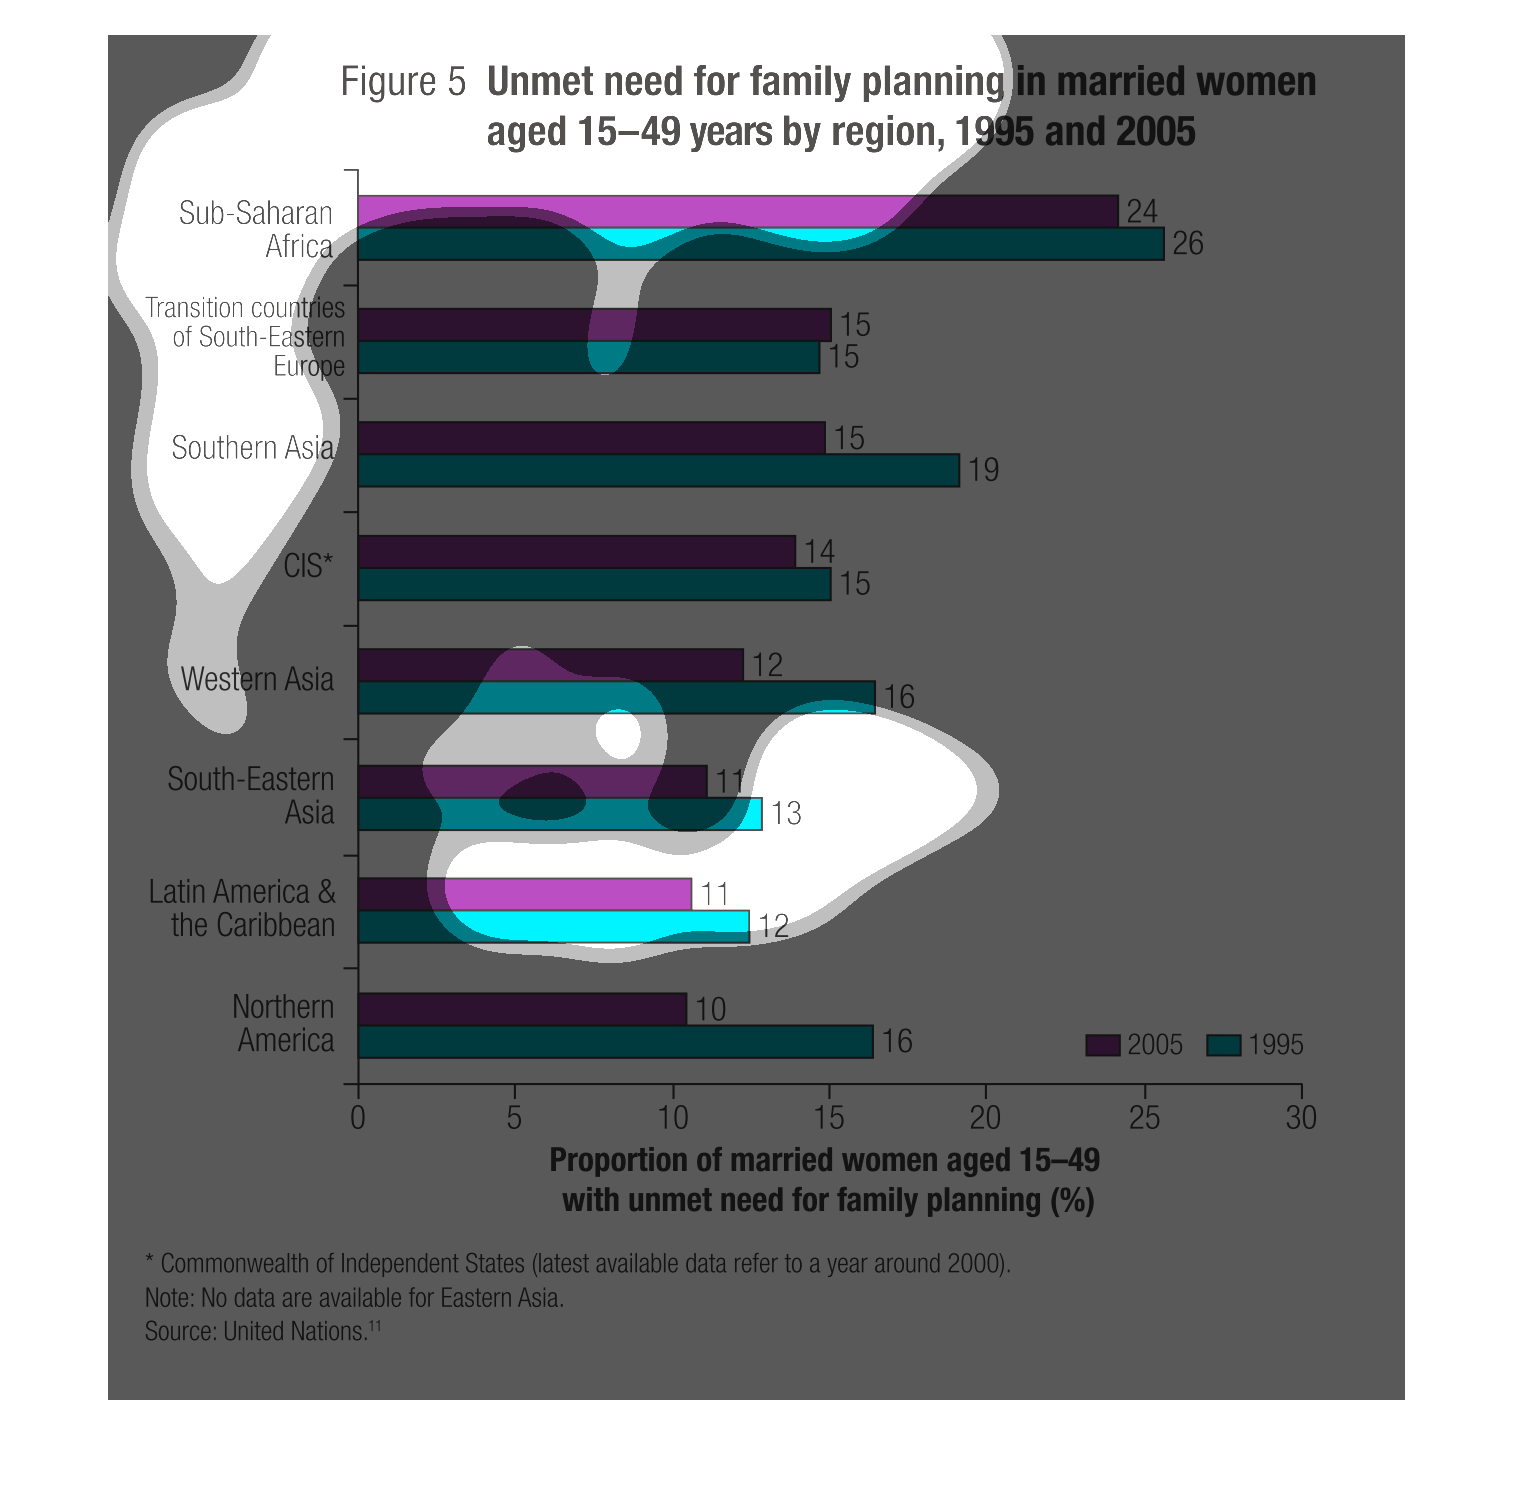
This graph illustrates the unmet needs for family planning in married women aged 15 to 49
years in 1995 and 2005.  Sub-Saharan Africa has the highest rates of mortality.
The graph illustrates the incidence of unmet need for family planning options to women ages
15 to 49, as a comparison over a ten year period (1995 and then 2005.) North America ranked
the lowest while  SubSaharan Africa ranked highest.
This chart describes and depicts the unmet needs for family planning in married women age
fifteen to age forty-nine by region from the year 1995 to the year 2005.
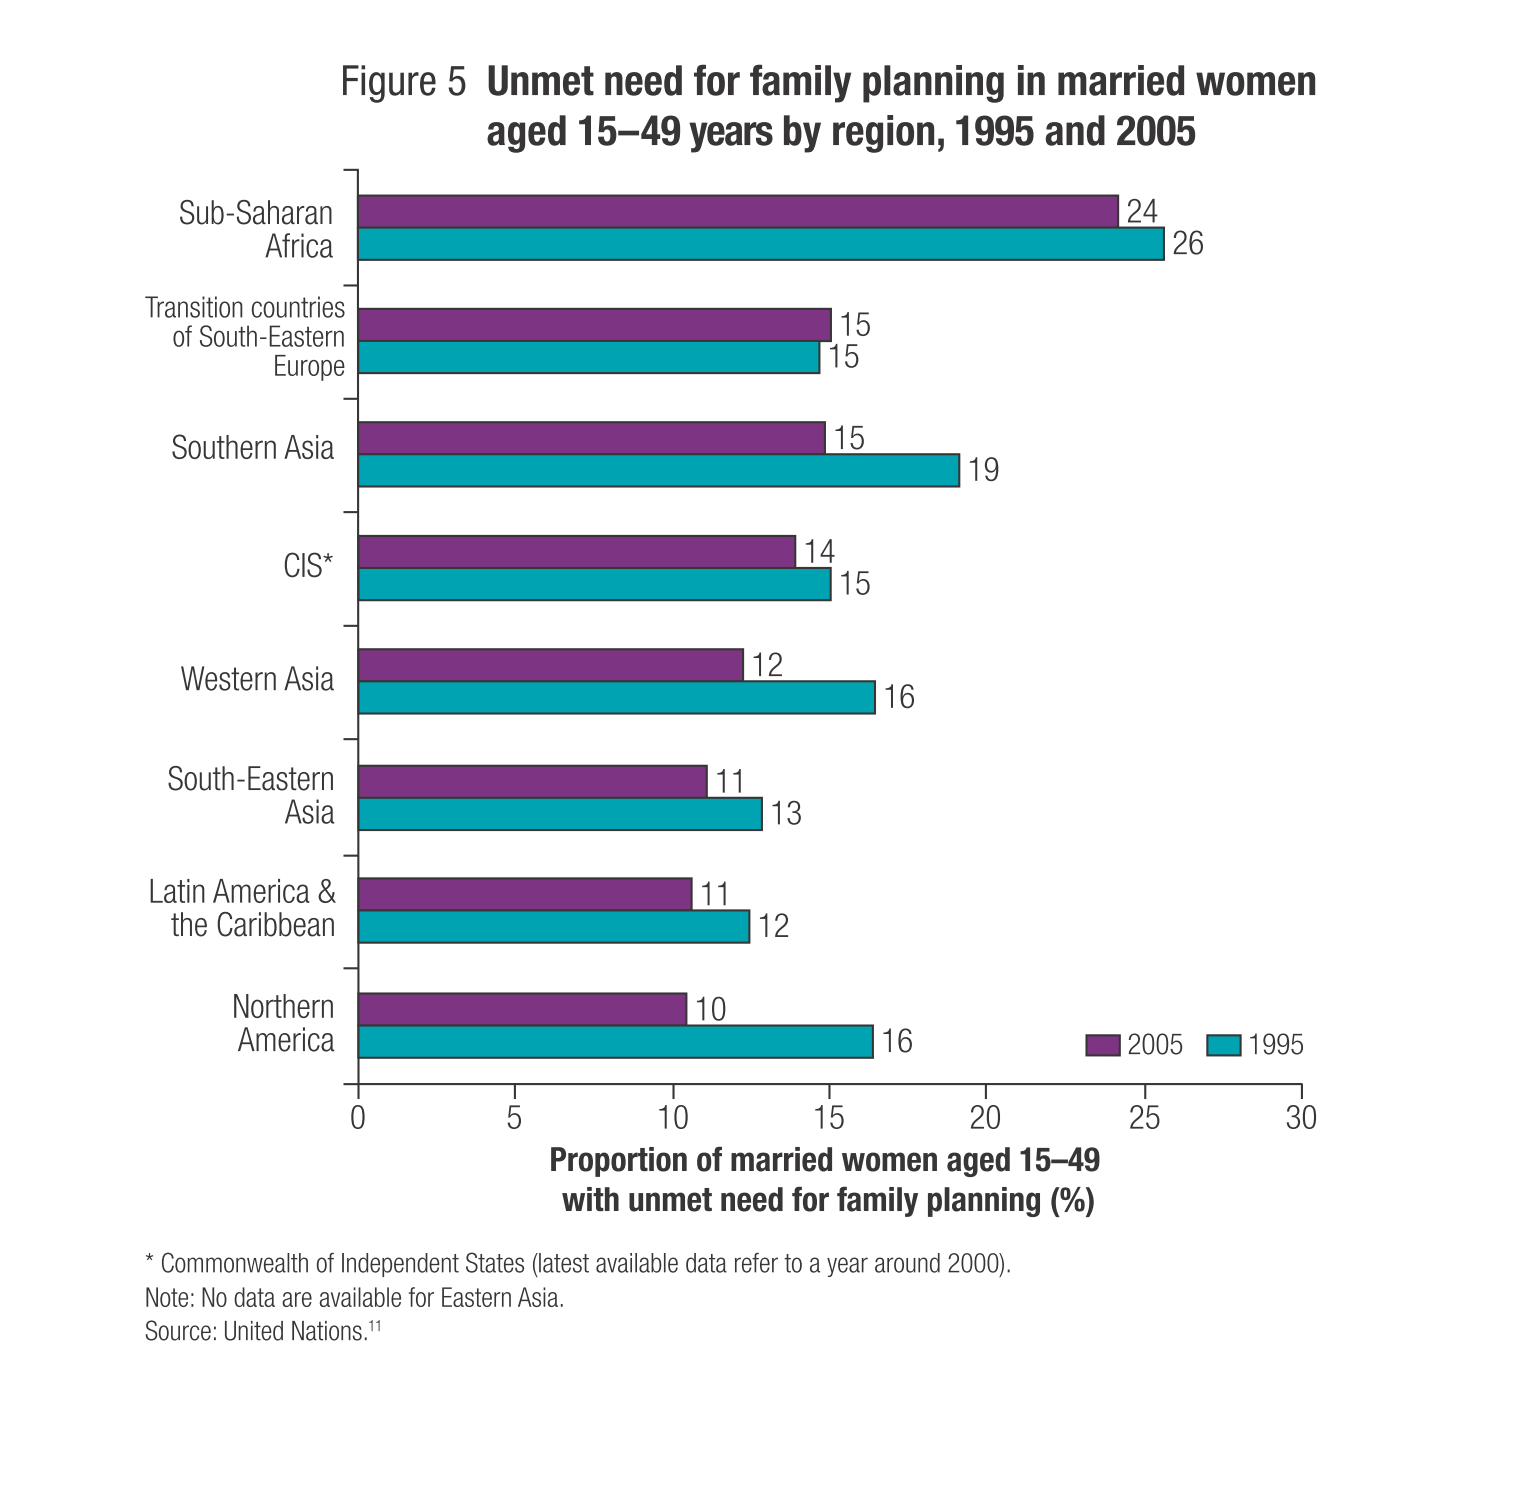
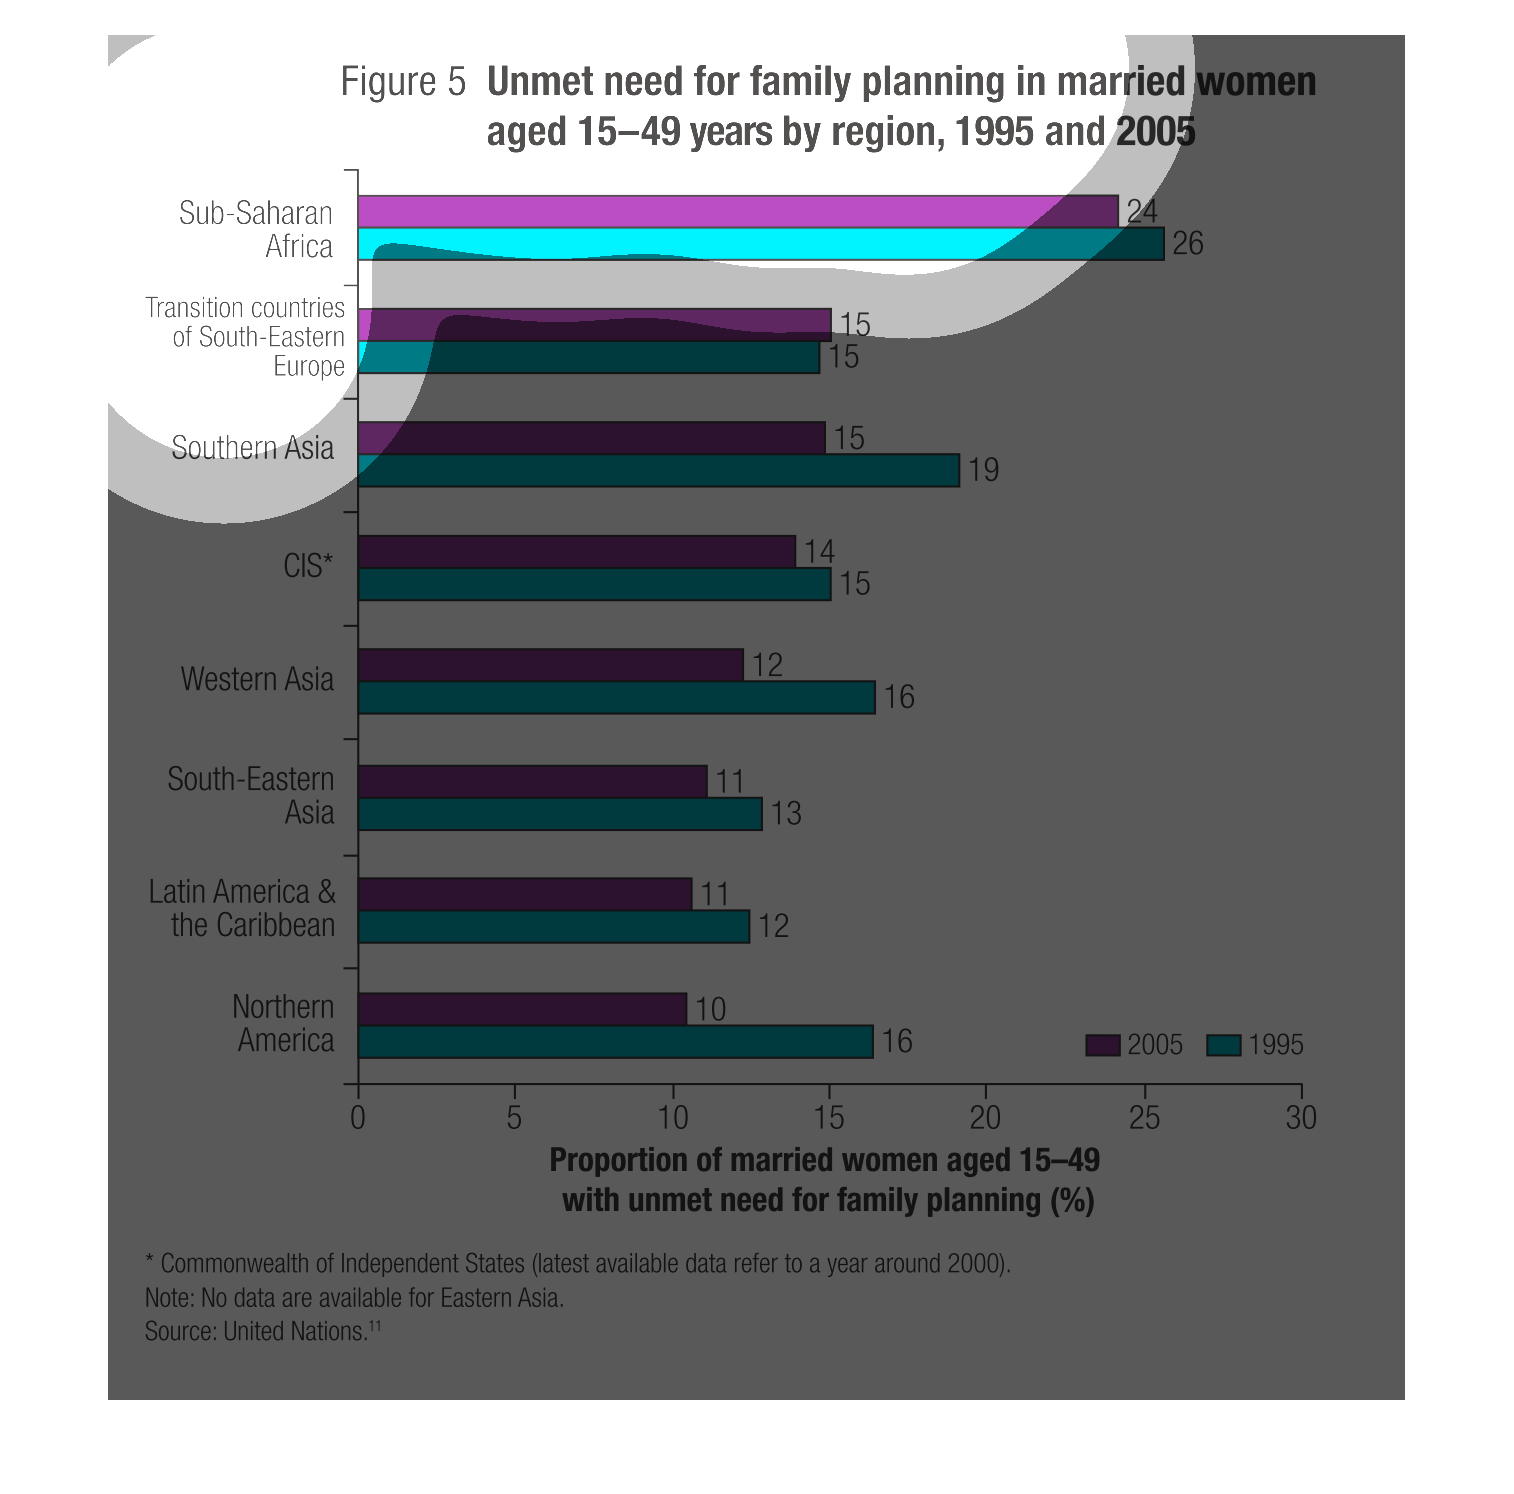
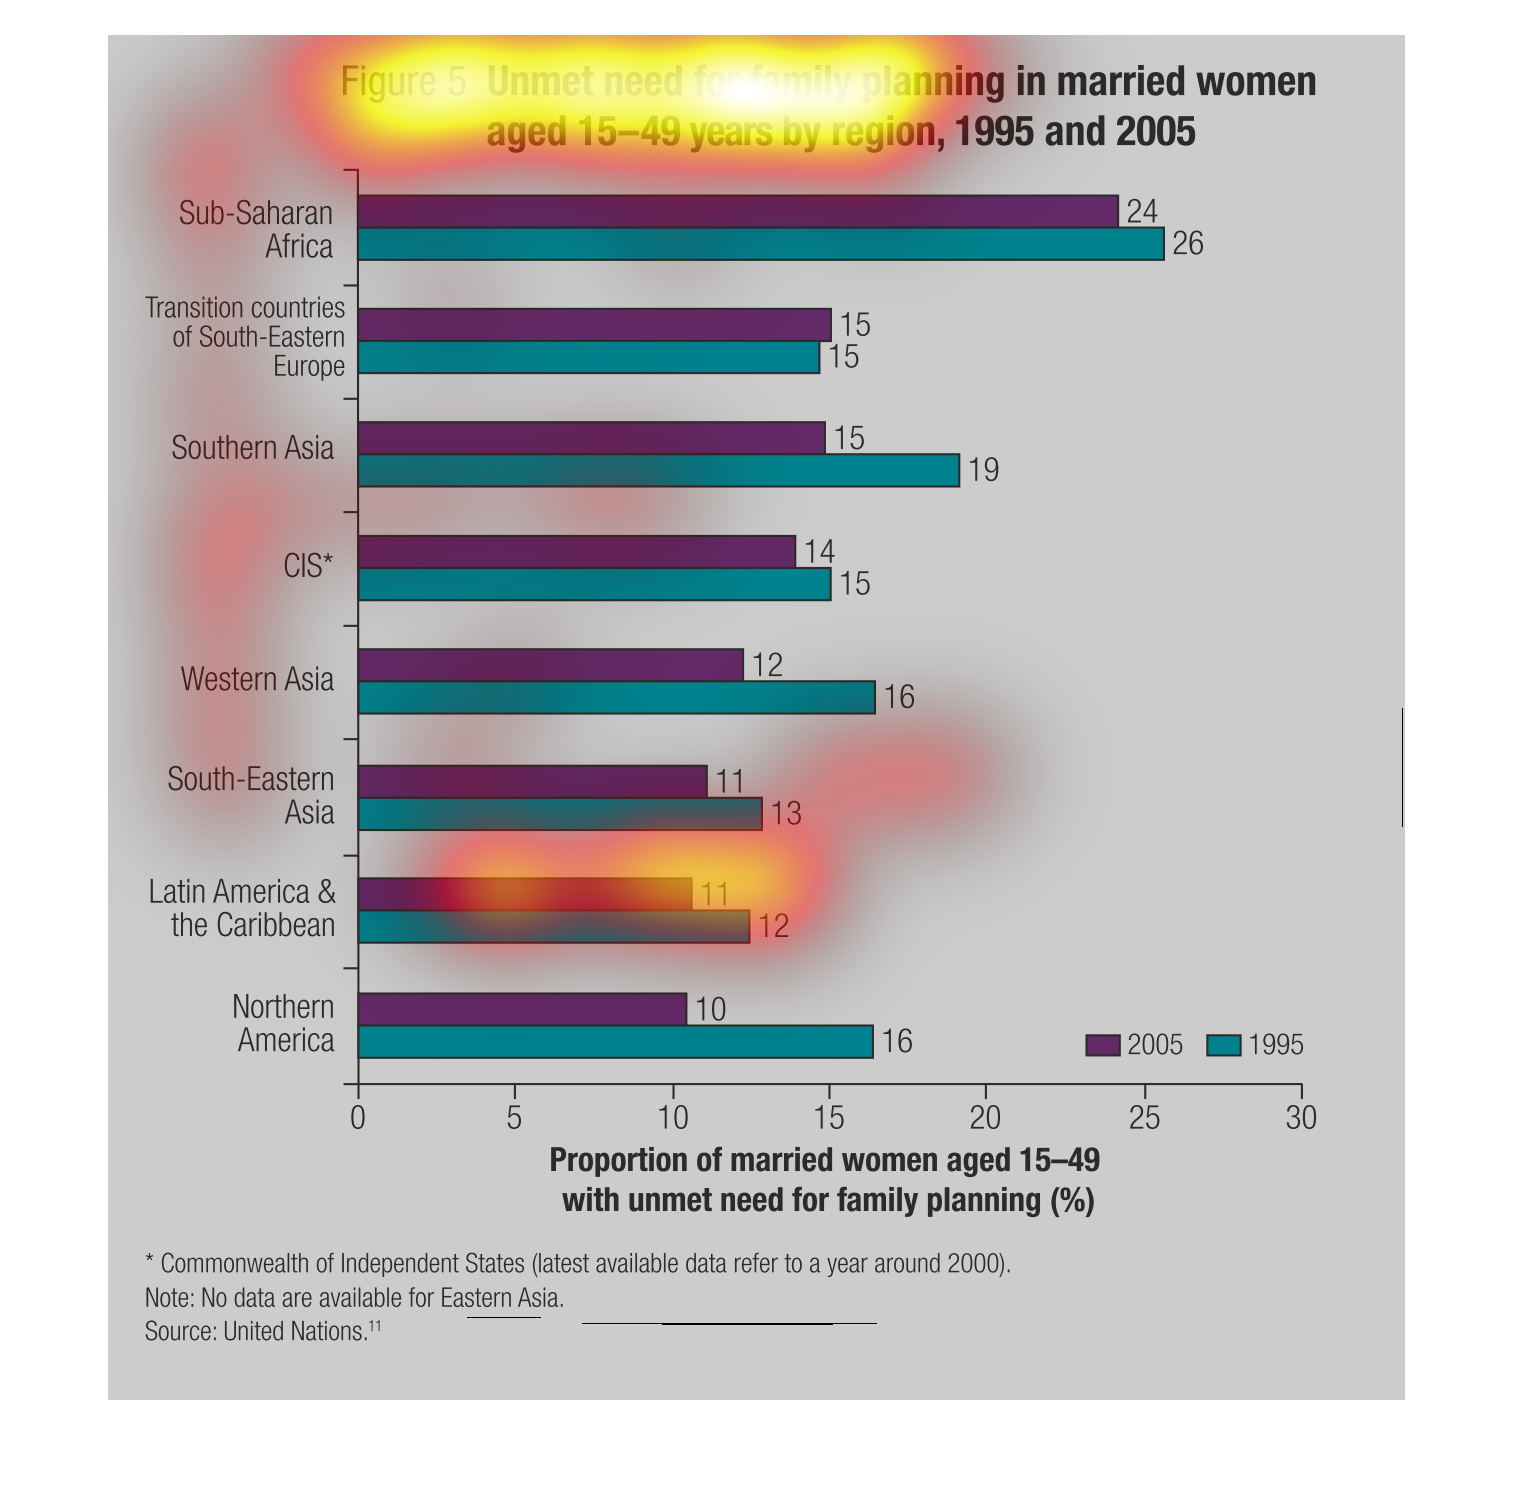
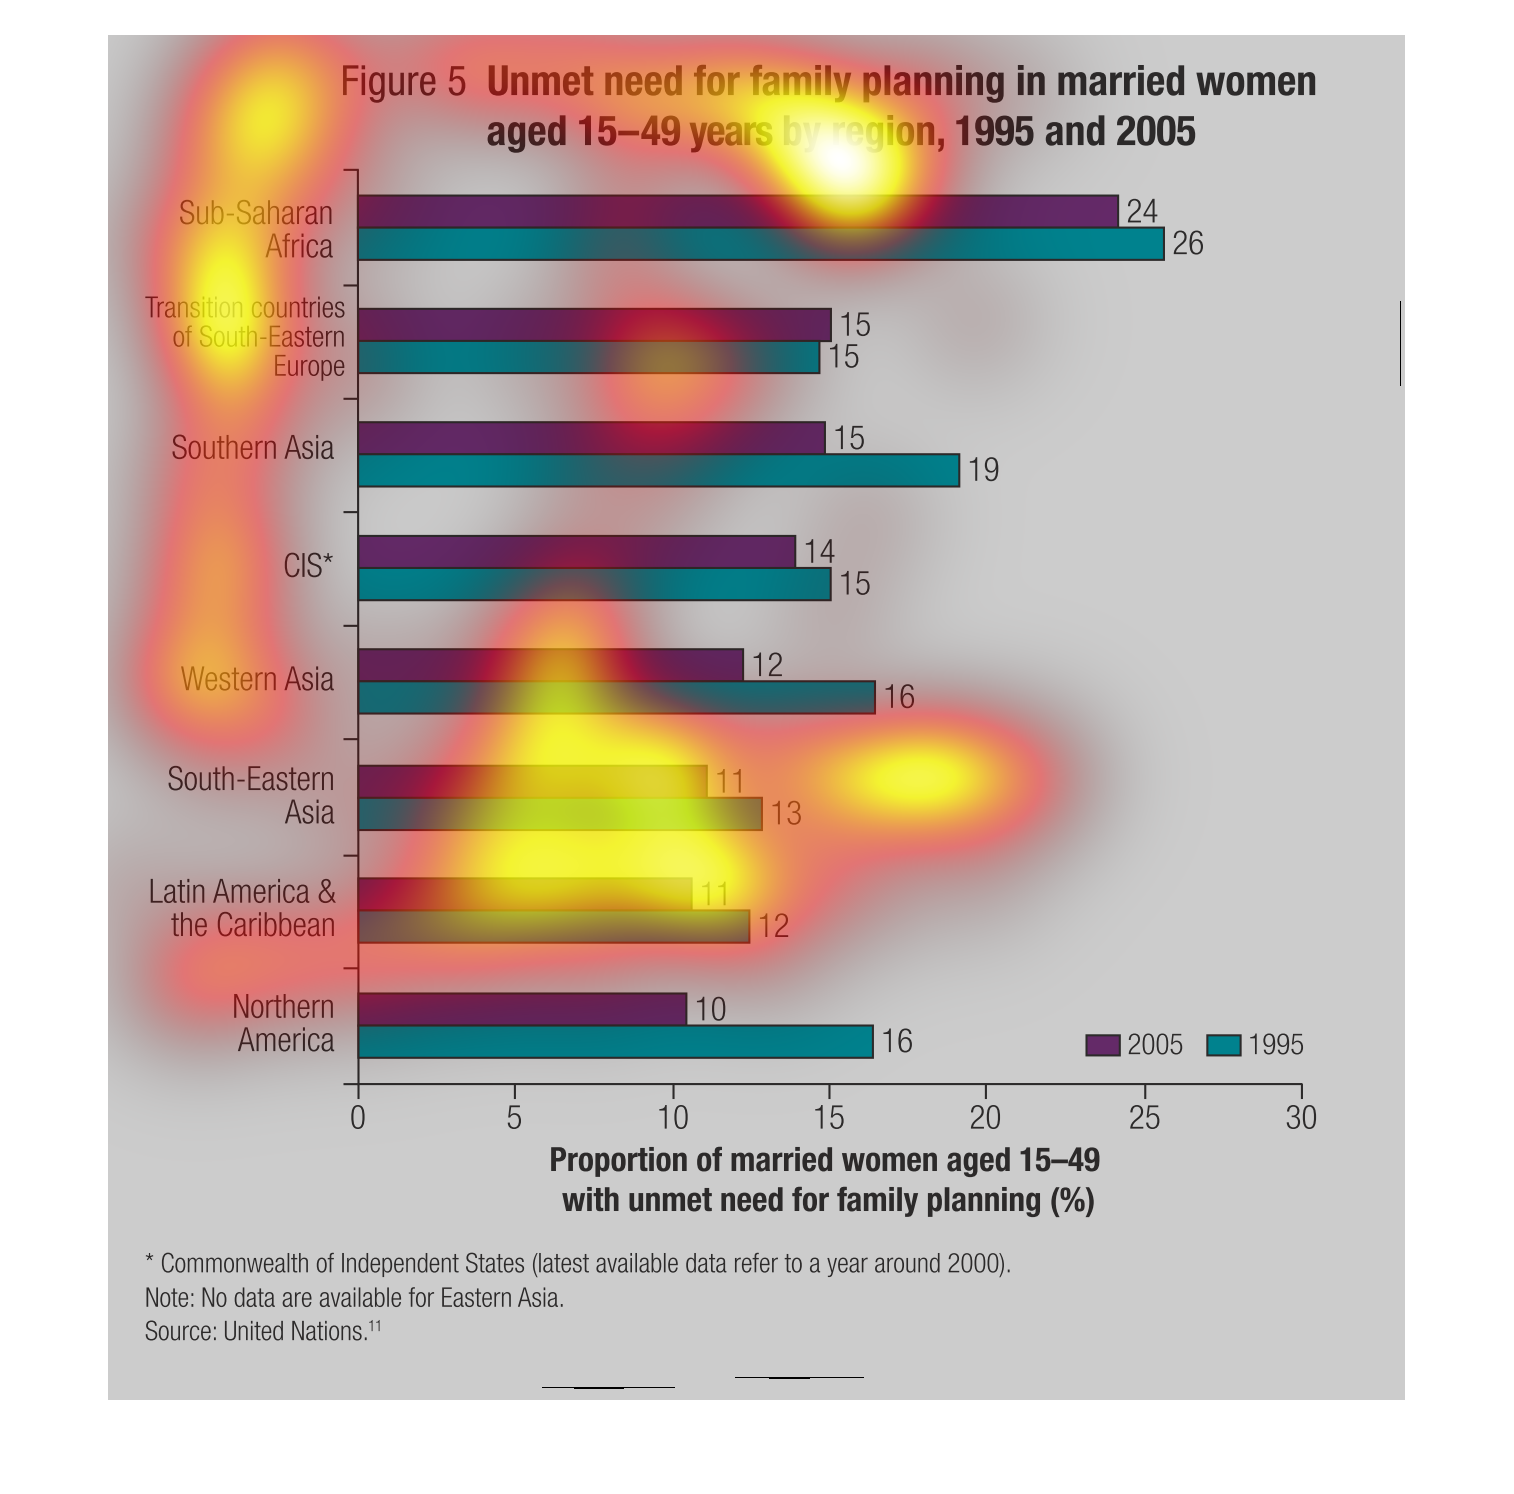
The image depicts the unmet need for family planning in married women aged 15-49 years by
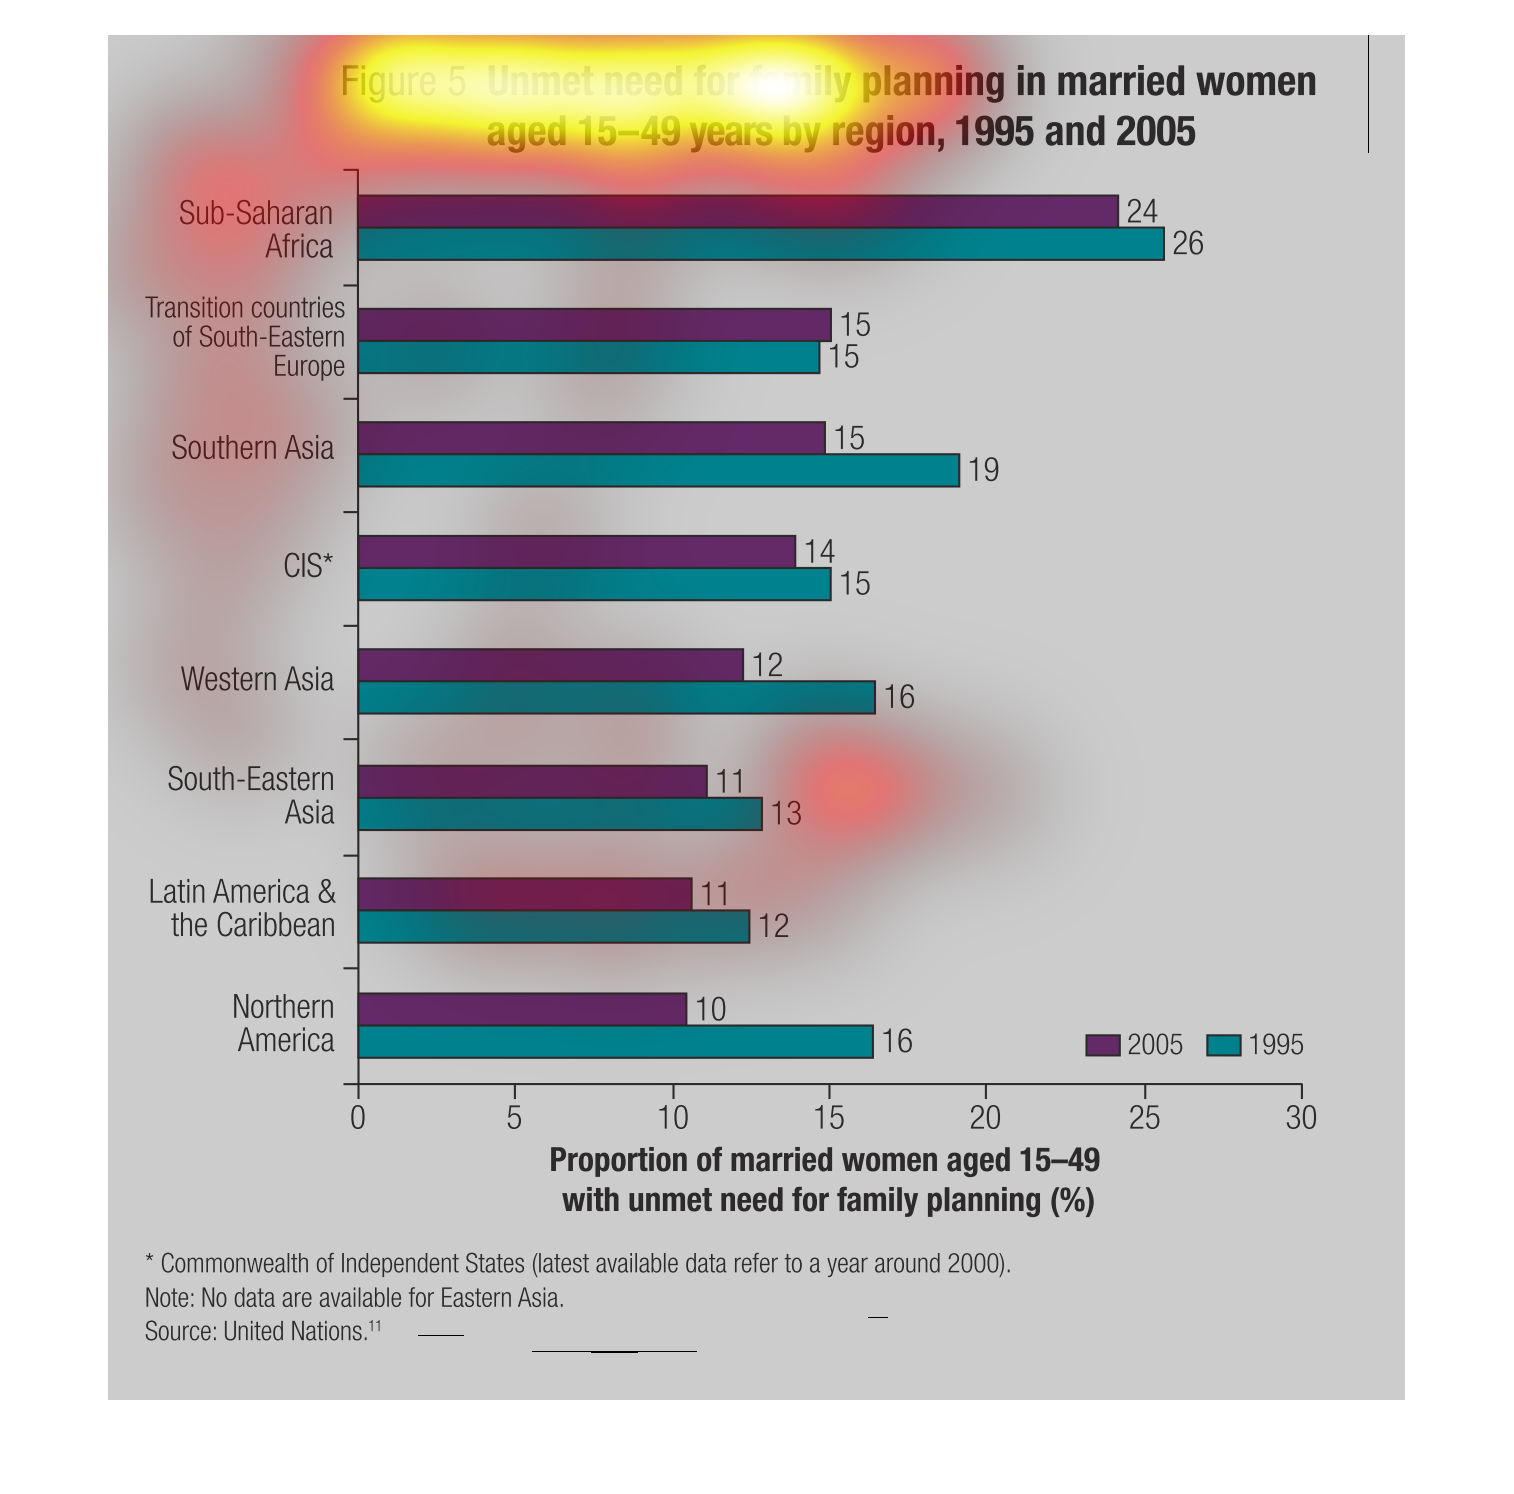
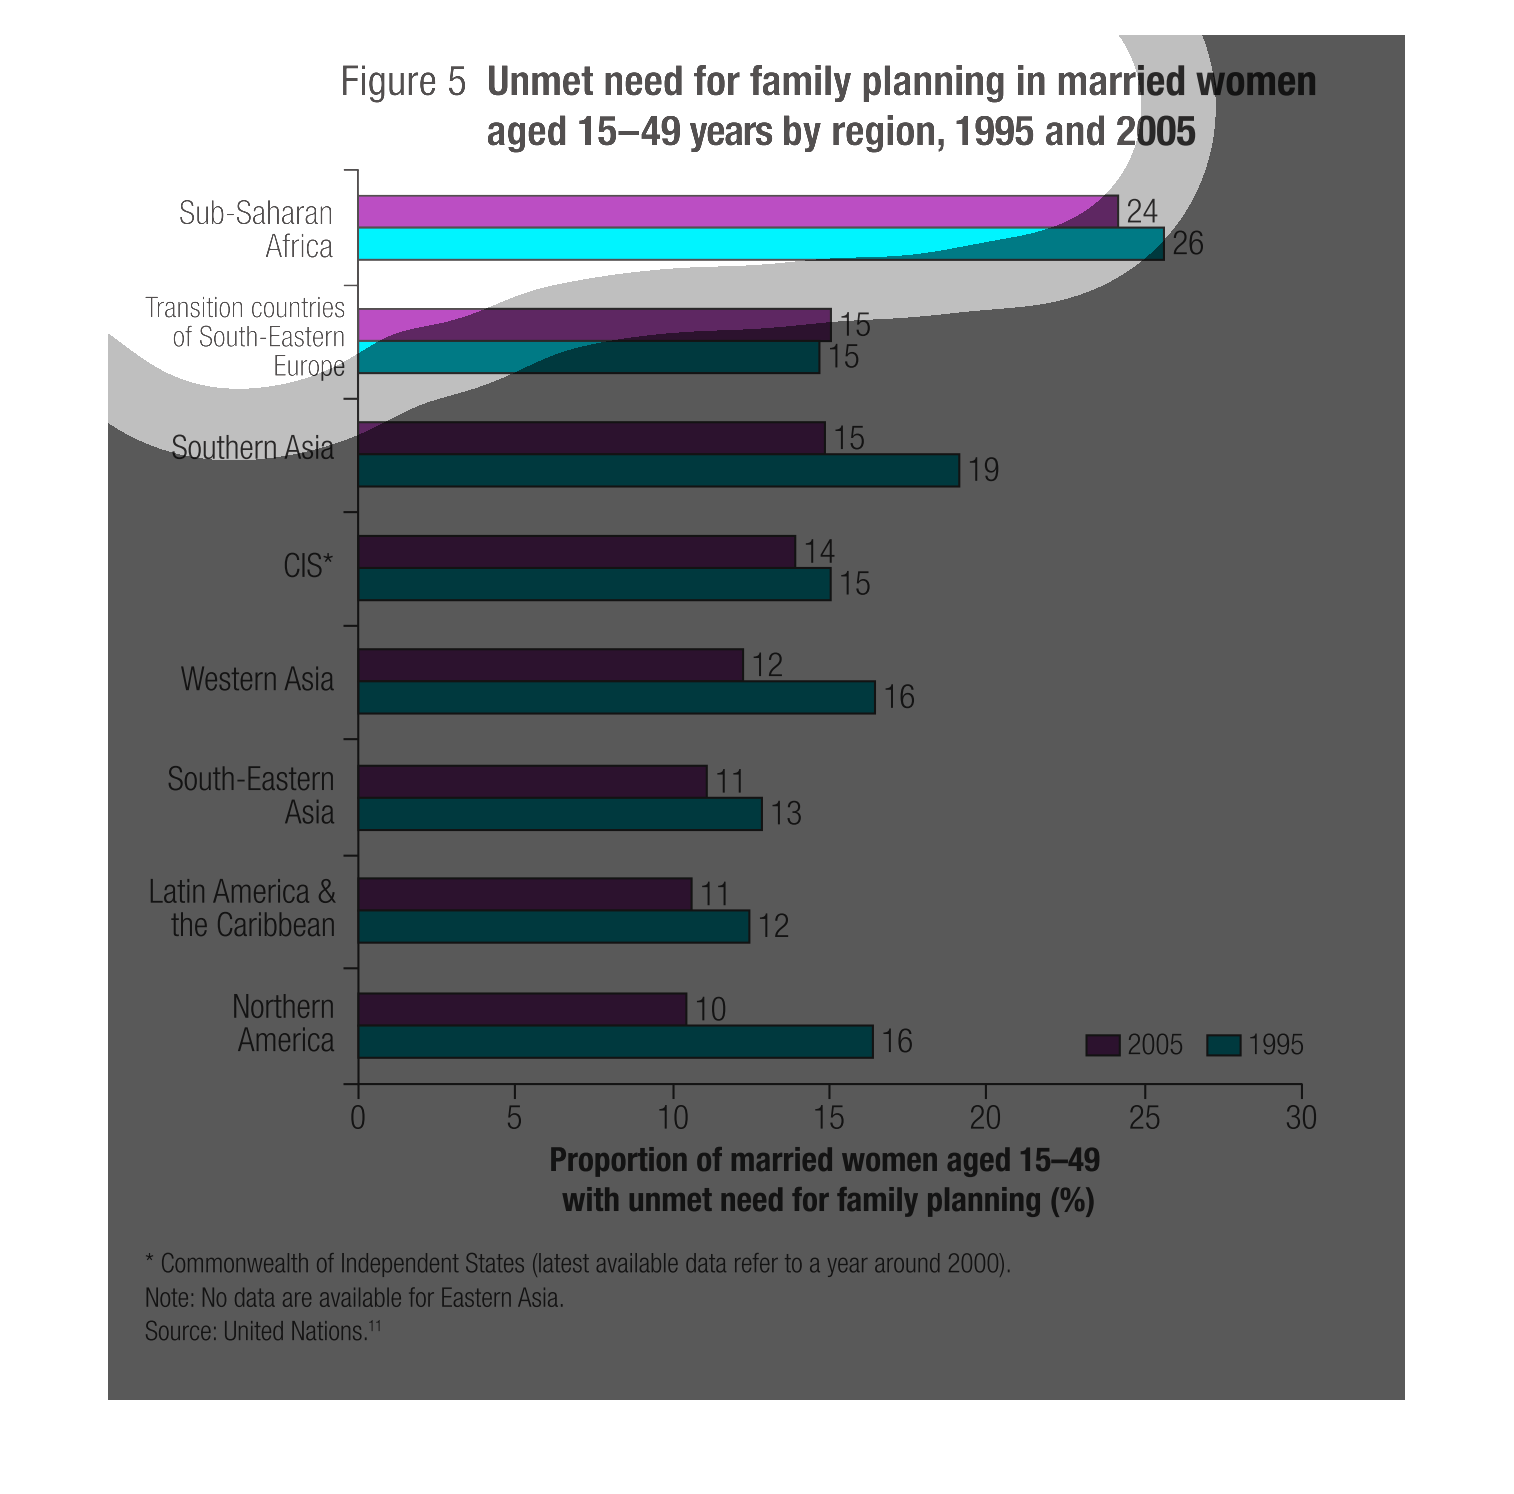
region, comparing the years of 1995 and 2005. The proportion of unmet need by married women
is represented by percentages, with specific regions listed for comparison. The data indicates
that unmet need for family planning has indeed decreased, rather slightly, for all regions
except Transition countries of South-Eastern Europe.
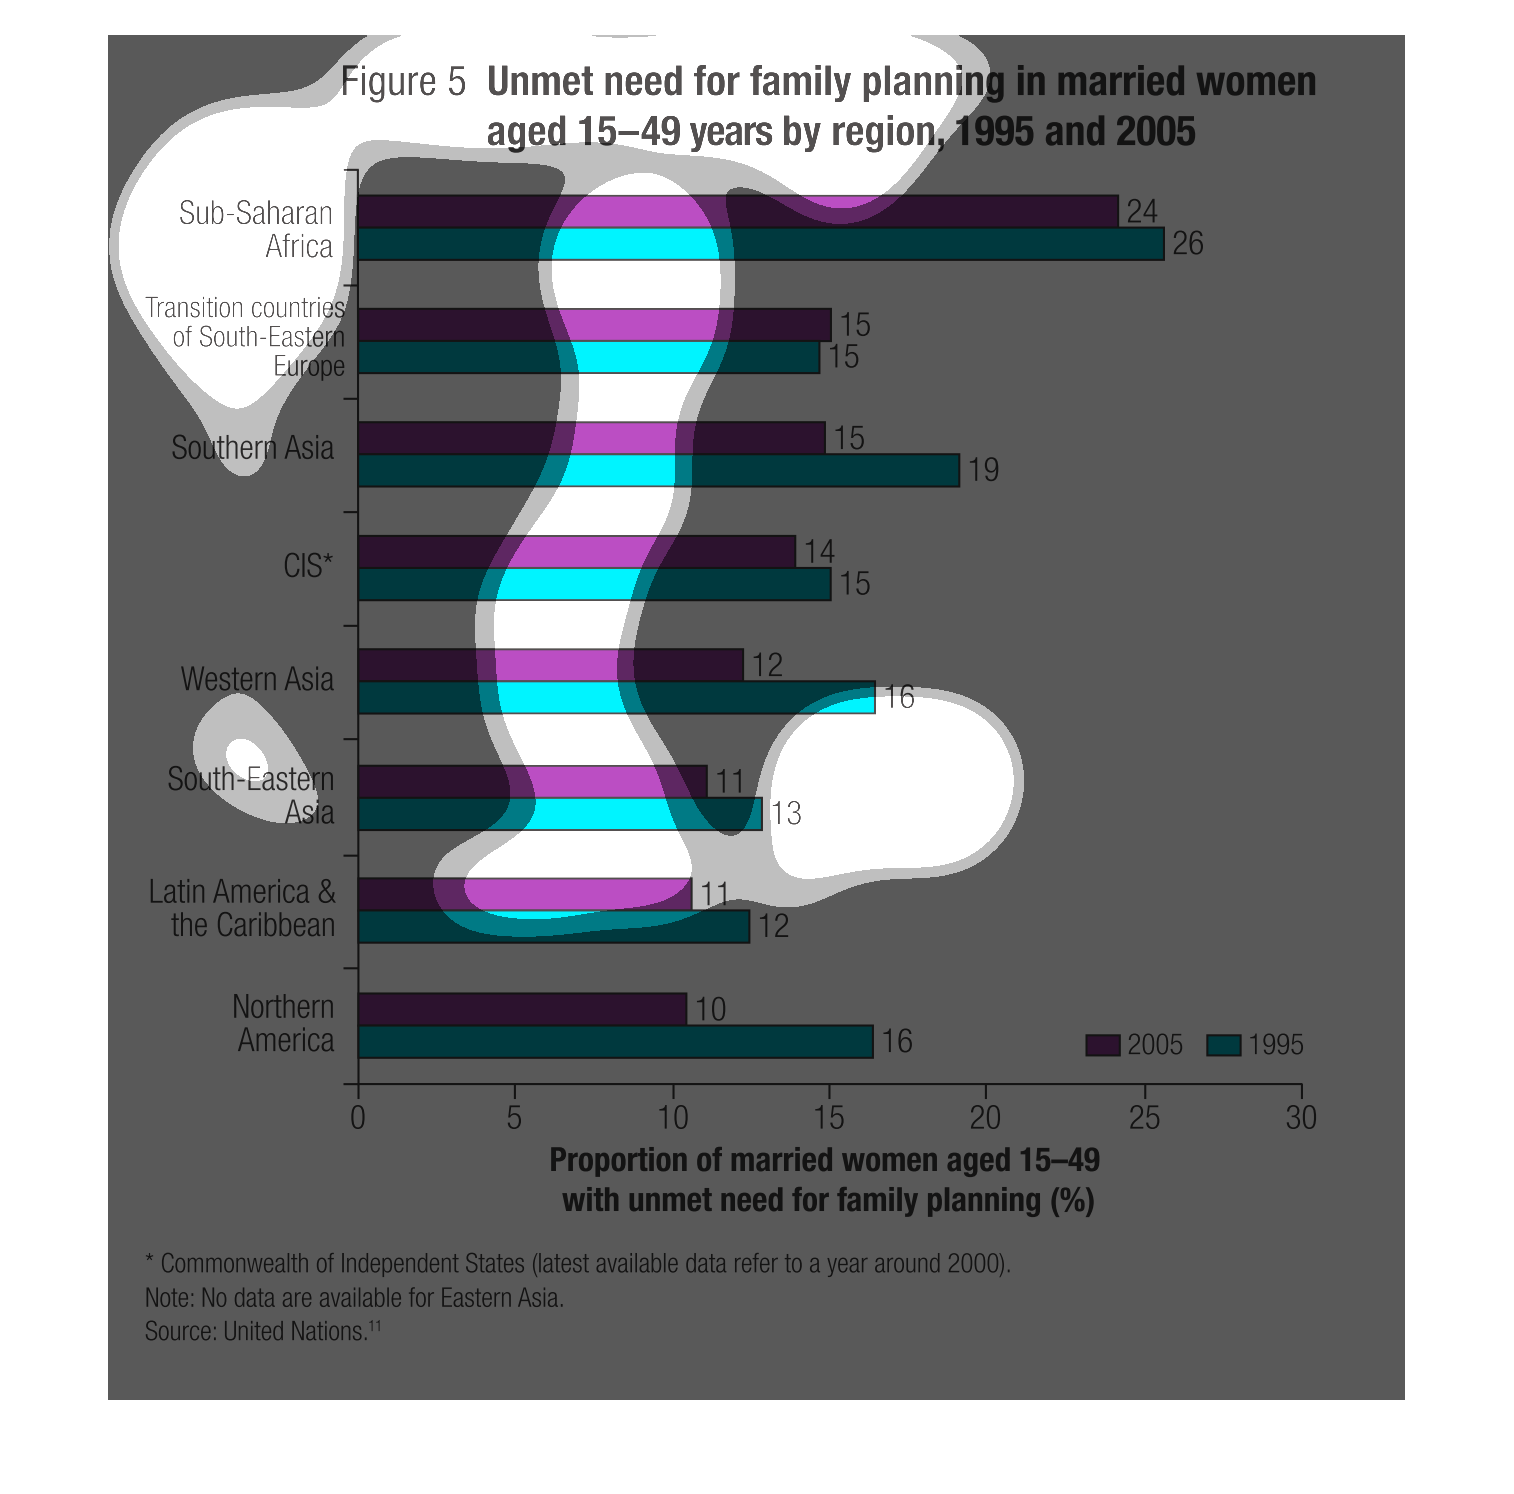
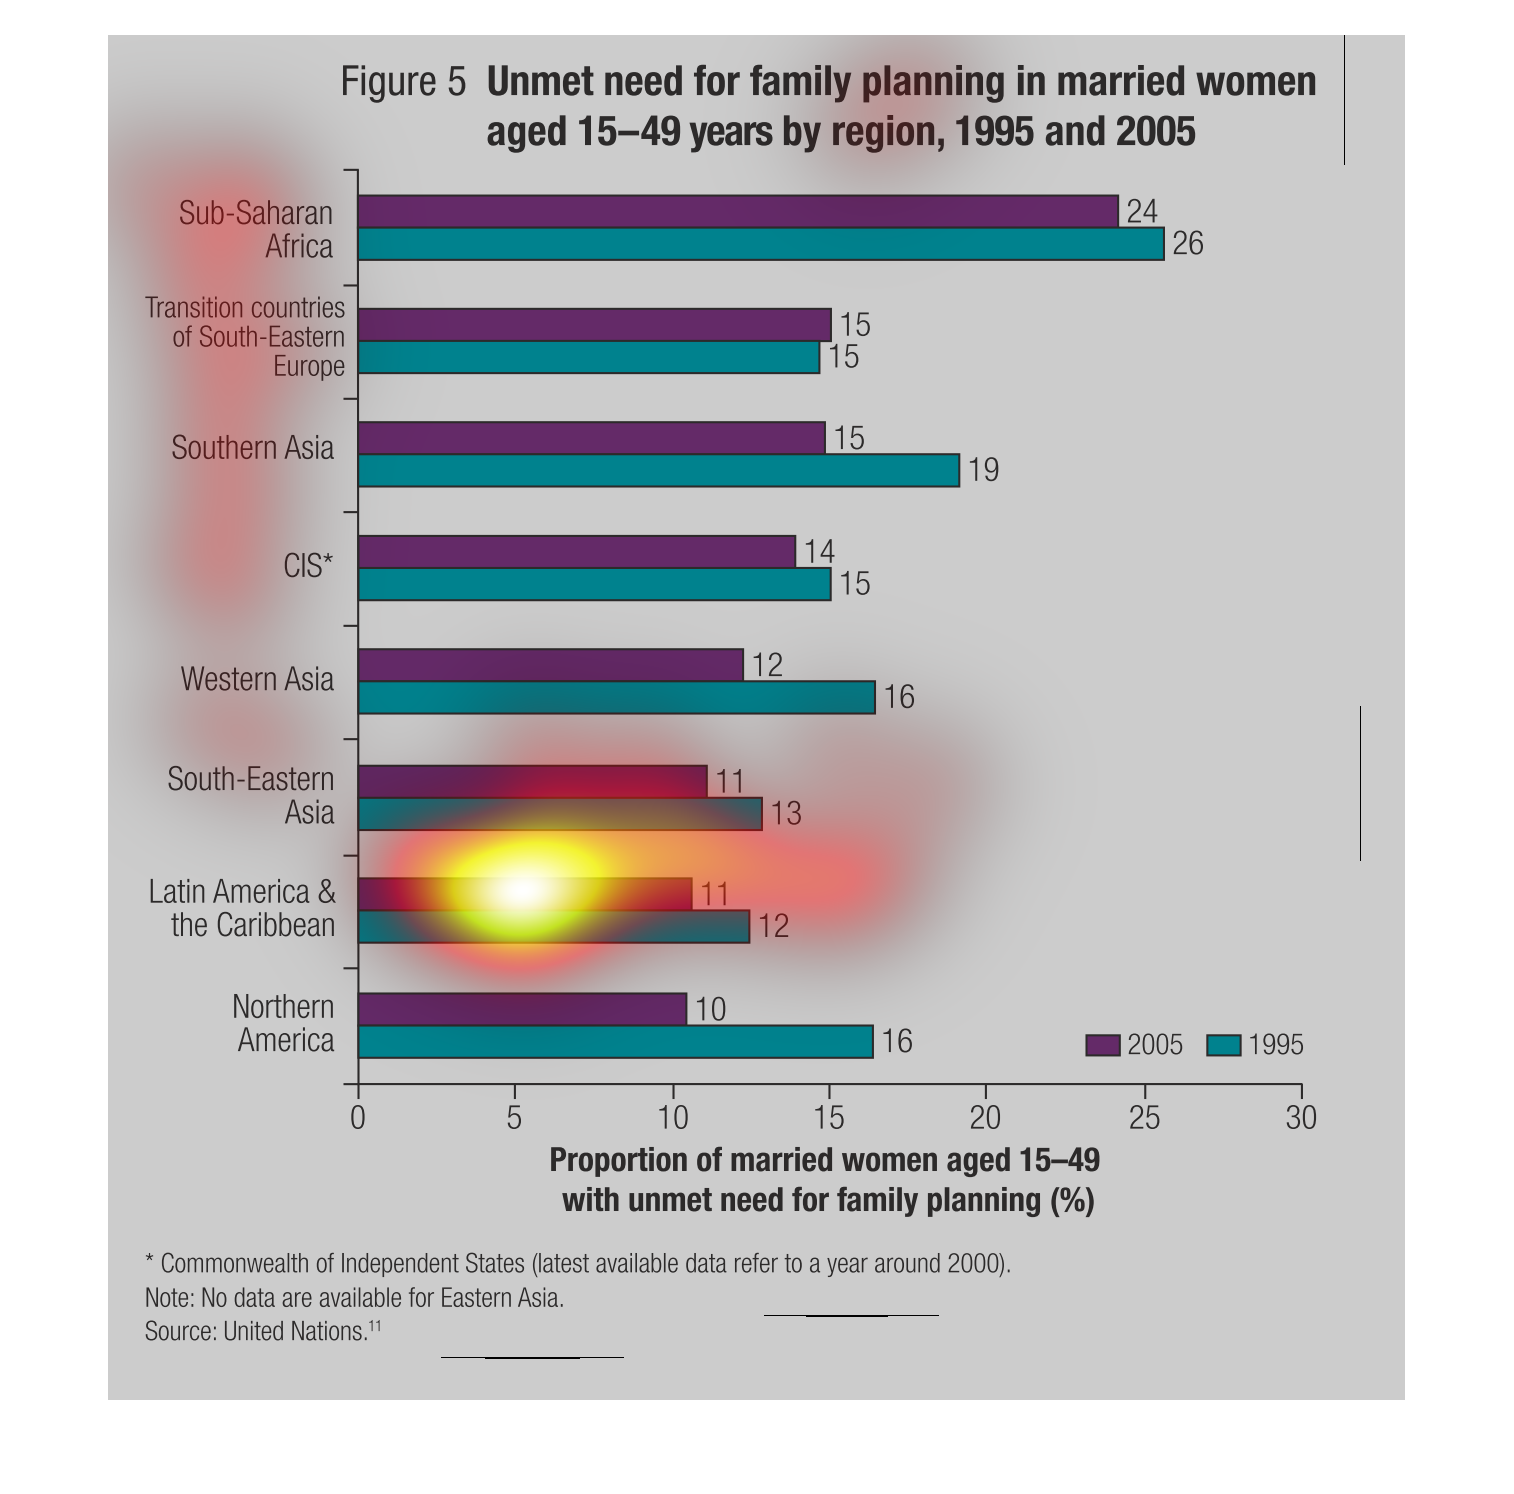
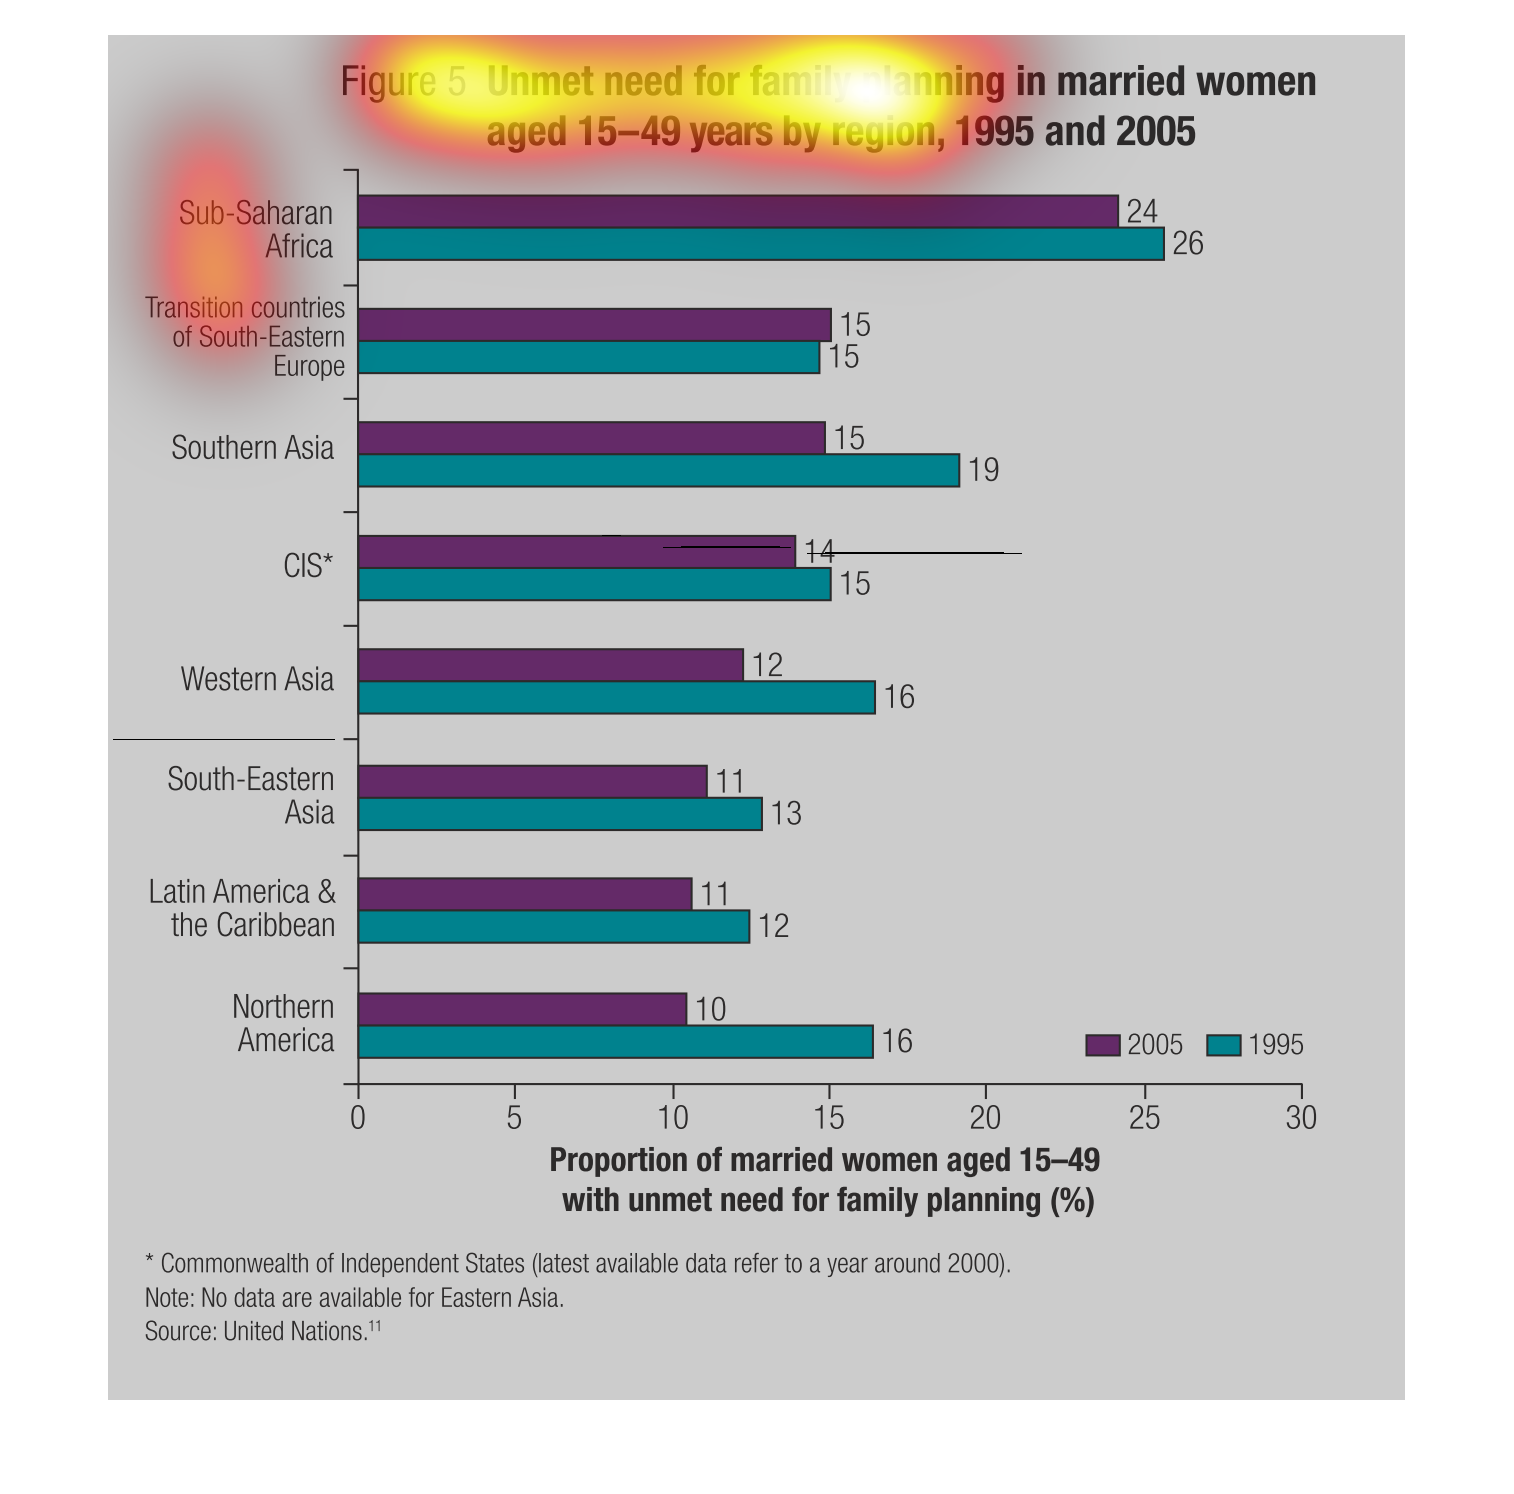
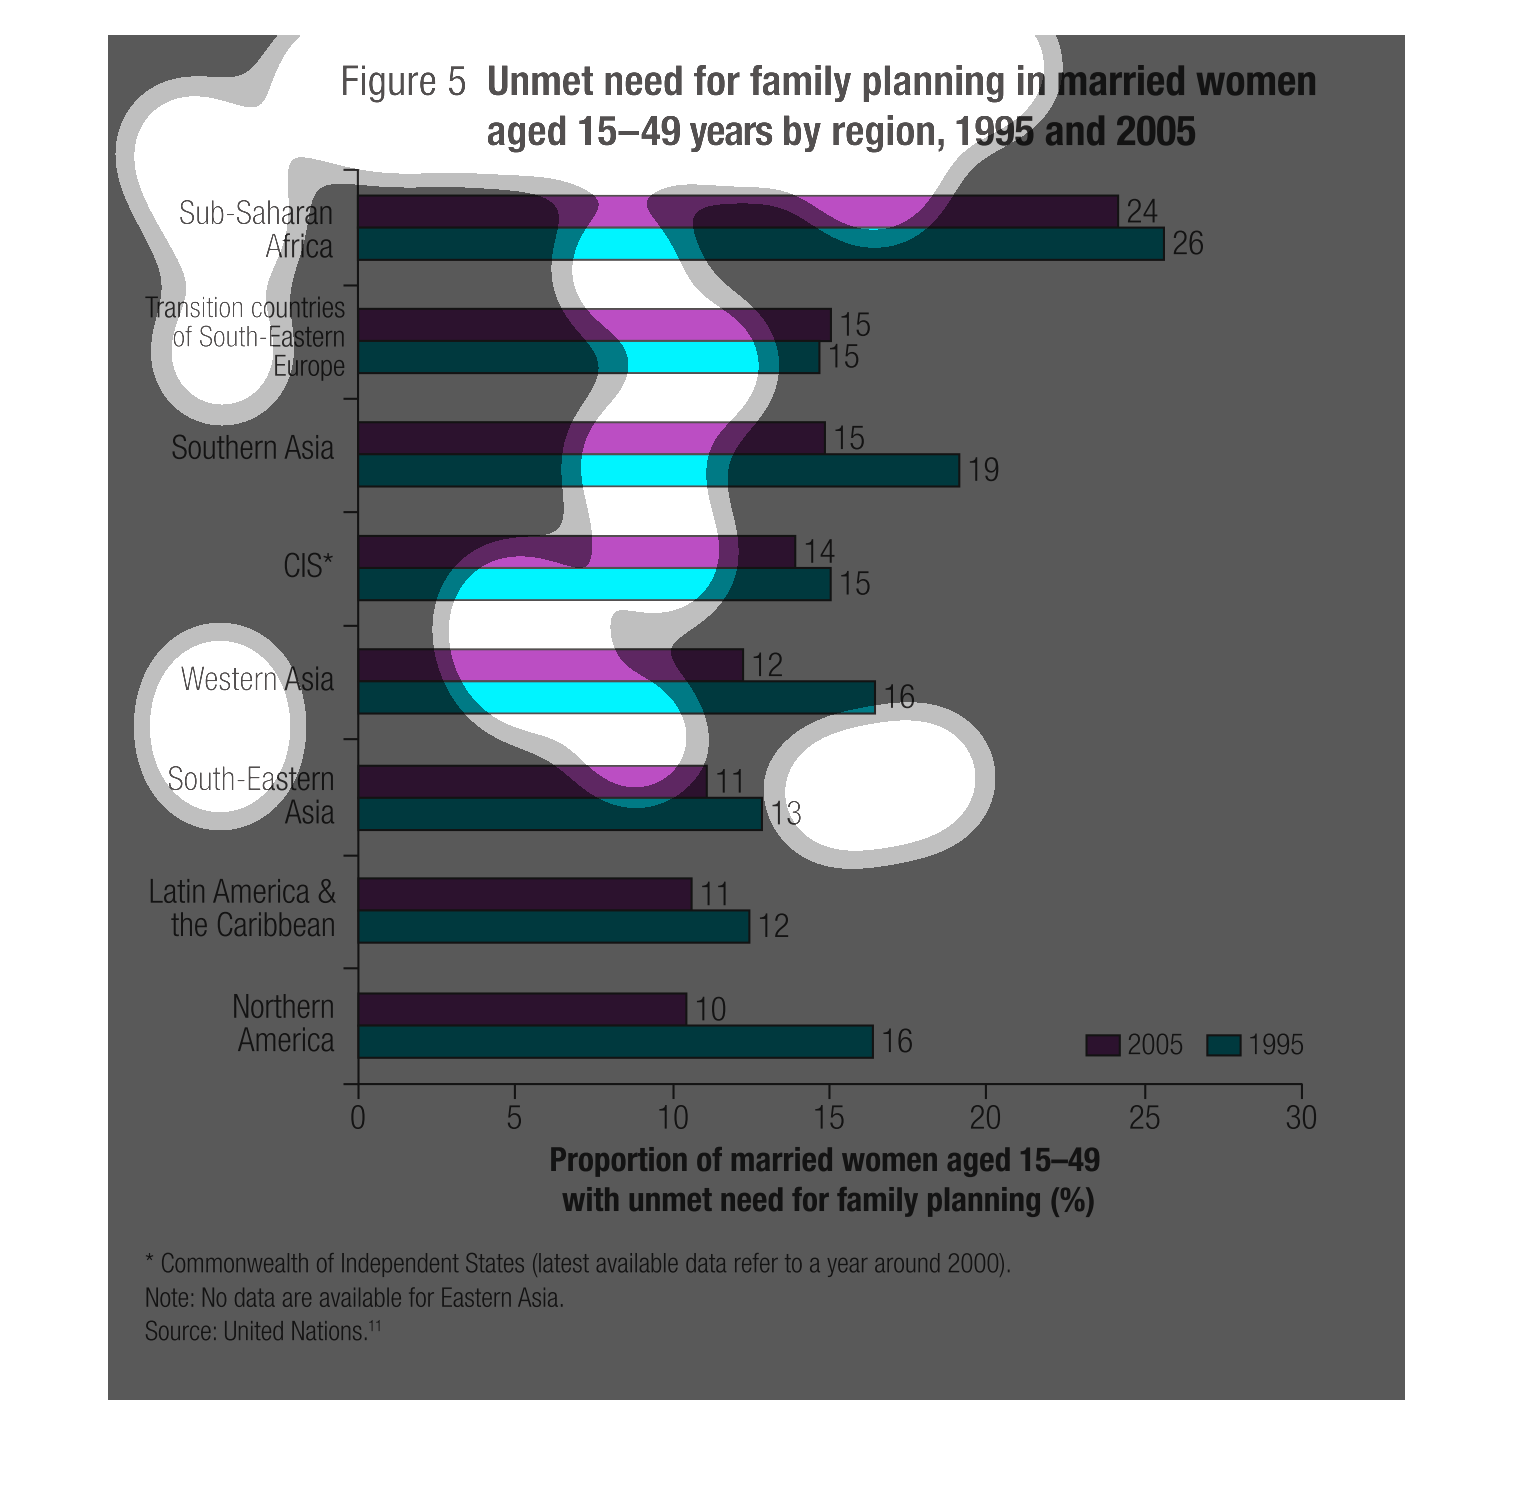
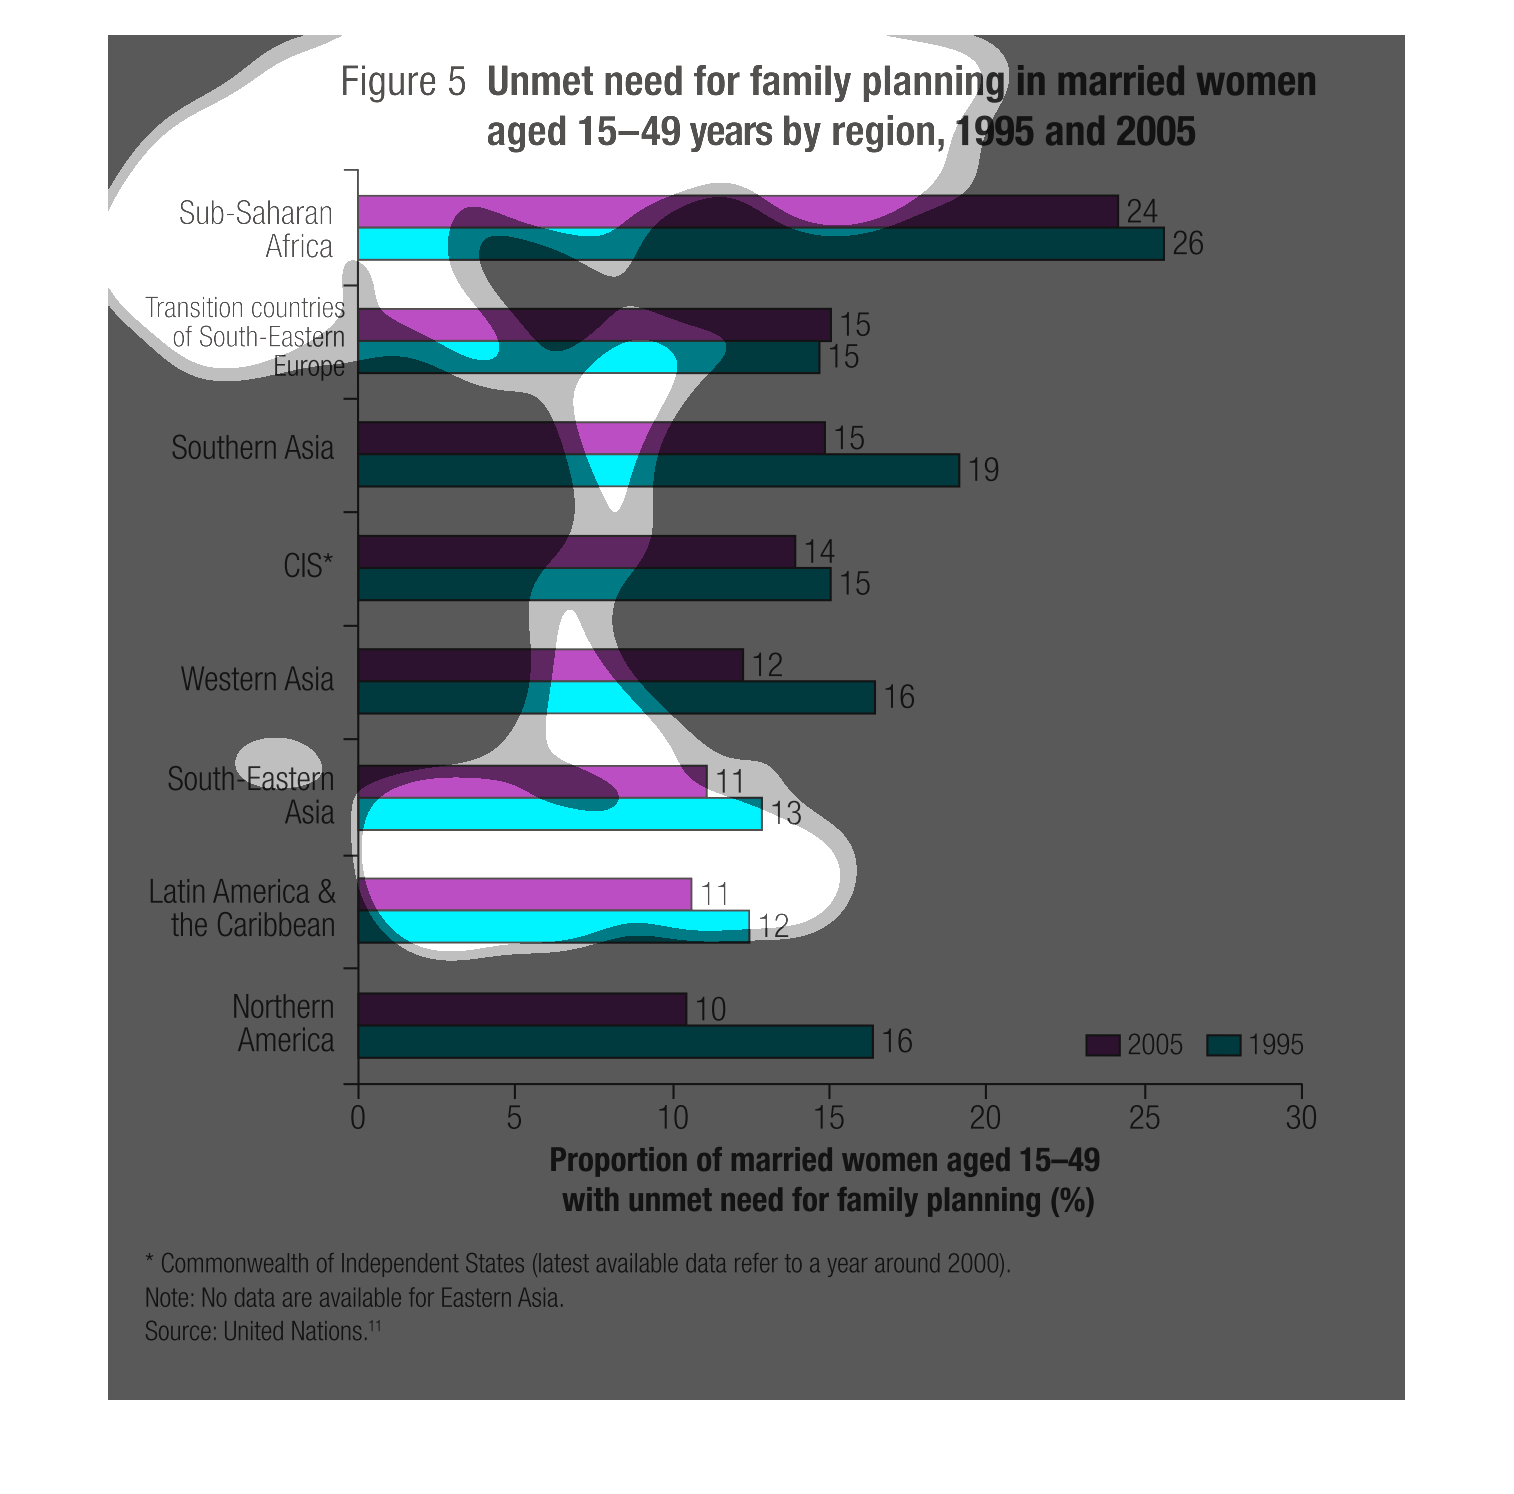
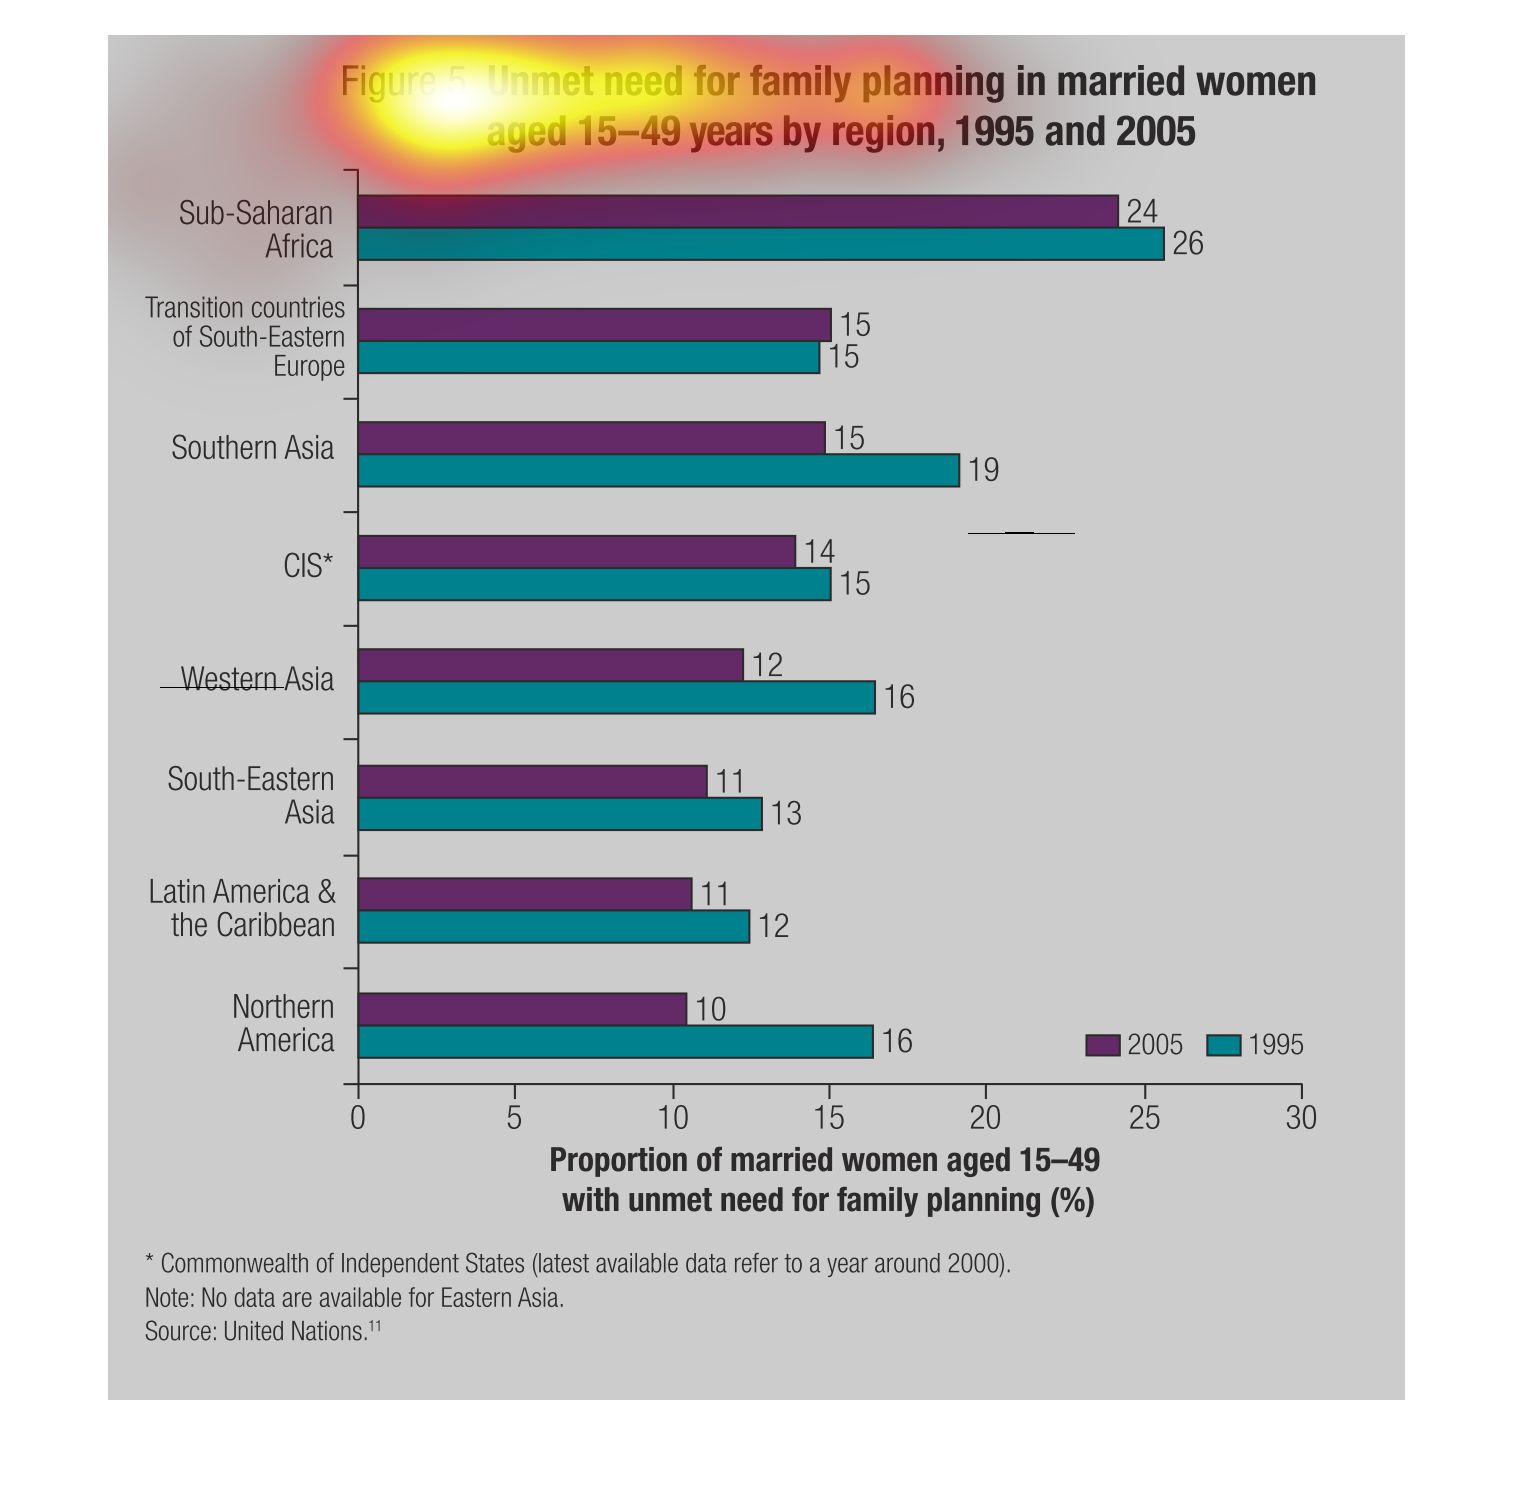
horizontal bar graph showing the Unmet need for family planning by geographic region.
Two years:  2005  and 1995  Shown as percentages of married women between 15-49  Largest percentage
is in Sub-Saharan Africa. 26-24  Largest improvement North America 16 - 10. Latin America
 12-11 South east asia 13-11 Western Asia 16-12 CIS 15-14 Southern asia 19-15 Transition countries
of Eastern Europe 15-15
This shows the amount of women for unmet need for family planning. It shows the years 2010
and 1995 and compares by country. The amount has decreased over time.