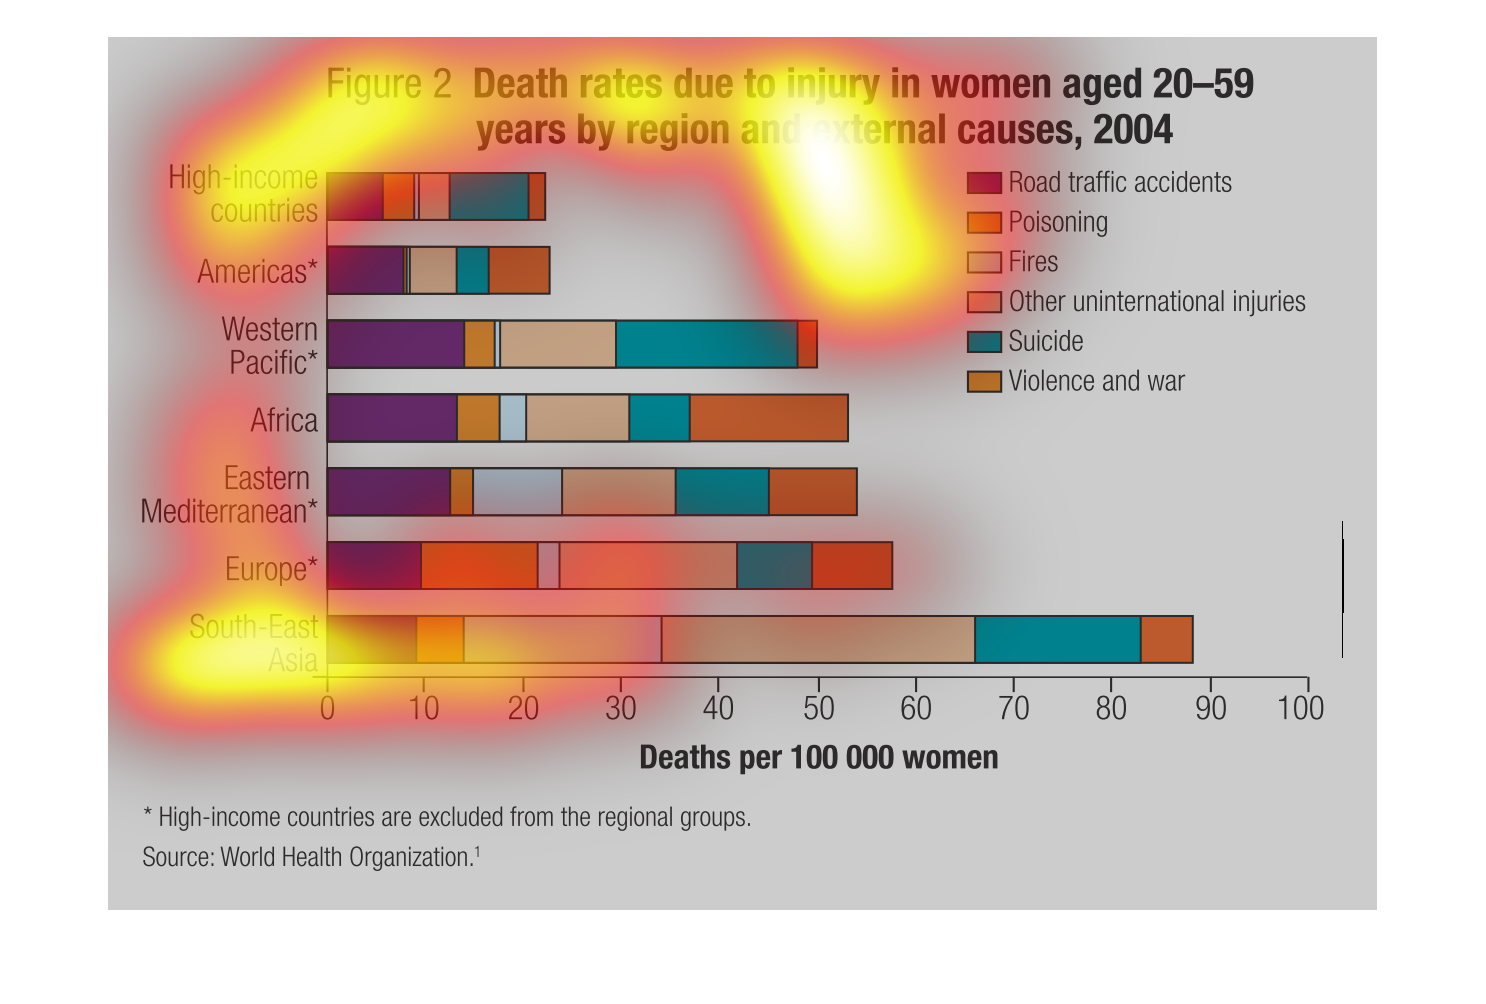
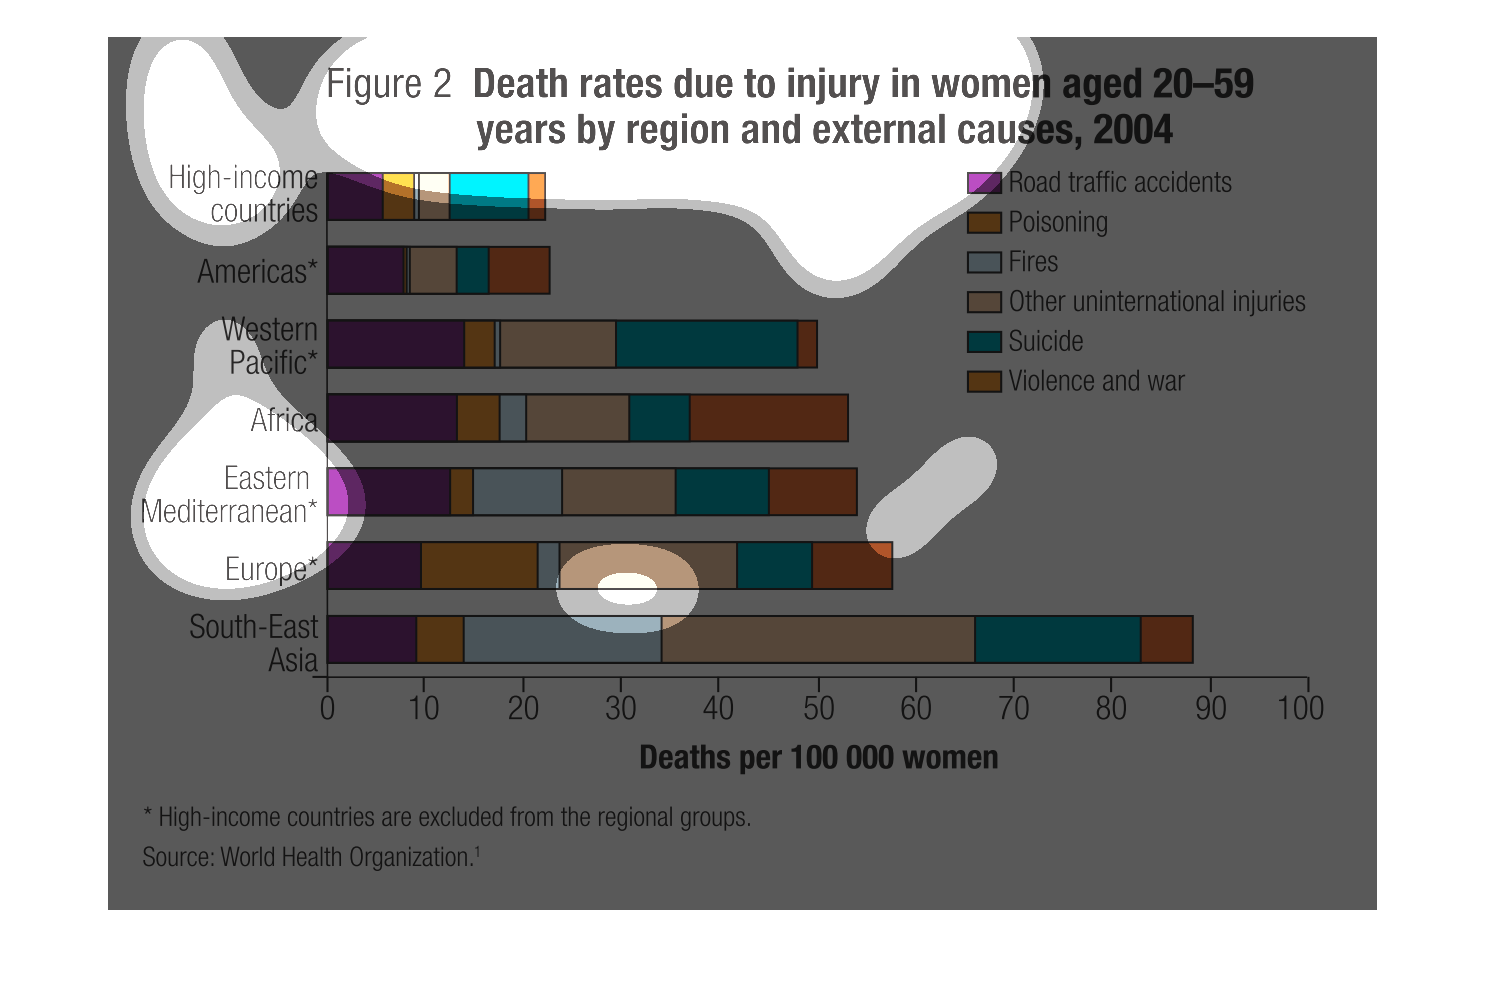
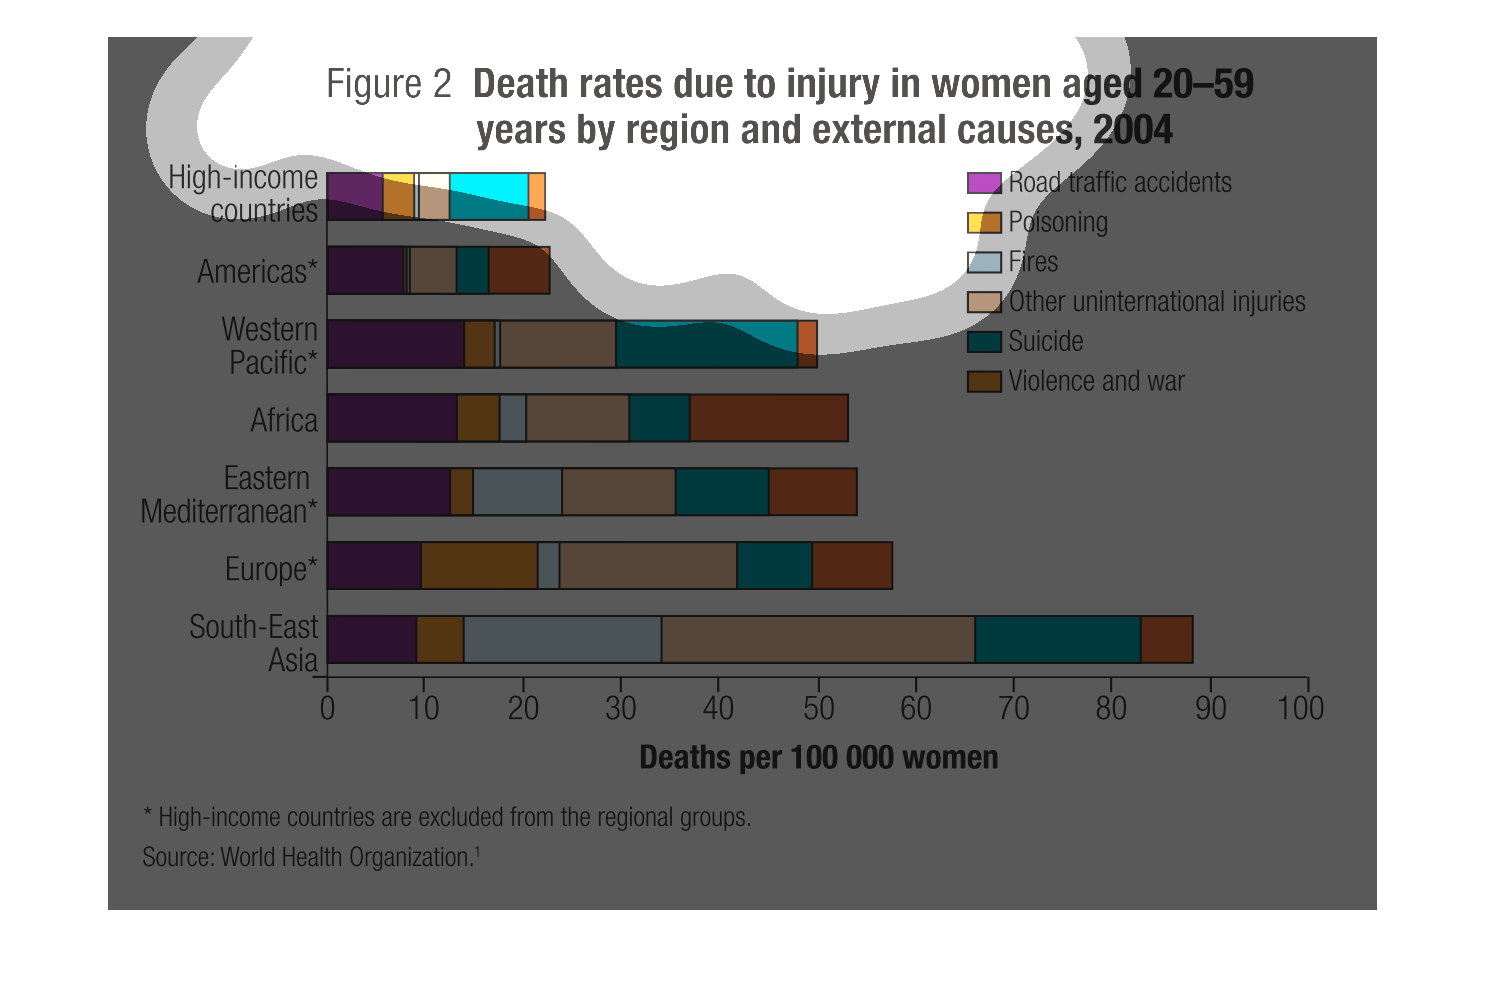
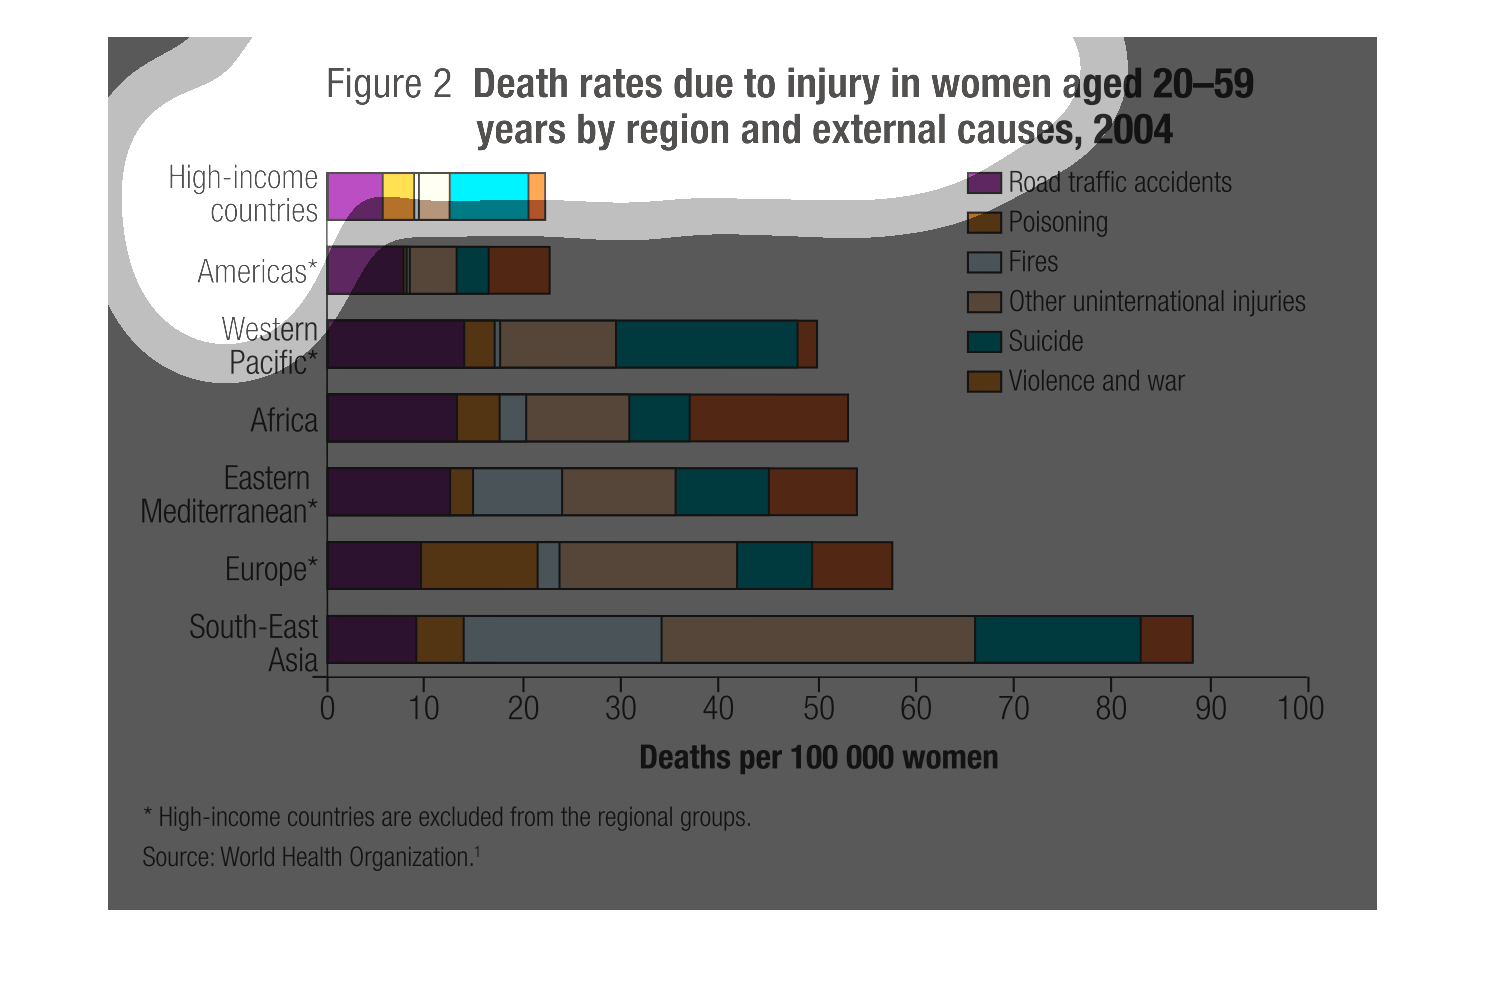
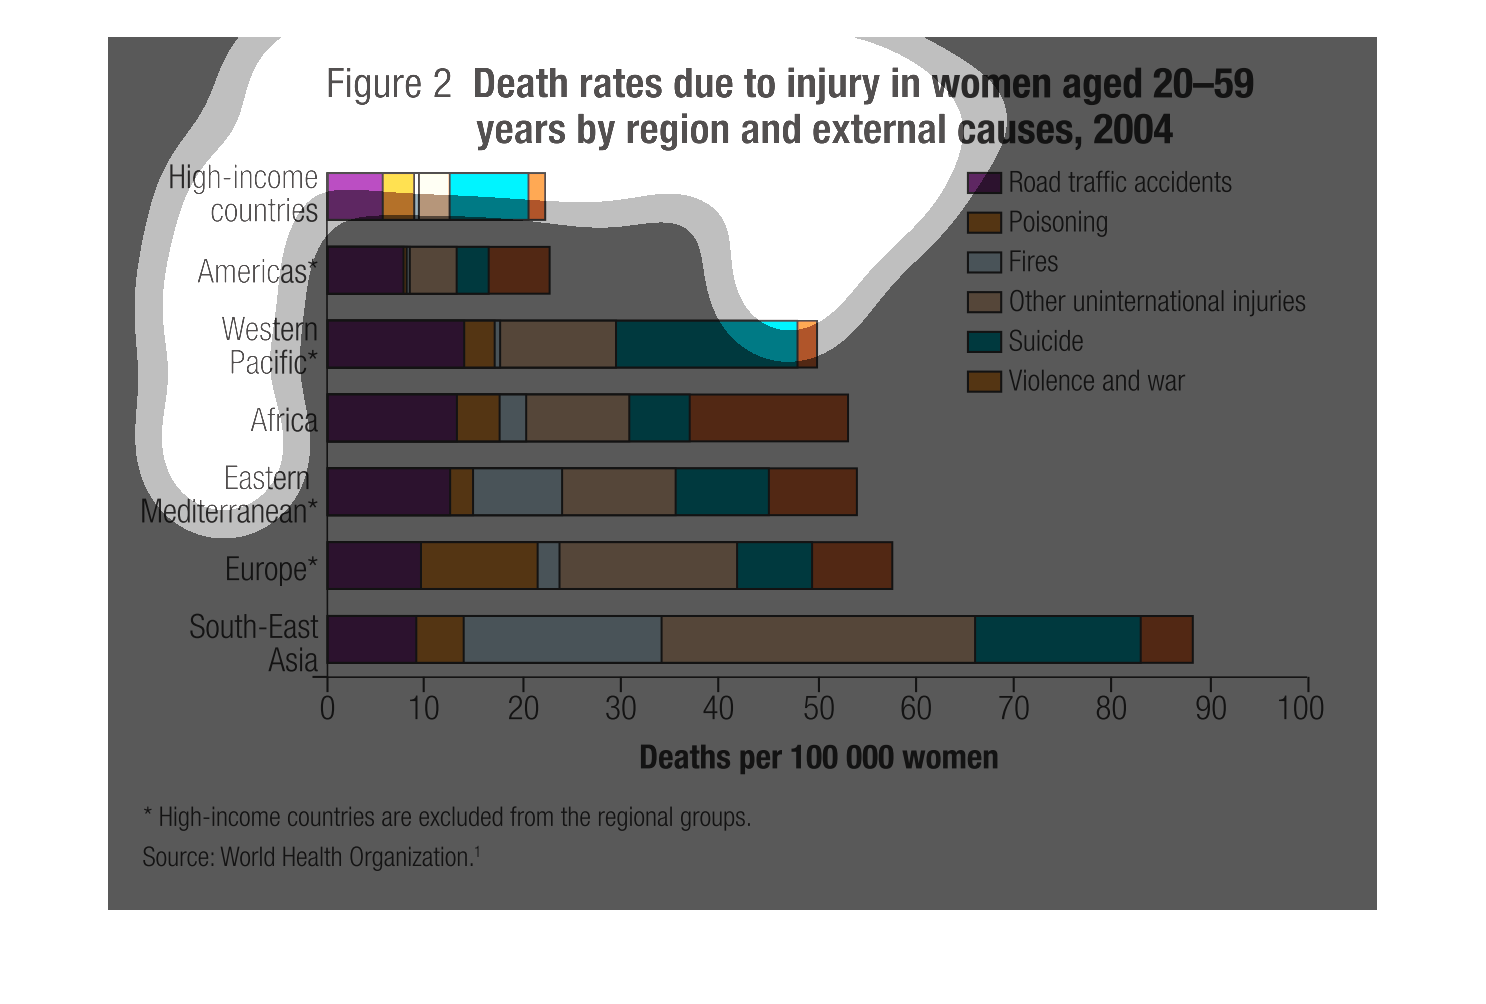
The image is a graph describing the death rates due to injury to women aged 20-59 in low-income
areas and high-income countries. The graph is unclear as to who was included in the information,
but it appears that many more people died in Southeast Asia due to injured women than in other
areas.
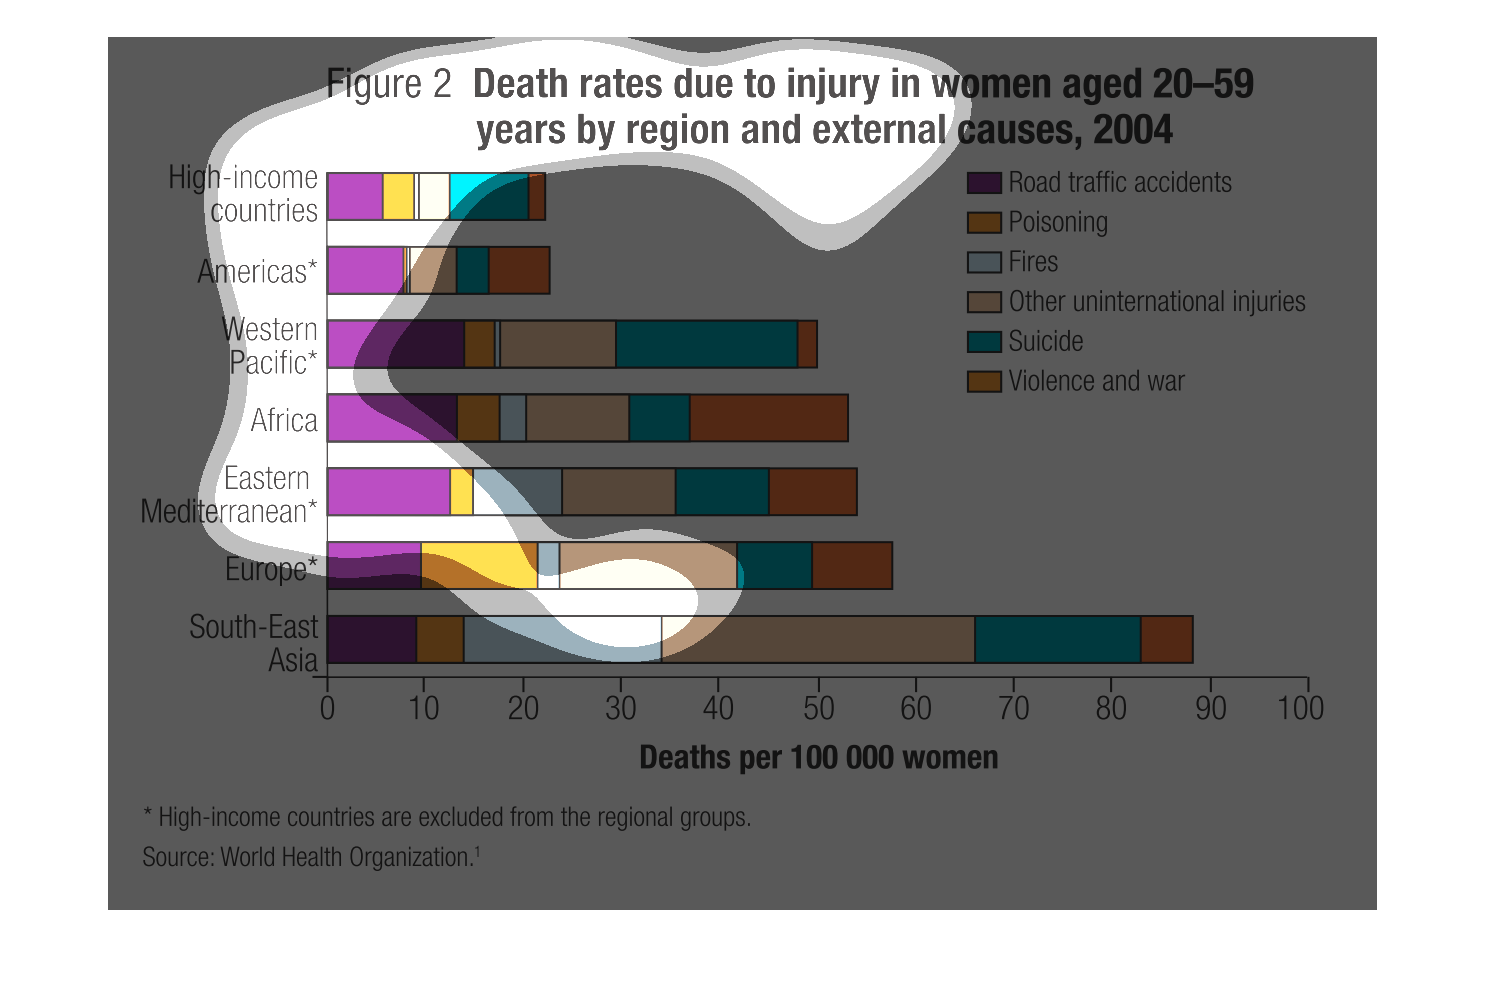
The image depicts death rates due to injury in women aged 20-59 years by religion and external
causes, by way of bar graph, in the year 2004. Deaths per 100,000 women are cited with: High-income
countries, Americas, Western Pacific, Africa, eastern Mediterranean, Europe, and South-East
Asia included. Causes include: Road traffic accidents, poisoning, fires, other unintentional
injury, suicide, as well as violence and war. Source is World Health Organization.
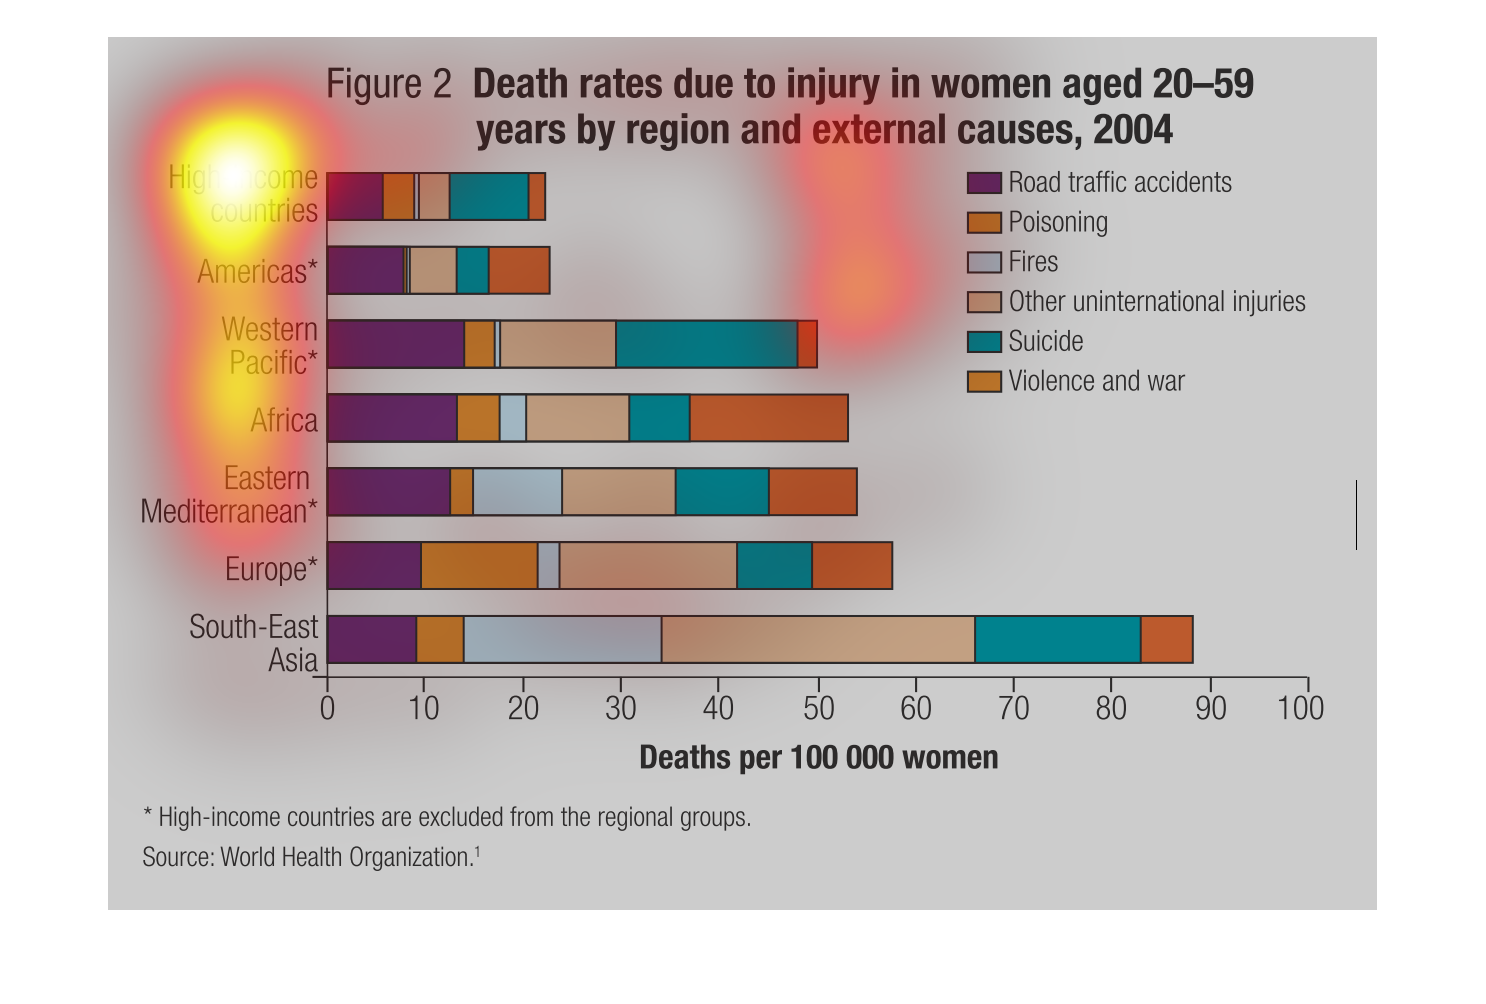
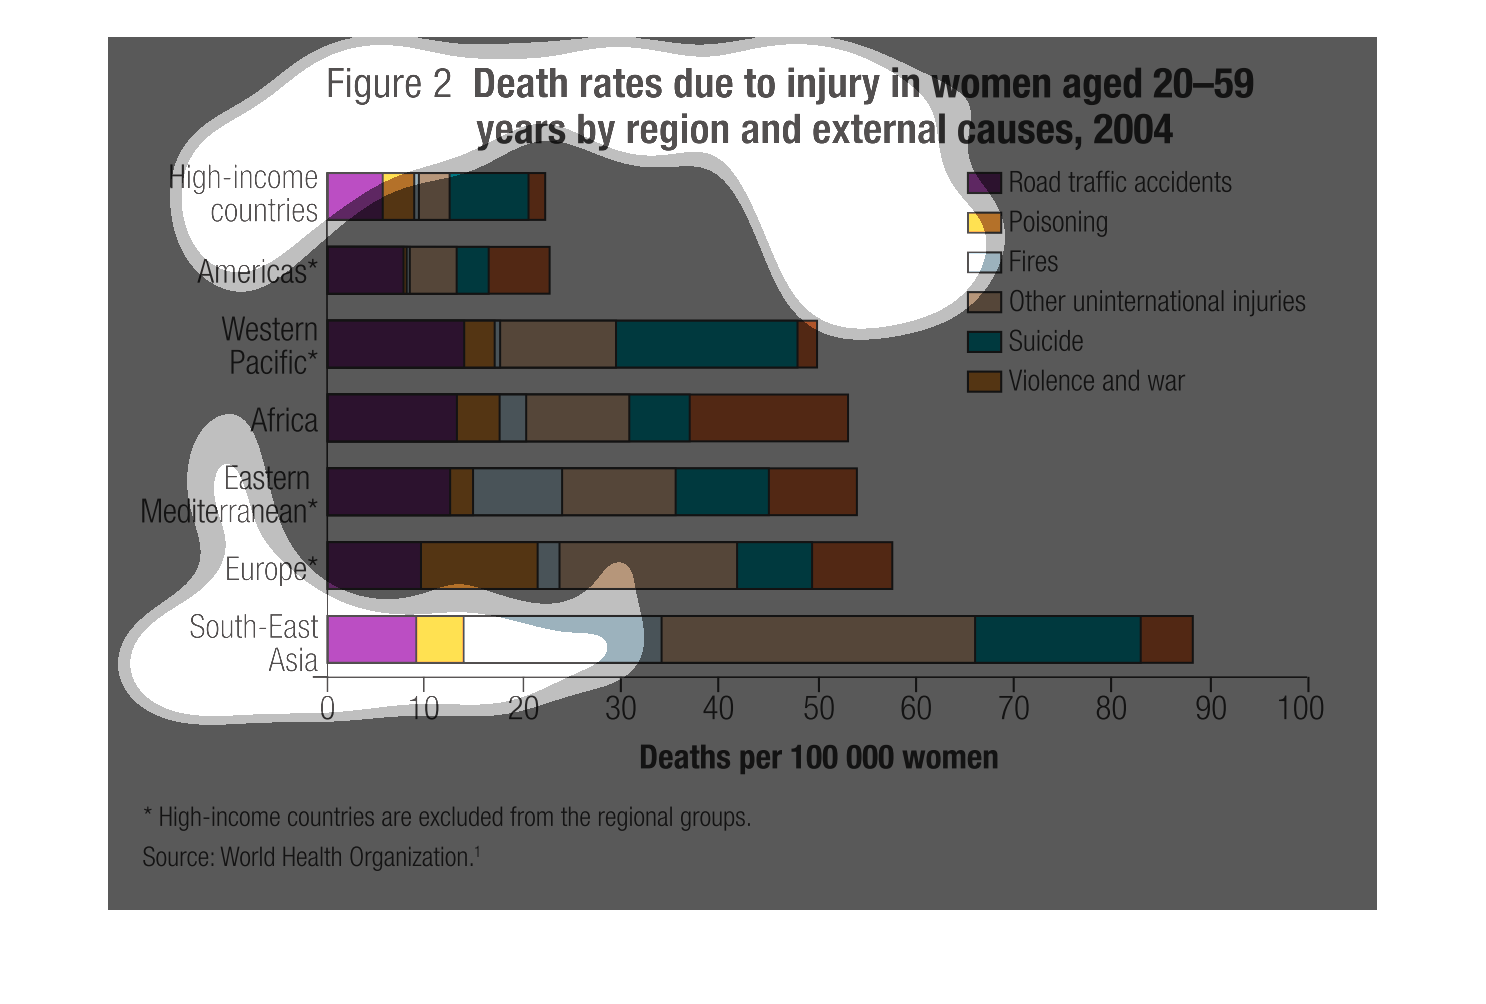
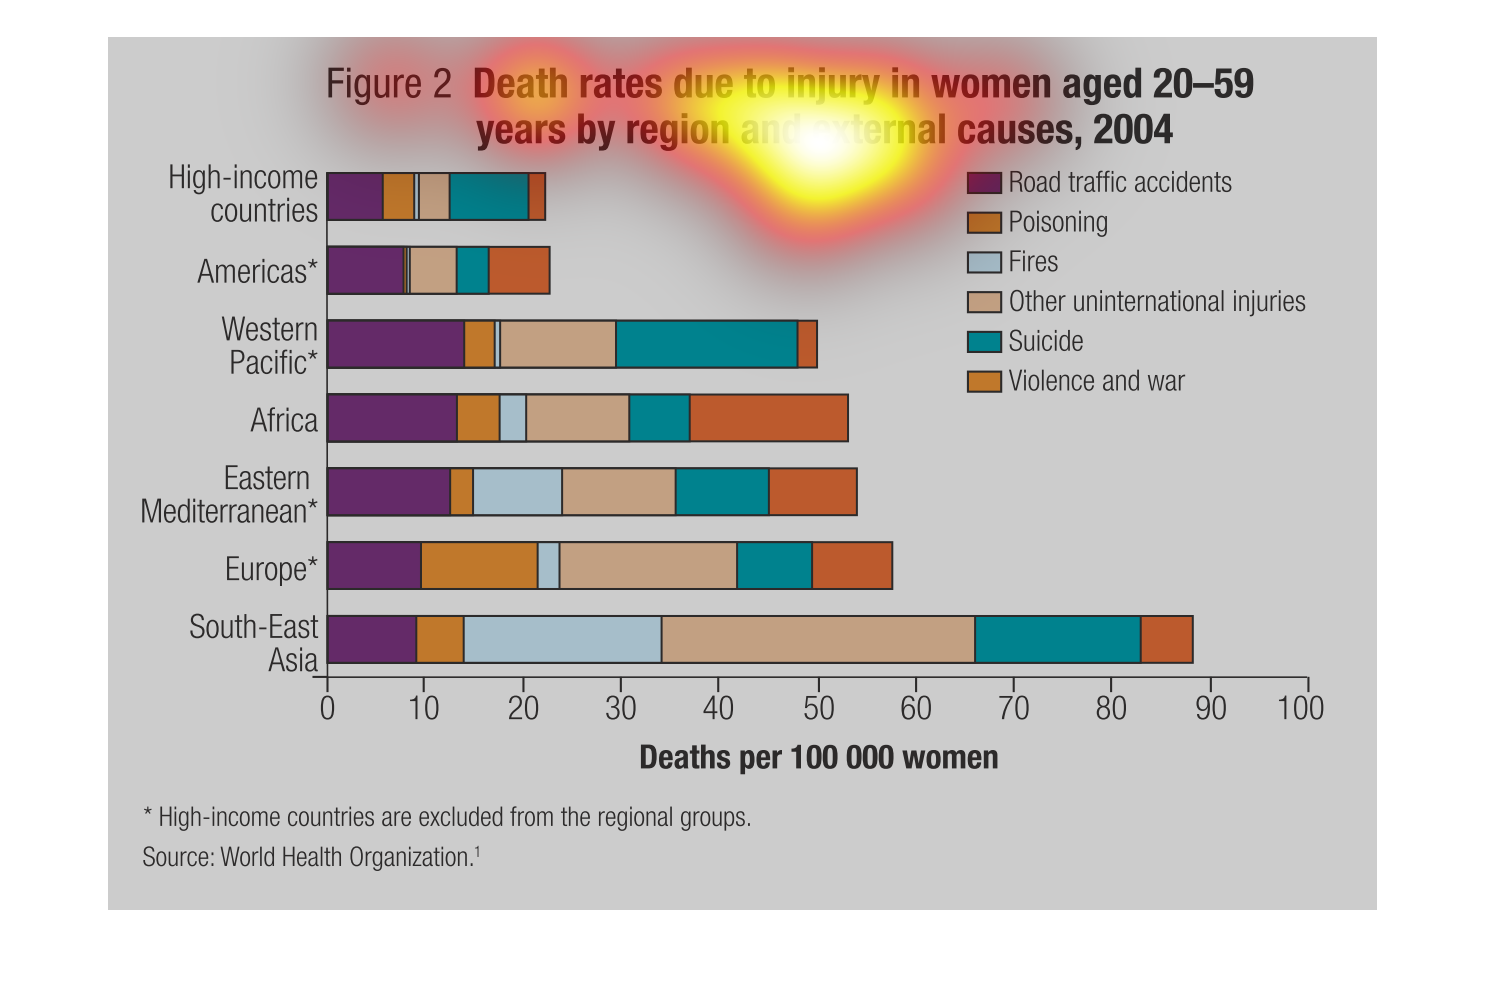
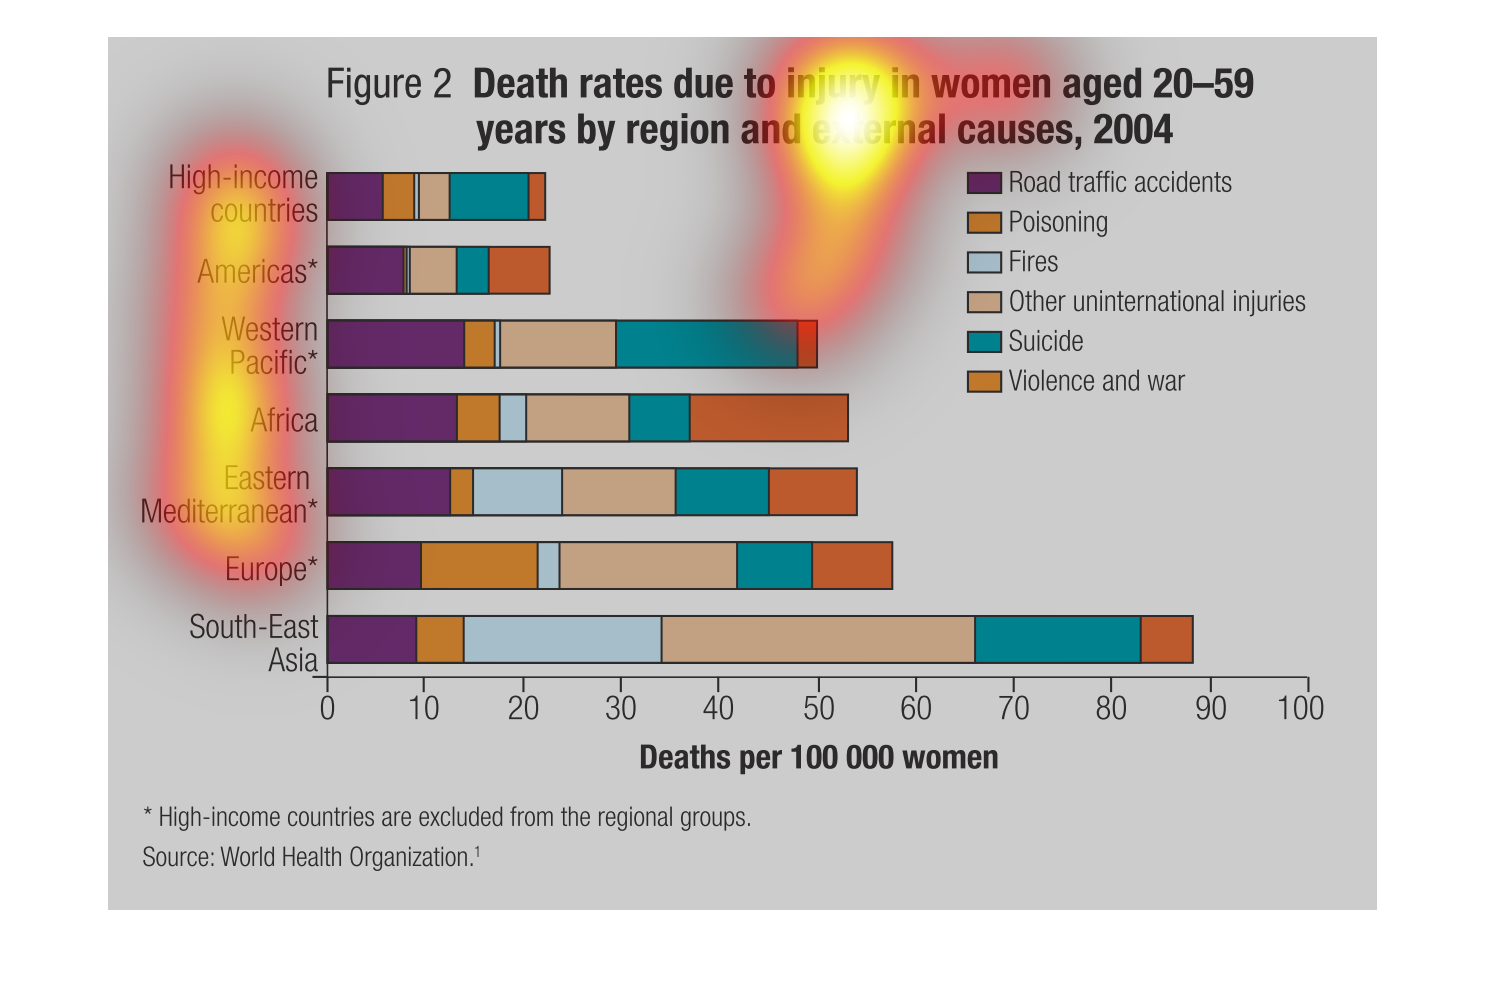
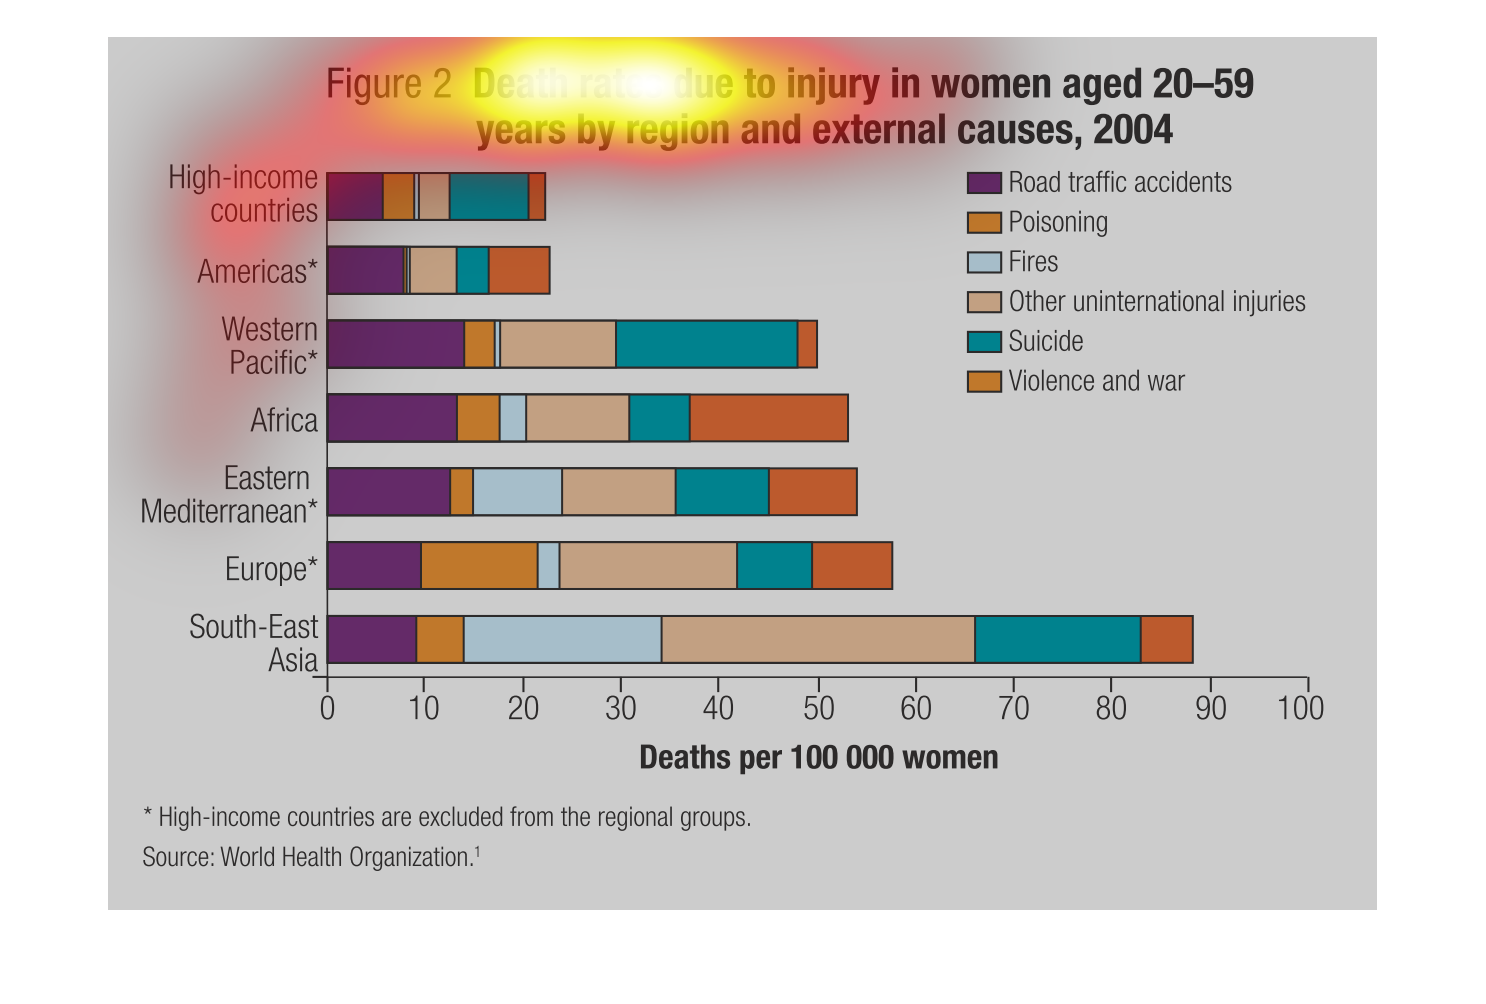
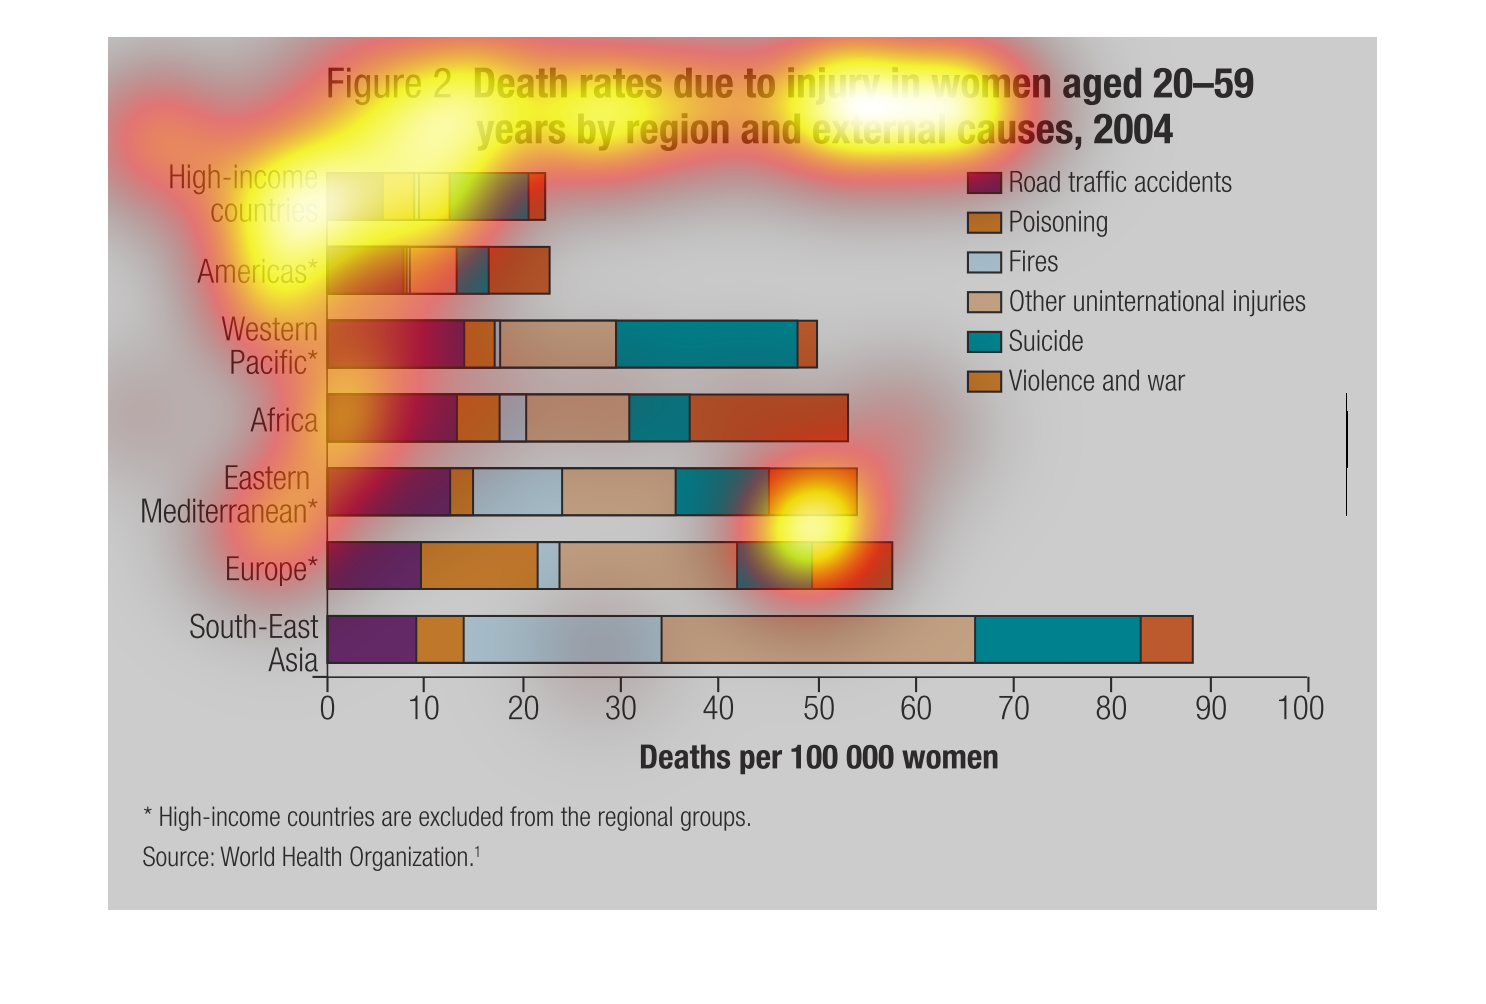
This chart describes the death rate in women aged 20-59 years by region and external causes.
Some of the causes of death collected in this study are suicide, fires, and violent crimes.
The data collected suggest that woman deaths in that age range are worst in south east Asia,
and best in high income countries.
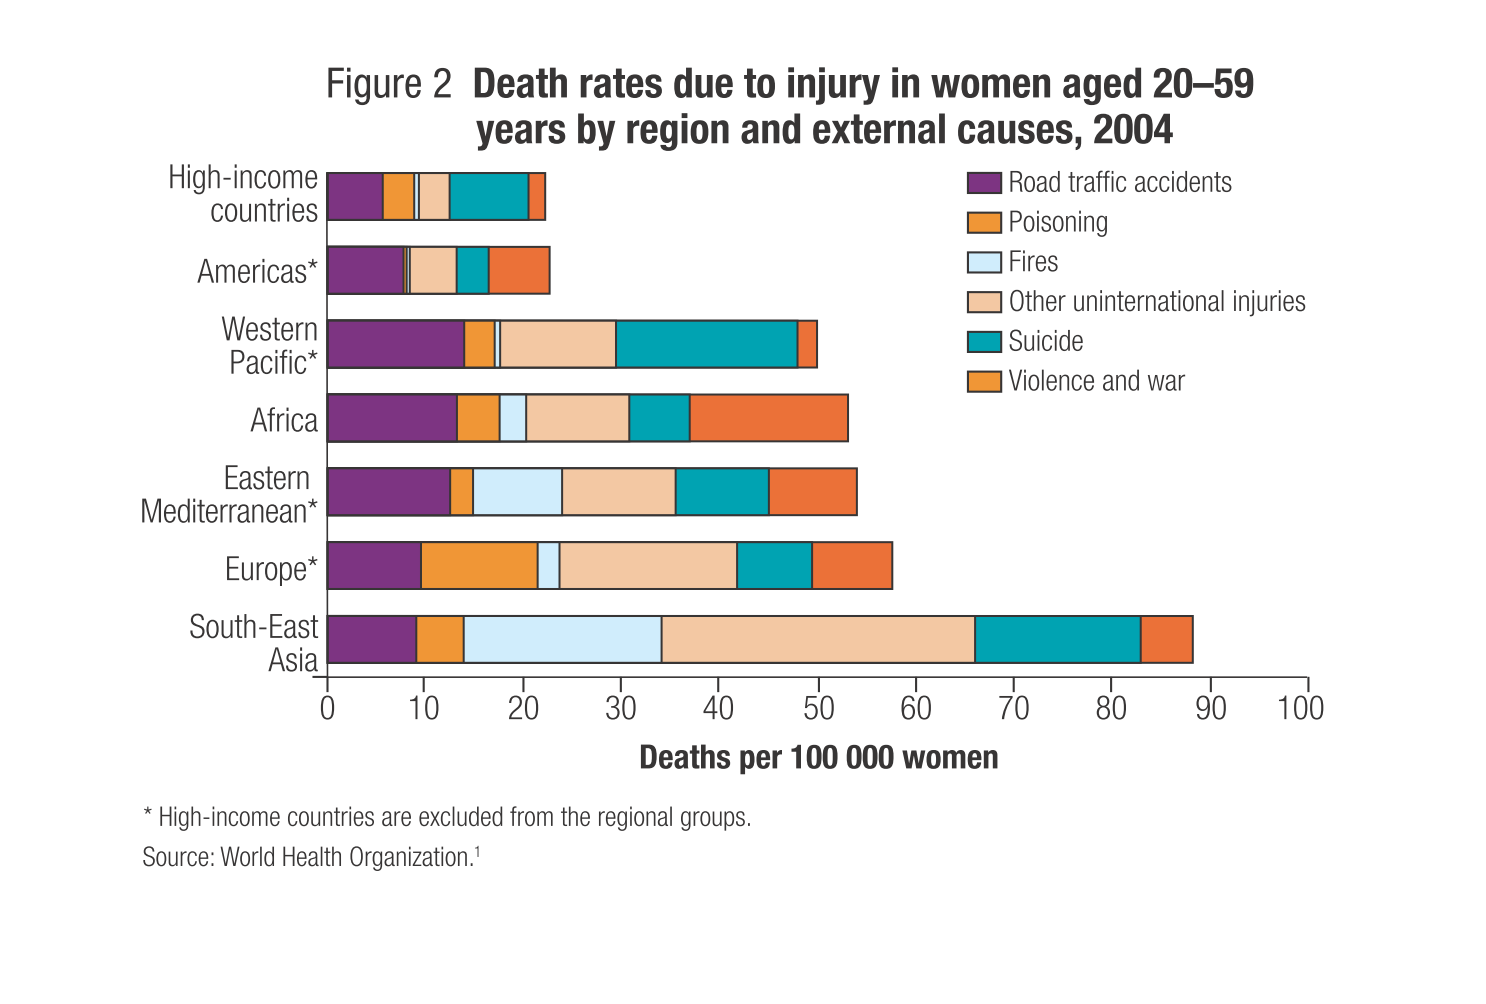
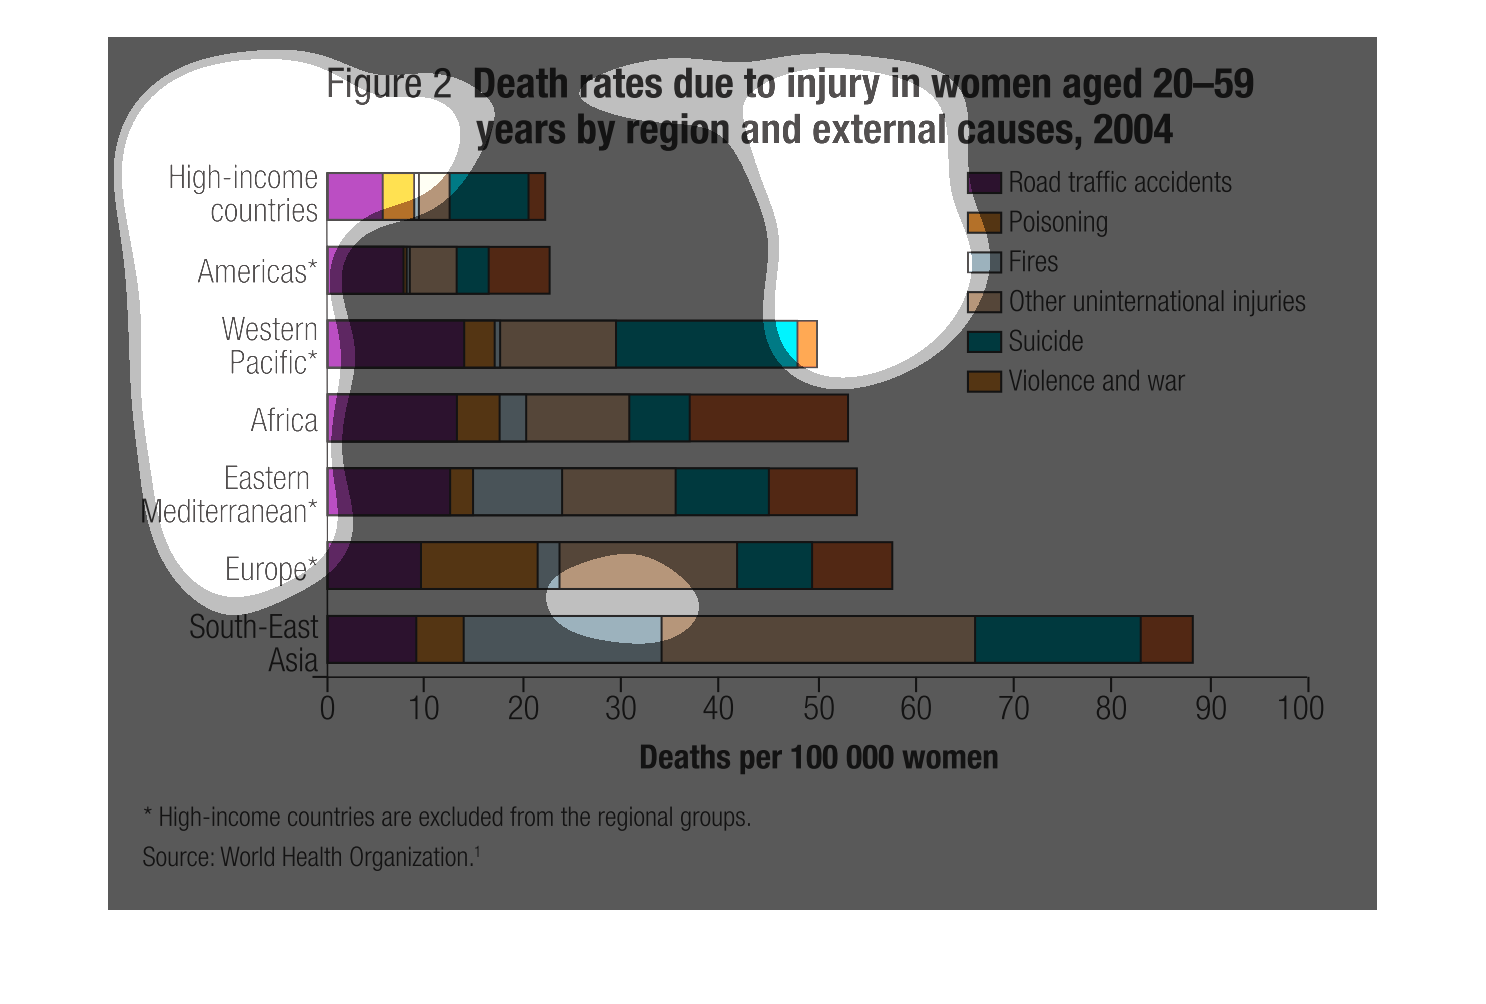
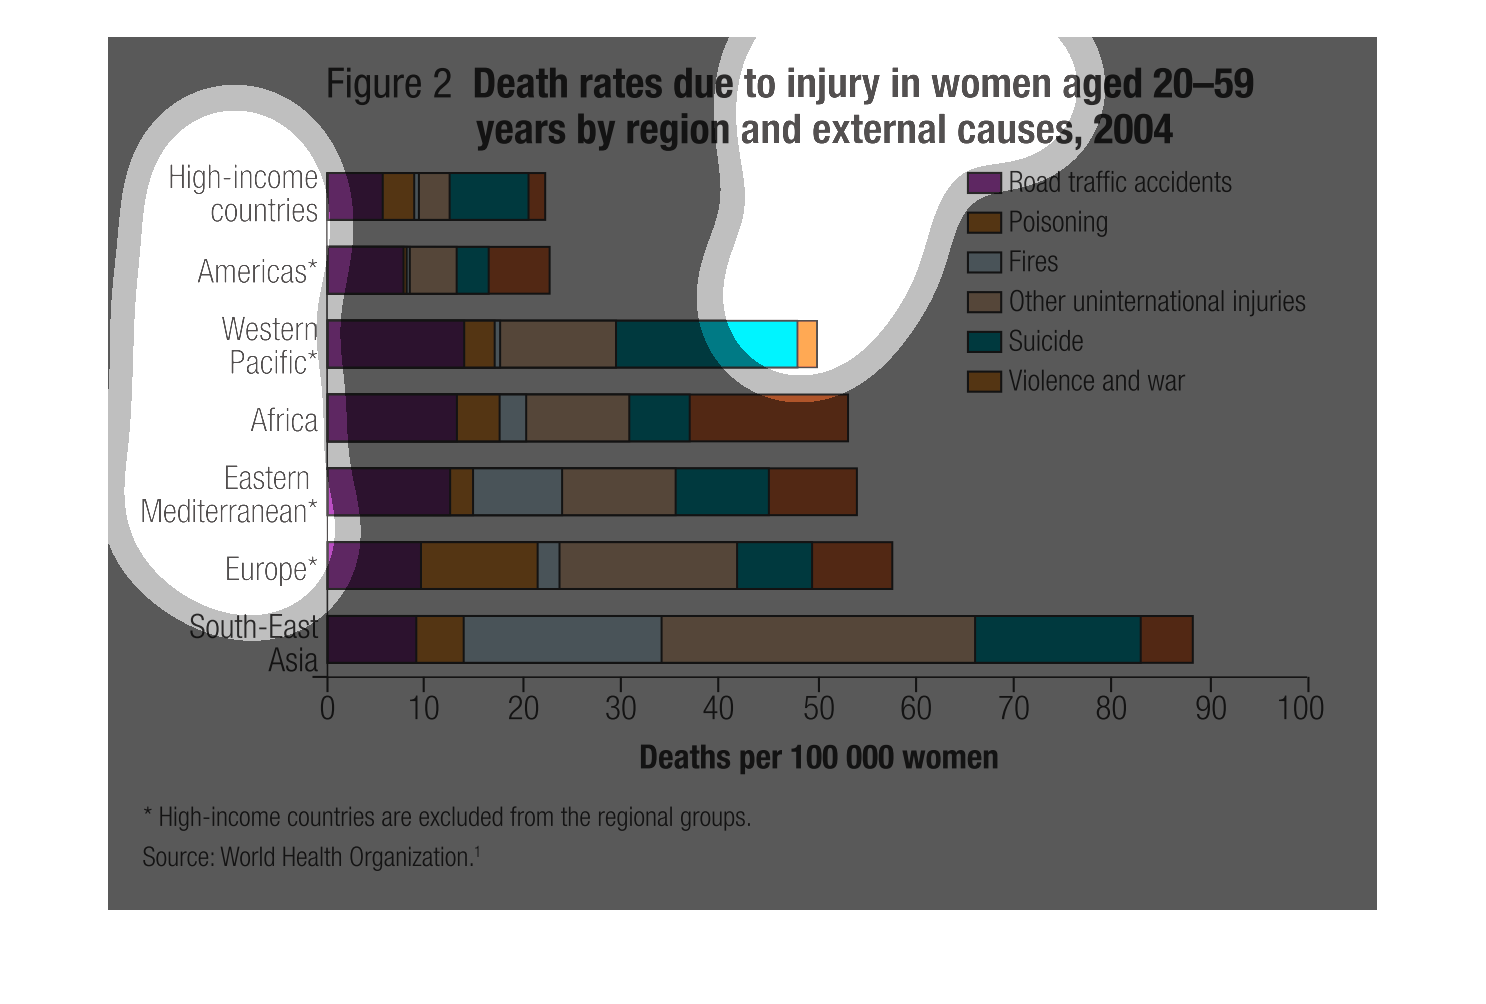
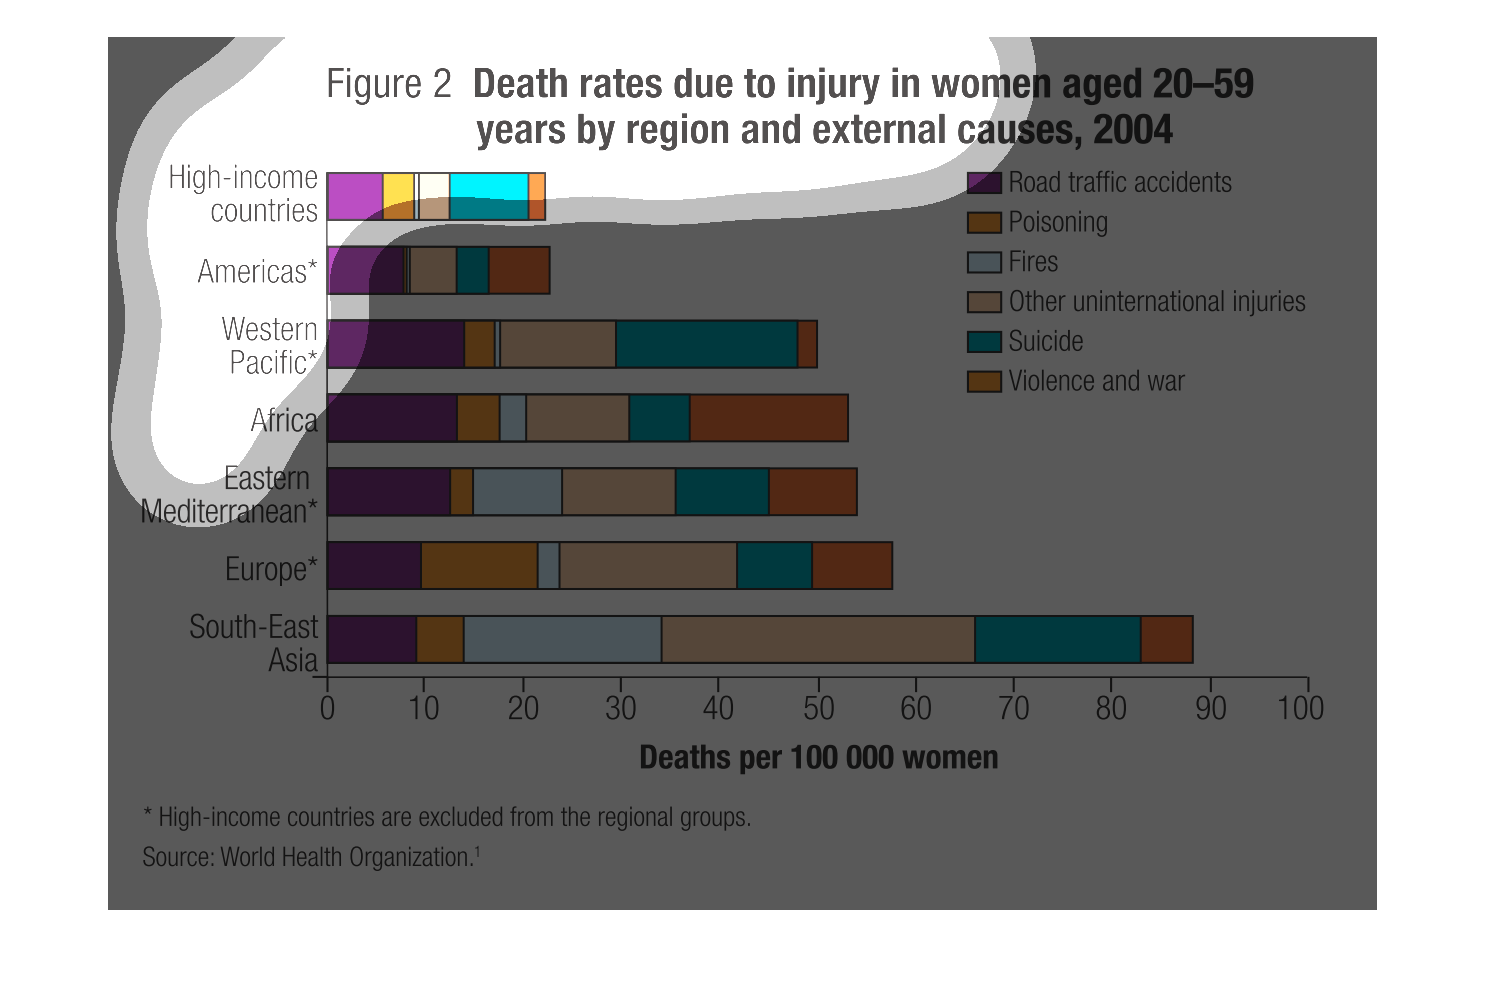
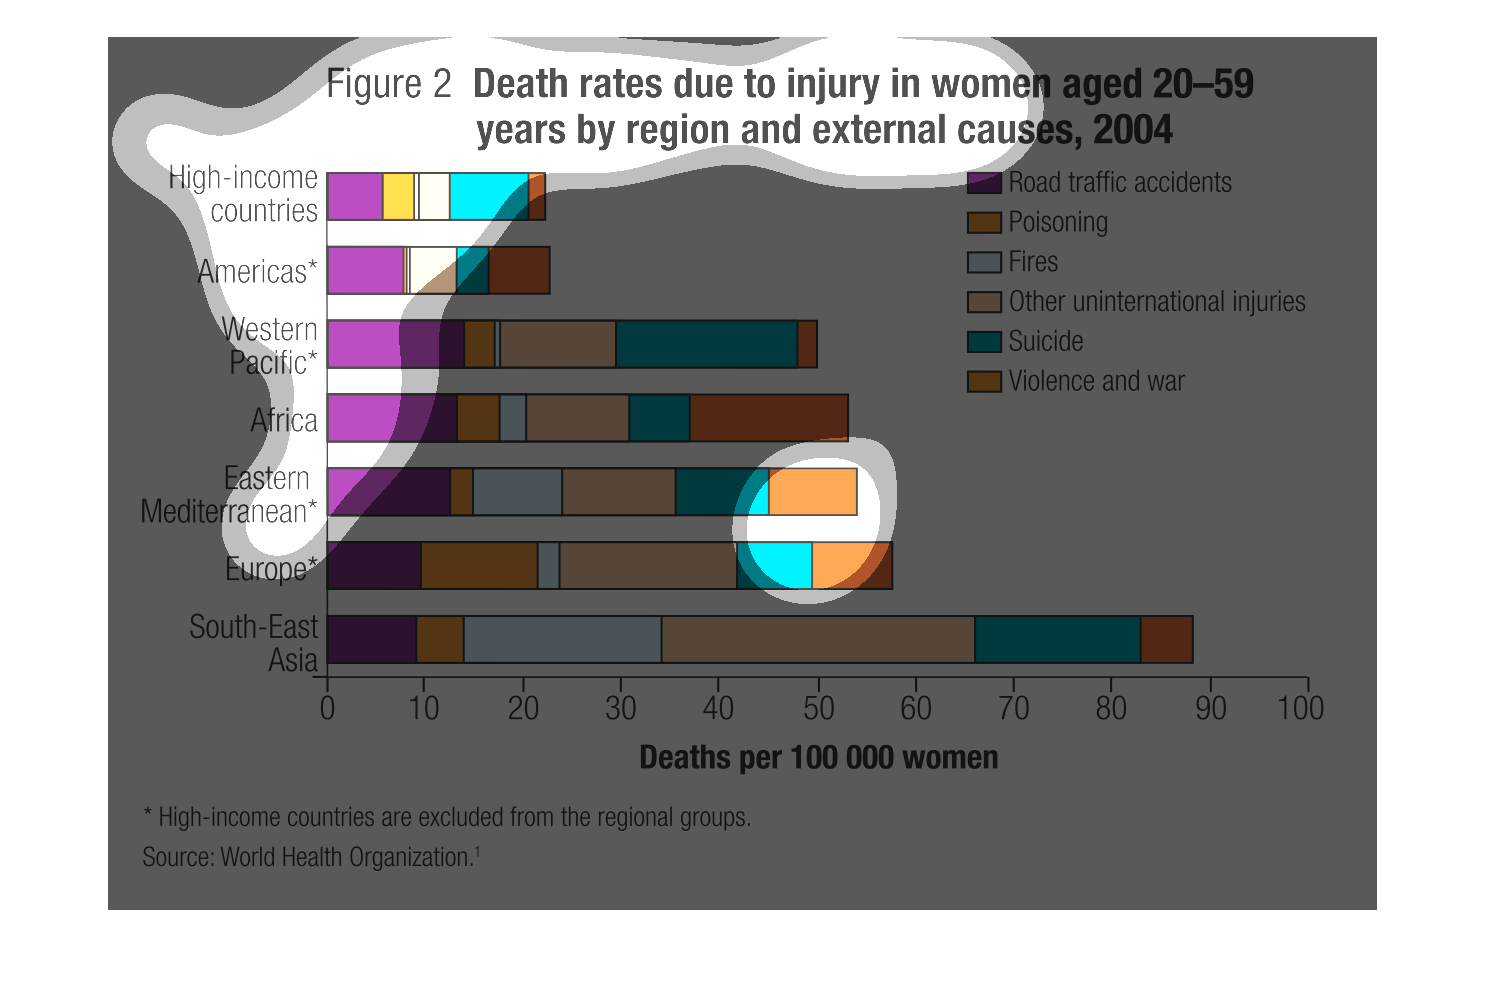
This graph illustrates death rates due to injury in women ages 20 to 59 years by region for
external causes in 2004.  Categories include road traffic accidents, [poison, and fires.
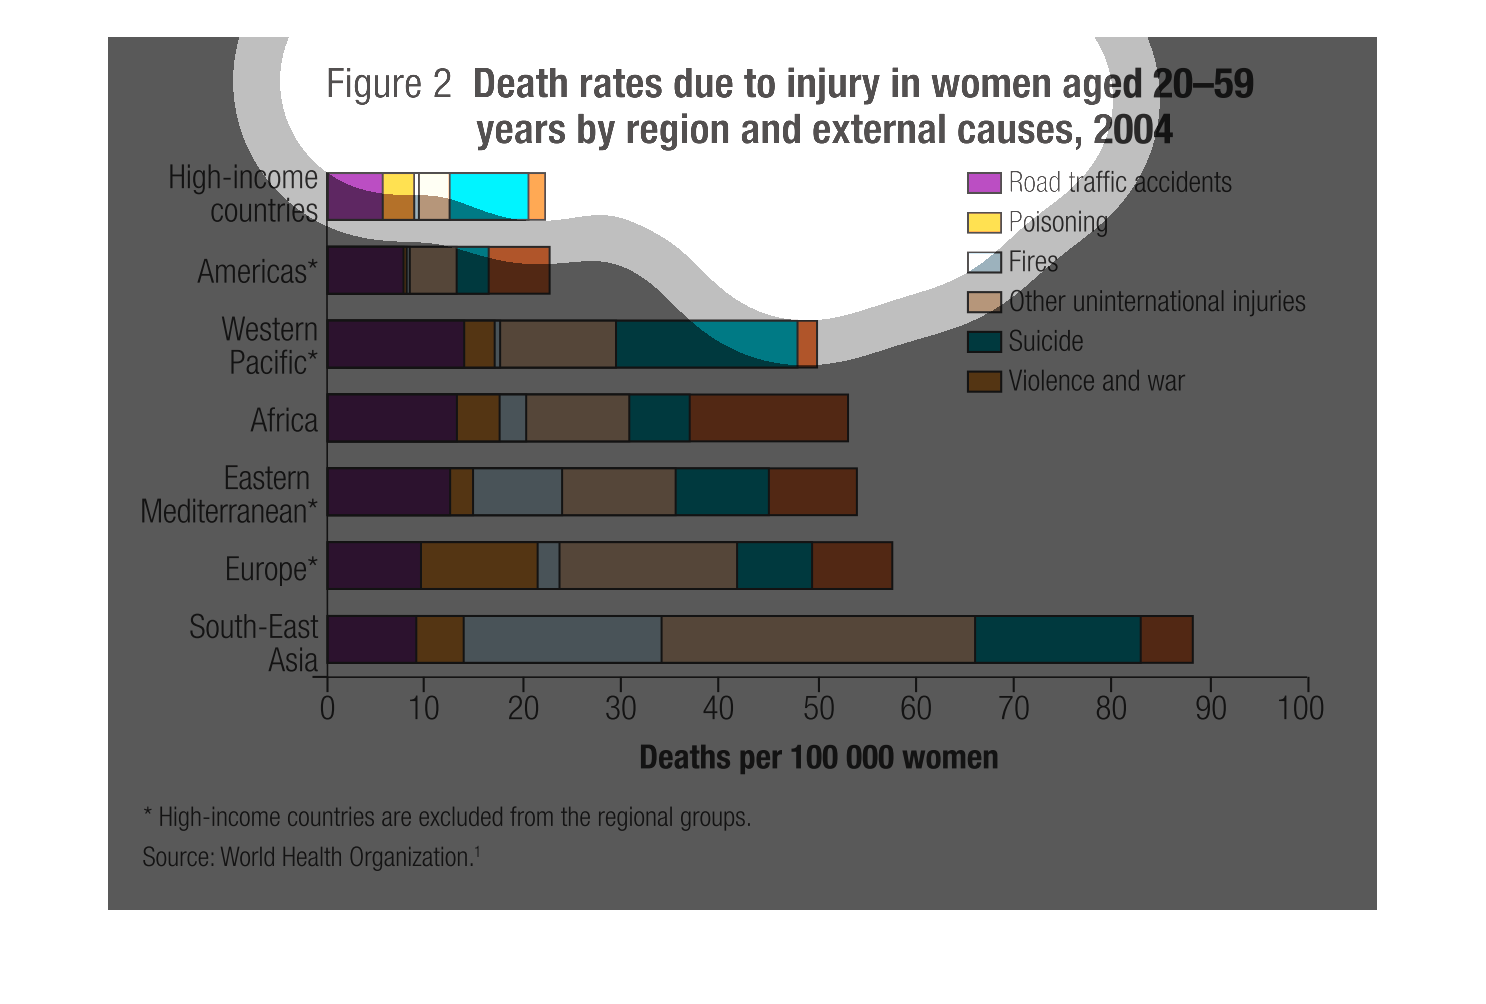
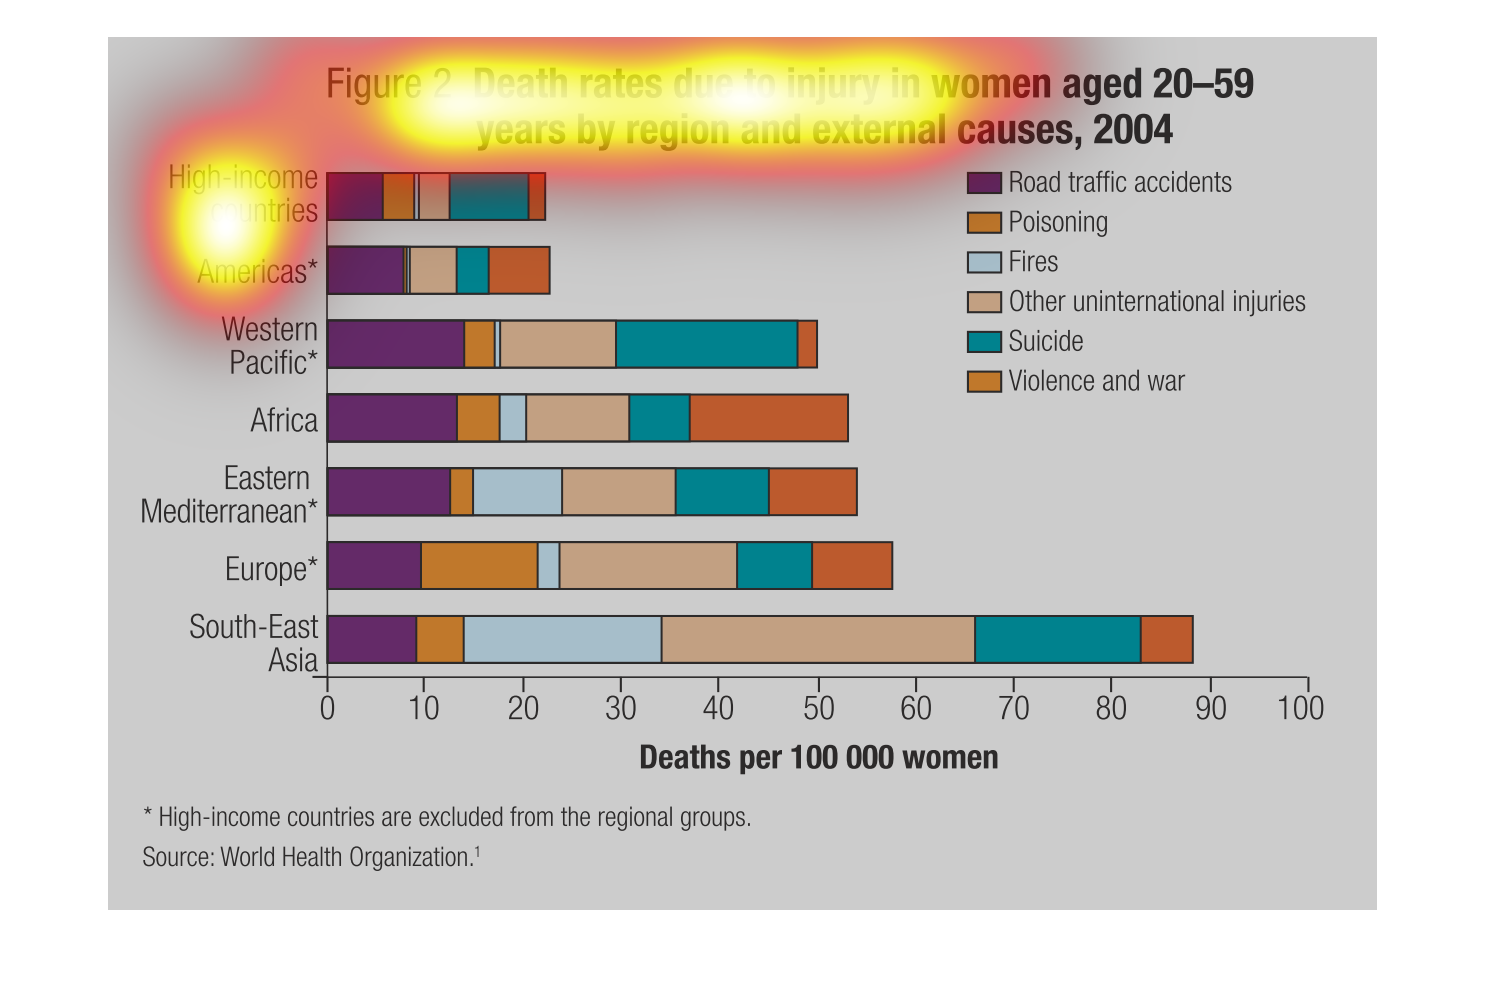
This chart is a representation of death rates due to injury in women aged 20 to 59 years old
by region and external causes.  The data from 2004 and shows multiple death causes.
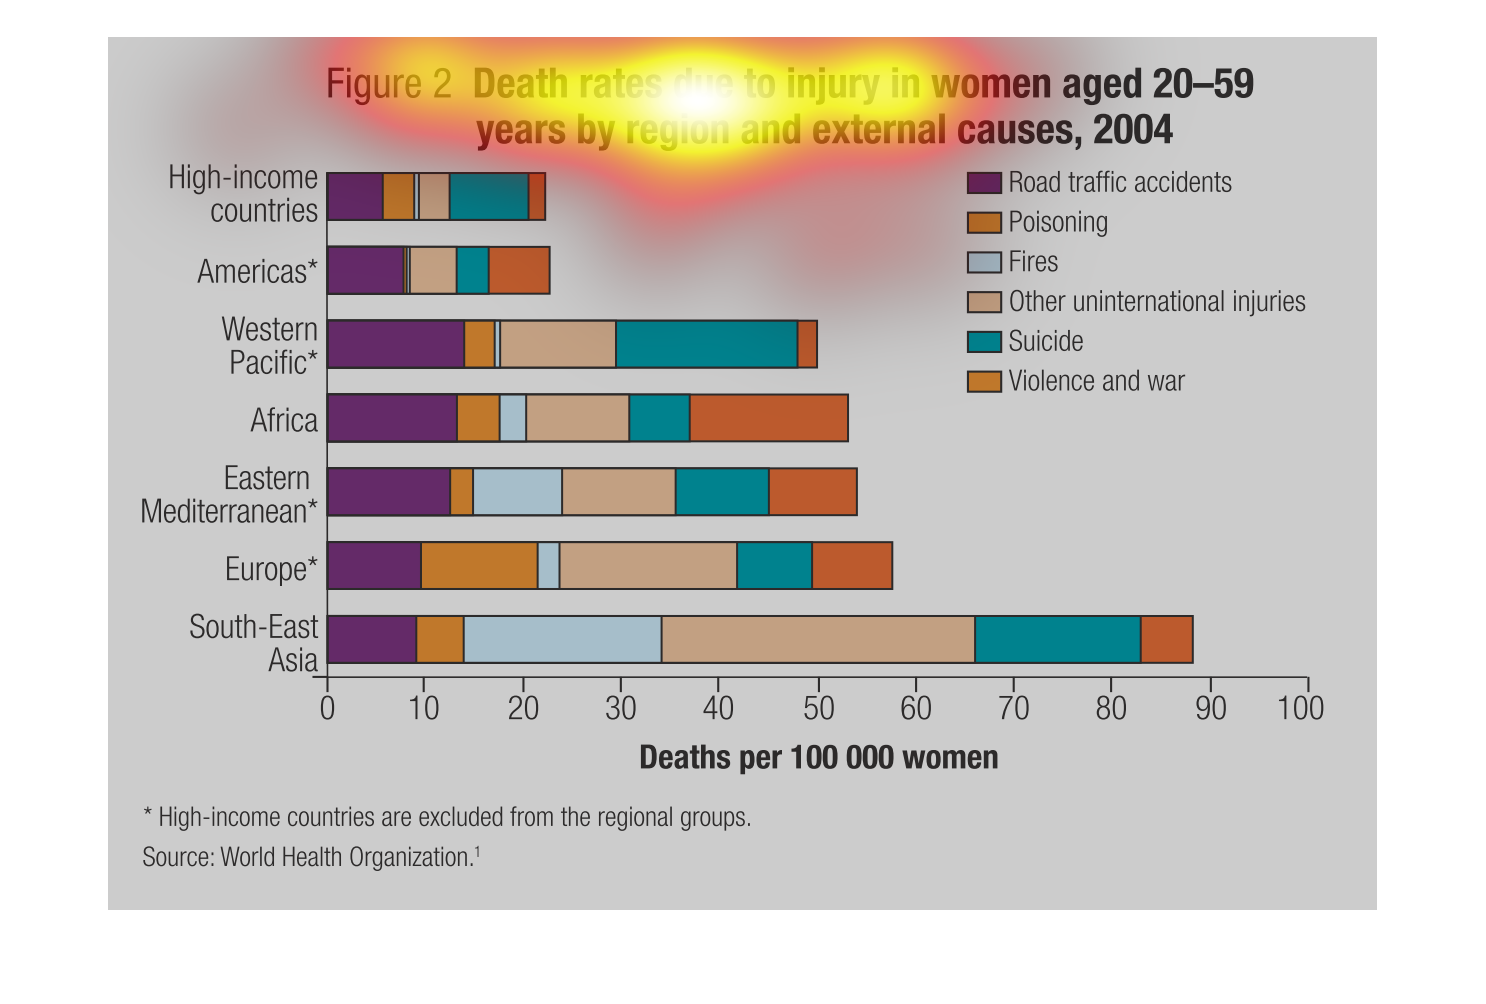
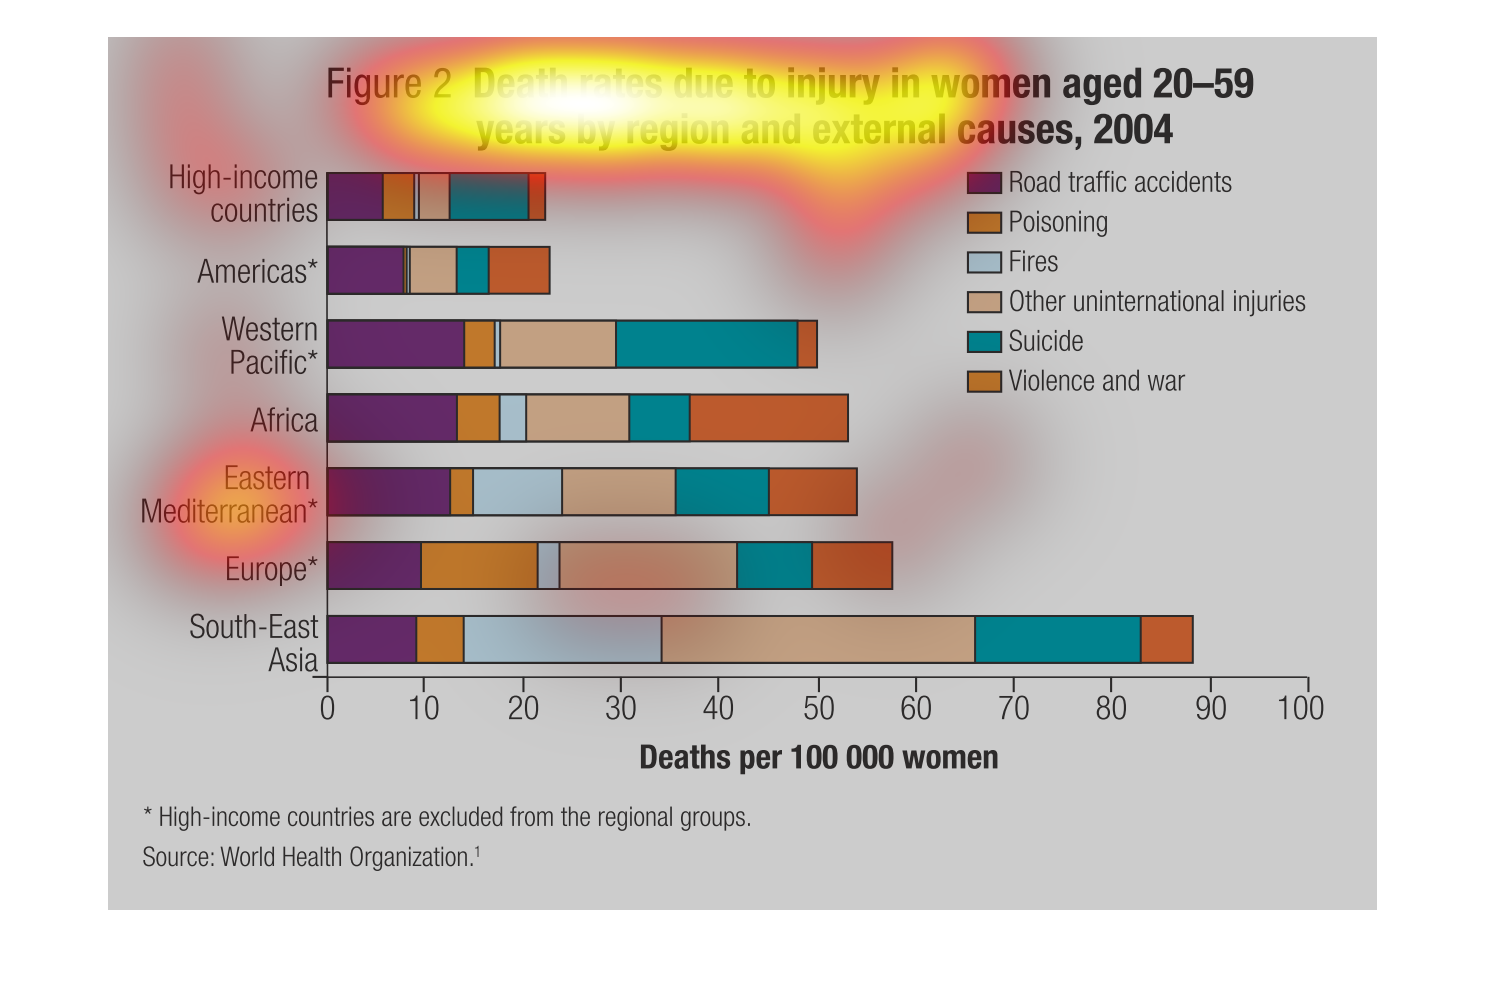
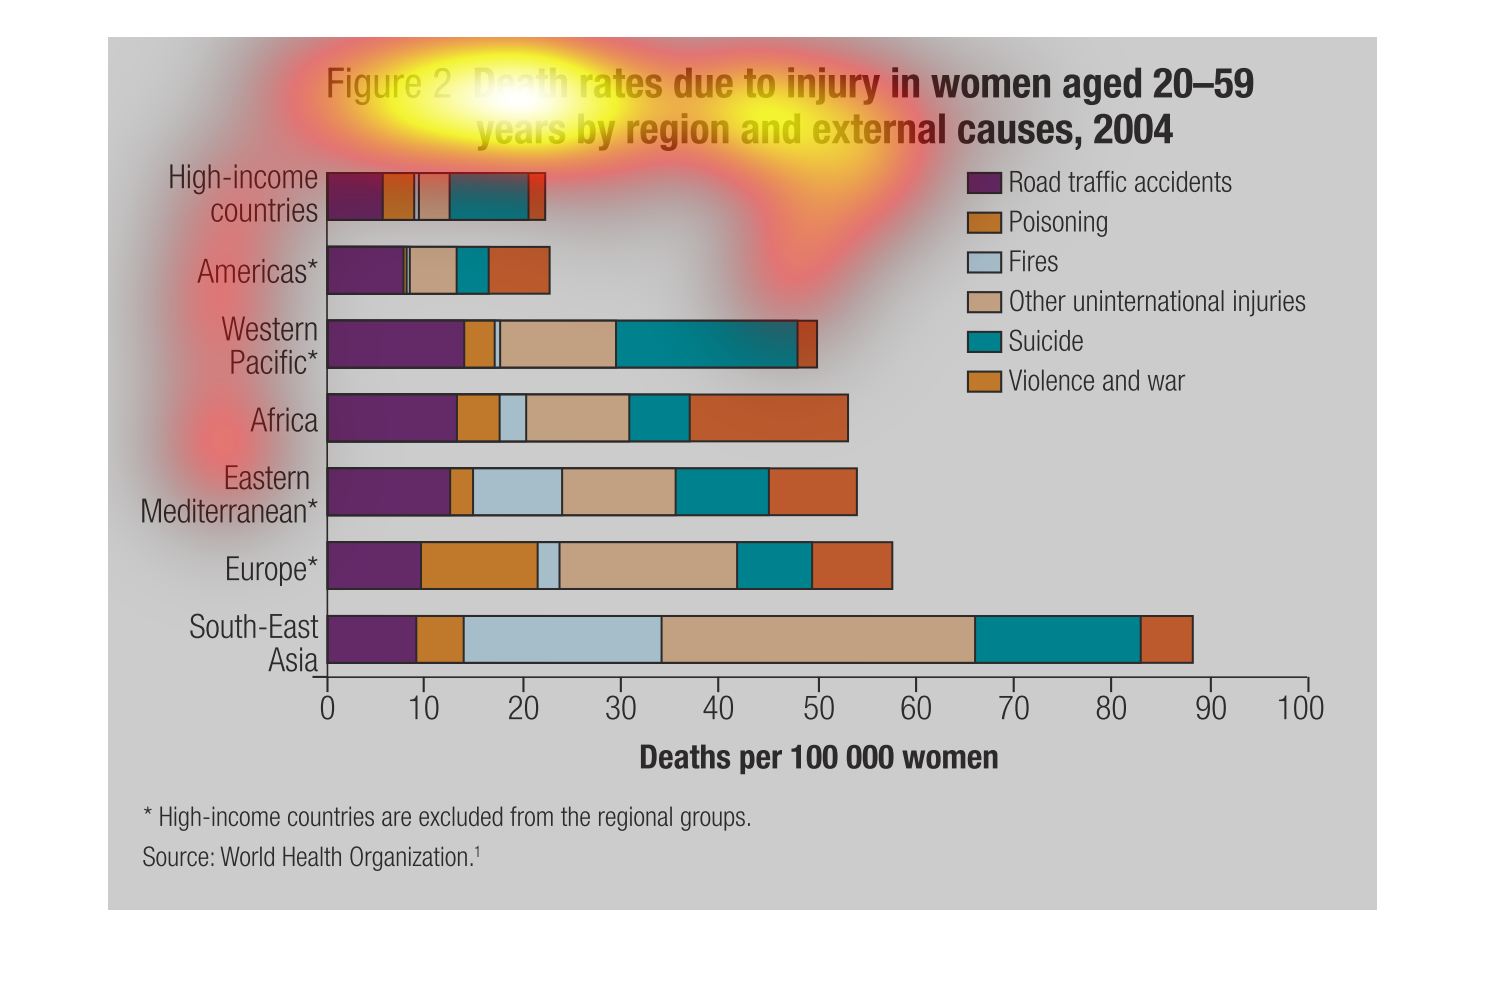
This image is showing a graph of female deaths by a variety of means, accidents to suicides
and different parts of the world, American Europe Asia and Africa was  where this data was
collected.
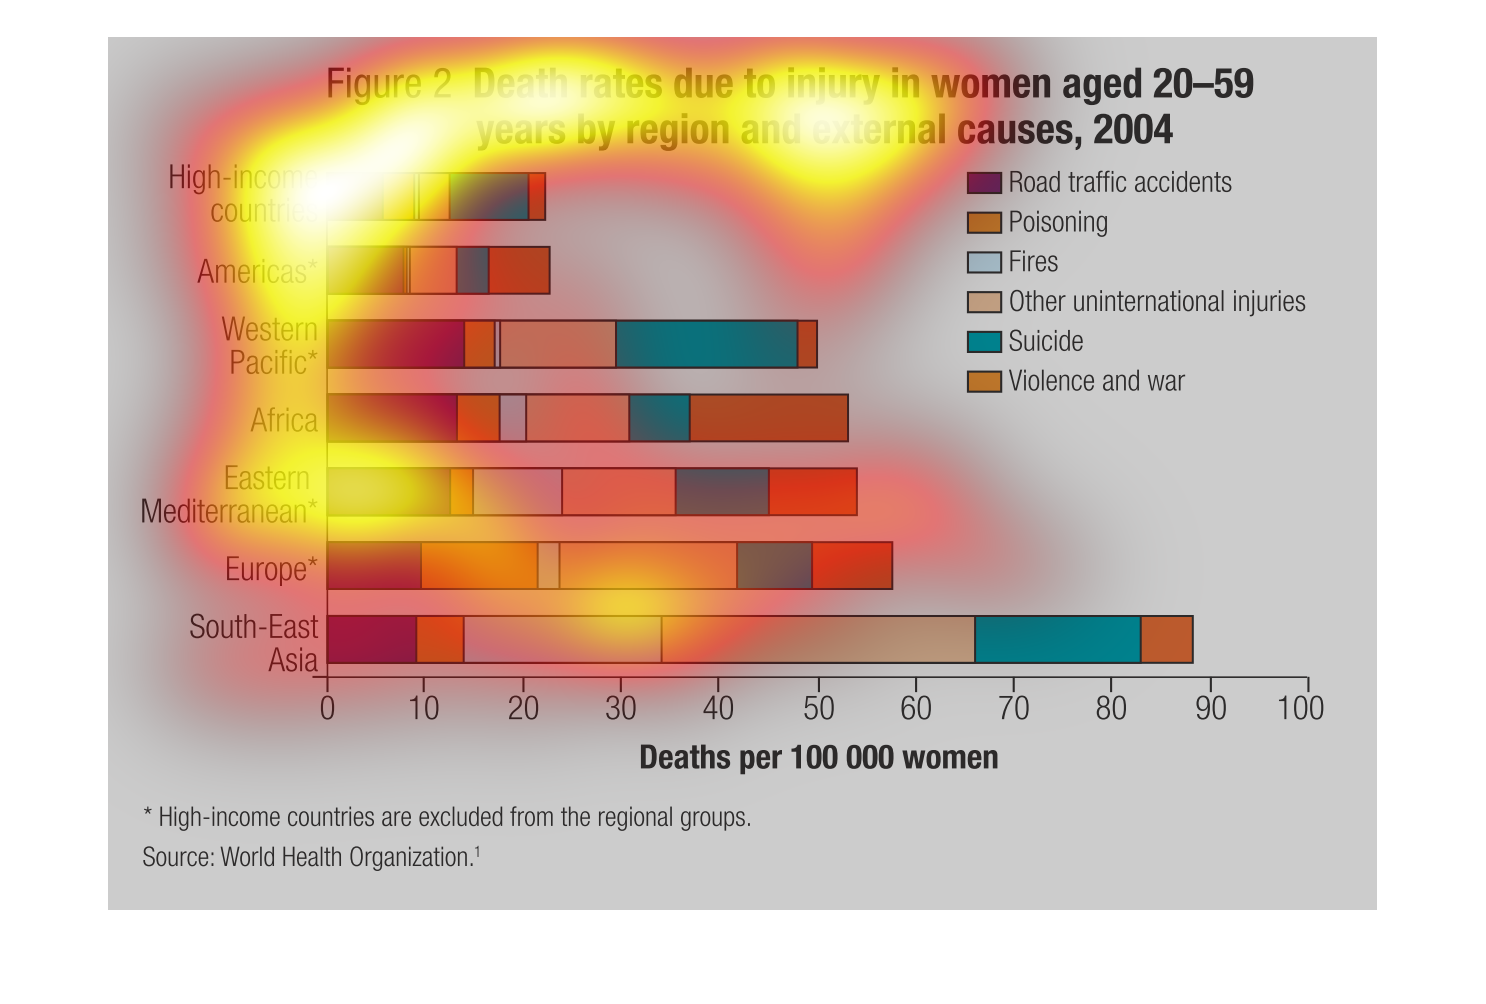
This chart describes death rates due to injury in women aged 20-59 years by region and external
causes, for the year 2004. Categories include Western Pacific.
This bar chart shows the Death rates due to injury in Women aged 20-59 for the years by regions
and external causes for the year of 2004. This was a very interesting chart.
The following chart gives the mortality rate of women in death caused by accidents. It gives
the data with women whose ages fall between twenty nine years of age and fifty nine years
of age.
The many faces of this, this graphic demonstrates the various mortality rates between women
between the ages of 20-59 and the various causes of said deaths.
It shows the death rates of women due to external injuries from 2004 from different parts
of the world. It also breaks down the different external causes for each part of the world
that is listed.