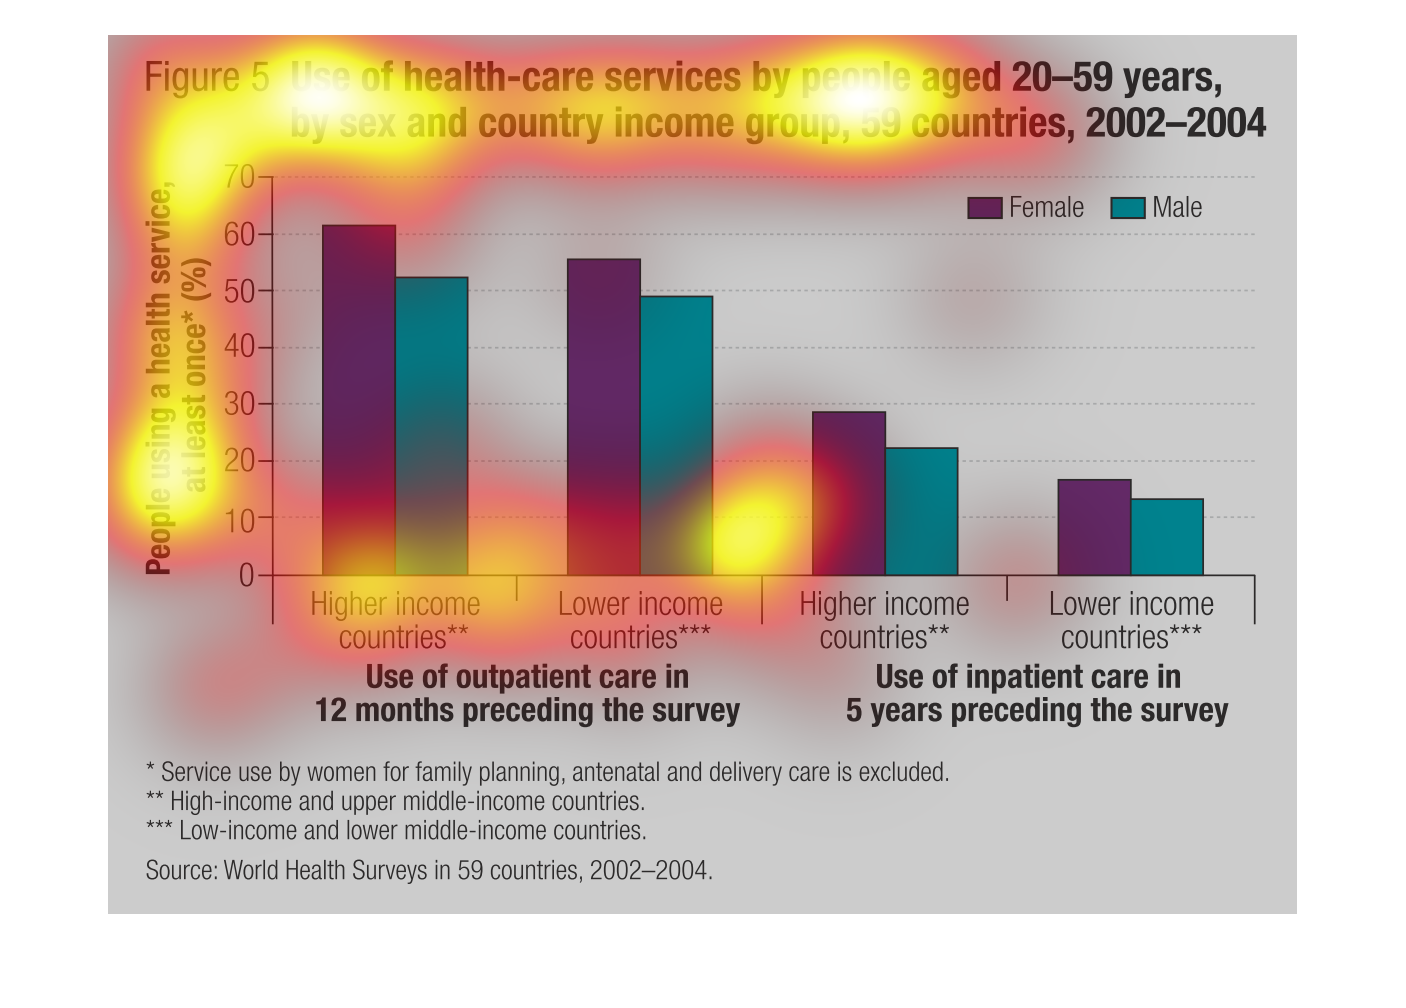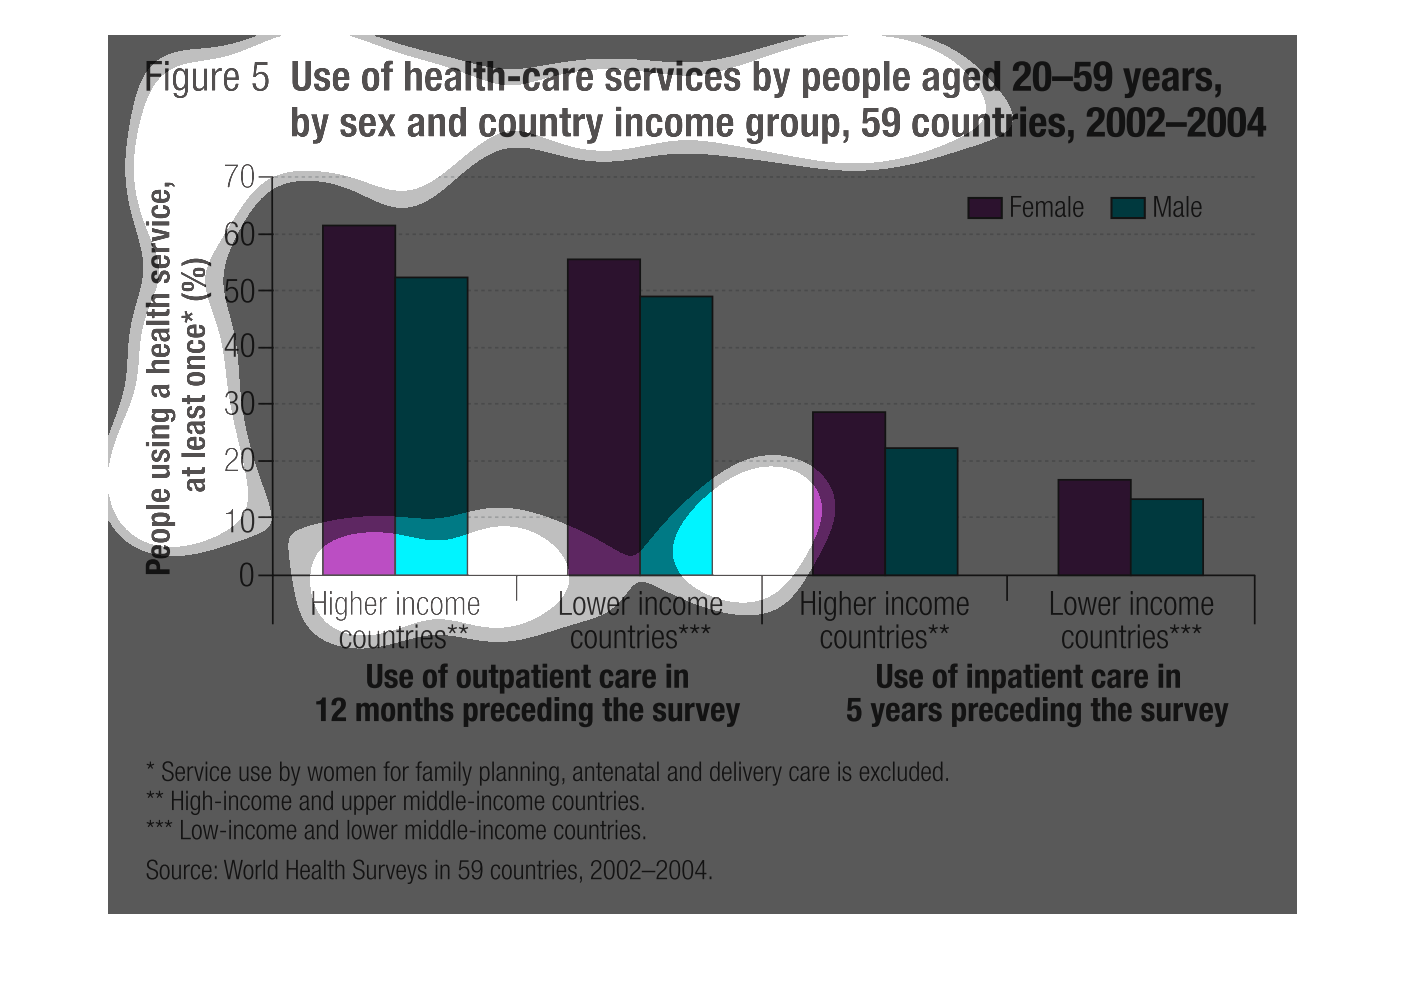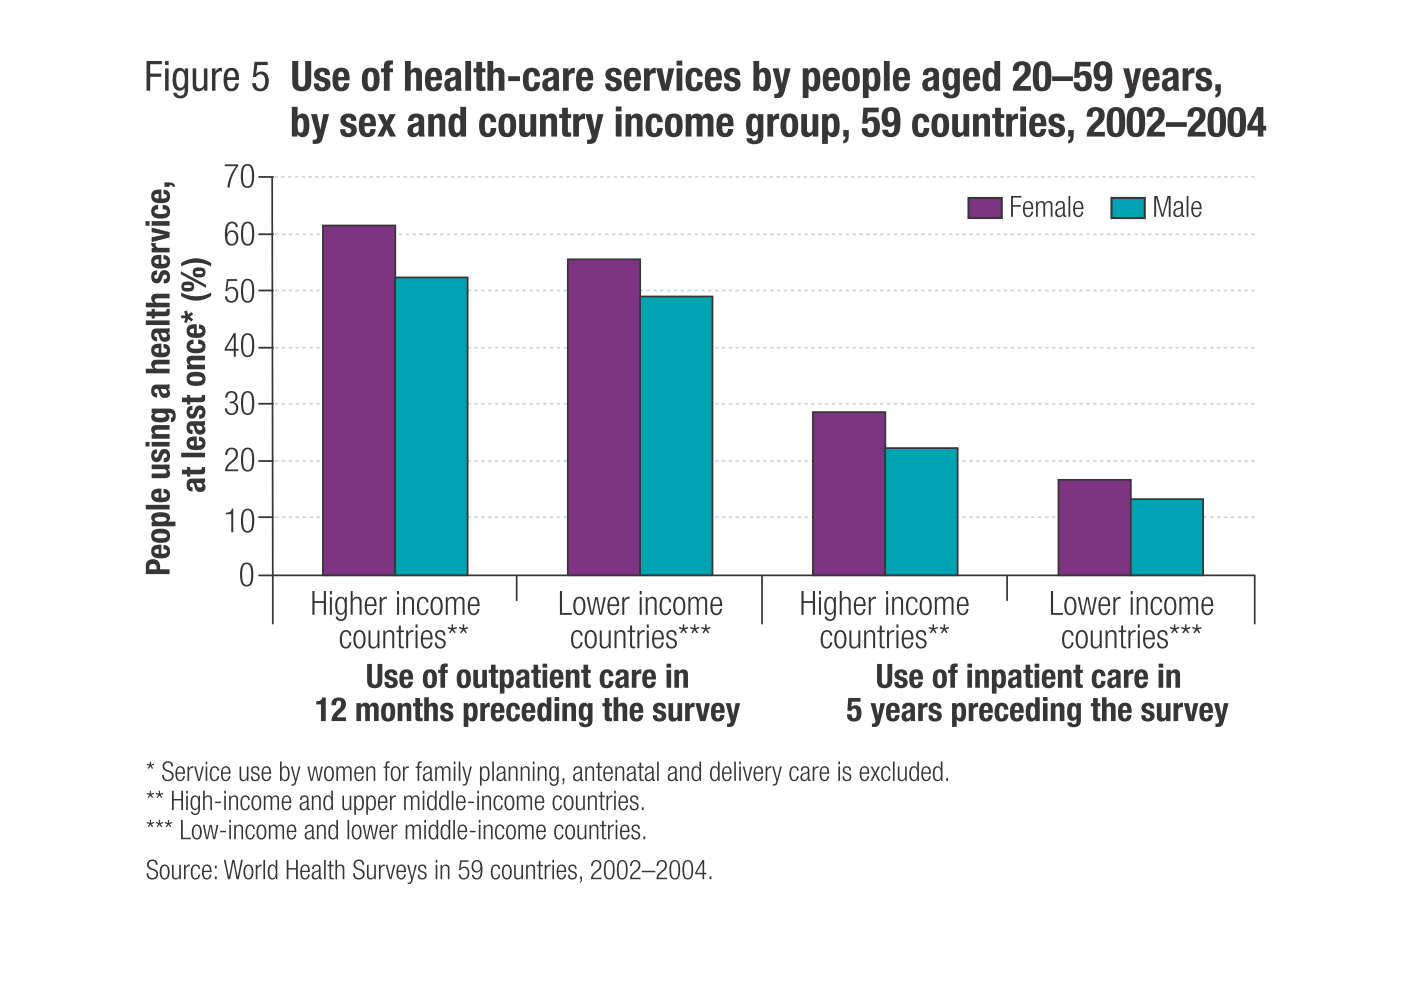
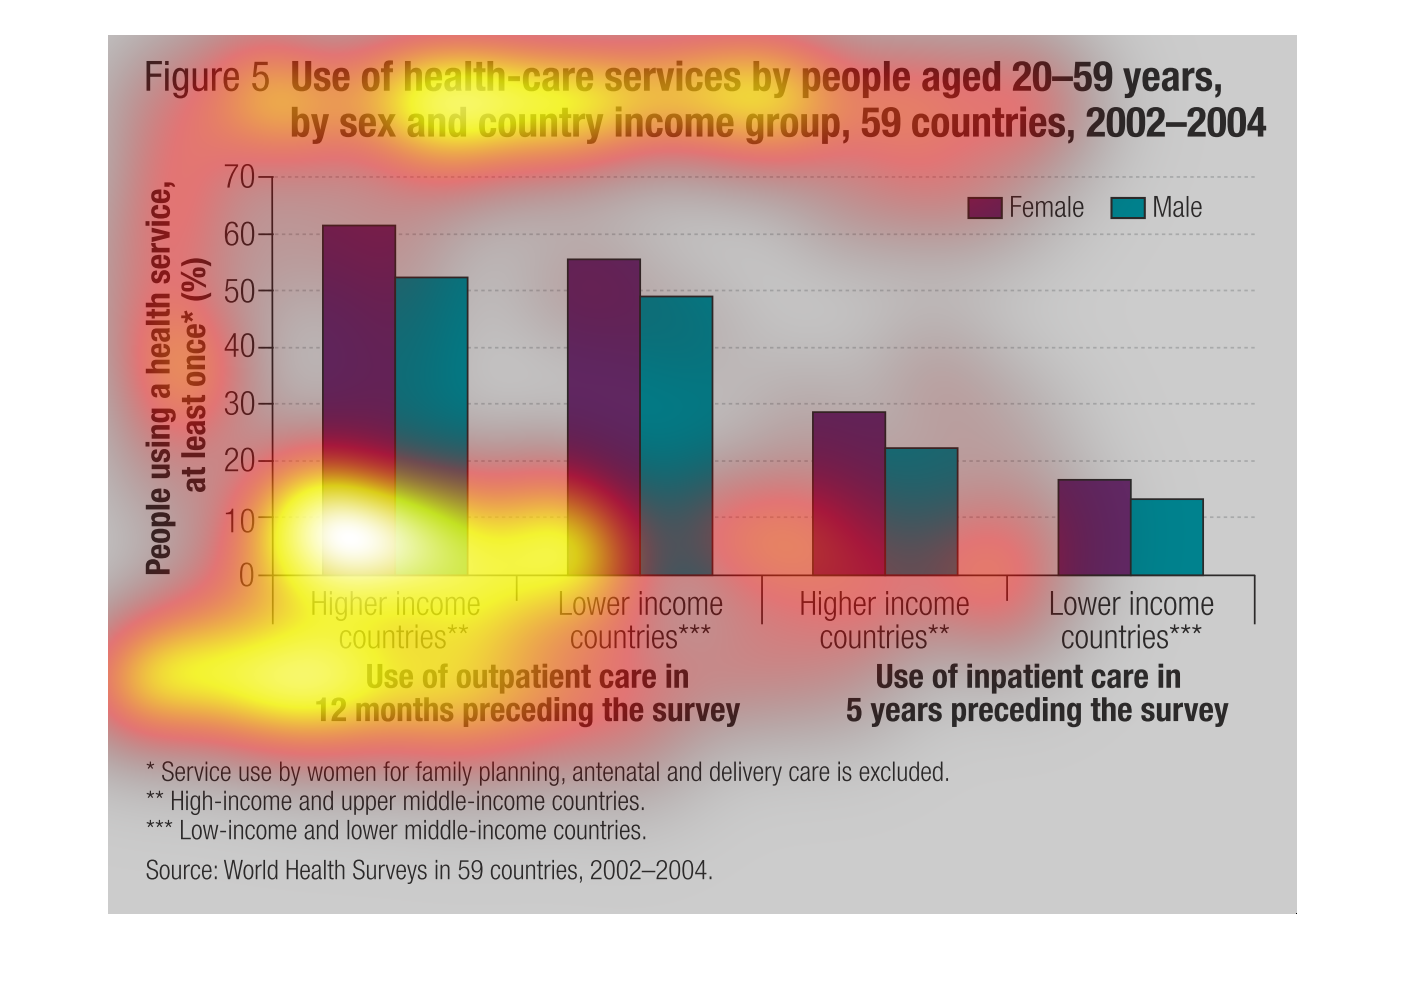
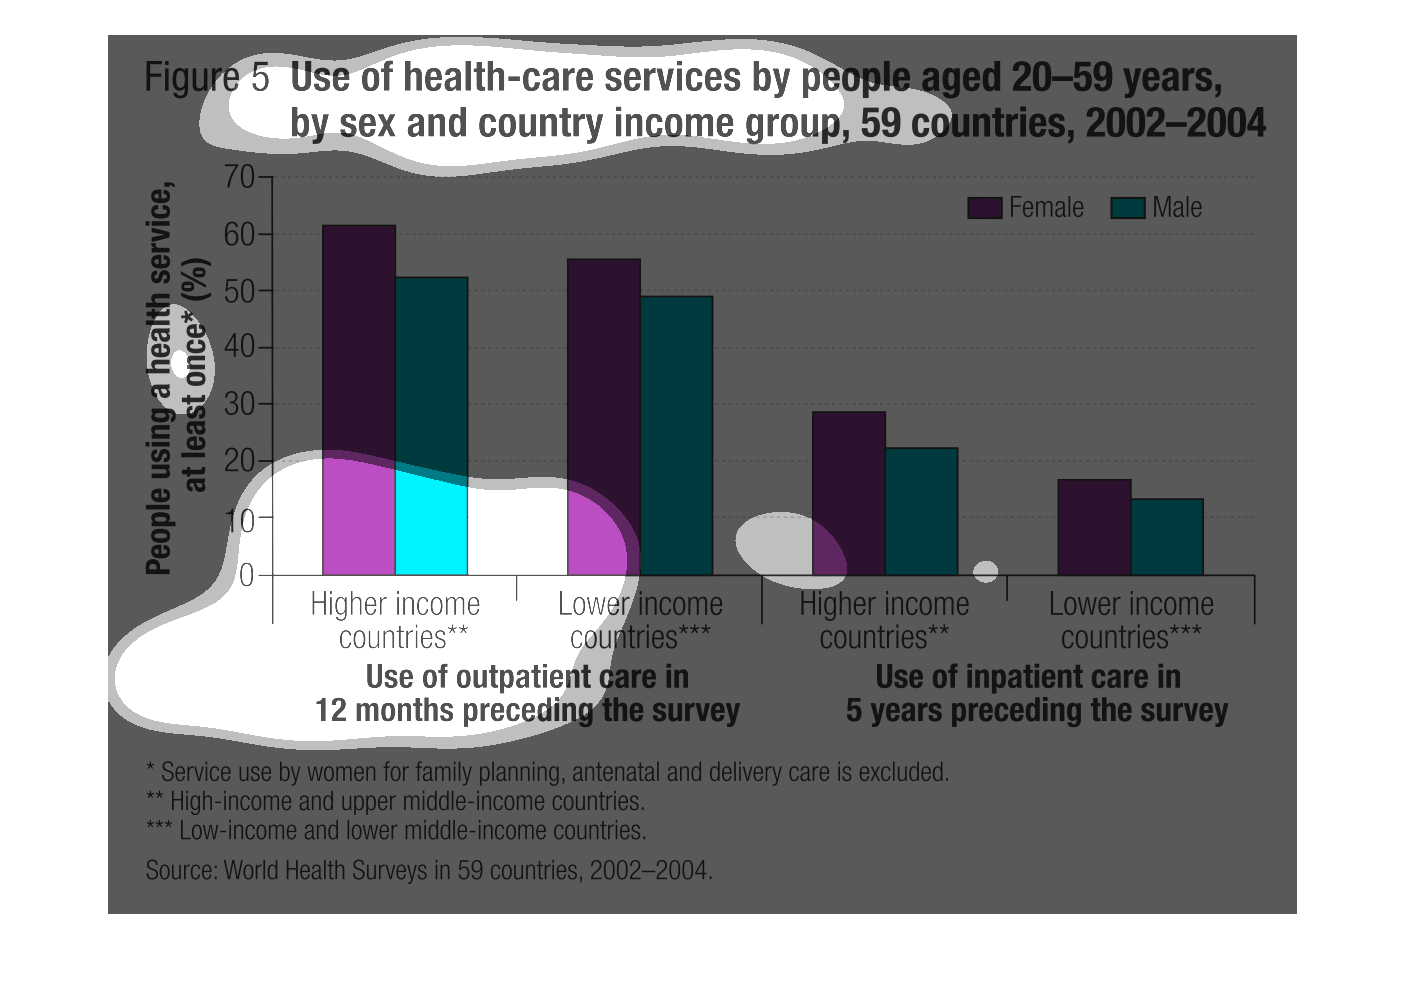
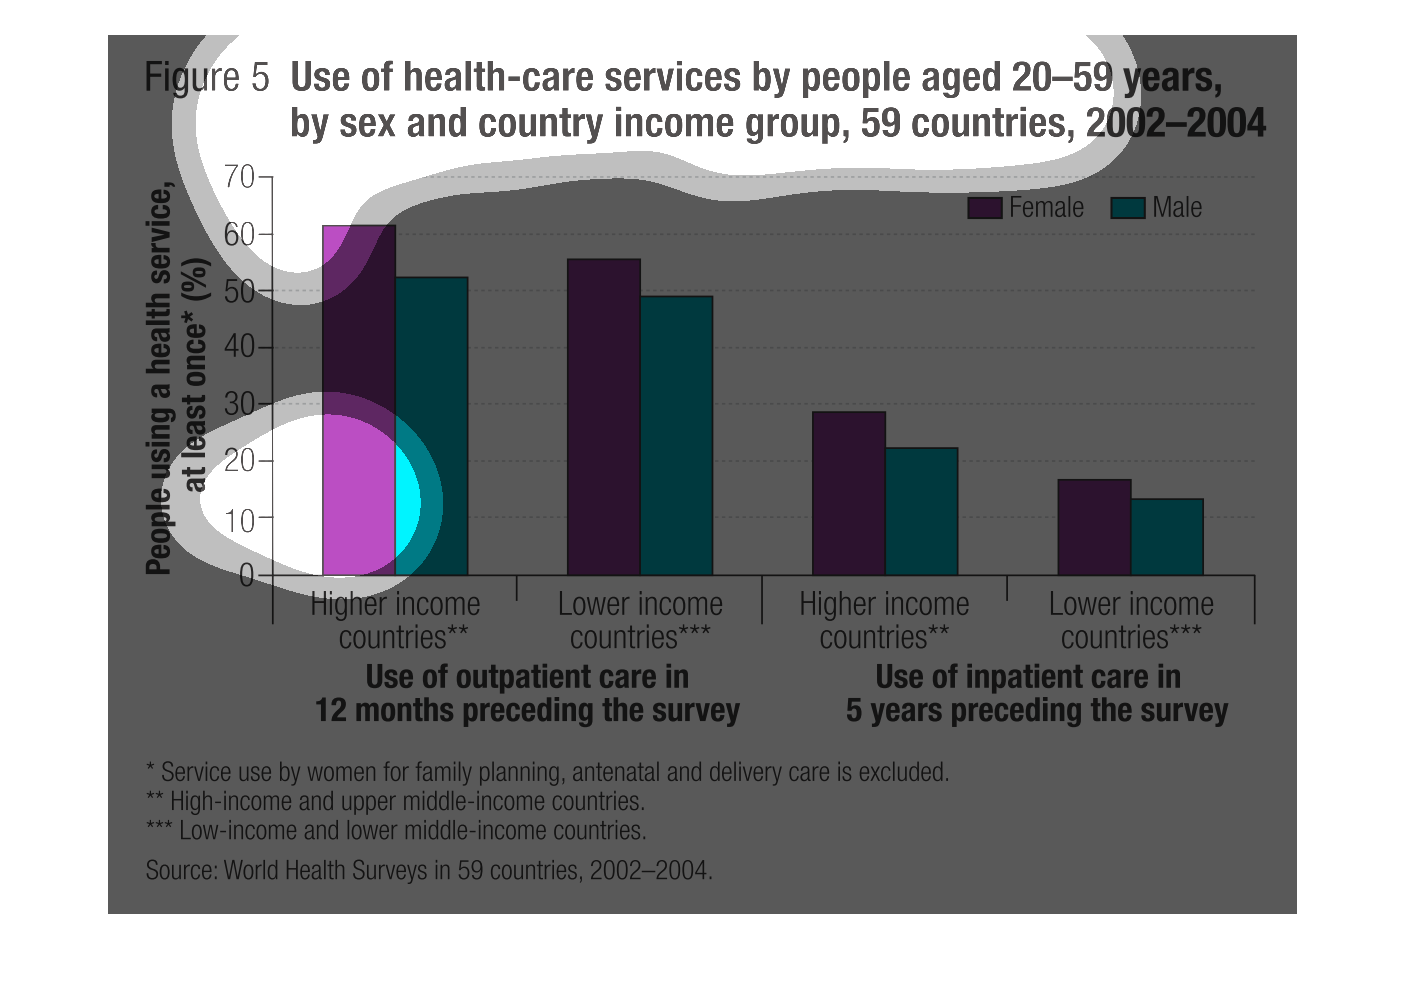
This chart is comparing the data for the use of health-care services by people aged 20-59
years, by sex and country income group, for 59 countries through the years 2002-2004. The
chart shows that females in both higher income and lower income countries spend more time
in inpatient and outpatient care than males. It also shows that both males and females in
higher and lower income countries receive more outpatient care than inpatient care. However,
the higher income countries are the ones who receive the most care.
This chart describes and depicts the use of health-care services from people aged twenty to
fifty-nine years of age by sex as well as by country of origin.
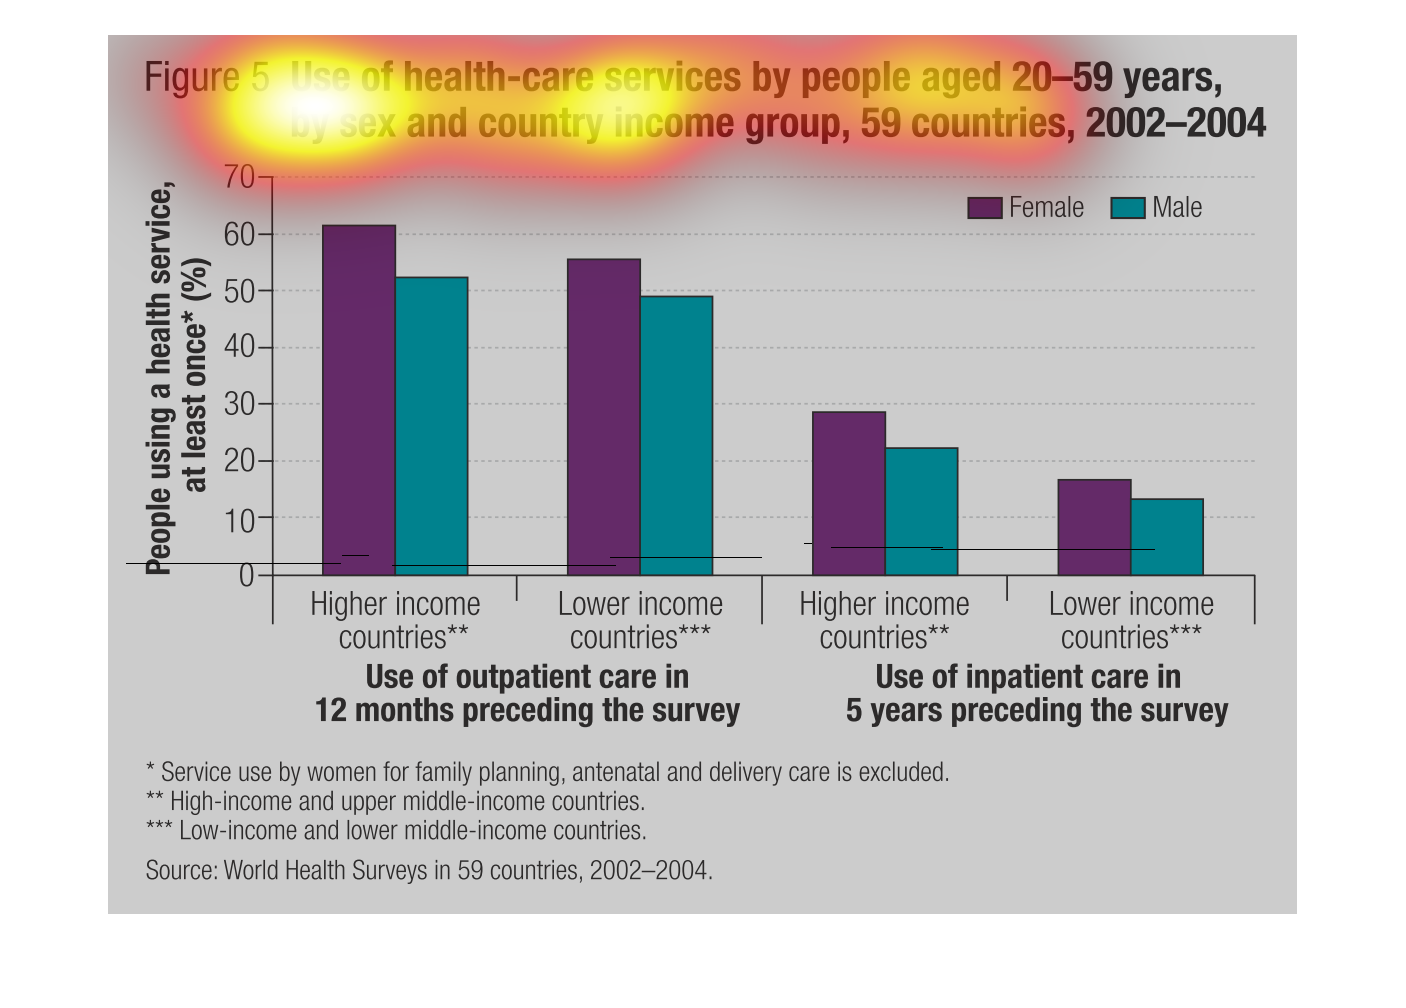
This is a graph depicting the use of healthcare services by people aged 20-59 years by sex
and country and income group throughout 59 countries from 2002 to 2004.
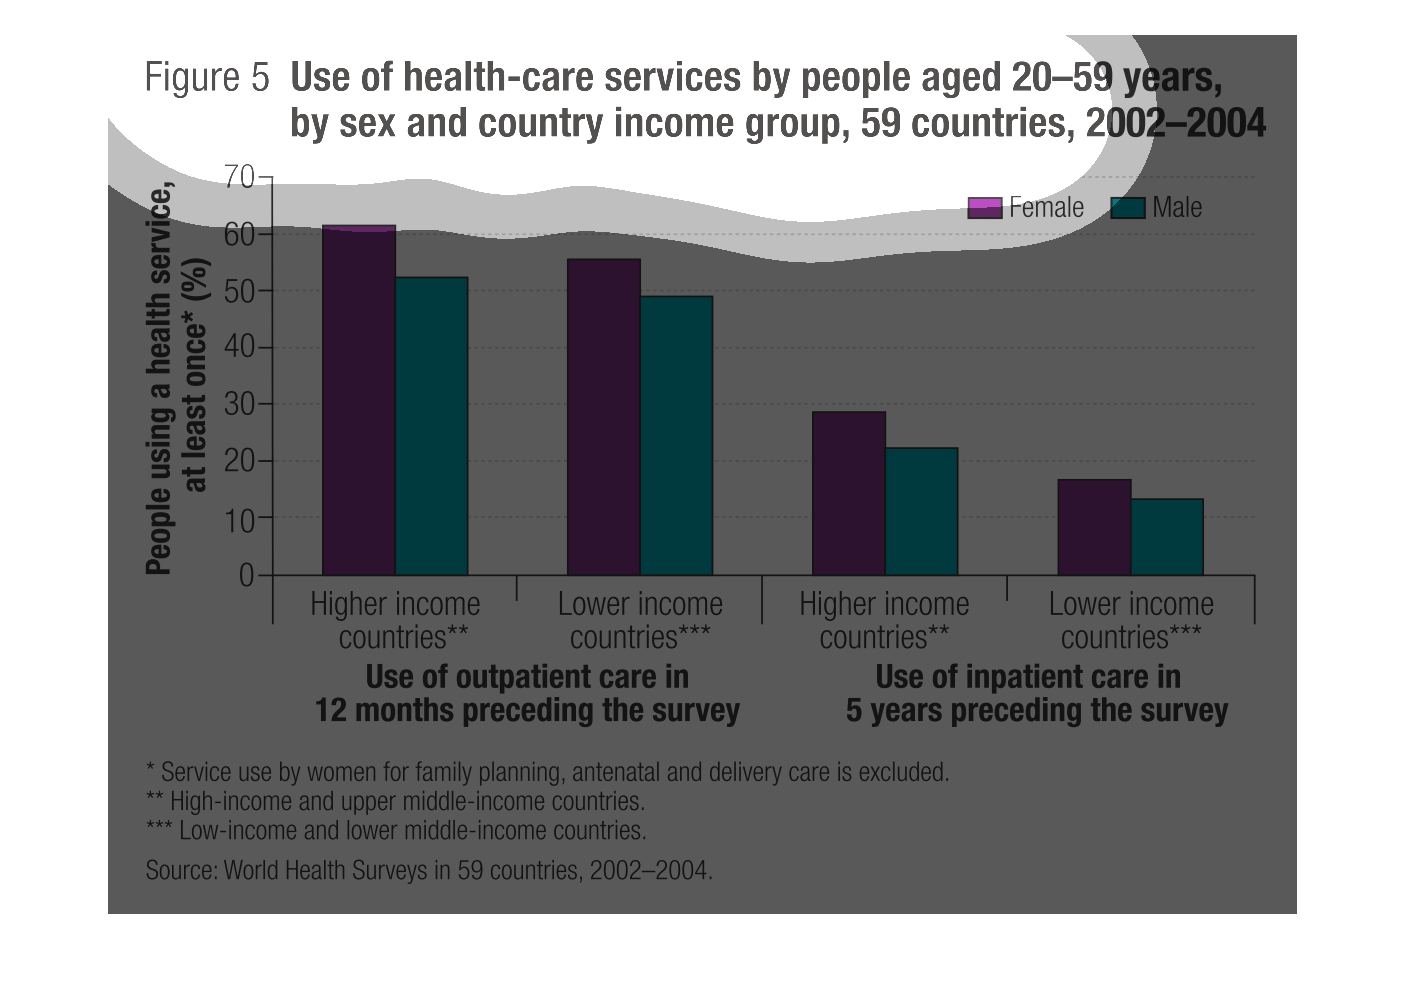
This graph shows the use of health care services by people aged 20-59 years by sex and country
income group. There are 59 countries represented from 2002 to 2004. The graph is also divided
up by male and female. Females always have higher numbers.
This chart describes use of health care services by people aged 20-59 years, by sex and country
income group in 59 countries for the years 2002 through 2004.
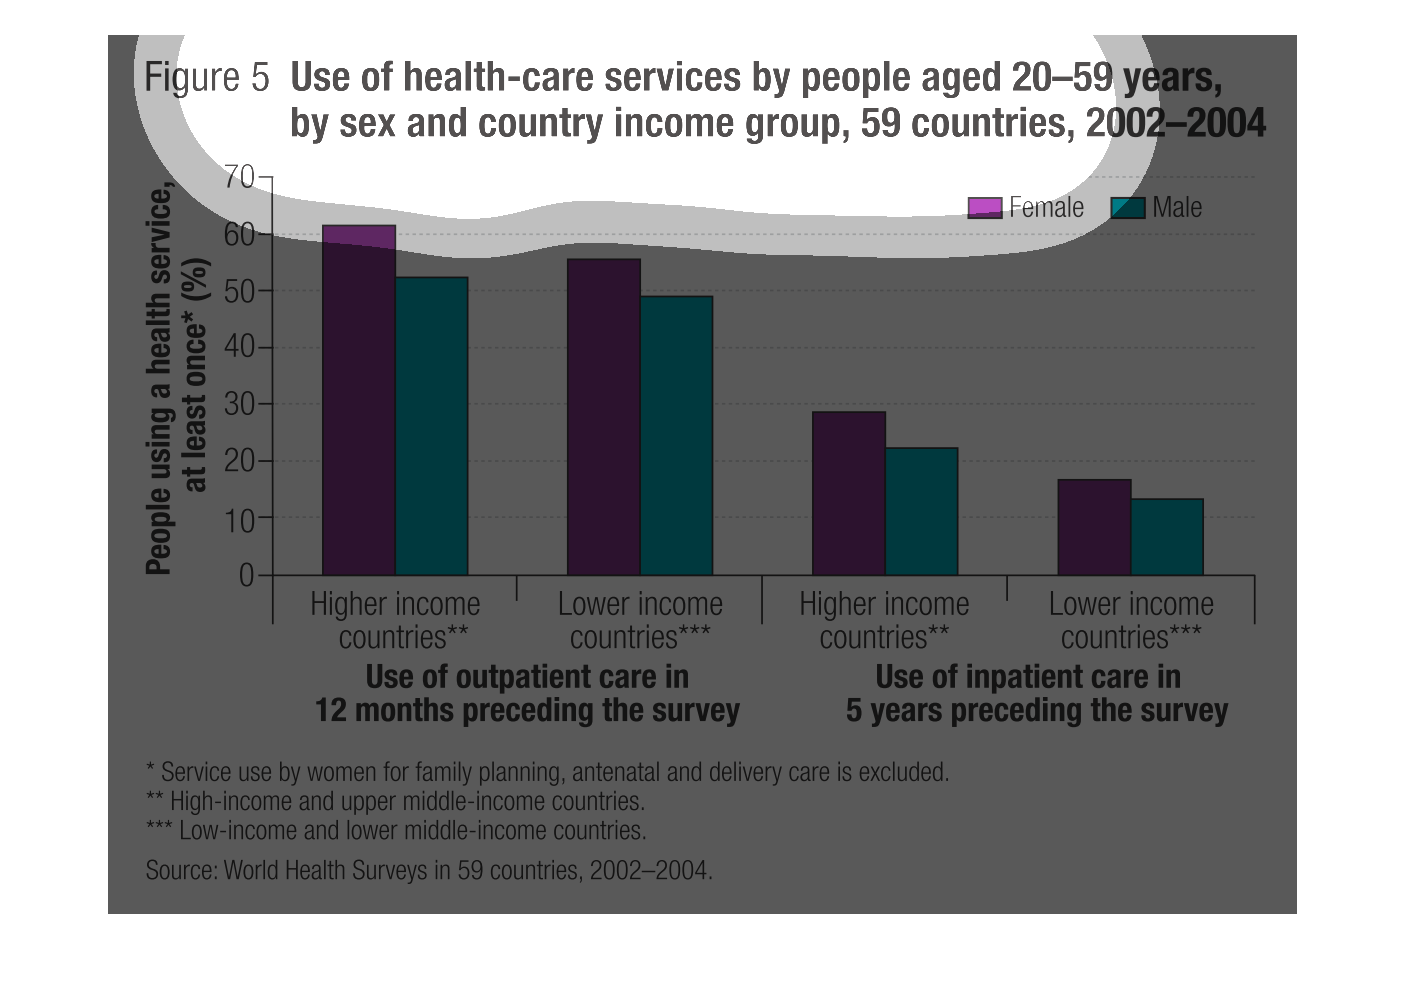
The image depicts a bar graph of use of healthcare services by people aged 20-59 years, by
sex and country income group. 50 countries are included, data is from 2002-2004, percentages
are listed. Both outpatient and inpatient care is cited in the bar graph, outpatient care
by 12 month preceding the survey and inpatient care preceding 5 years preceding the survey.
The data shows that higher-income countries tend to have higher healthcare usage by patients.
Source is World Health Surveys in 59 countries.
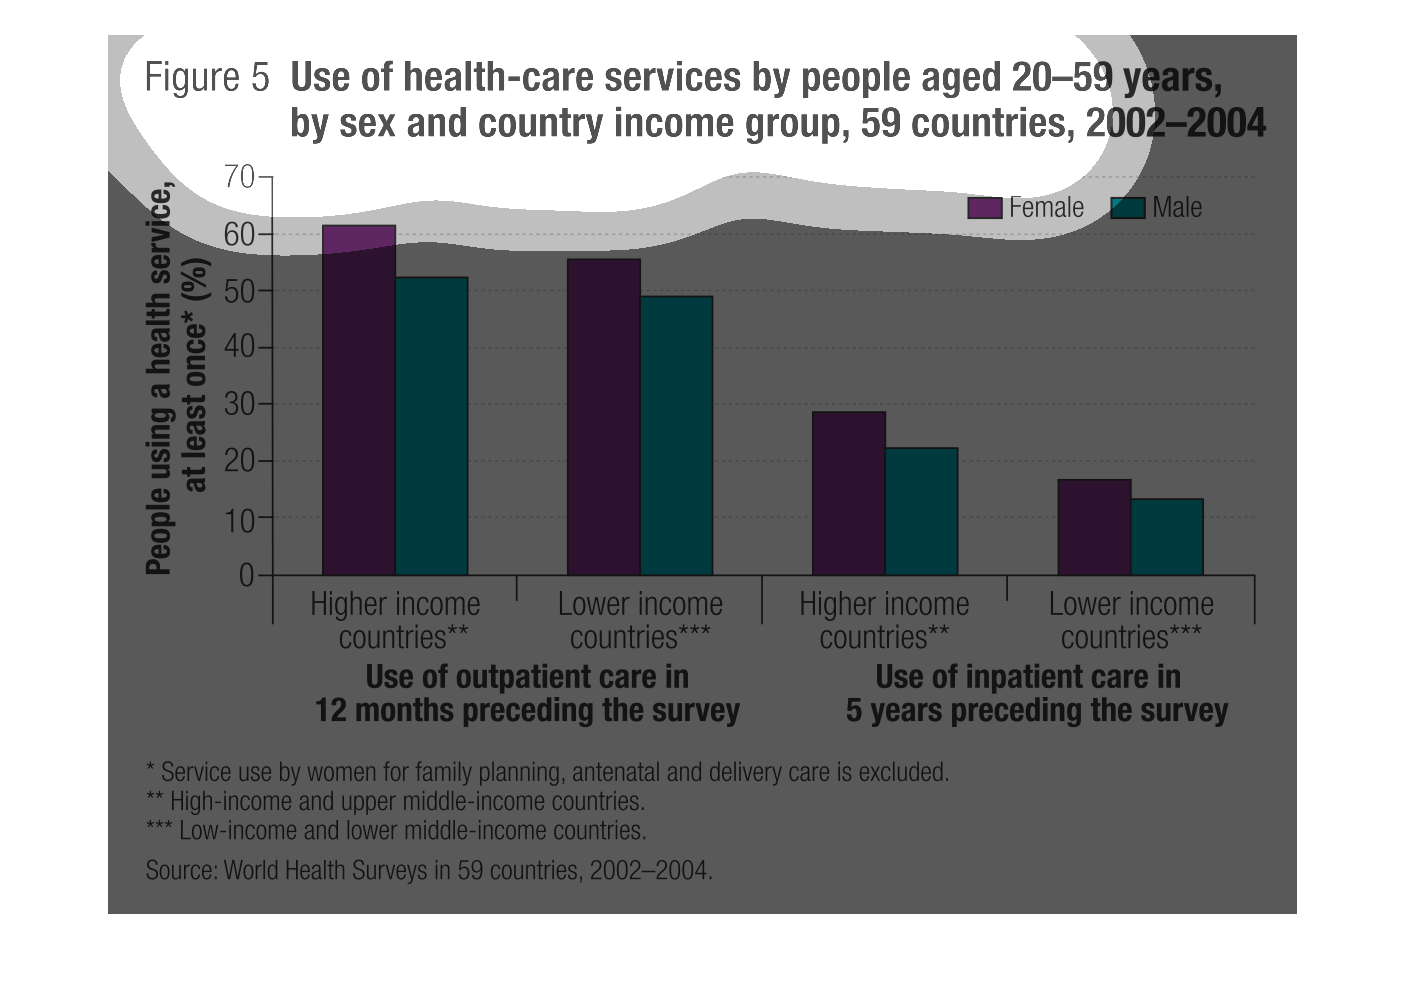
The image is a graph about the Use of Healthcare services by people 20-59 years old, gender,
and country income group from 2002 to 2004. Higher income countries use for health care services
than lower income countries.
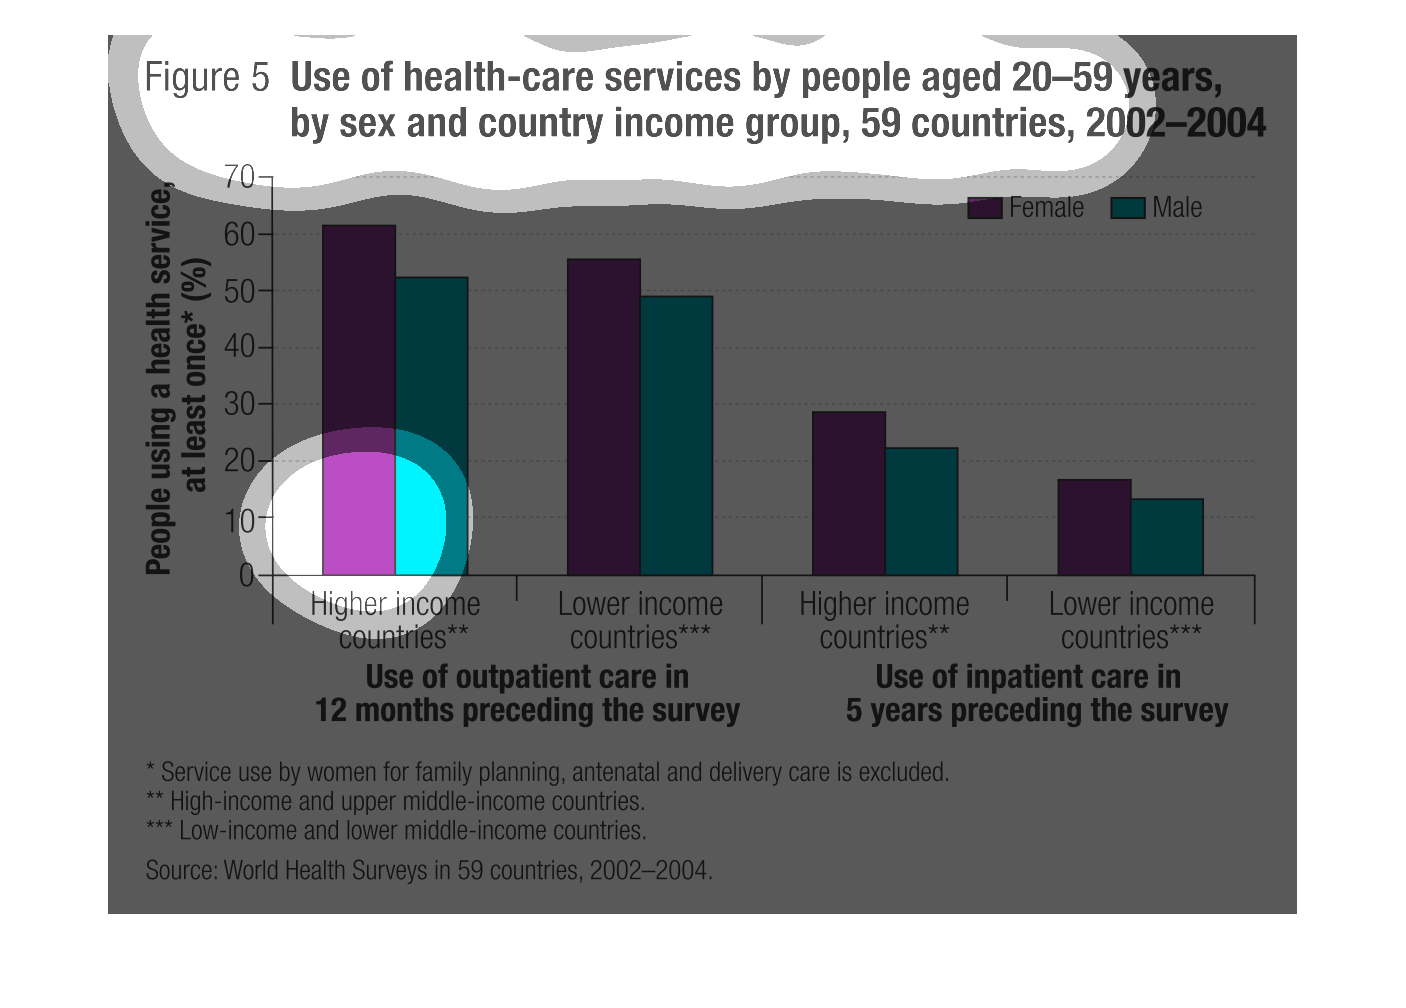
This graph illustrates the use of health care services by people age 20 to 50 years old by
income group from 2002 to 2004.  It compares males and females use of heatlh care by income
level.
Graph showing people aged 20-59 years of age who use health care services in 2002-2004. Broken
down by income levels & gender. Seems to be implying that people who have a higher income
go for more medical/outpatient services than lower income. Reasons that are woman-only (is
pregnancy, etc) are not included.
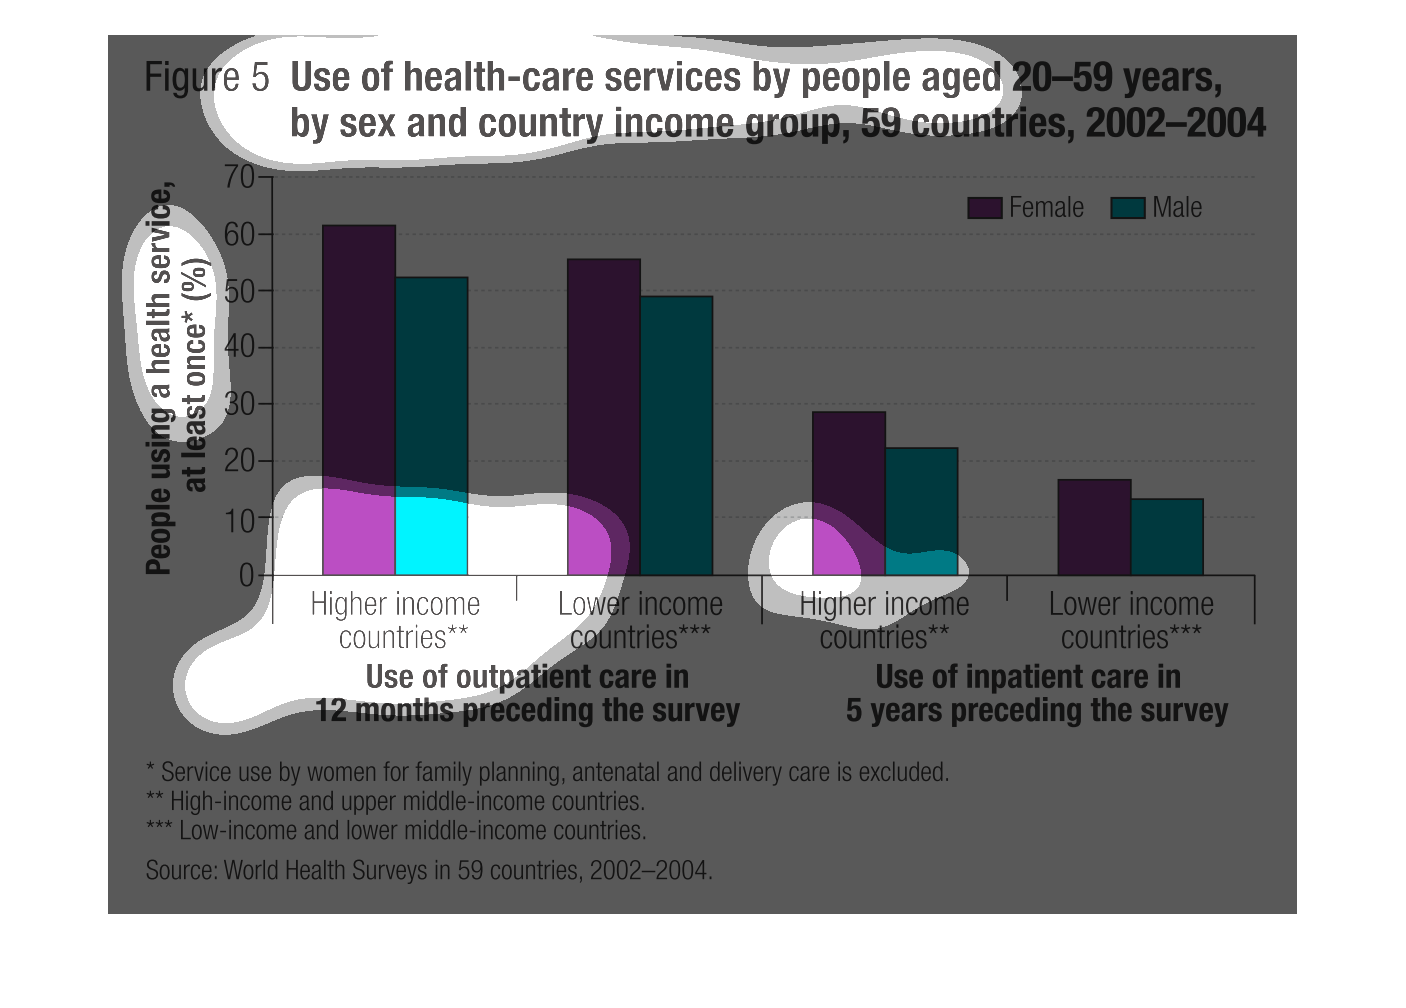
This graph compares how different age groups of people use medical services divided my gender.
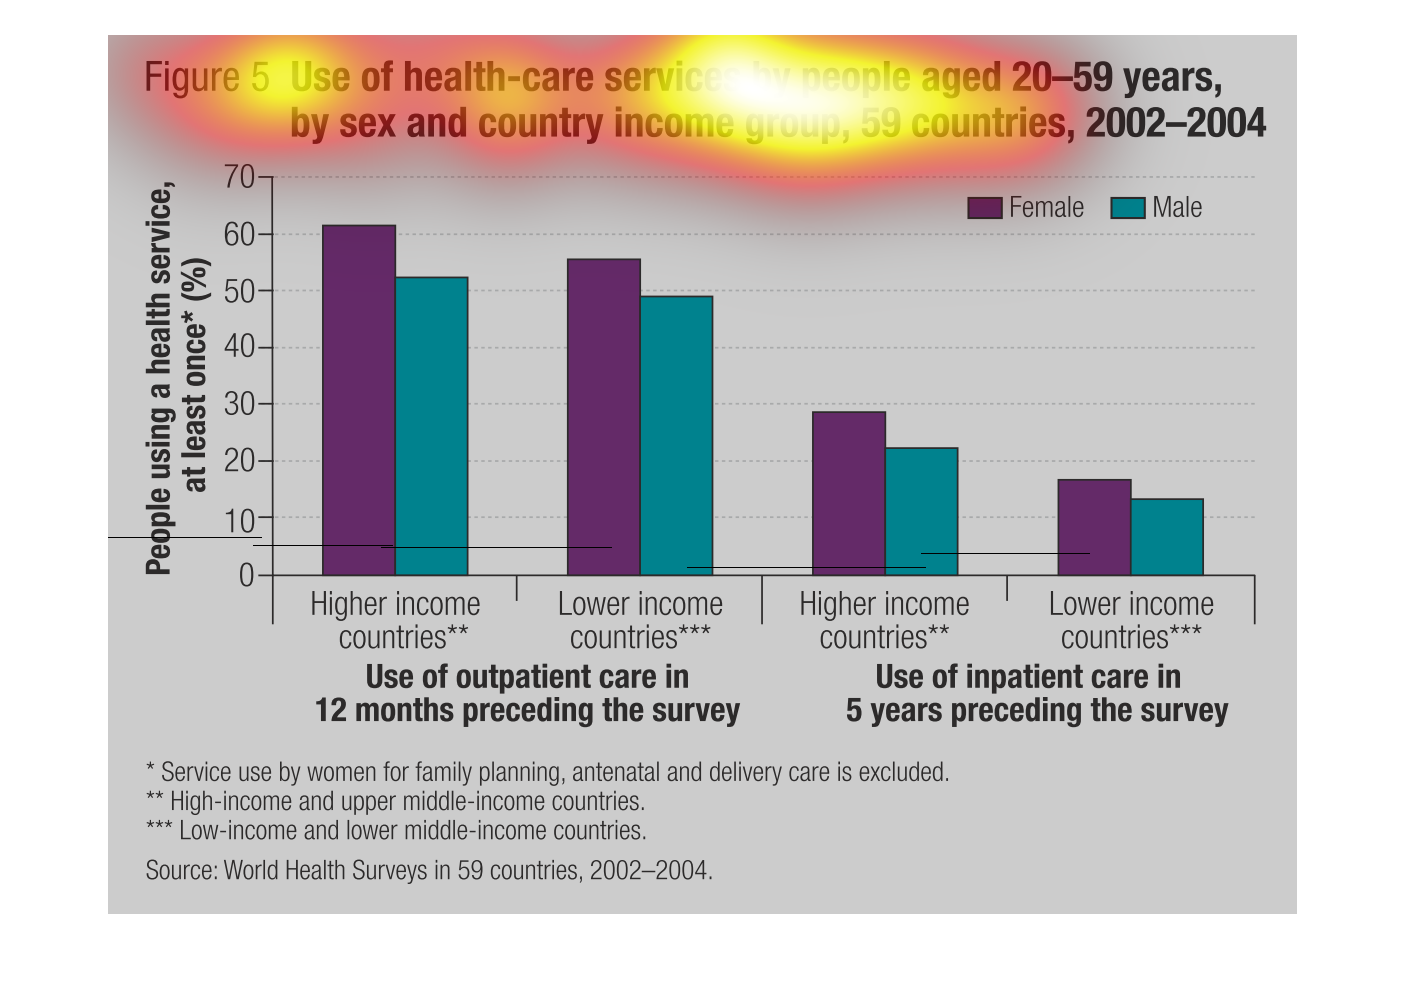
This information is comparing how much people are using either inpatient or outpatient care
in both developed countries and undeveloped countries. The study was done using data from
59 countries.
This chart shows the "Use of health-care services by people aged 20-59 years, by sex and country
income group, 59 countries, 2002-2004. Of course people in higher income countries are able
to utilize health care services more.
The following chart lists the amount of health care that is being used by people aged 20-59
years of age in 59 different countries. The chart is broken down by male and female
There are four pairs of vertically extending bar graphs.  The tallest pair being on the left,
ending with the shortest pair on the right.  The caption above these icons reads, "Use of
healthcare services by people aged 20-59 years, by sex and country income group, 59 countries,
2002-2004.

This graph shows the use of healthcare by both male and females from 20-59 in a multitude
of manners, not of which excludes monetary levels. It shows the cost for each.