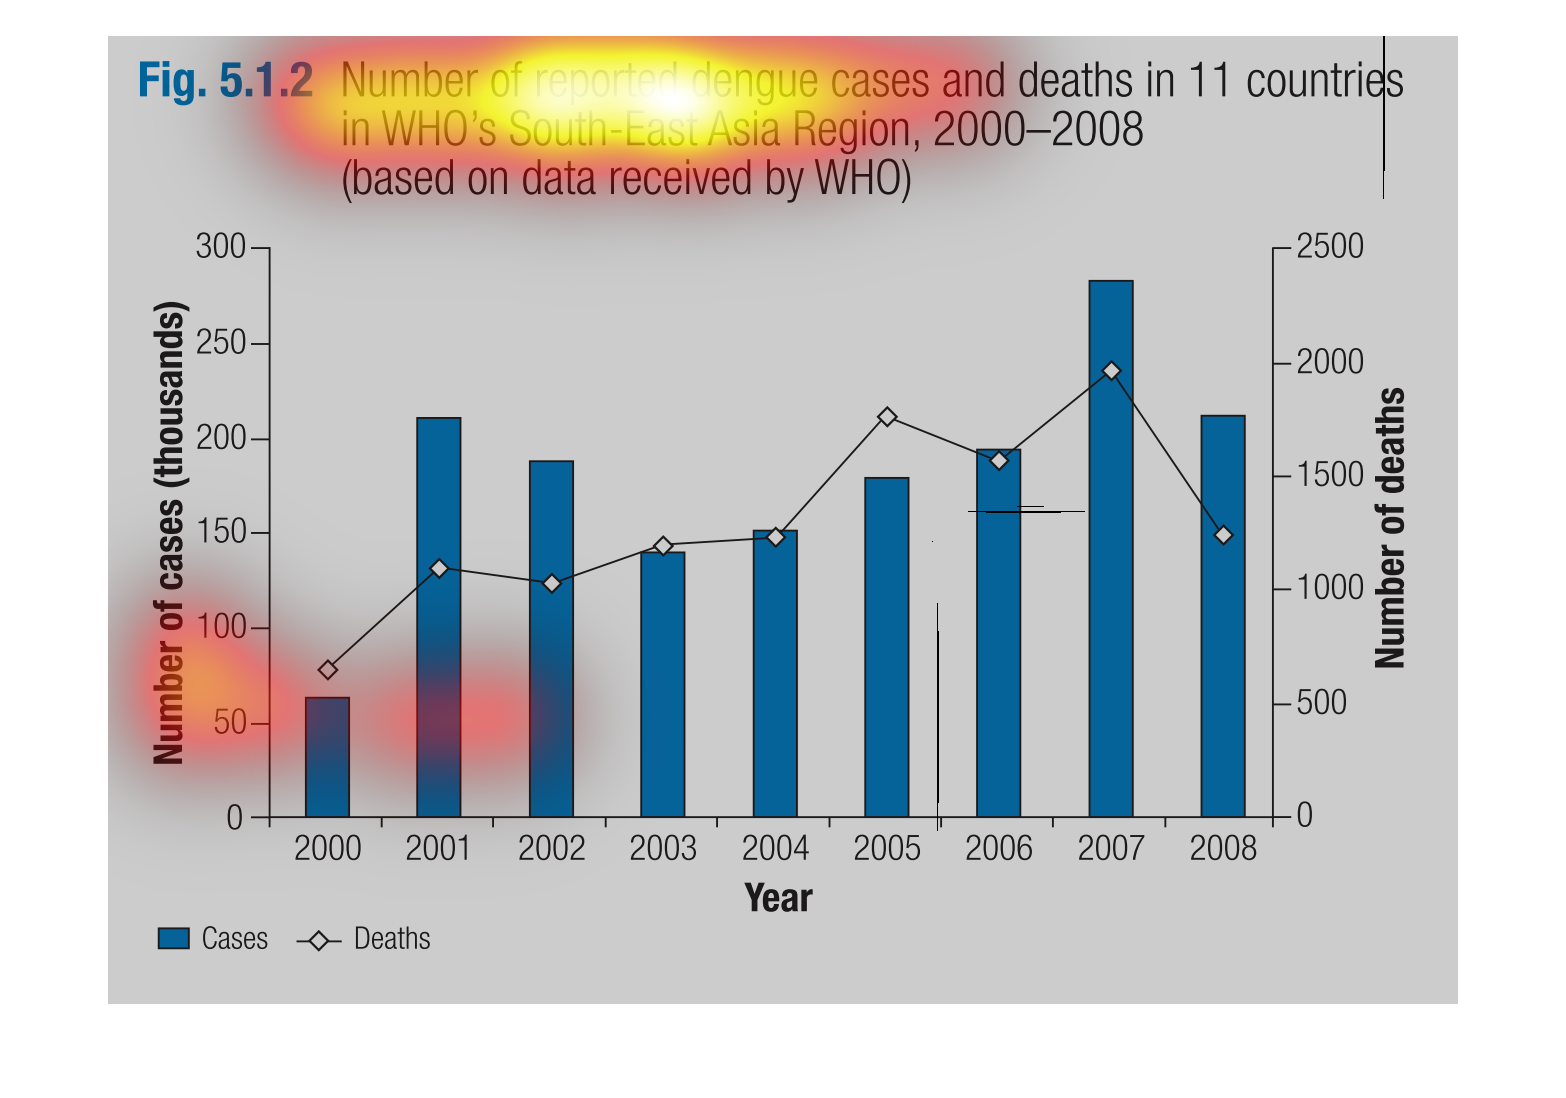
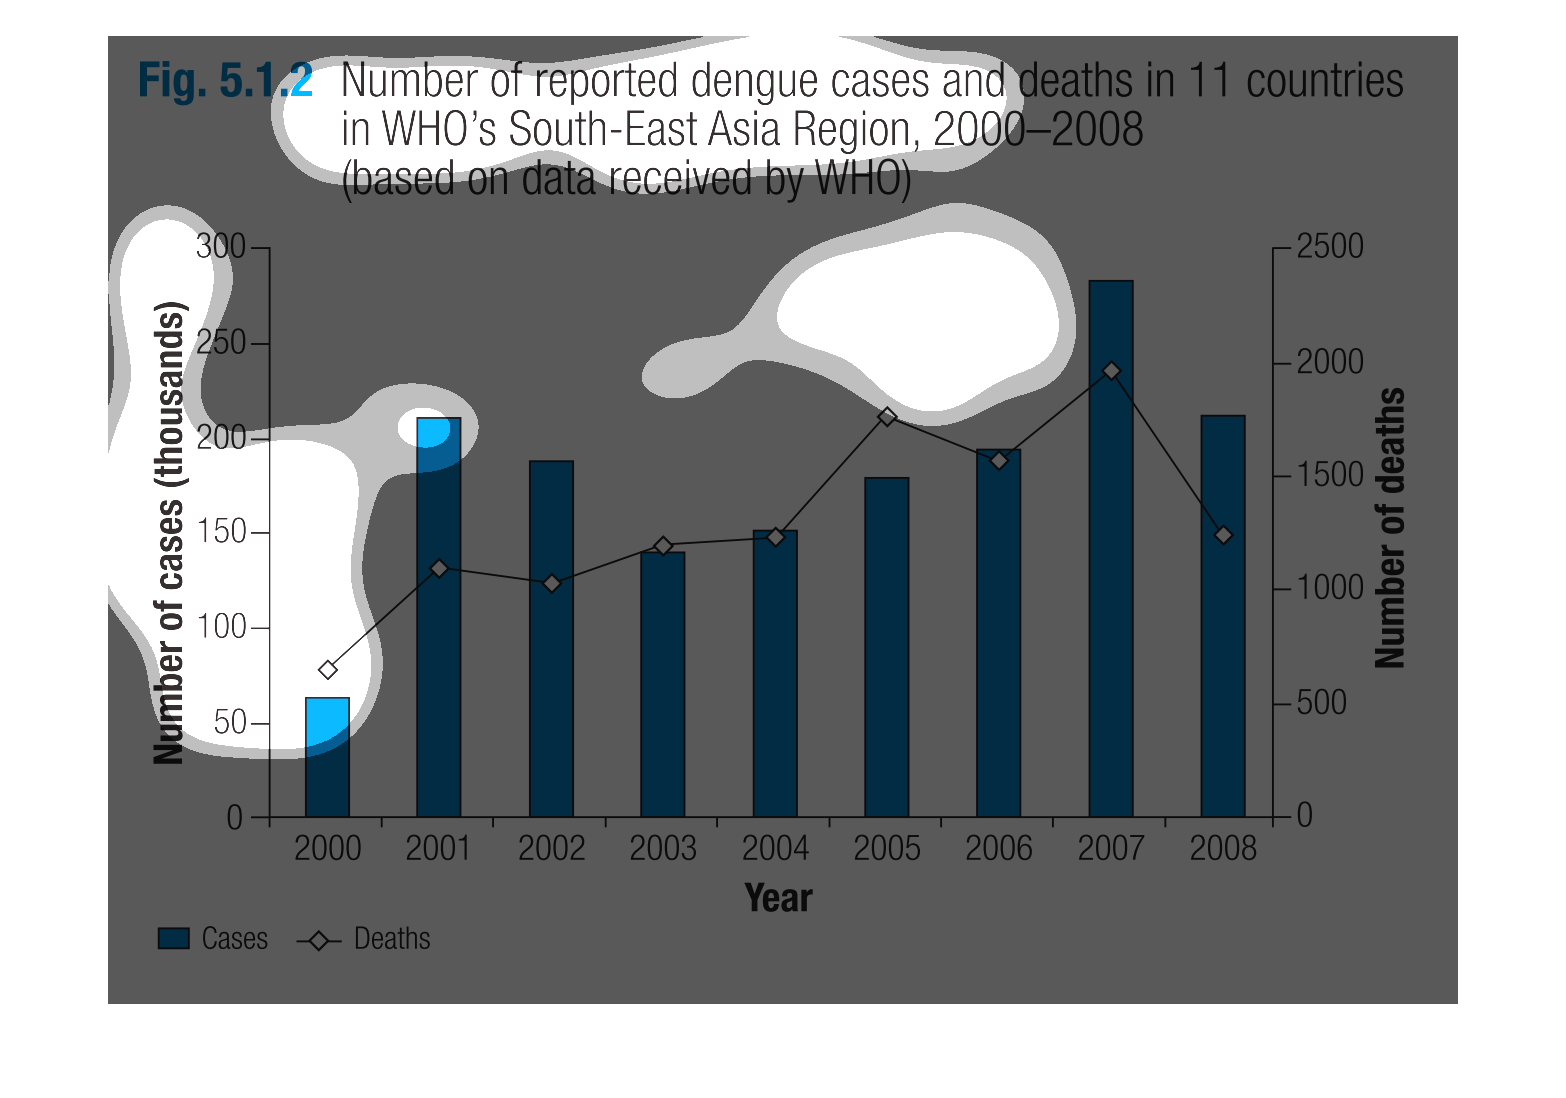
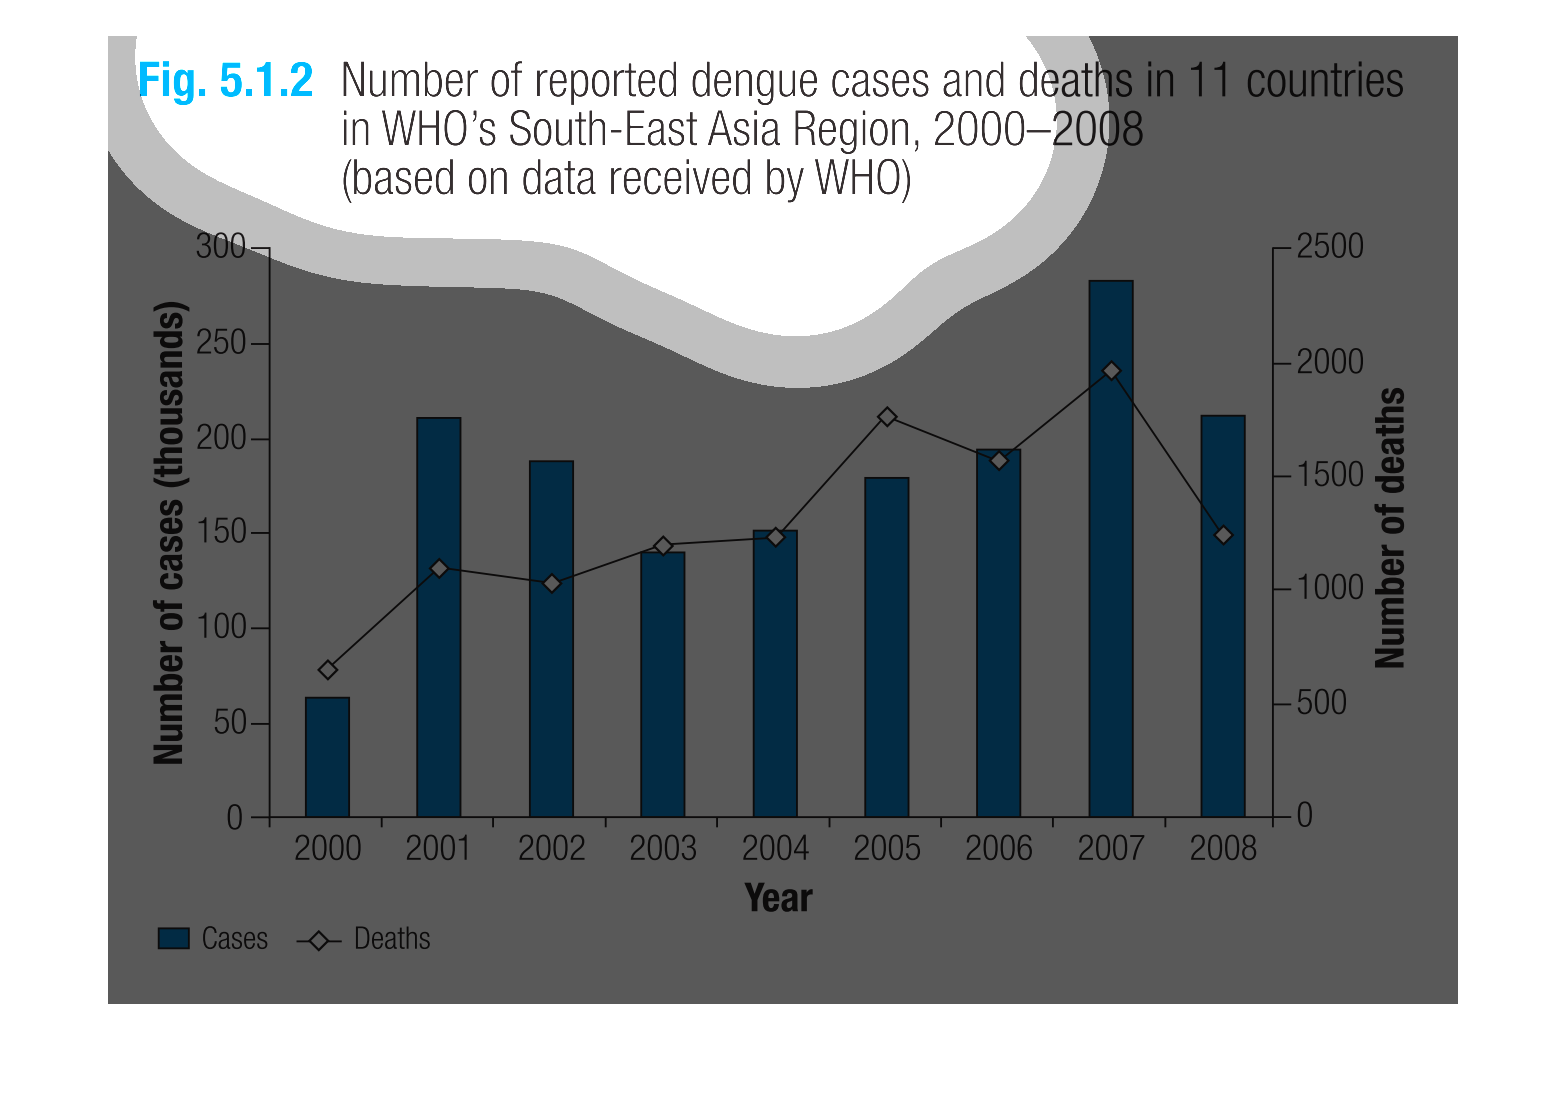
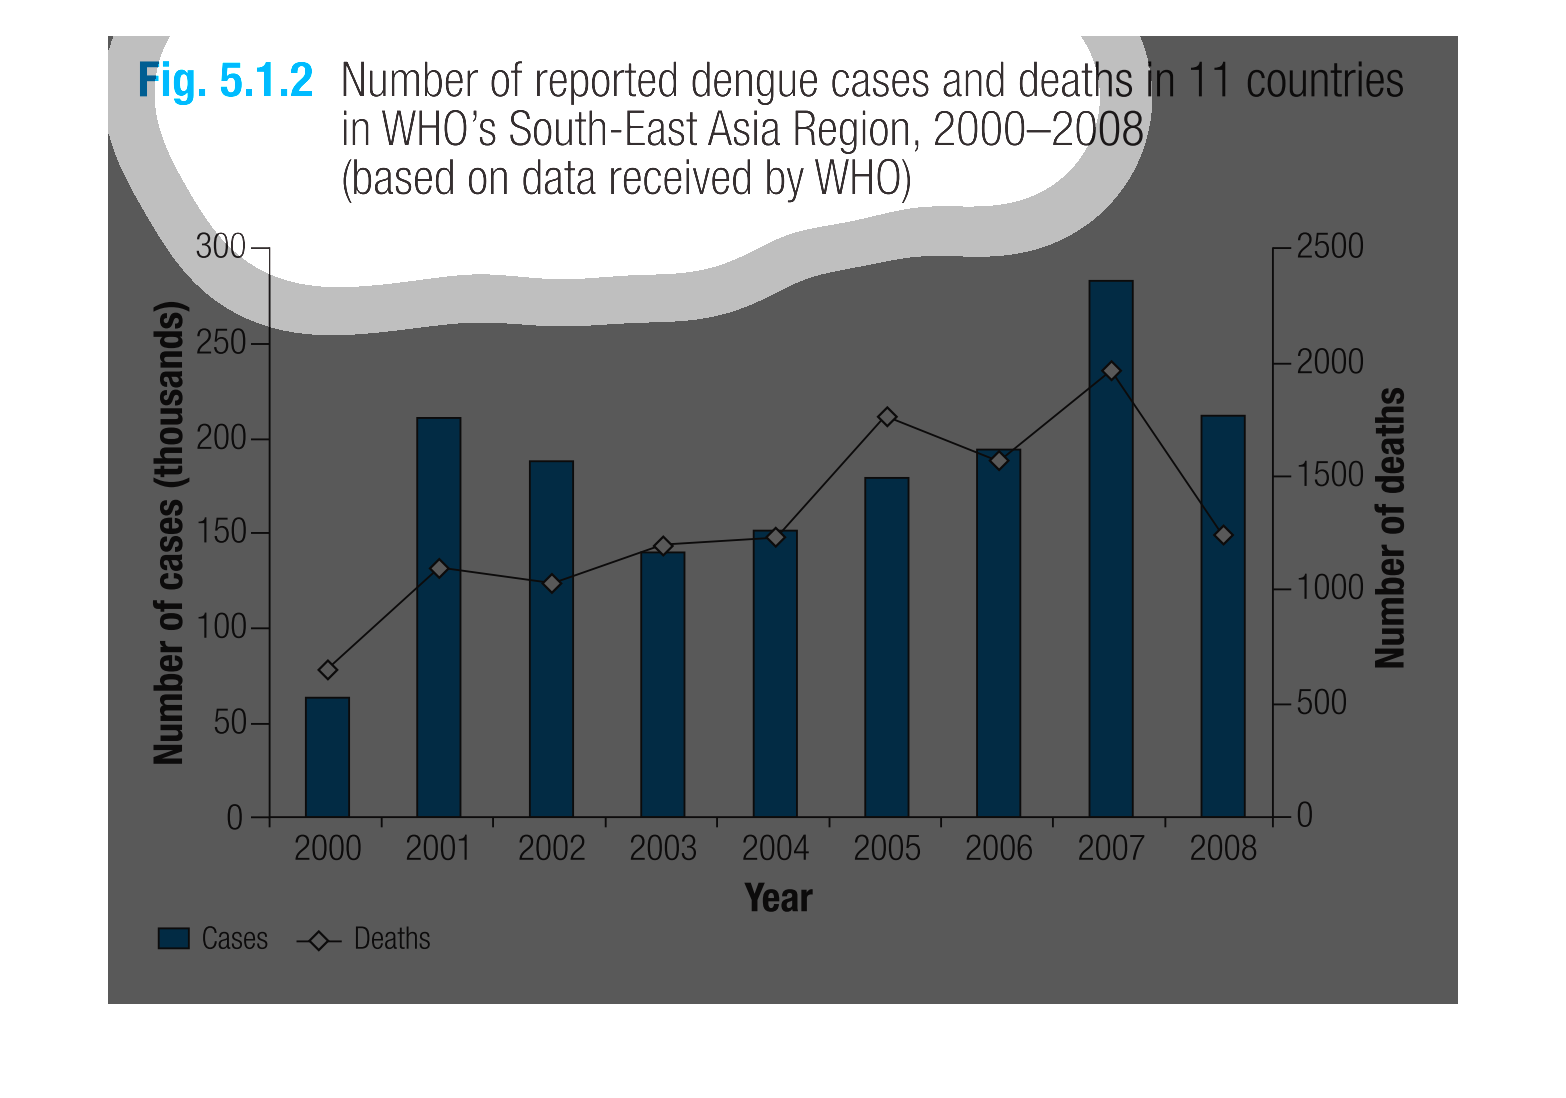
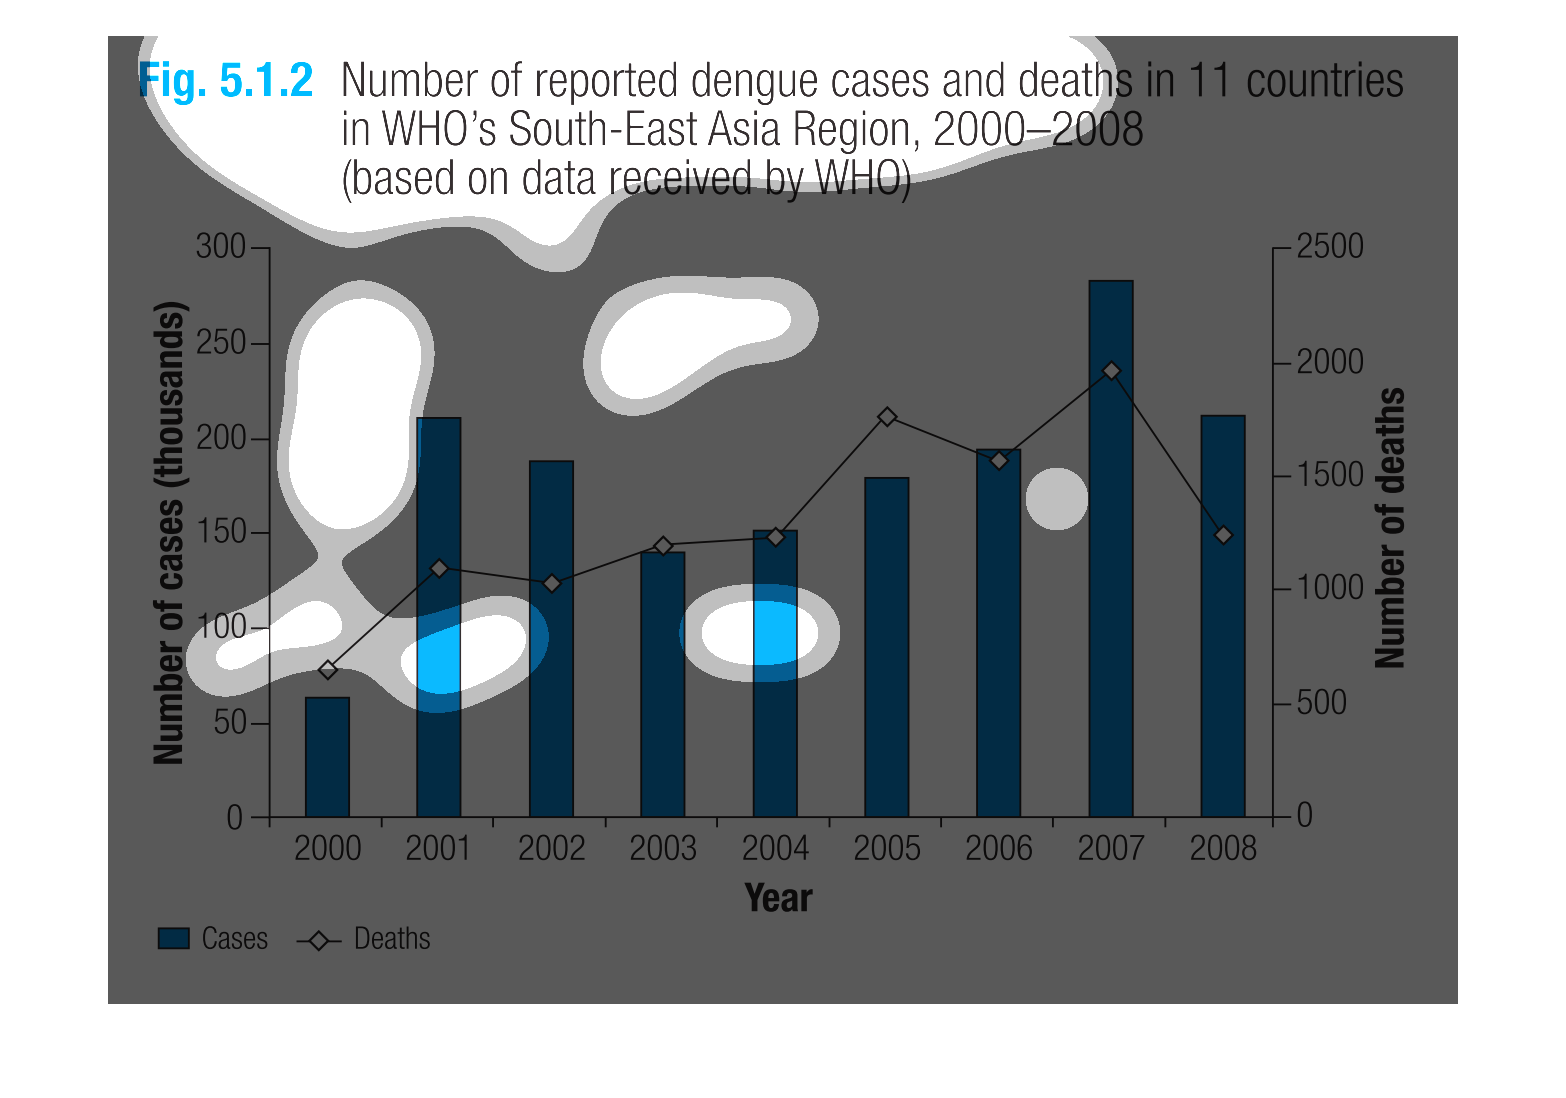
The graphic based on data receieved by WHO shows numbers of reported dengue cases and deaths
in 11 countries in South-East Asian Region in 2000-2008 years. Even though the whole graphic
isn't stabile it looks like the number of reported cases and deaths was increasing and reached
it's peak by 2007 and then dropped a little in 2008 but still remained higher than at the
beggining.
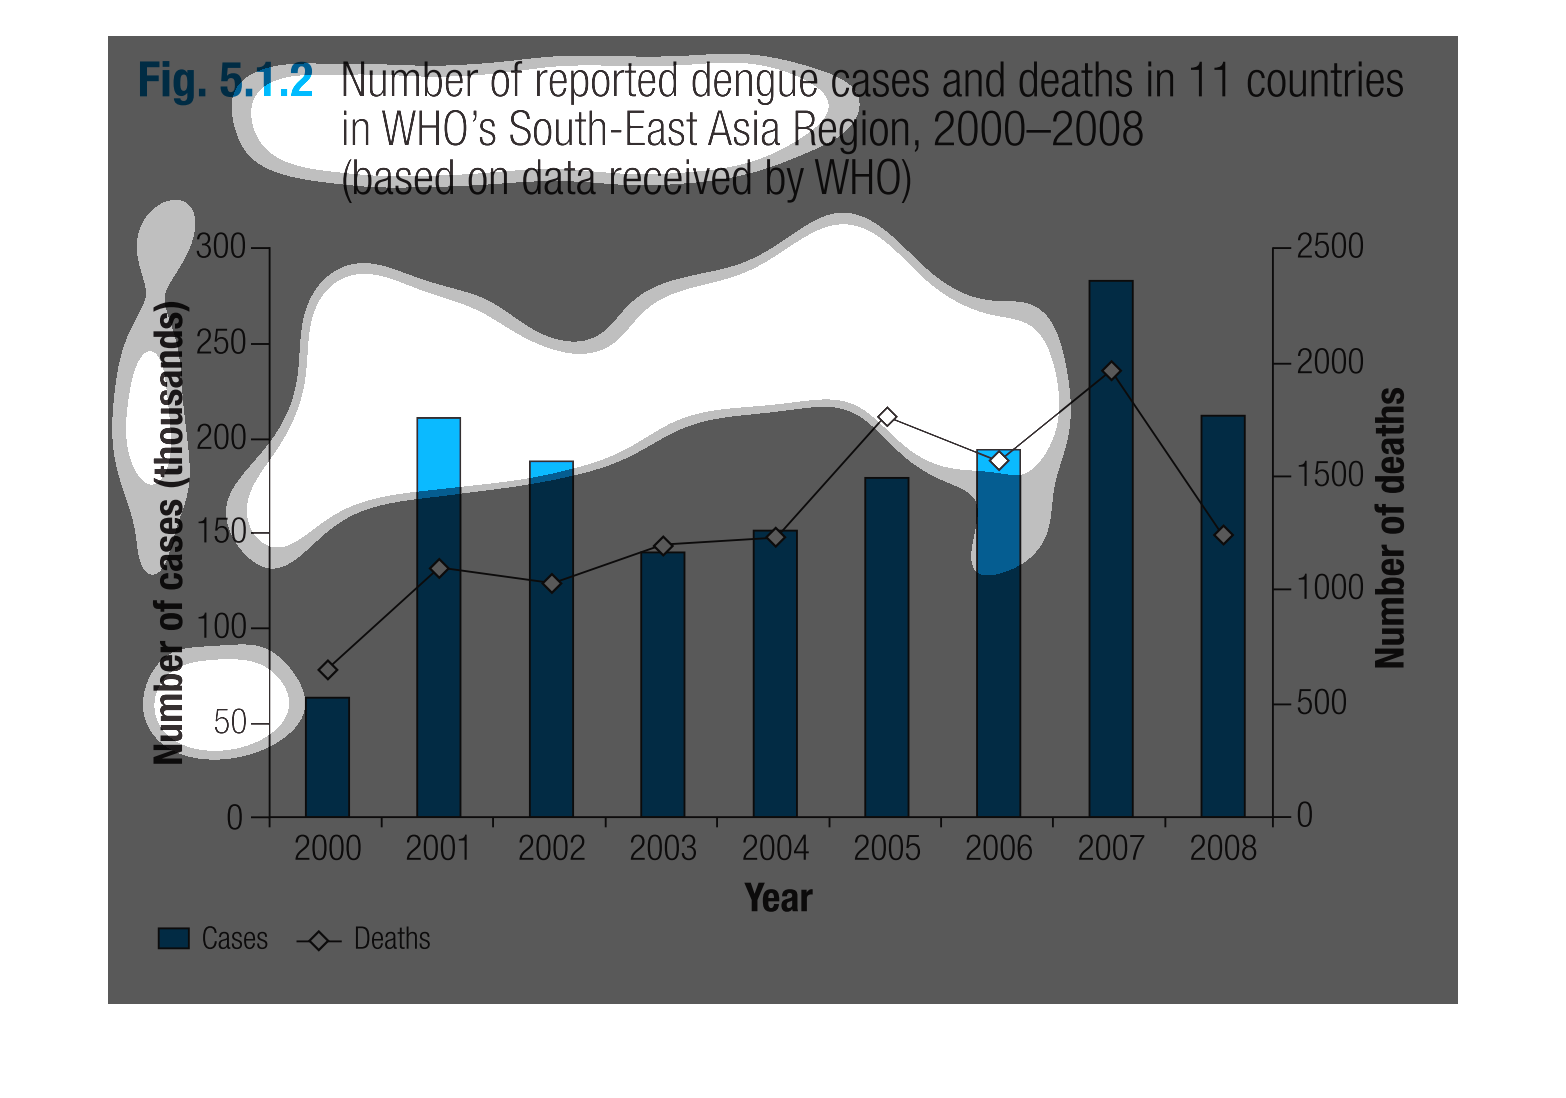
The image depicts a bar graph of number of reported dengue cases and deaths in 11 countries
in WHO's South-East Asia Region, years 2000-2008. Cases are measured in the thousands across
listed years. The overall trends in reported cases has dramatically increased since 2000,
with 2007 being the worst year.
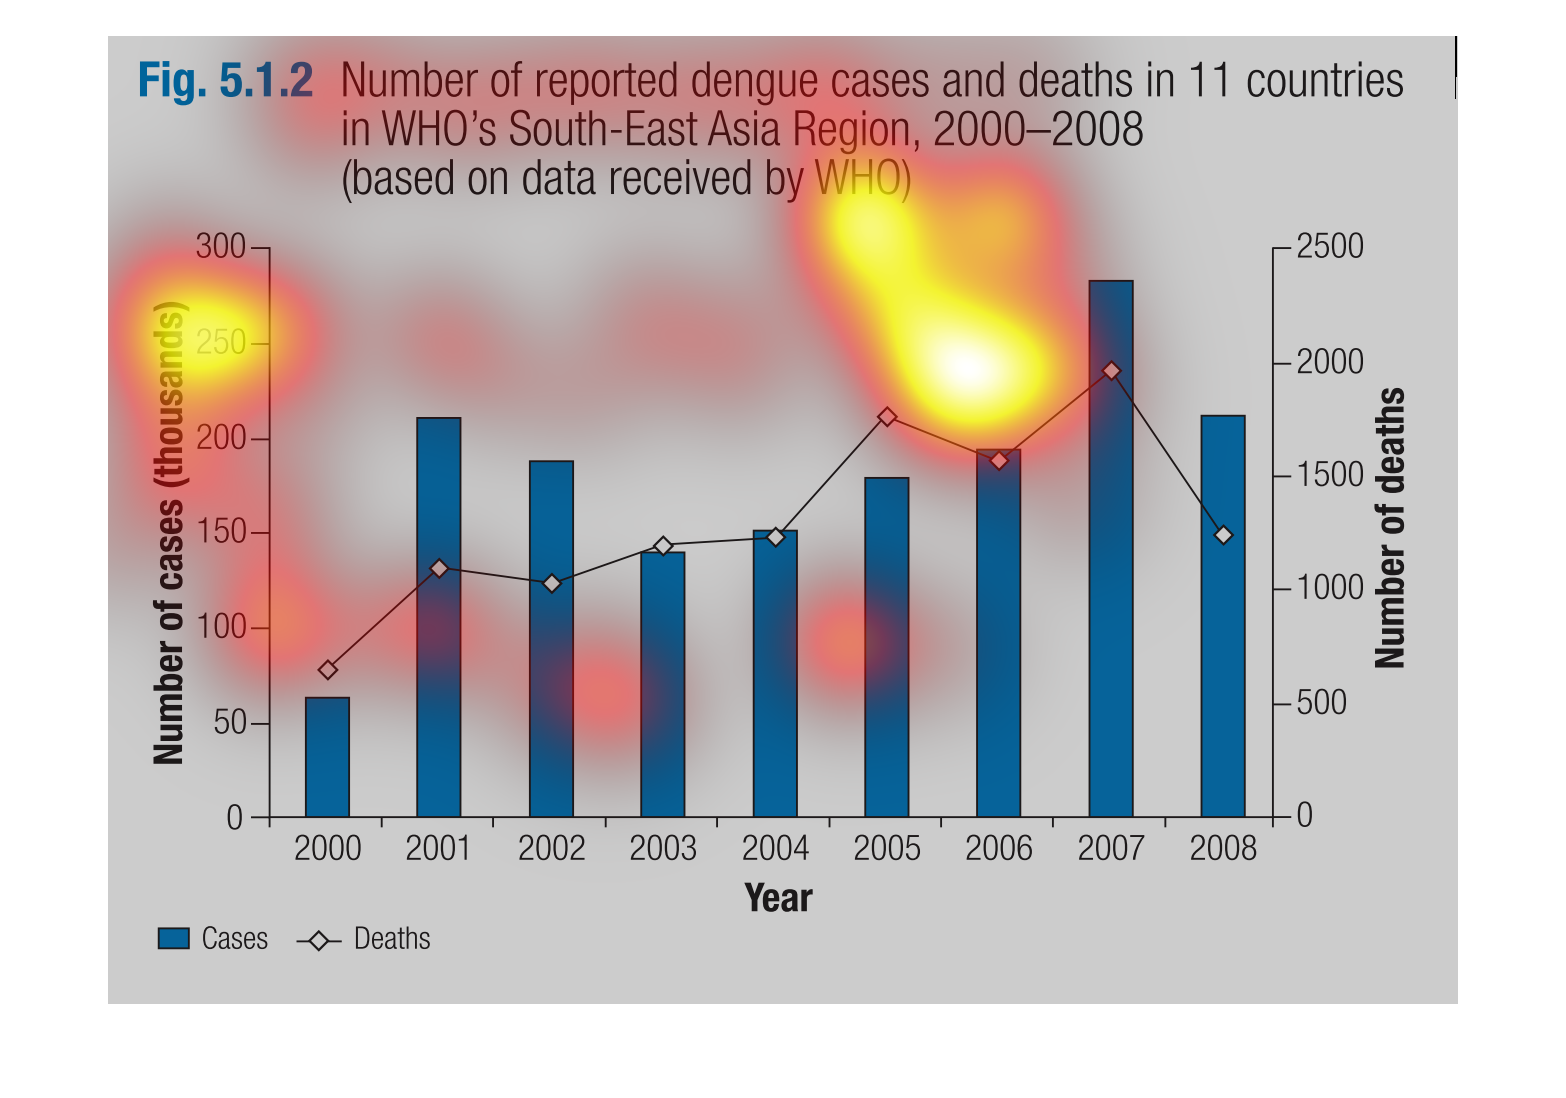
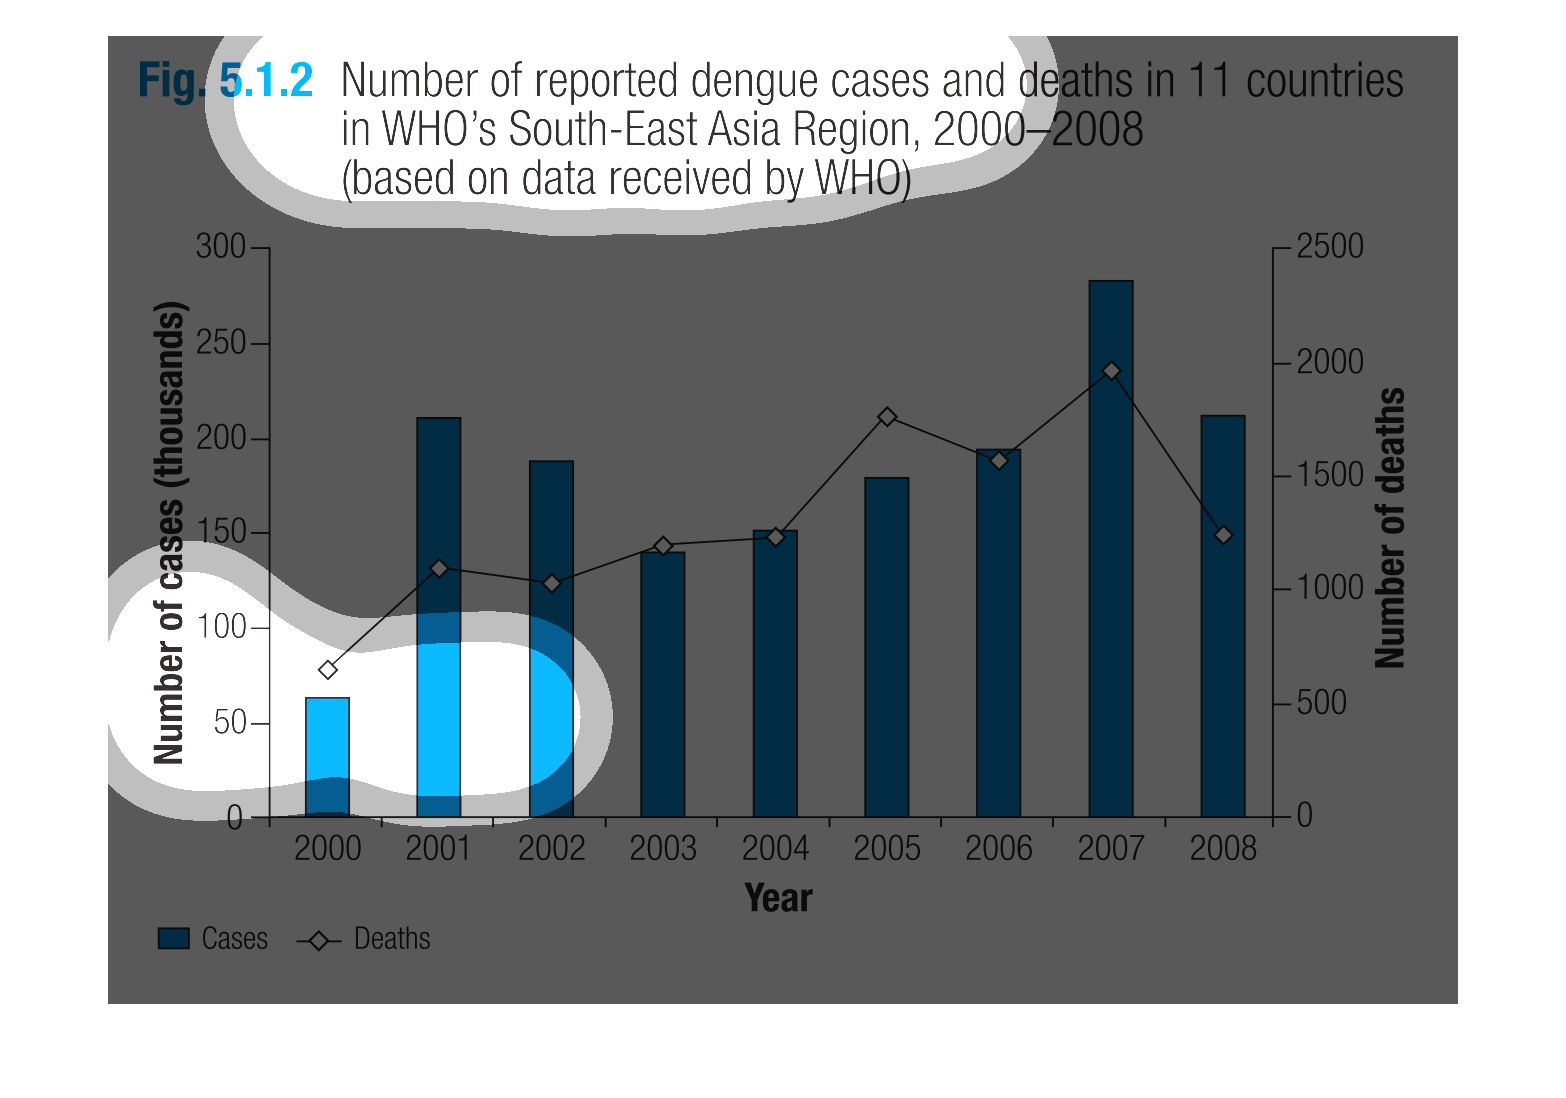
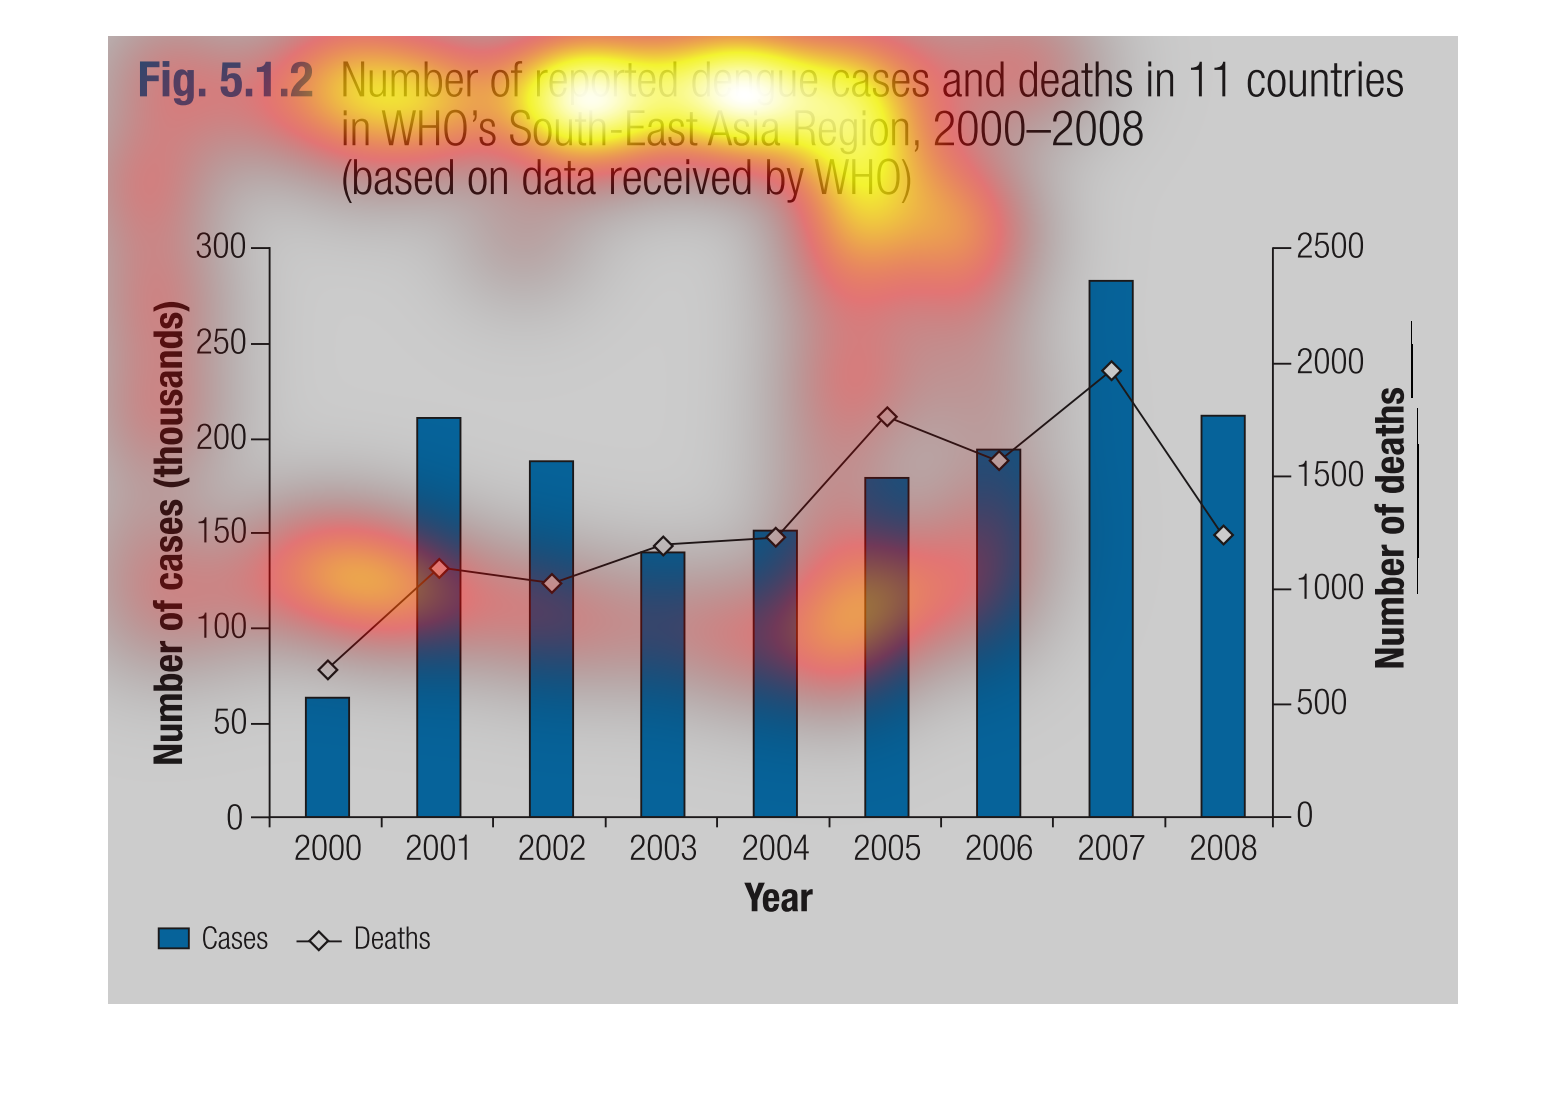
This chart shows the number of dengue fever cases and deaths reported in WHO's Southeast Asia
region between 2000-2008. While the number of reported cases has risen significantly over
this time period, the number of deaths has only trended upward slightly.
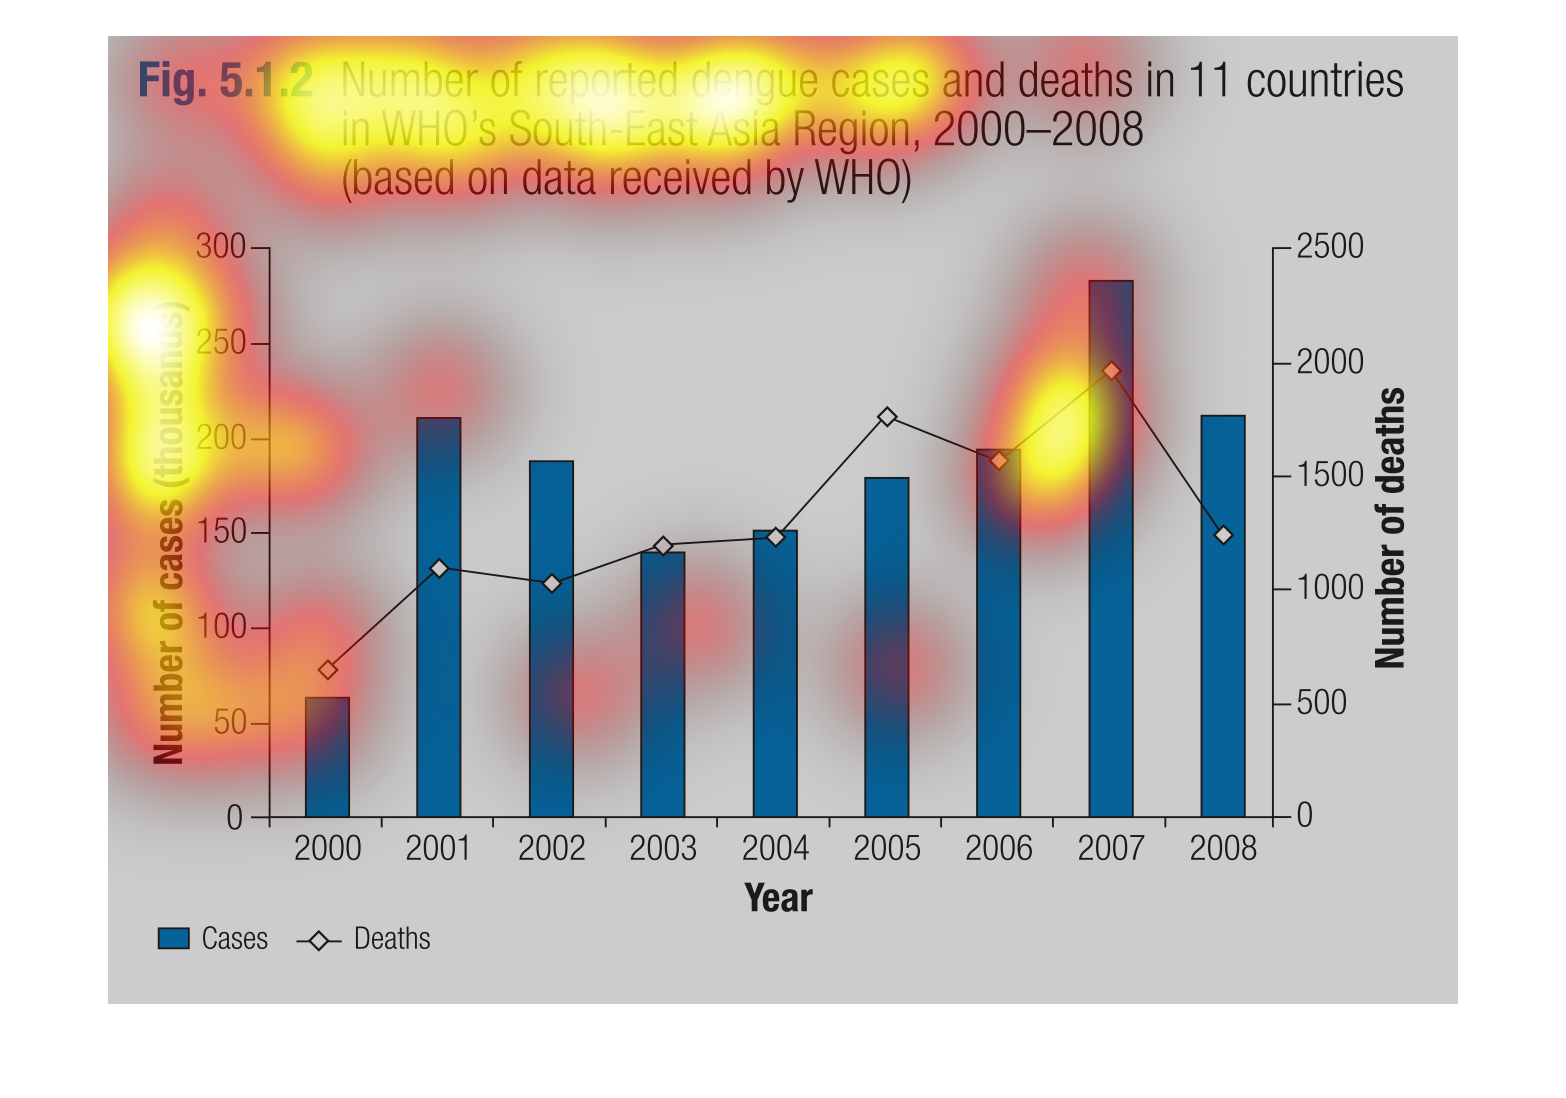
This chart shows the number of reported dengue cases and deaths from 11 countries in WHO's
south/east asia regions, from 2000-2008. A bar tracks across the graph, denoting number of
deaths.
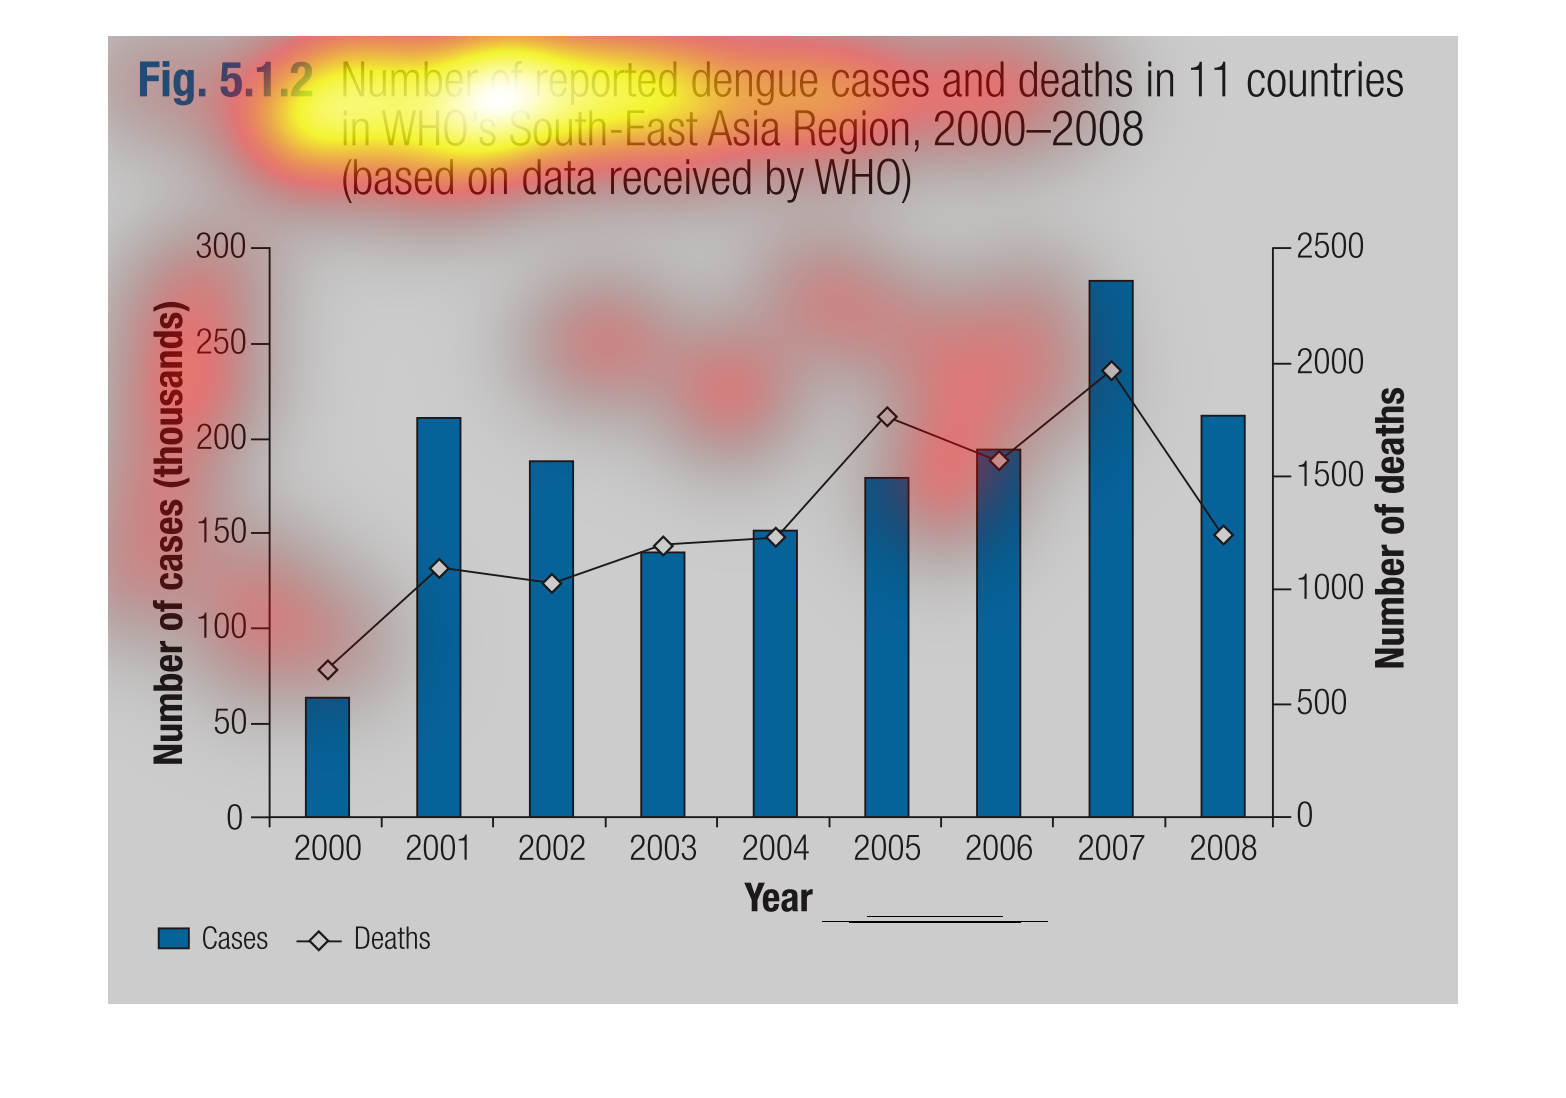
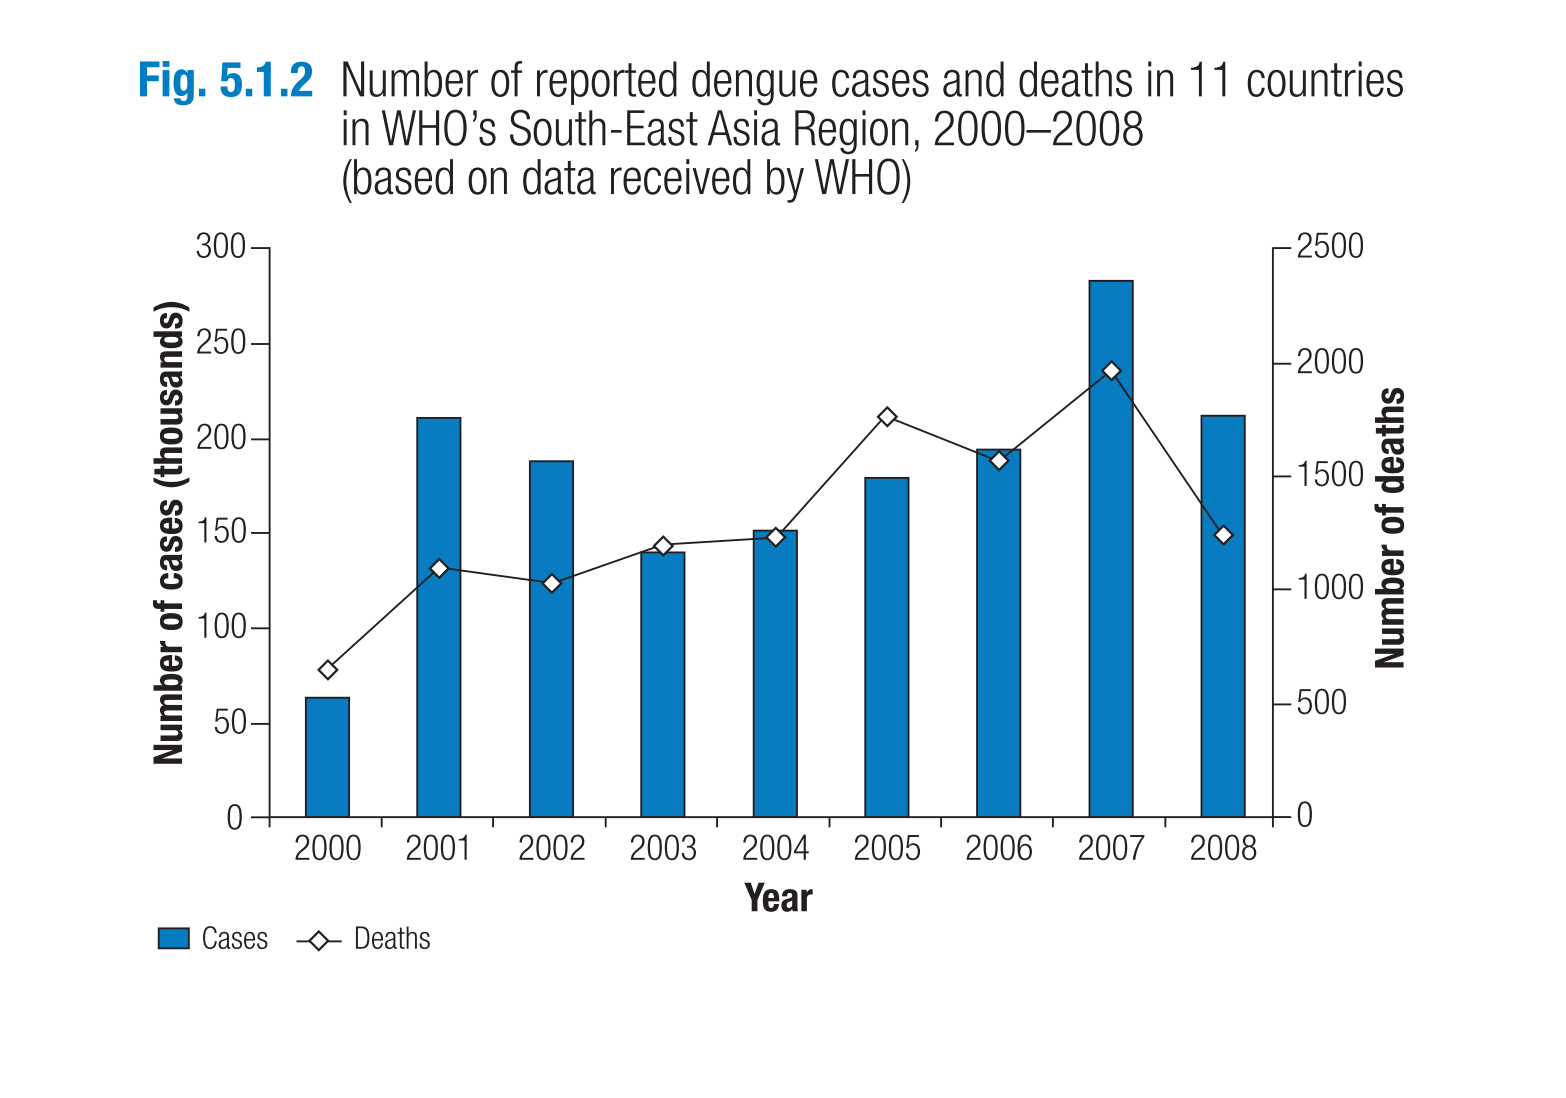
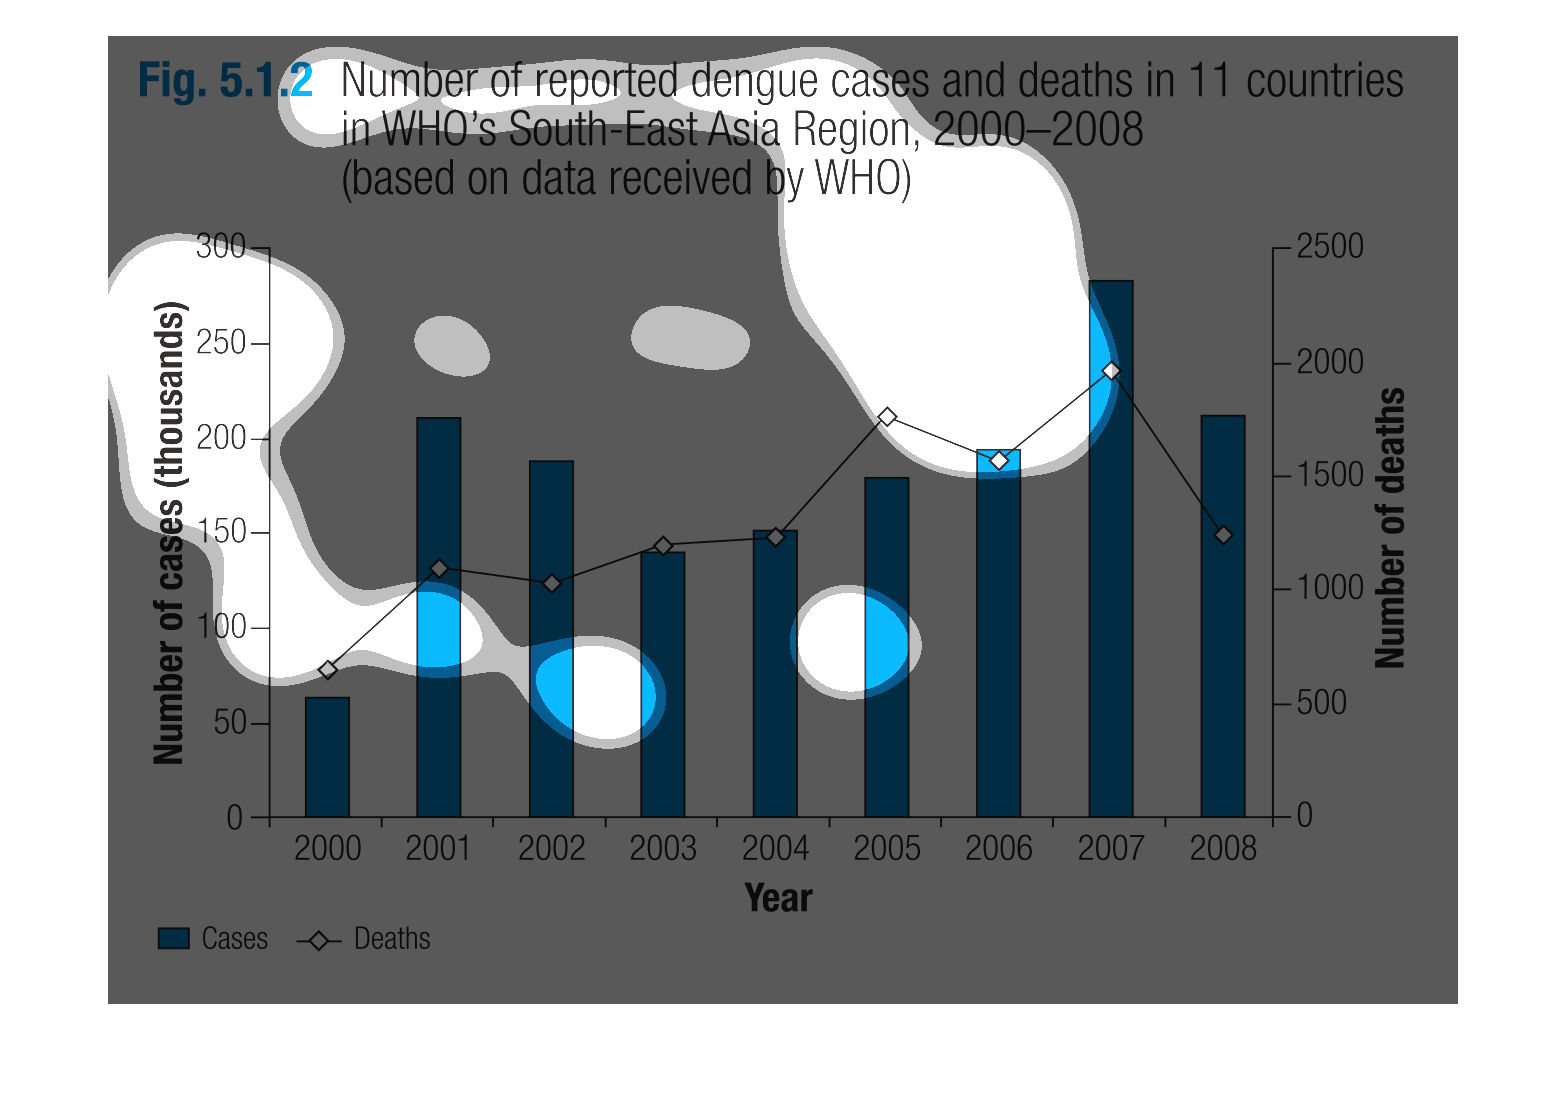
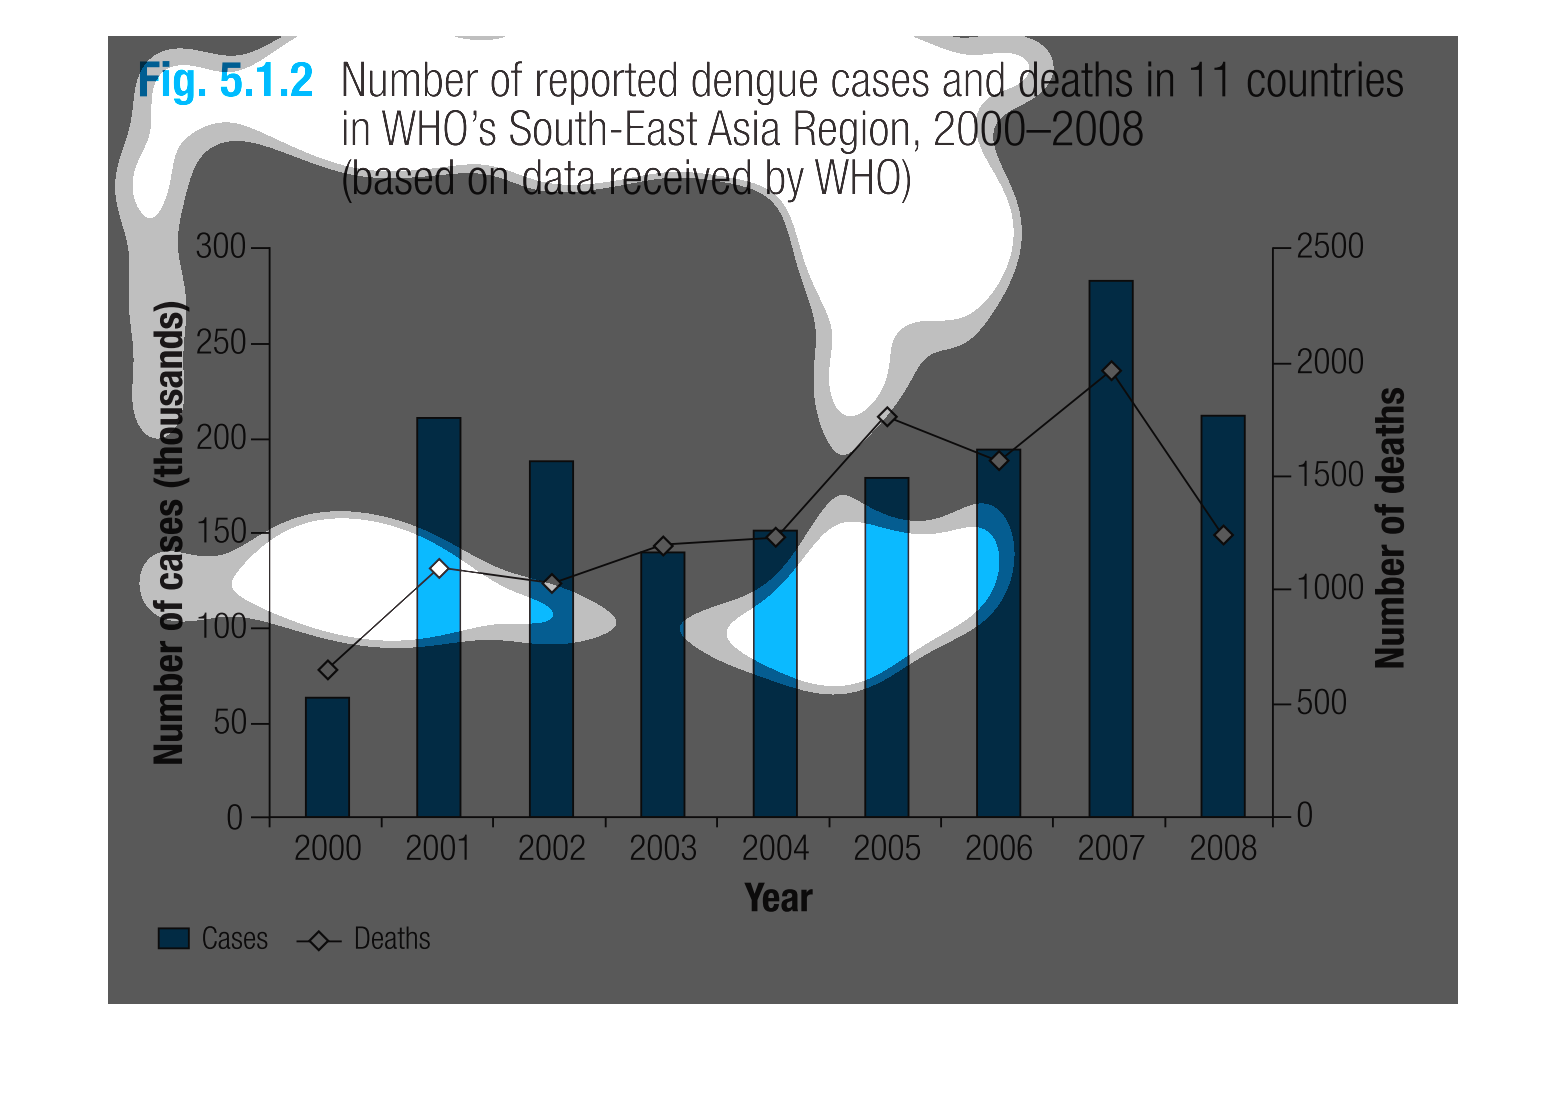
This handmade chart shows the number of dengue cases and deaths related to dengue fever as
reported to the World Health Organization between 2000 and 2008
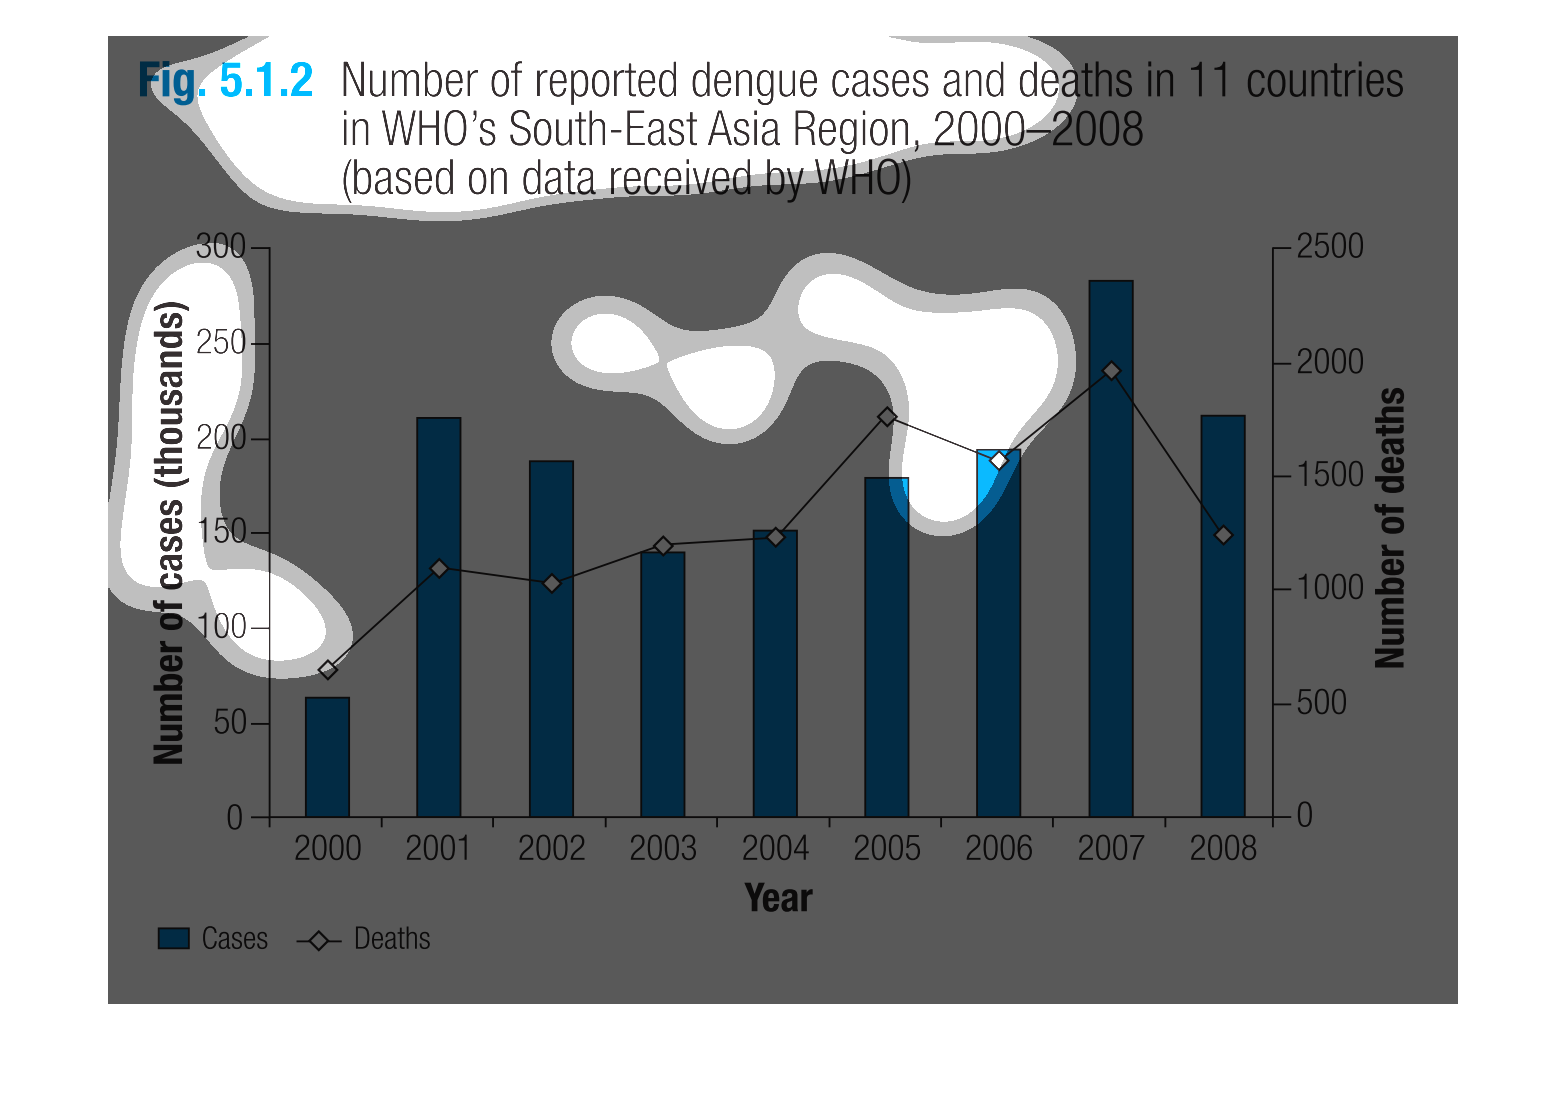
This graph shows the years from 2000-2008. It is the numbers for dengue causes if death in
11 countries. It fluctuates from year to year, and was the highest in 2007.
This chart describes number of reported dengue cases and deaths in eleven countries in WHO
South-East Asia for the years 2000 through 2008. Based on data received by WHO.
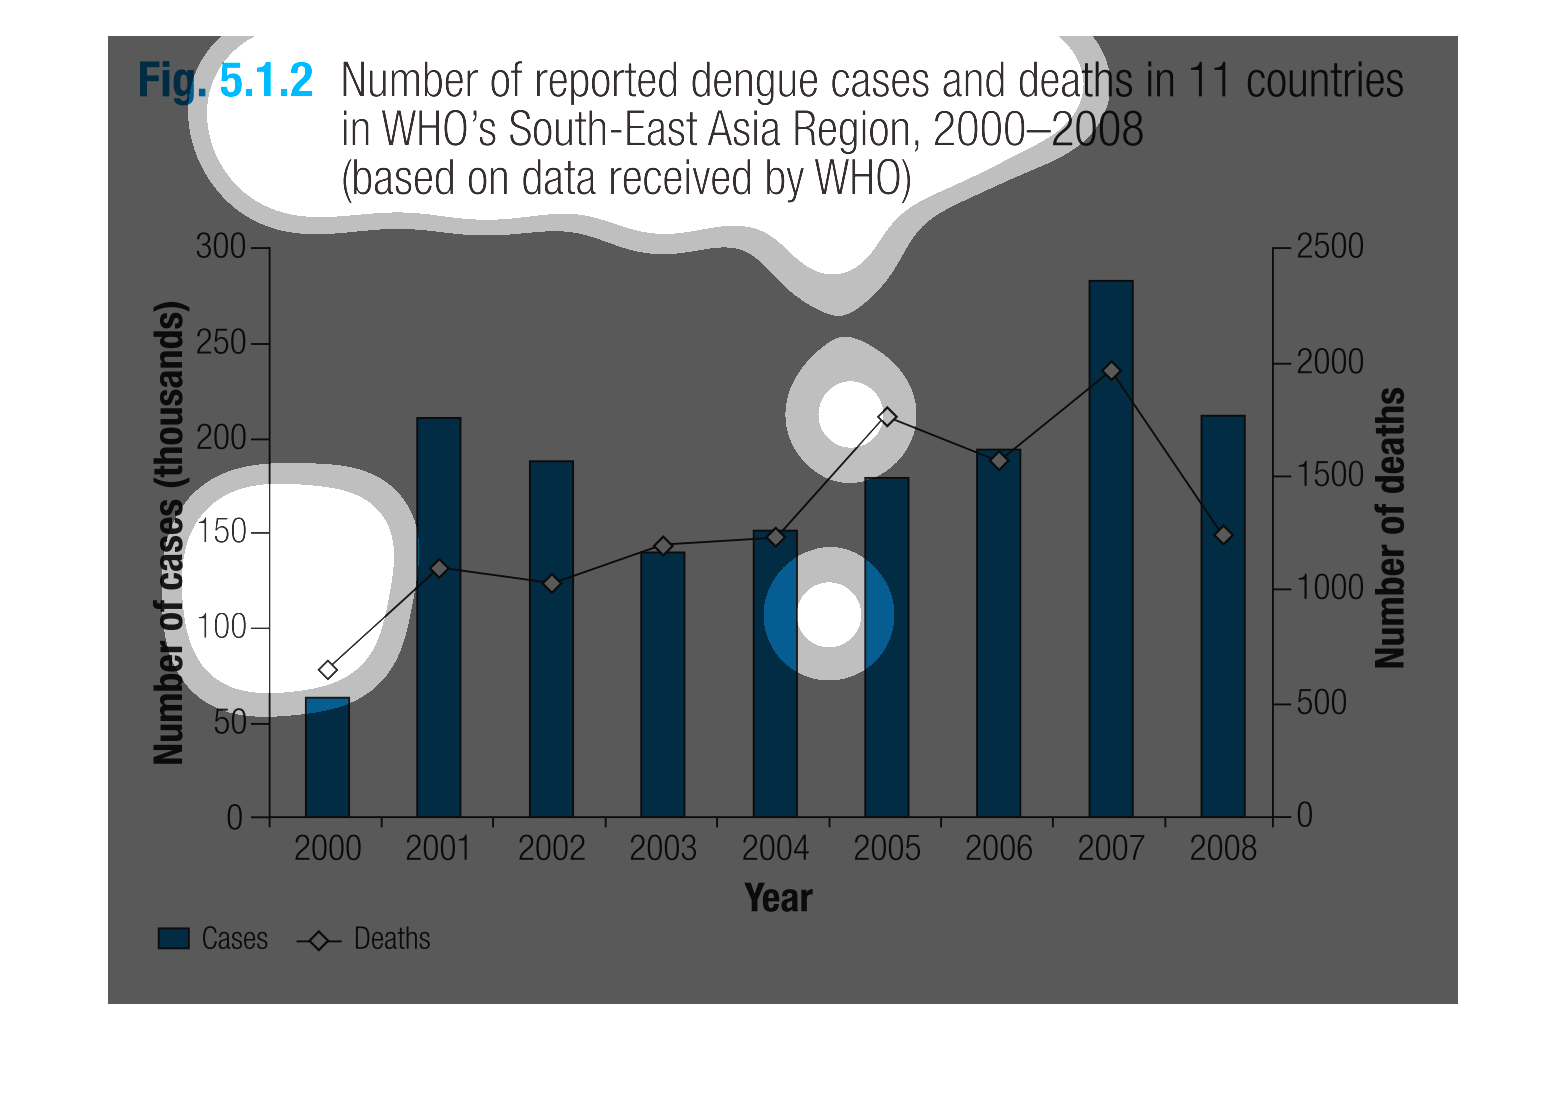
Number of reported dengue cases and deaths in 11 countries in WHO's South East Asia Region
from 2000-2008.    Number of cases in the thousands is shown in blue by the year below.  Number
of deaths is shown with a line corresponding to the year.
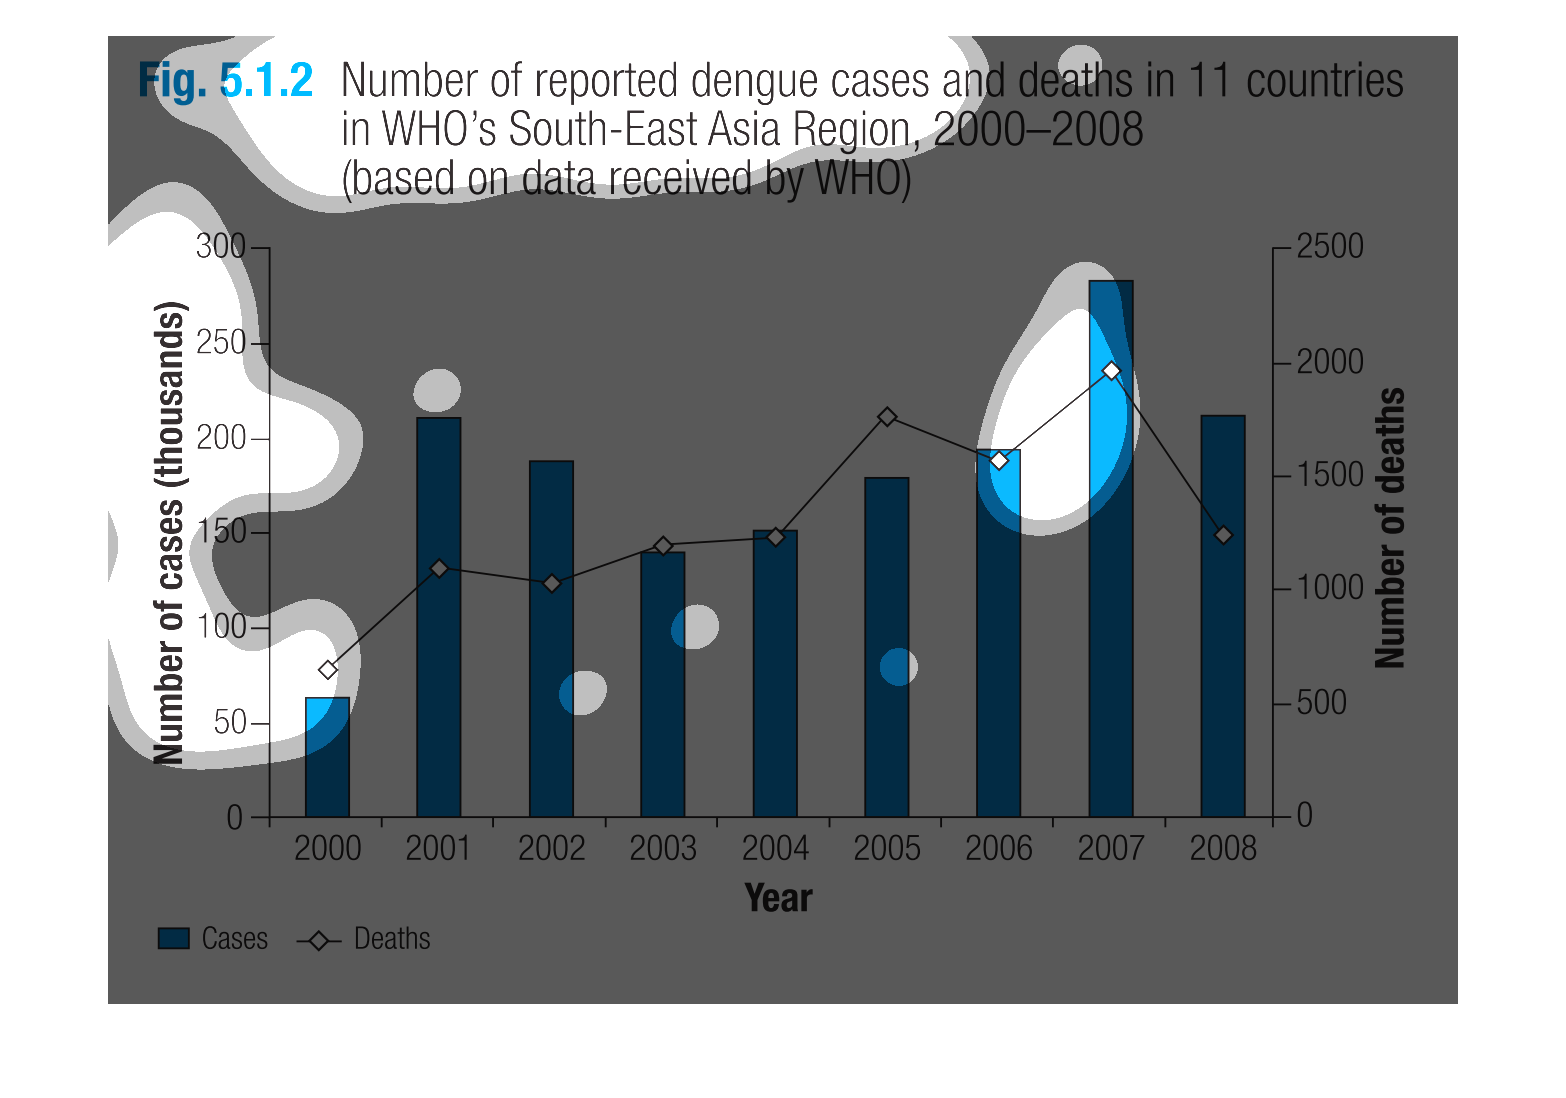
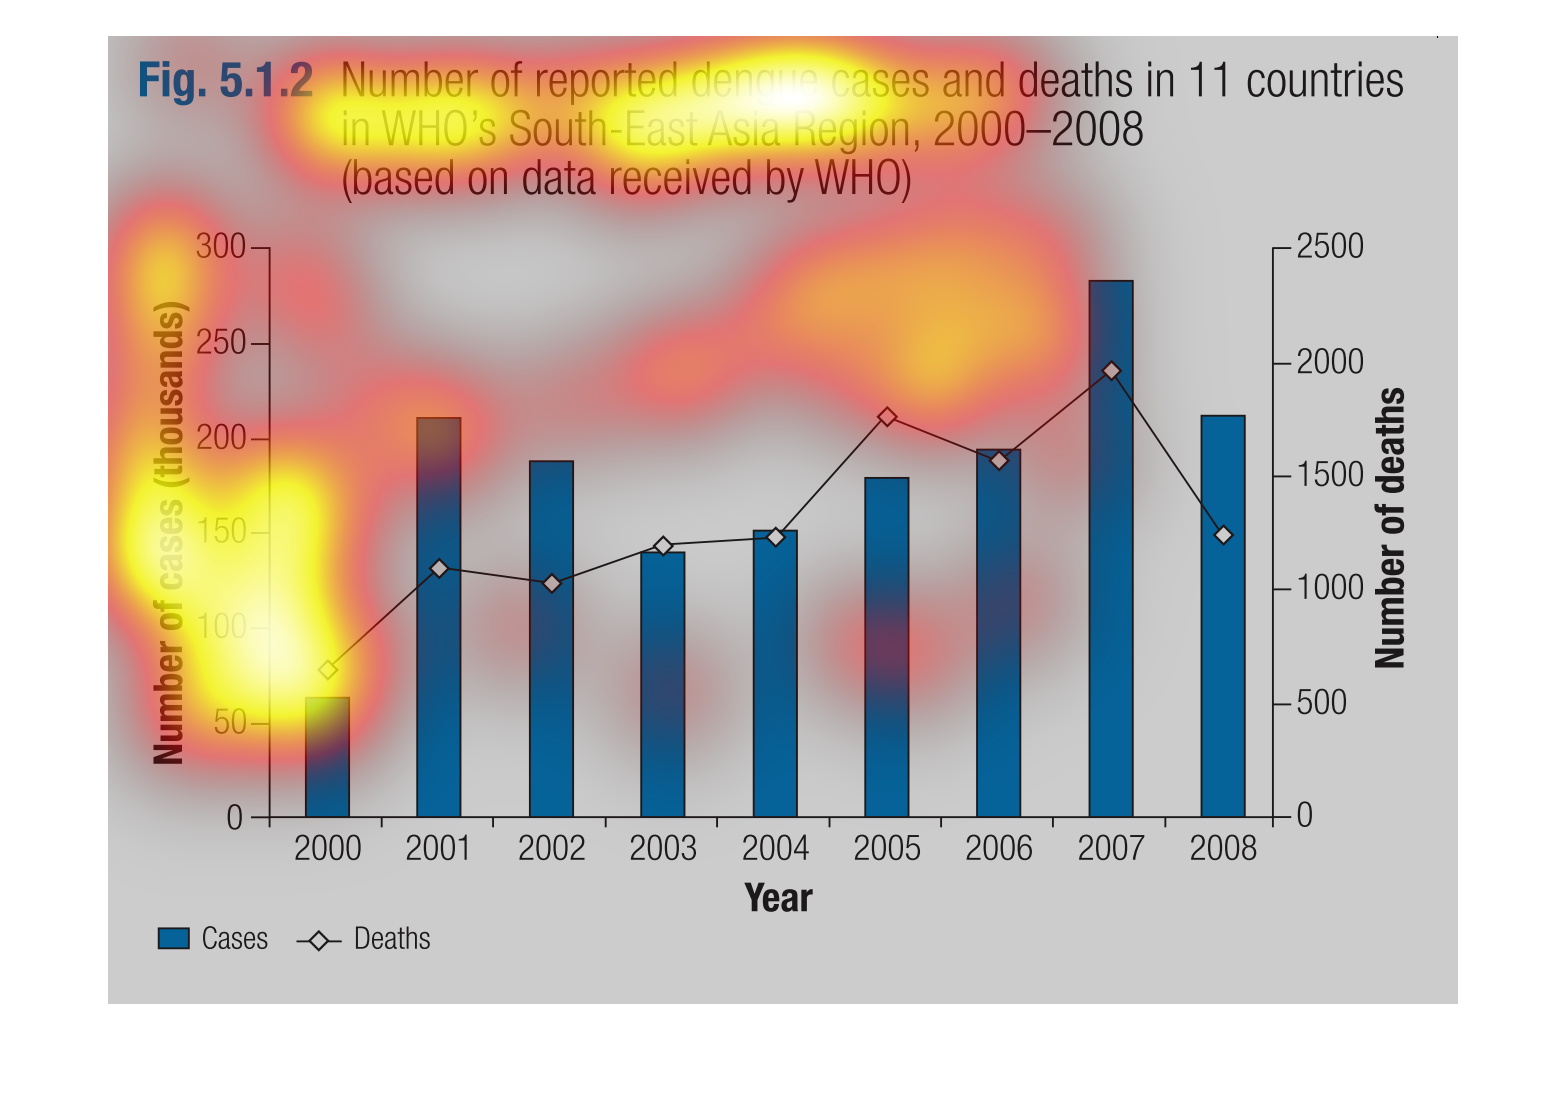
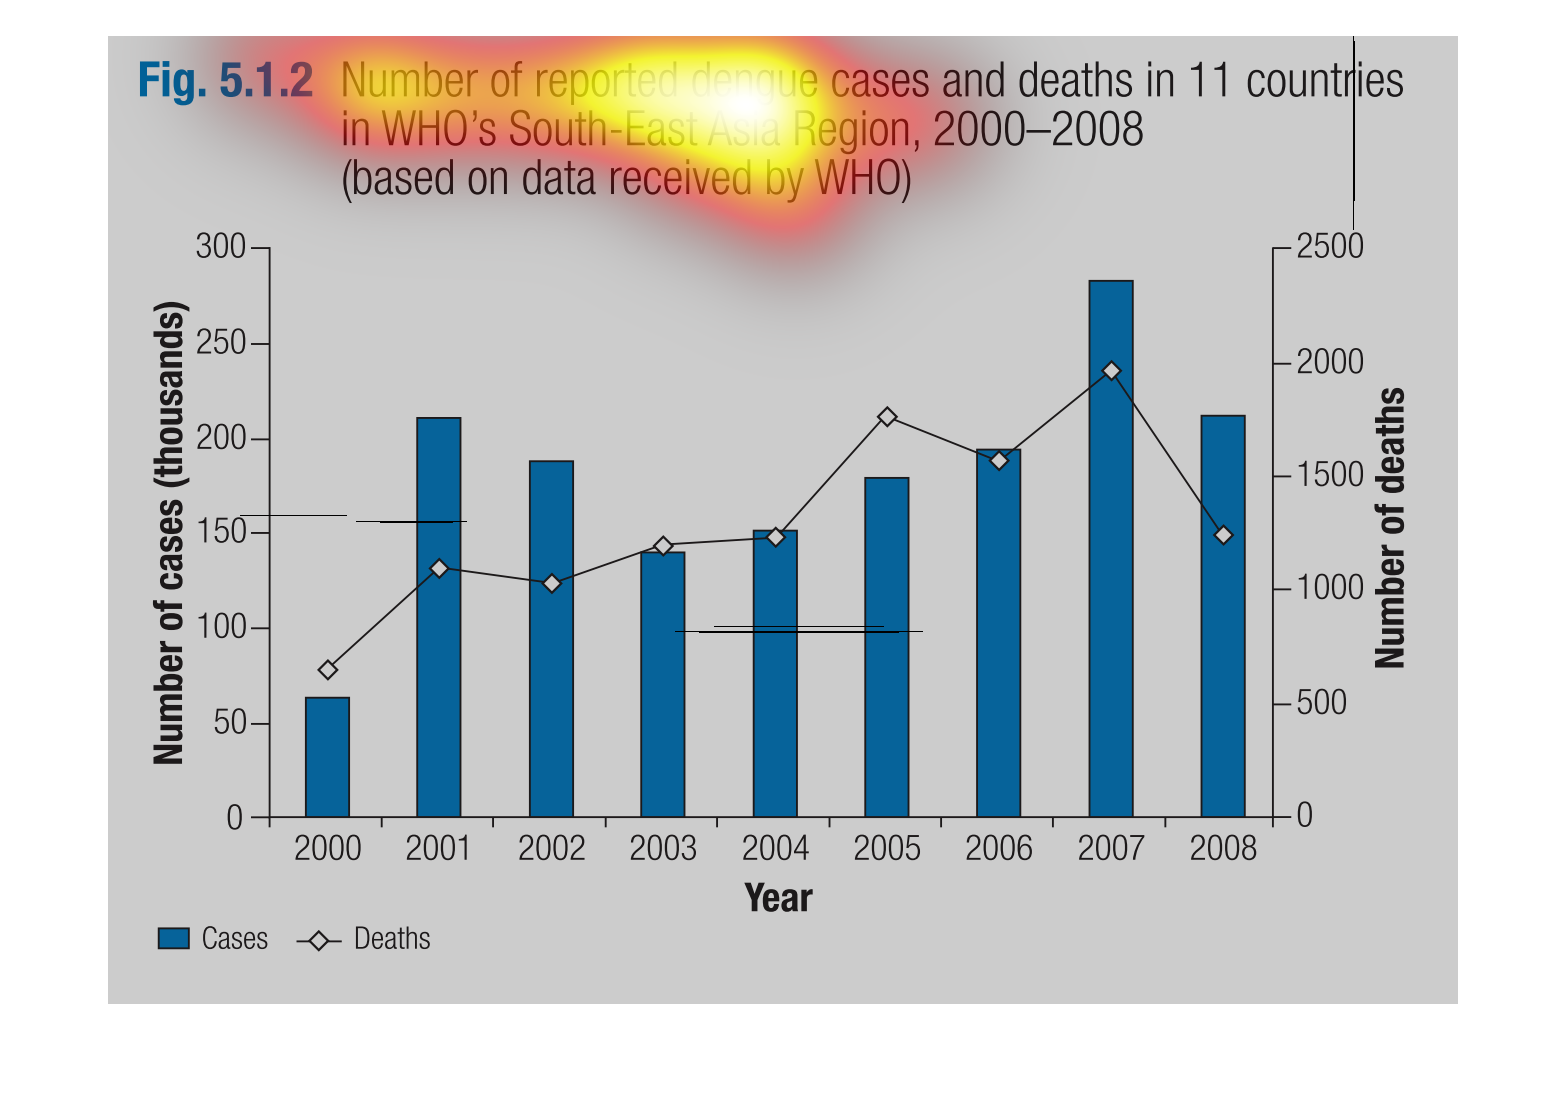
The figure presented is titled number of reported dengue cases and deaths in 11 countries
in WHO's South-East Asia region, 2000-2008. The figure shows data for dengue cases.
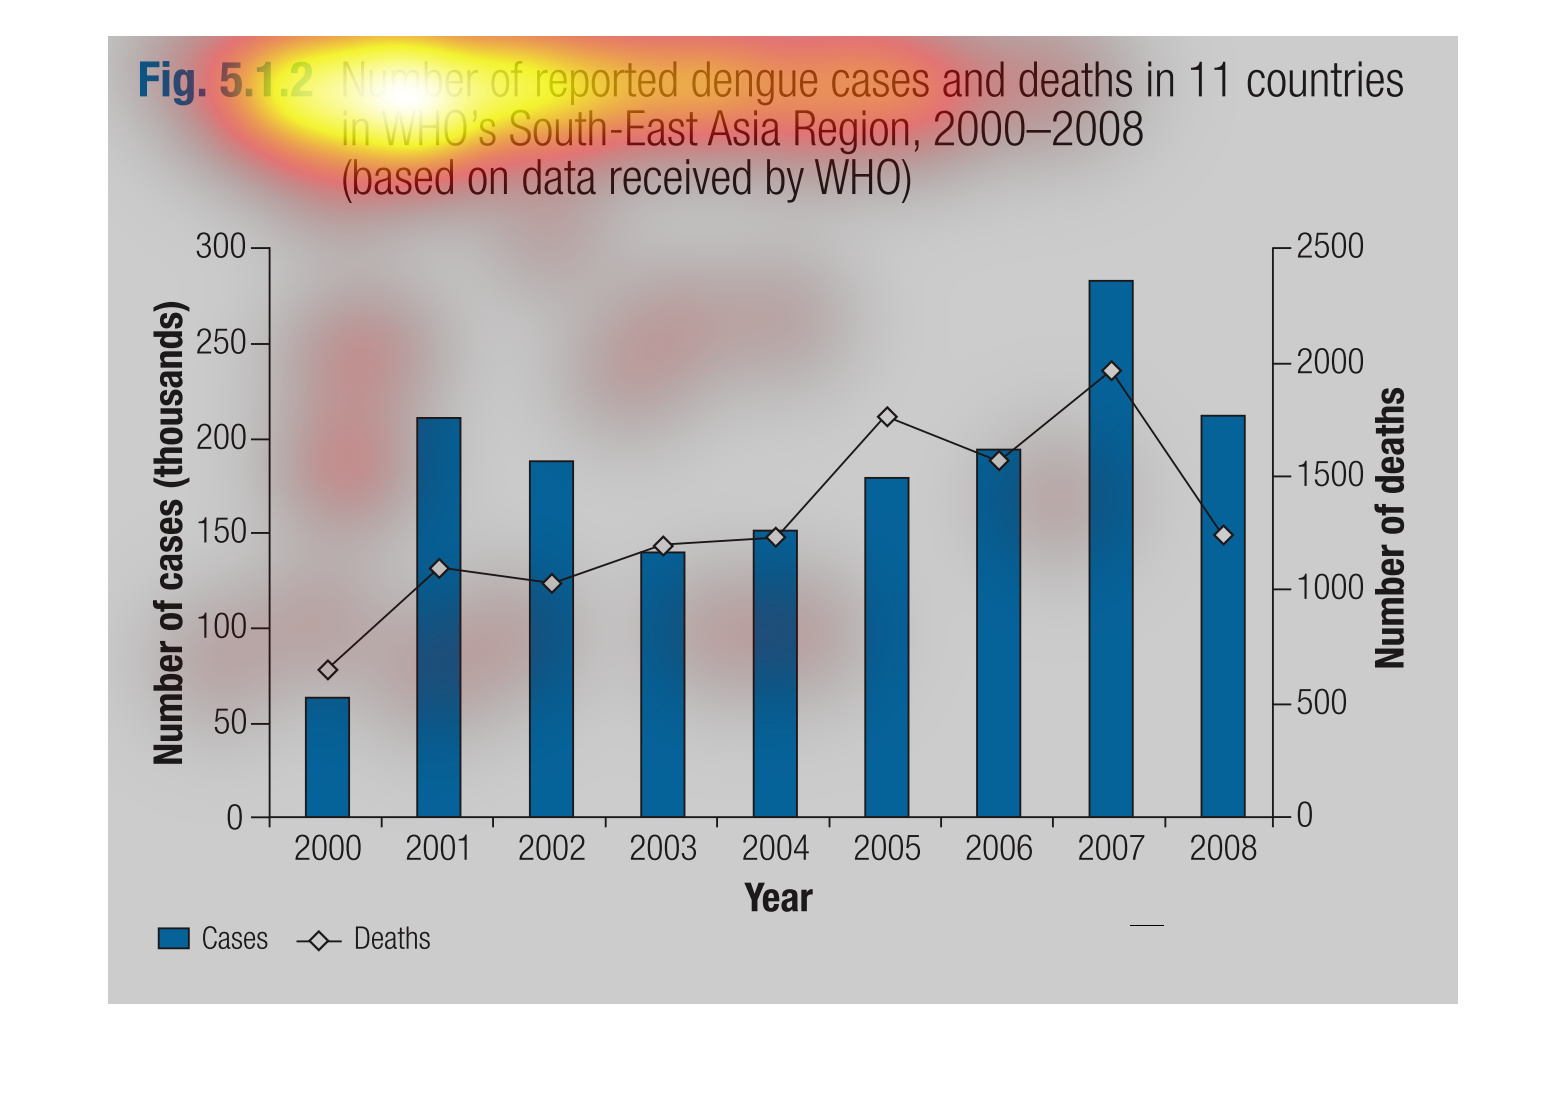
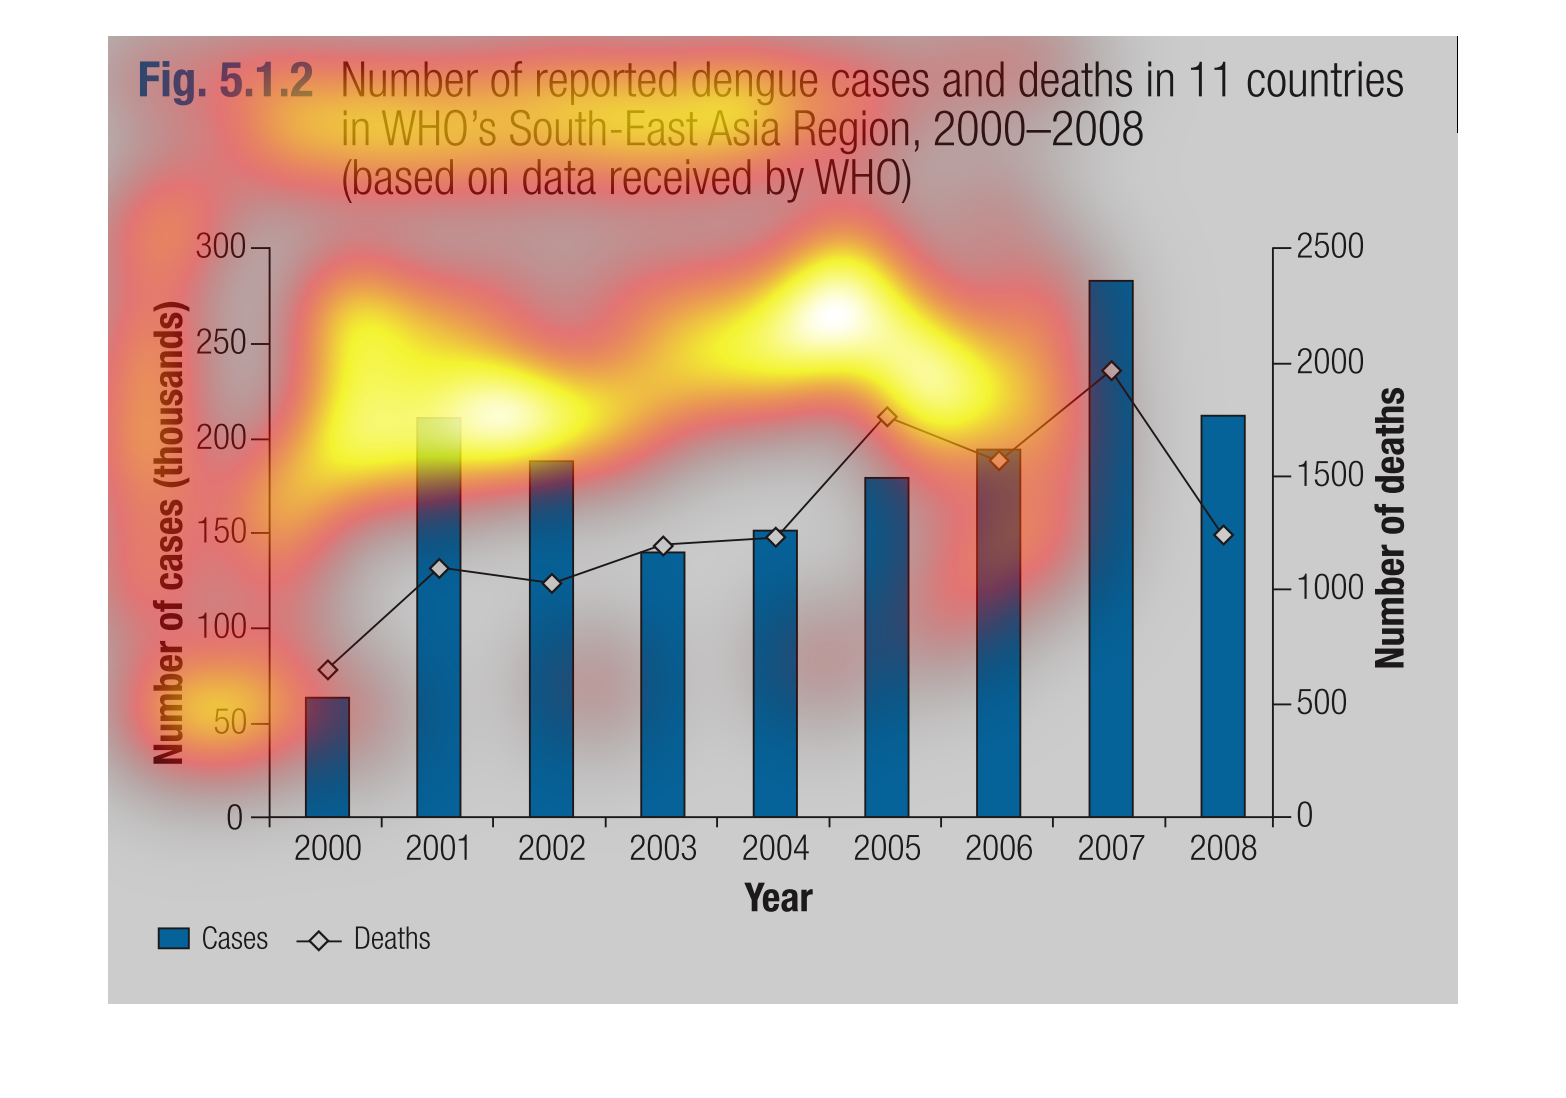
The graph shows the number of reported Dengue cases and deaths in 11 countries in Southeast
Asia between 200 and 2008.  2007 was the year with the most reported cases and deaths with
25000.
This bar graph demonstrates the number of dengue cases and deaths due to dengue in 11 South-East
Asia countries between 2000 and 2008. There was a spike in cases/deaths in 2001, after which
numbers waxed and waned but remained relatively similar. The greatest number of cases/deaths
was reported in 2007.
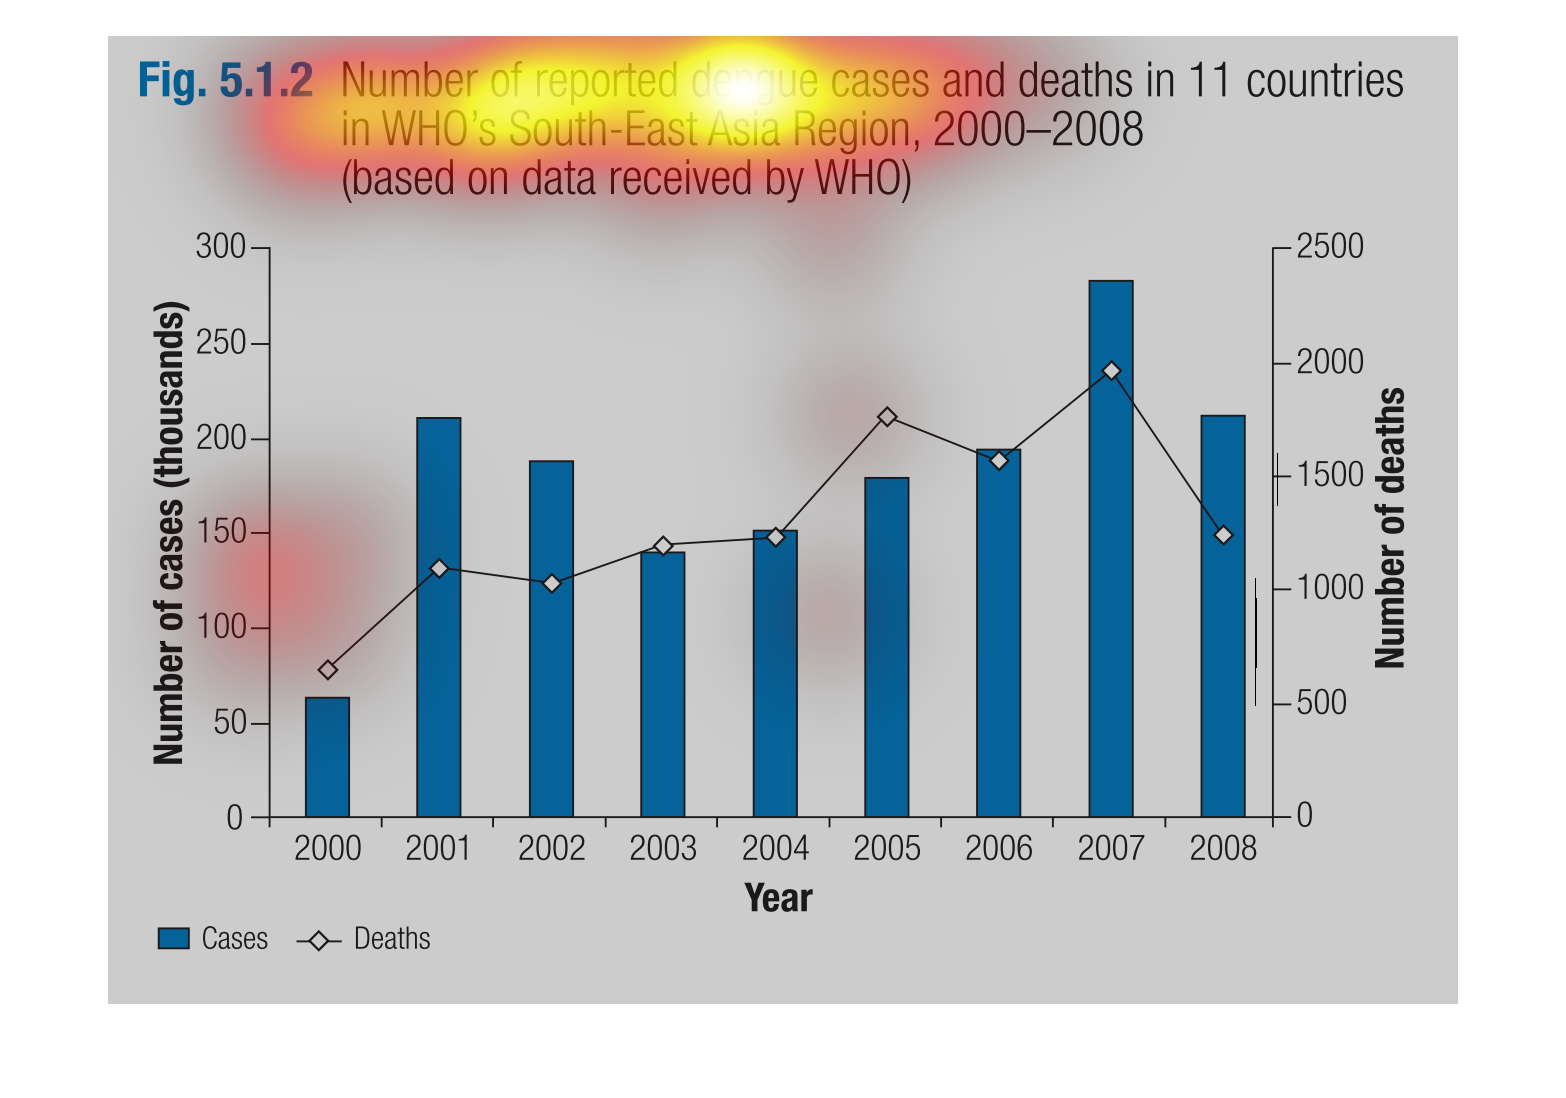
This graph illustrates the number of reported dengue cases and deaths in WHO's southeast Asia
region from 2000 to 2008.  It has both the number of cases and number of deaths.