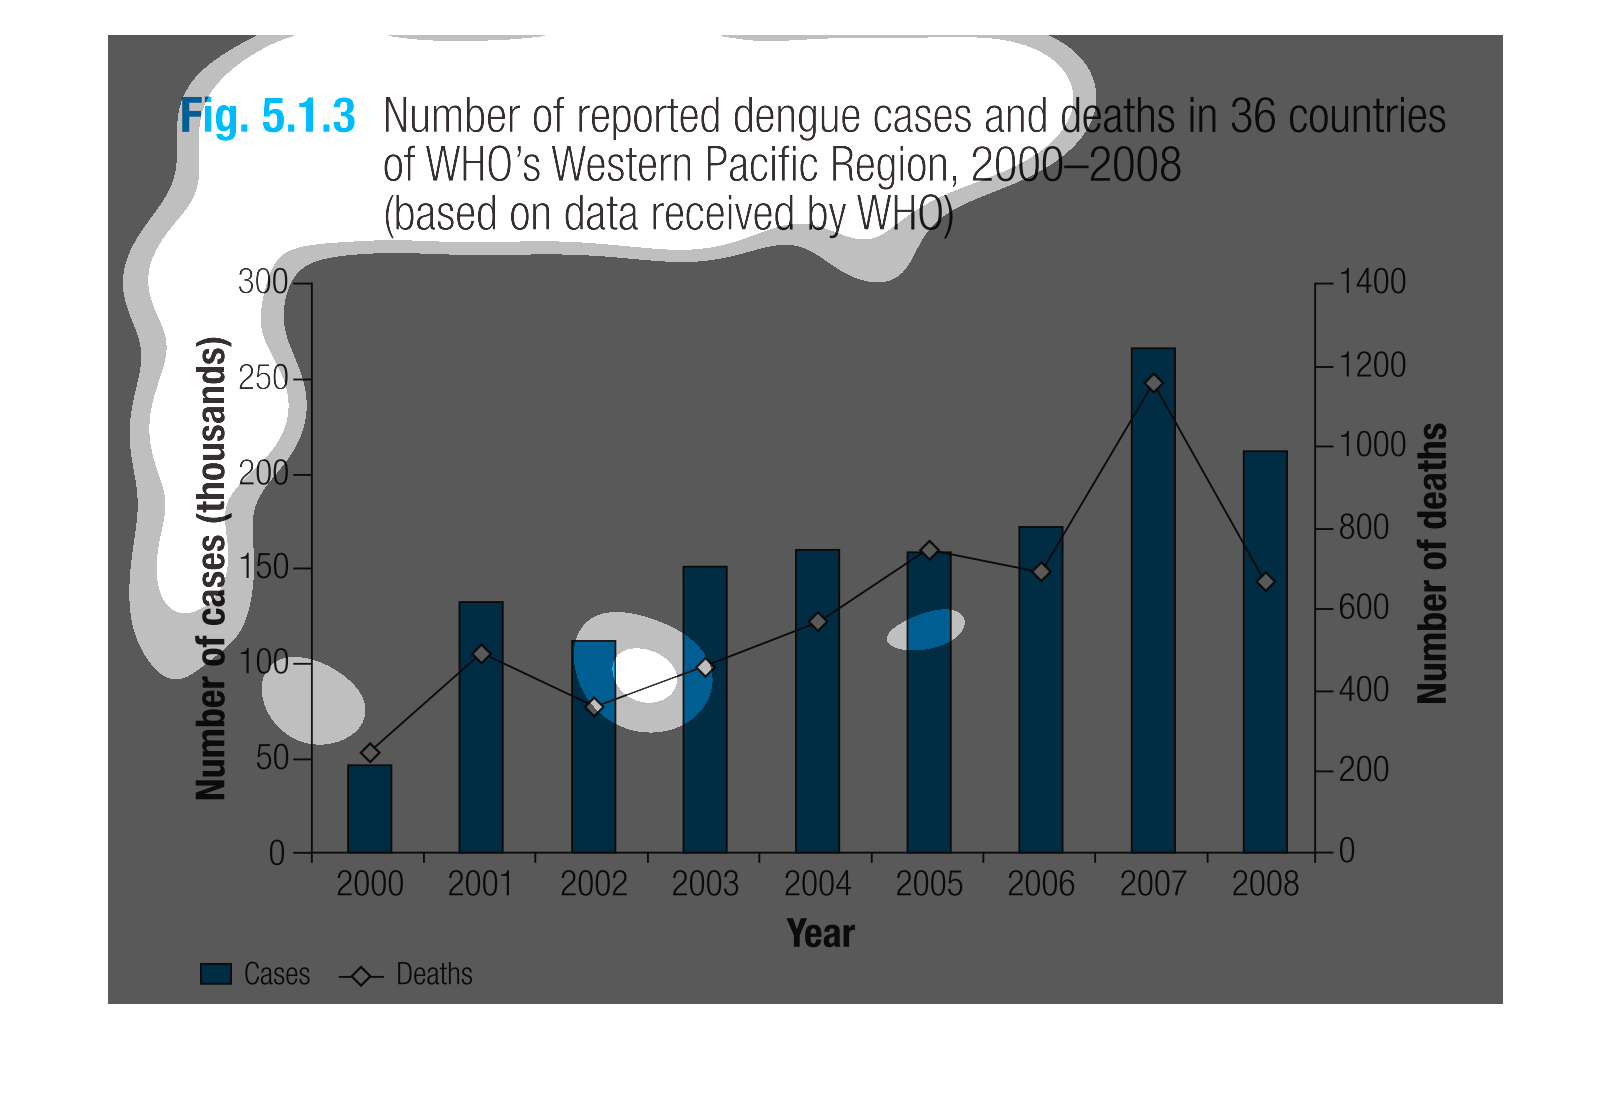
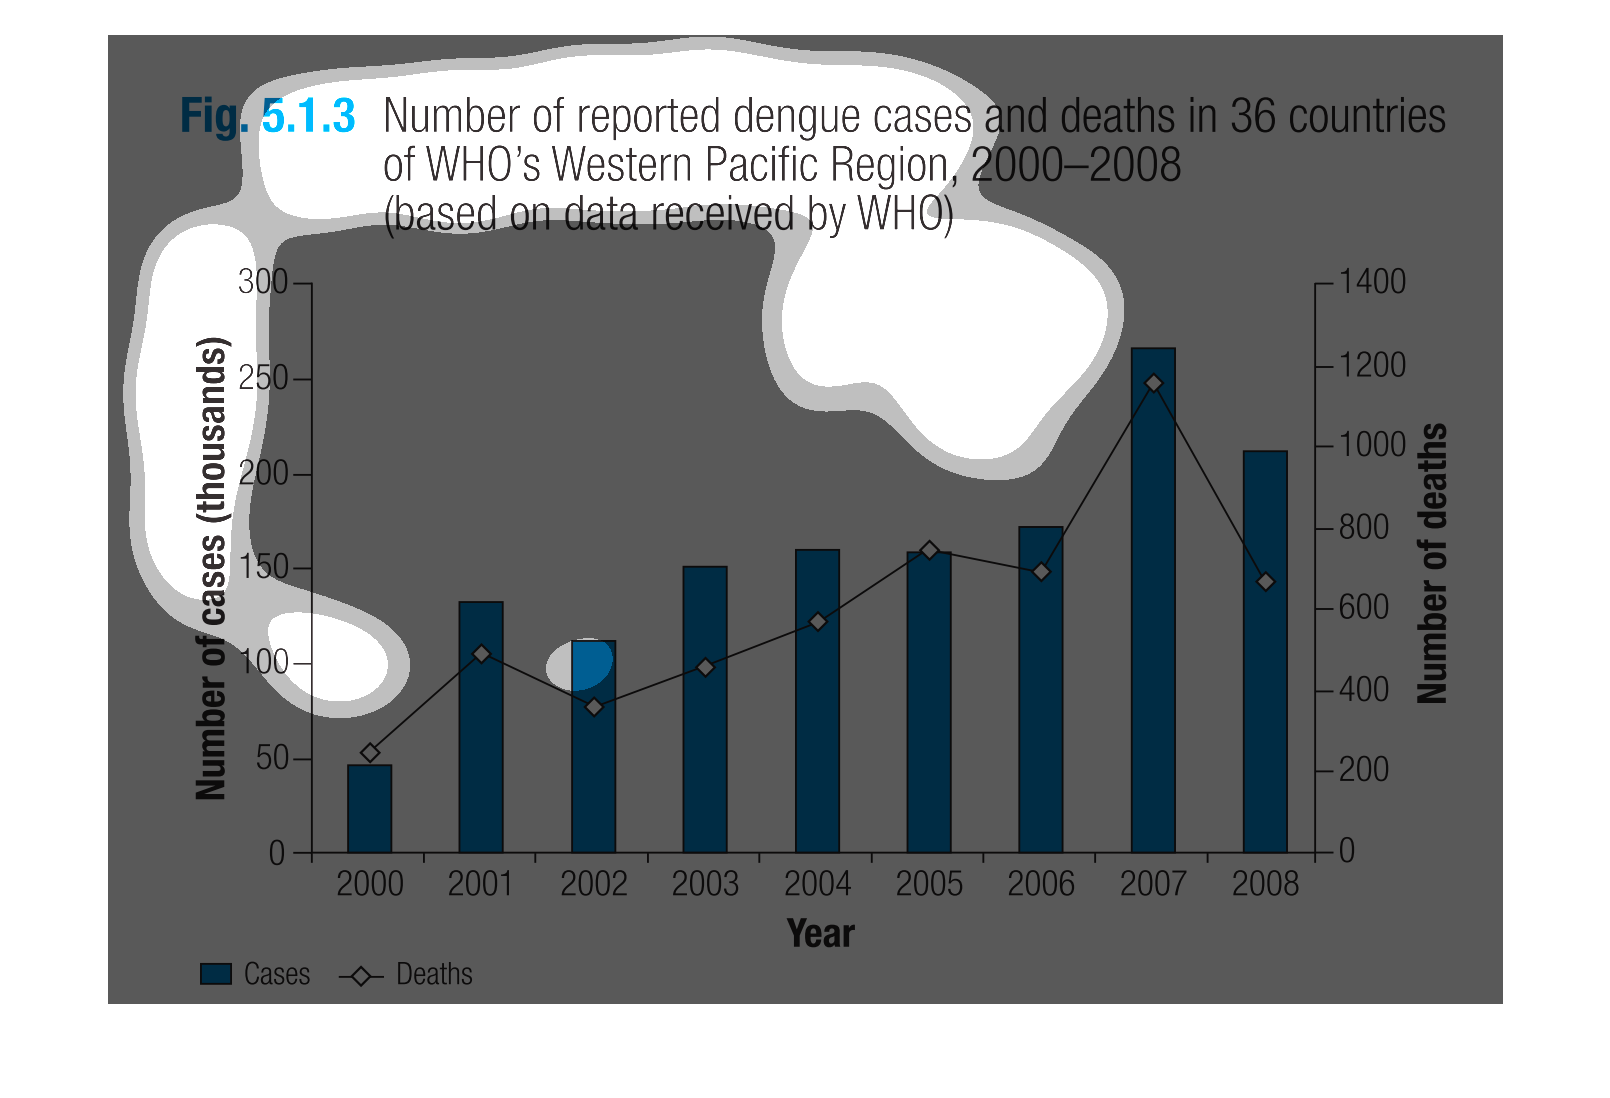
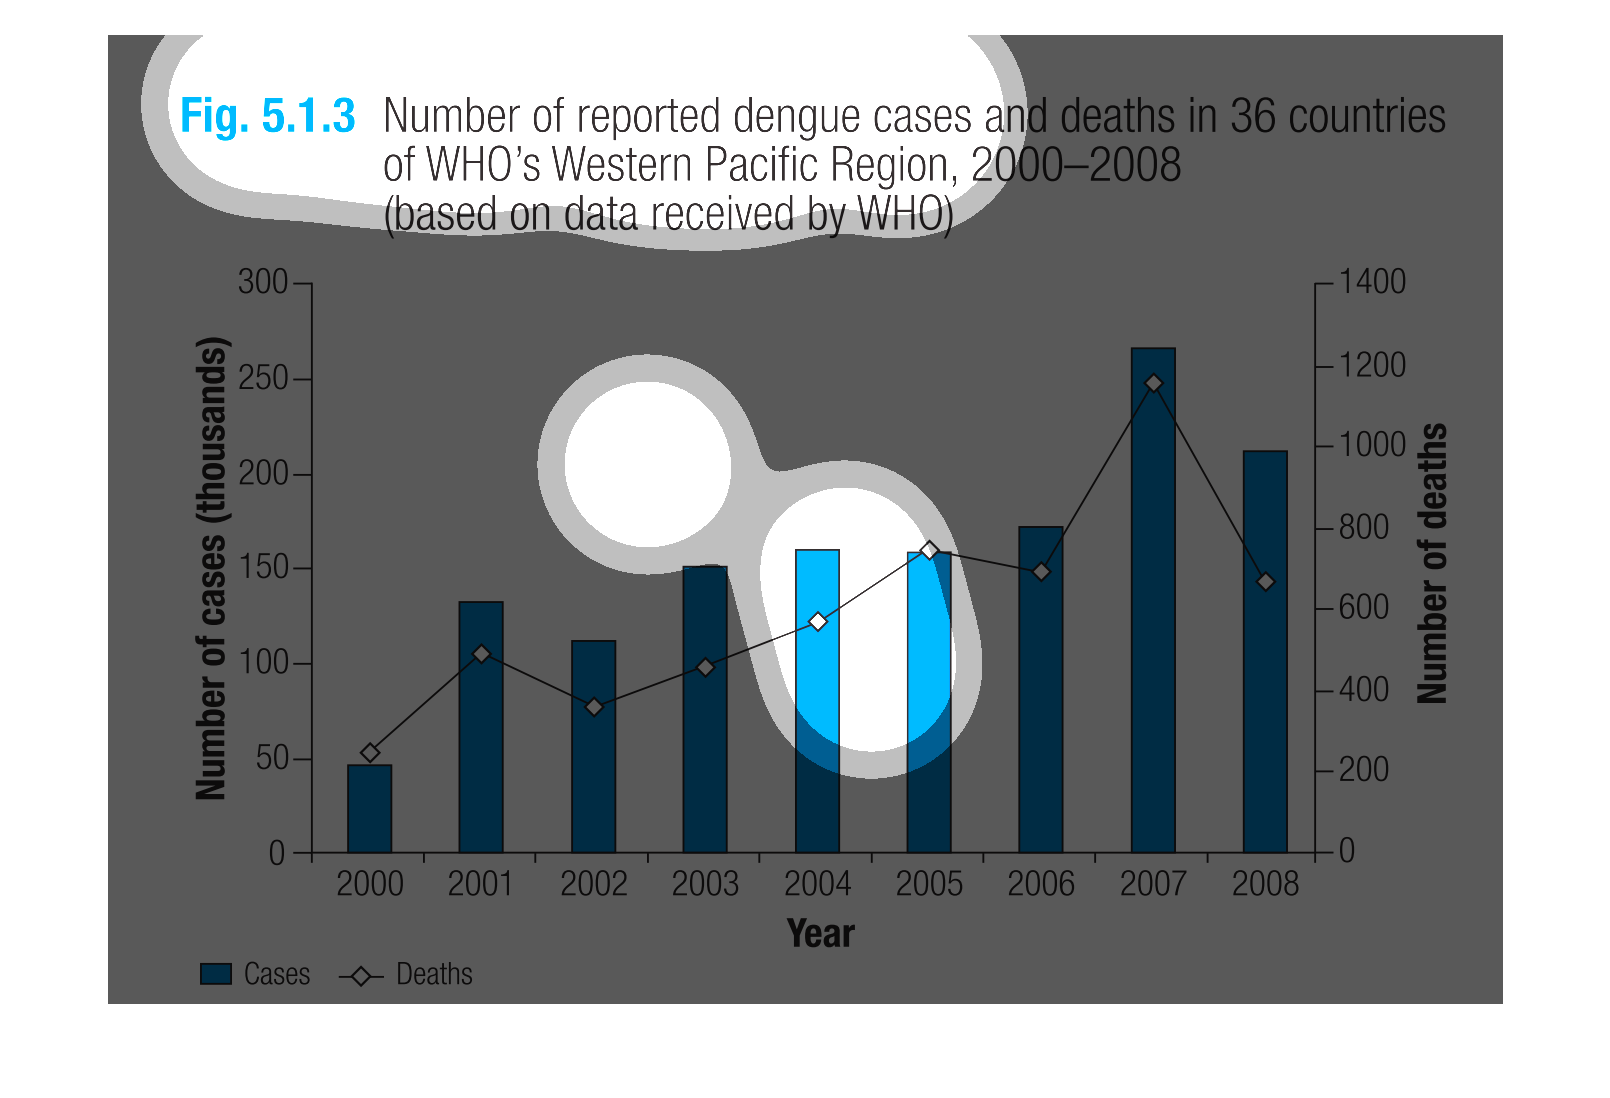
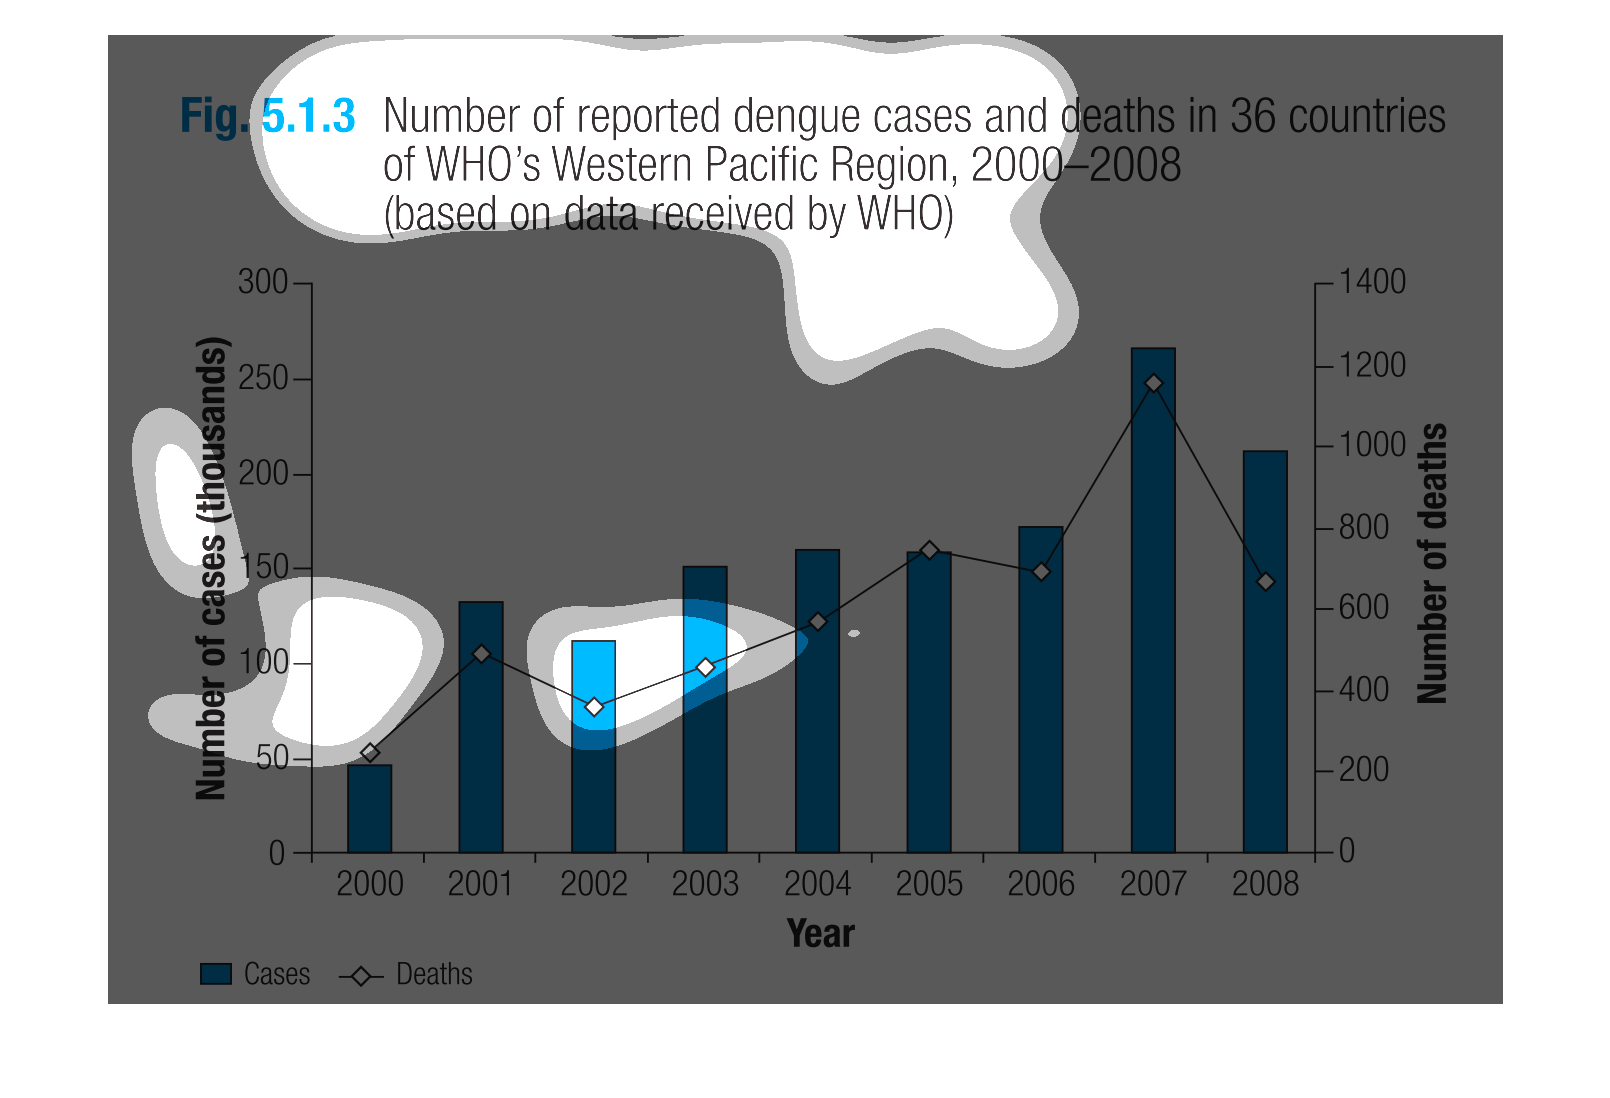
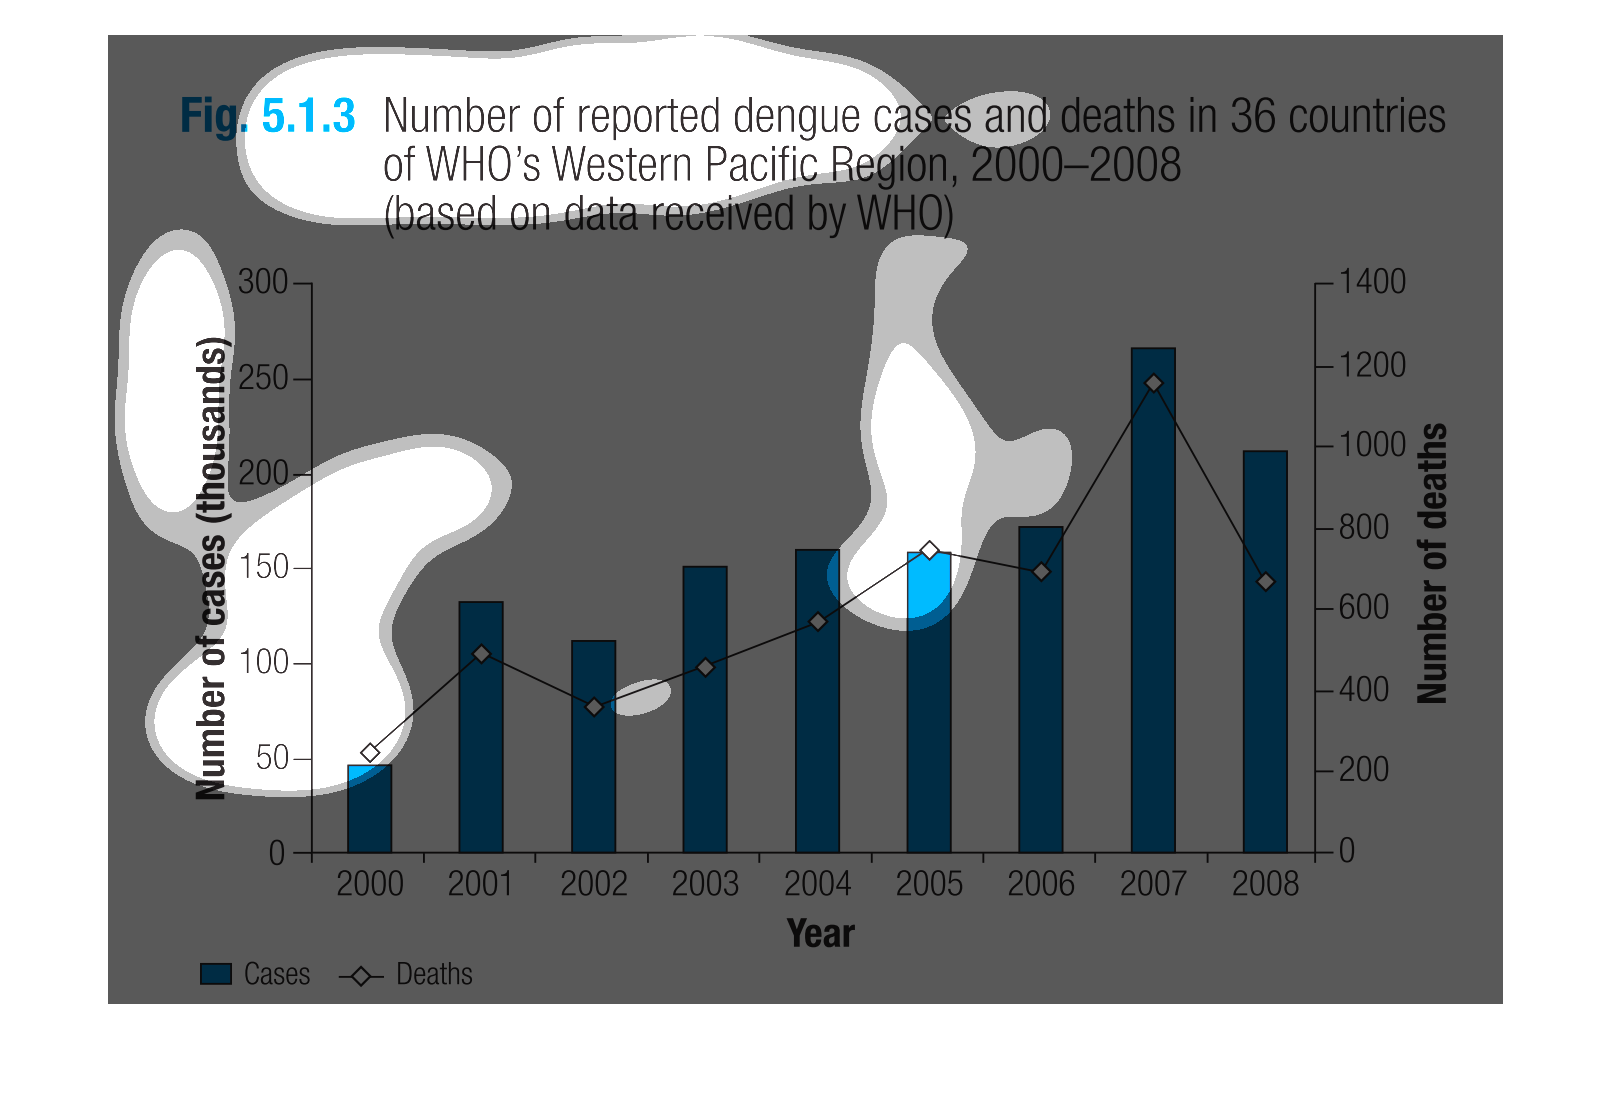
This chart describes number of reported dengue cases and deaths in 36 countries of WHO Western
Pacific region, for the years 2000 through to the year 2008.
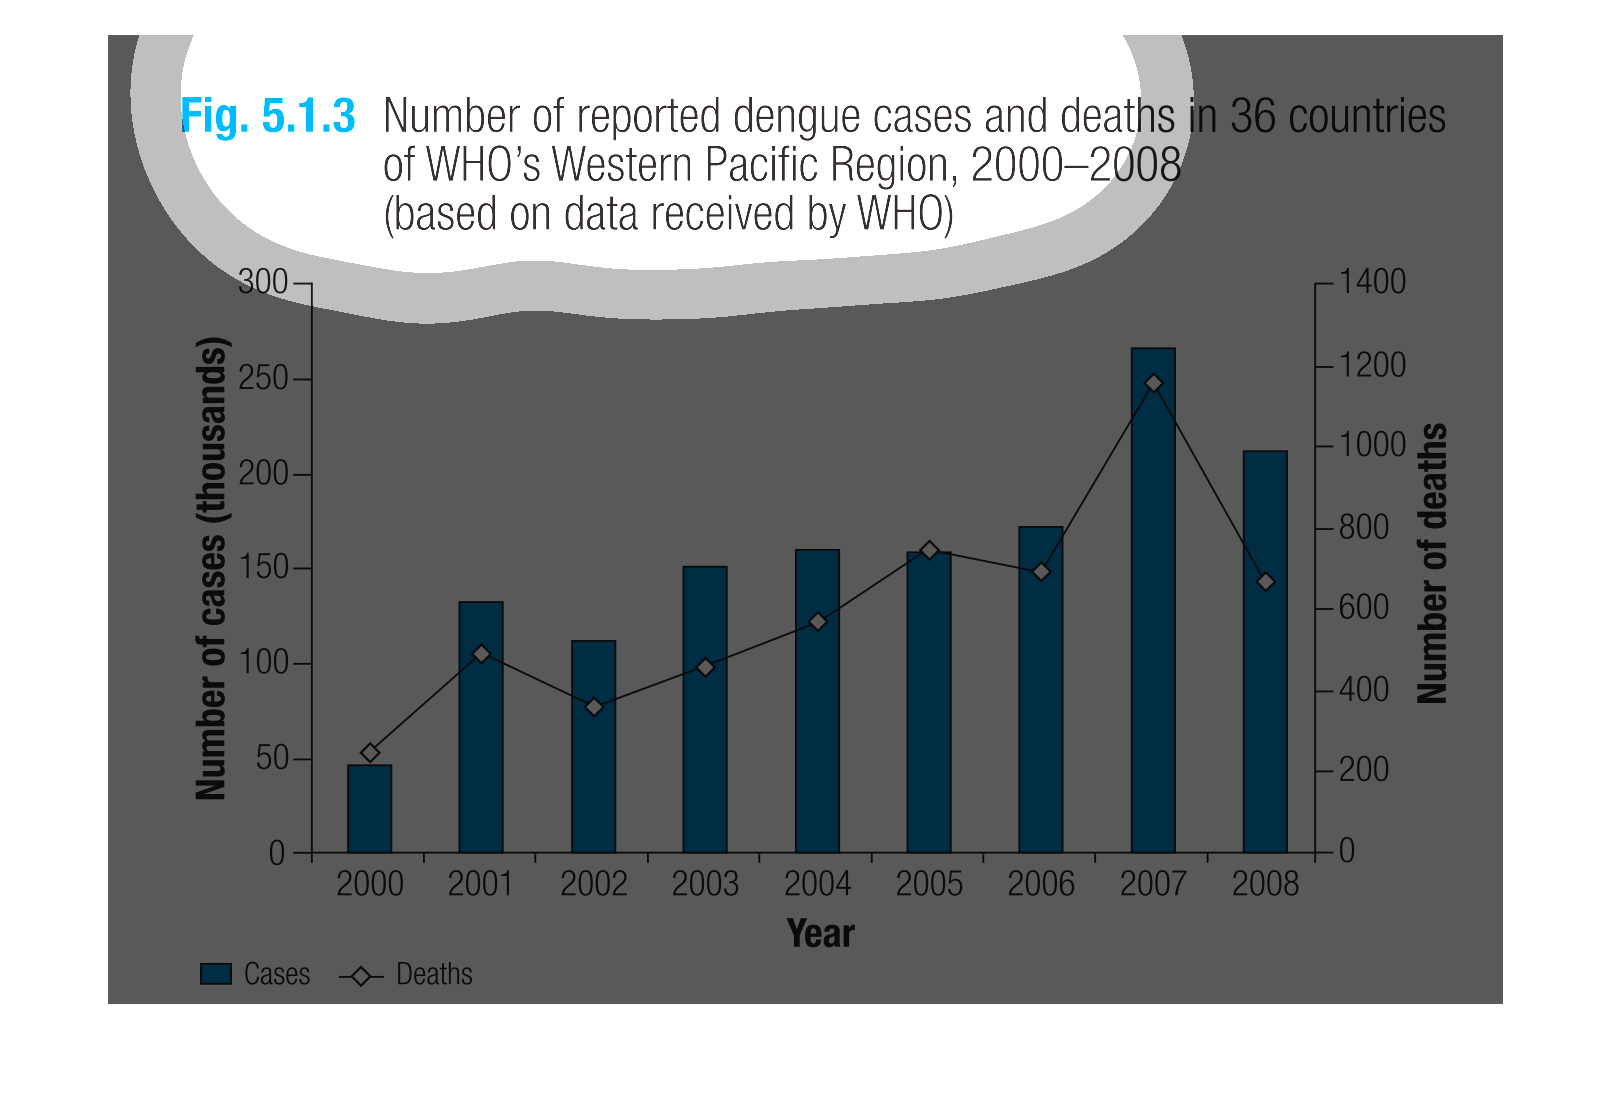
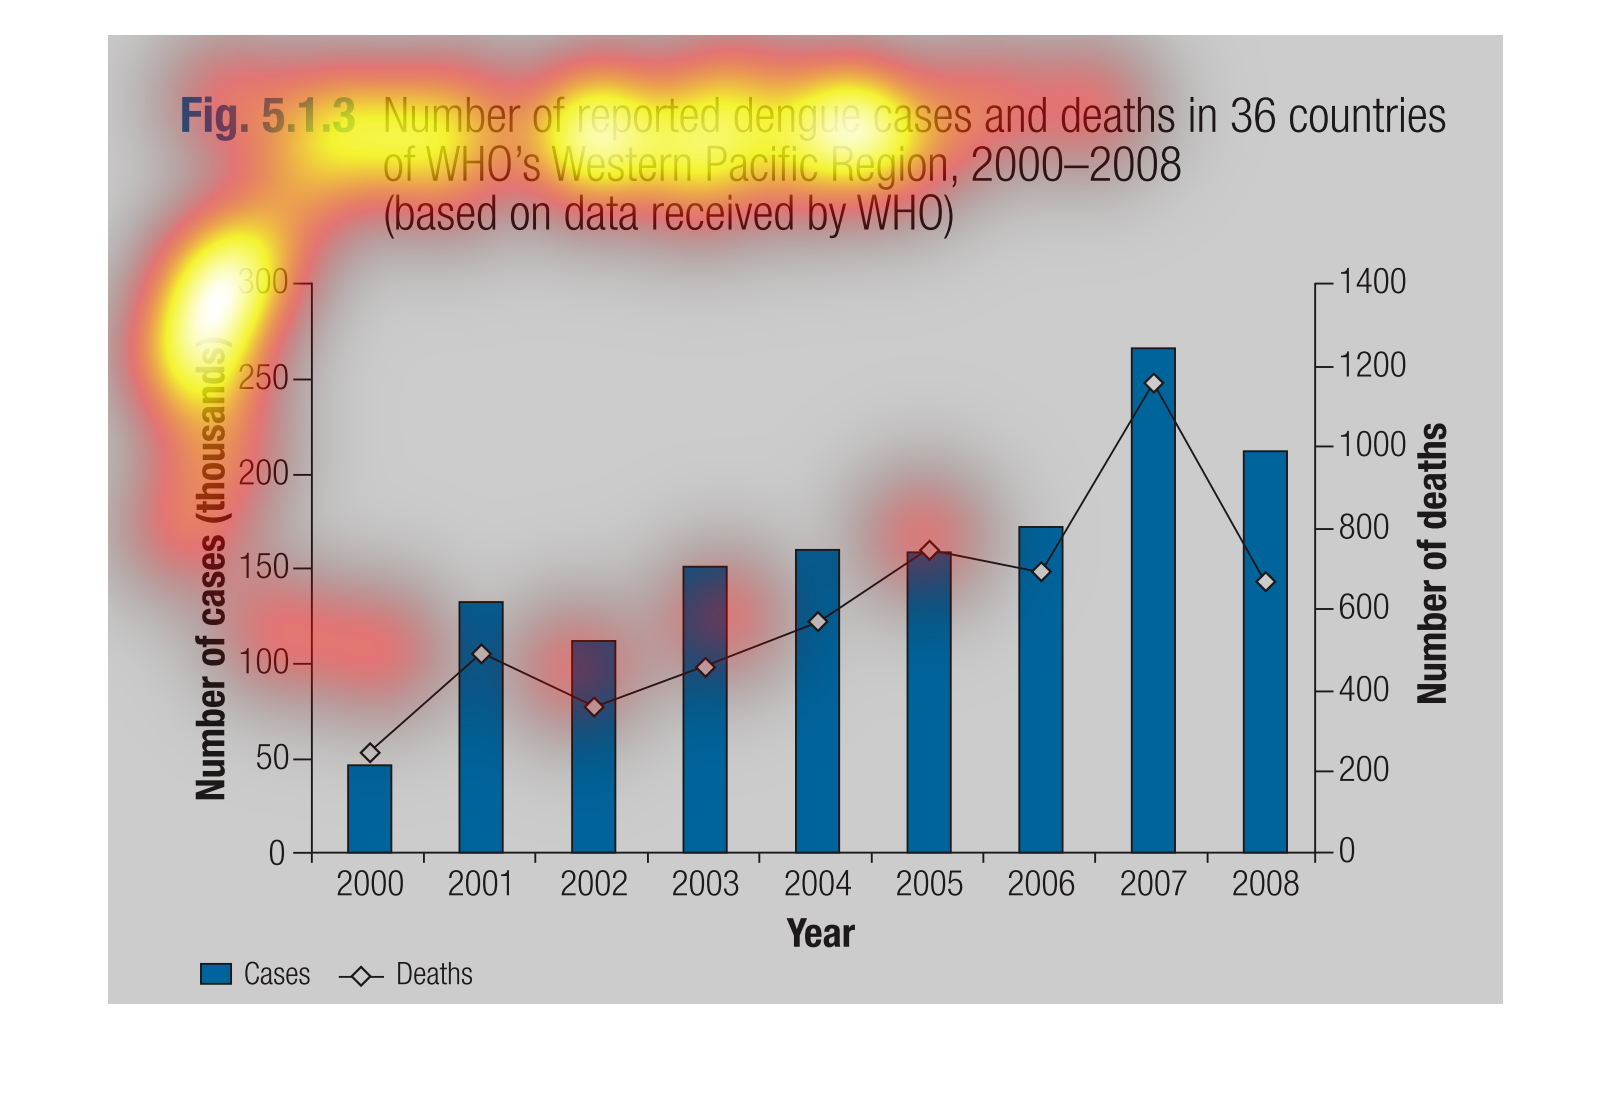
This graph shows the number of reported dengue cases and deaths in 36 countries of WHO's western
pacific region for 2000-2008. The year that had the most reported deaths and cases was 2007
at approximately 1300, while 2000 had the fewest at 200. There were approximately 250,000
cases in 2007.
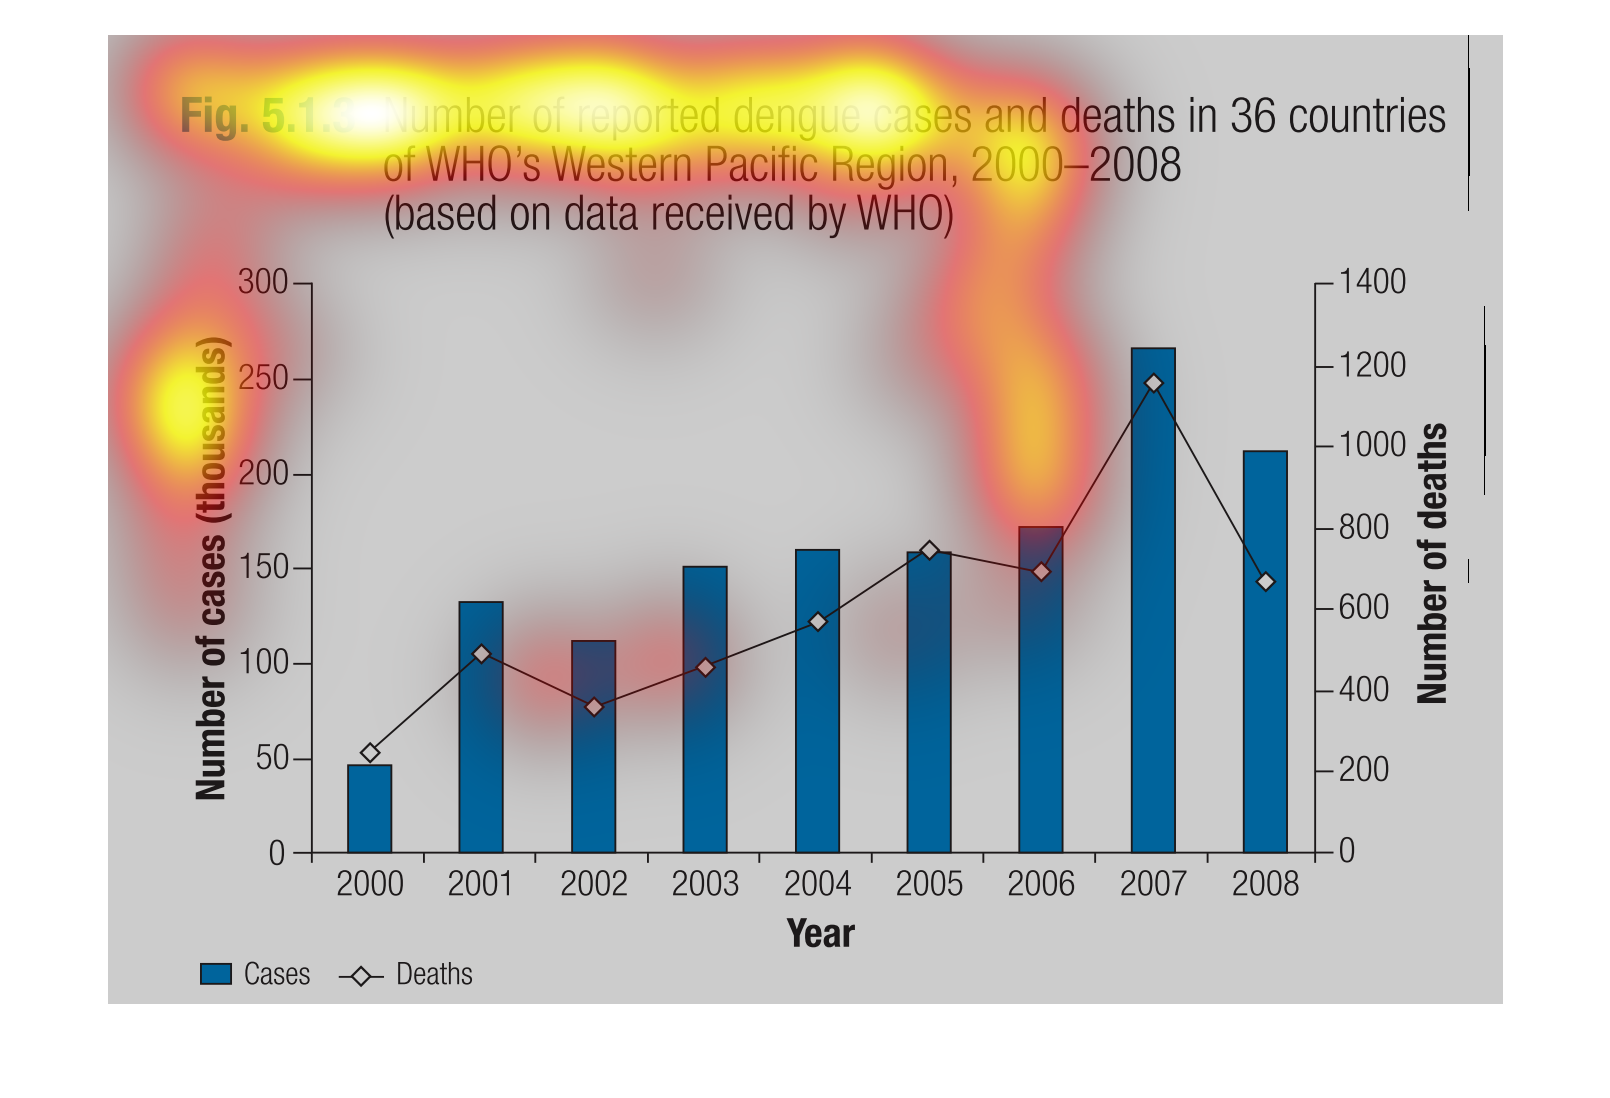
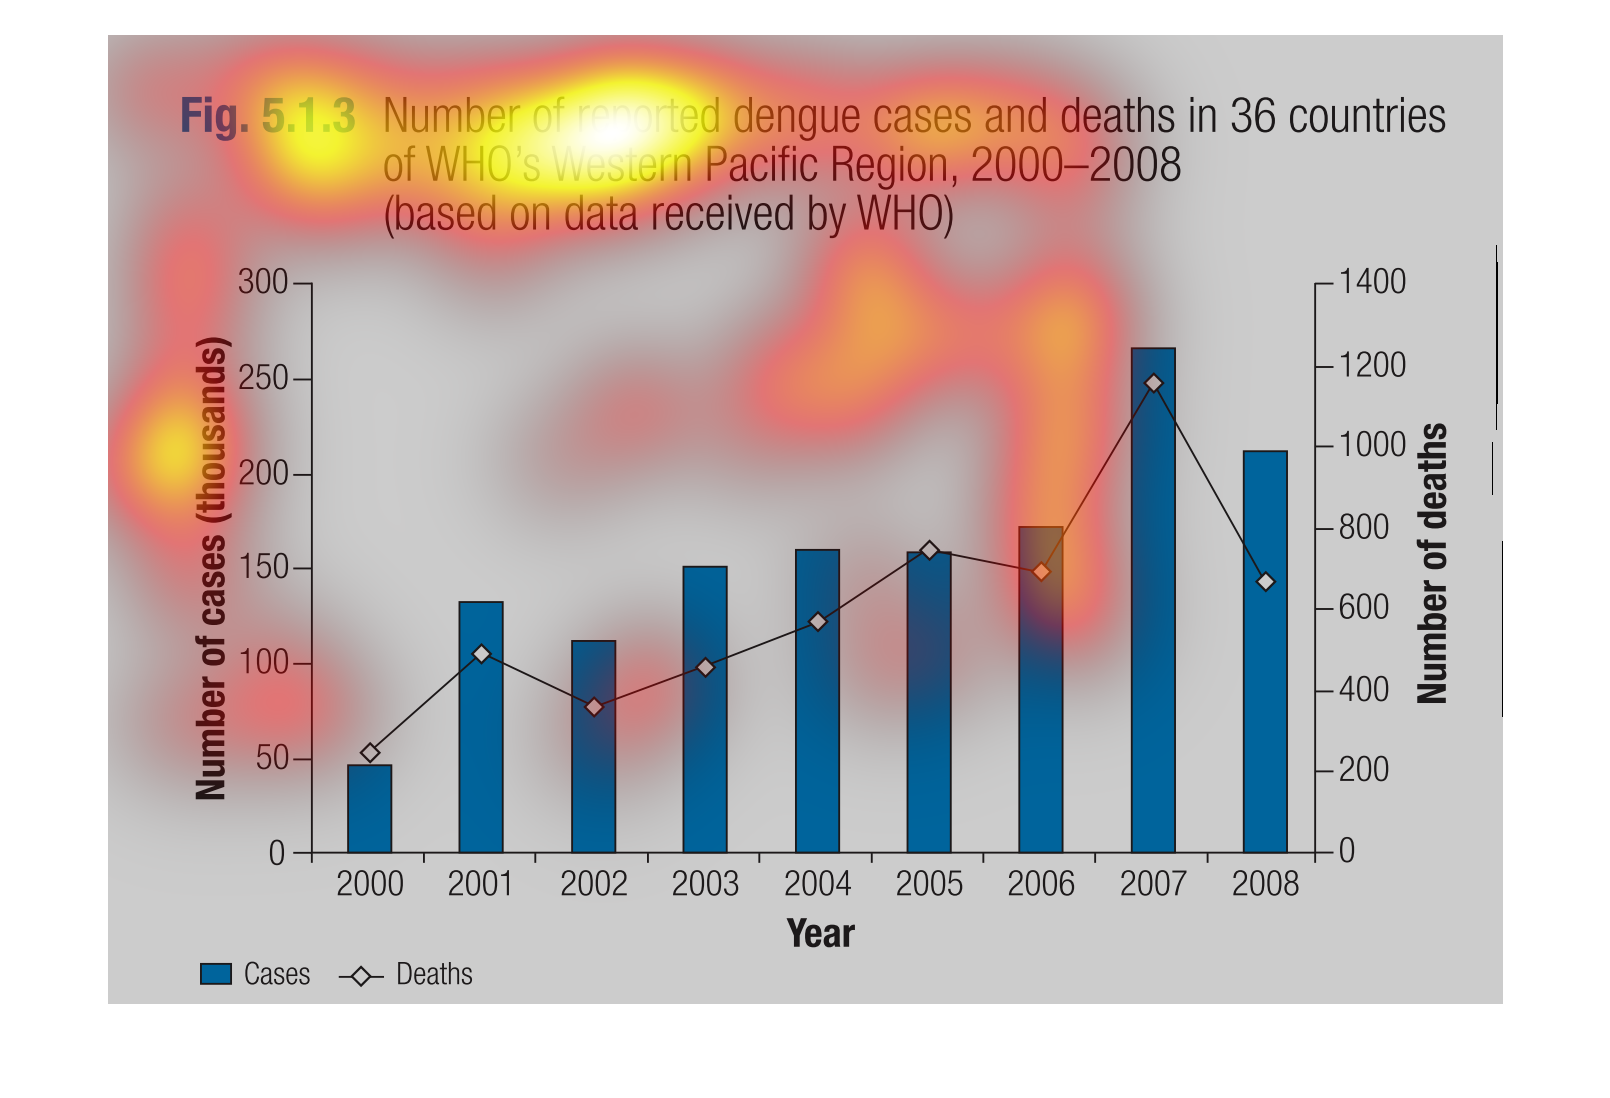
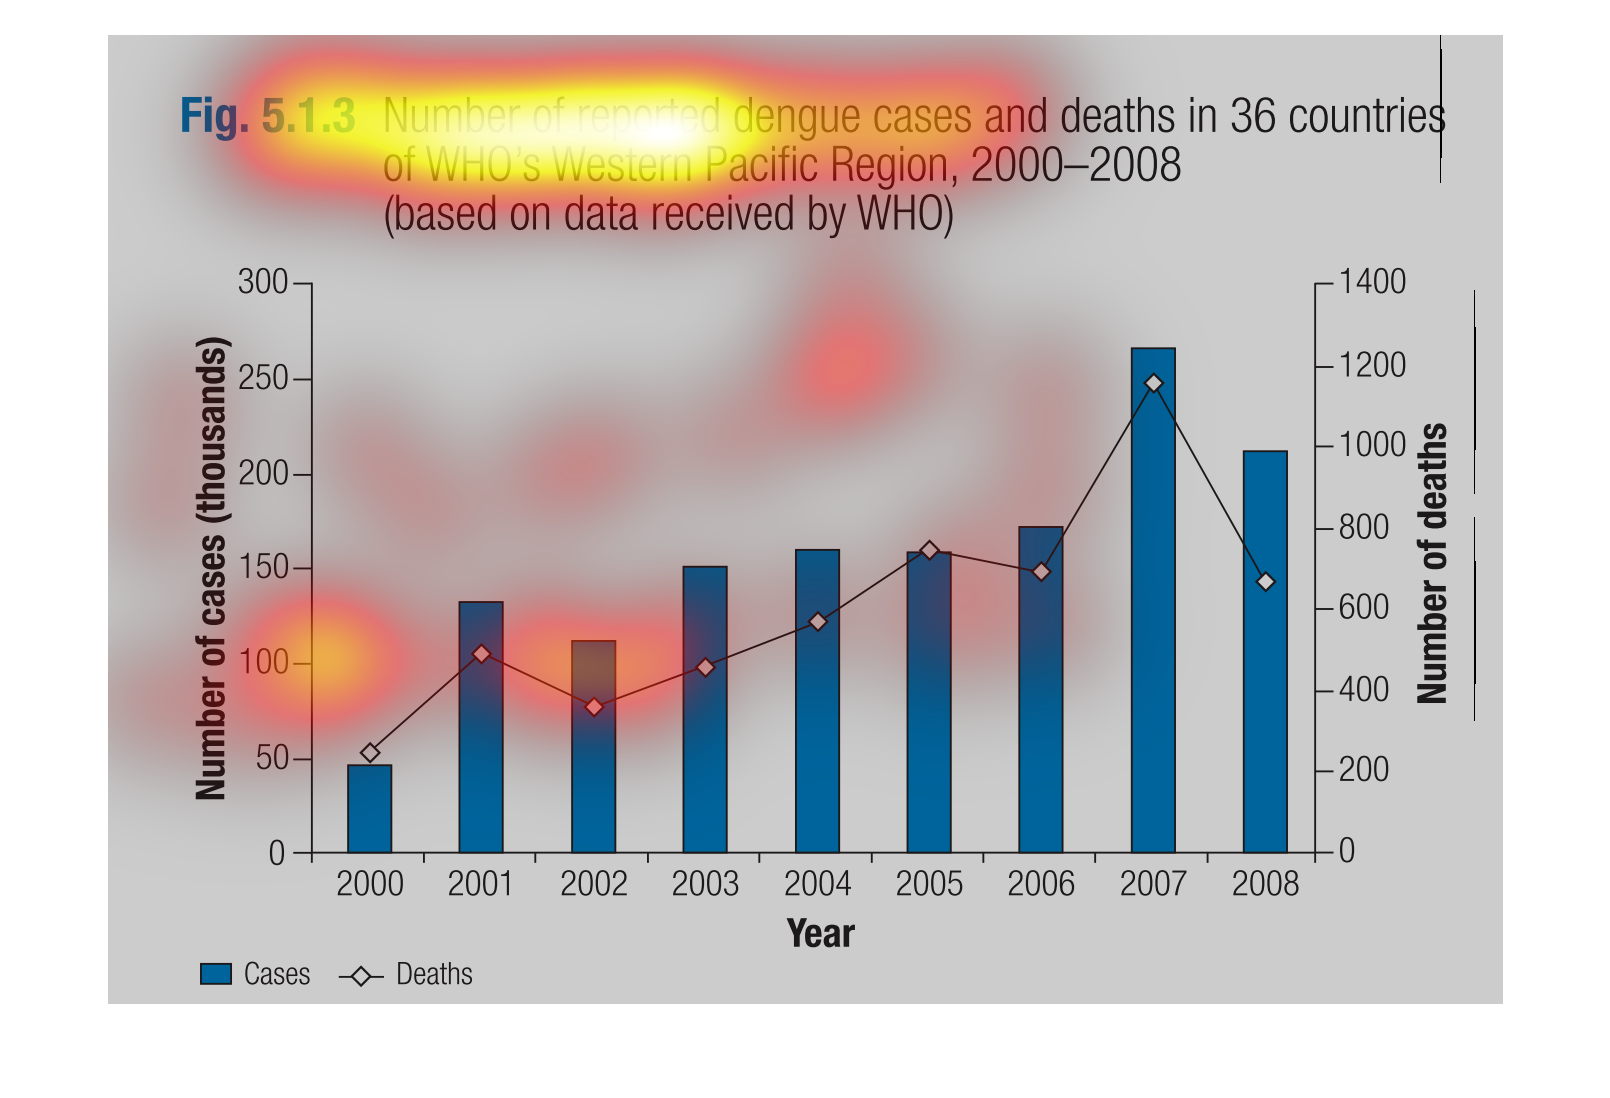
Number of reported dengue cases and deaths in 36 countries of WHO'S Western Pacific Region,
2000-2008 (based on data recieved by WHO). 250,000 deaths, the most were in 2007, the smallest
in the year 2000 at 50,000, steadily increased till 2008 then dropped the following year.
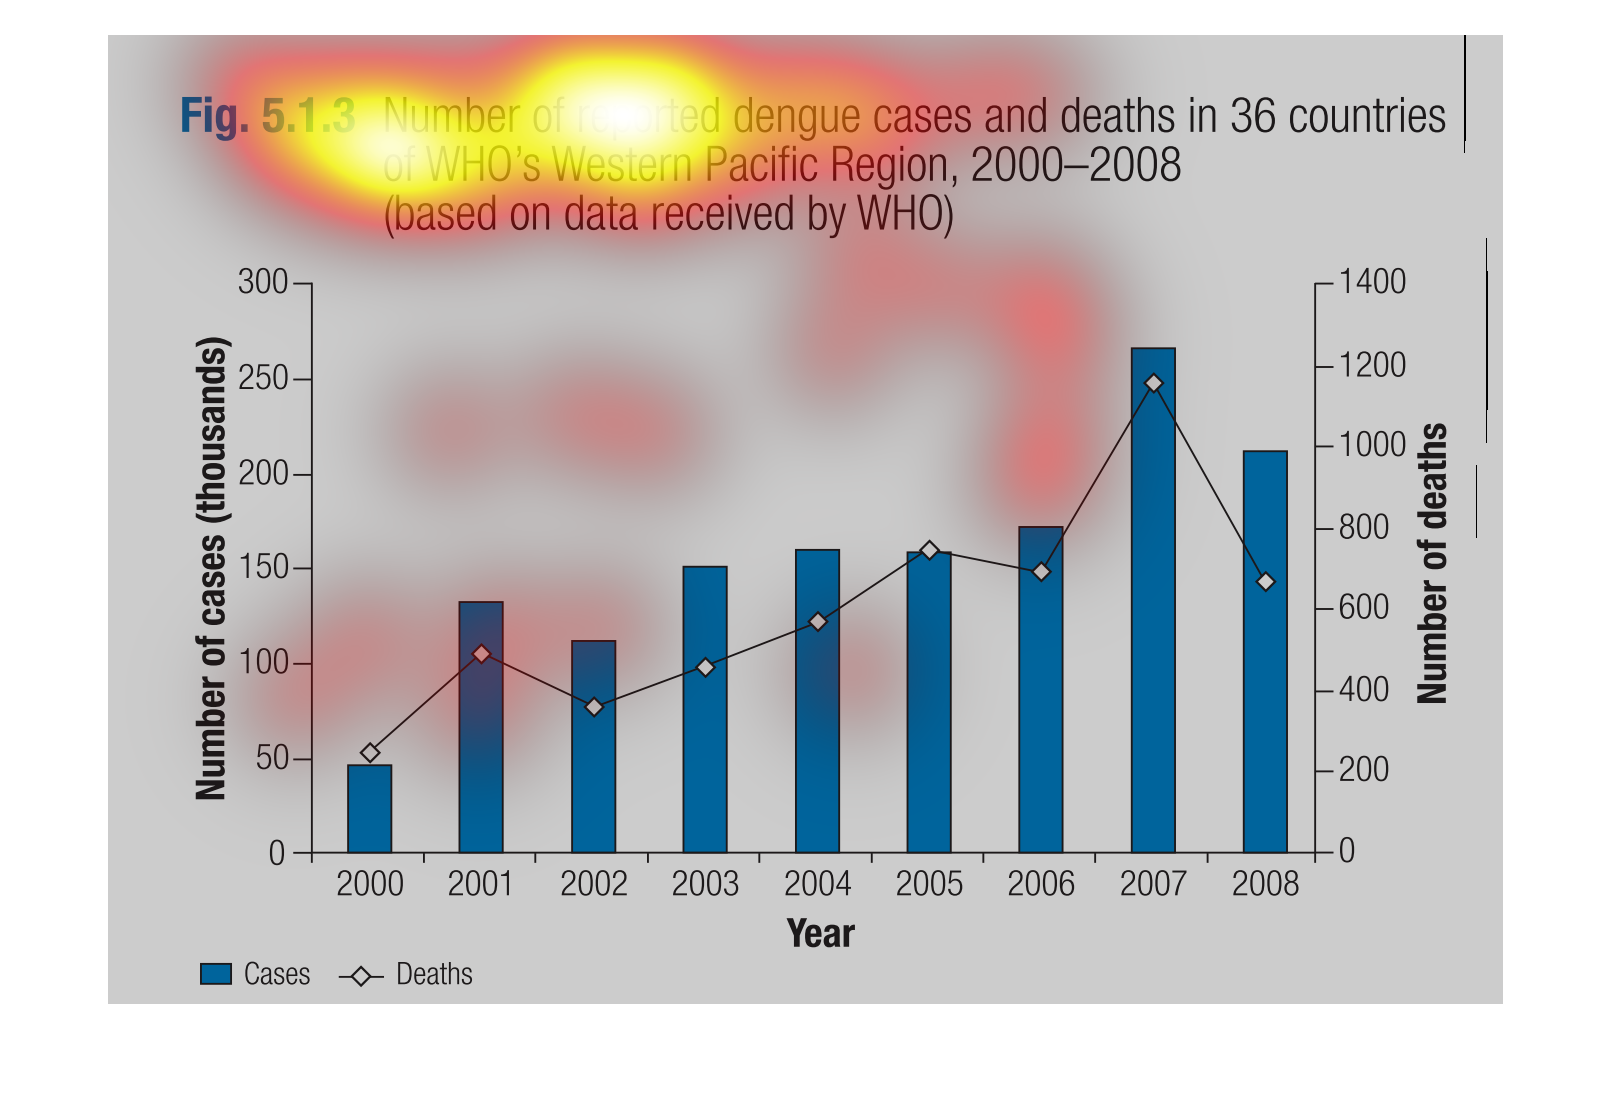
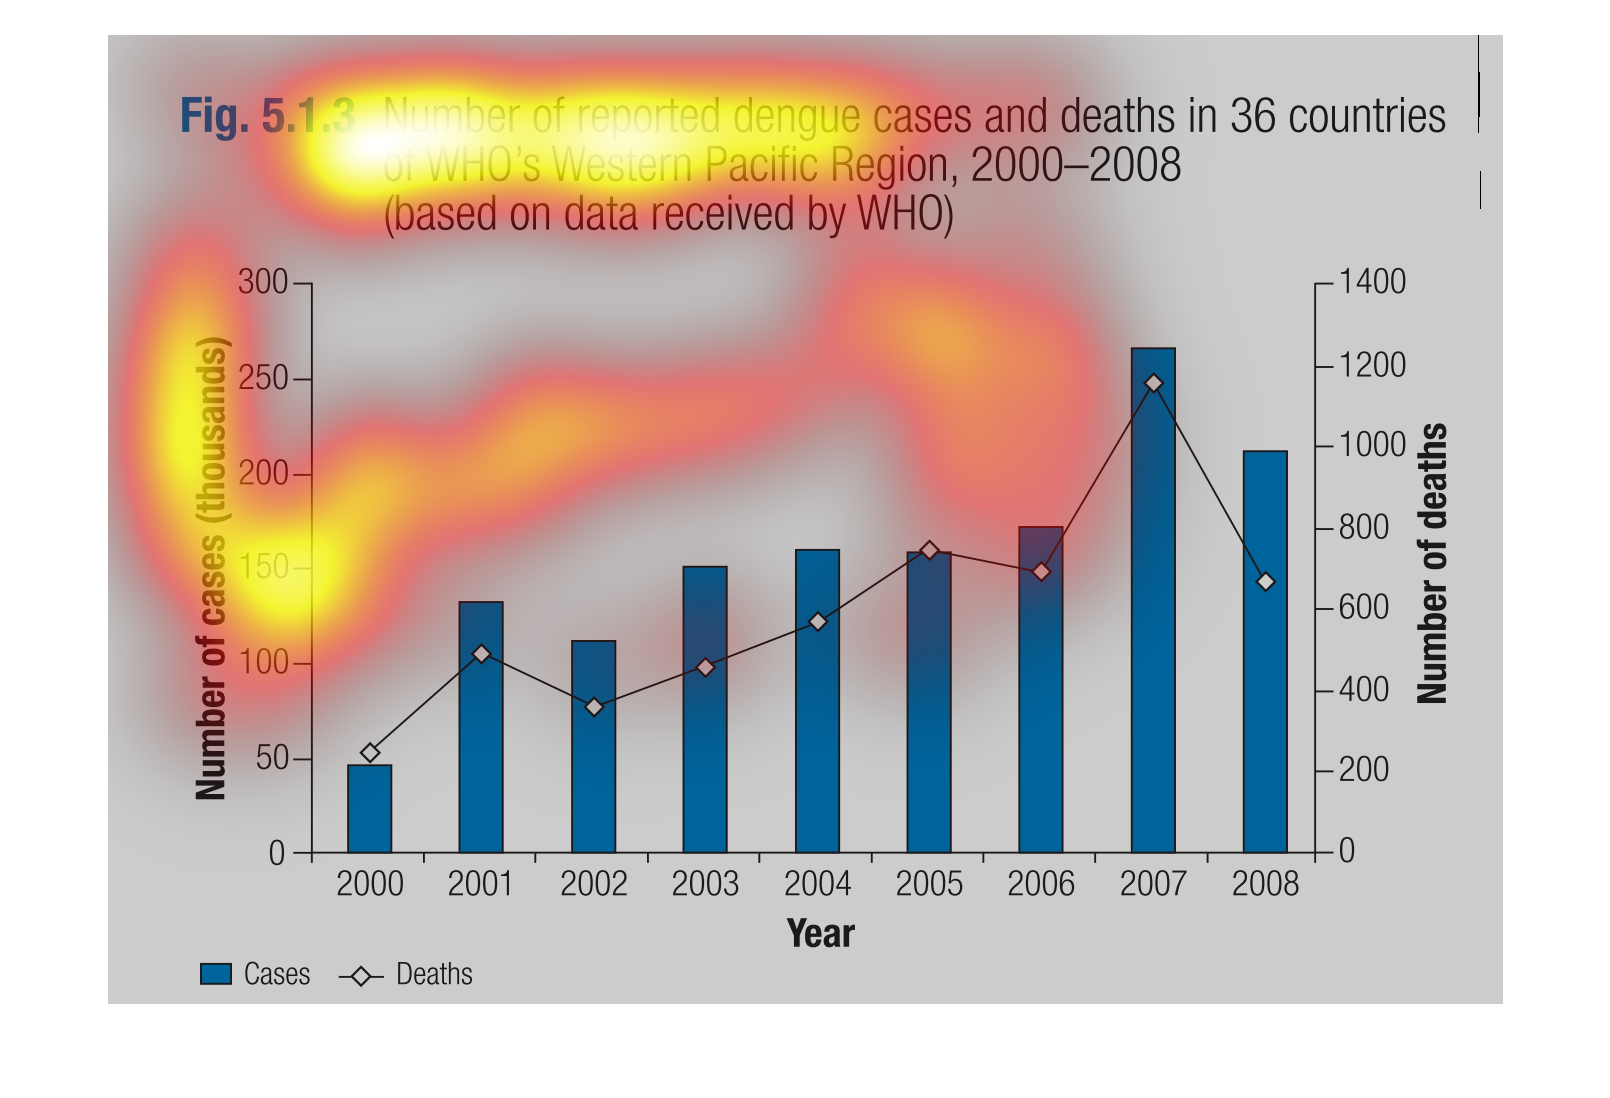
This graph measures the amount of dengue and deaths in the East Pacific region. Year is on
the X-Axis and the amount of deaths are on the right Y-Axis.
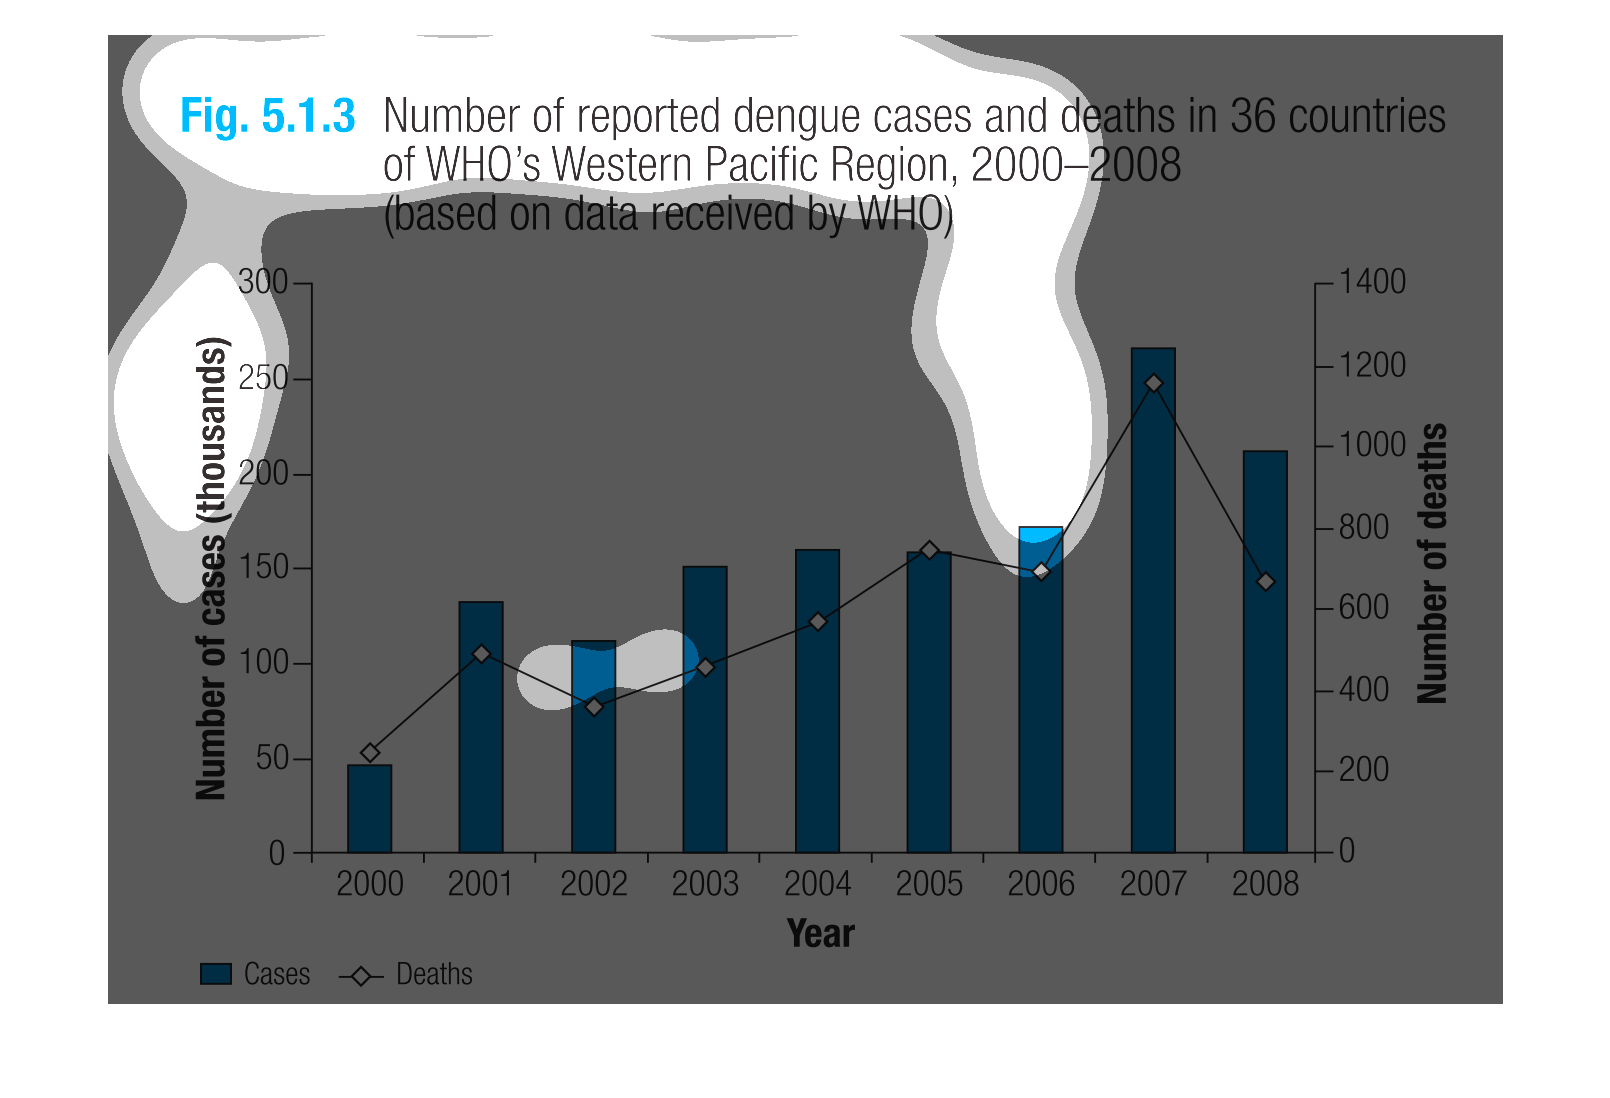
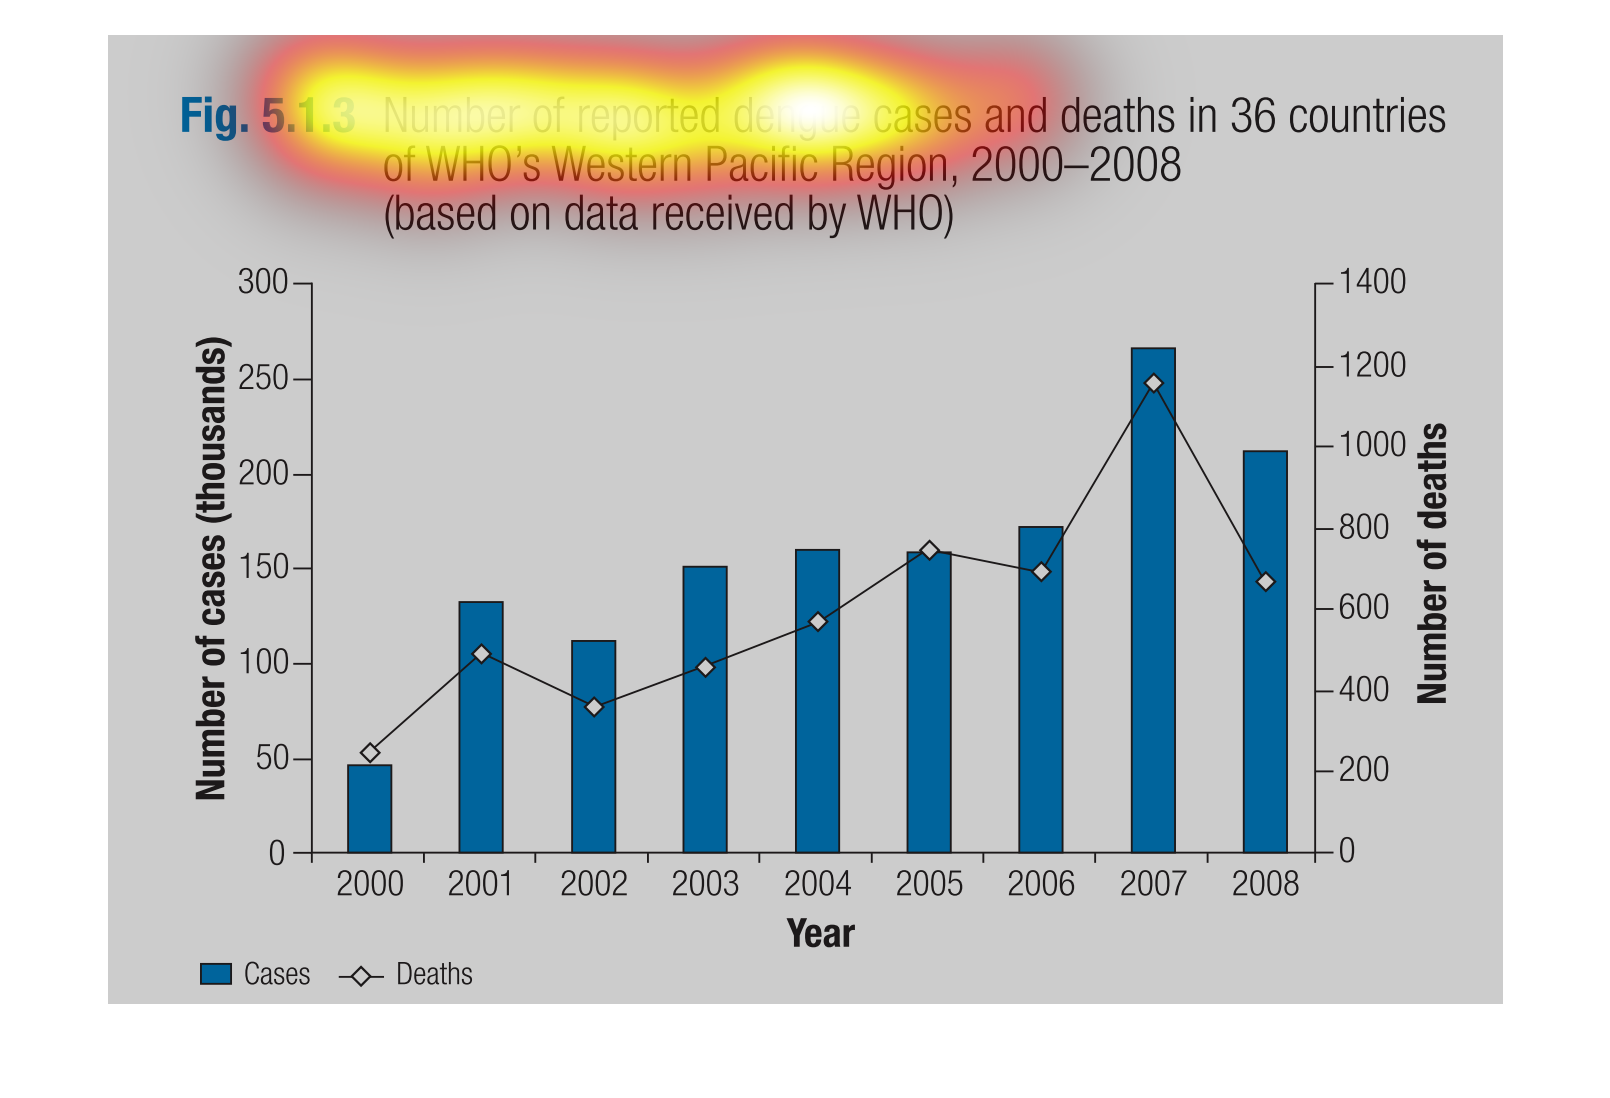
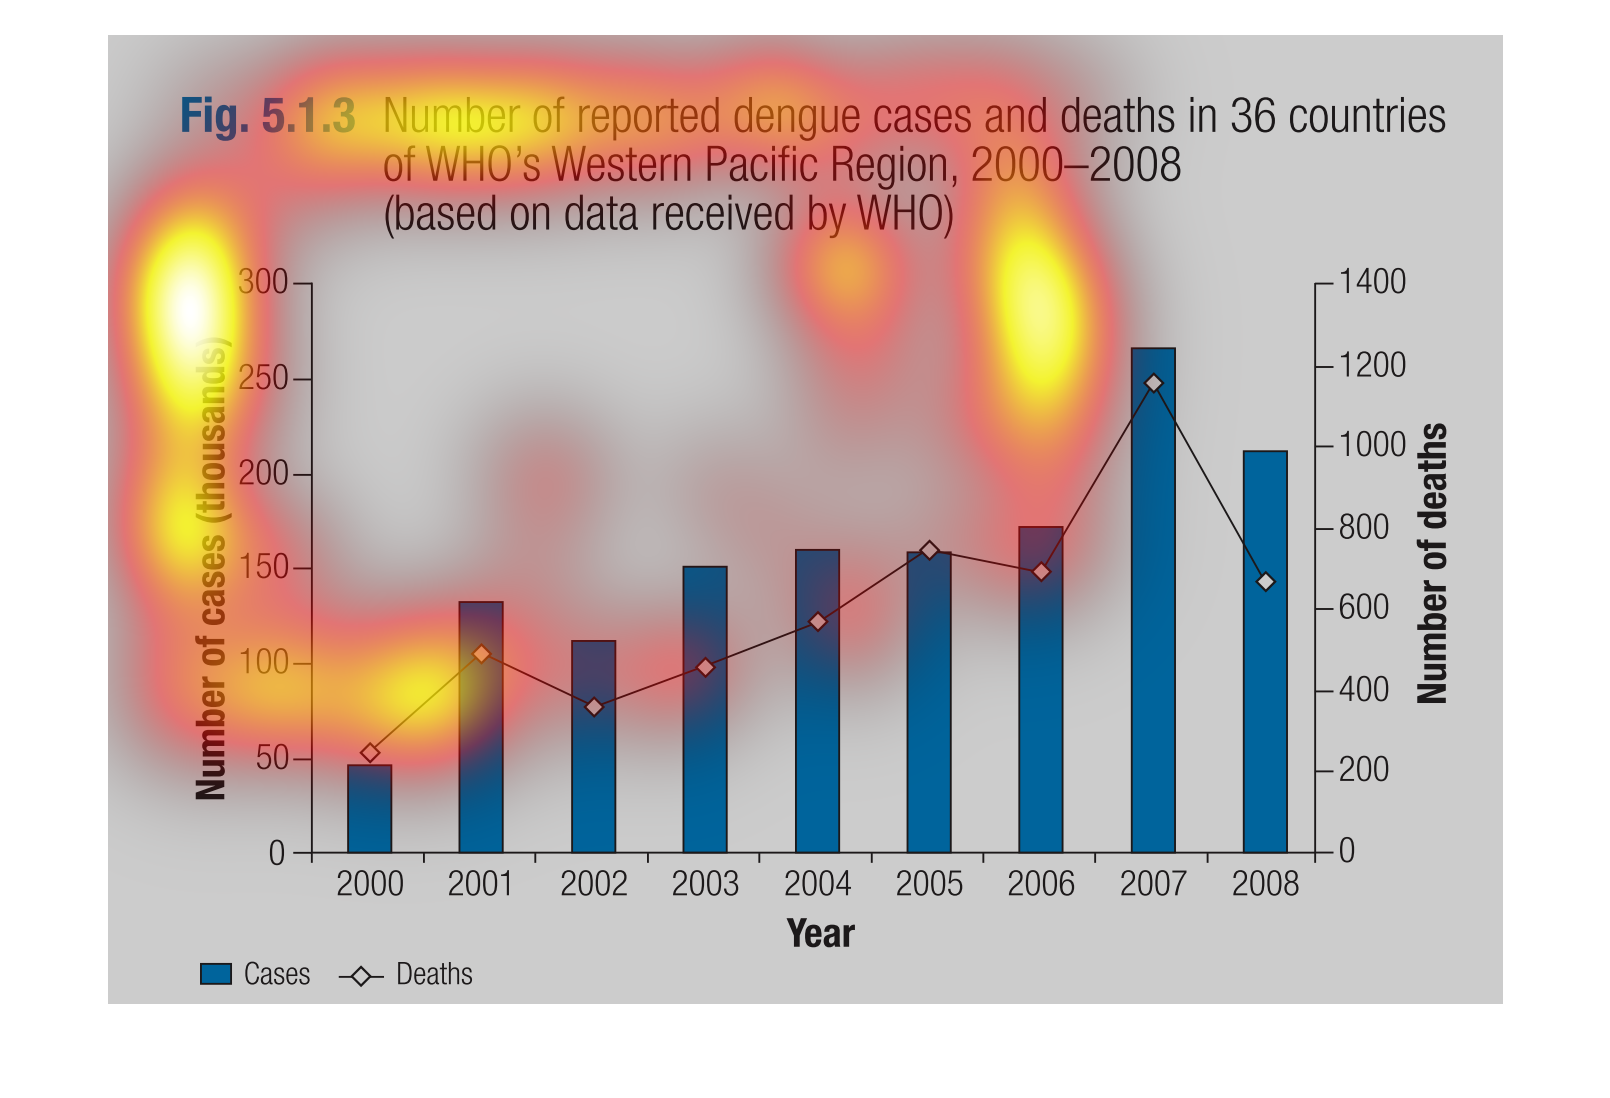
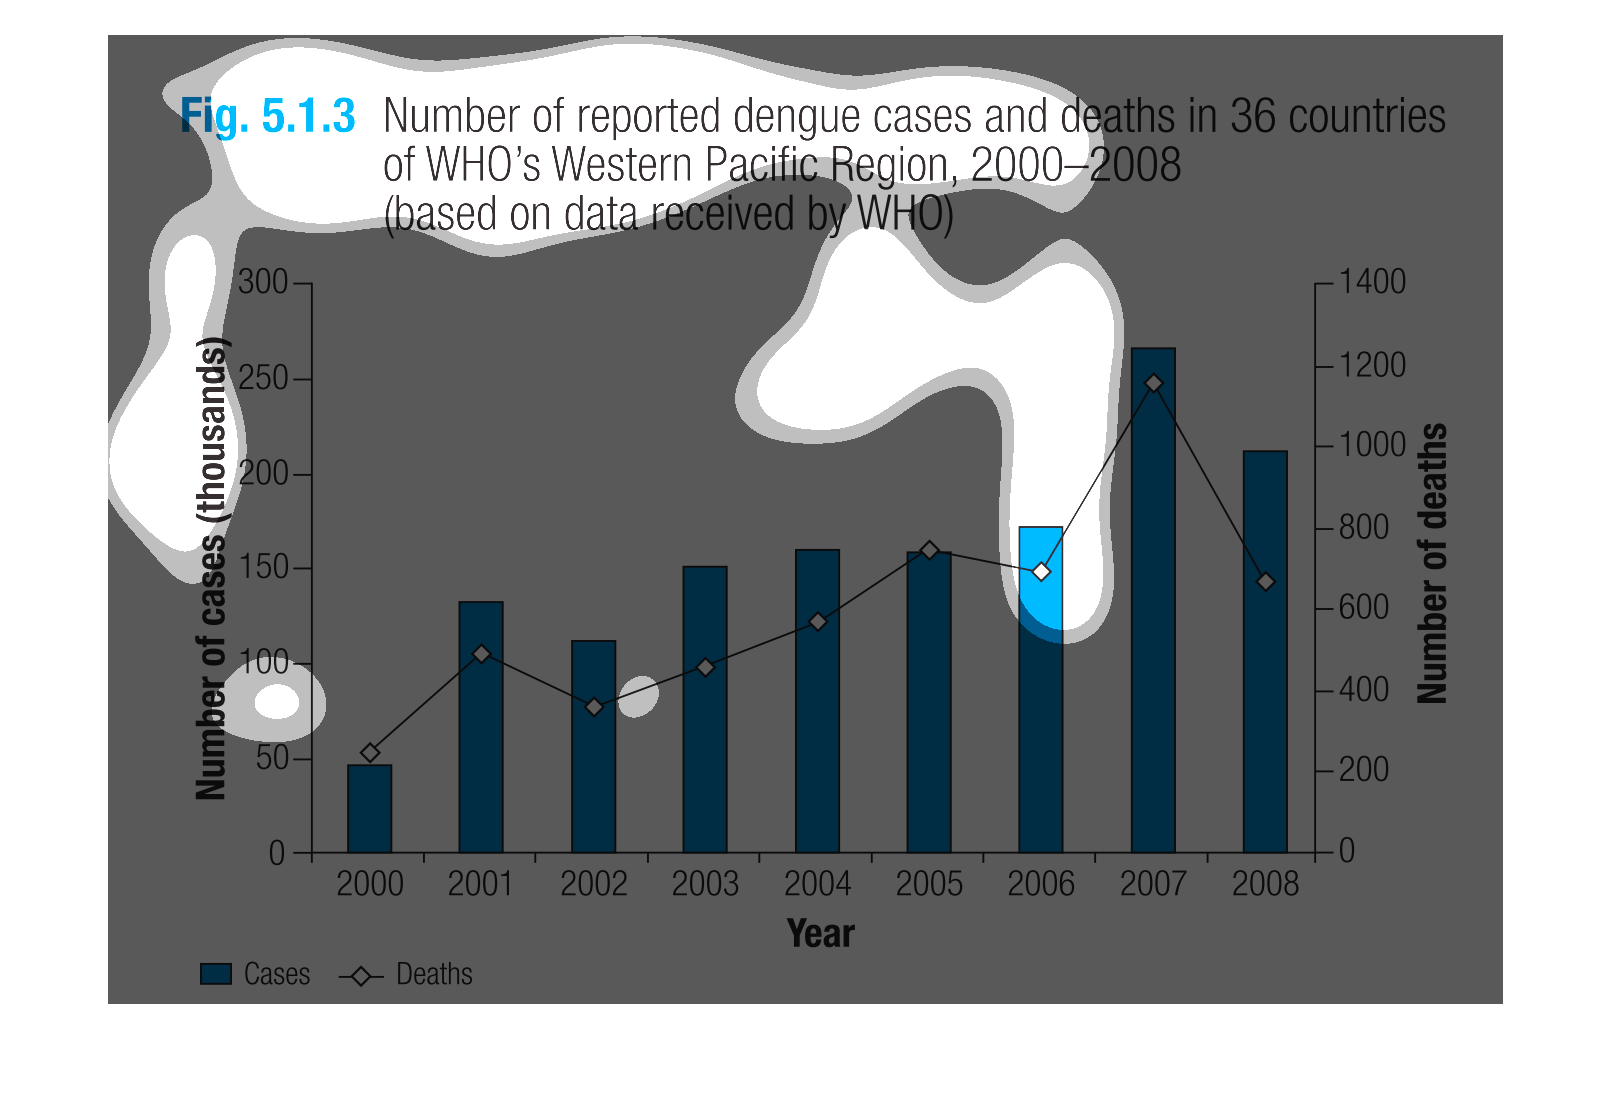
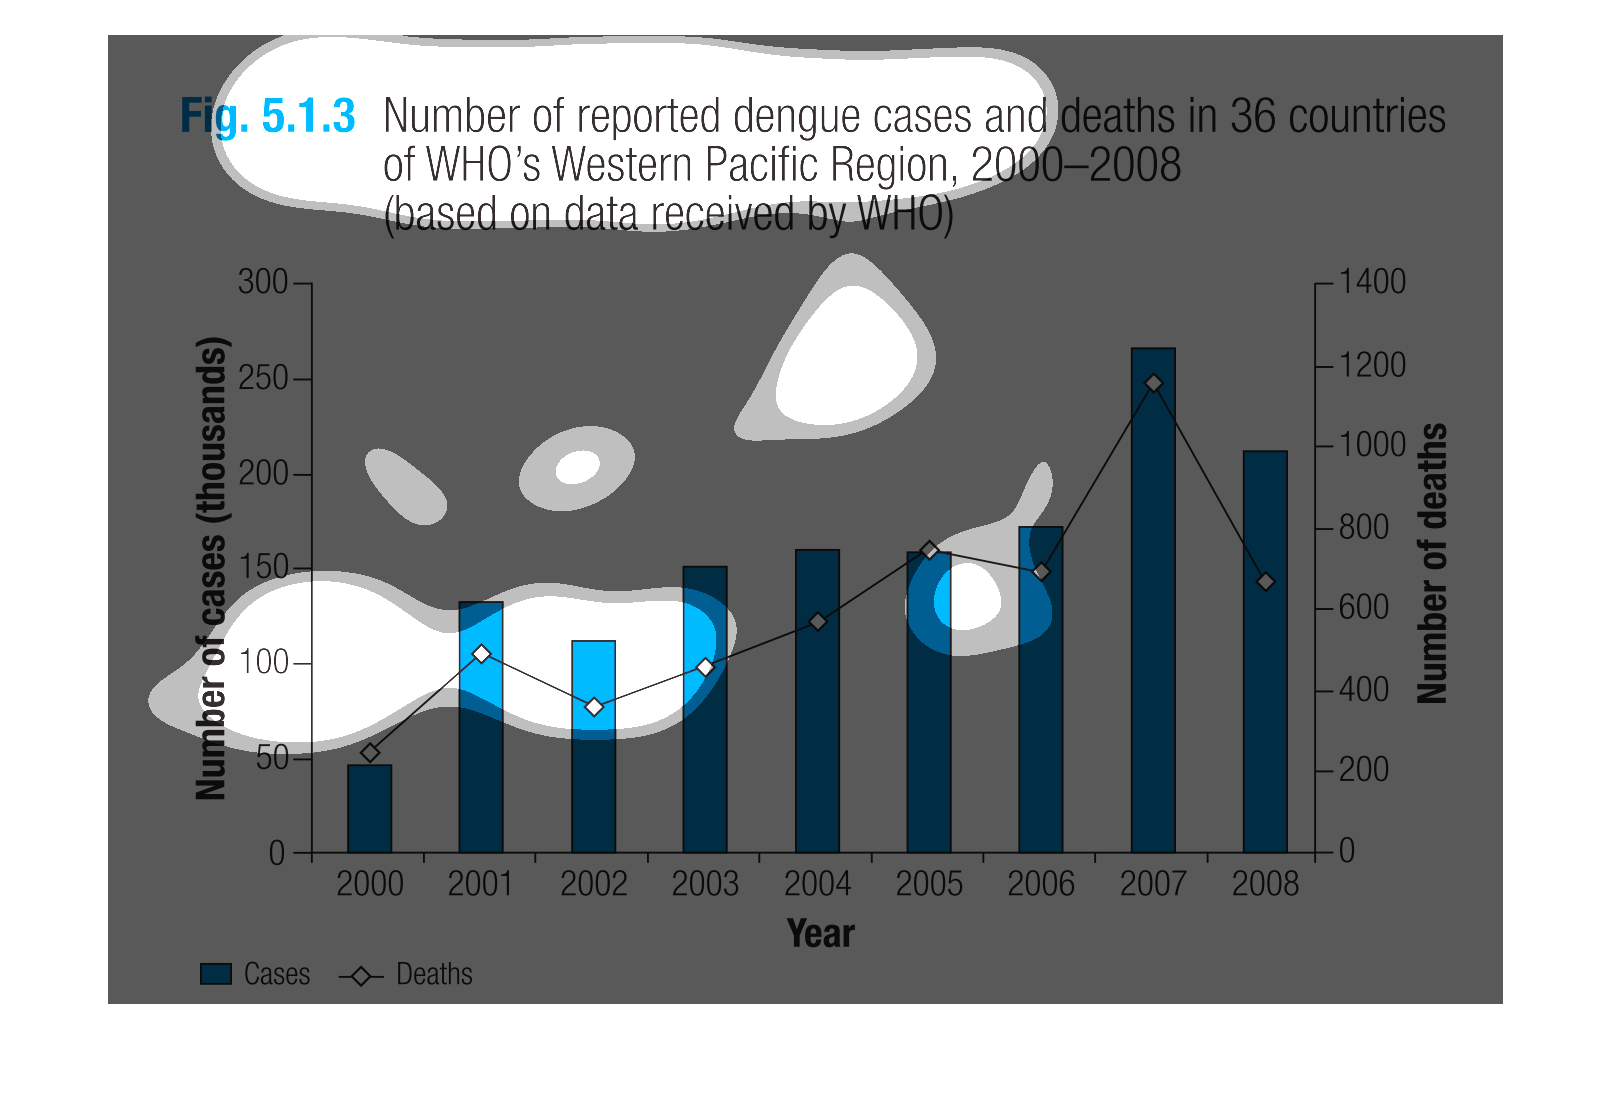
This is a bar chart of the number of reported dengue cases and deaths in 36 countries of the
WHO's Western pacific region from 2000 to 2008. Trend is increasing as the years go on and
there was a spike in deaths and cases in 2007.
Bar graph shows the number of dengue cases and death in 36 countries of WHO's western Pacific
Region in 2000-2008 based on data received by WHO. The number of deaths increased until 2007
when they started to show a slight decline.
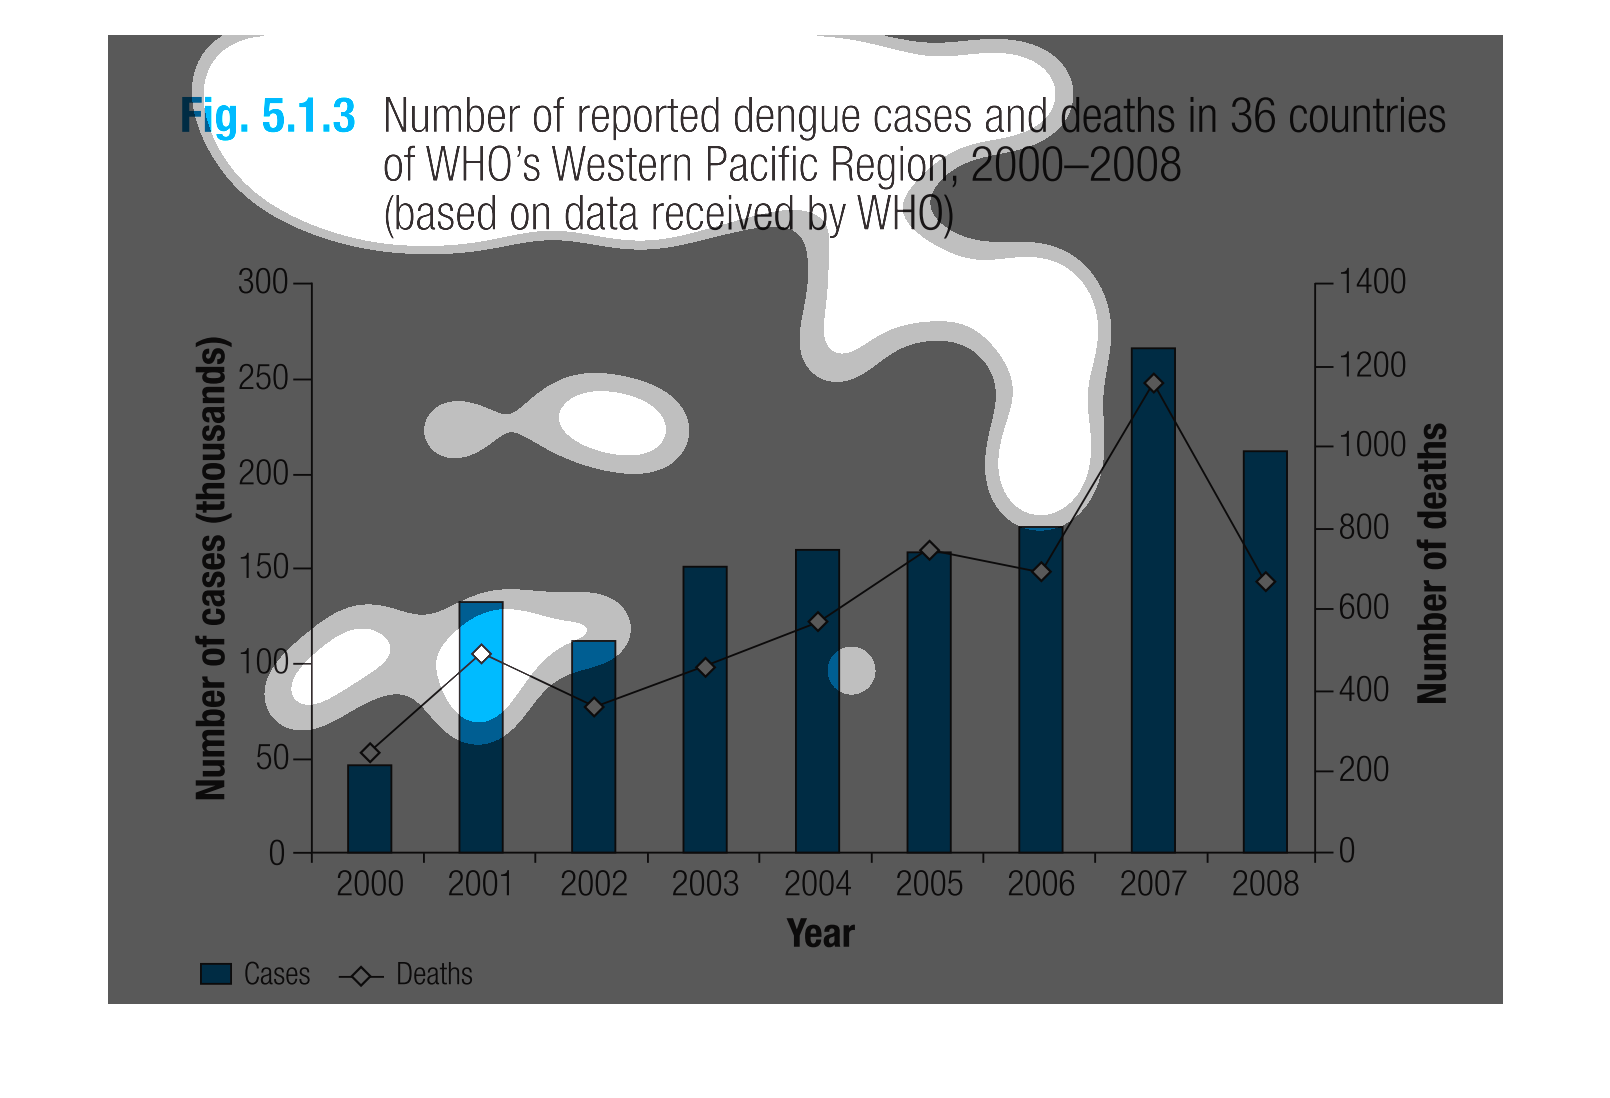
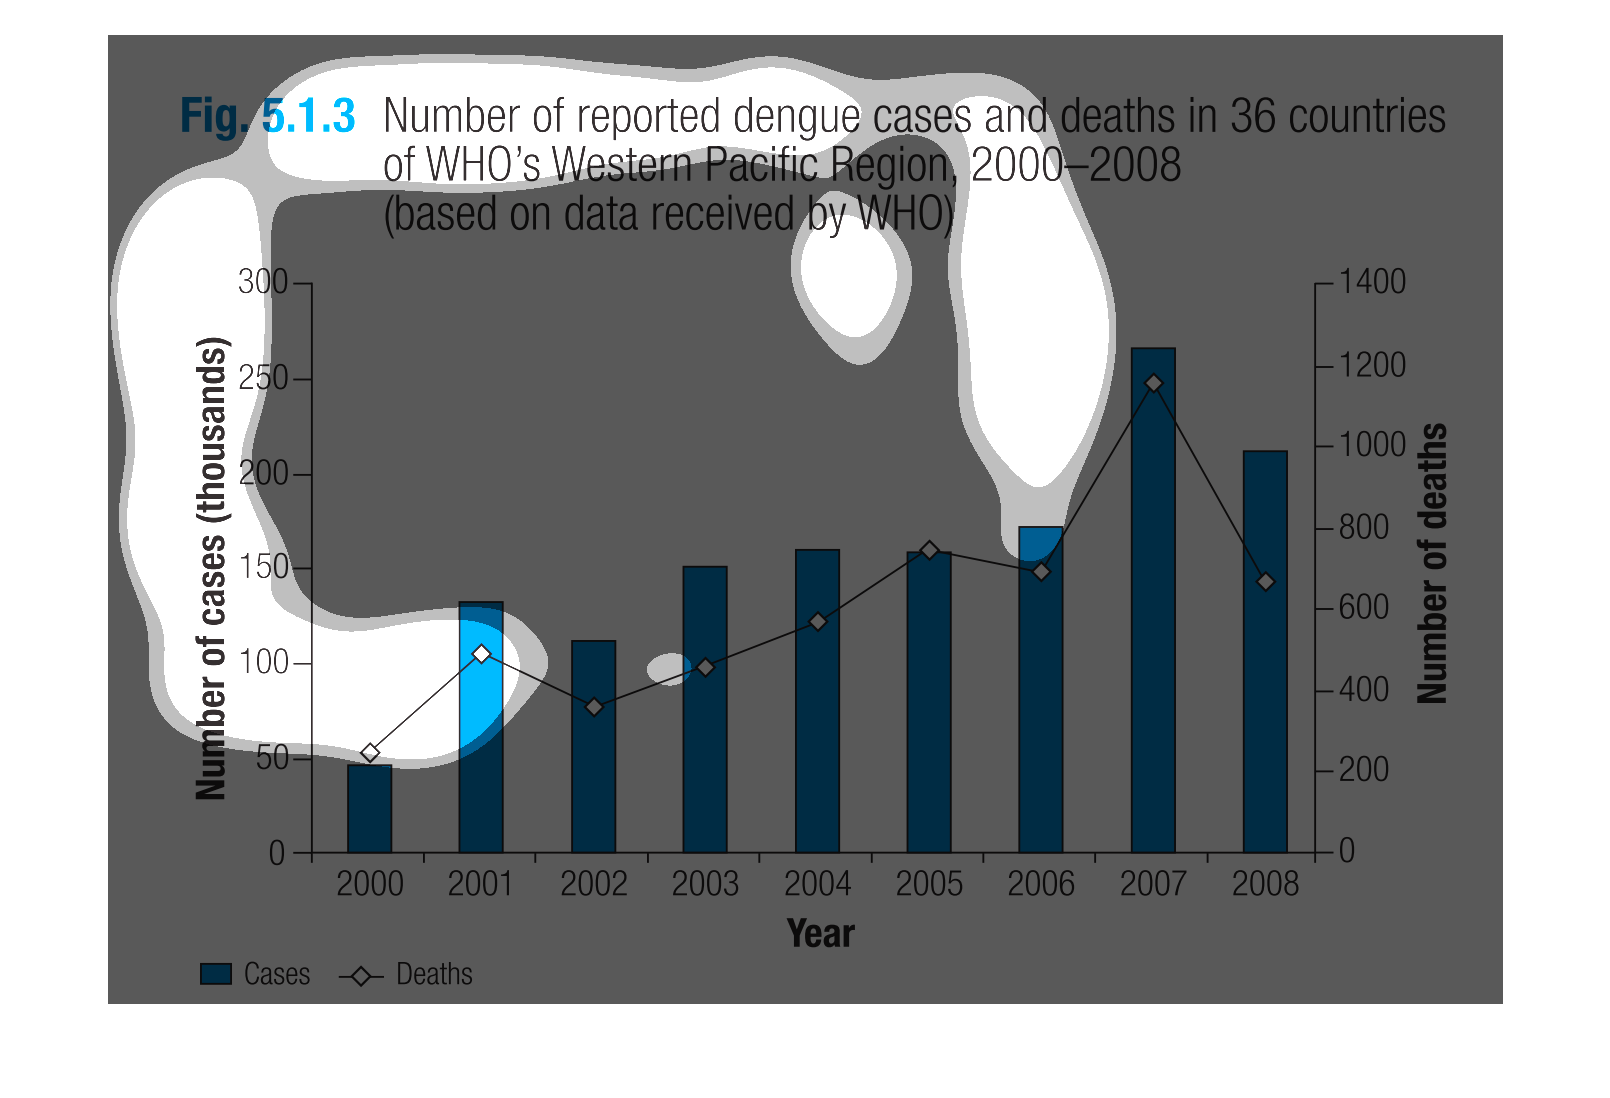
This is a bar graph about the reported number of deaths. The bars are blue and seem to be
varying heights but pretty much the same. The highest spike was in 2007.
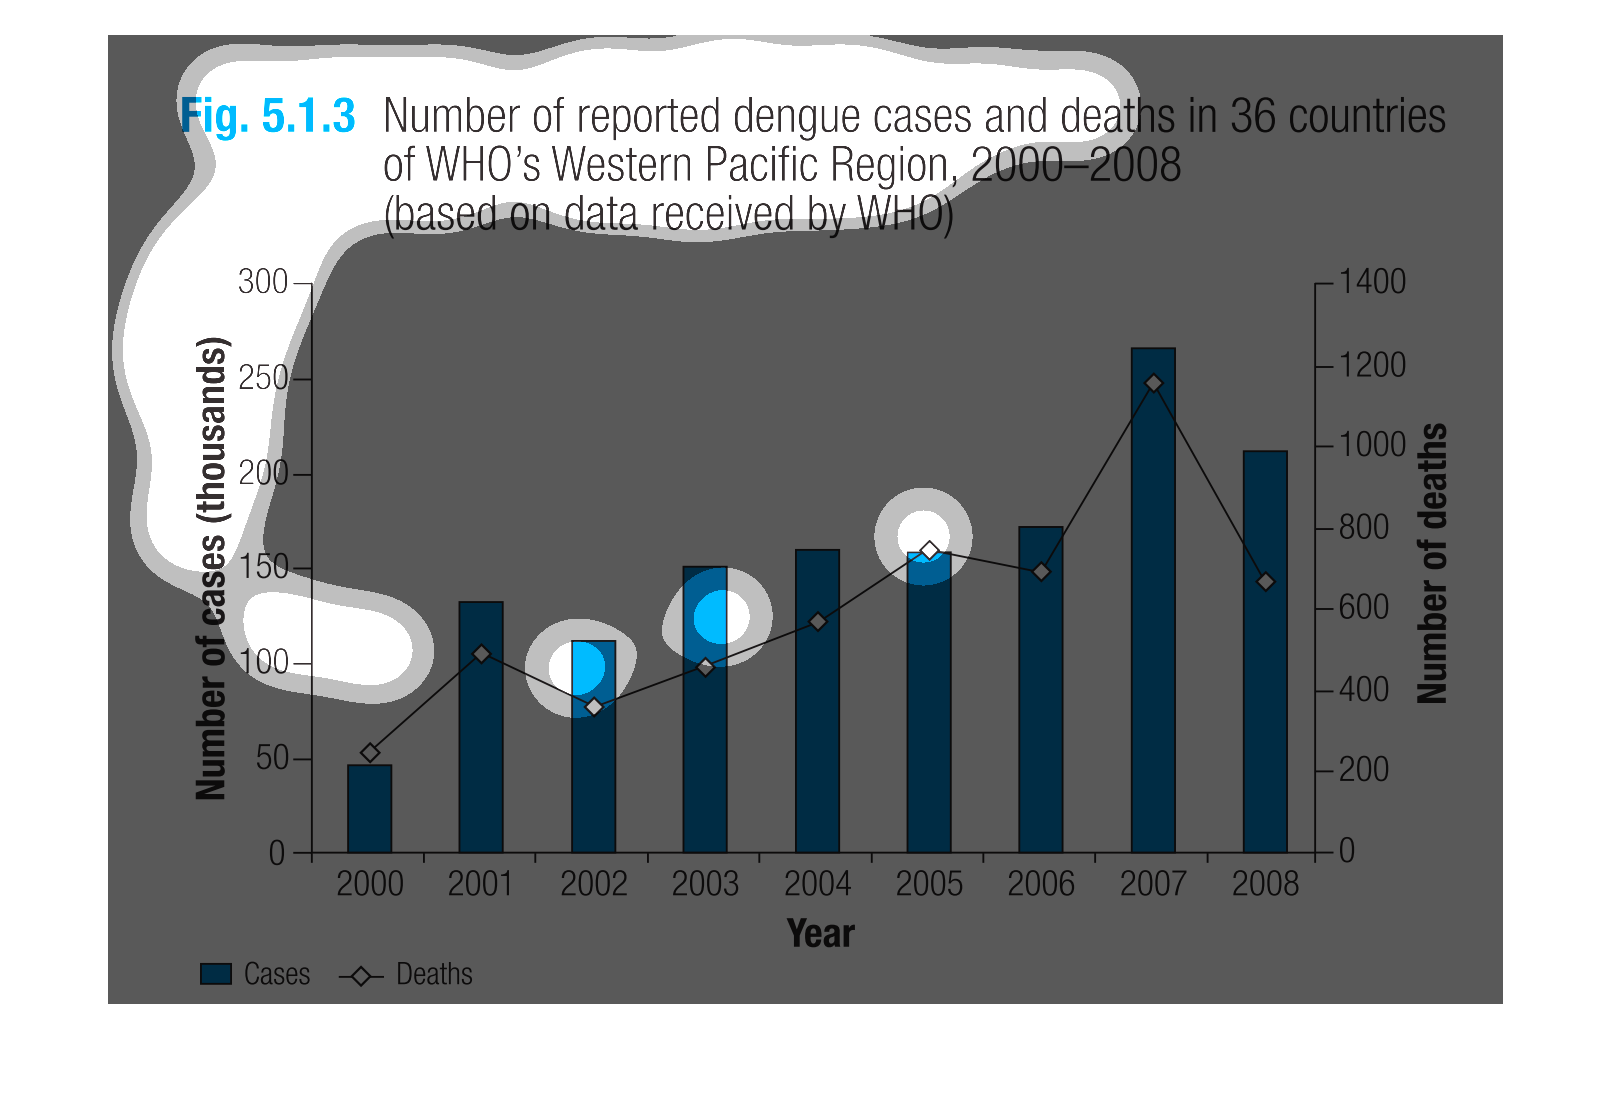
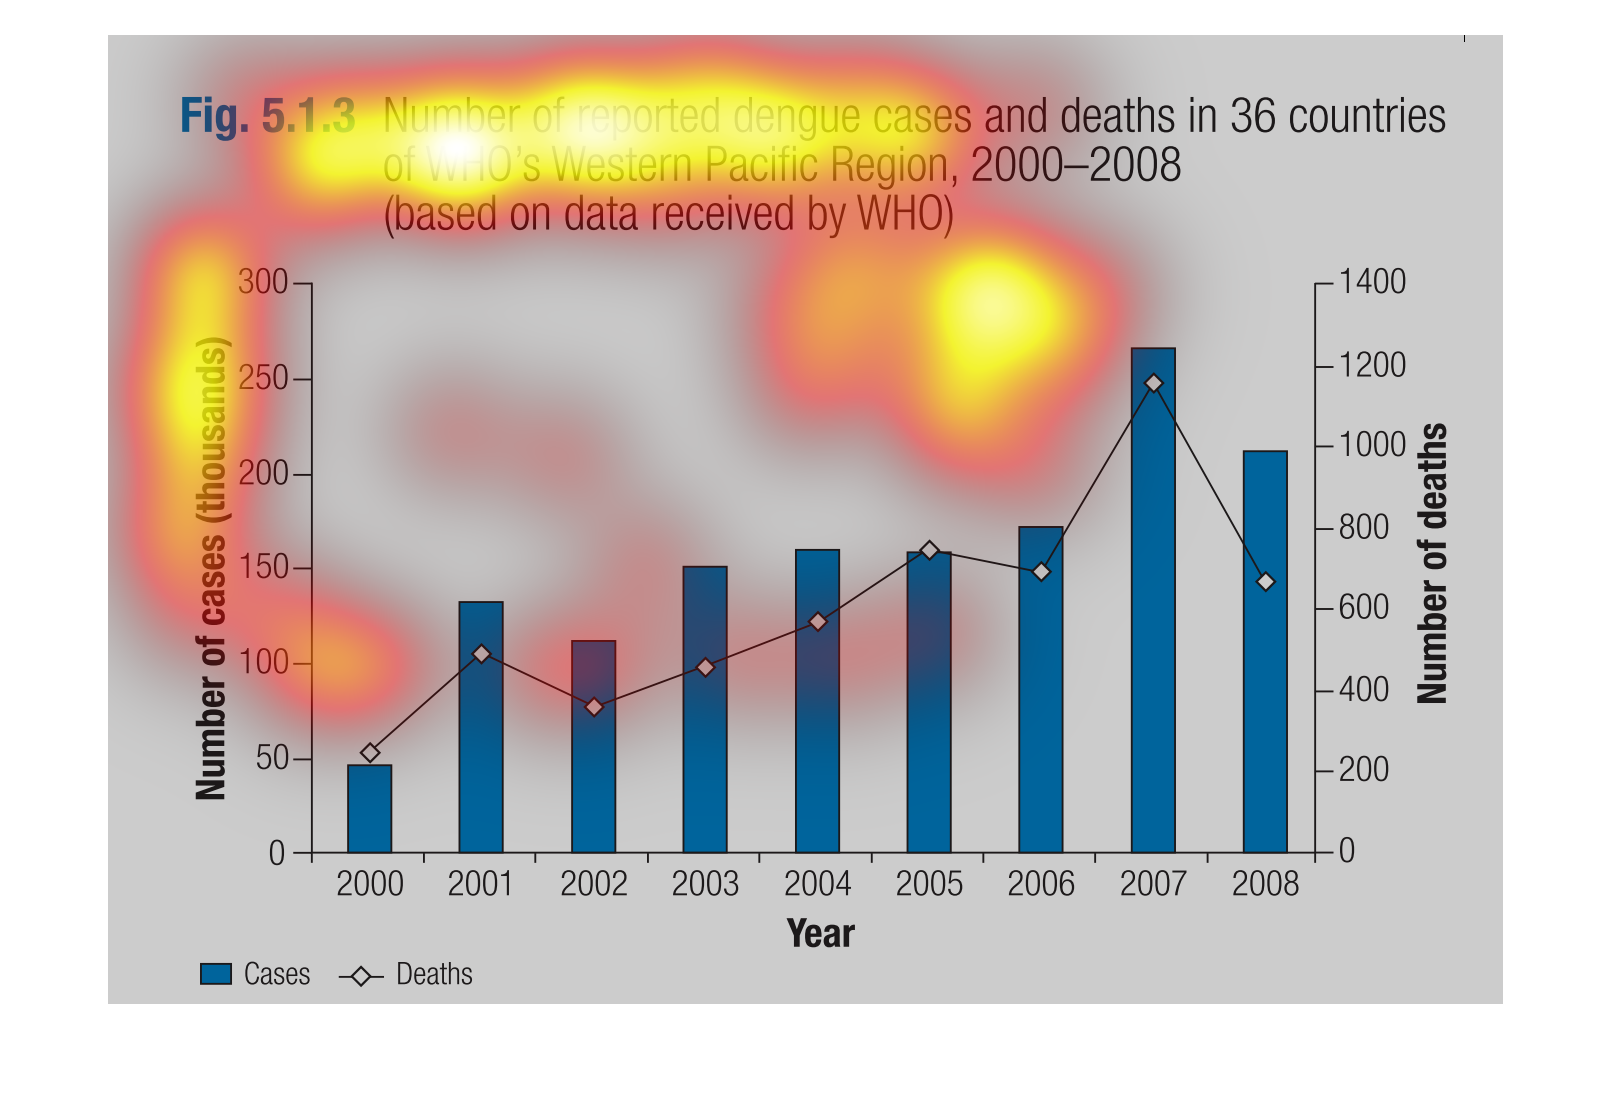
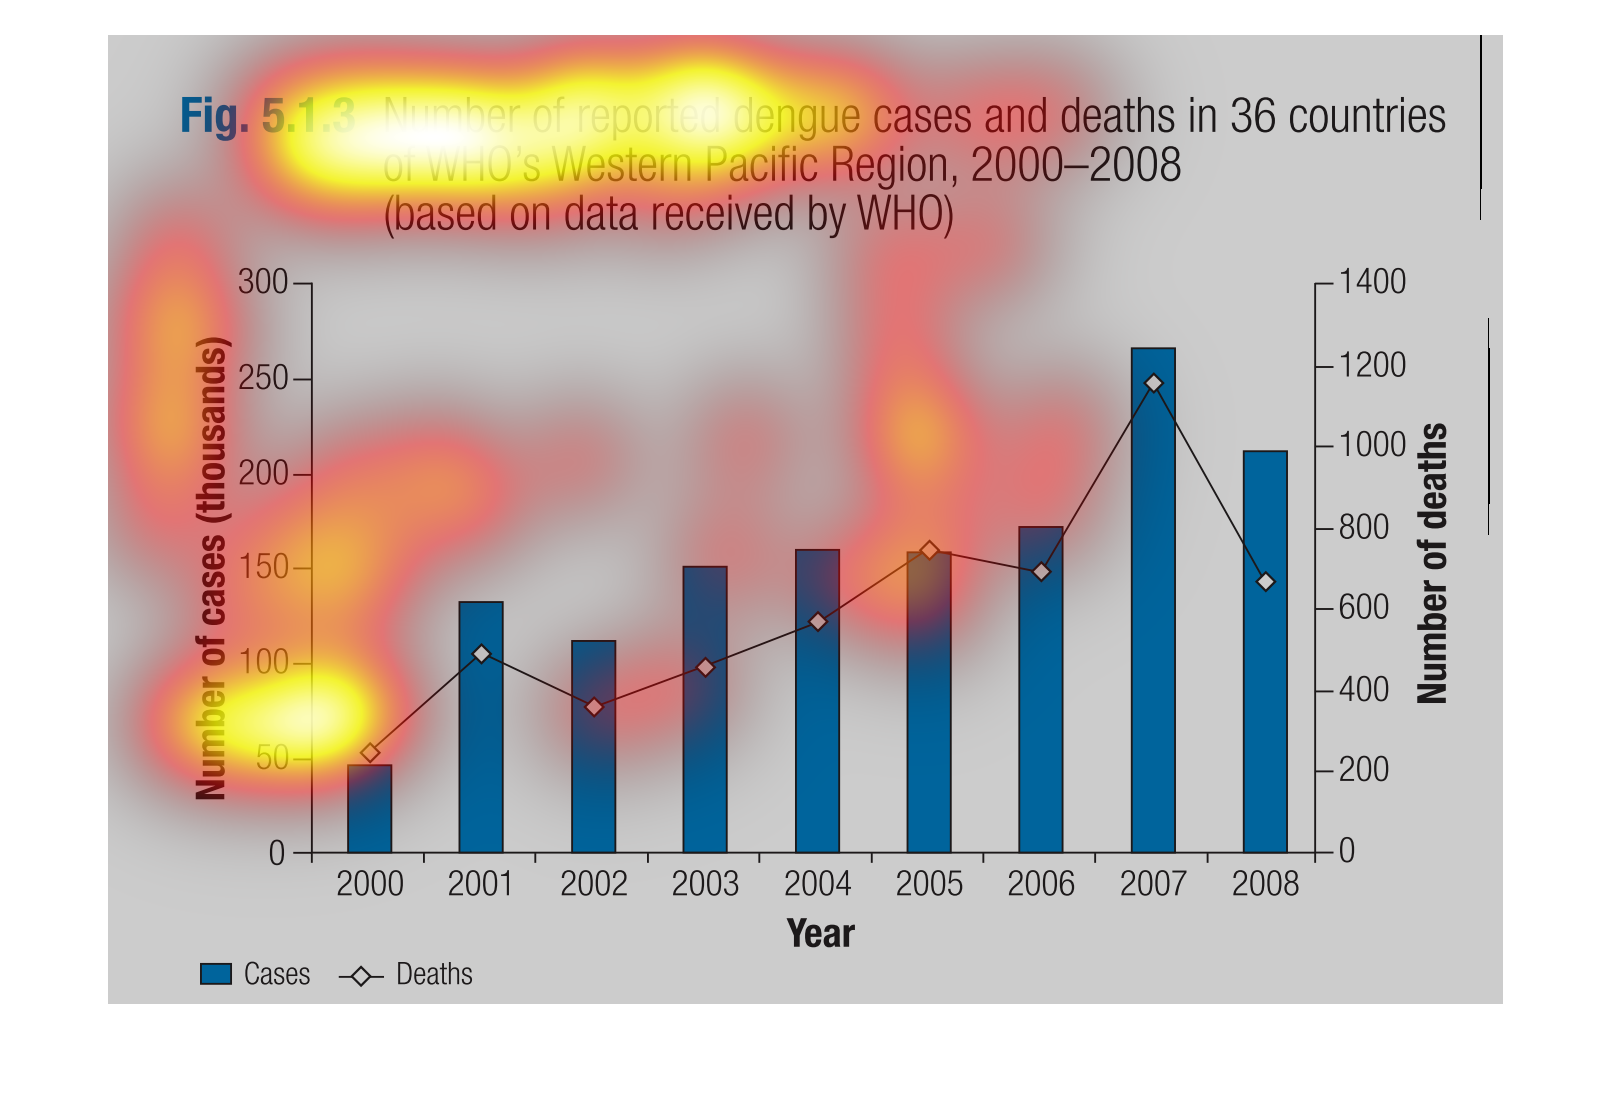
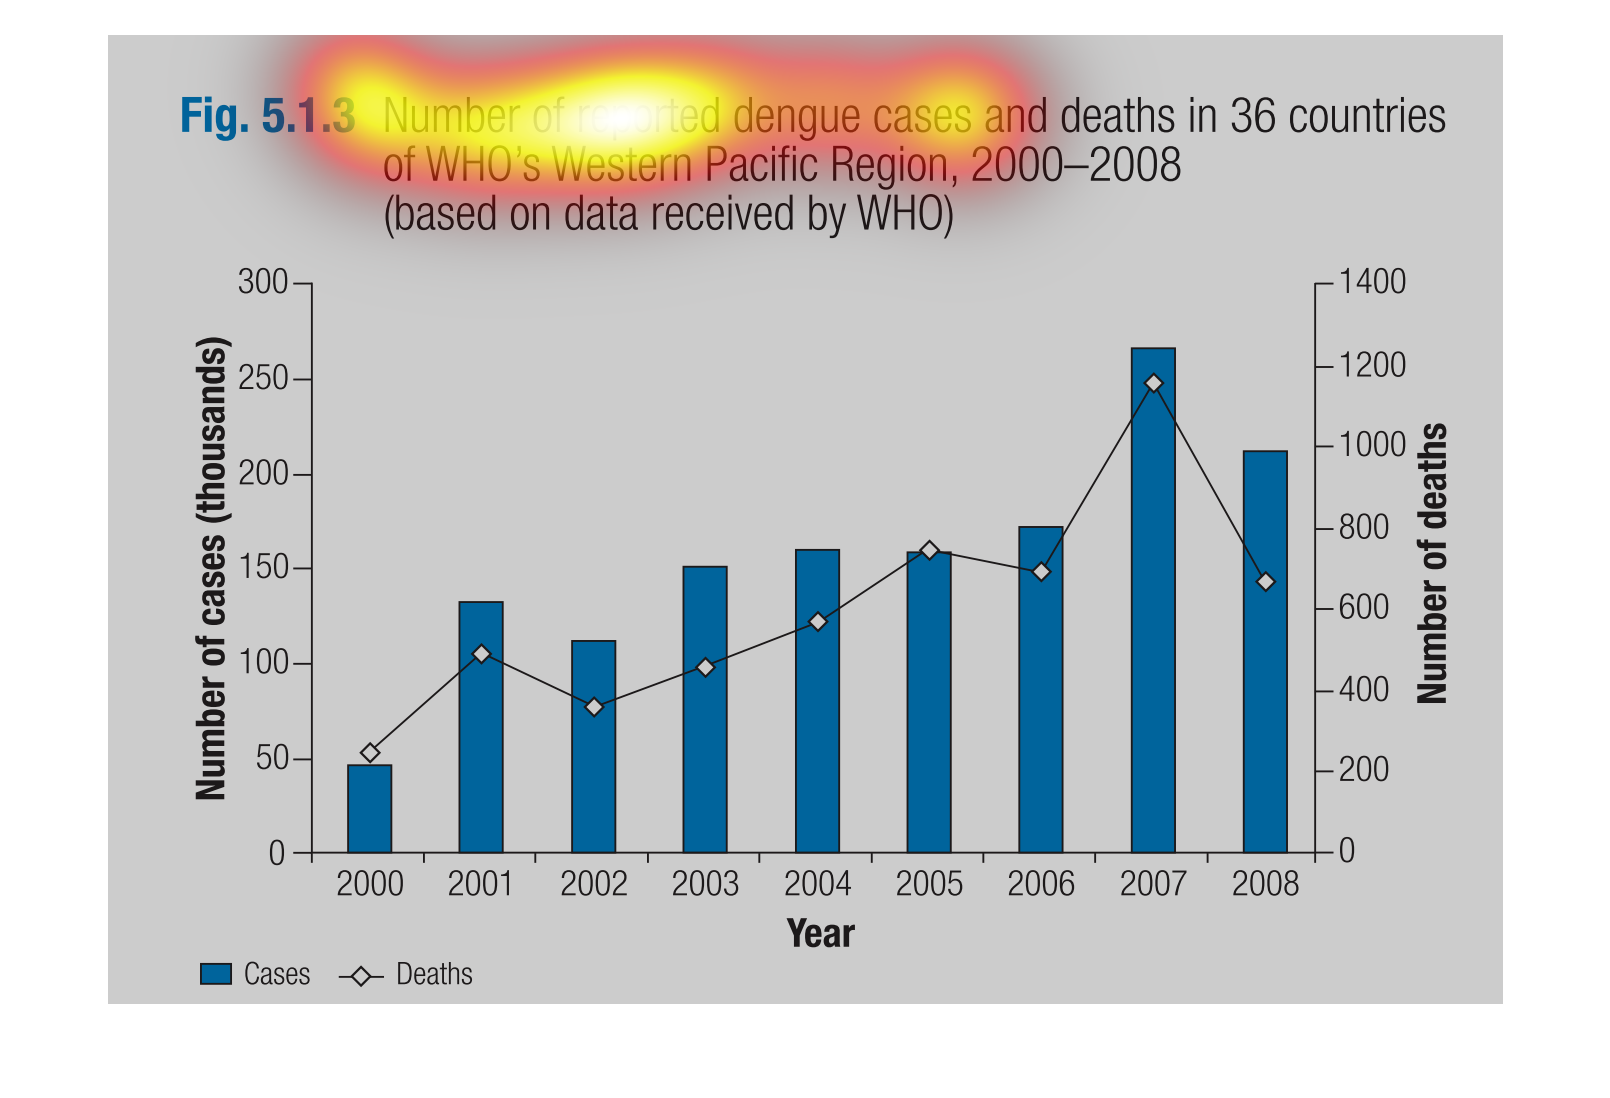
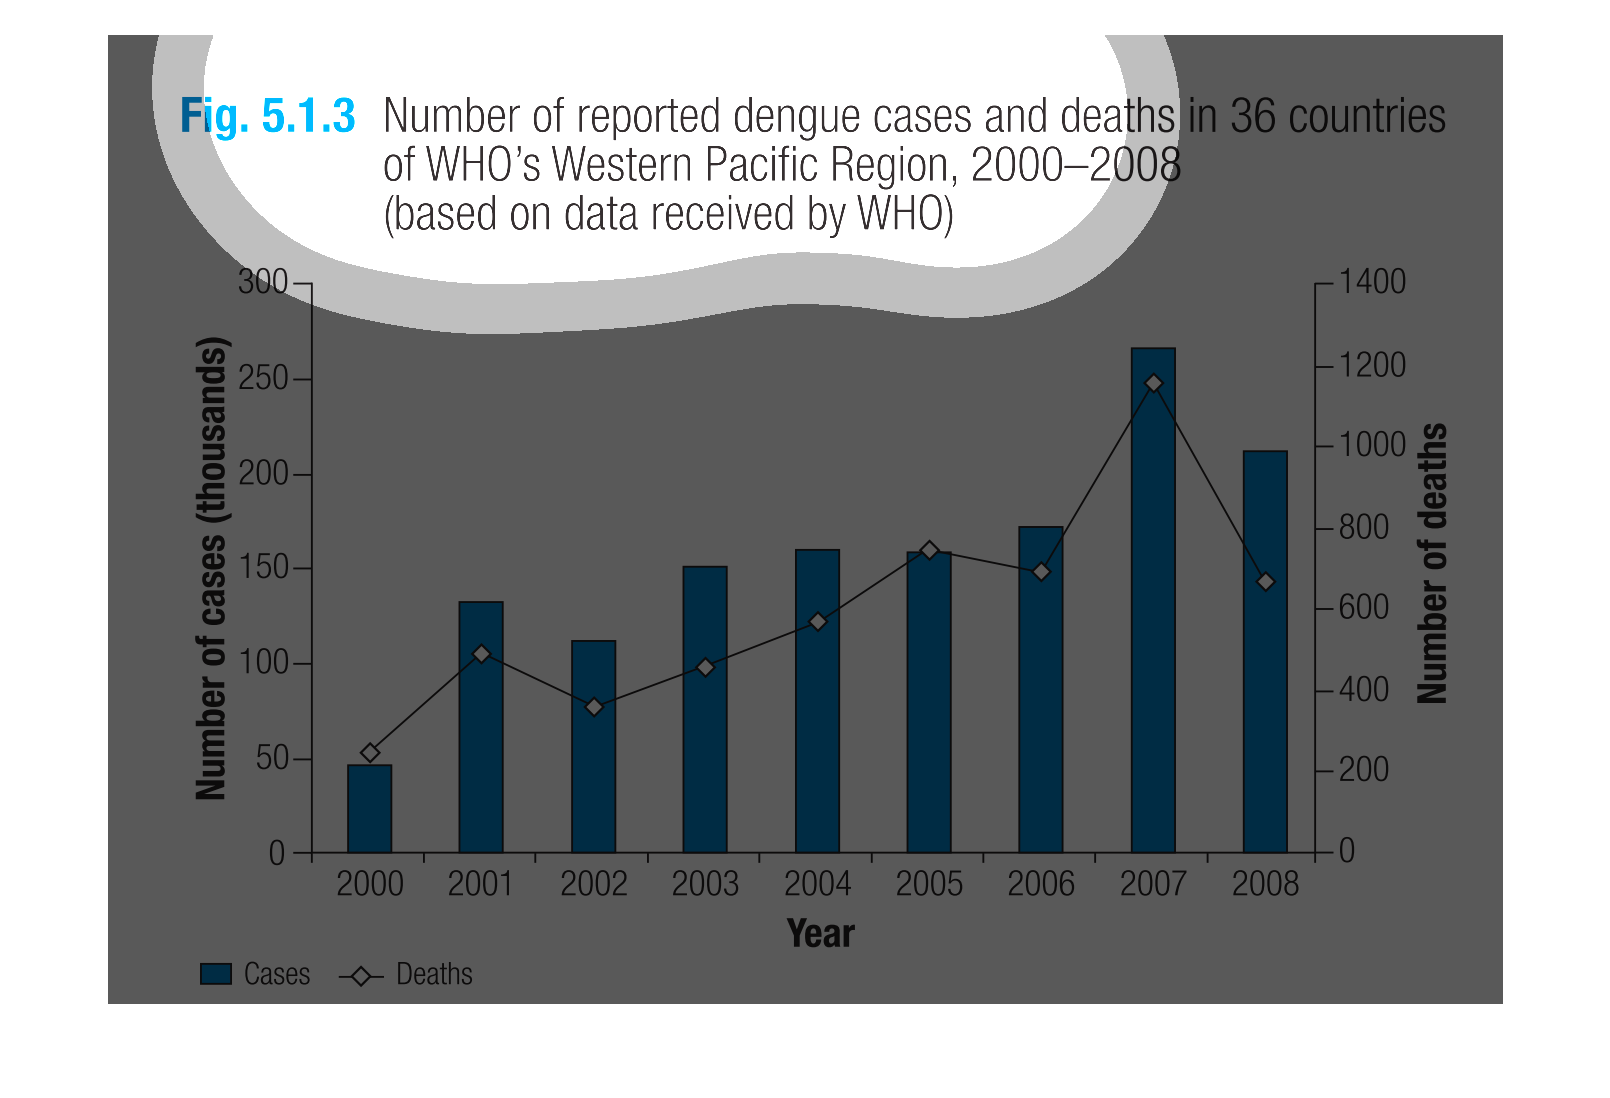
The graph represents the number of dengue cases and deaths reported in 36 countries located
in WHO's Western Pacific Region during the years 2000-2008.  Overall, the number of cases
grew substantially over the time period studied, beginning around 50 thousand in 2000 and
ending around 200 thousand 2008.  Generally, the number of deaths from dengue rose in correlation
with the number of cases reported. Only two years saw a drop in cases and deaths reported,
but growth was seen as  a dominant trend overall.
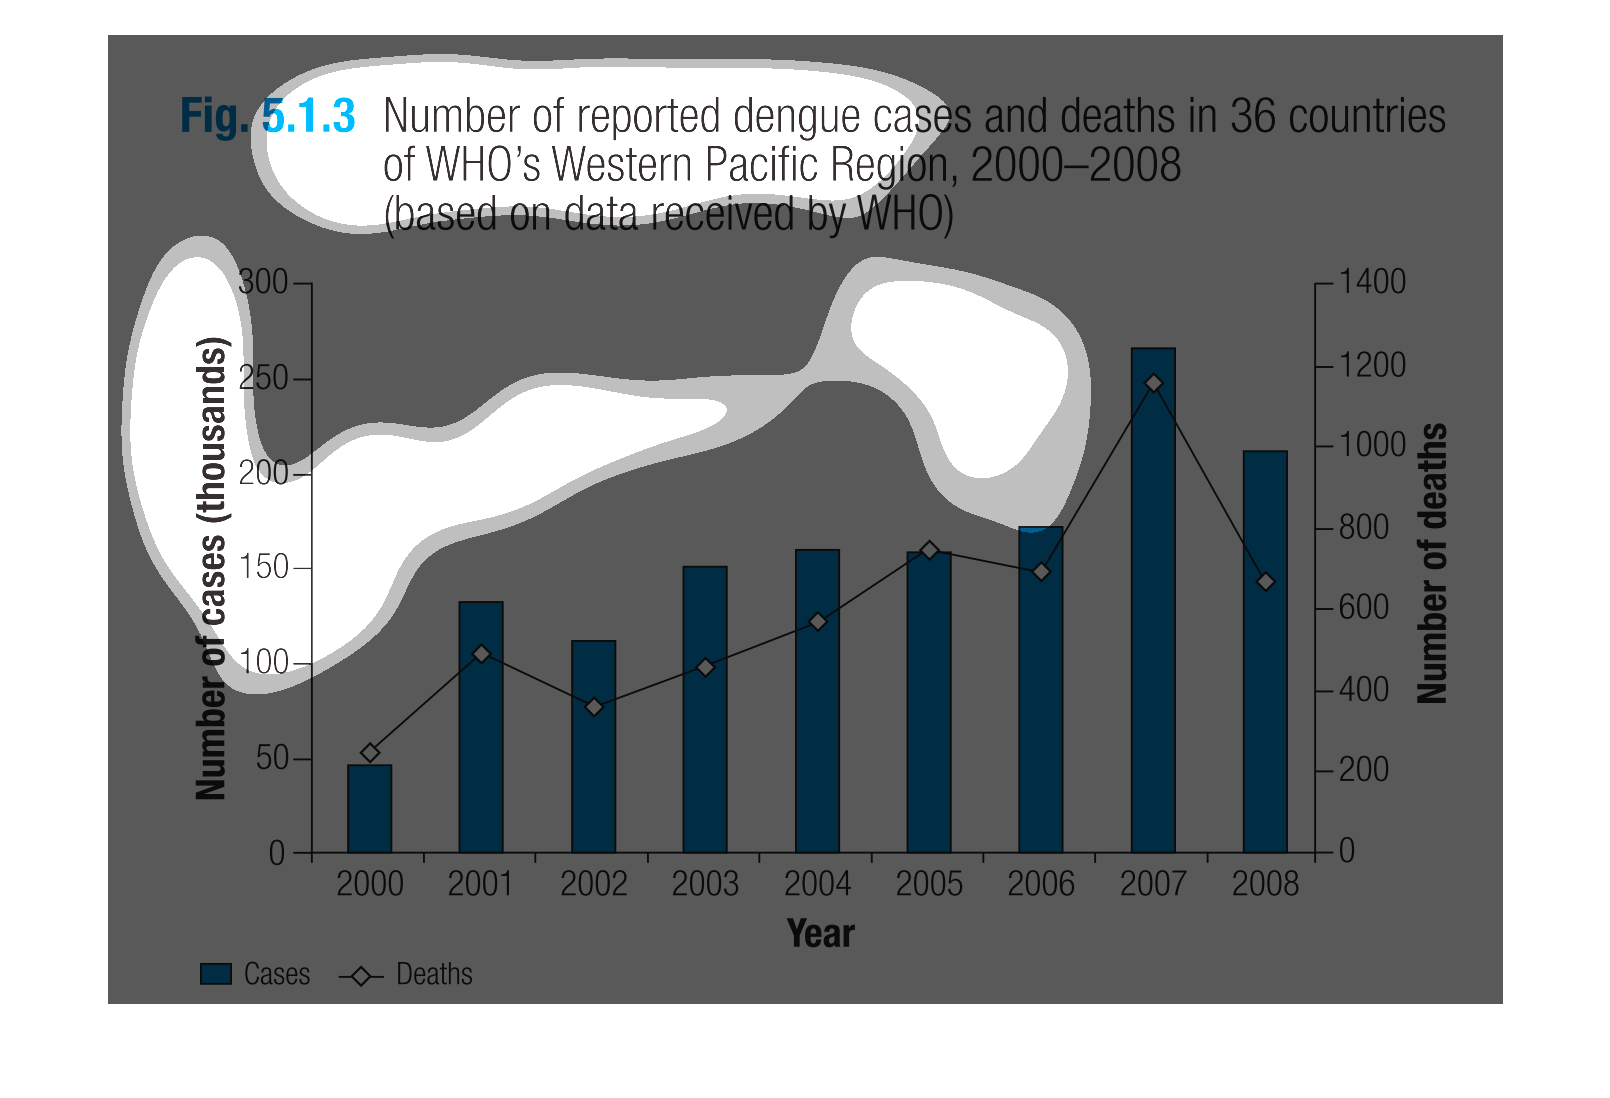
This bar graph shows the number of dengue cases and deaths in 36 countries of WHO Western
Pacific region from 2000-2008 based on data received by WHO. In 2007 there were the most deaths
and cases.
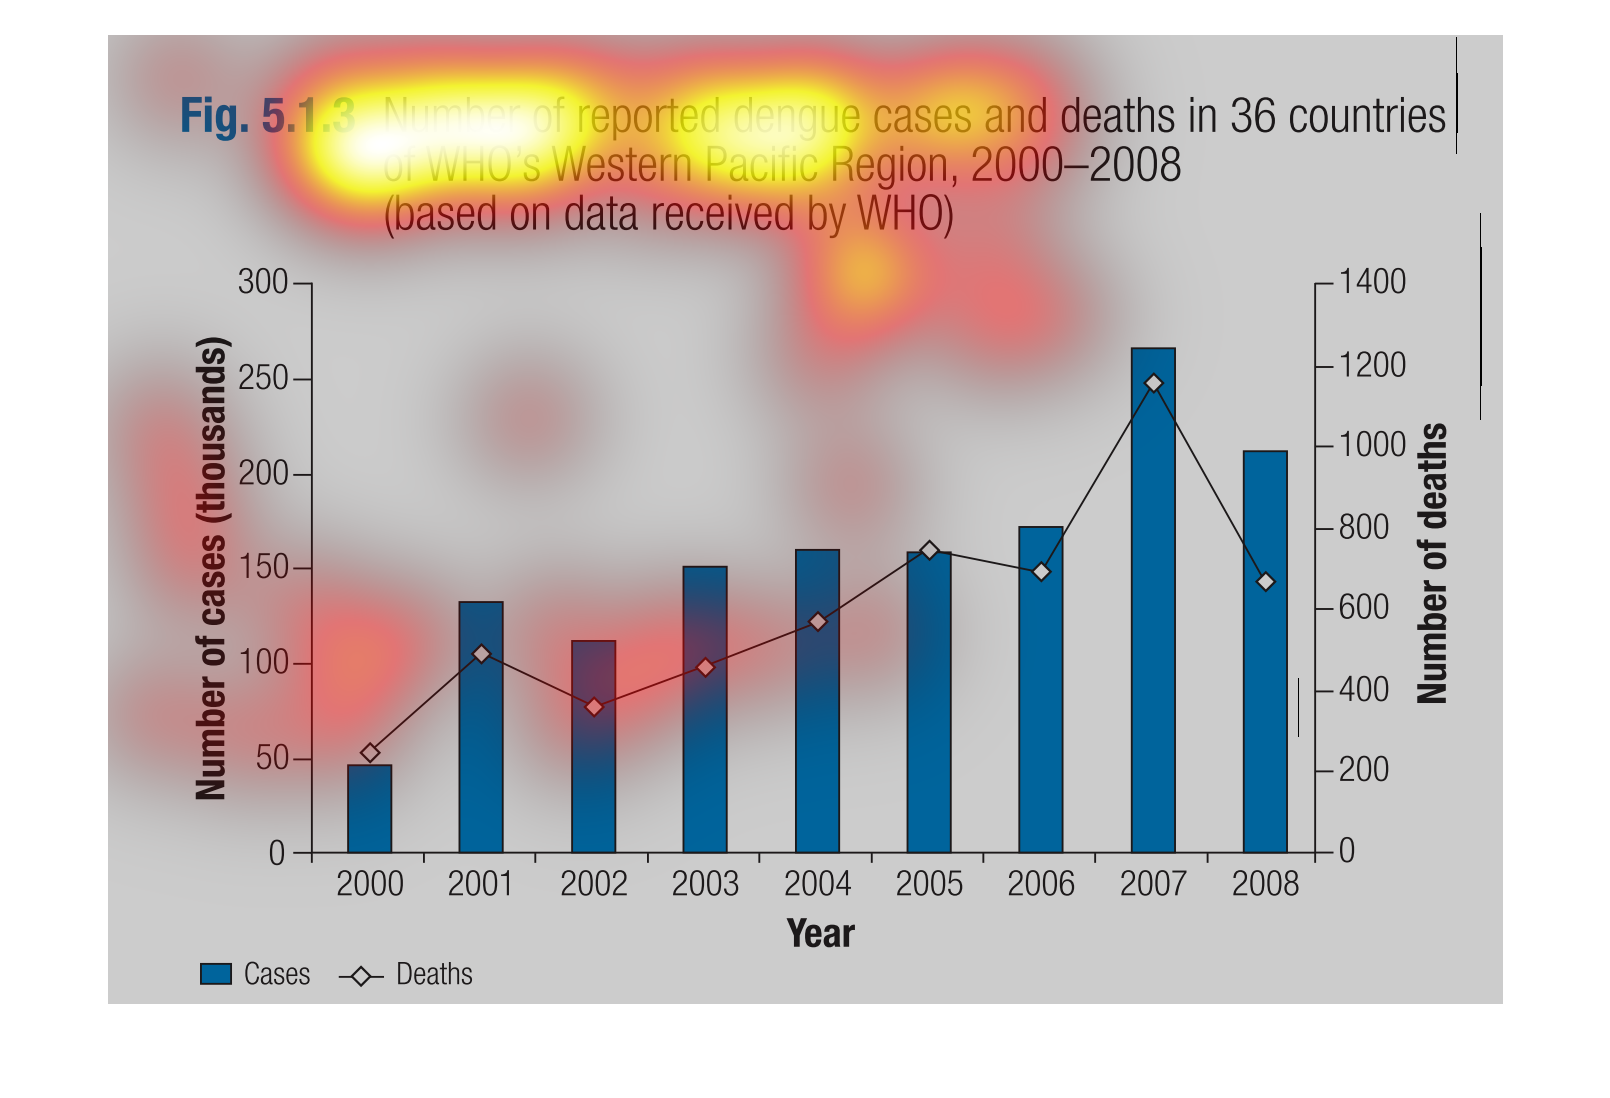
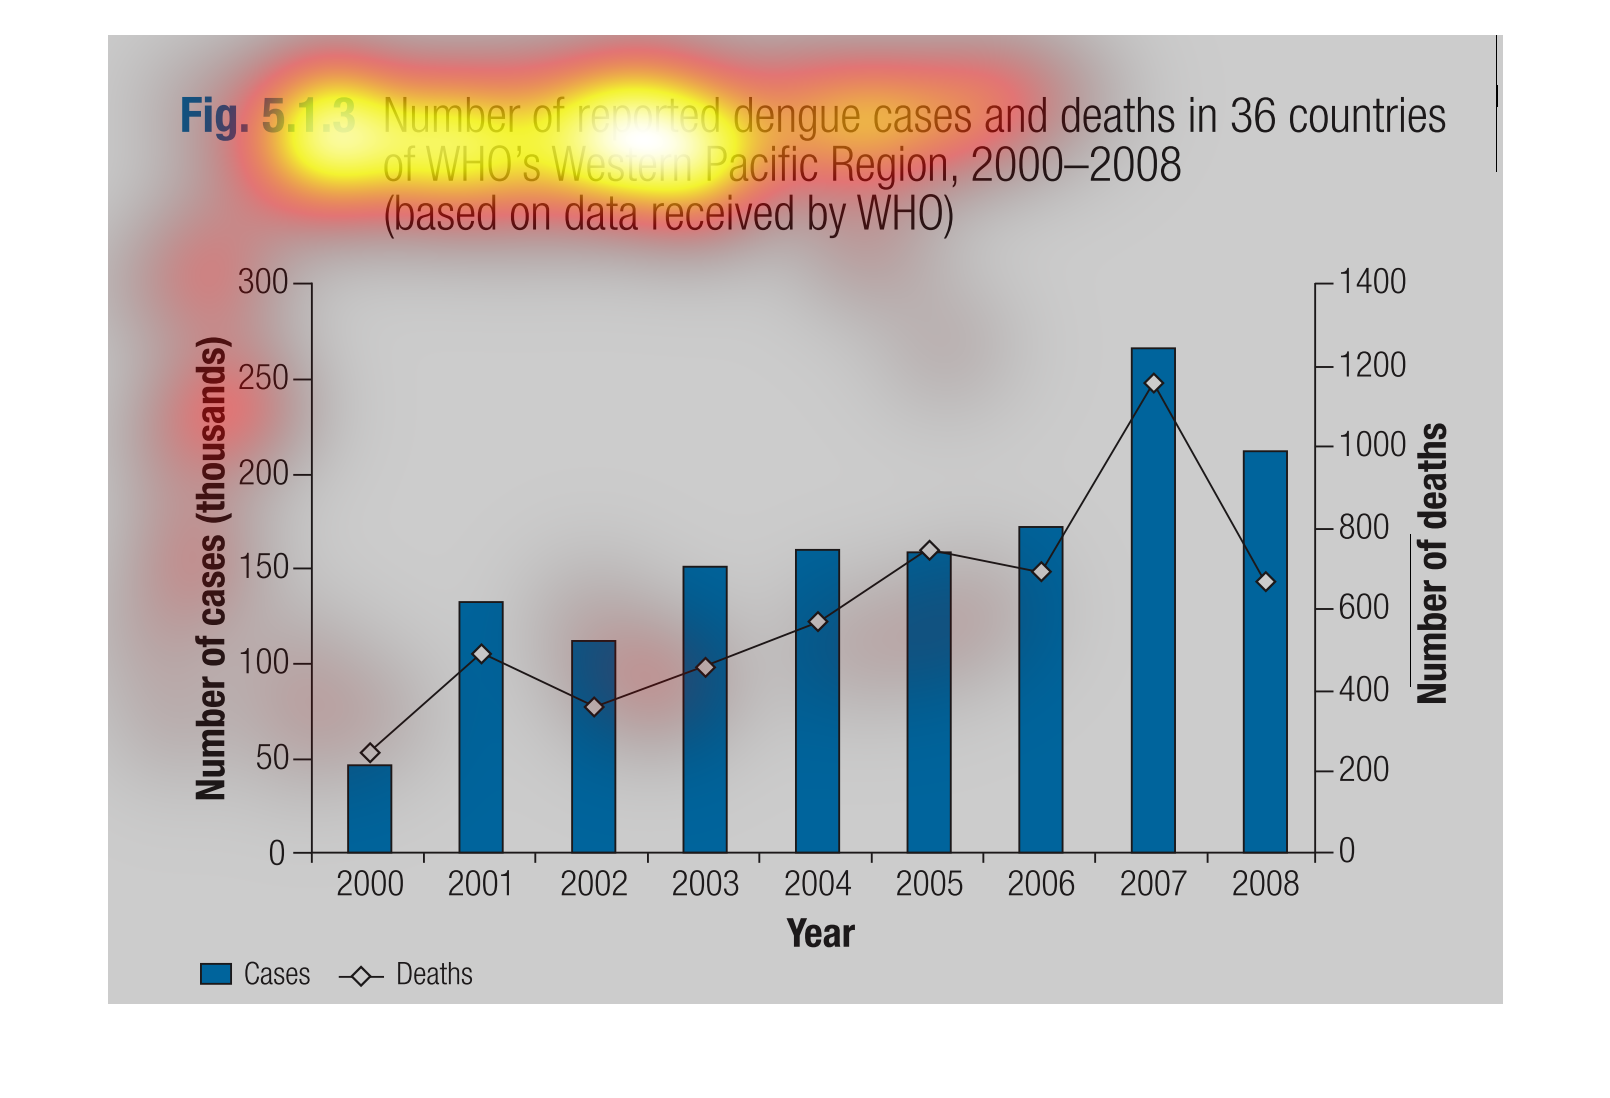
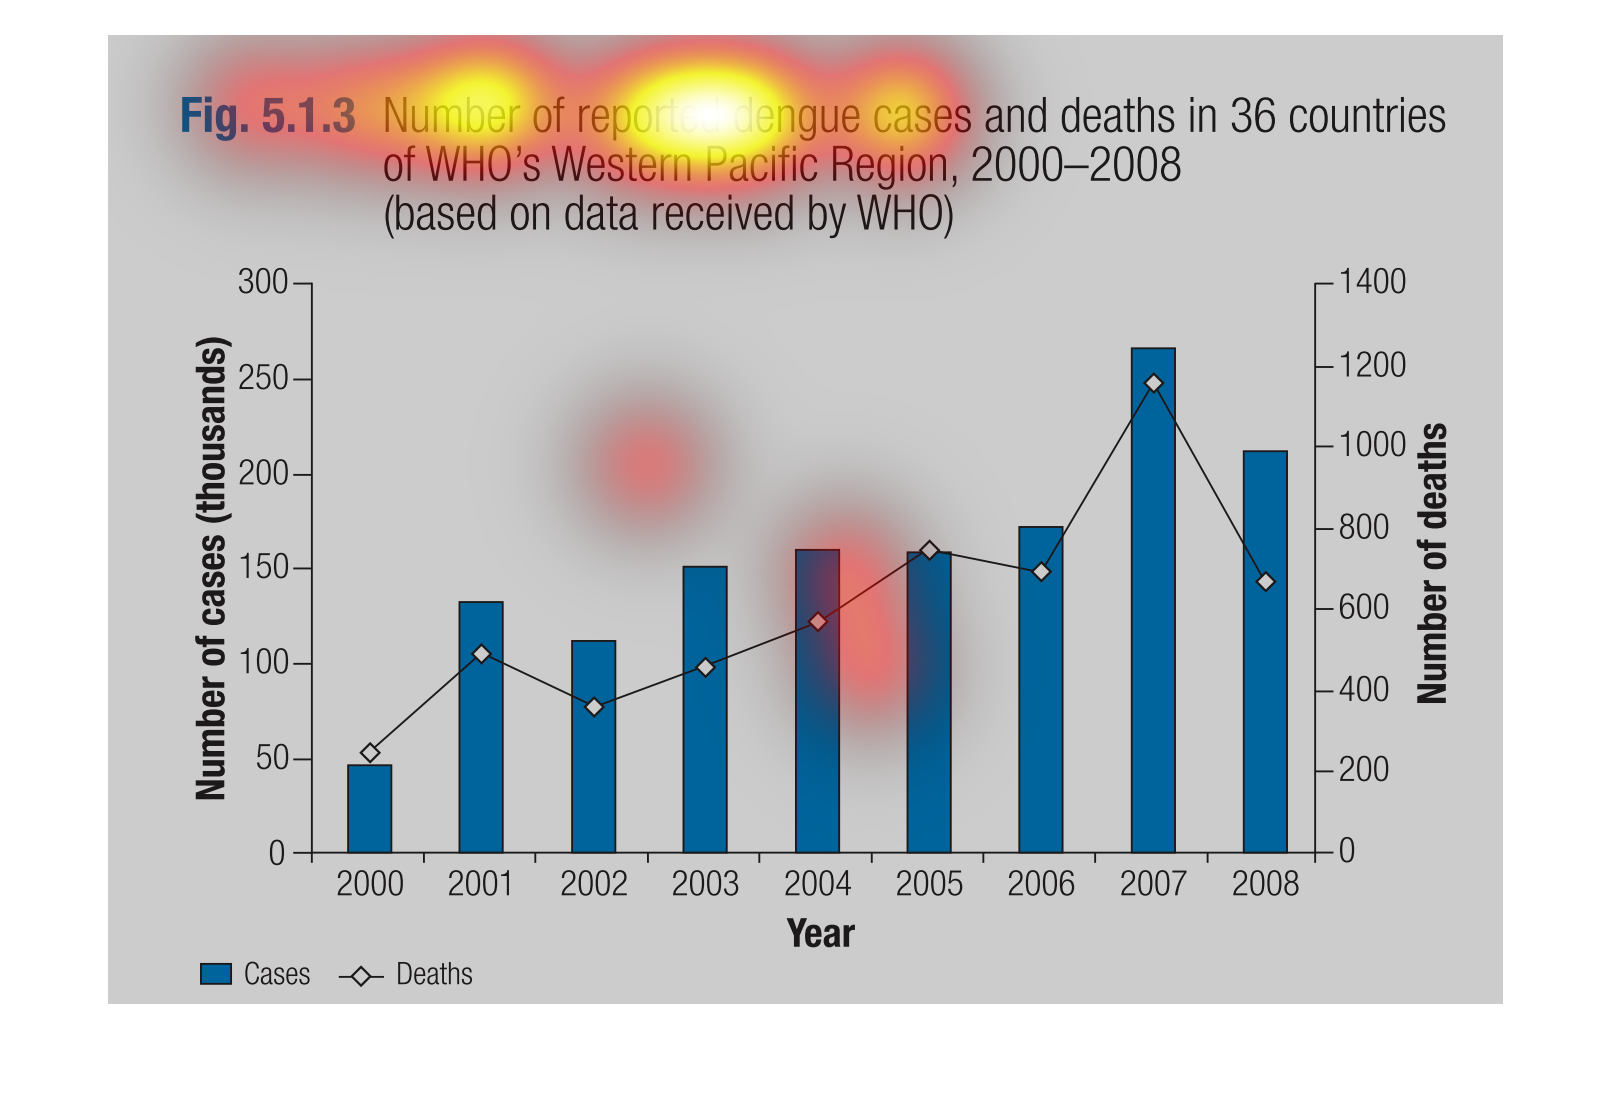
The graph shows the number of cases of dengue fever, which is spread by mosquitoes, between
the years of 2000 and 2008. The graph shows the correlation between the number of cases and
the numbers of deaths. Overall, 2007 had the highest number of cases and deaths.
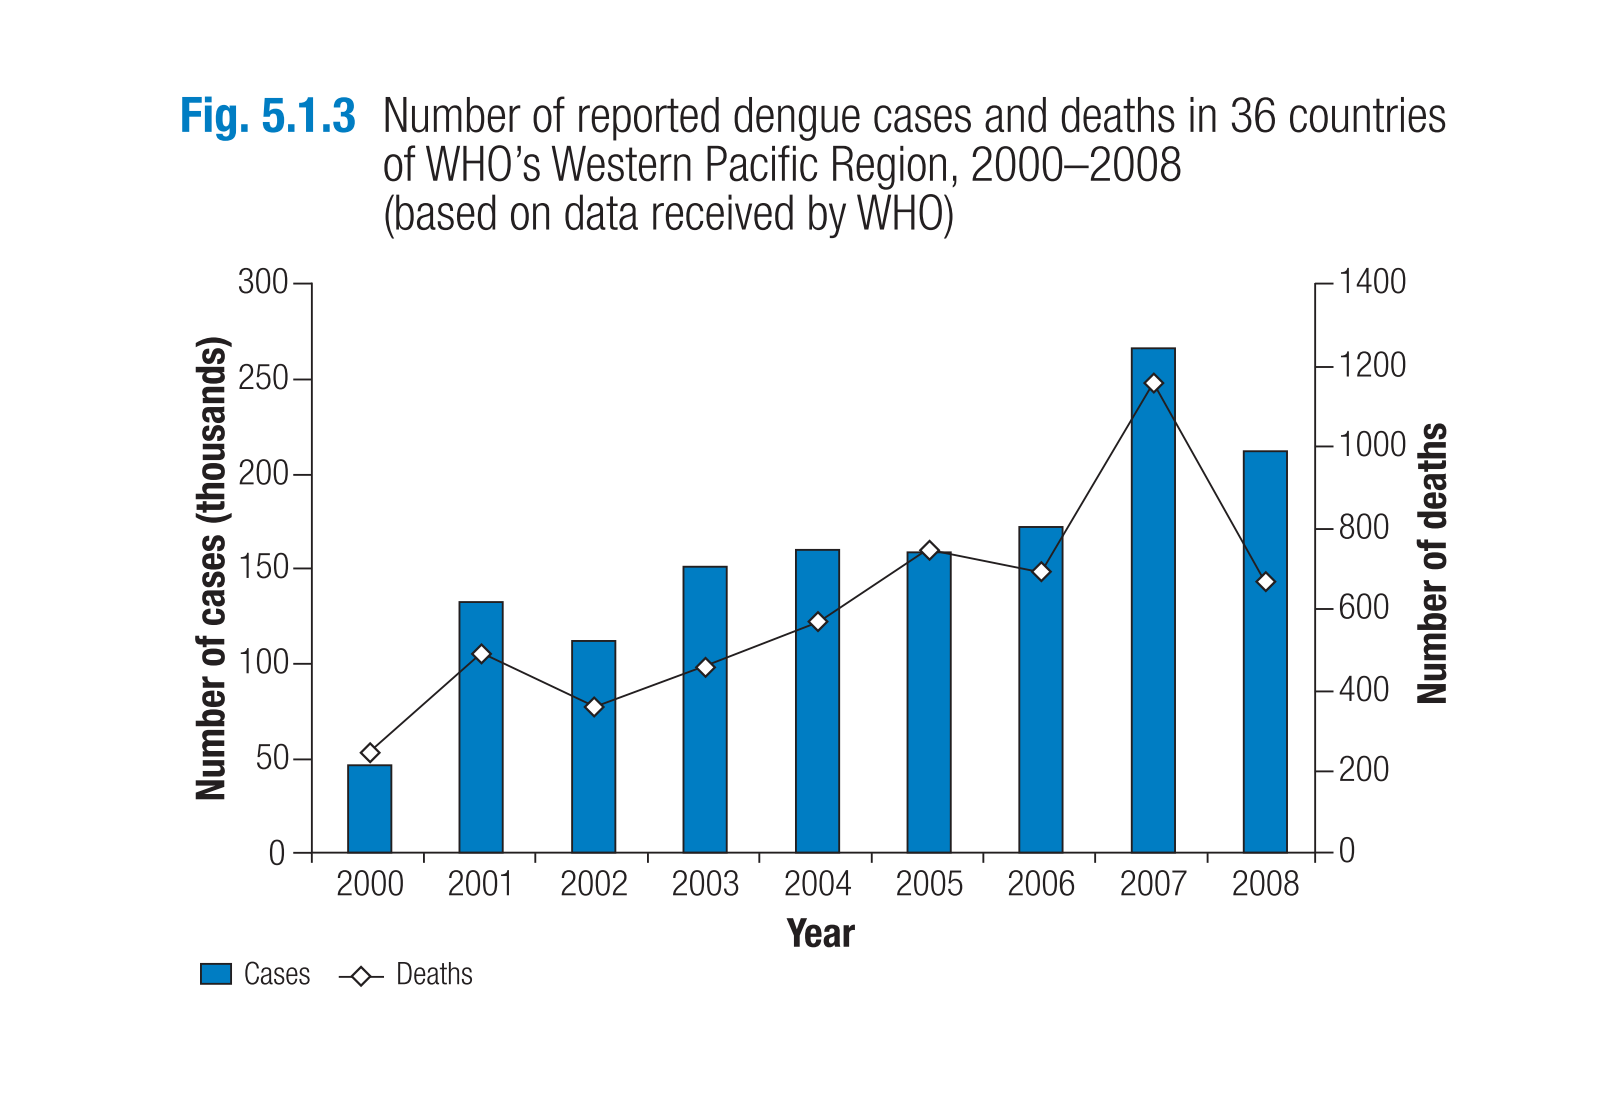
This image shows a bar graph that depicts the number of reported dengue cases and deaths in
36 countries of WHO's western pacific region in 2000-2008.  The information displayed is based
on the information received by the WHO.  The cases are shown with a blue bar while the deaths
are shown with an open circle with a line though it.  Numbers depicting possible cases are
along the left of the bar graph, and the years are along the bottom.  A bar is drawn to show
the number of cases for each year, and a circle is placed at the correct spot for each year
as well.  Each dot is then connected by a line.
The image on the left hand side is a nine year period collection of data from 2000-2008 showing
the number of reported Dengue cases and deaths in 36 countries.  From the data in 2007 had
the highest number of cases reported and nearly almost of those cases ended up deceasing from
the data collected.
This handmade chart shows  shows the number of reported dengue fever deaths around the world
to the World Health Organization. It is growing over time
 Number of dengue cases reported in 36 countries in the years 2000-2008 in the WHO's western
Pacific region this is a color-coded bar graph  it is measured by cases in the thousands