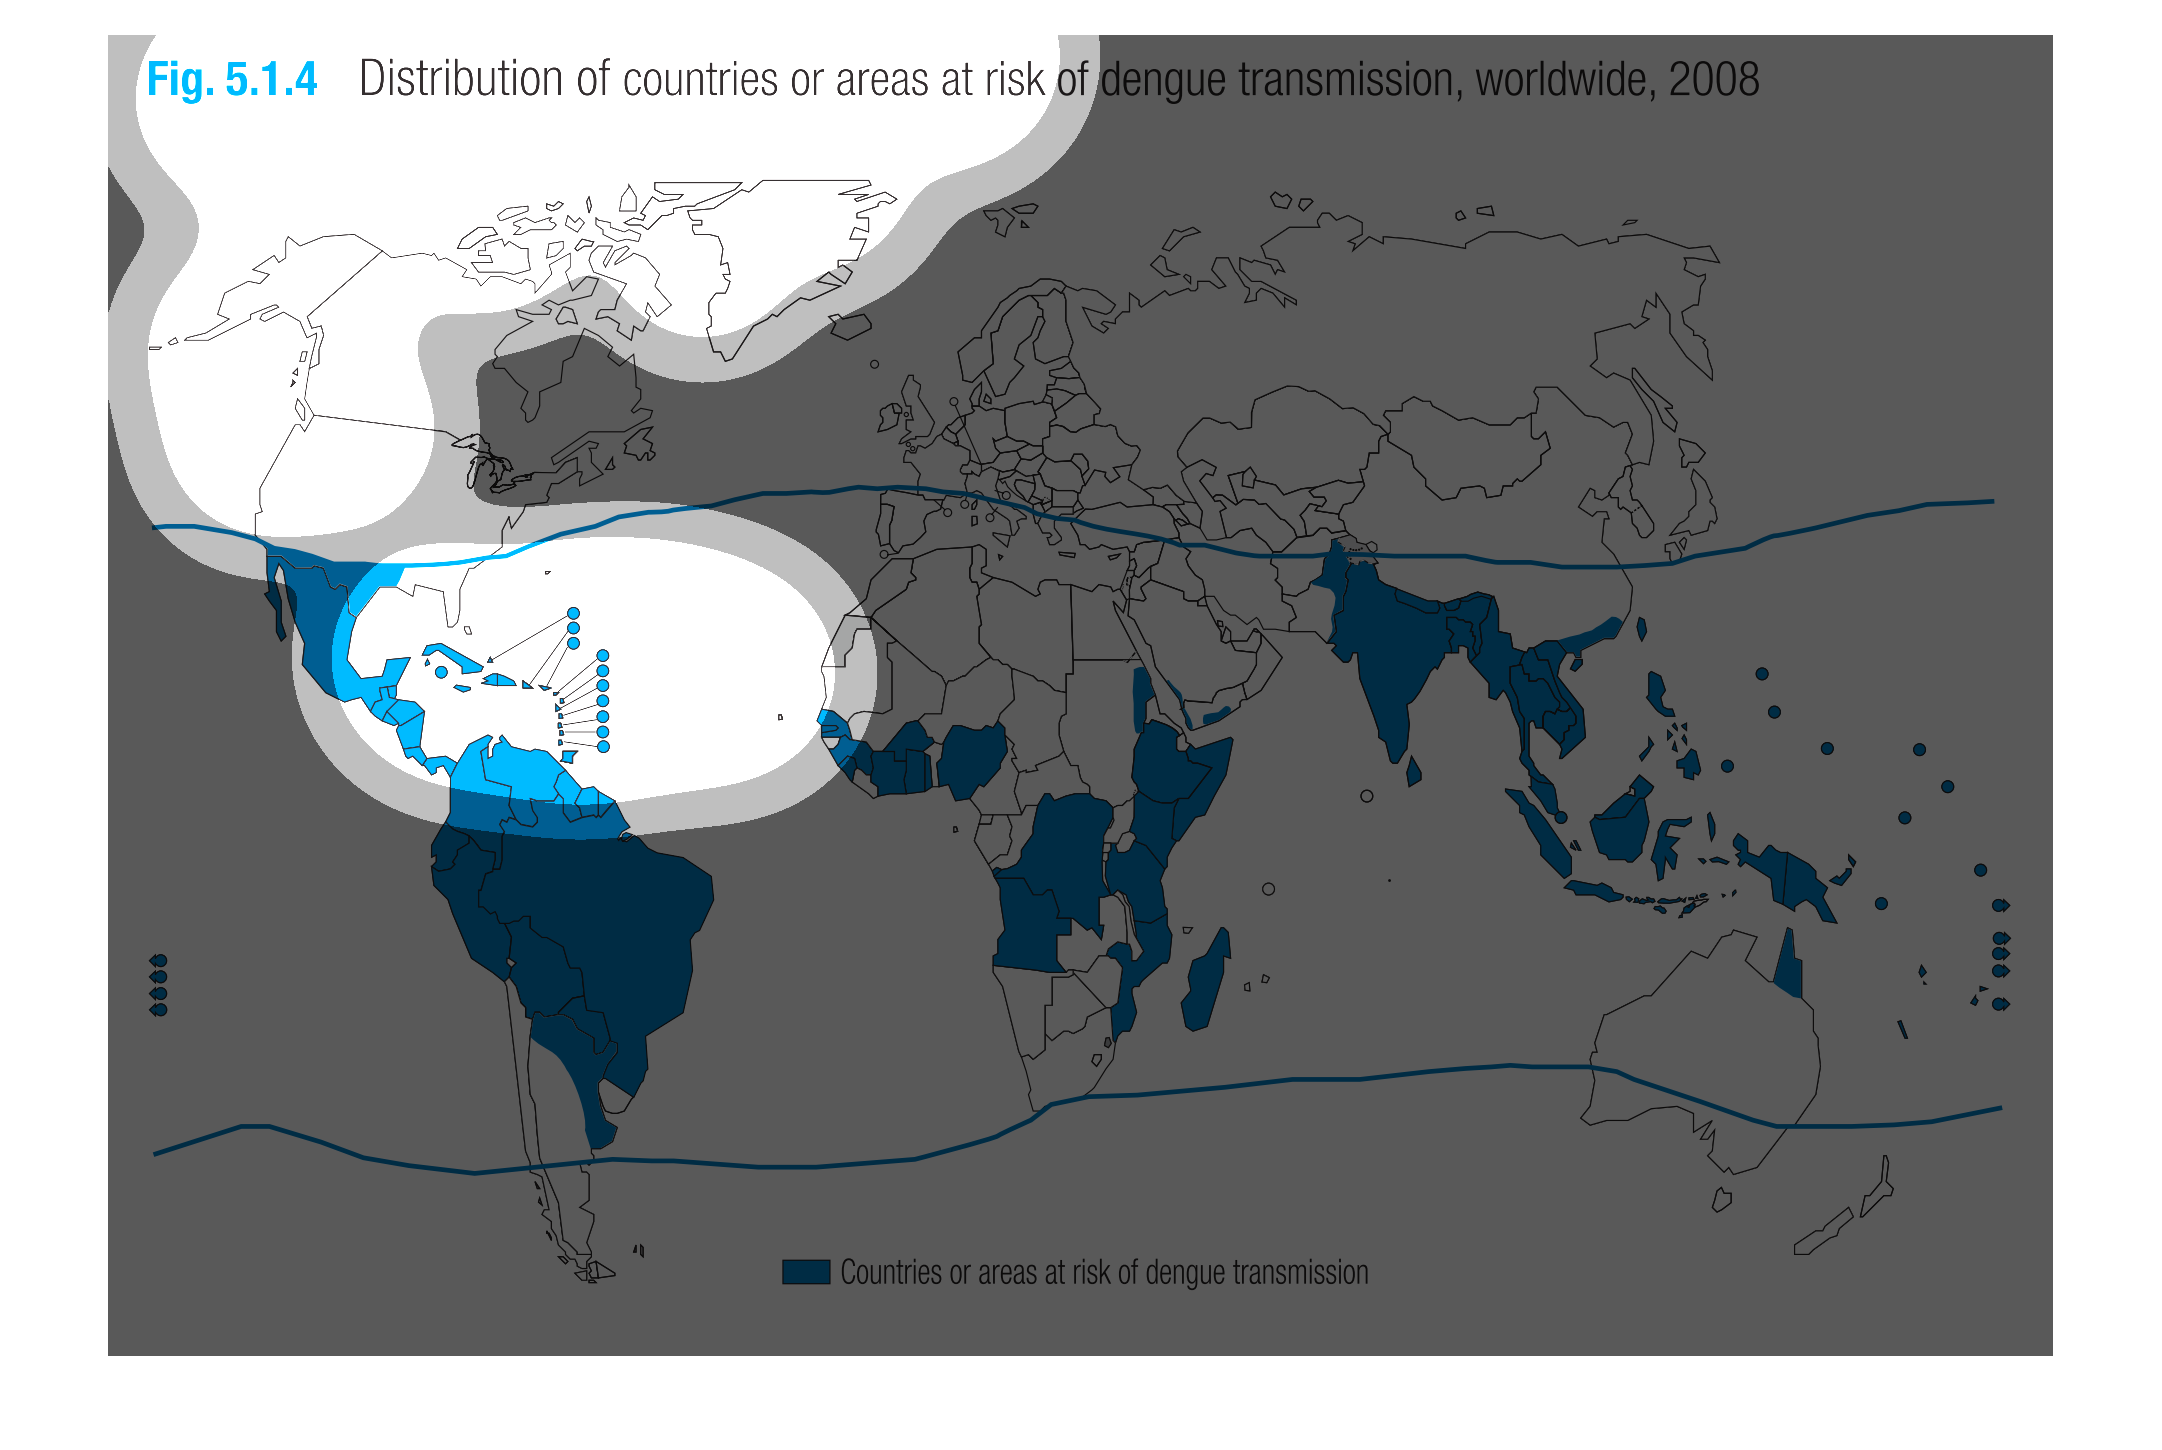
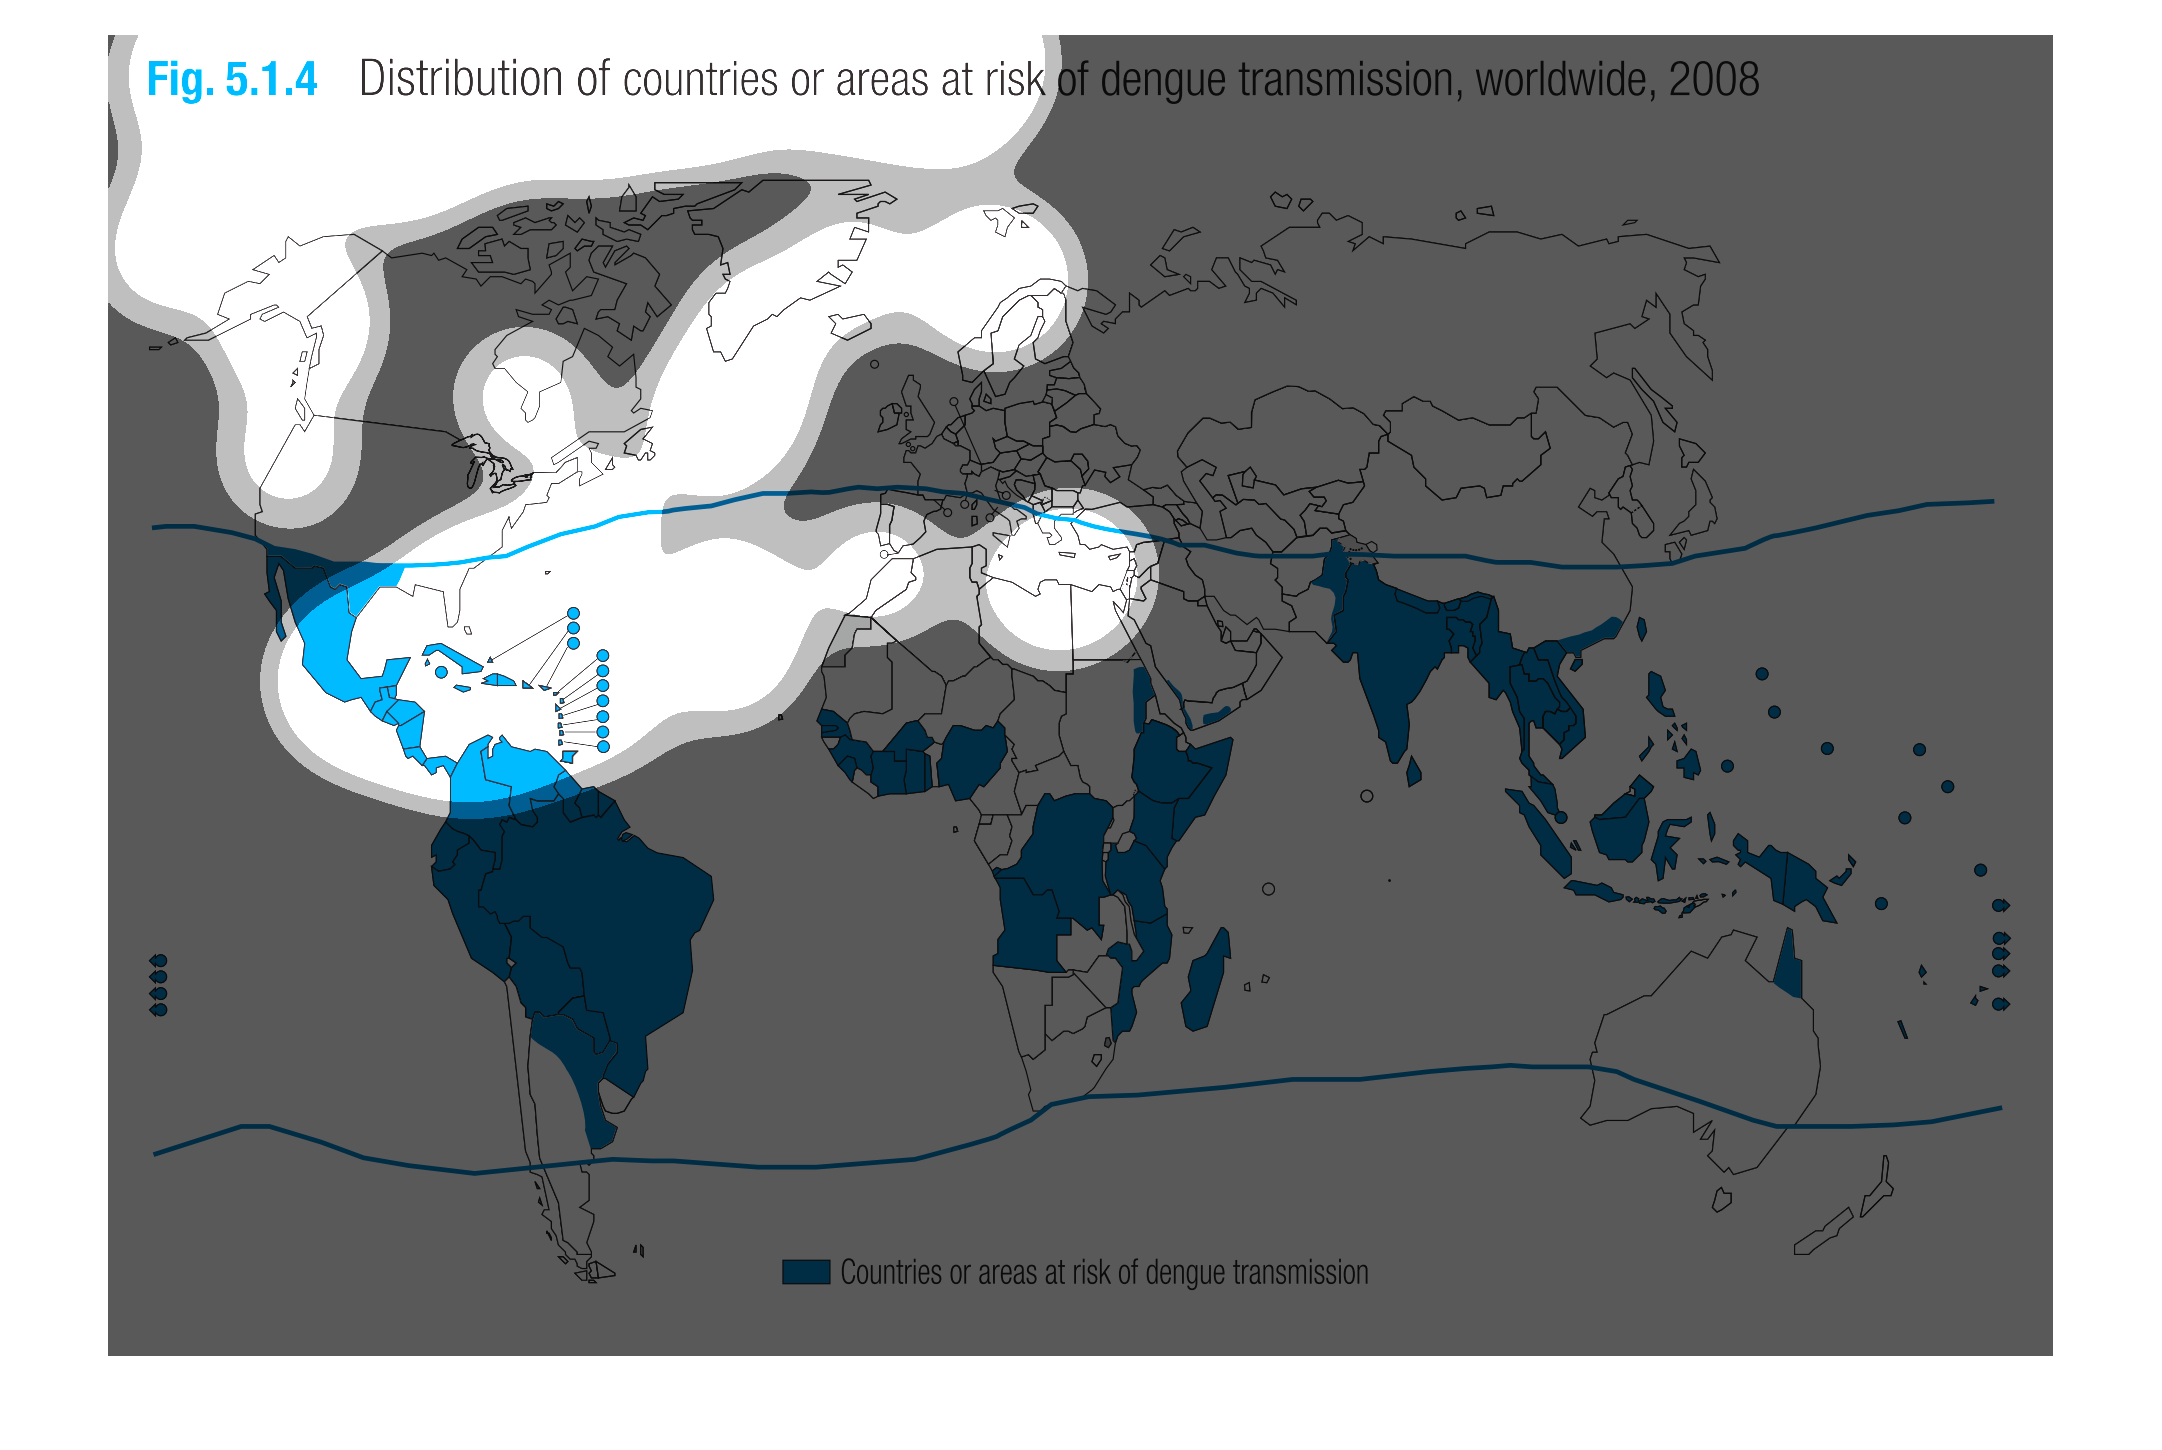
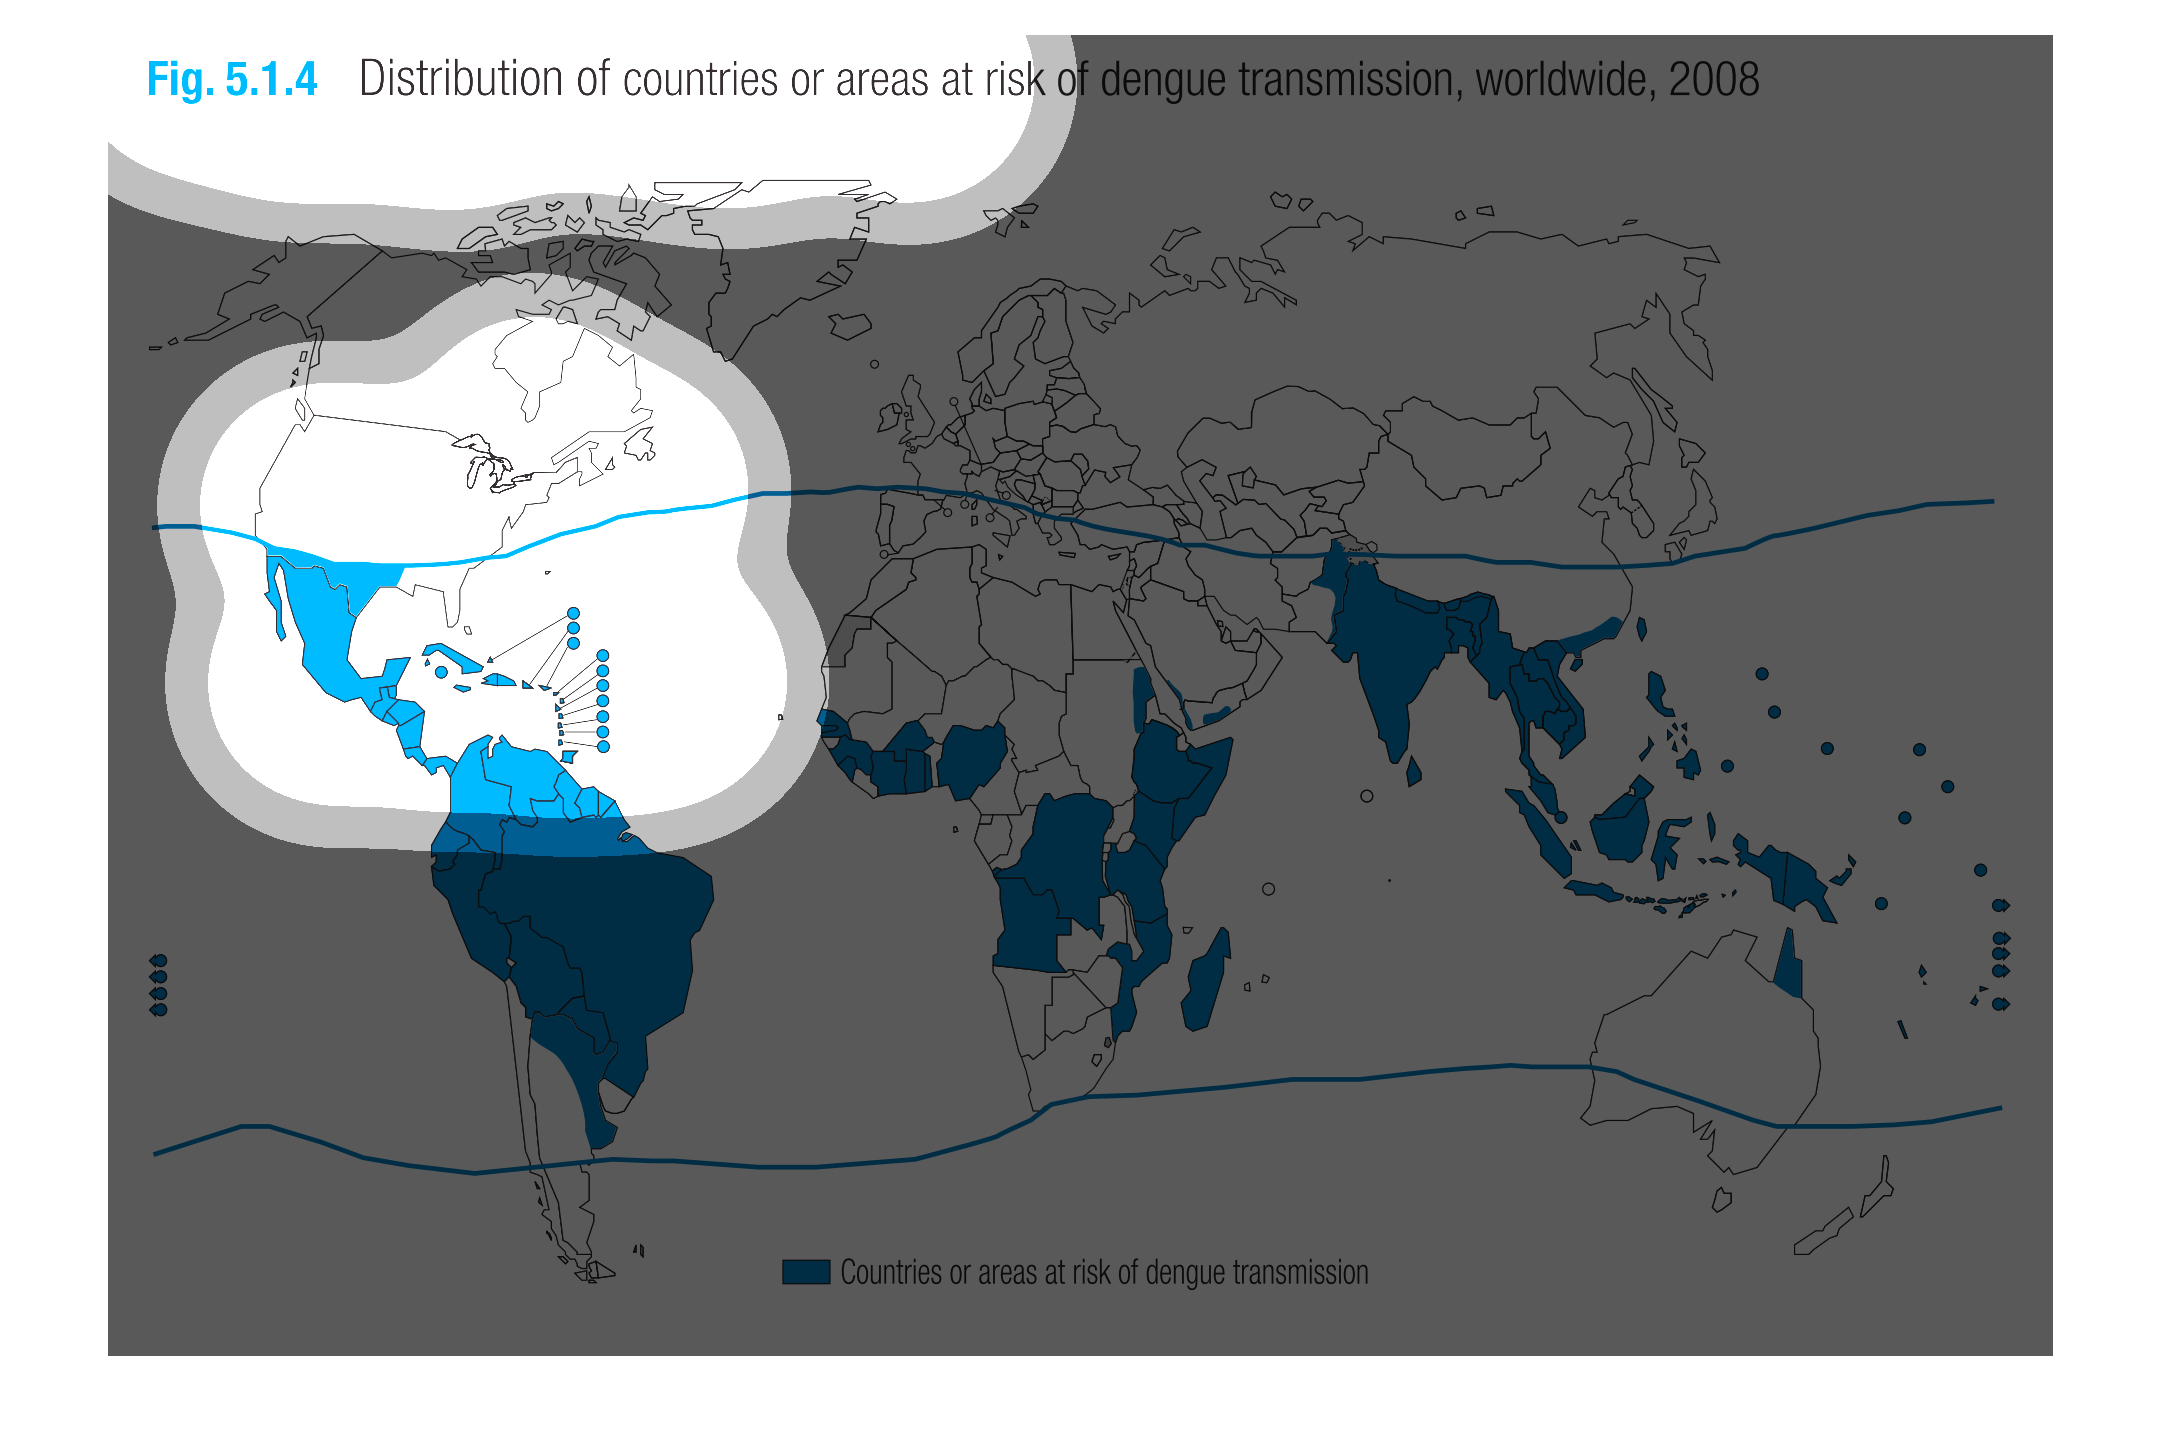
This graph depicts the countries or areas at risk of transmission for dengue fever worldwide
in 2008. The areas most at risk are represented in blue and the areas less at risk are represented
in white.
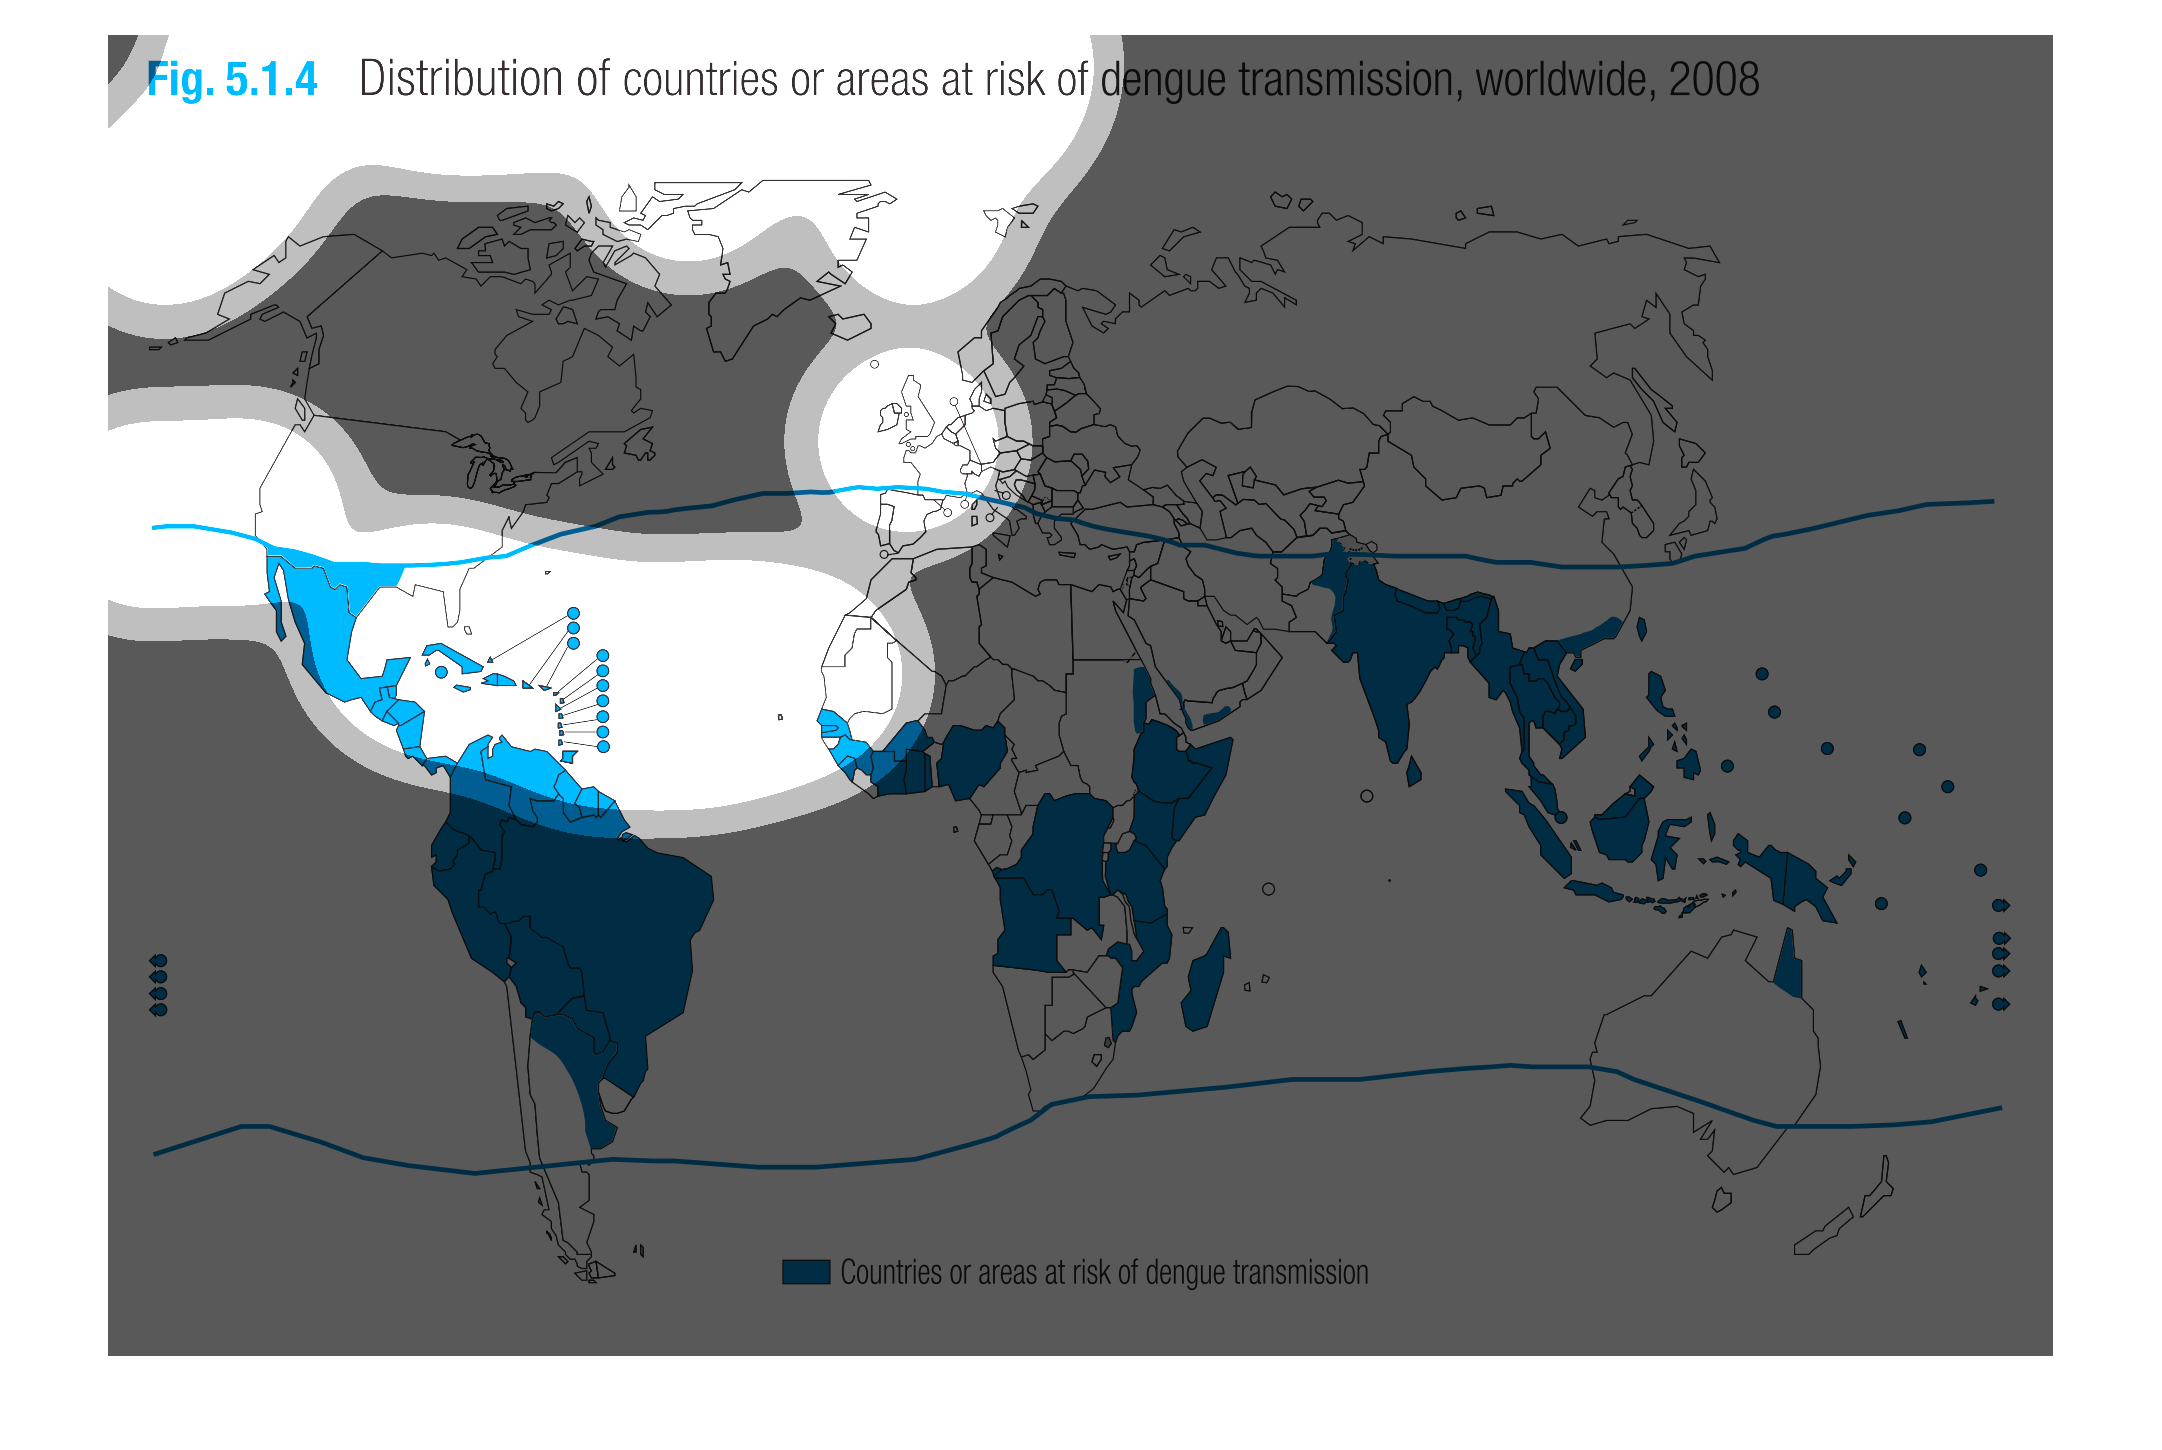
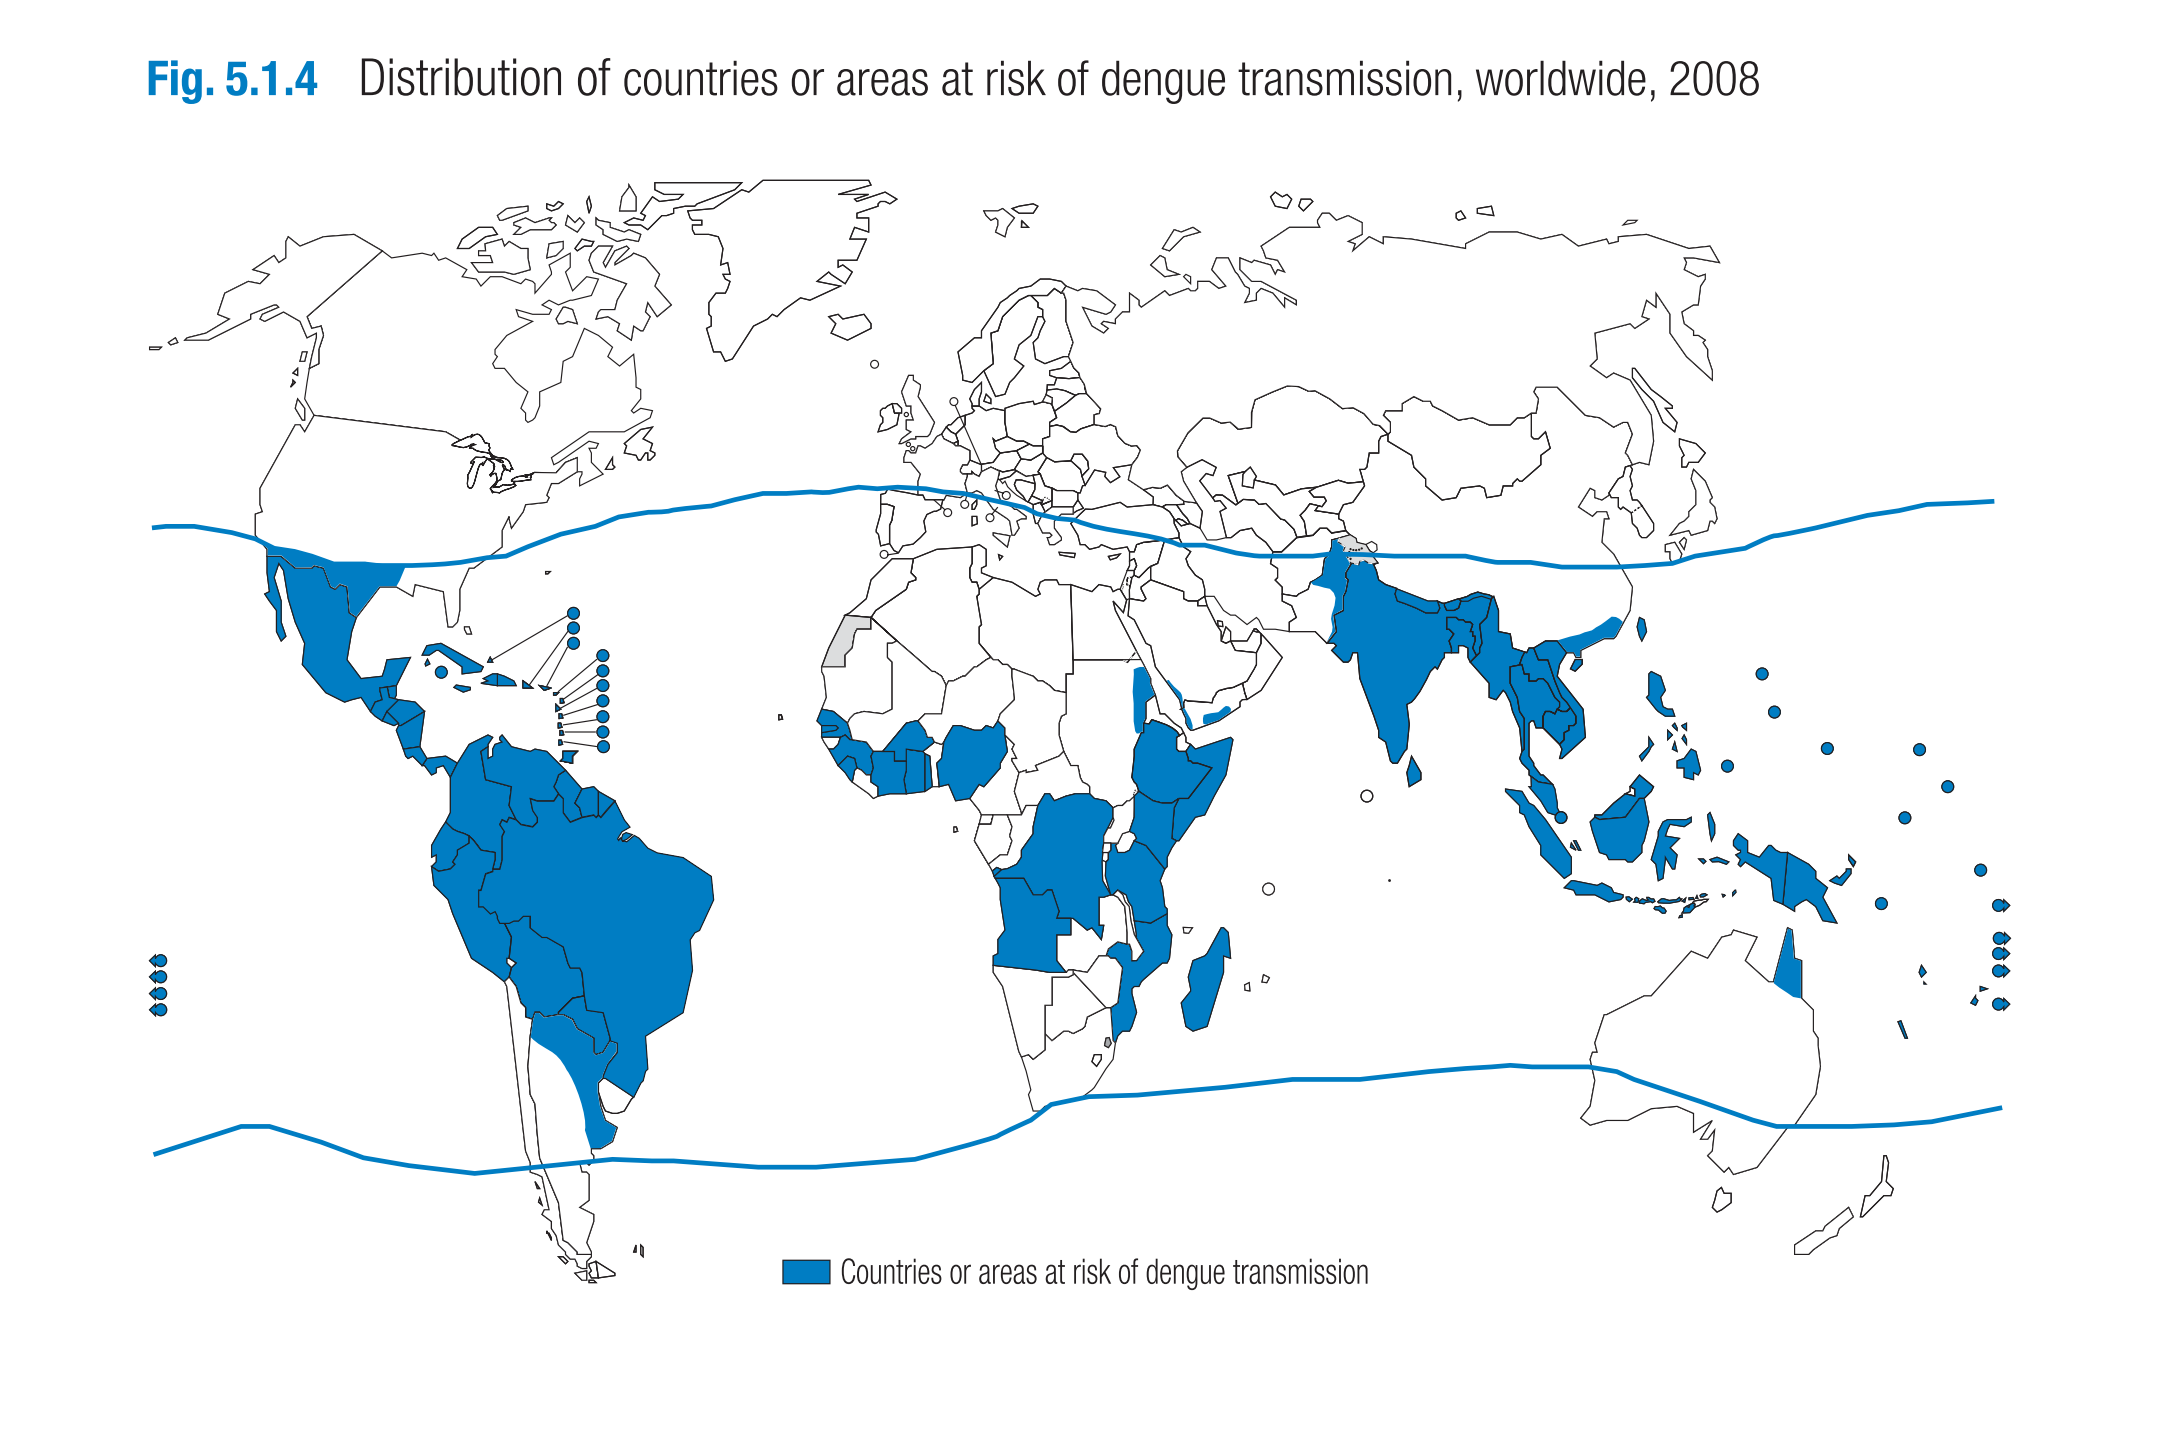
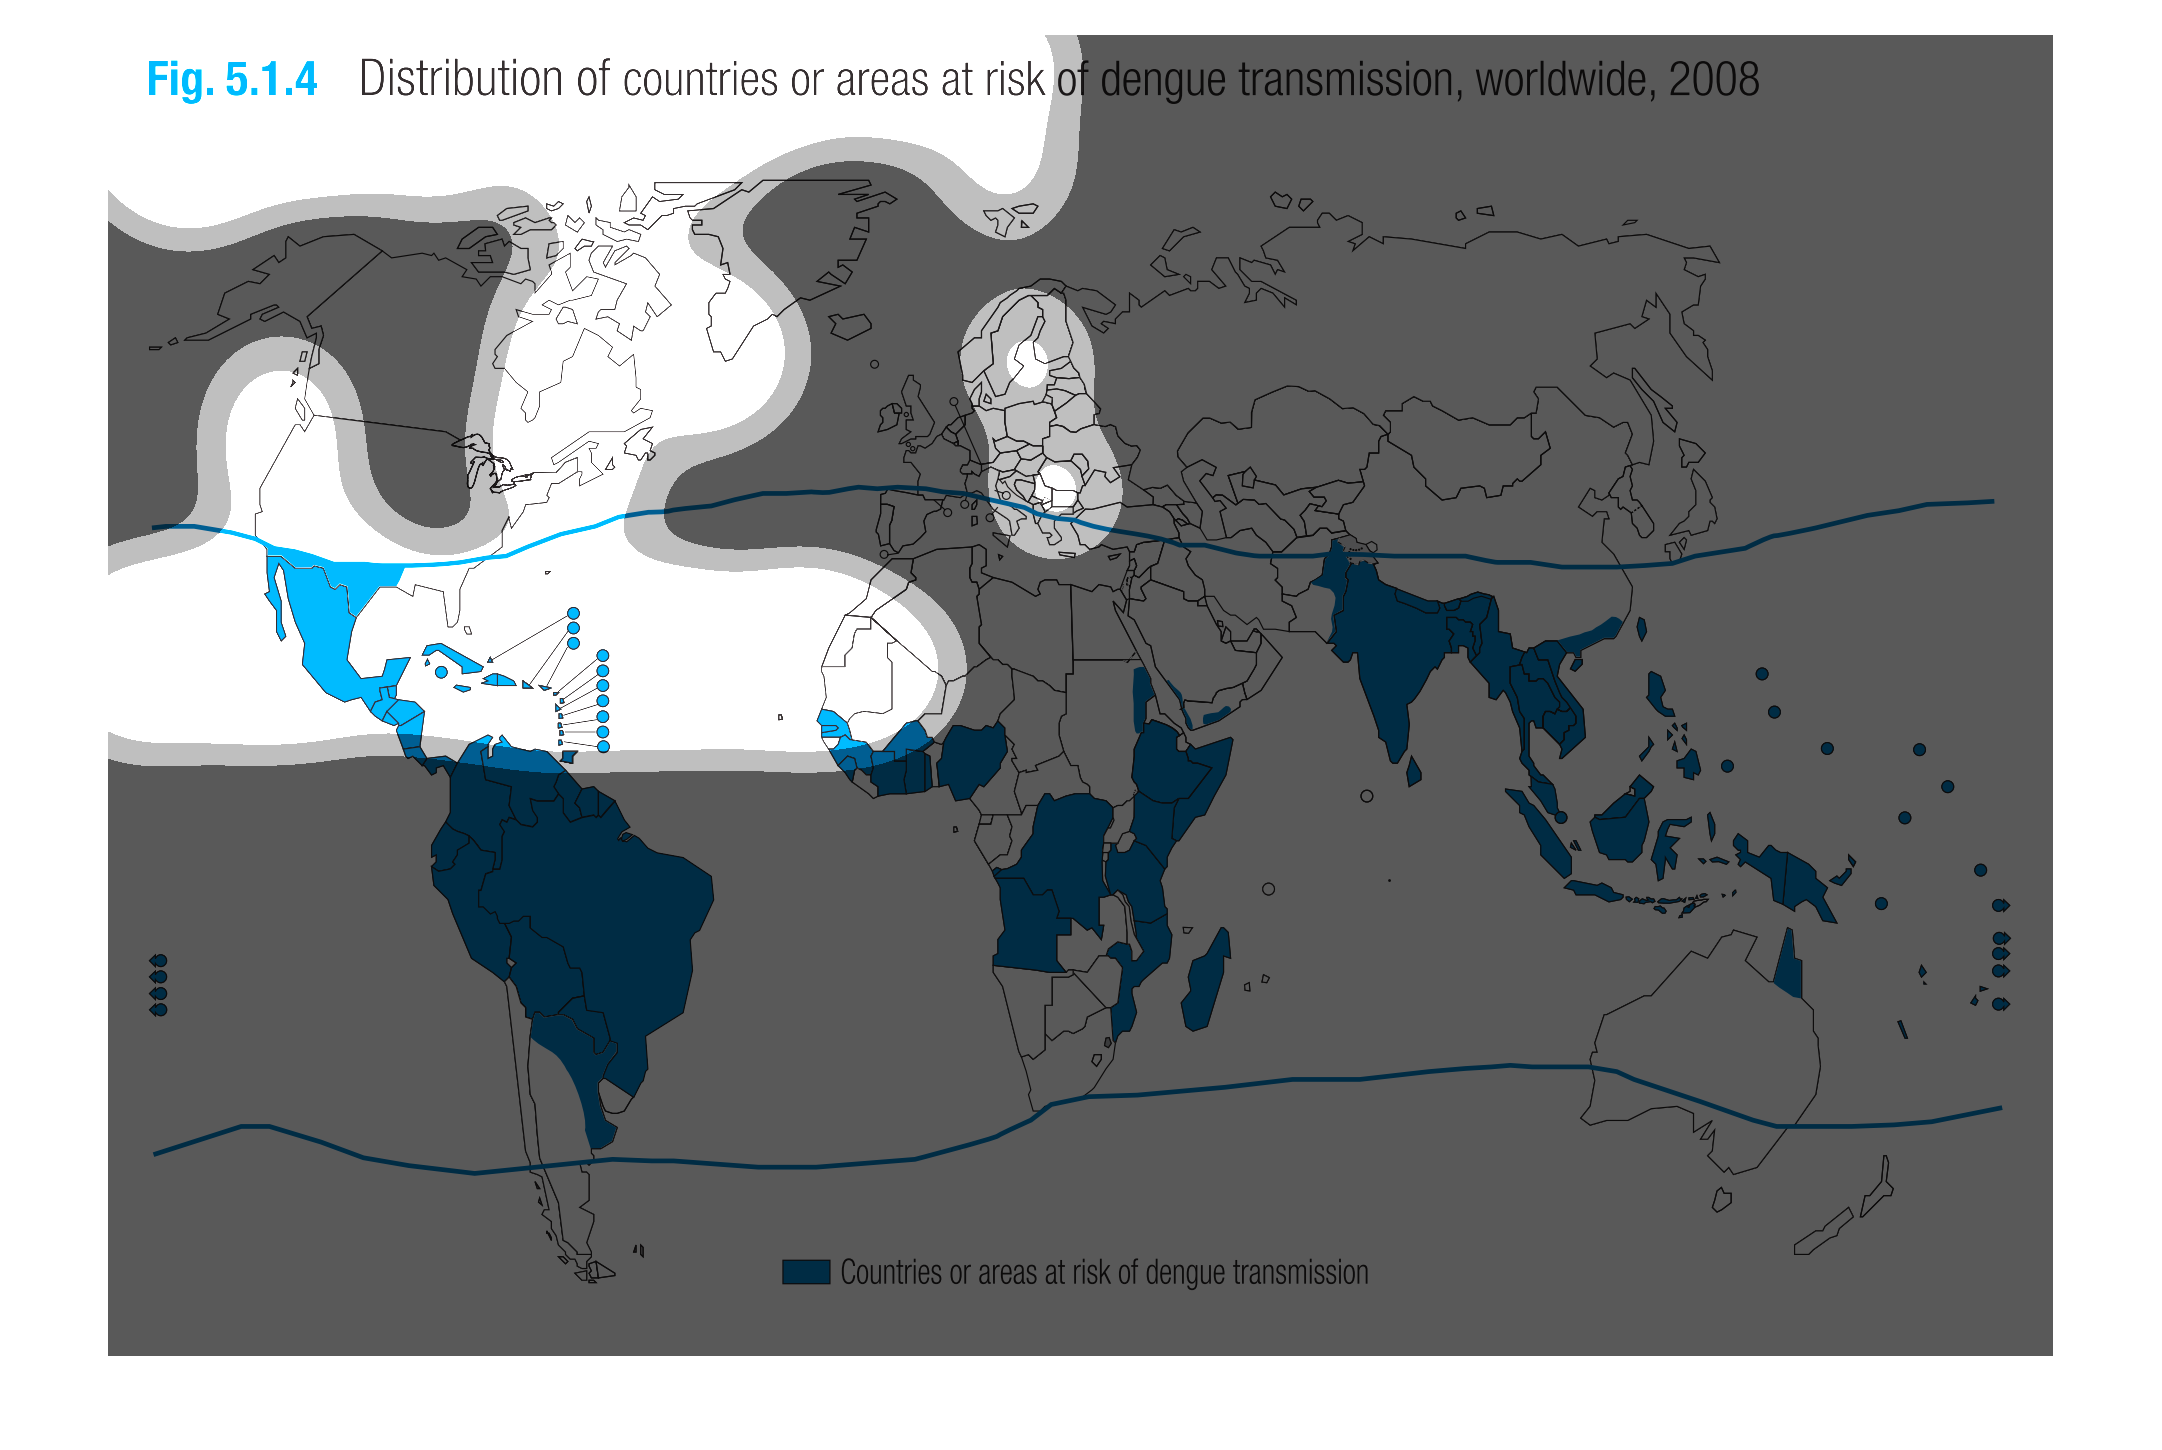
This is a map of the world, with the blue parts showing the countries or areas that are at
risk of dengue transmission, including what appears to be routes of transportation.
This image shows or depicts in World Geographical statistical format the regions of the world
that are at risk of dengue transmission worldwide for the year 2008.
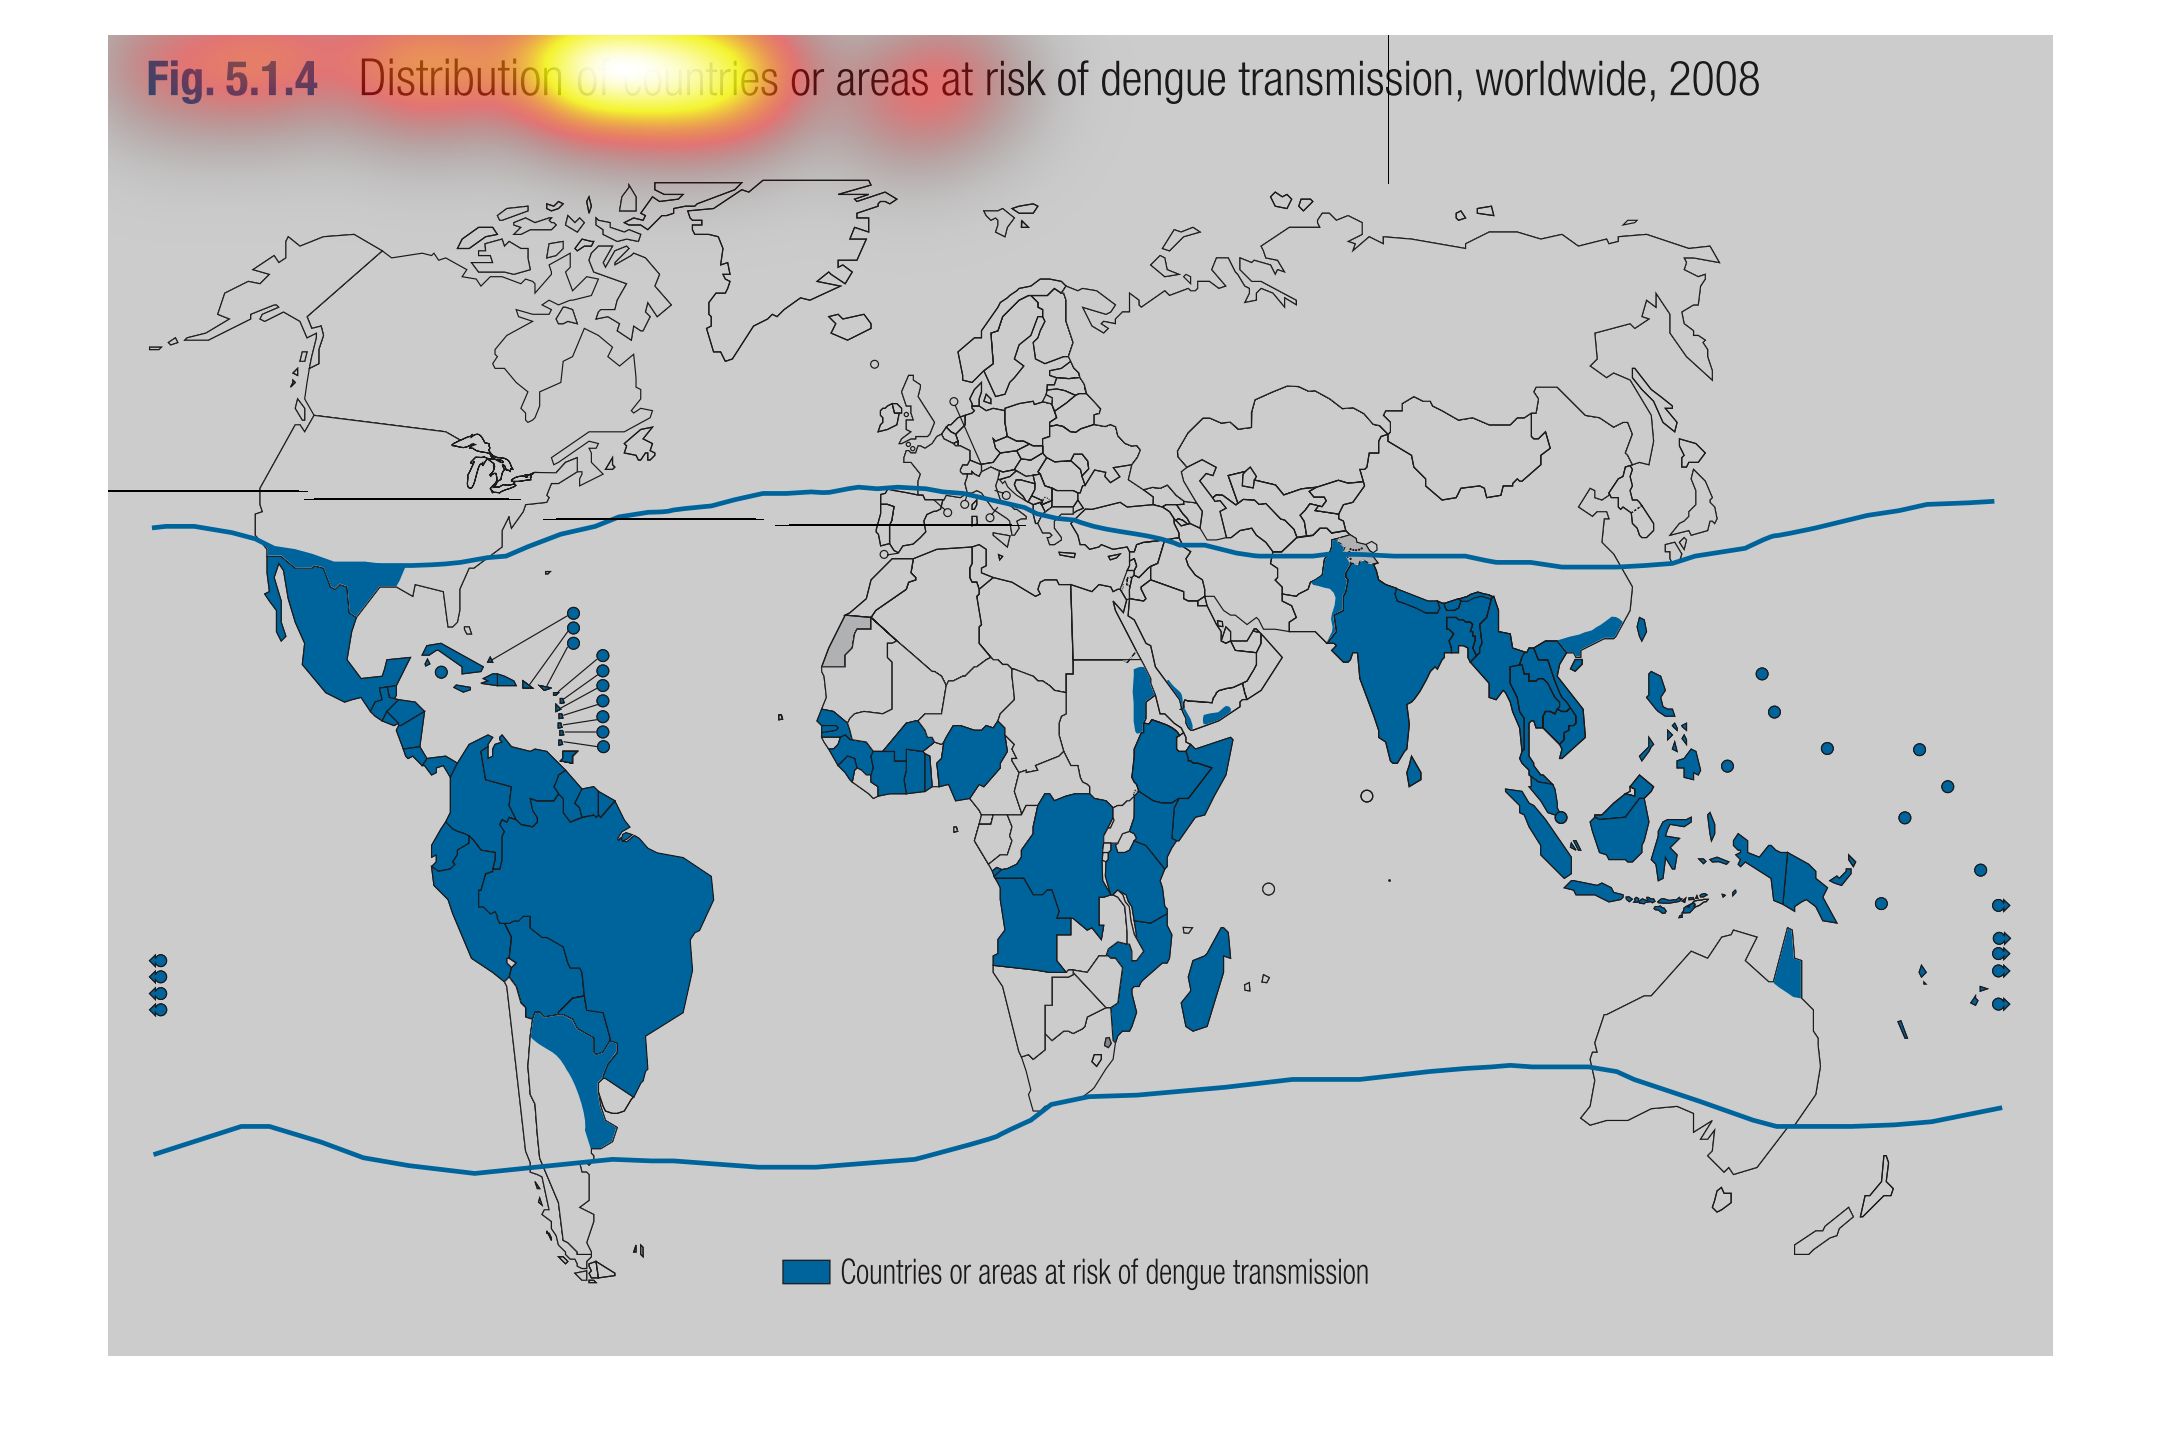
This is a blue and white chart showing the distribution of countries or areas at risk of dengue
transmission worldwide in the year 2008. The areas indicated in blue show the affected countries
or areas.
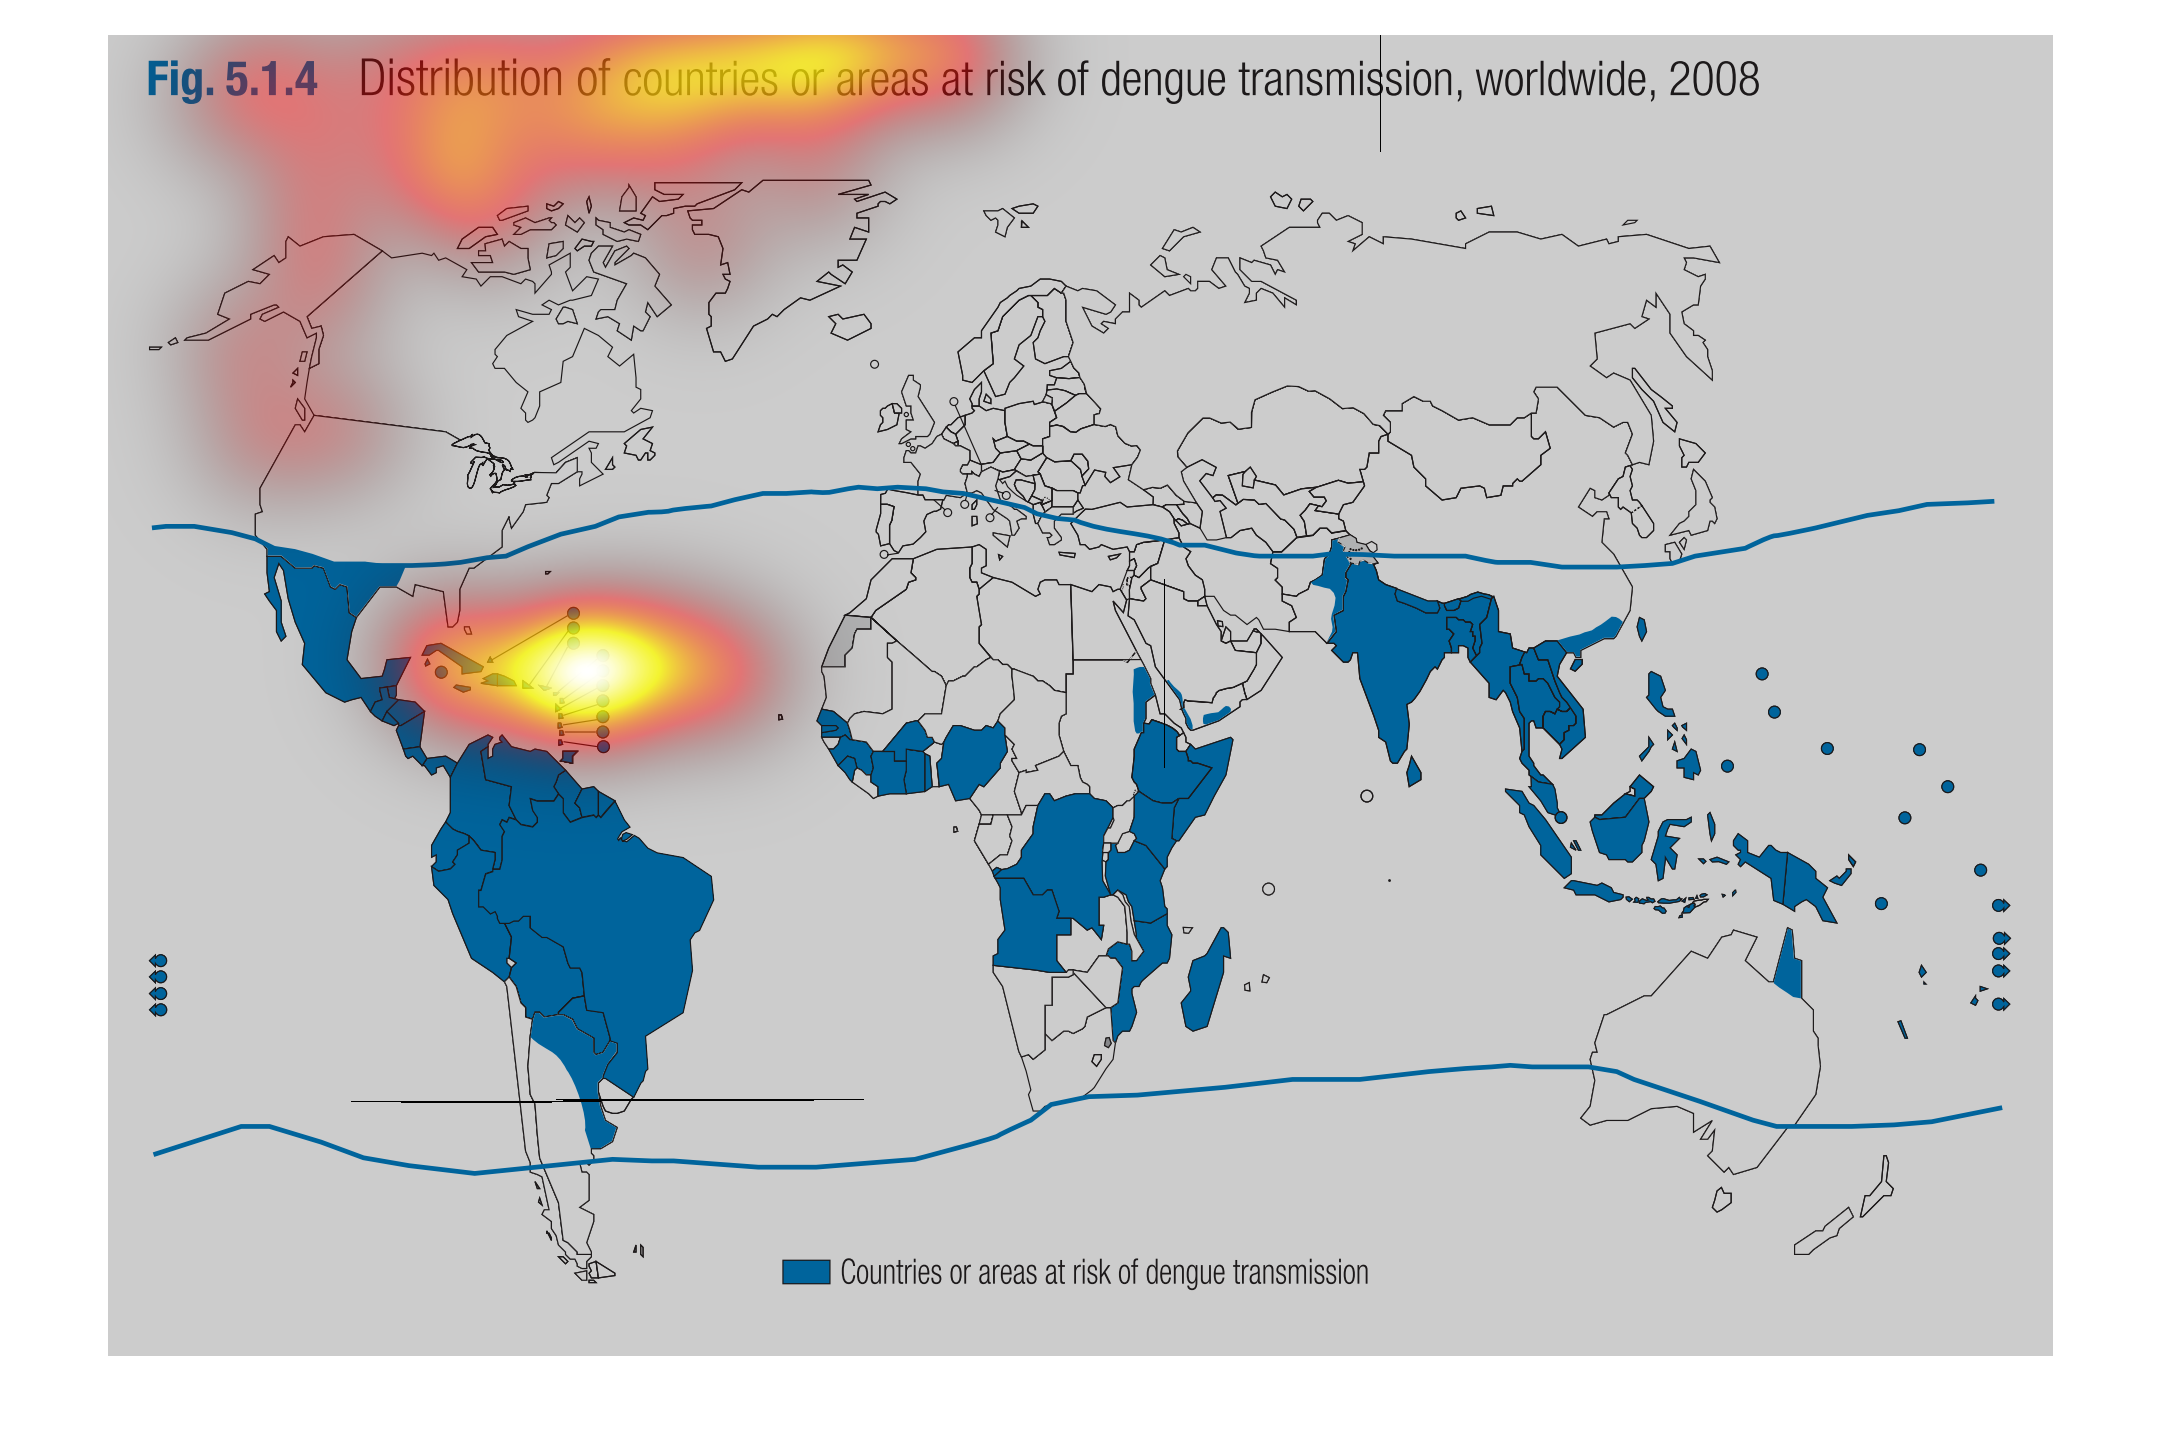
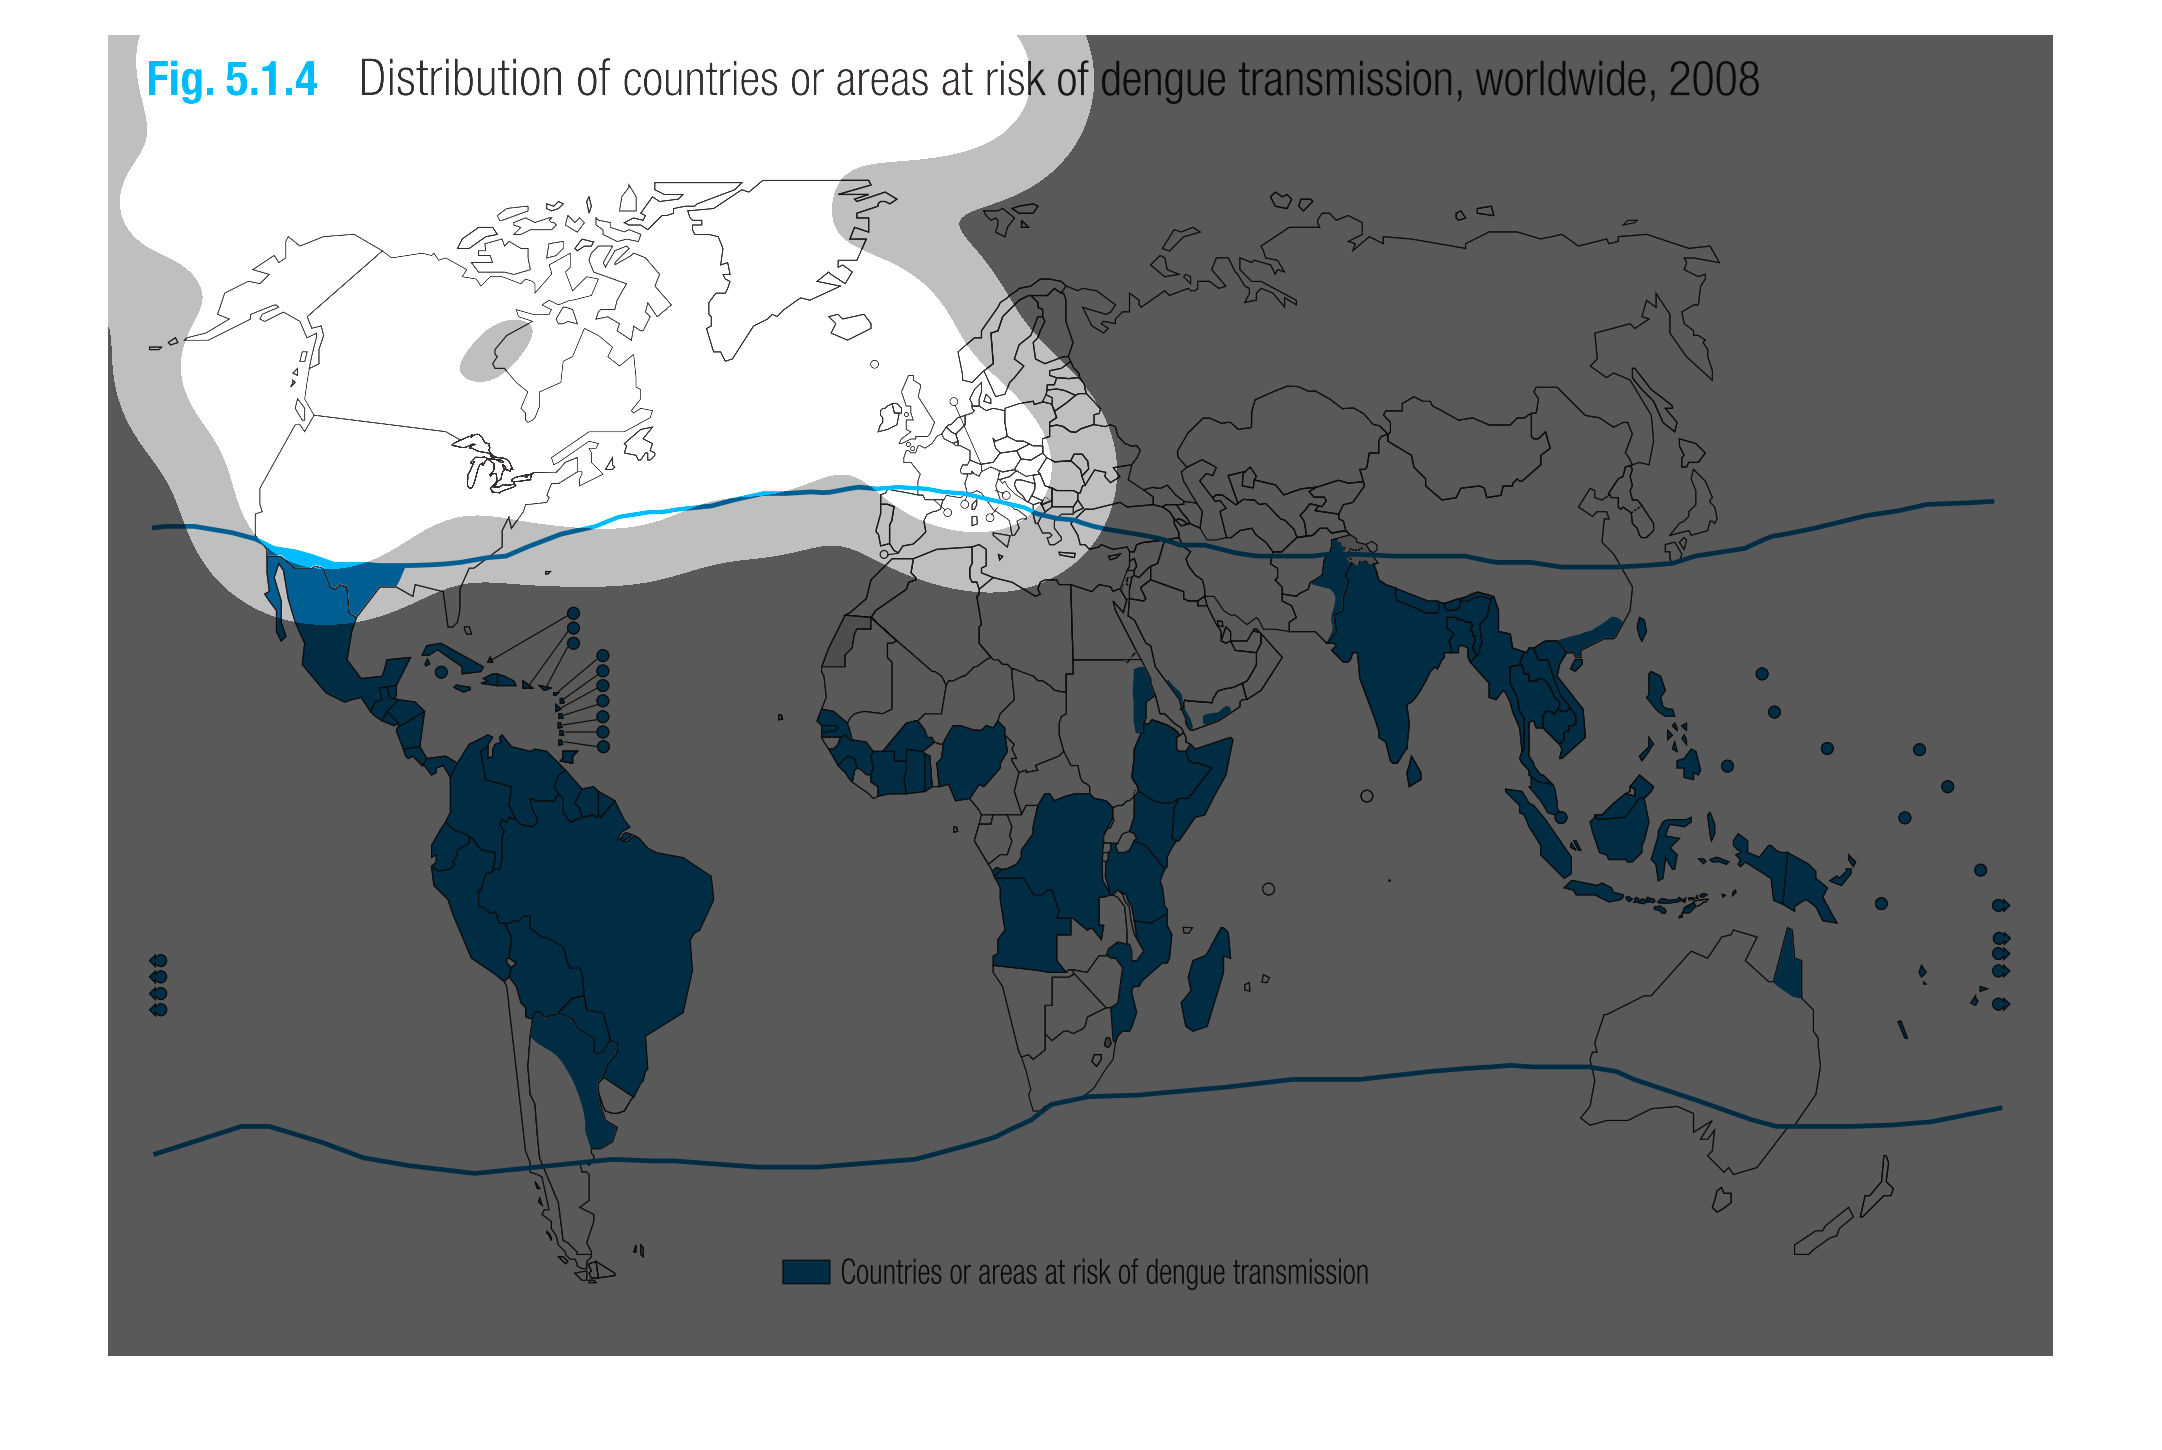
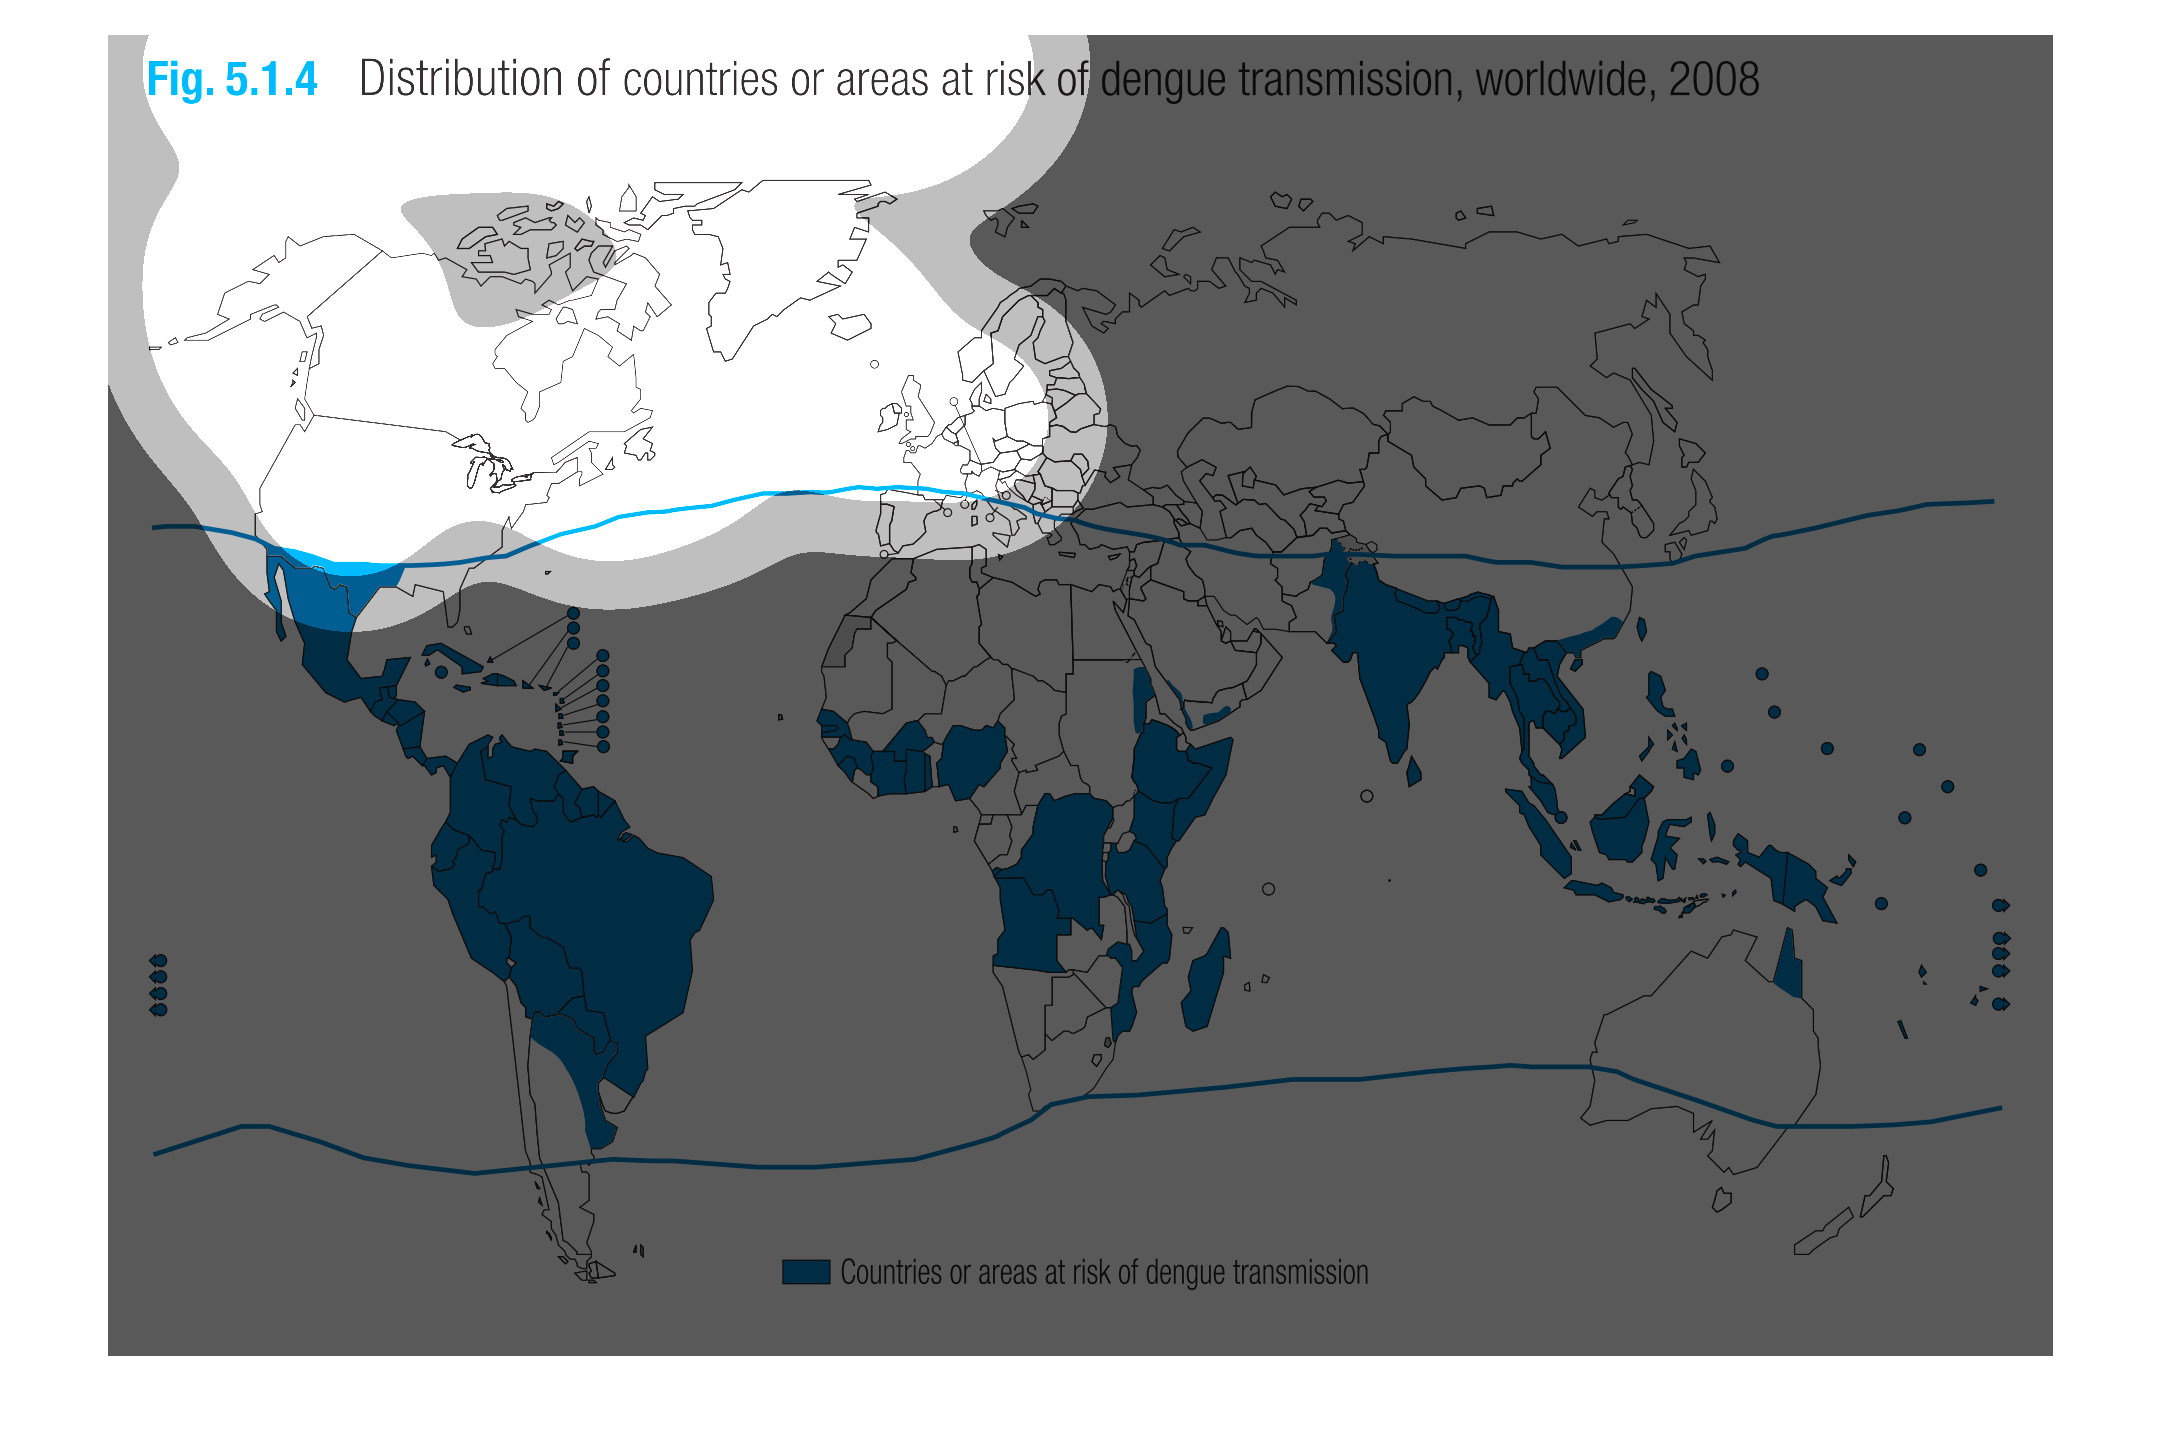
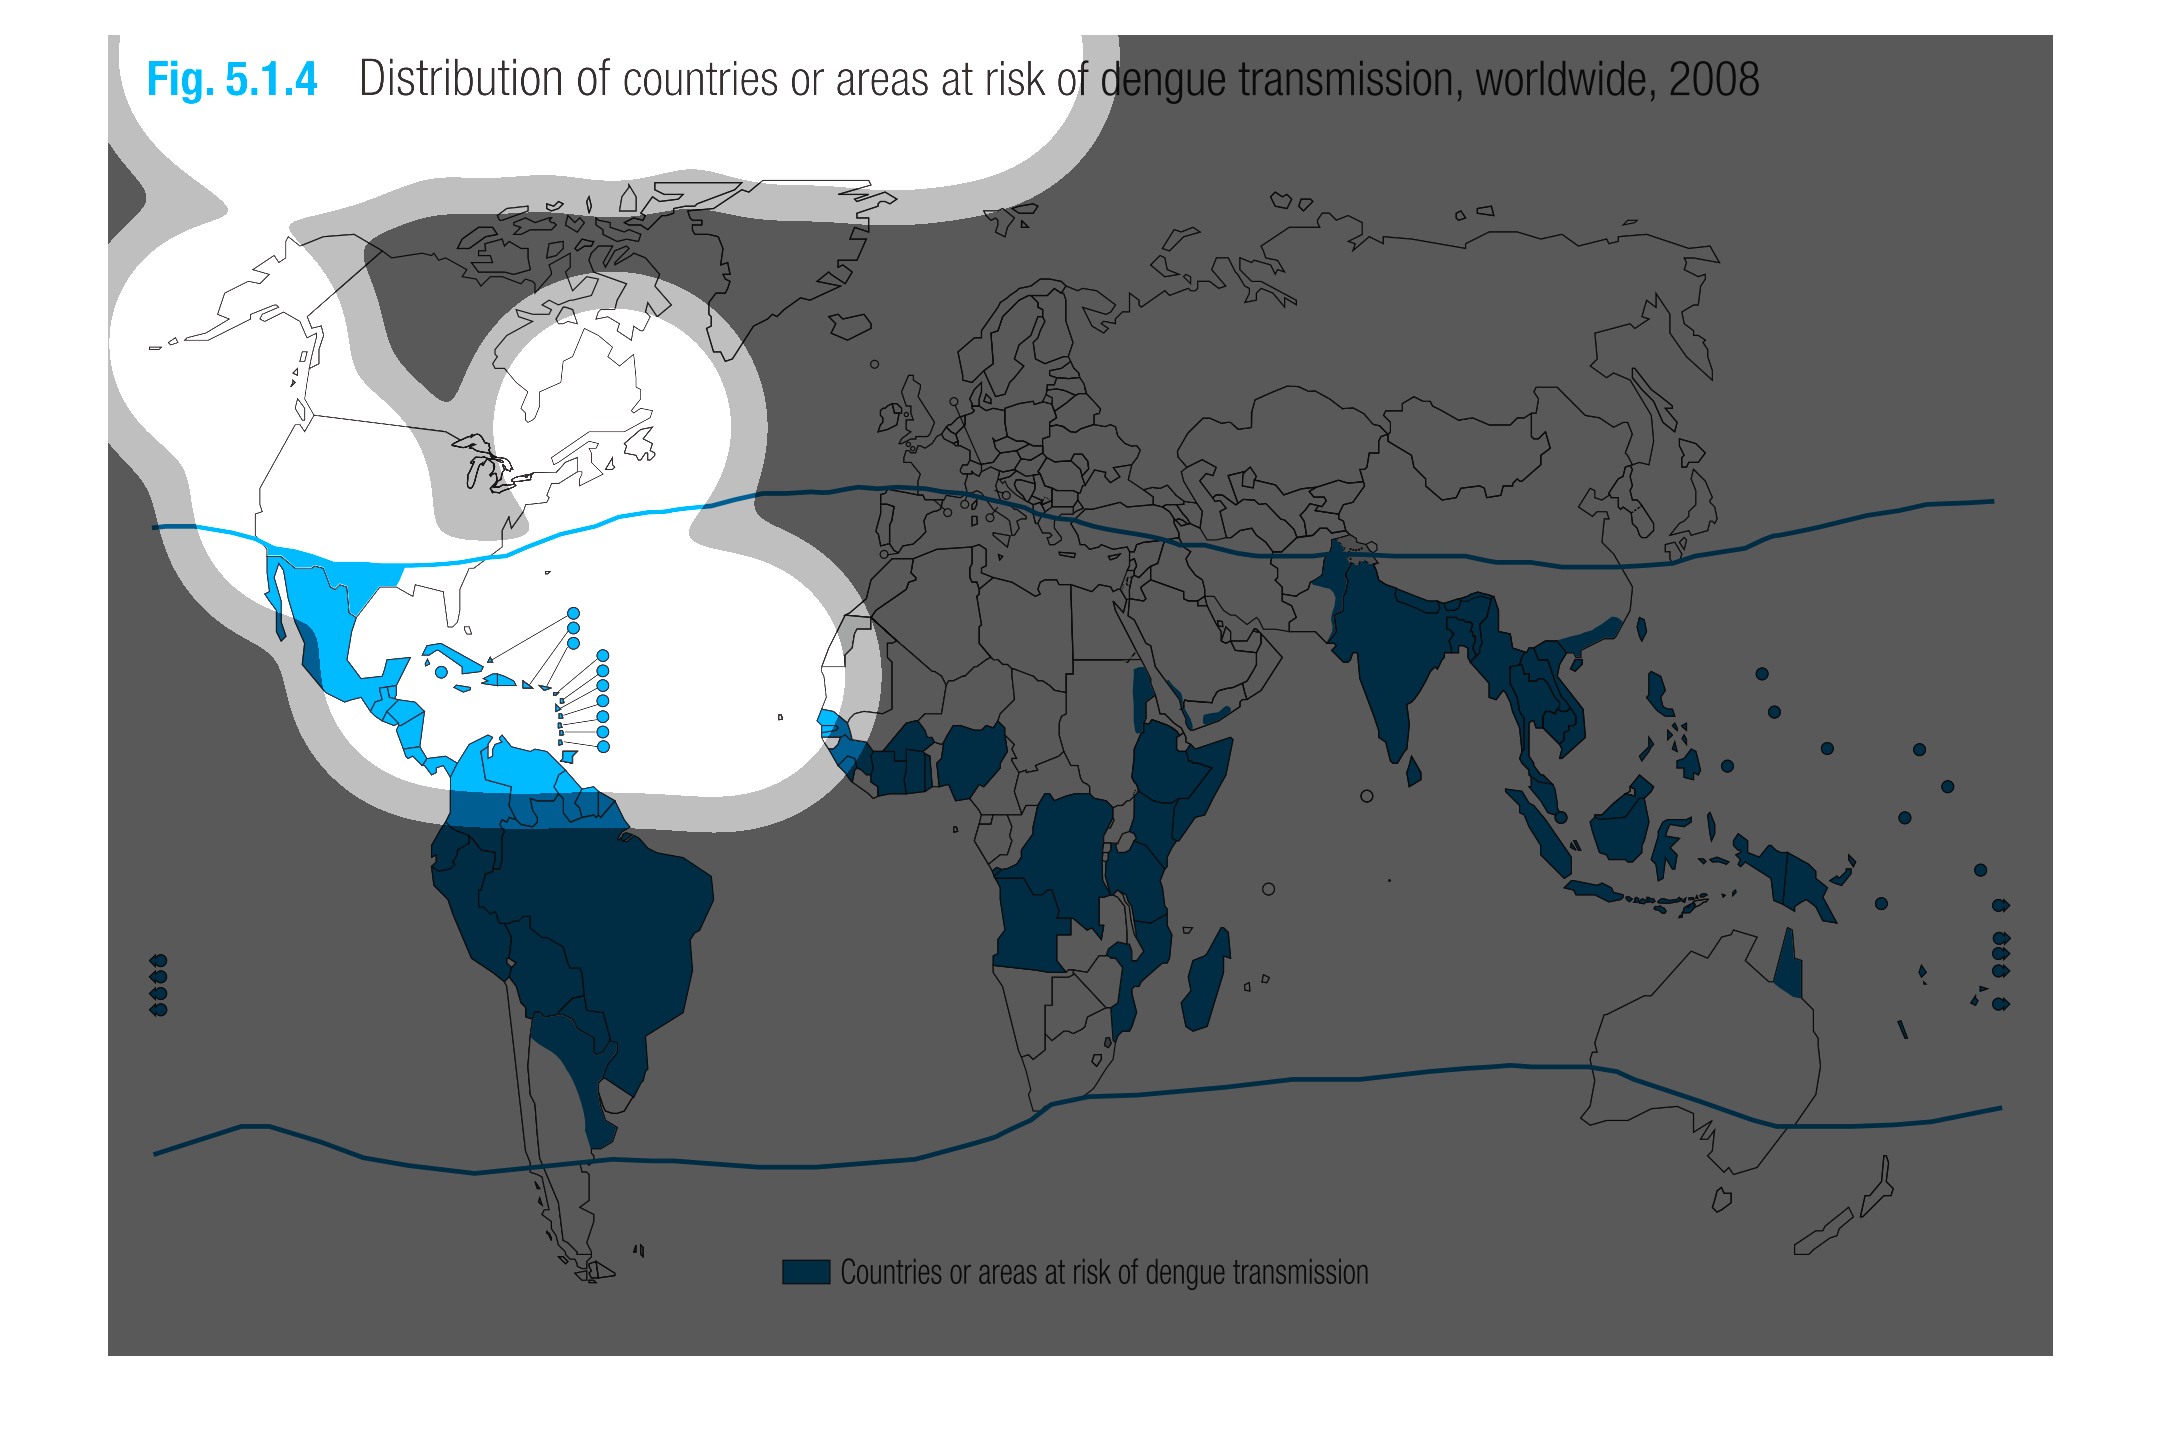
The figure presented is titled Distribution of countries or areas at risk for dengue transmission,
worldwide, 2008.  The figure is a representation of dengue transmission.
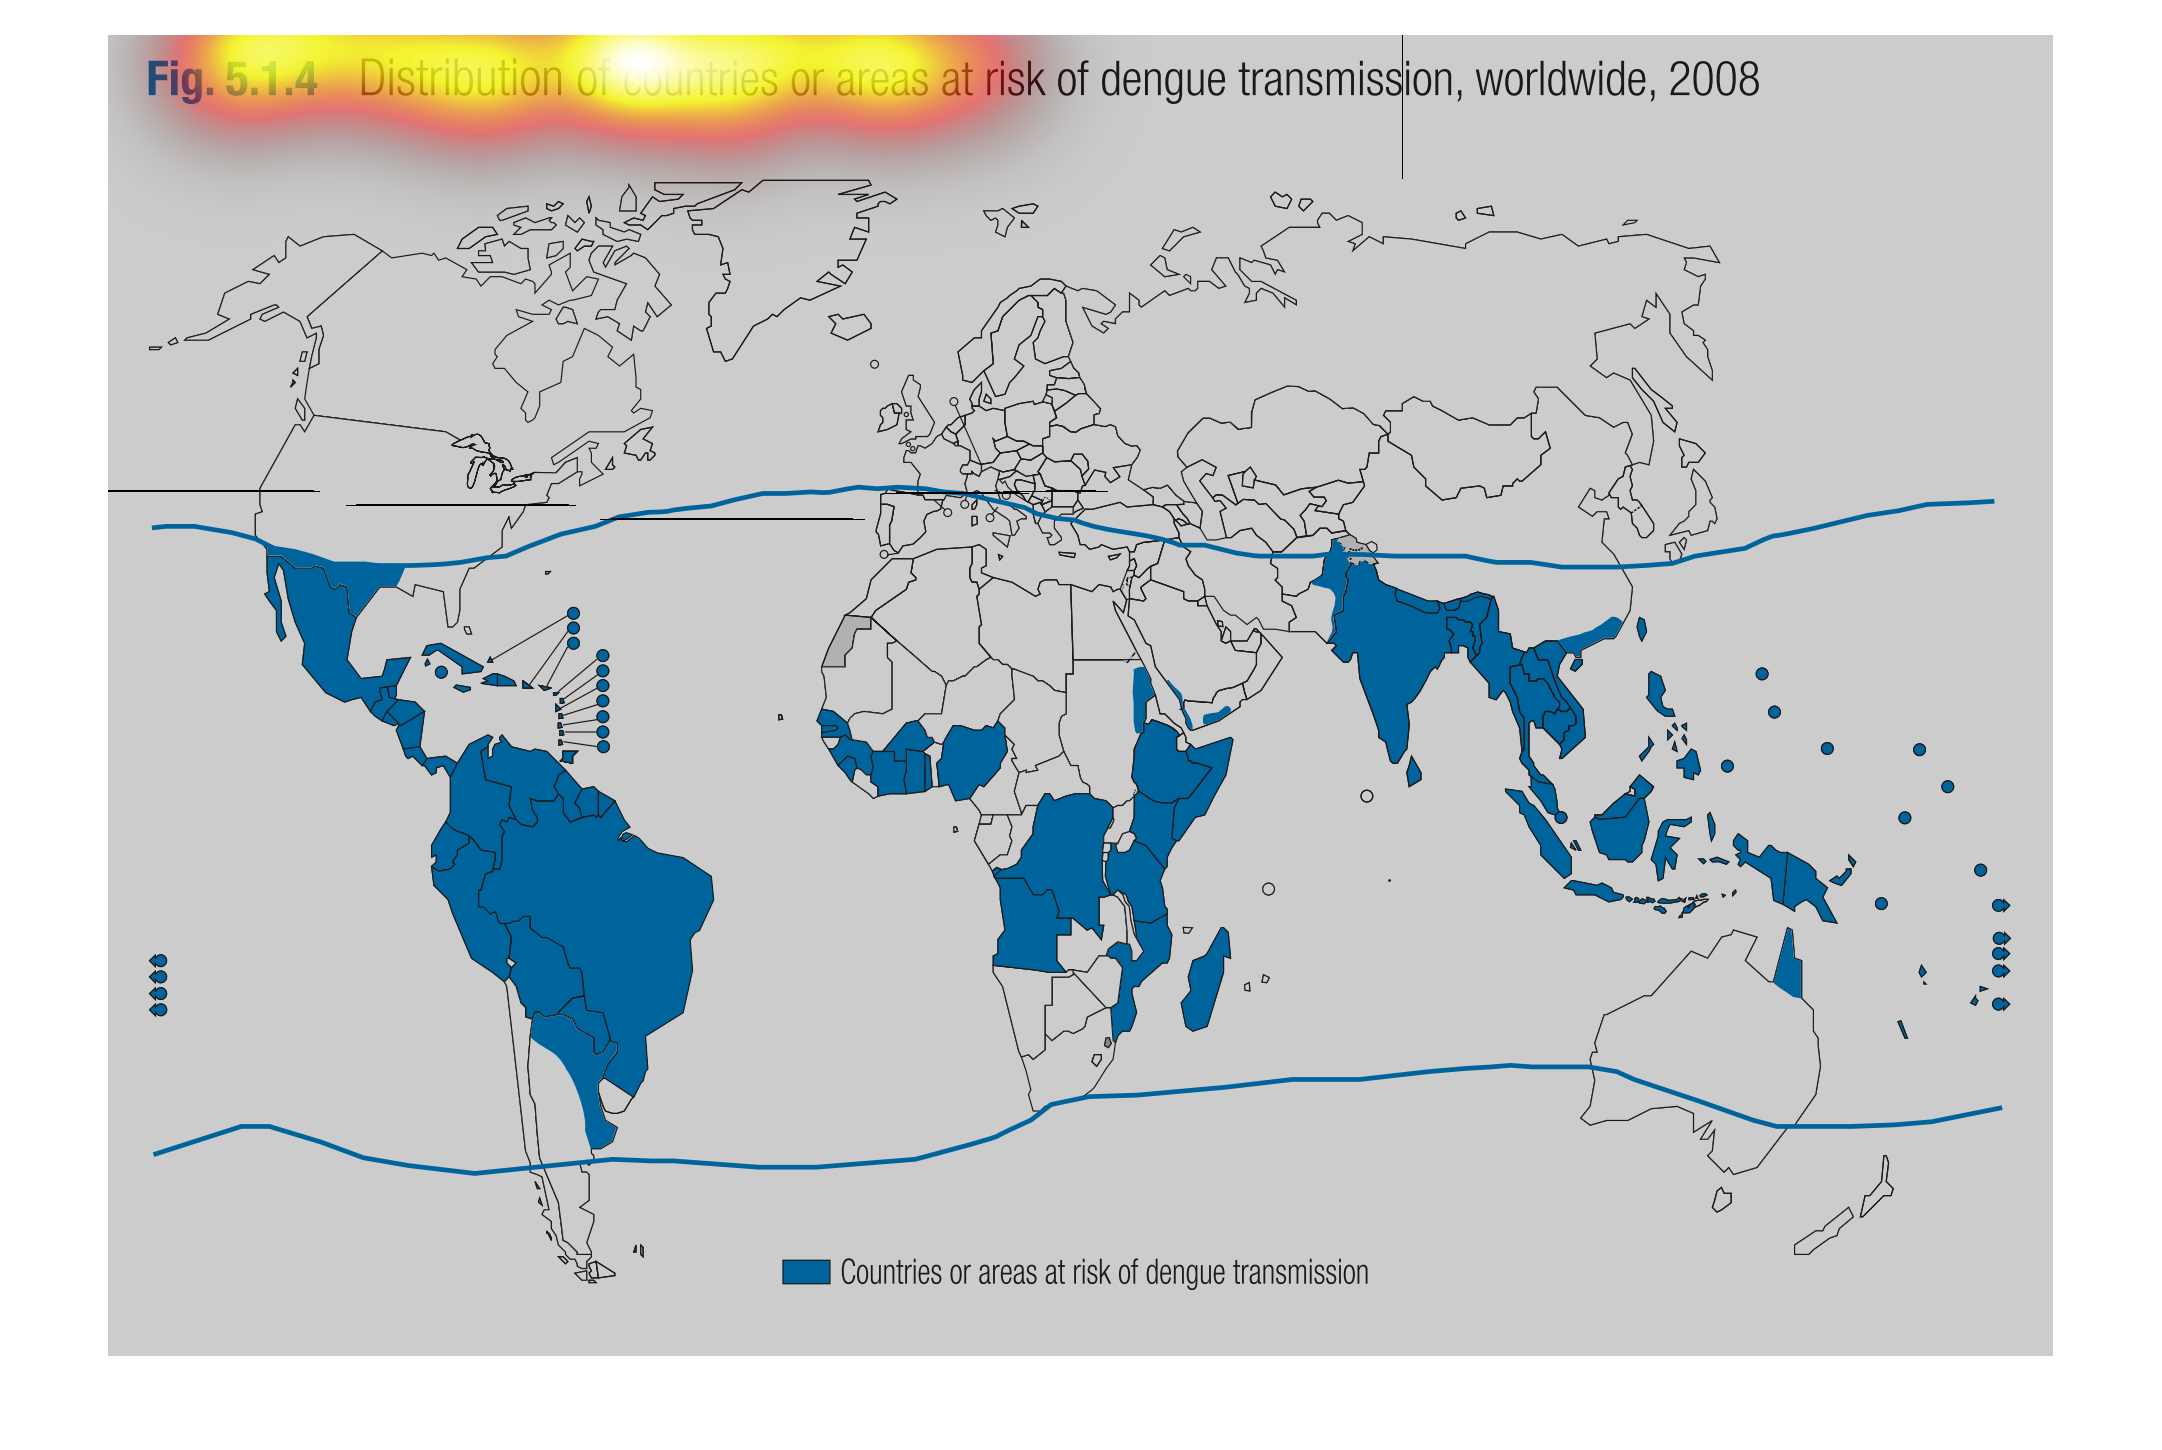
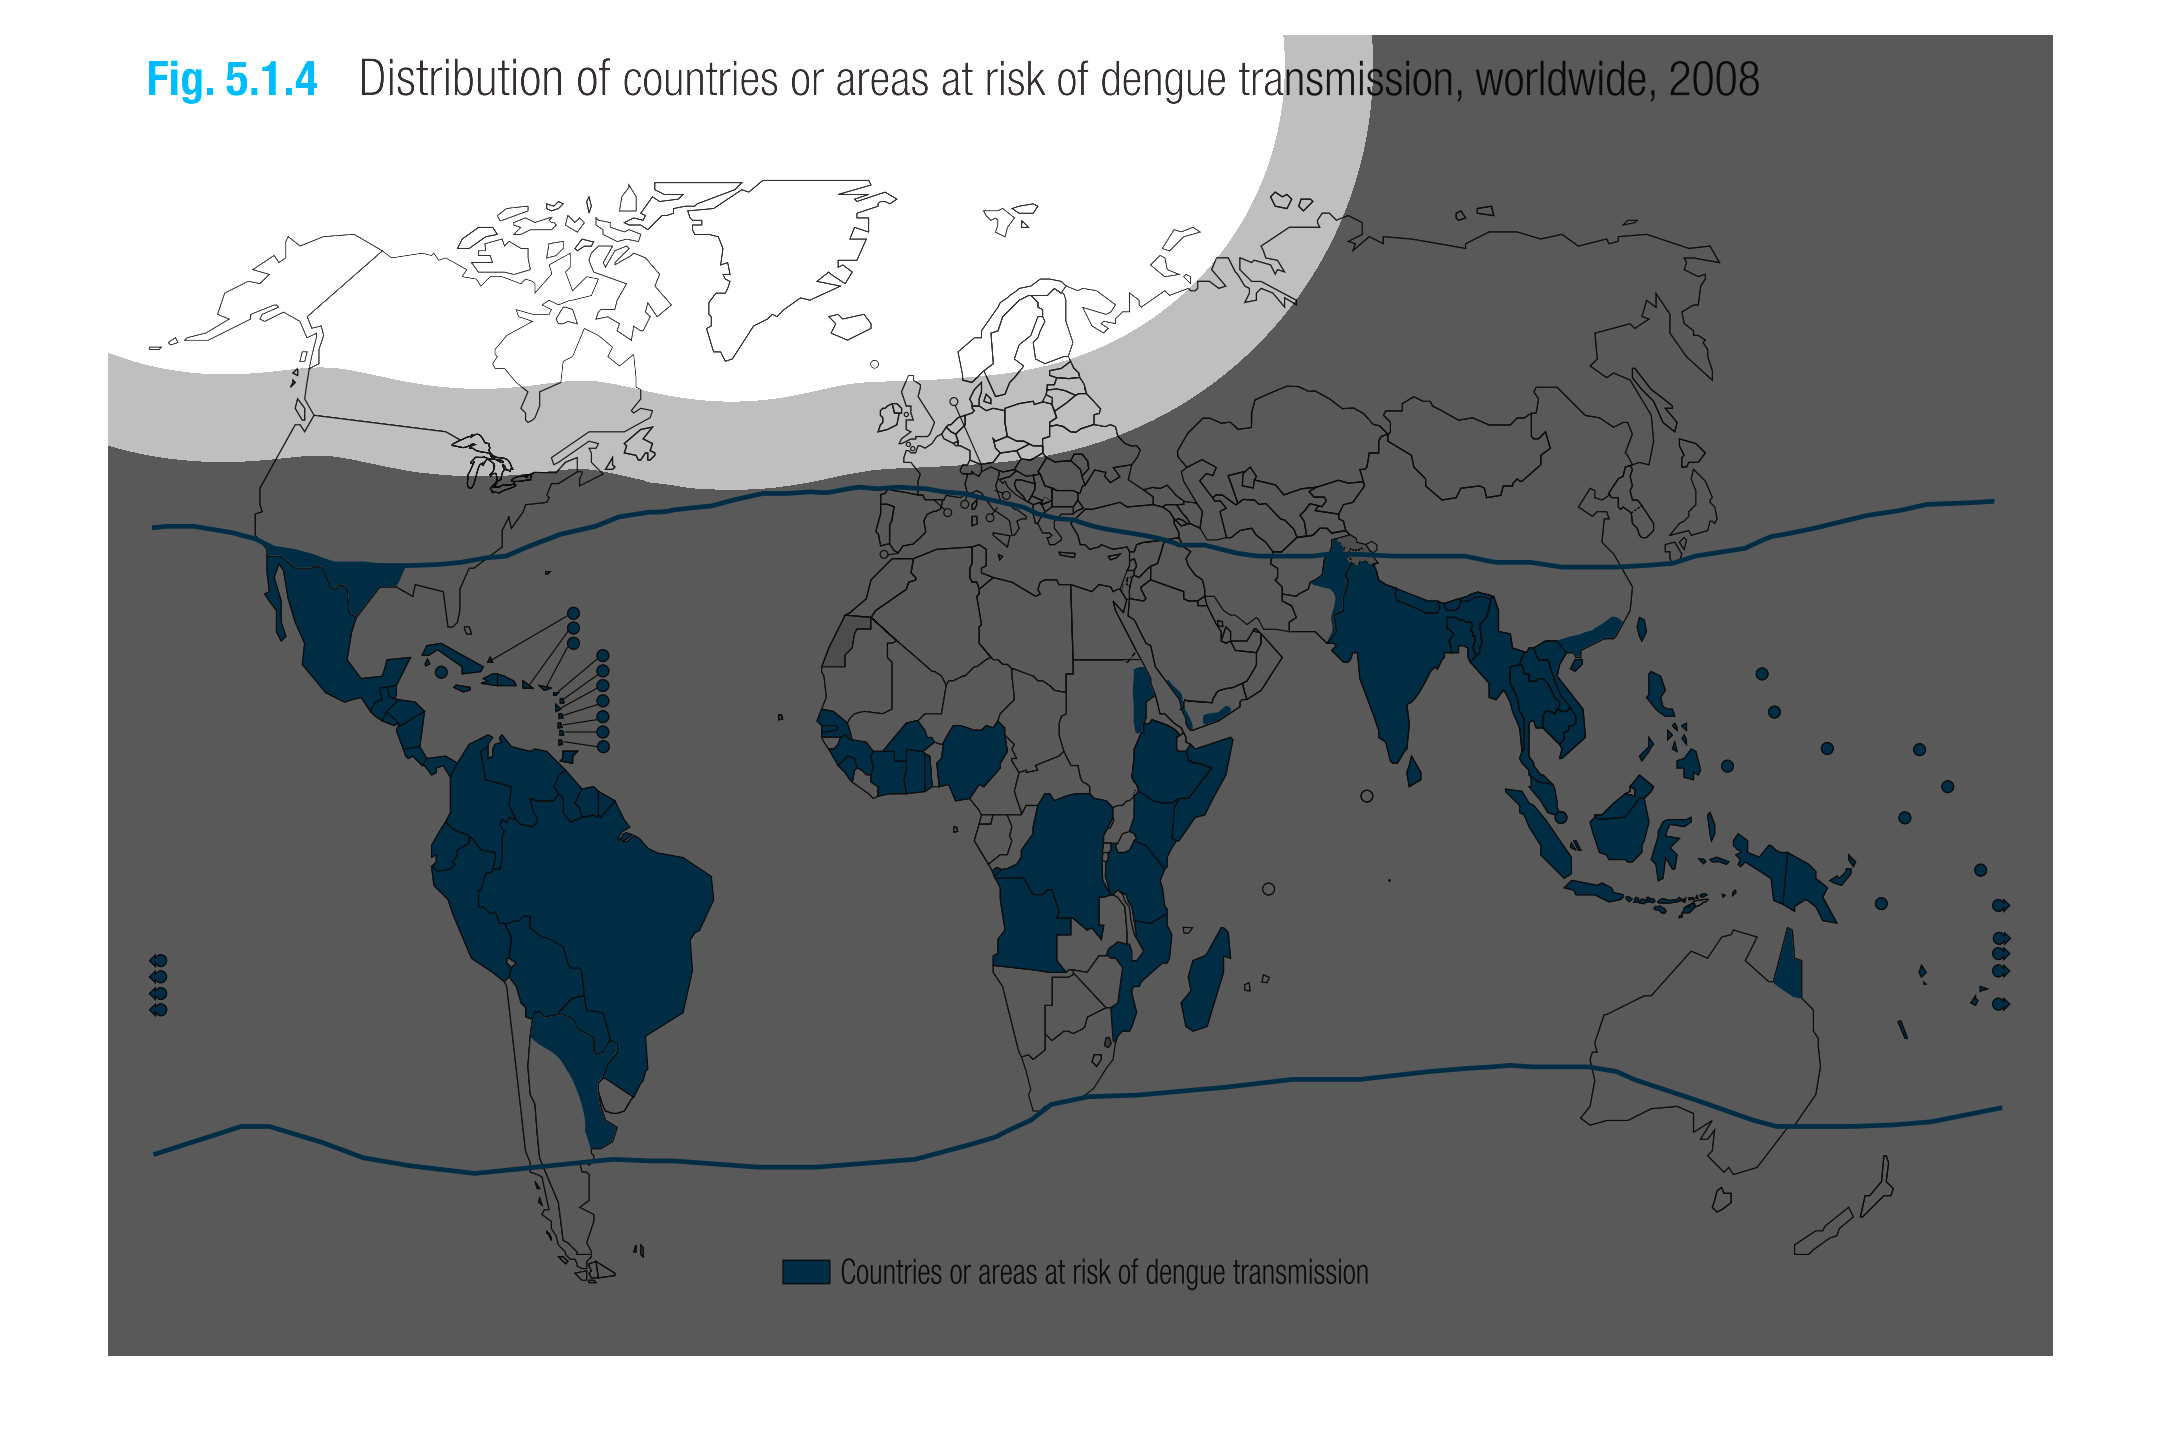
Figure 5.1.4 distribution of countries or areas at risk of dengue transmission, worldwide
2008. These places include india throug southern islands to northern australia, mexico, panam
and south american region, and scattered throughout western, central and eastern africa
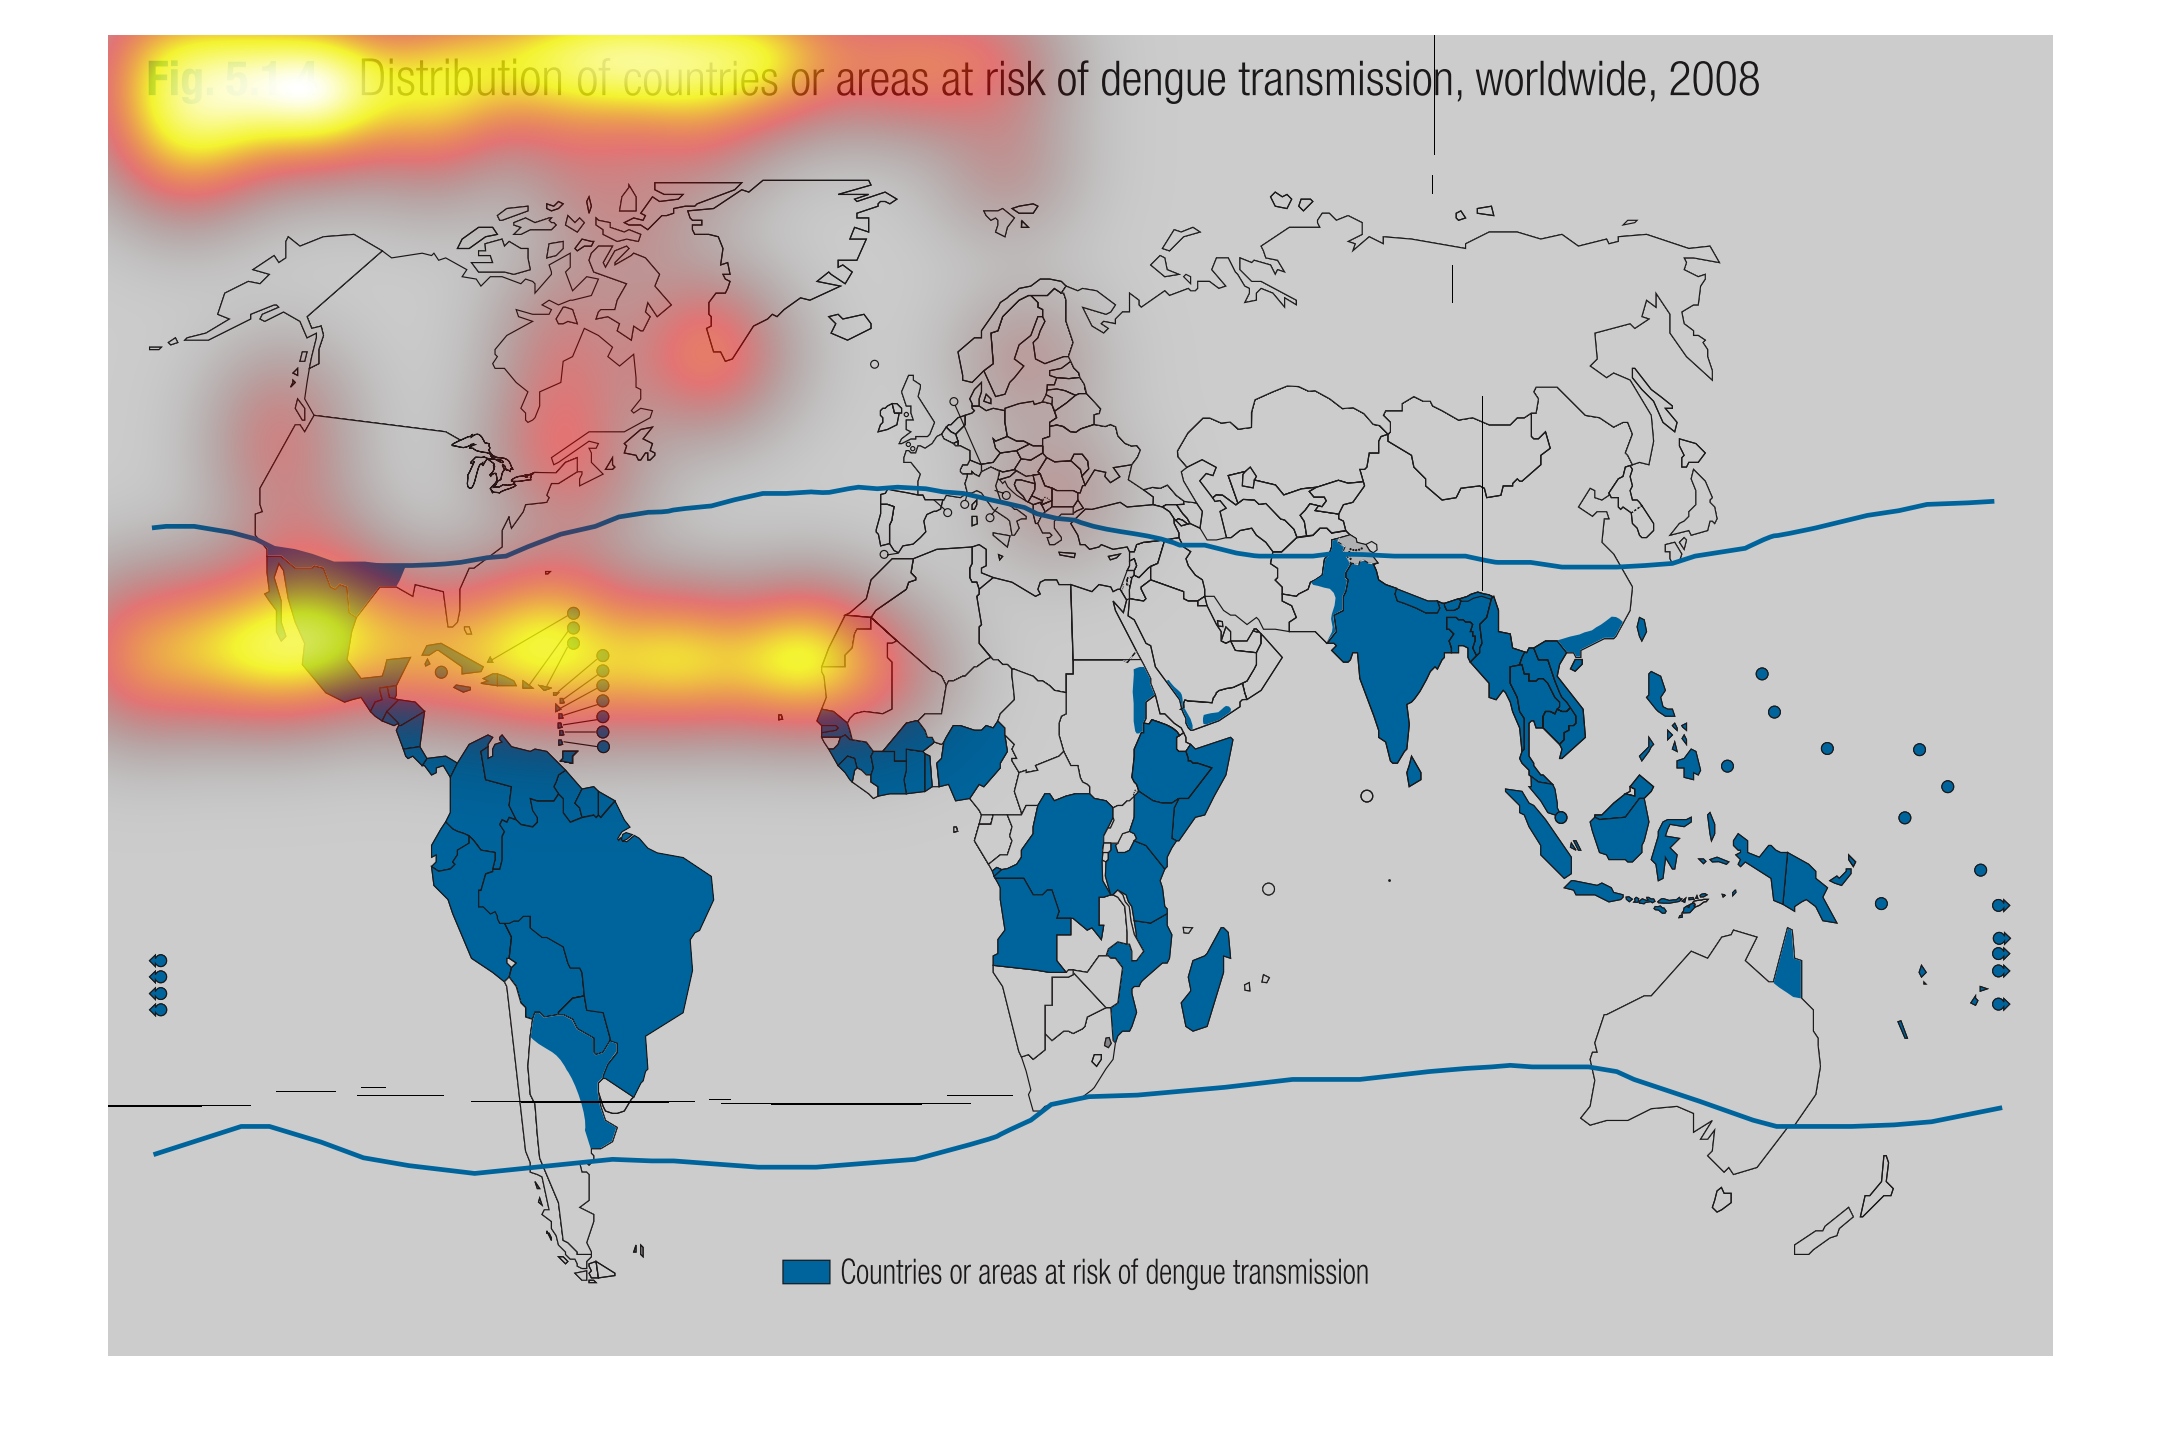
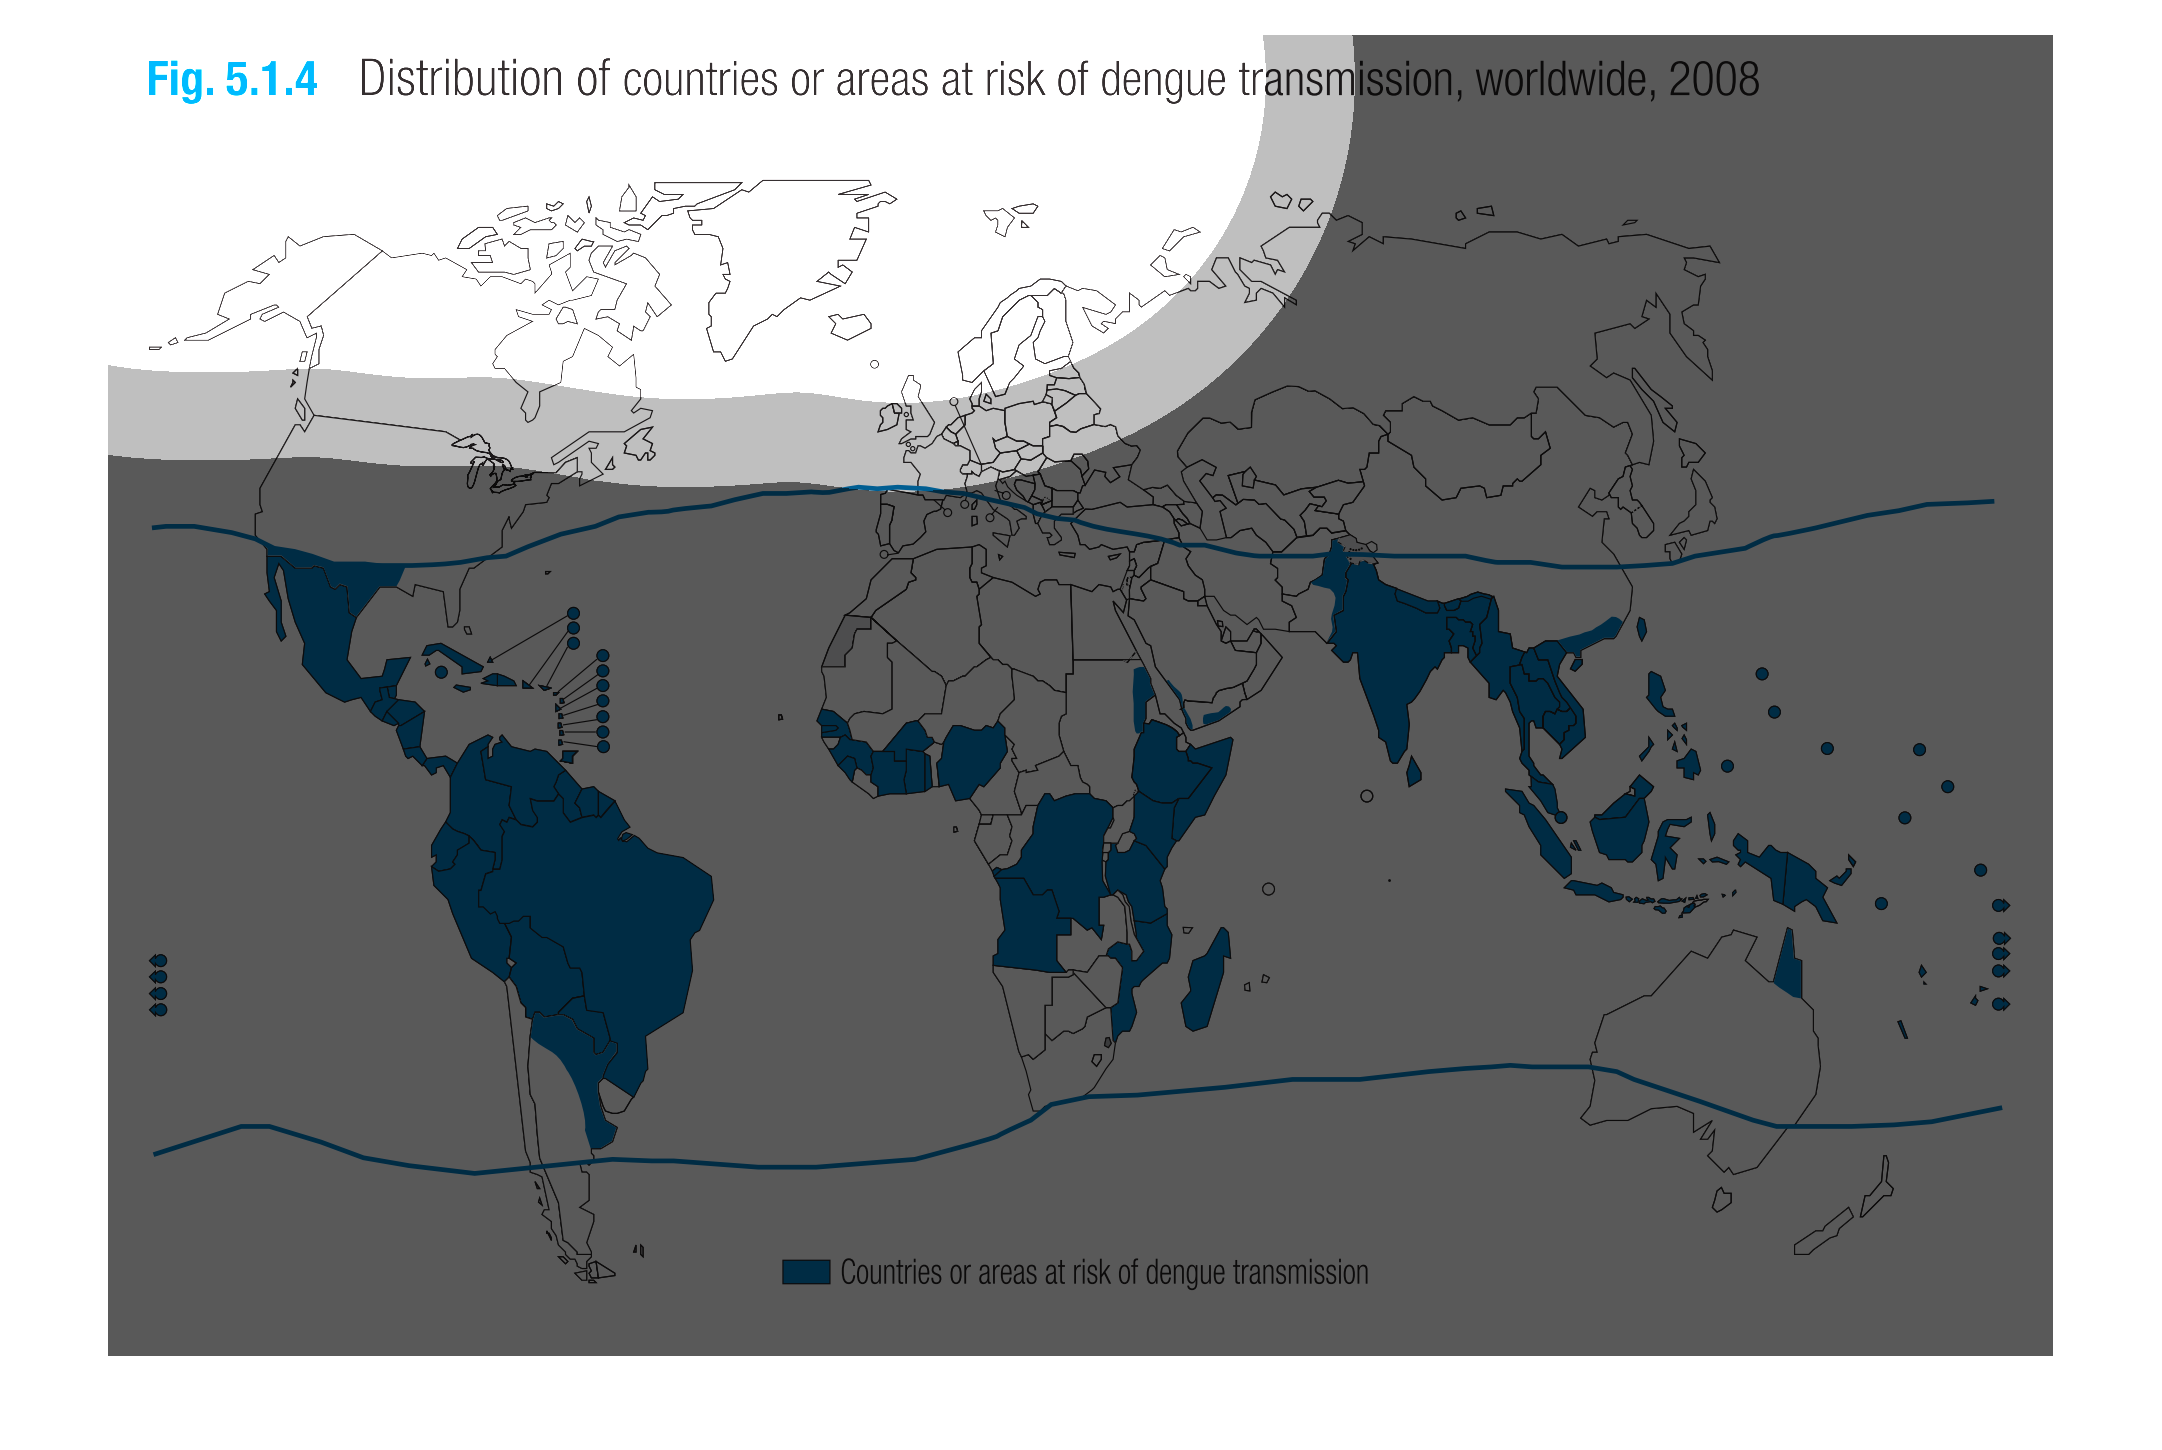
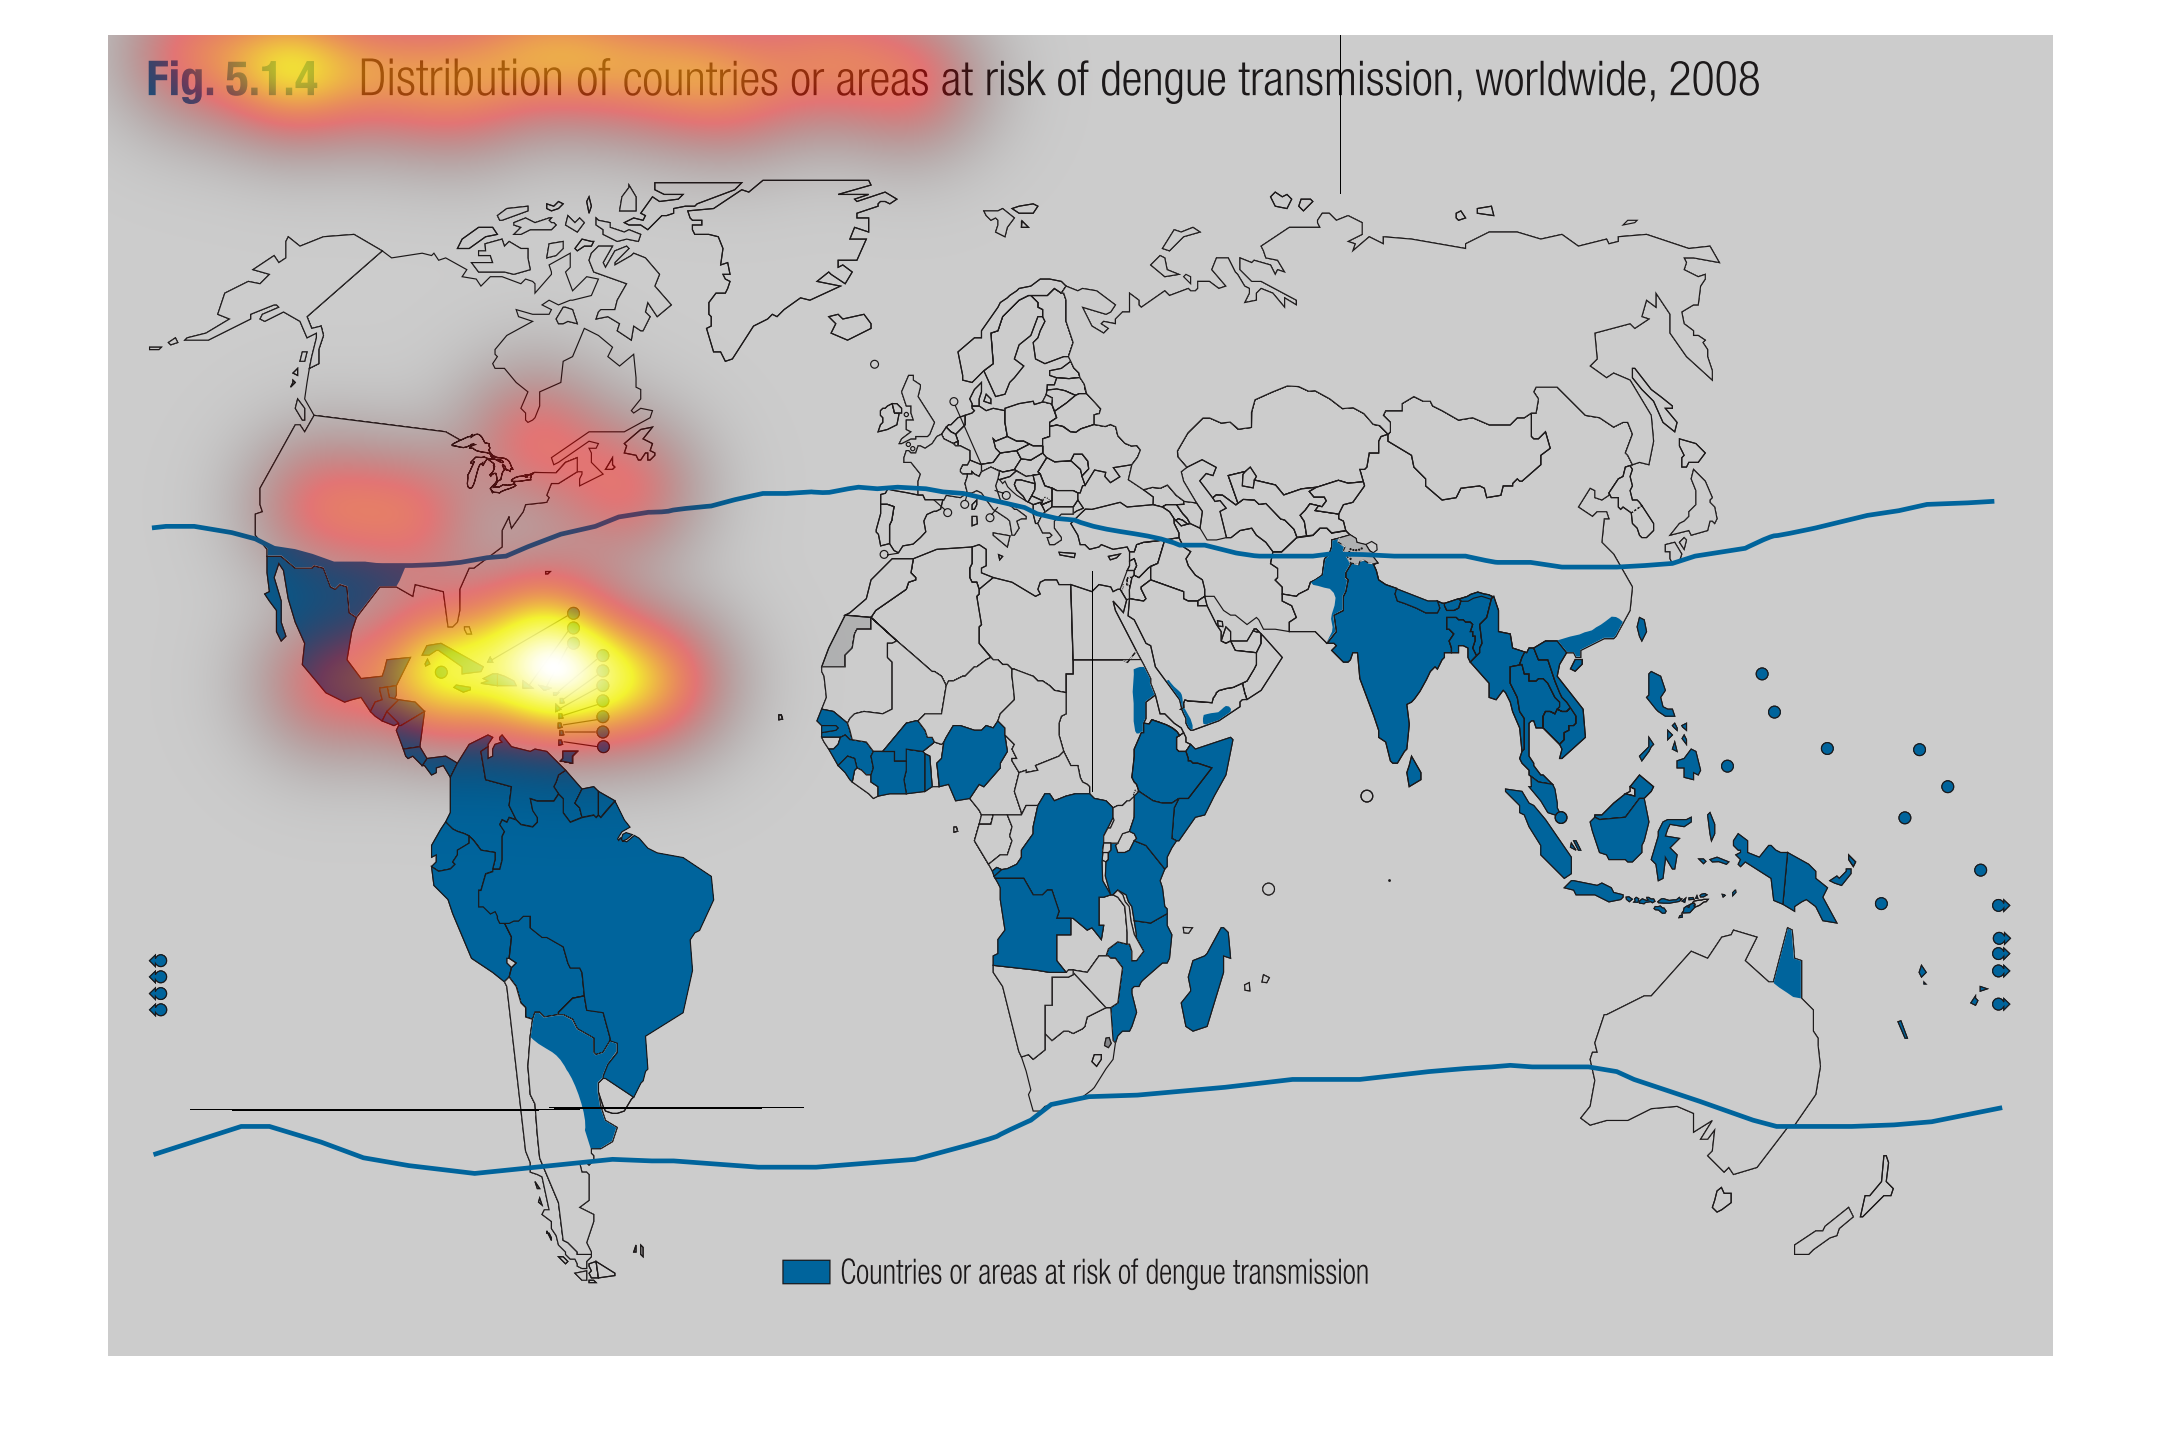
The graph shows the distribution of countries that are at risk of transmission of dengue fever
in the 2008 year. It's a world map and the risk is represented by a line.
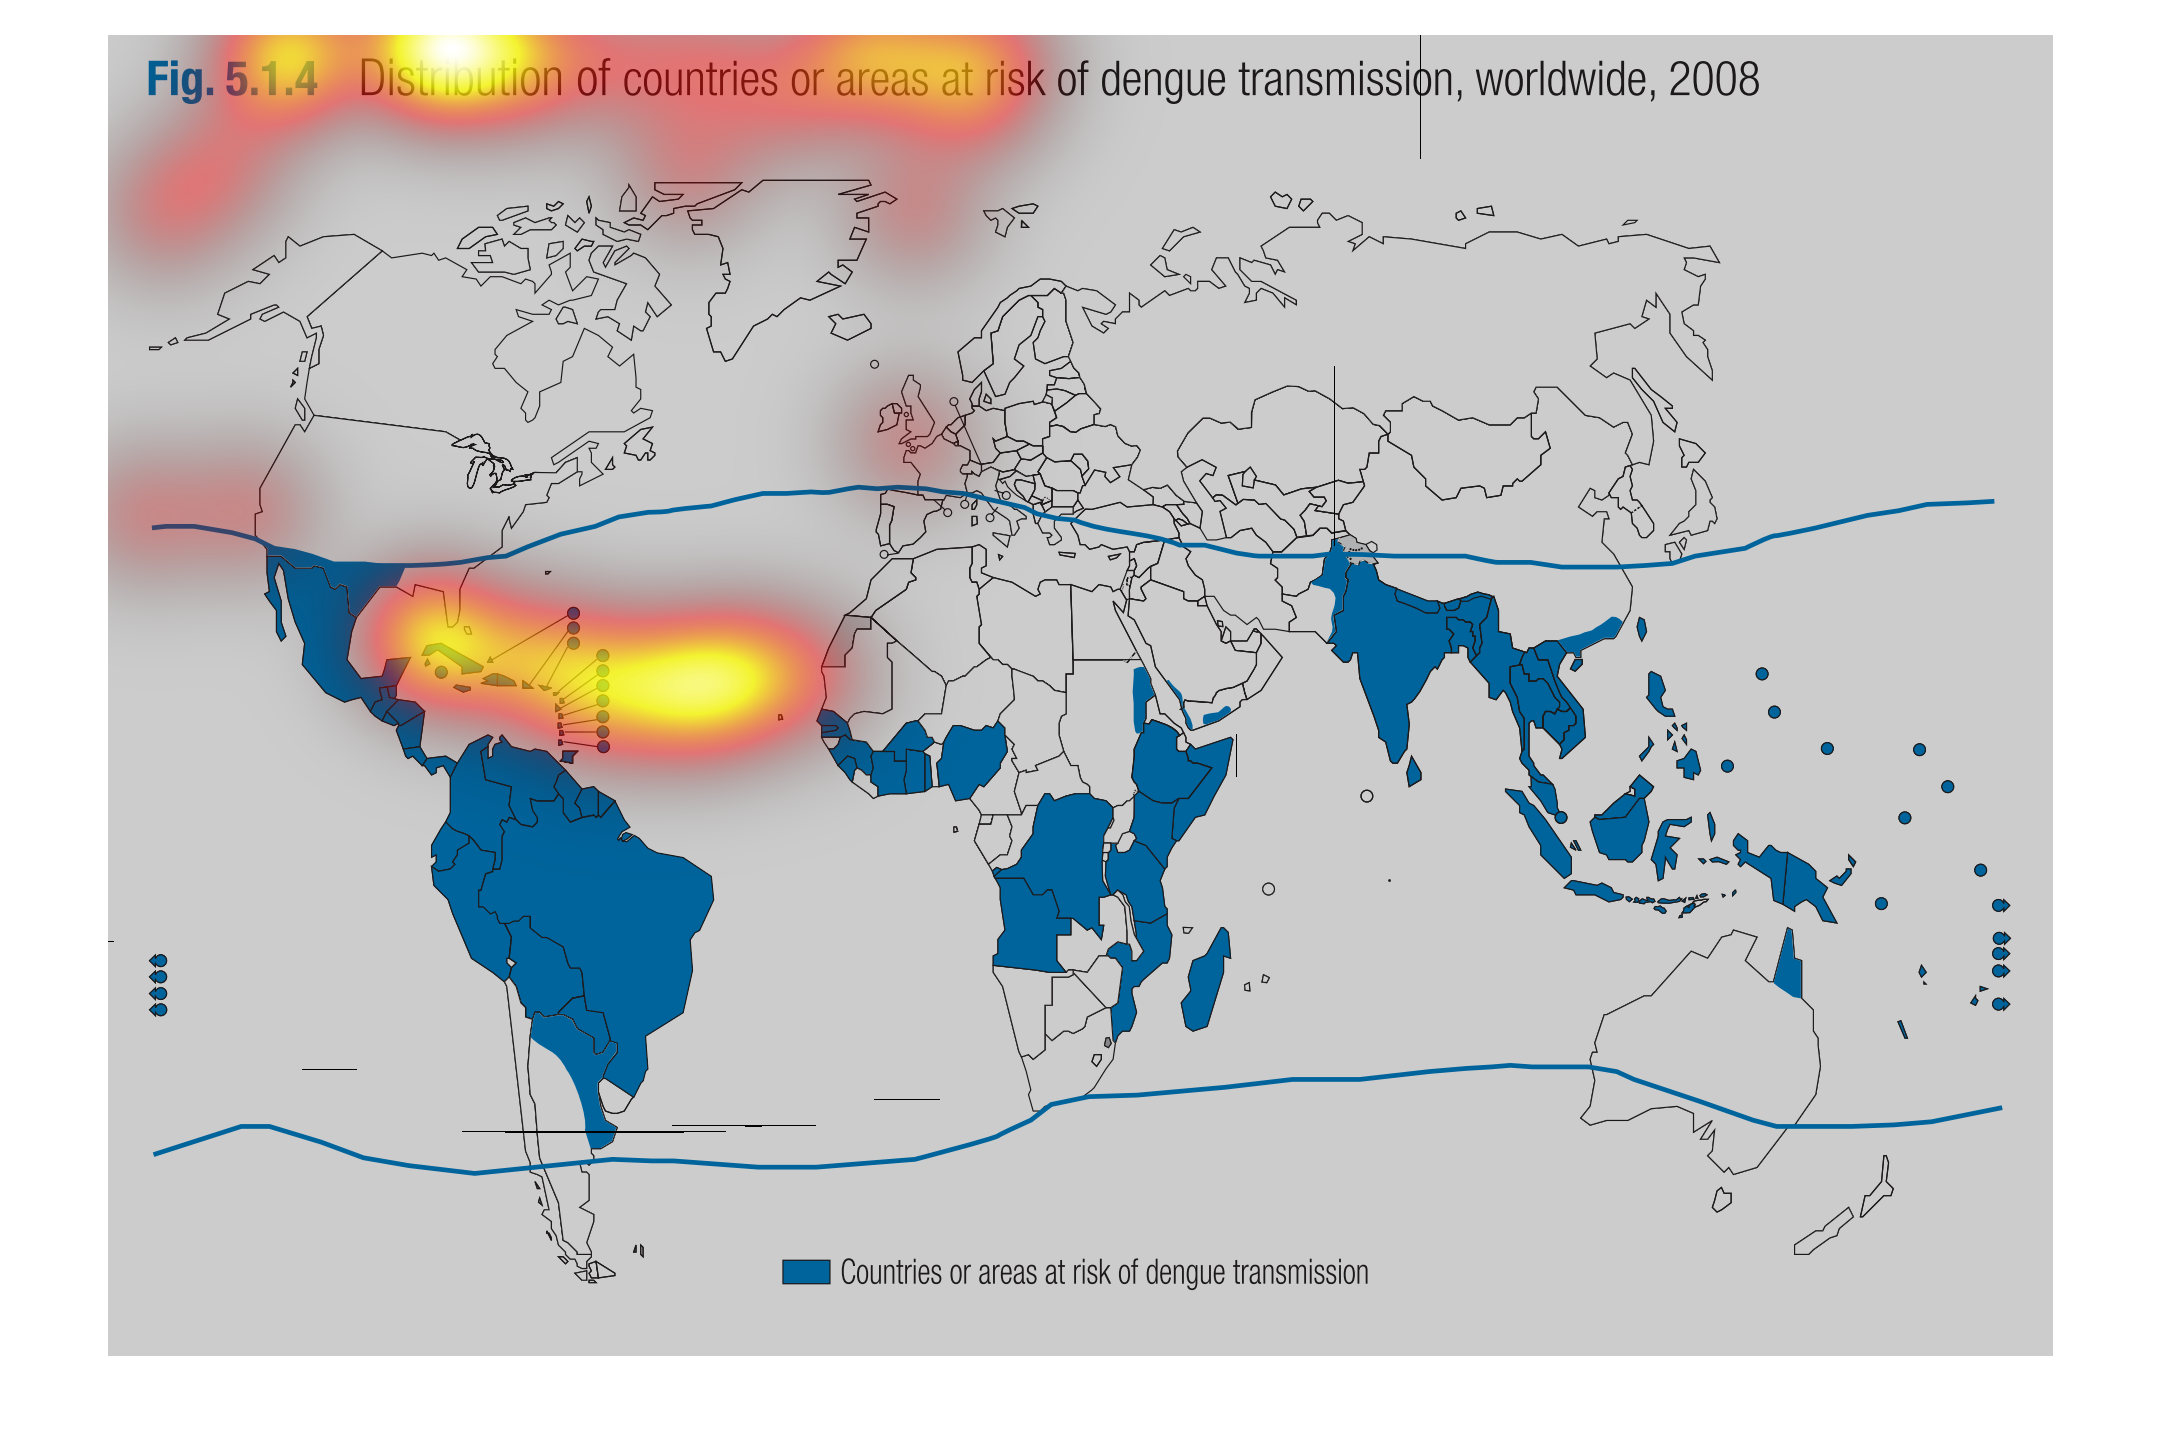
The image on the left hand side is a picture of each continent displaying the countries that
are most at risk for dengue transmission.  From the data collected in a 2008 survey, it shows
that a large part of South American, the middle of Africa and parts of Southern Asia are the
most endanger of capturing this disease.
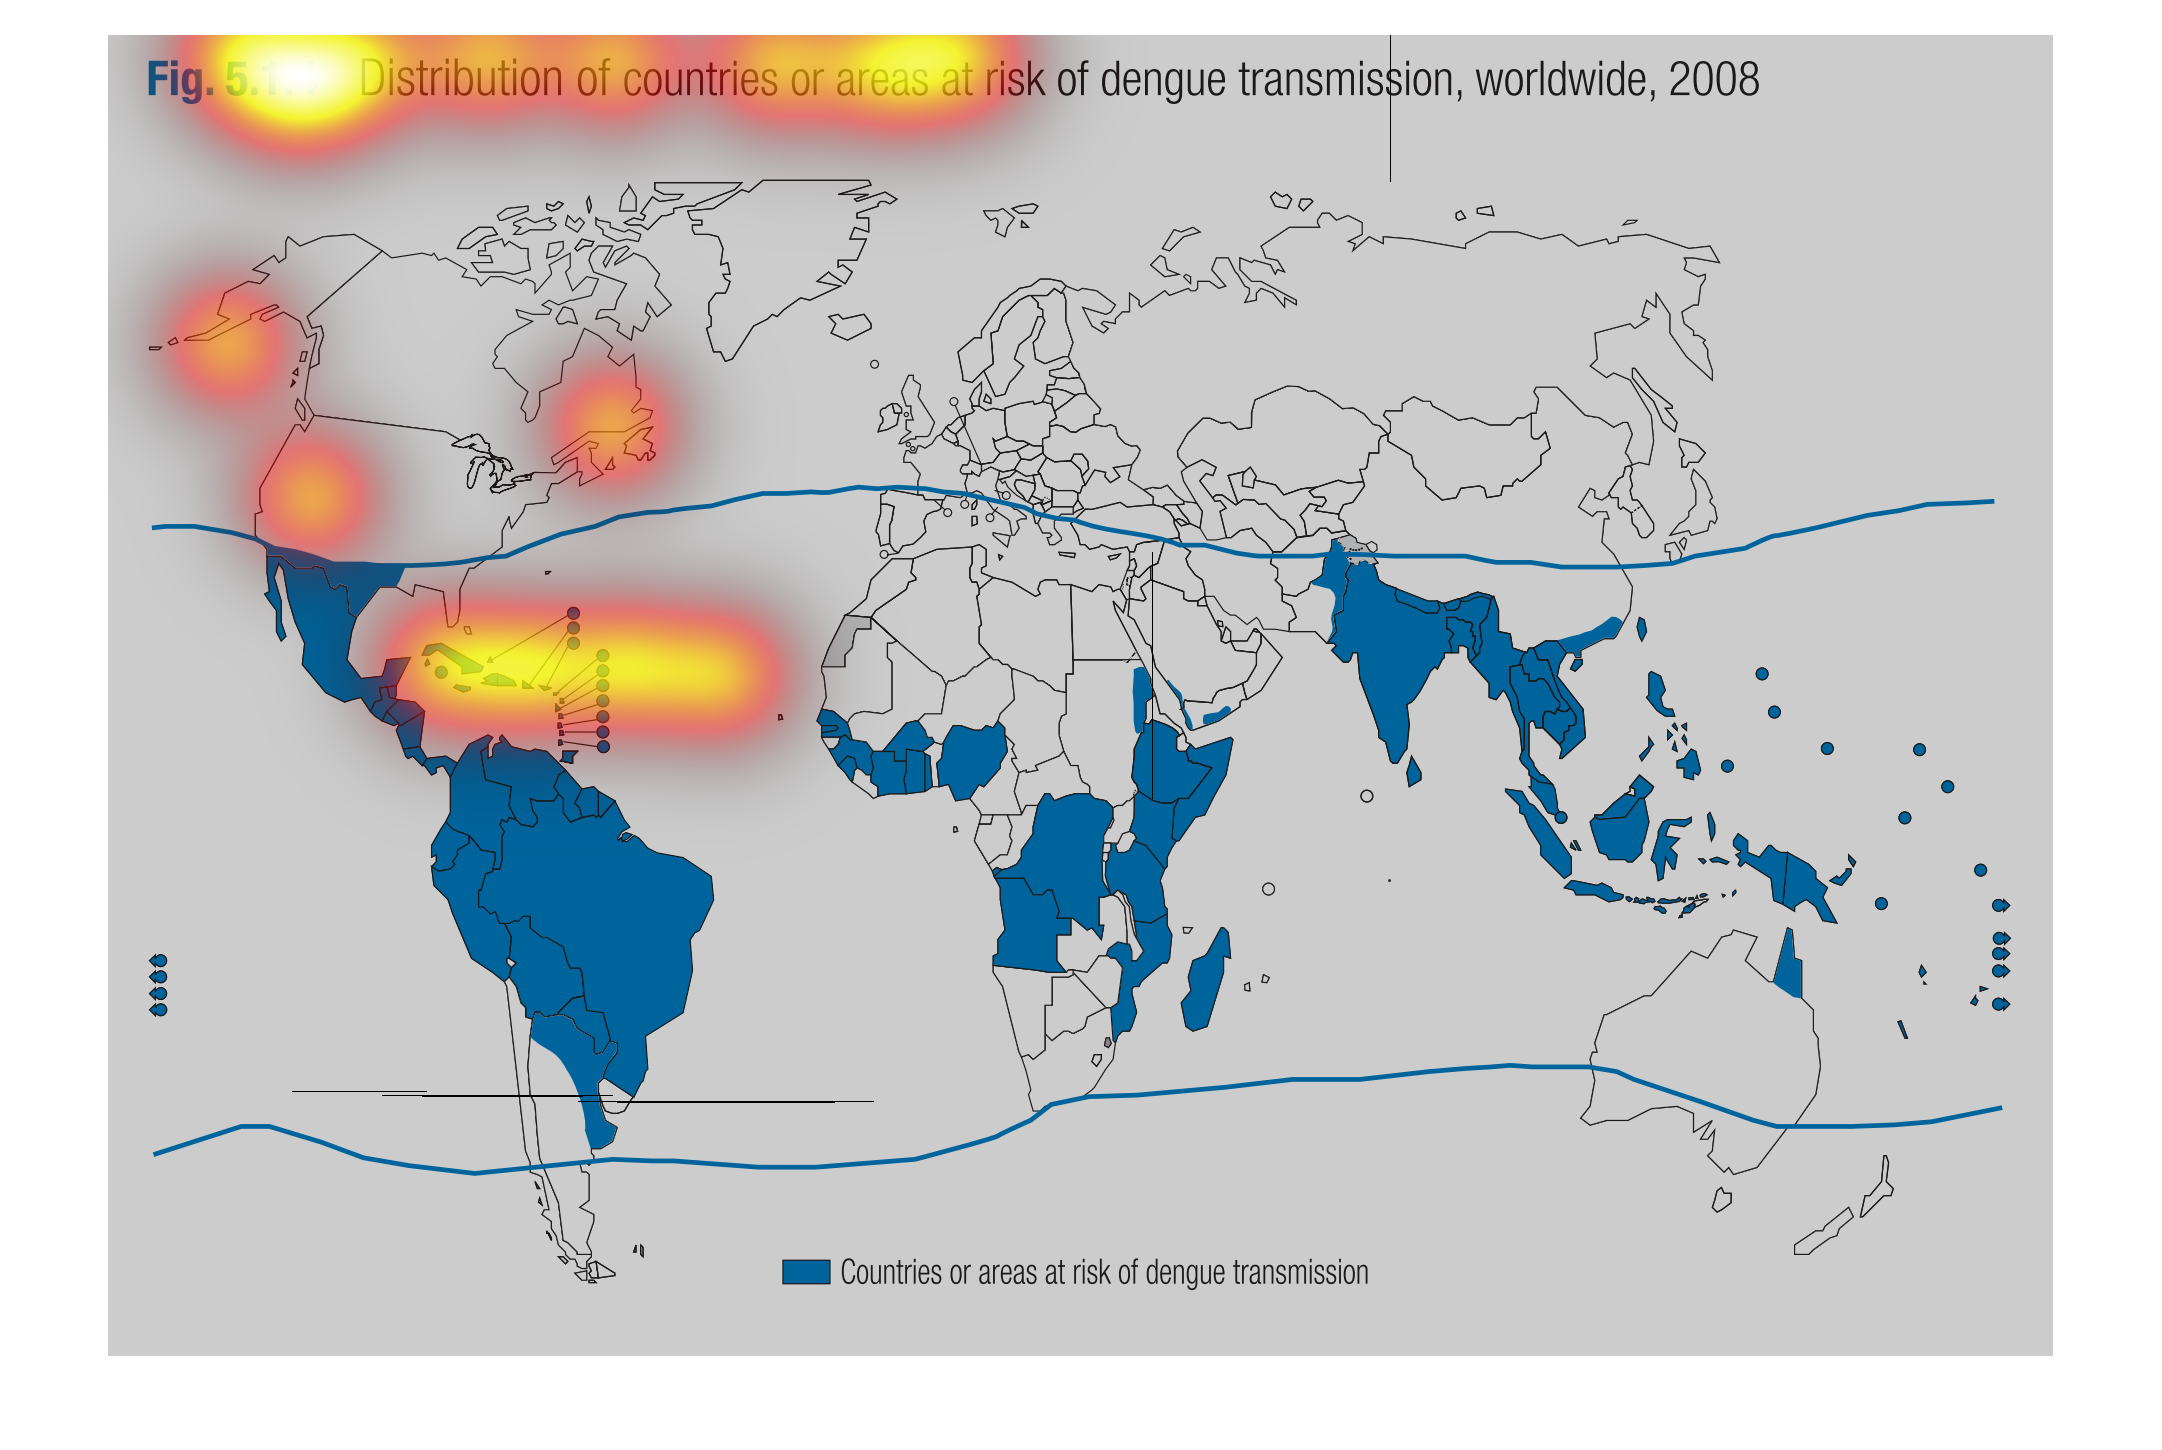
The following chart gives the risk of region or country at risk of transmission of dengue
worldwide in the year 2009. India , Mexico and South American Countries were at the highest
risk along with some countries in Africa.
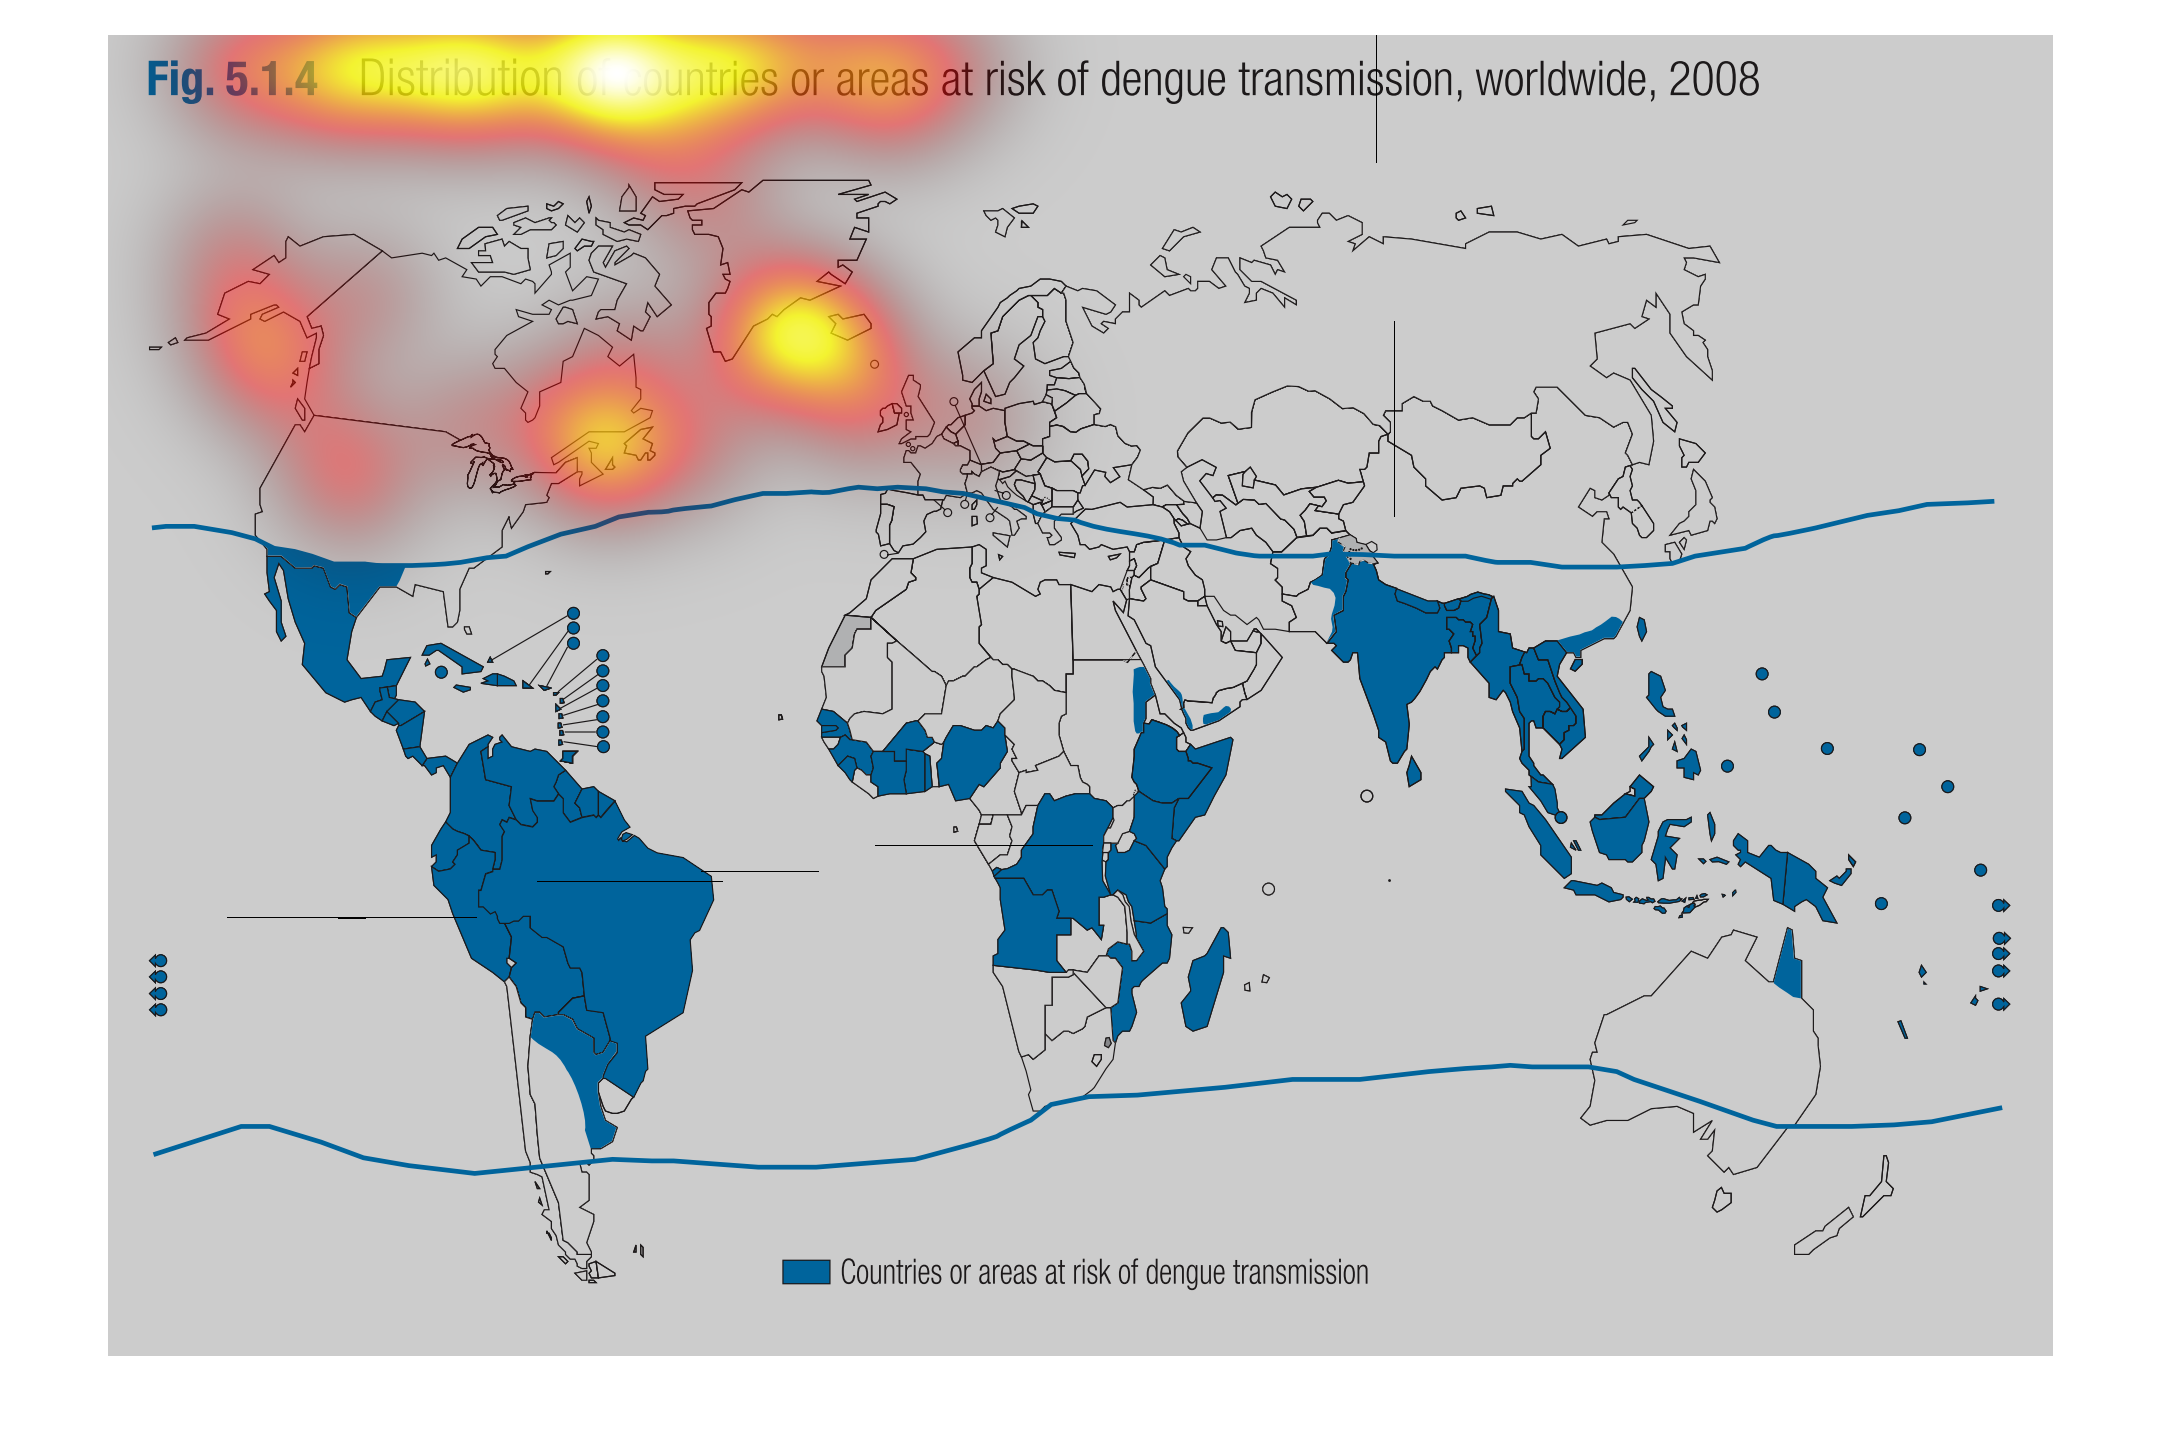
This chart describes distribution of countries or areas at risk of dengue transmission, worldwide,
for the year 2008. Different areas on the chart are represented by the color blue.
This graph illustrates distribution of countries or areas at risk of dengue transmissions
worldwide in 2008.  Countries at risk of dengue are in Africa, Asia, South America, and Central
America.
The image describes the distribution of dengue fever based on risk of infection. The distribution
if further characterized by country distribution. The information is provided for the year
of 2008.