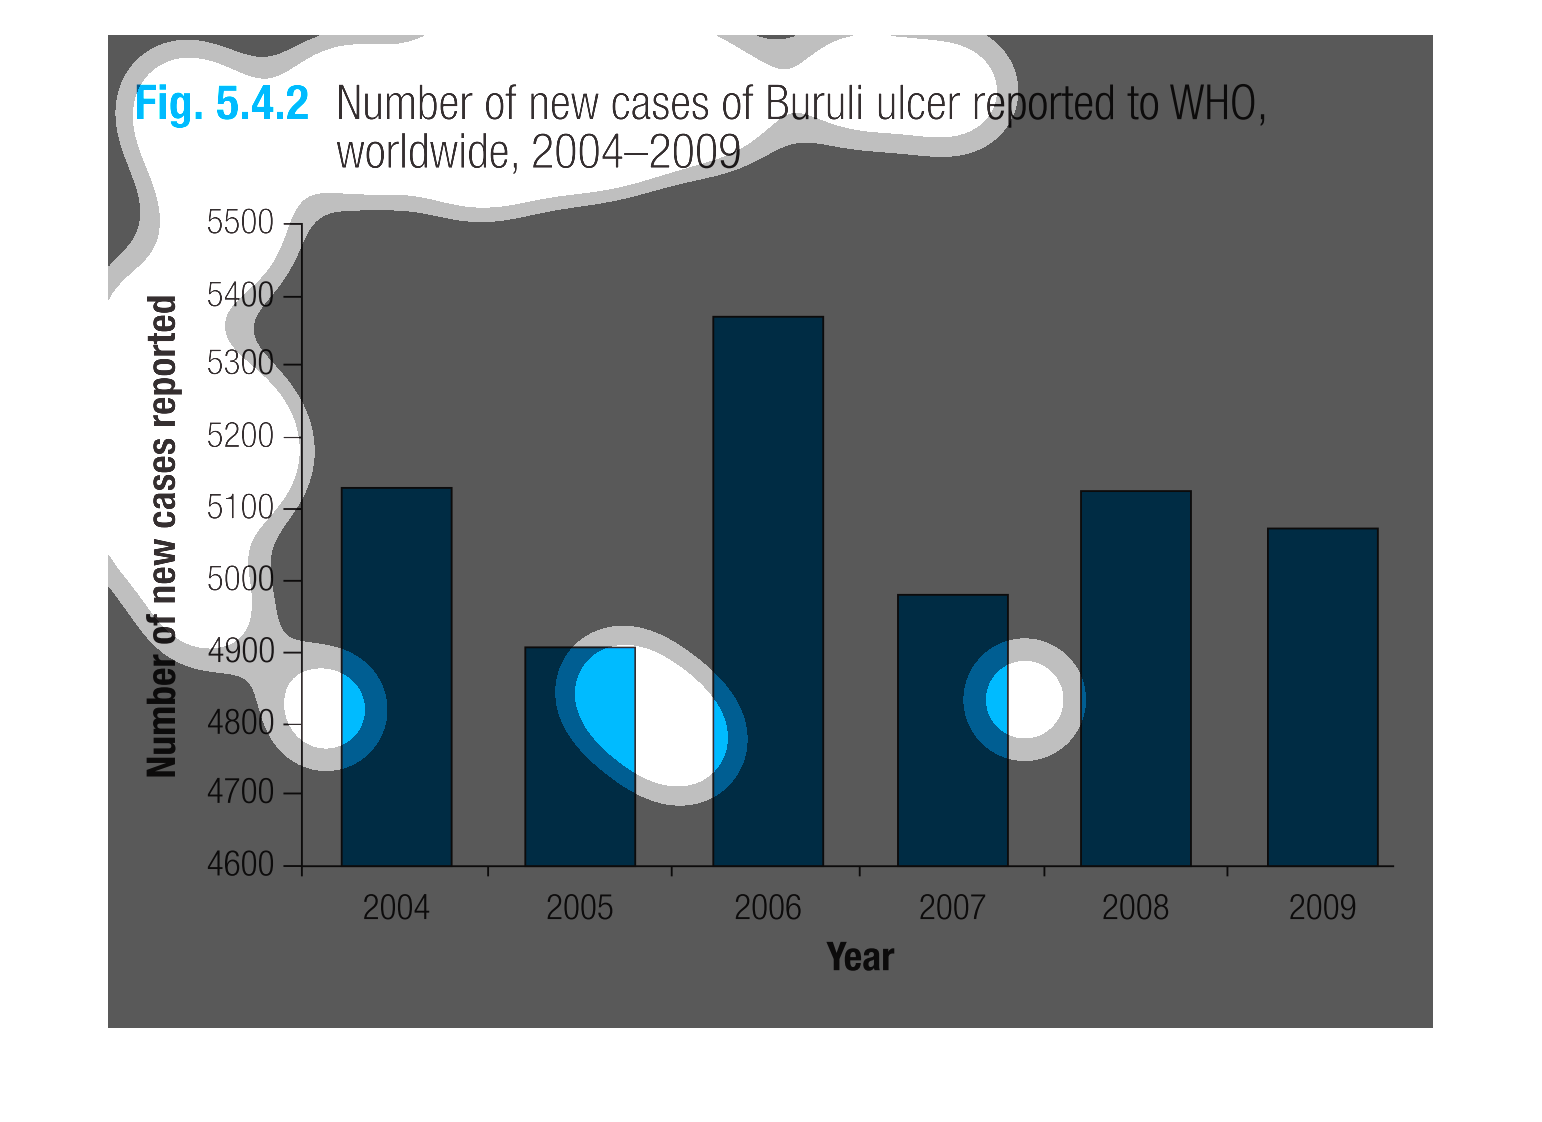
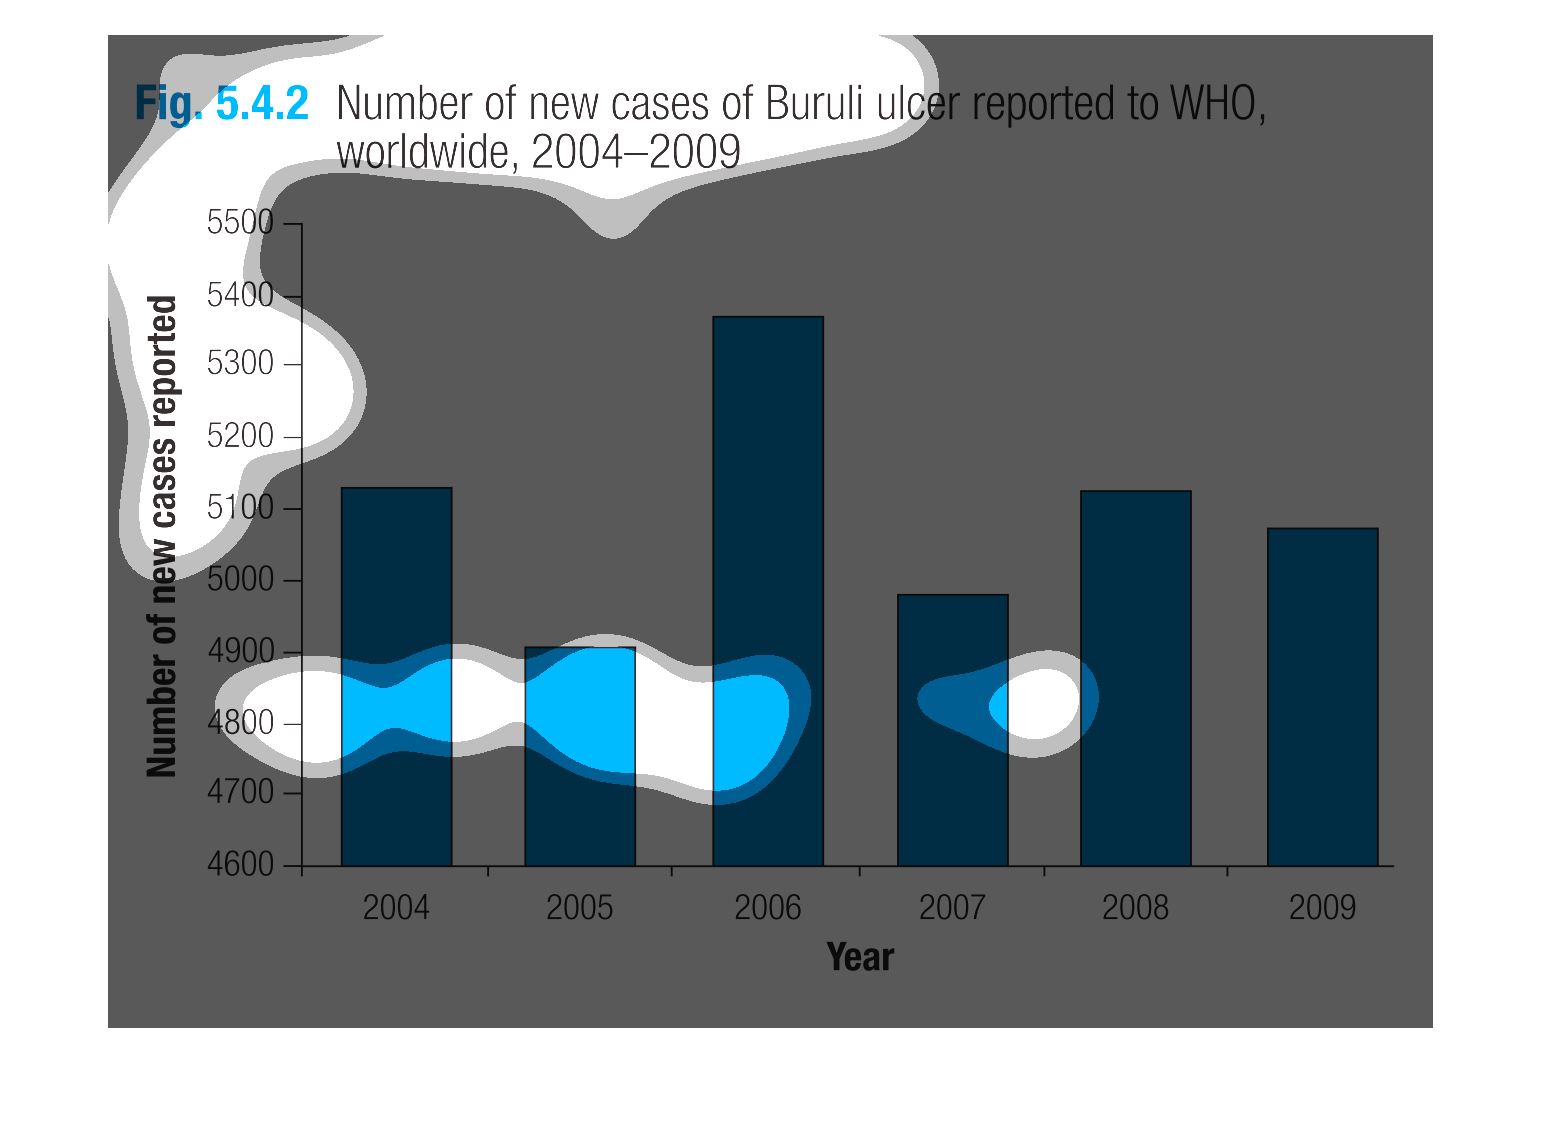
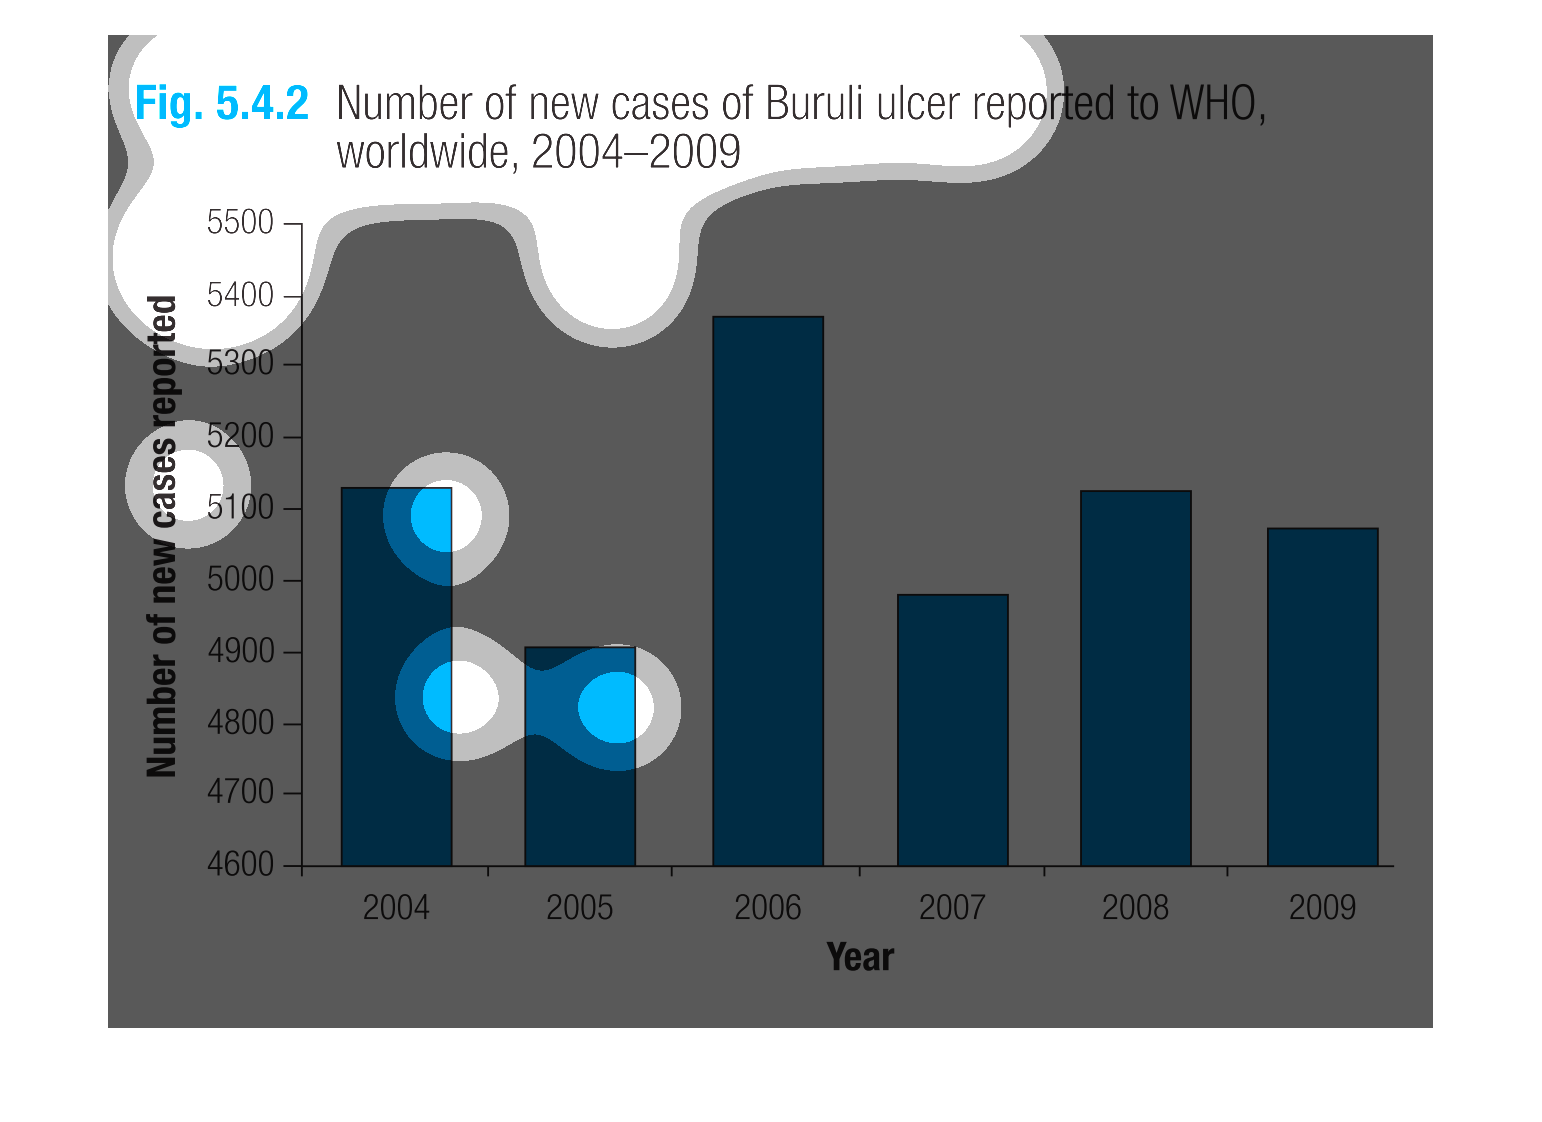
This chart describes the number of new cases of Buruli ulcer reported to WHO, worldwide for
the years 2004 through 2009. With the highest spike occurring in 2006.
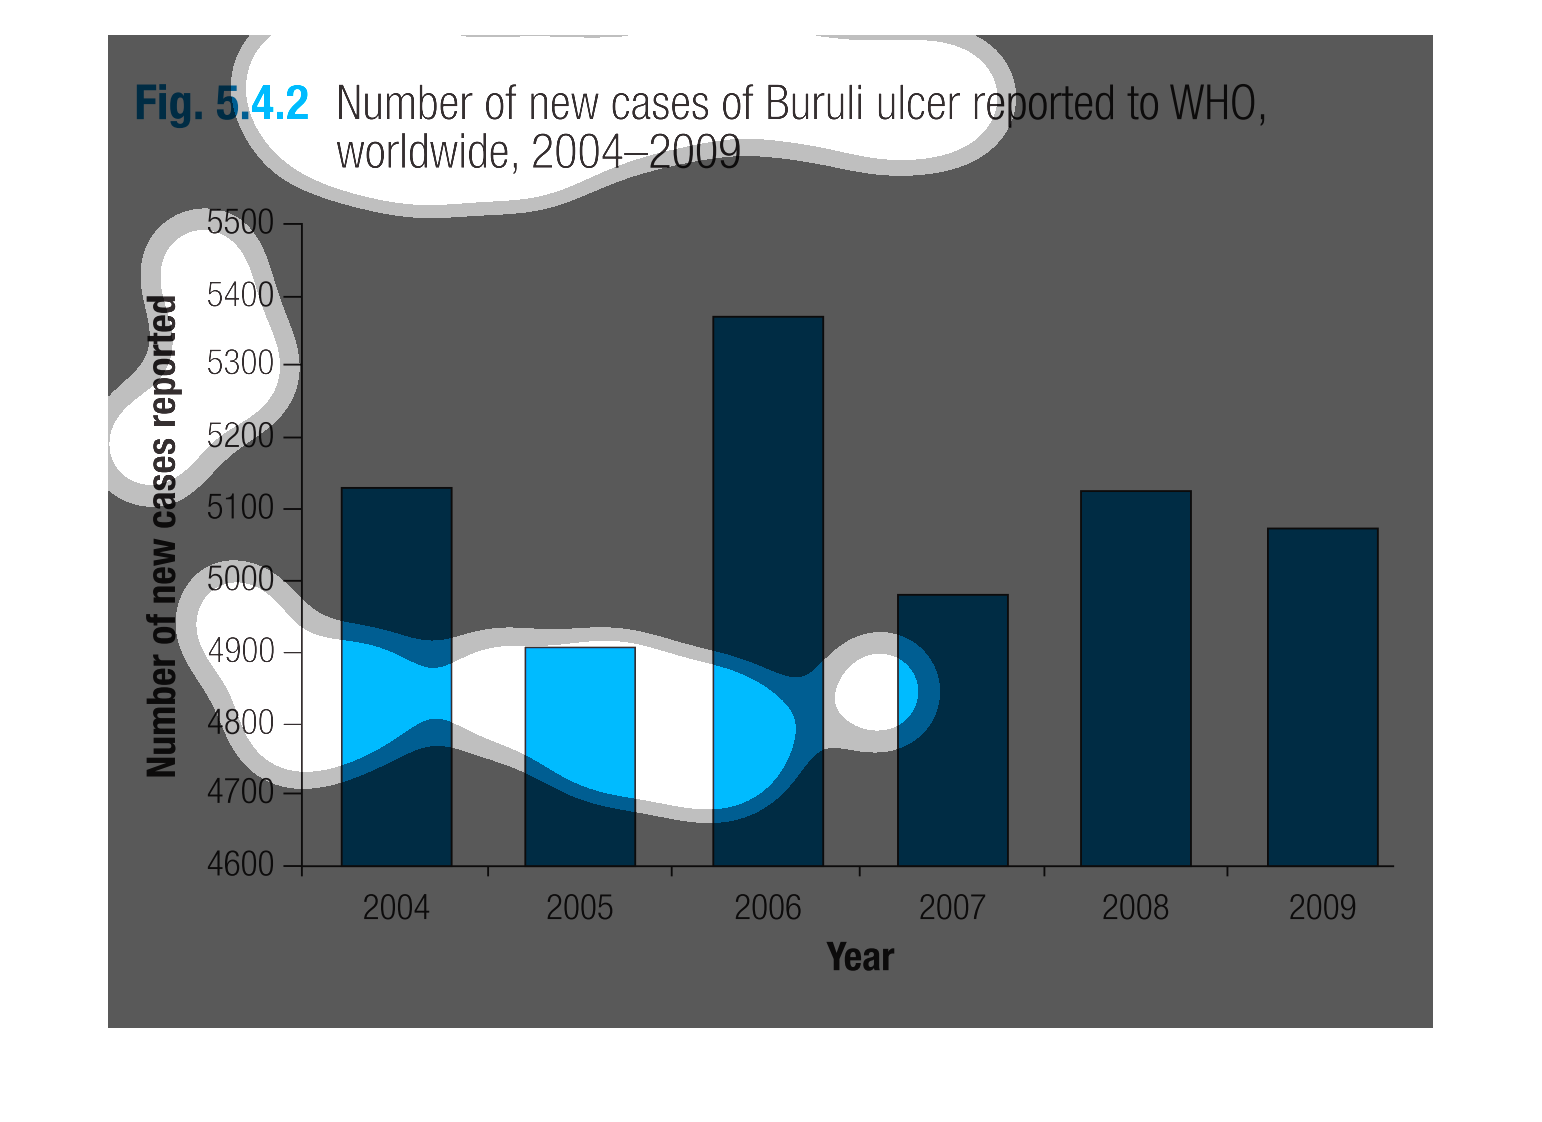
This diagram shows the number of new Buruli Ulcer reported to WHO during the years of 2004-2009.
During the year 2006 the number of cases reported was at its highest.
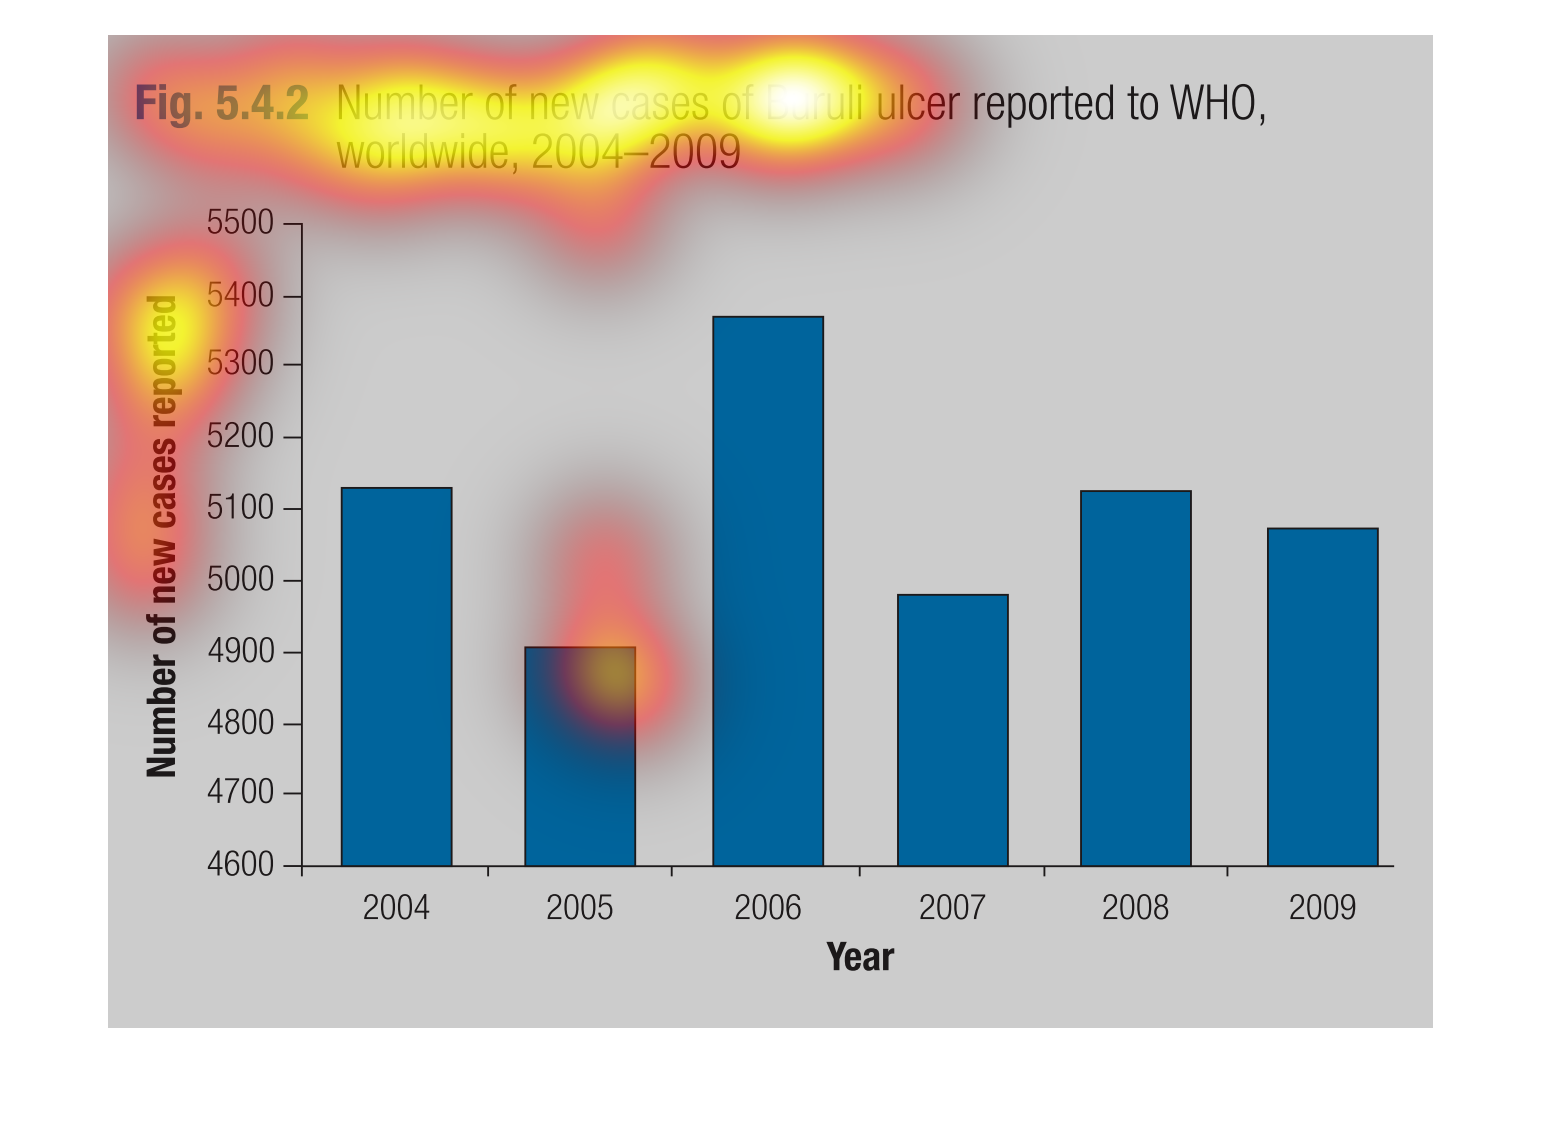
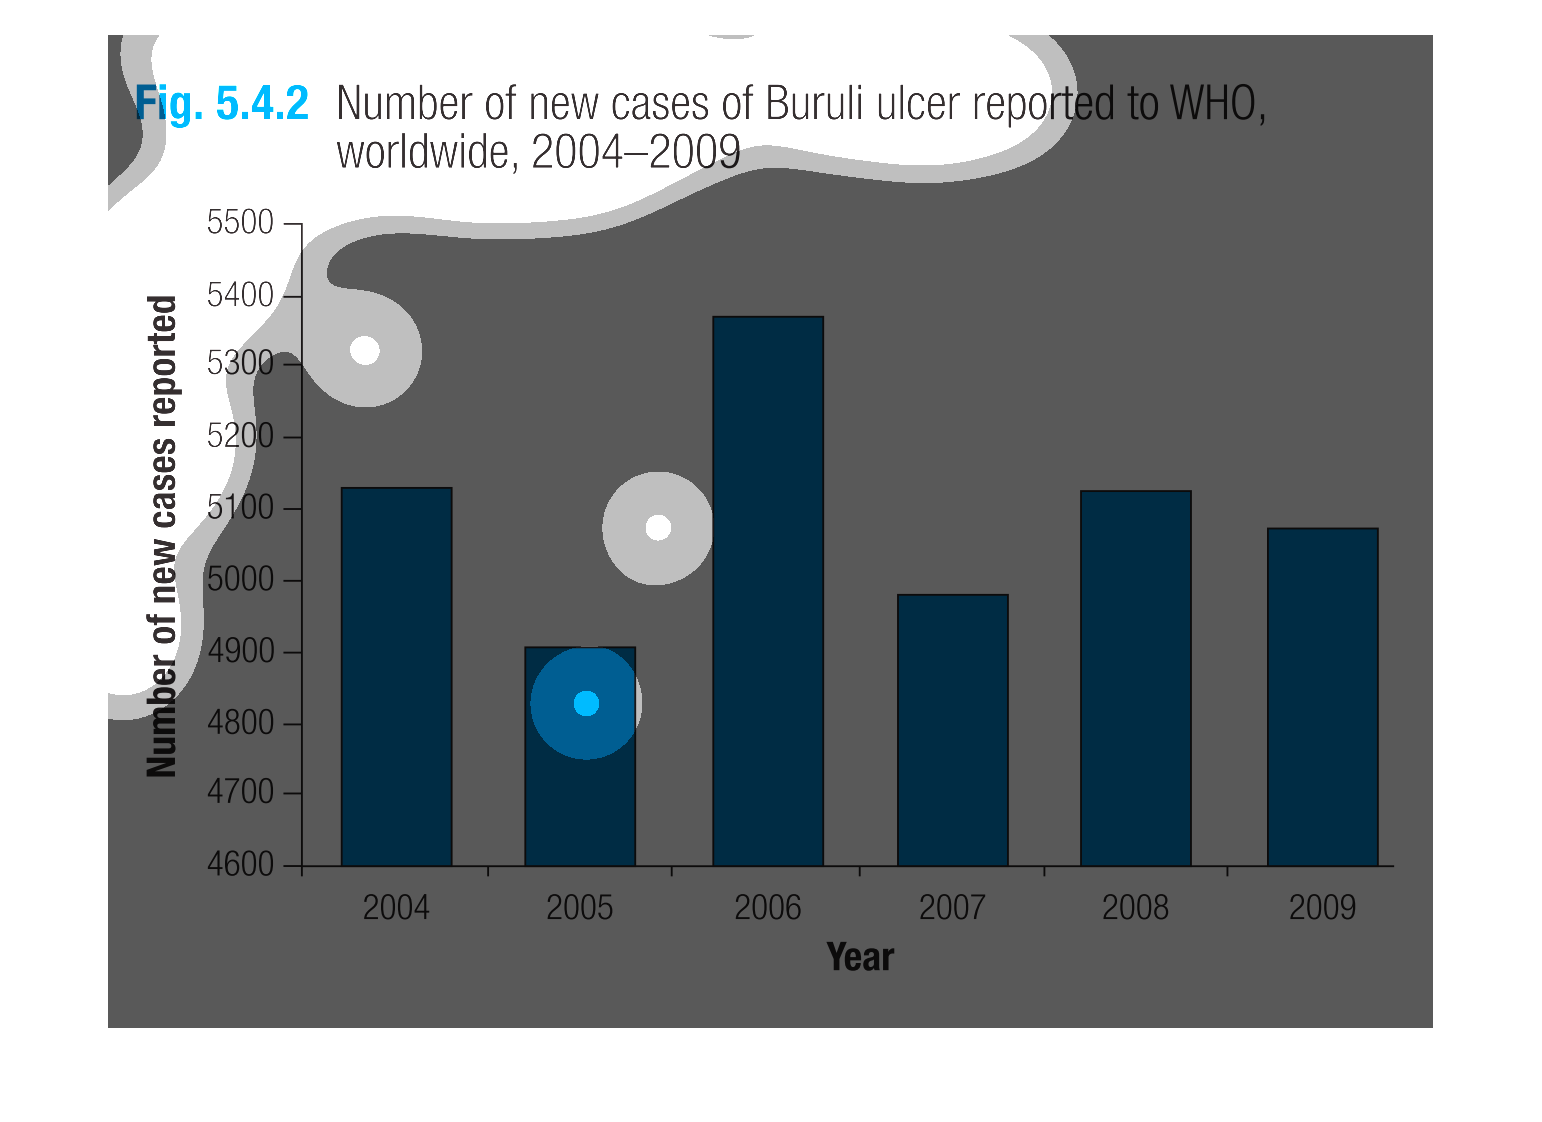
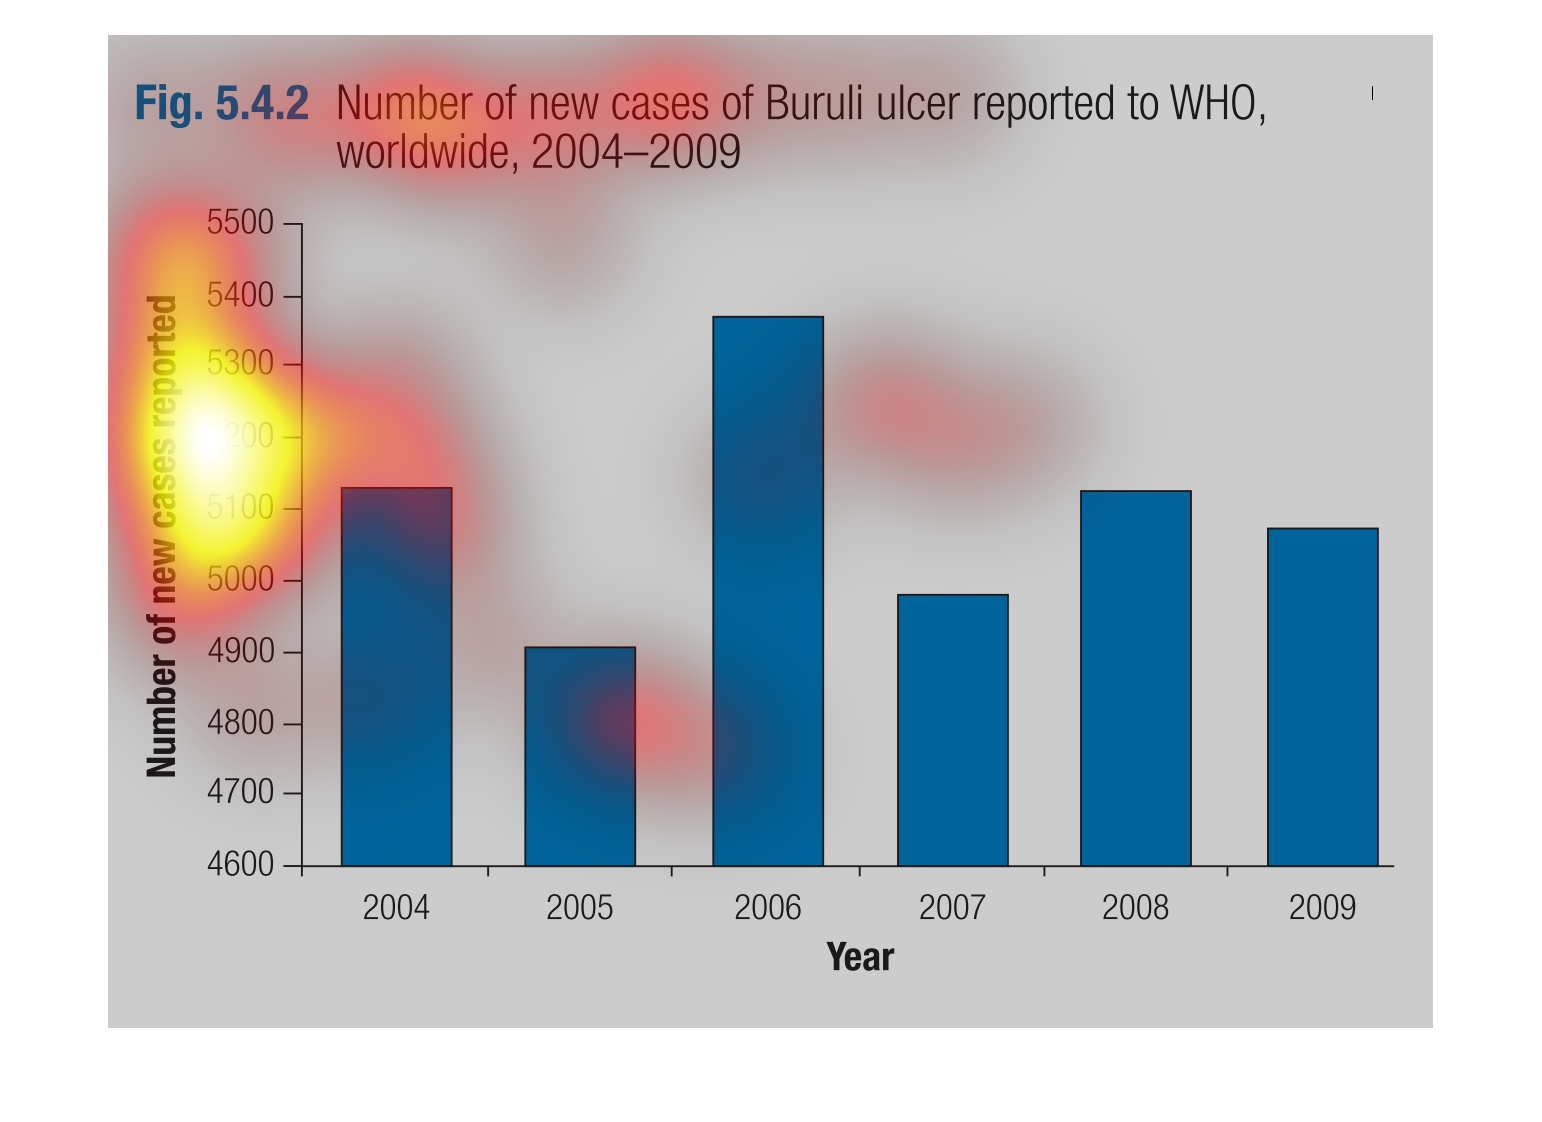
This is a graph of the number of new cases of Buruli ulcer reported to WHO worldwide. The
year that has the most number of reported cases was 2006, while the year with the least reported
cases was 2005.
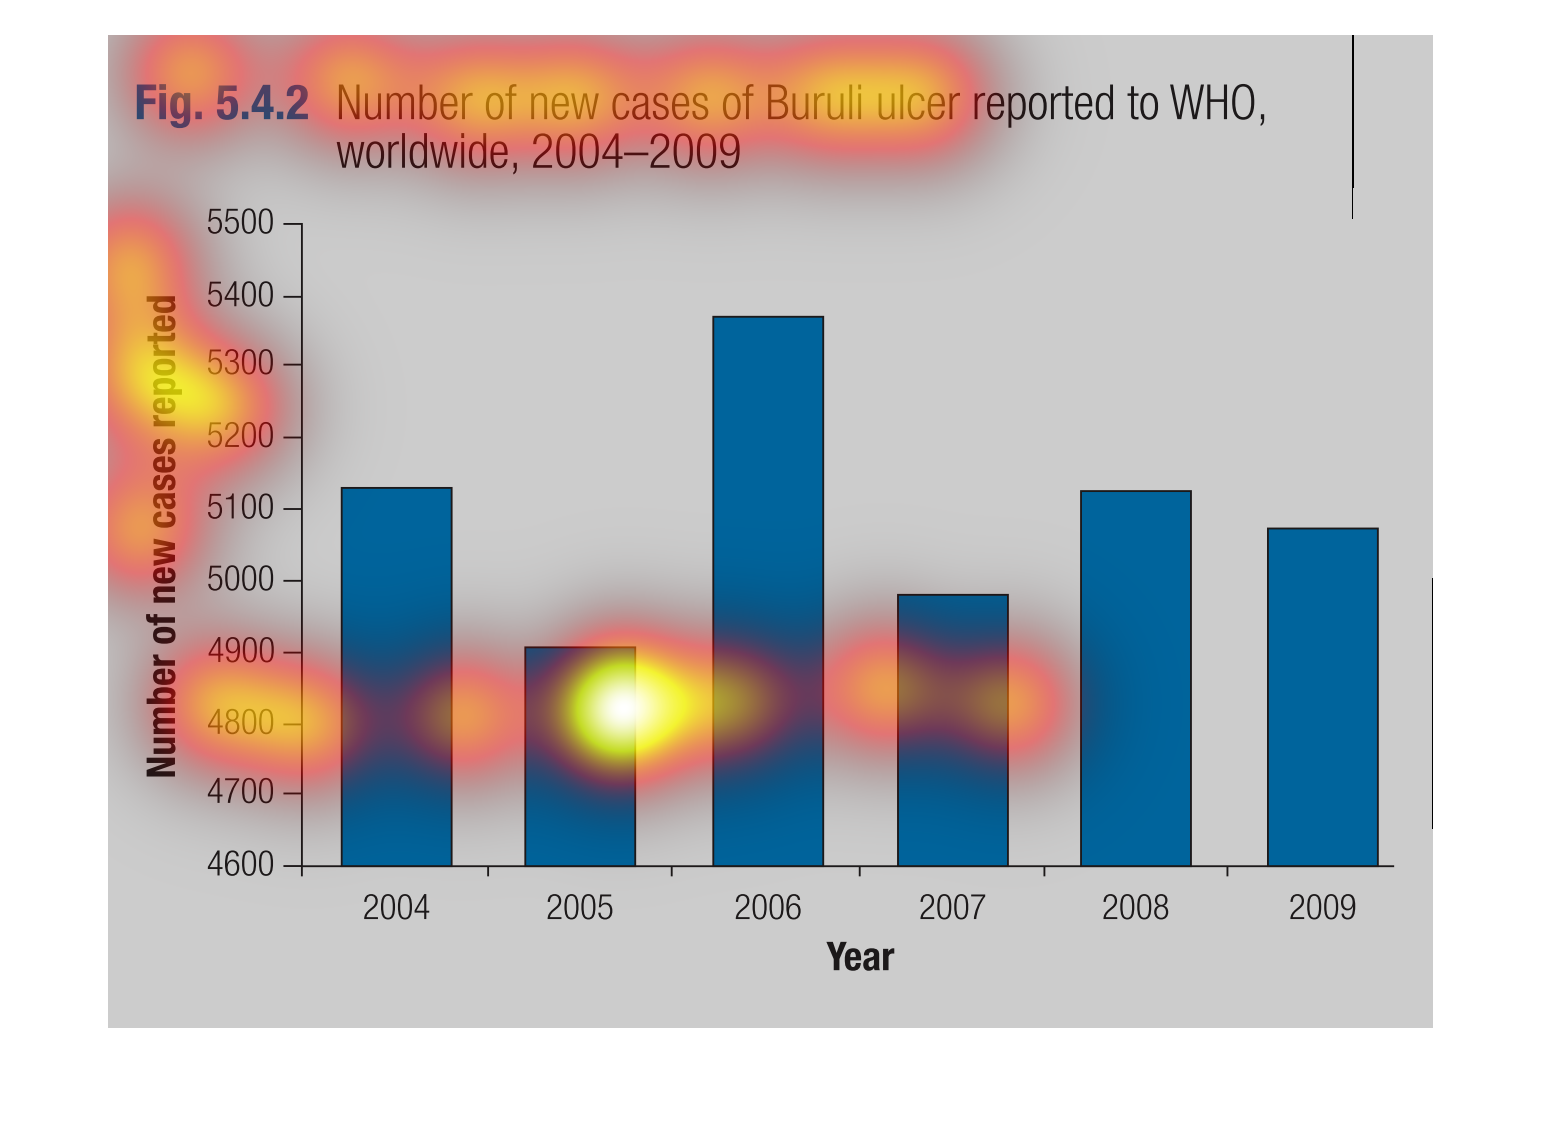
The graph is showing how many cases of Buruli ulcers were reported to WHO worldwide from the
years 2004 through 2009. From the chart we can see that in 2006, there was a significant increase
in reports, but they went down for the next few years.
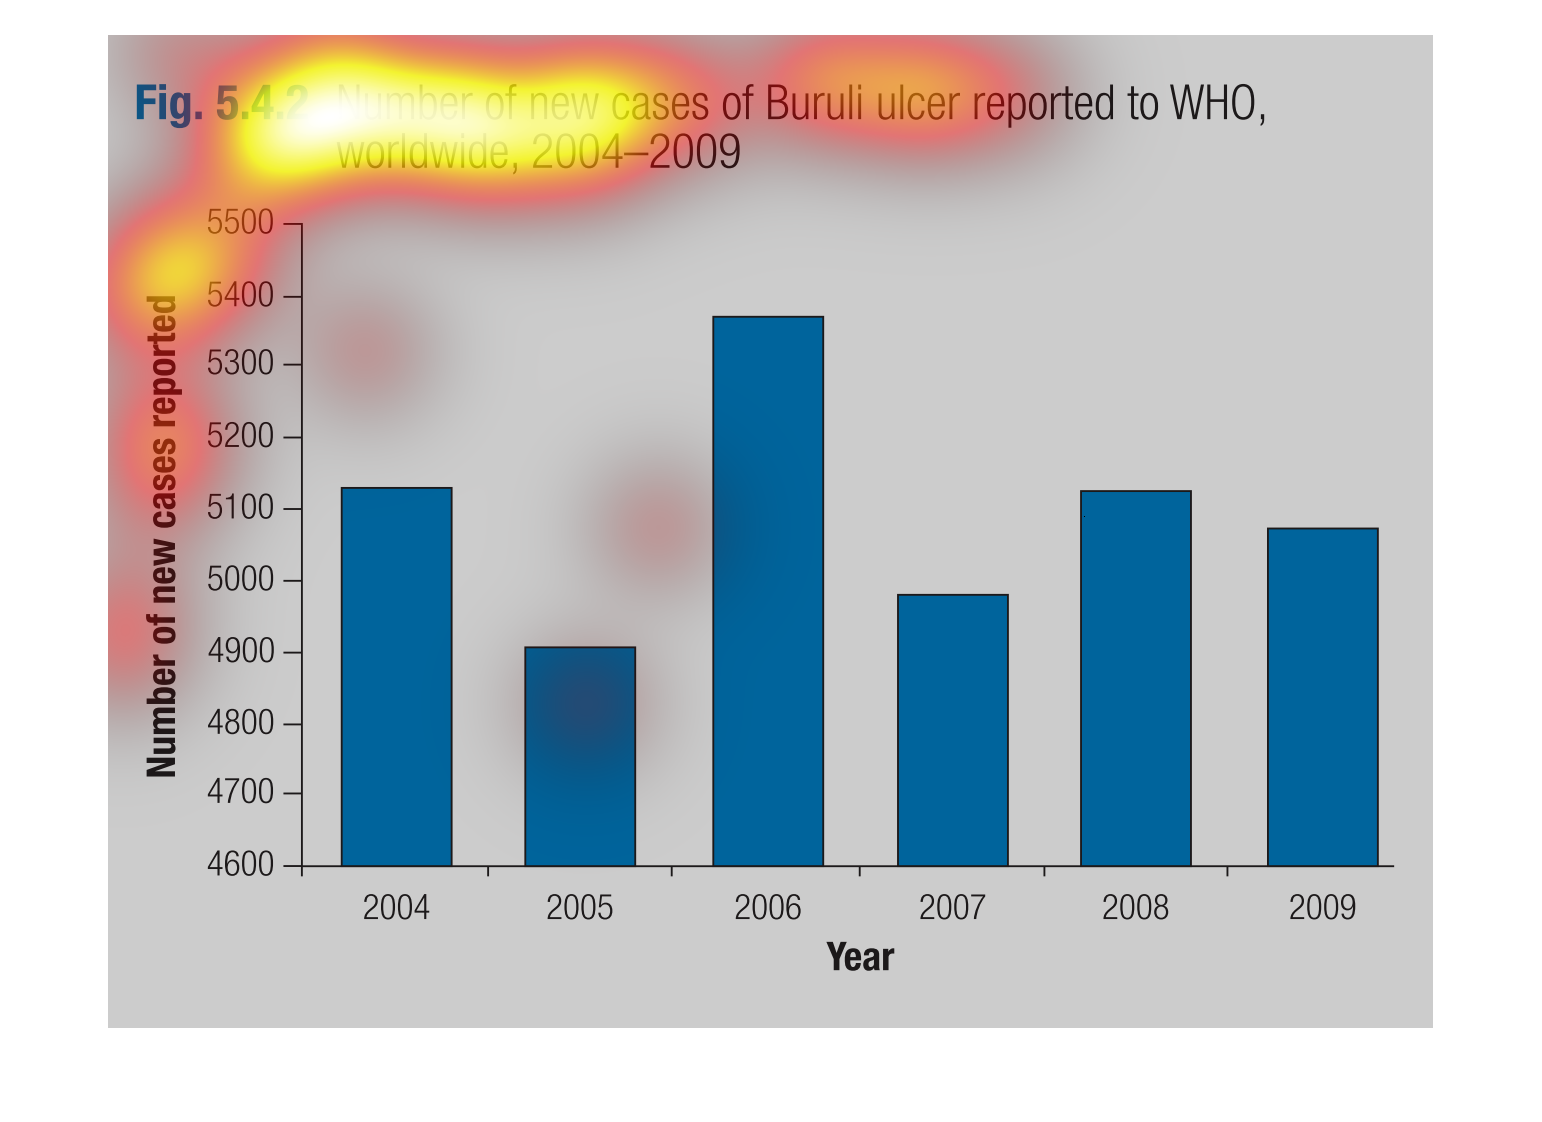
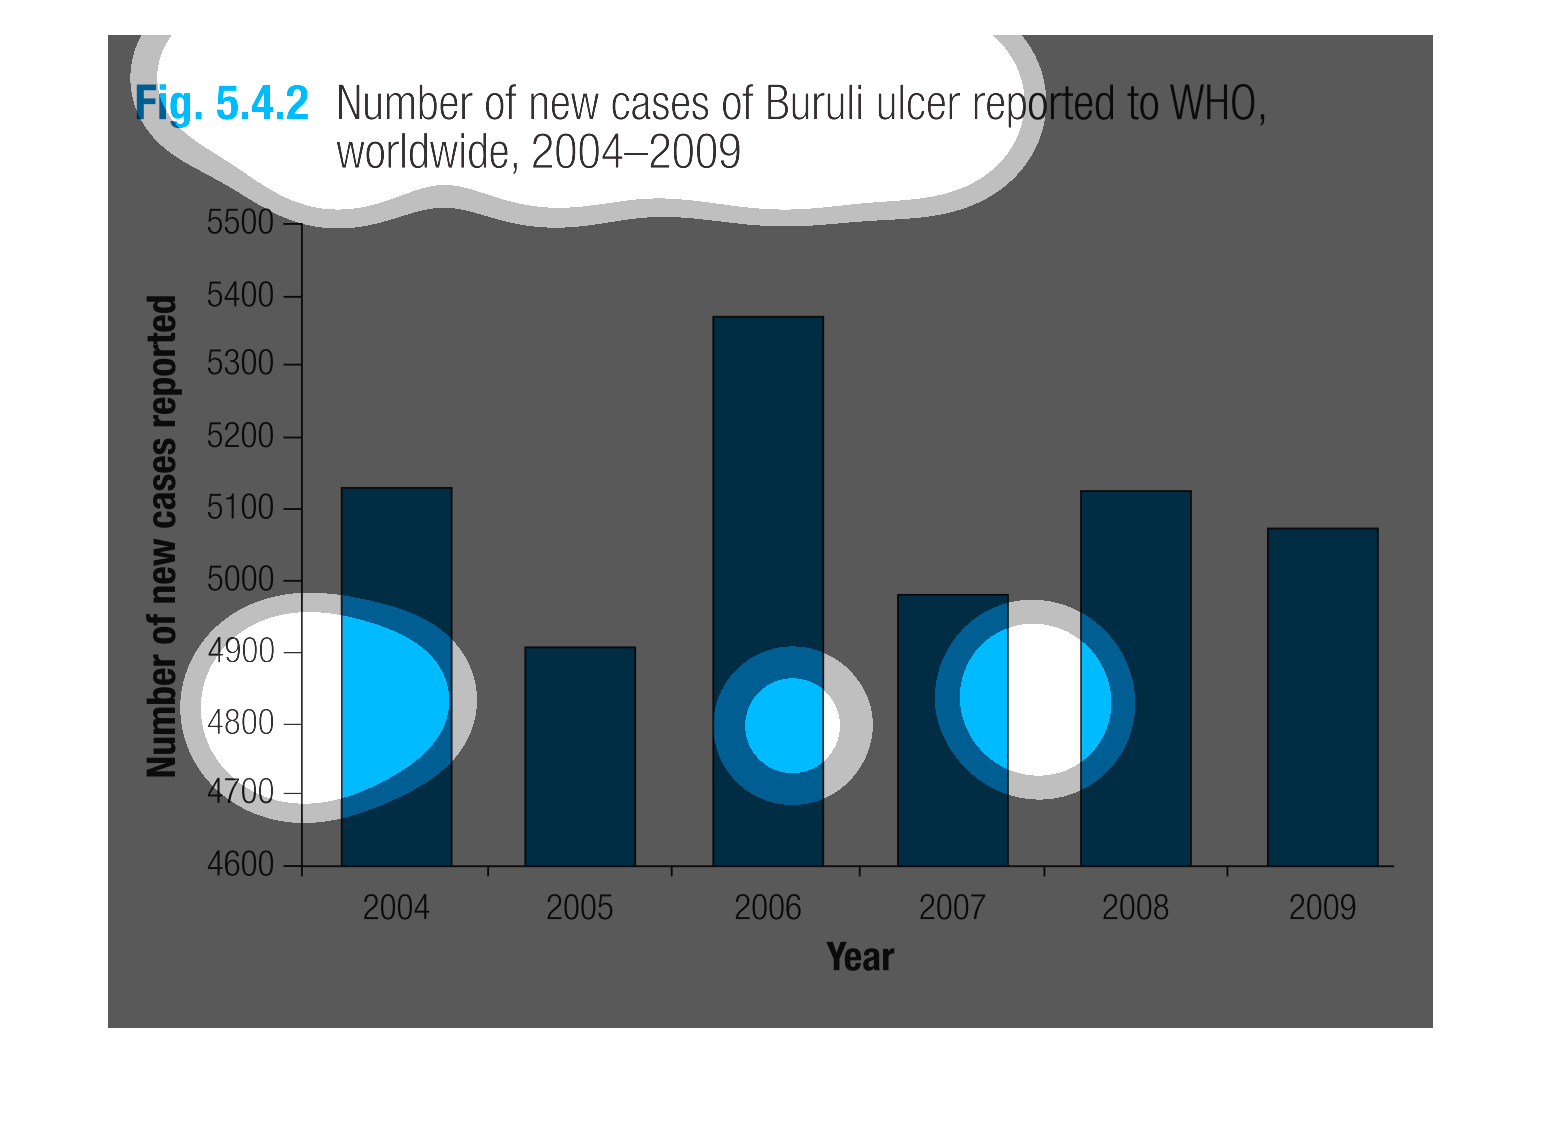
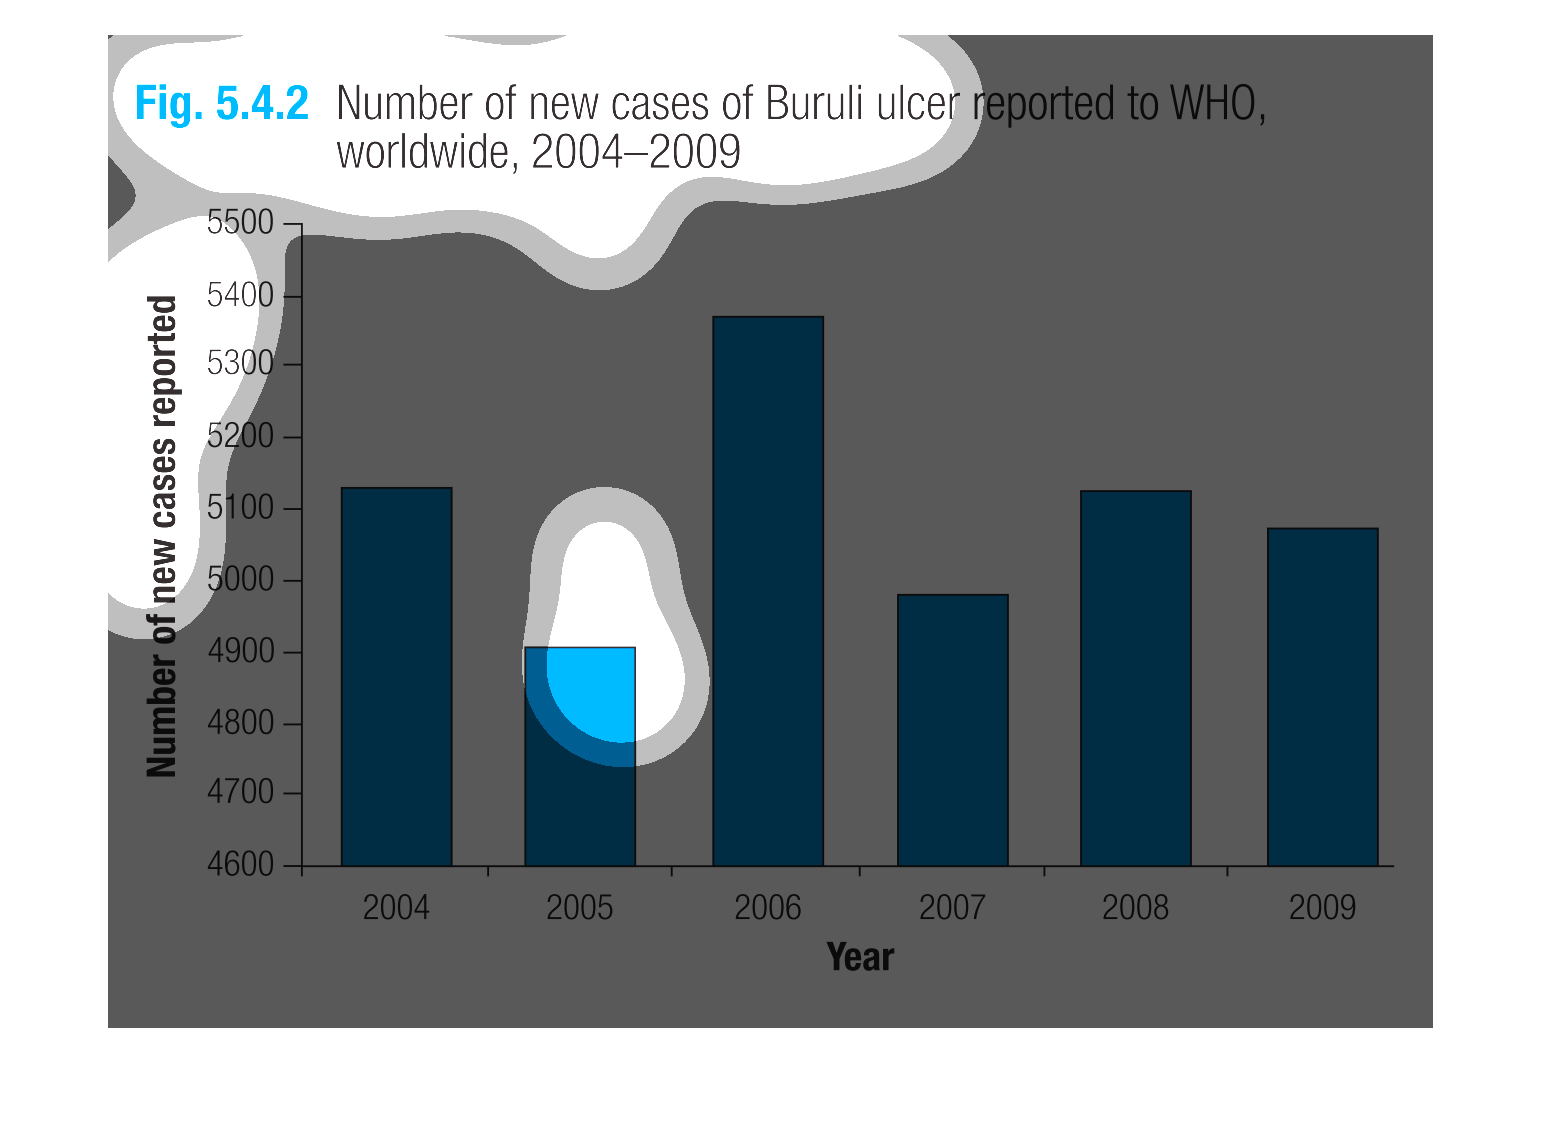
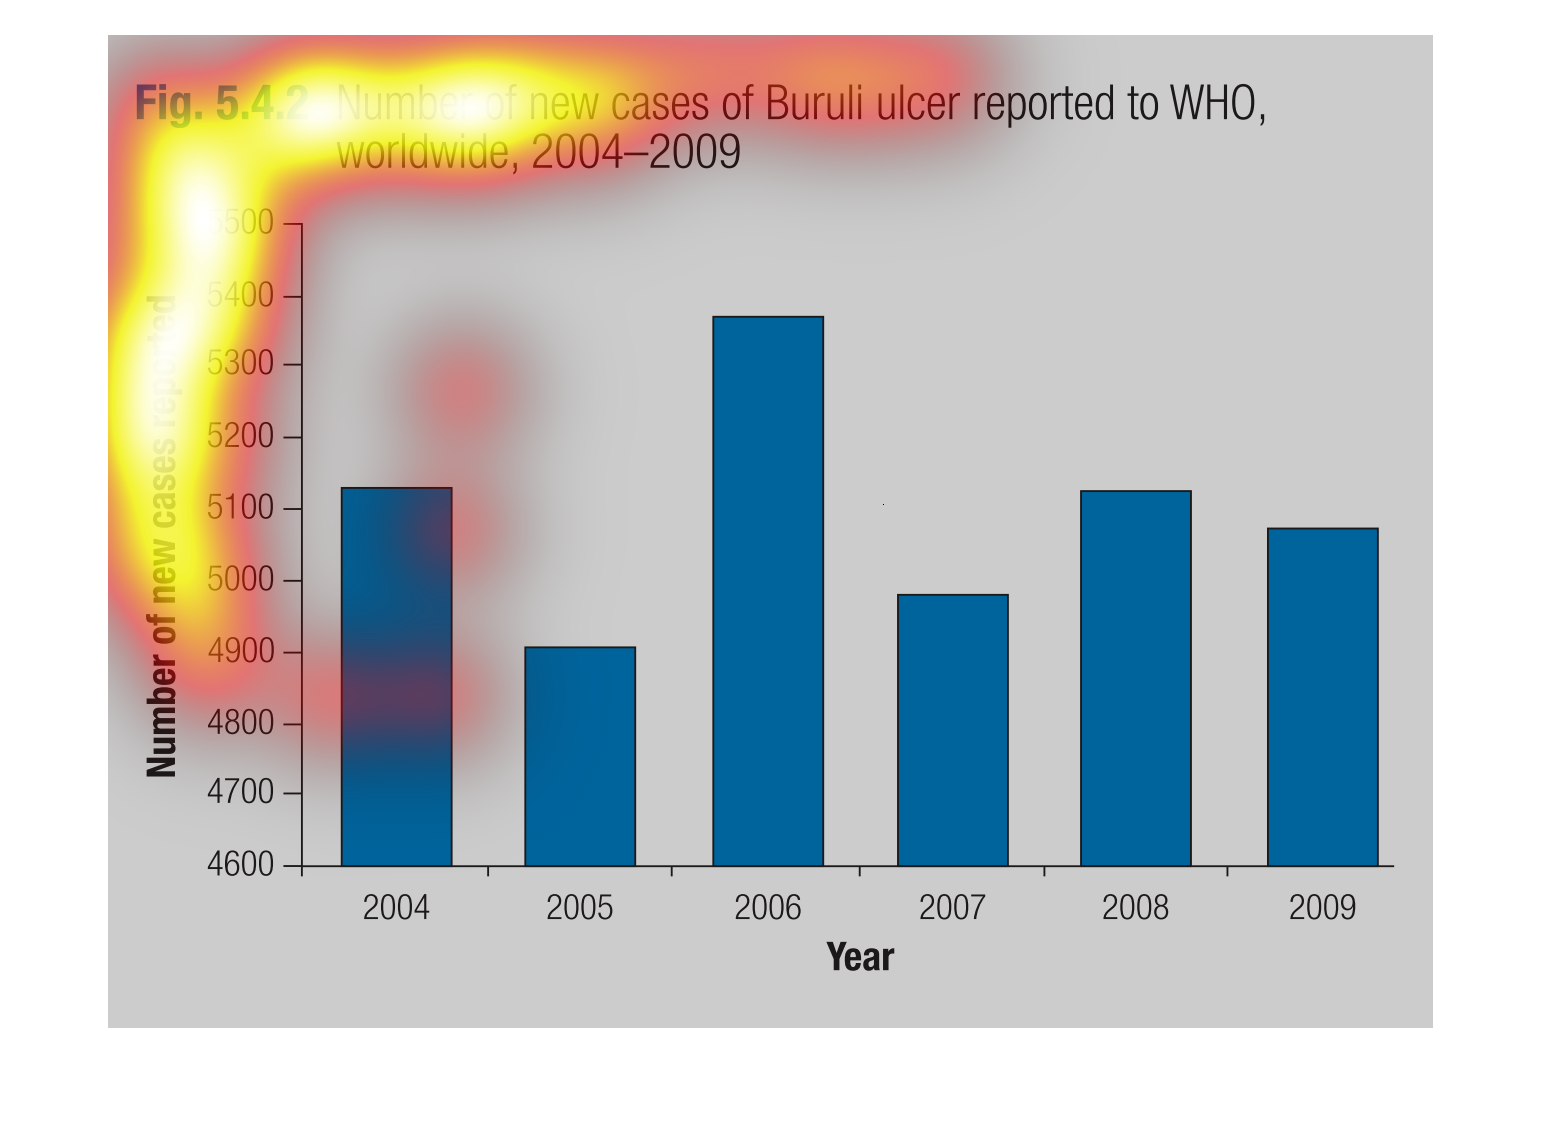
The chart describes the new cases of buruli ulcers reported between the years 2004-2009. The
year 2006 had the most new cases reported, upwards of 5,300 cases. There is no particular
trend, however, from 2007-2009, the number of newly reported cases has been steady between
4,900 and 5,100 per year.
Shows the number of ulcers reported to the WHO during various years. The highest amount of
ulcers were reported in 2006 while there was a low amount in 2005
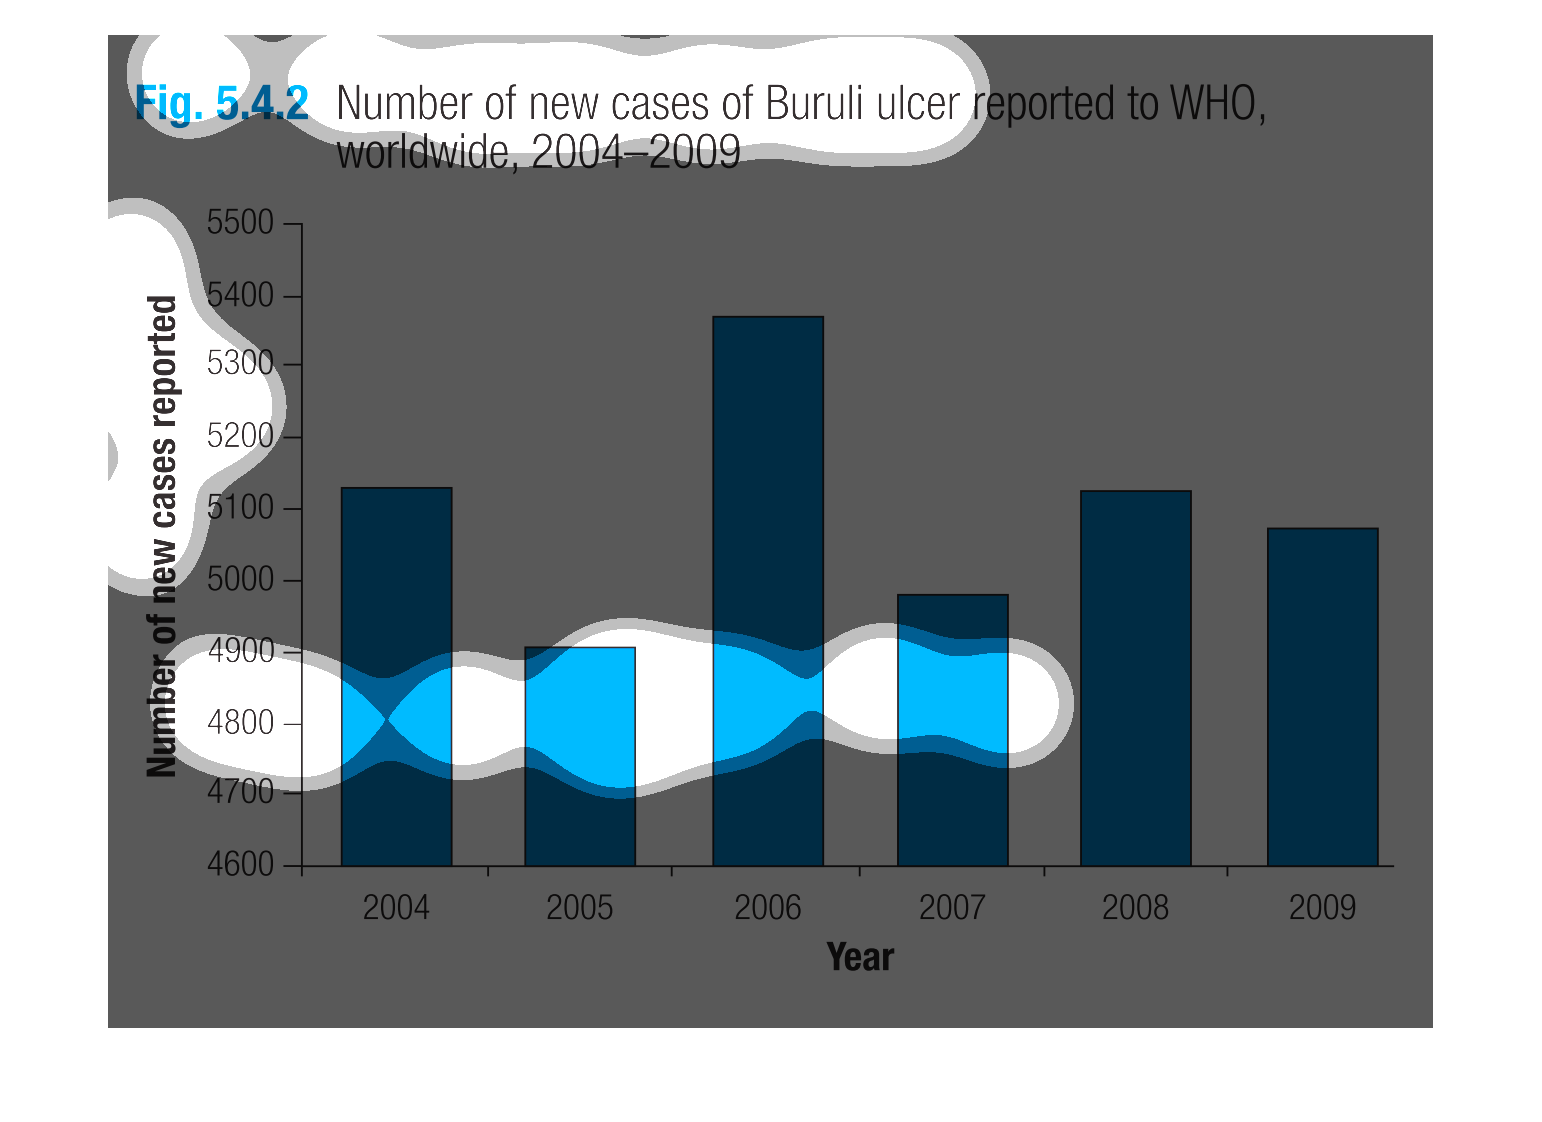
This handmade chart shows the incidence of Buruli ulceritis around the world. It is sorted
by region and shows 2006 was the most prevalent year of this
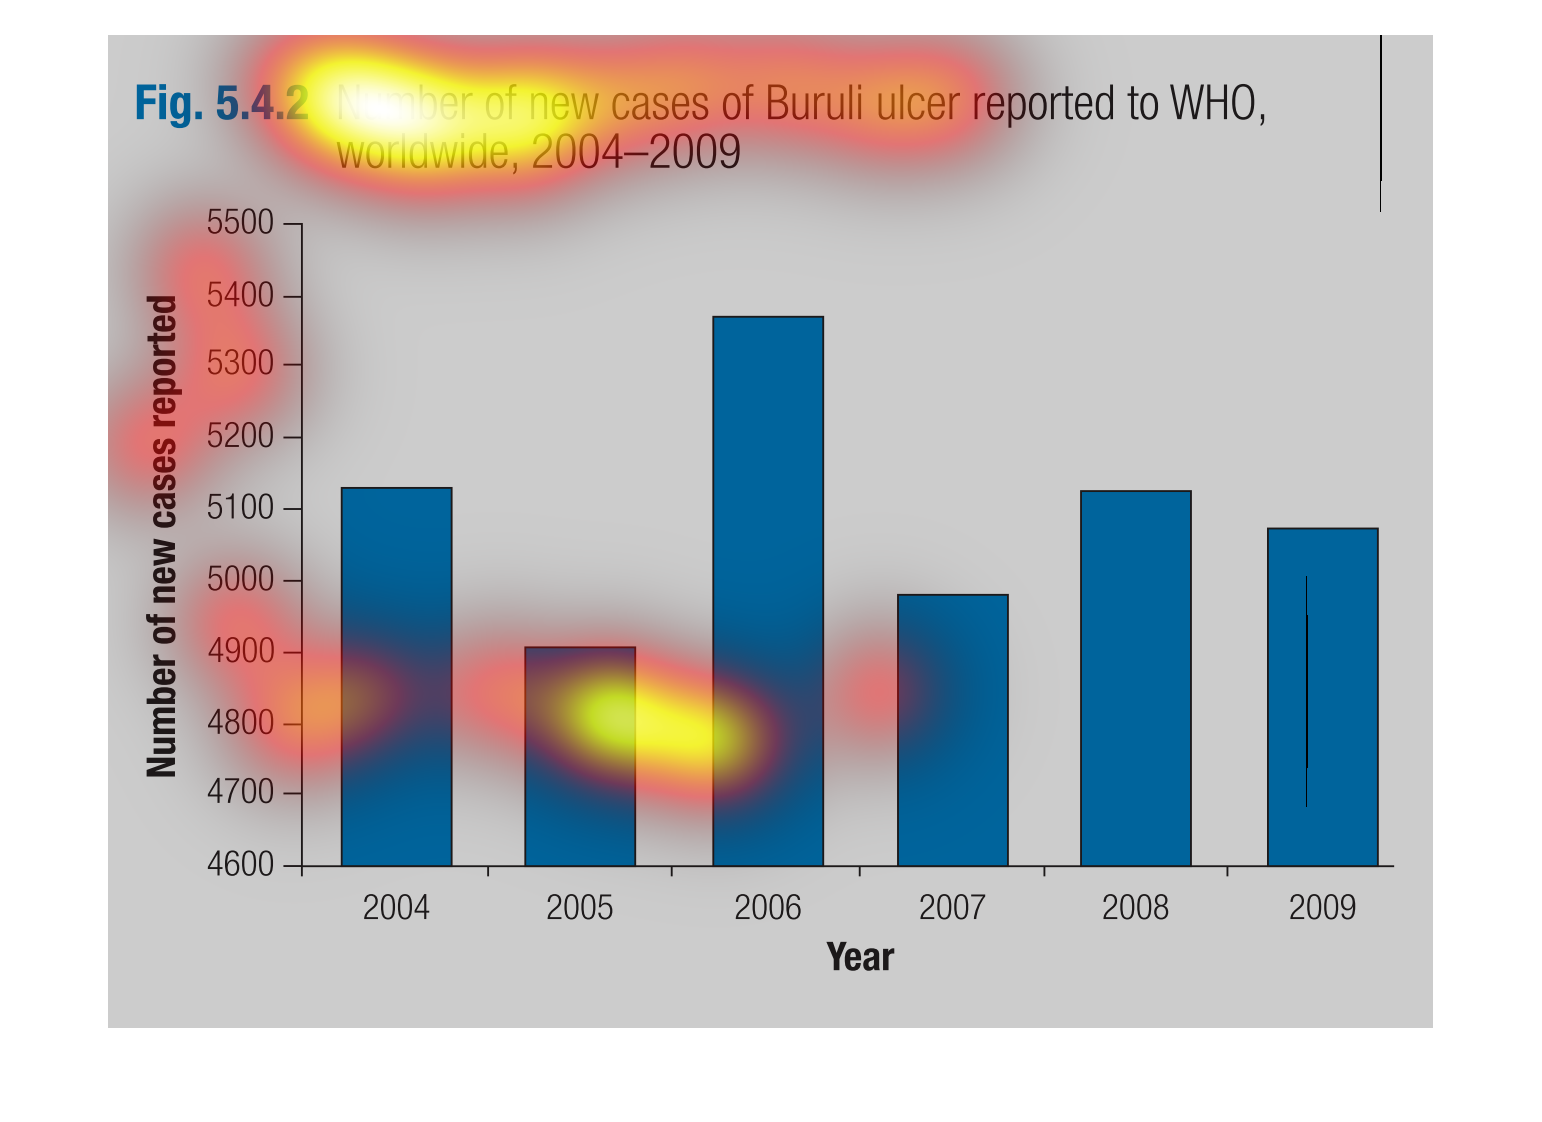
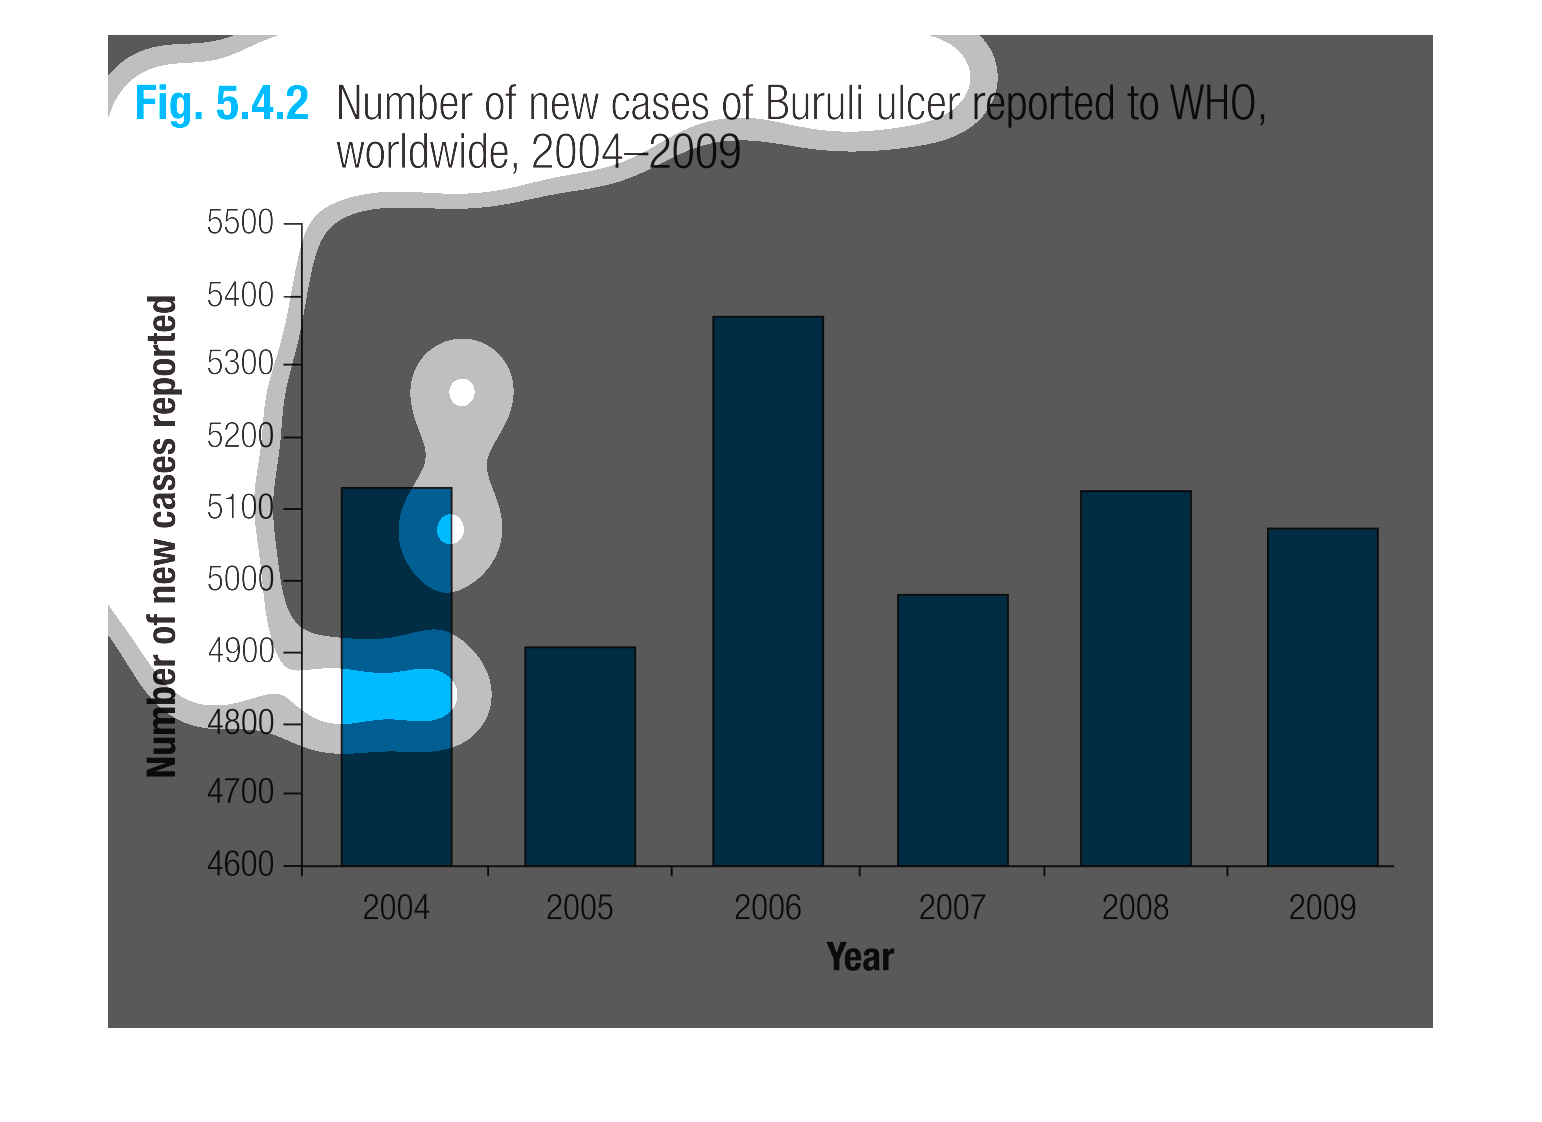
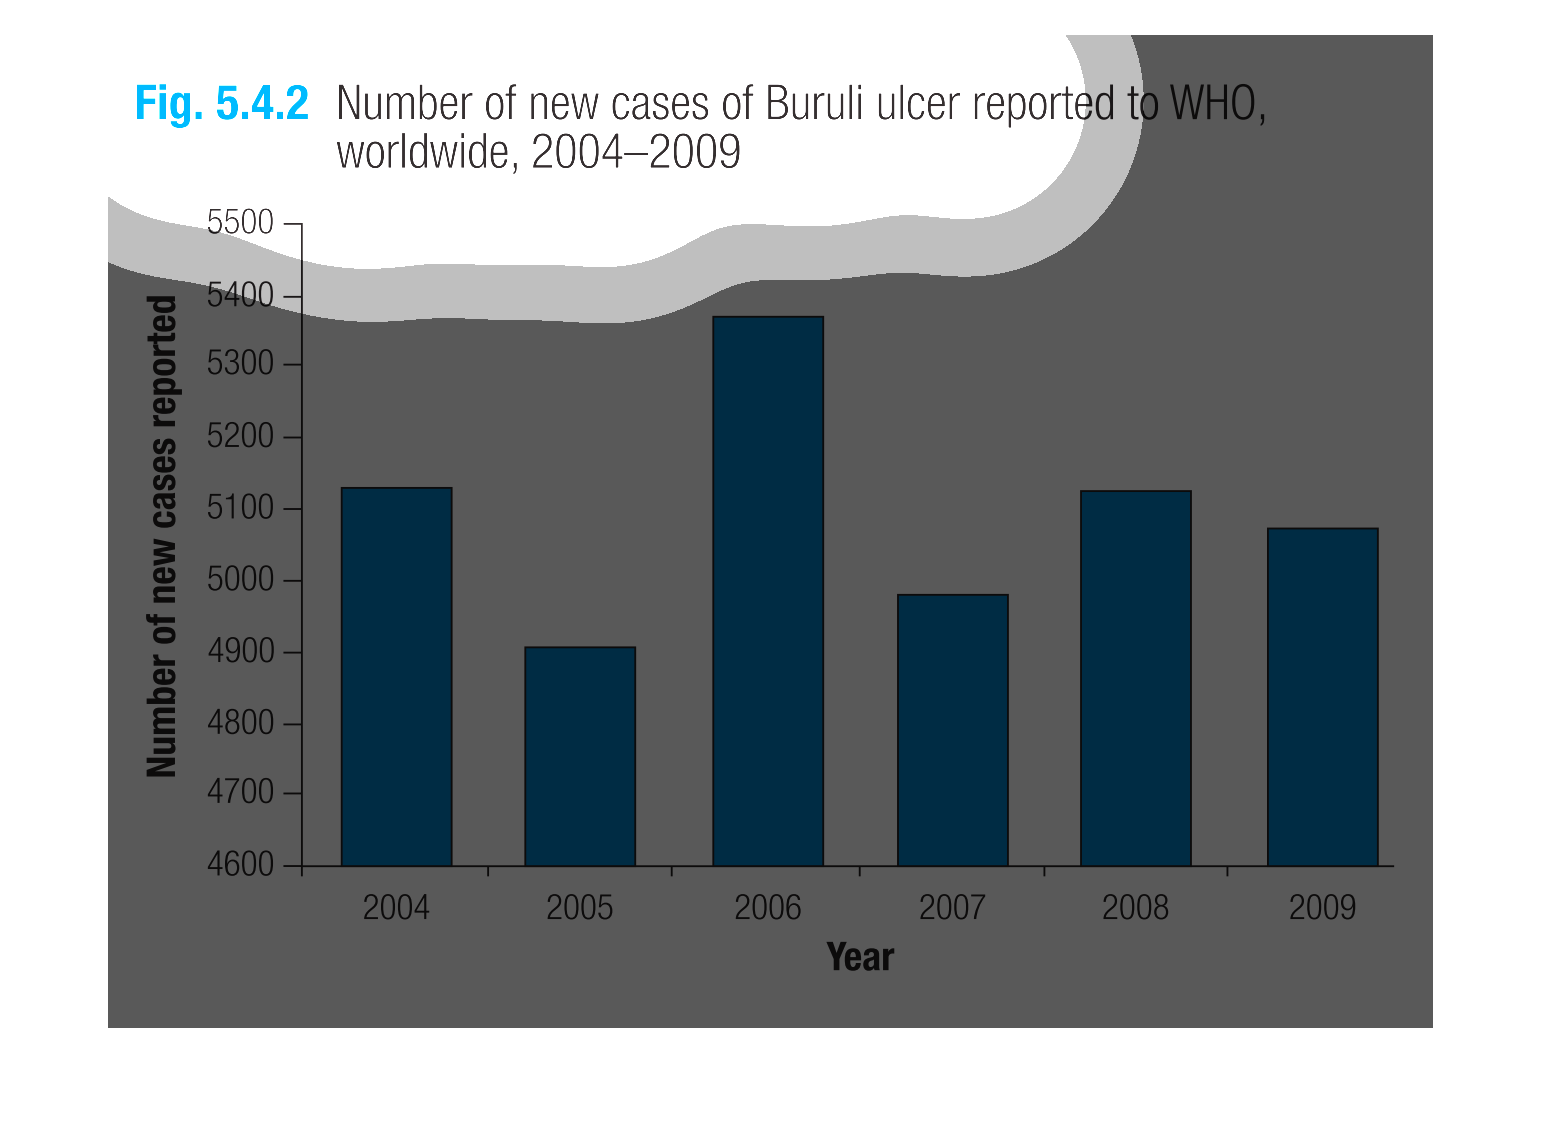
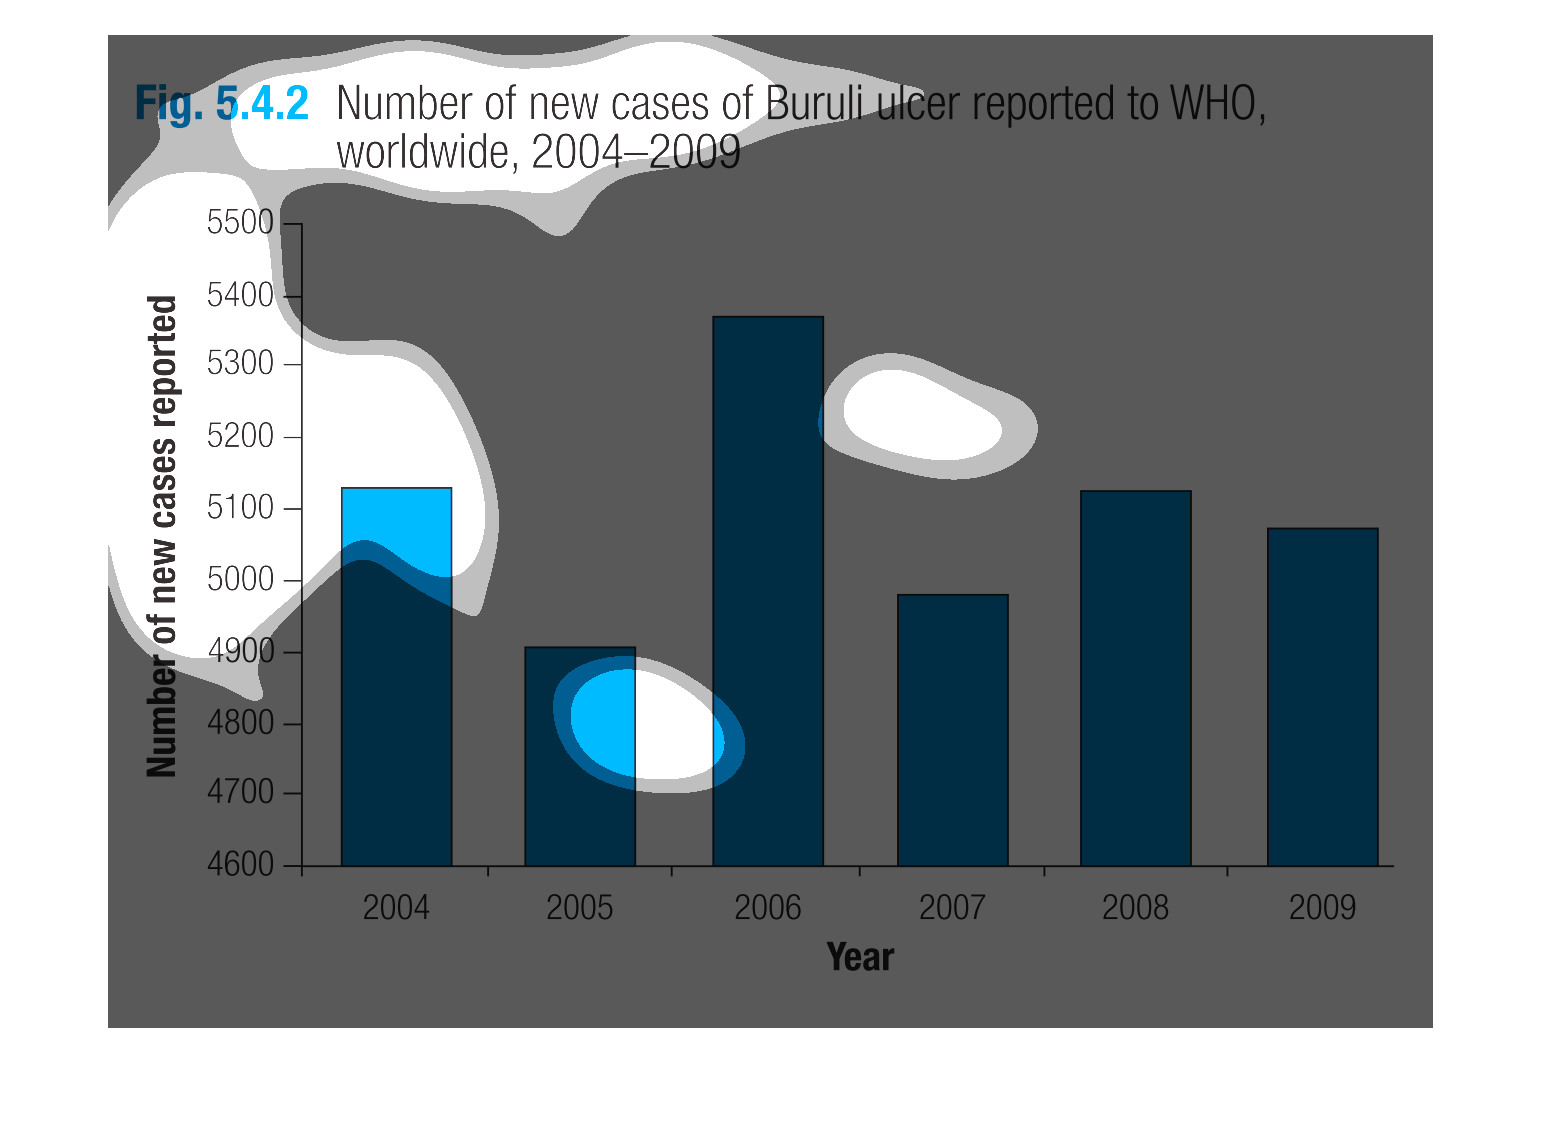
This graph shows the number of Buruli Ulcer reported to WHO, worldwide from 2004 through 2009.
It shows the number of new cases reported. They range from 4600 to about 5400.
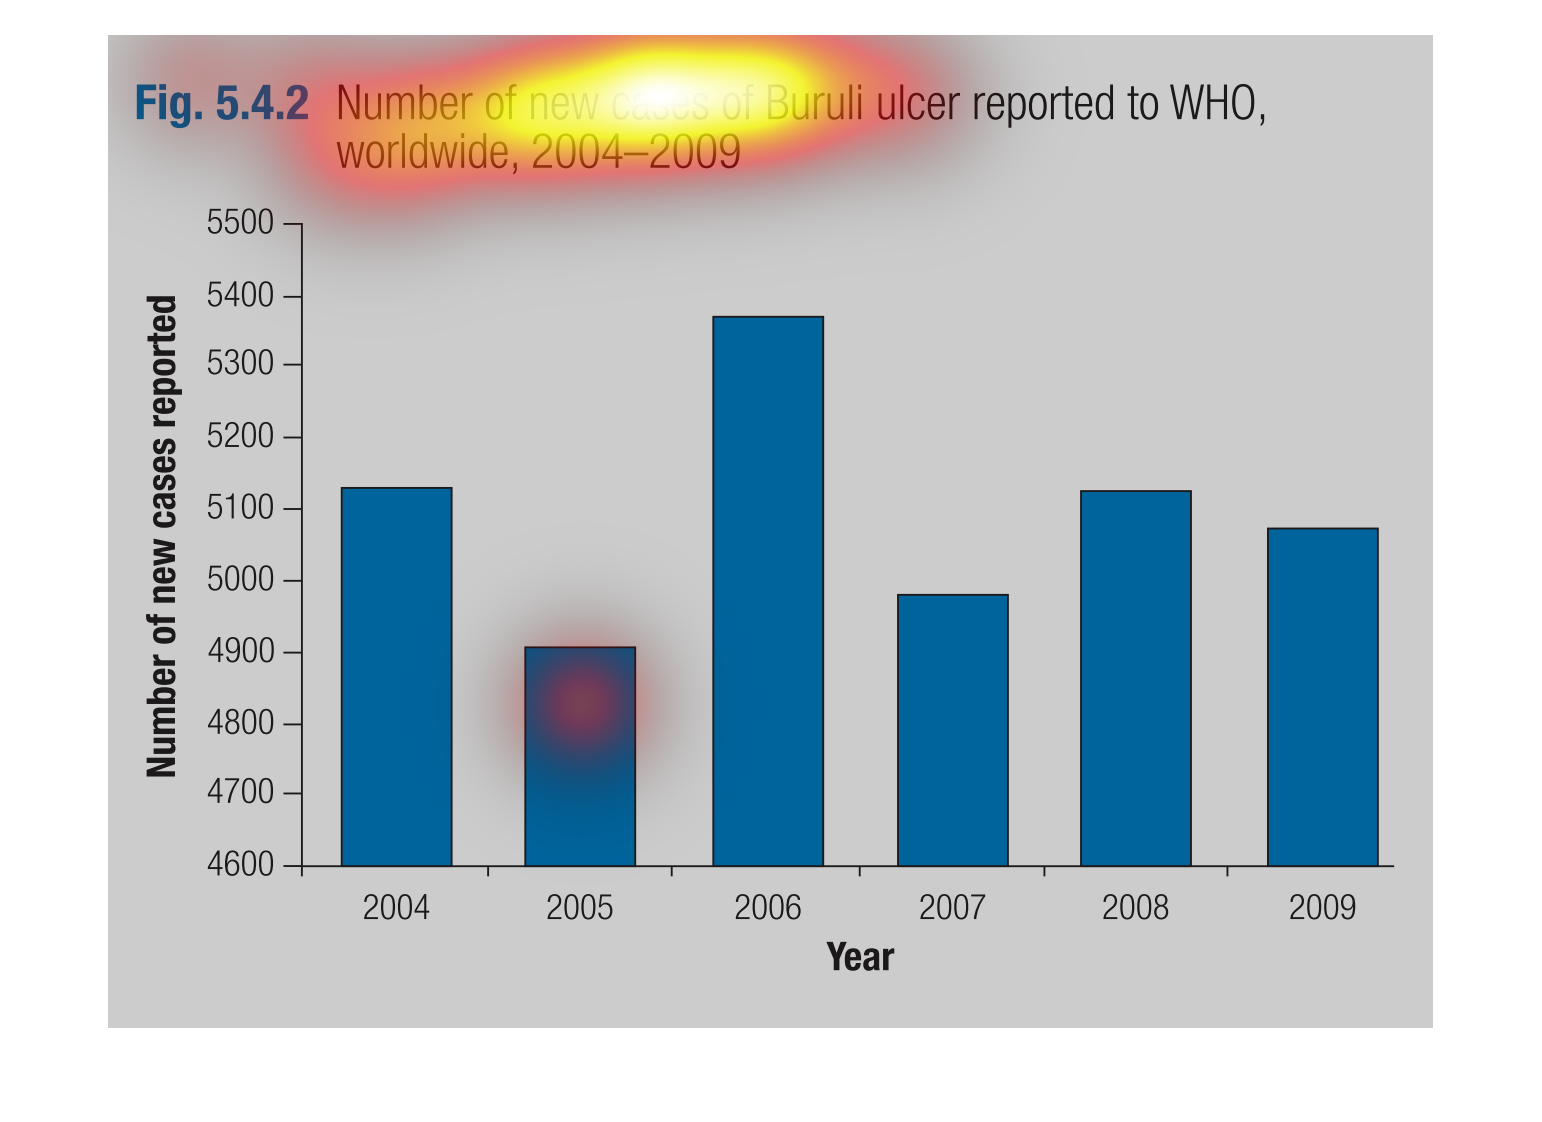
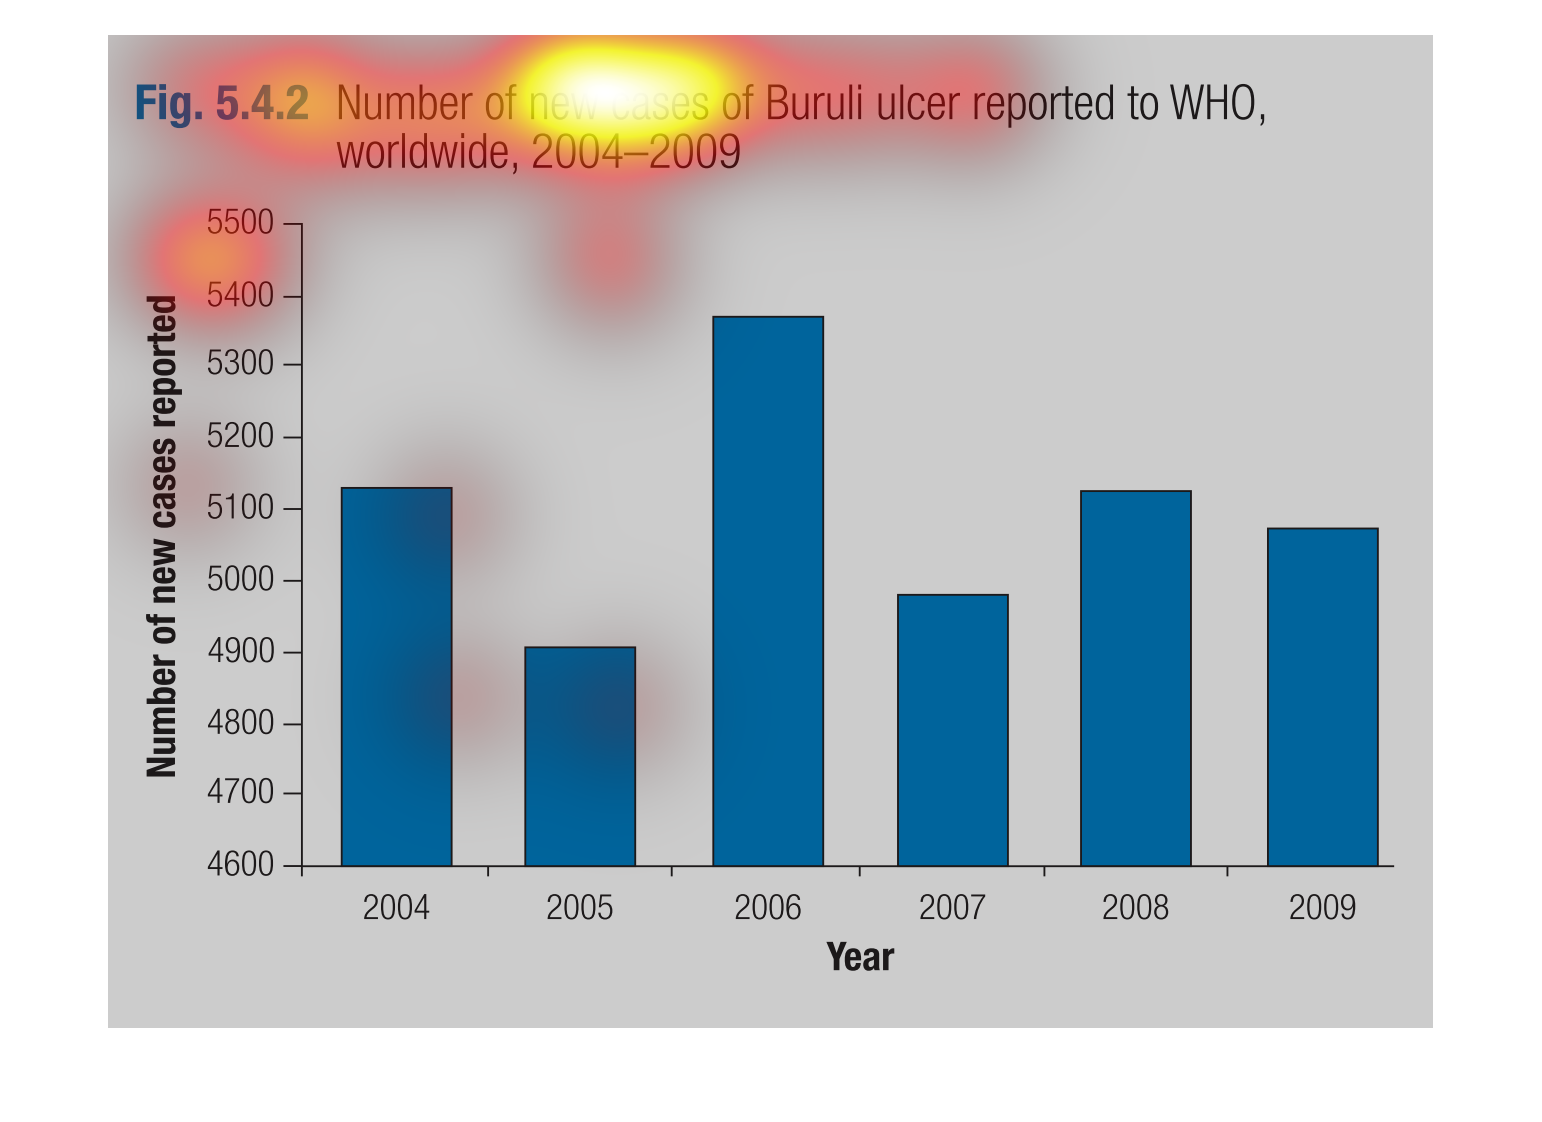
This is a bar graph that shows the number of newly reported Buruli ulcers in the world from
the years 2004 to 2009. 2006 had the highest and 2005 had the lowest.
This image shows or depicts a figure in statistical bar graph format the number of new cases
of Buruli ulcer reported to WHO, worldwide from 2004-2009.
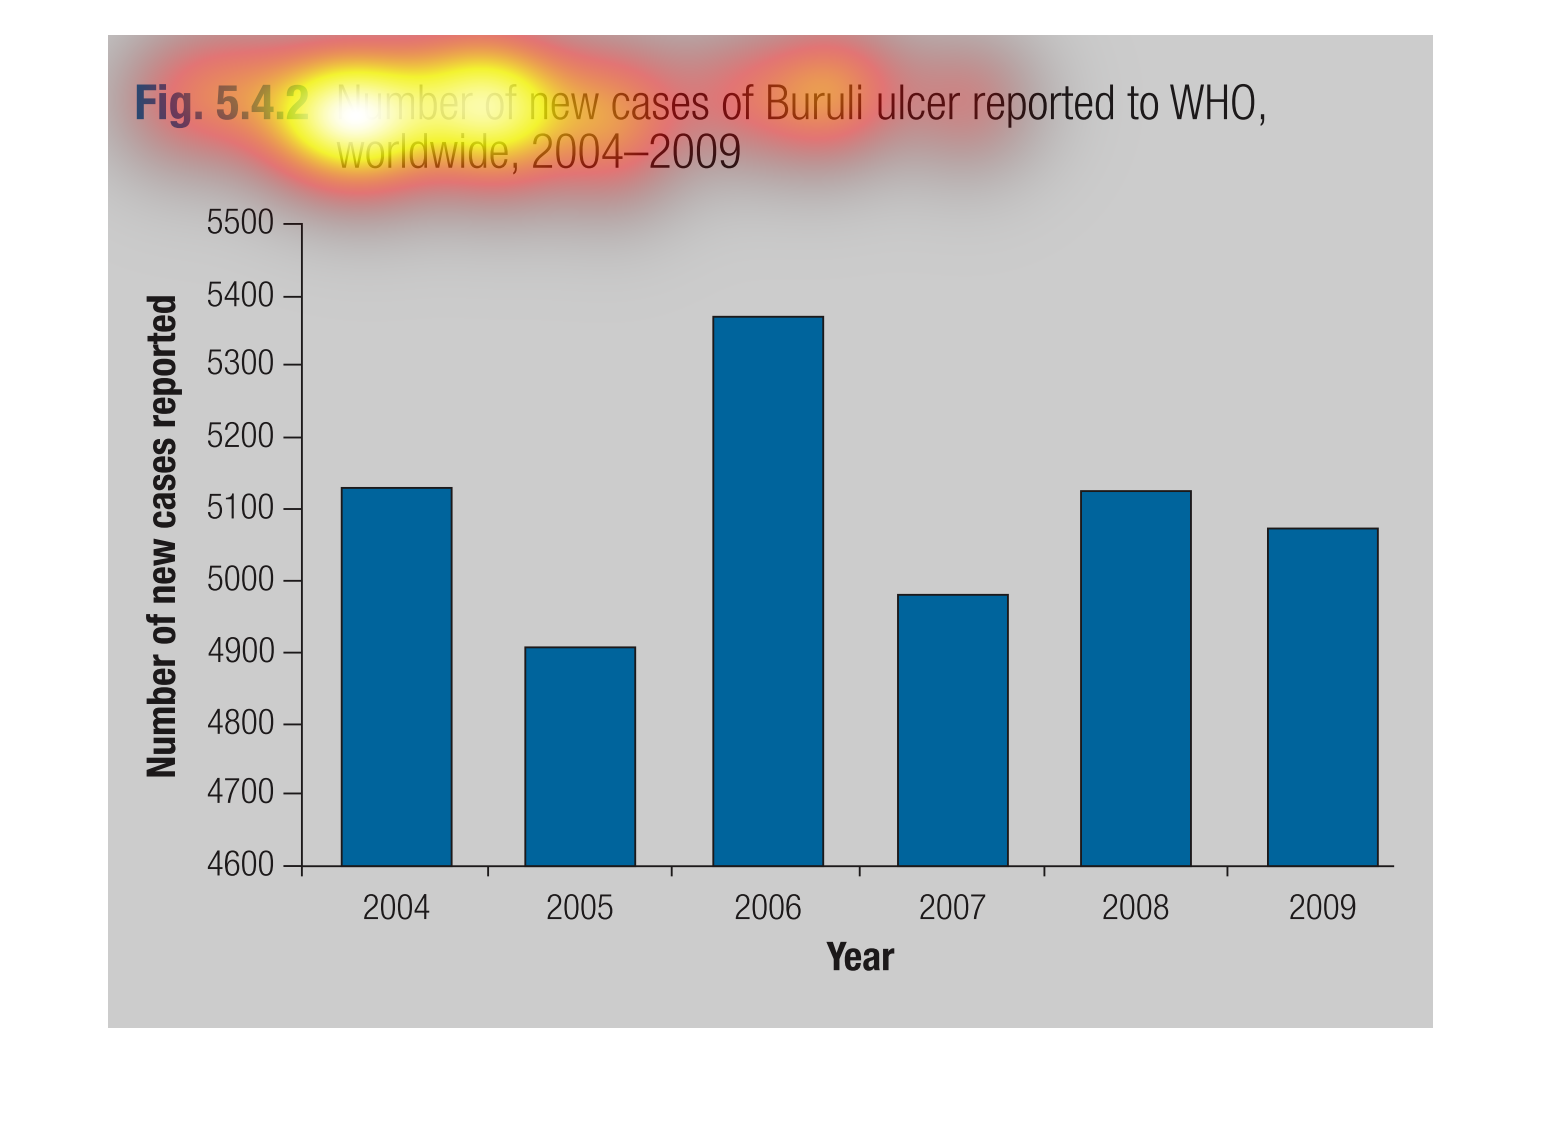
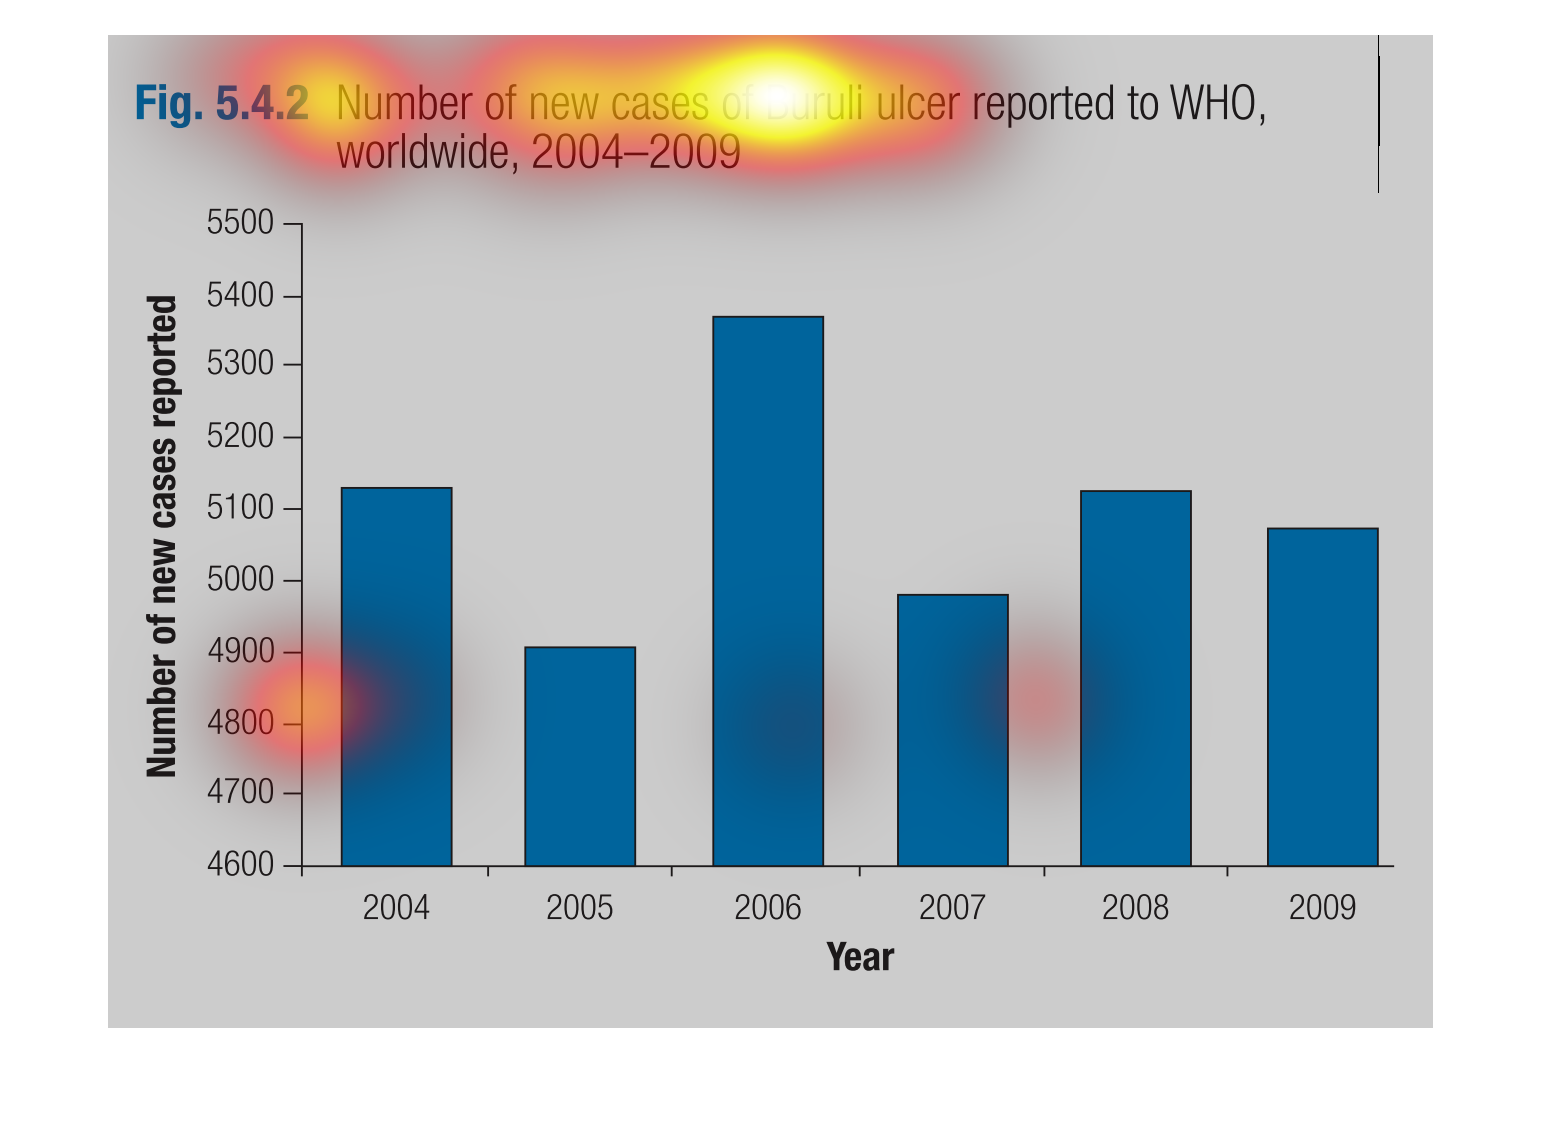
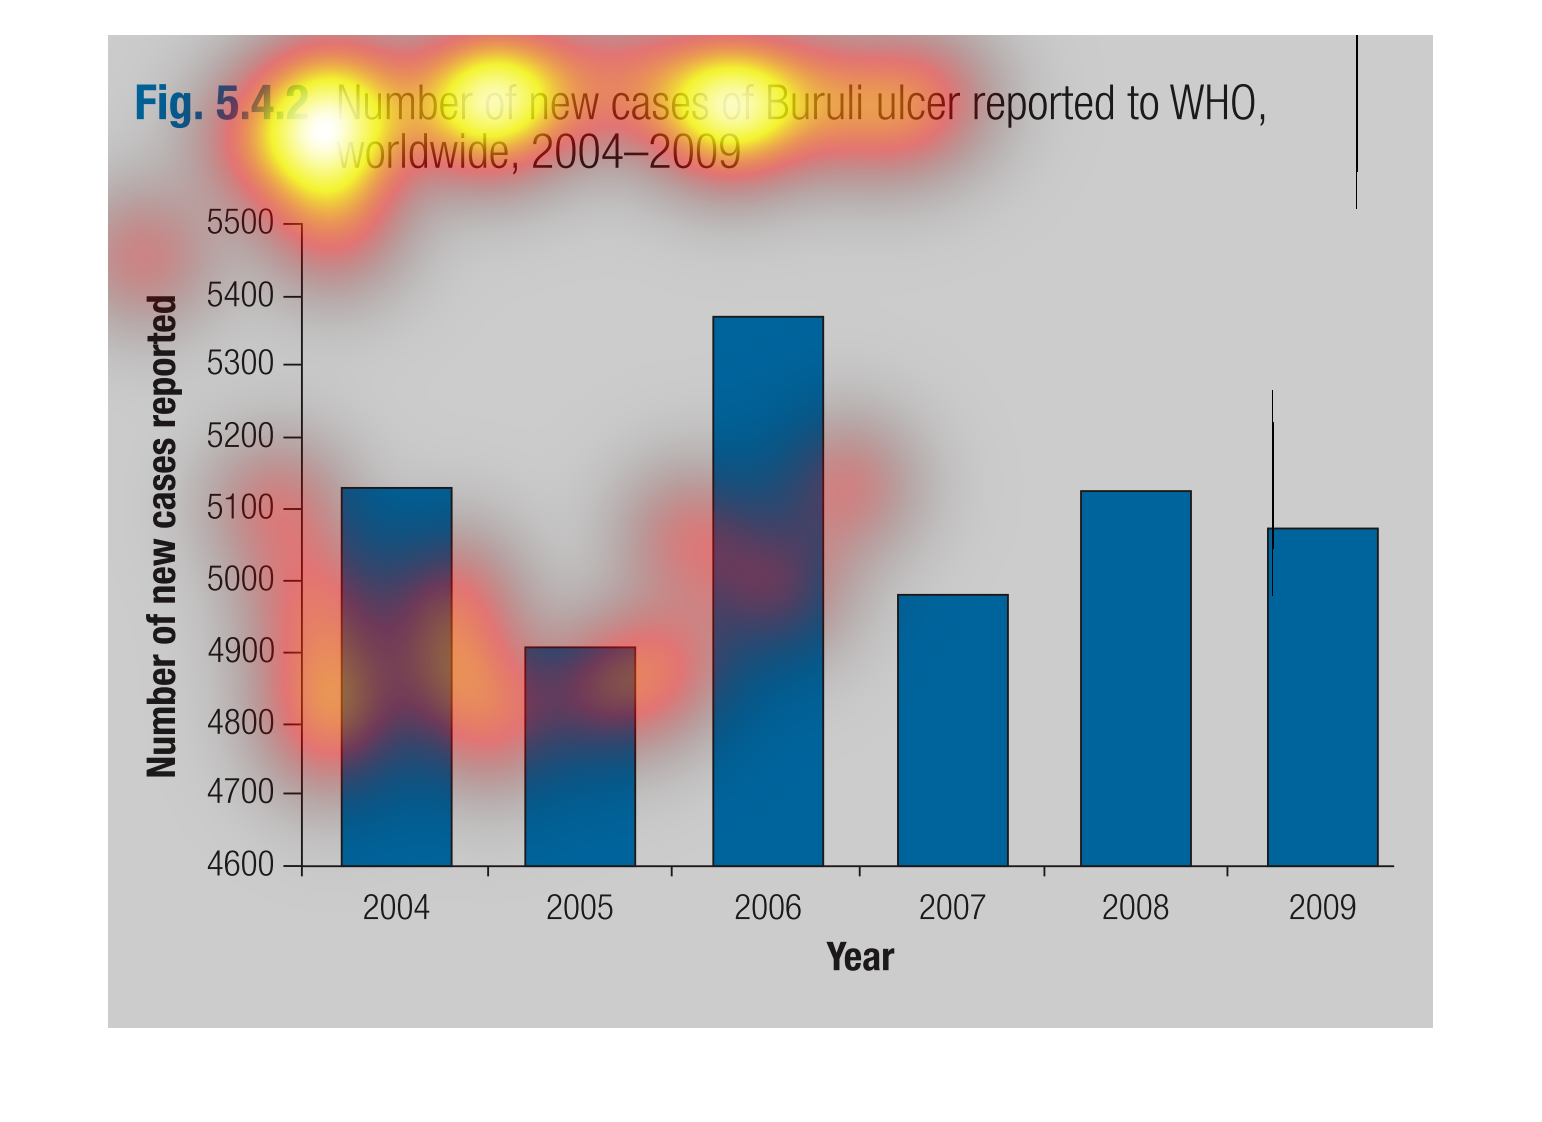
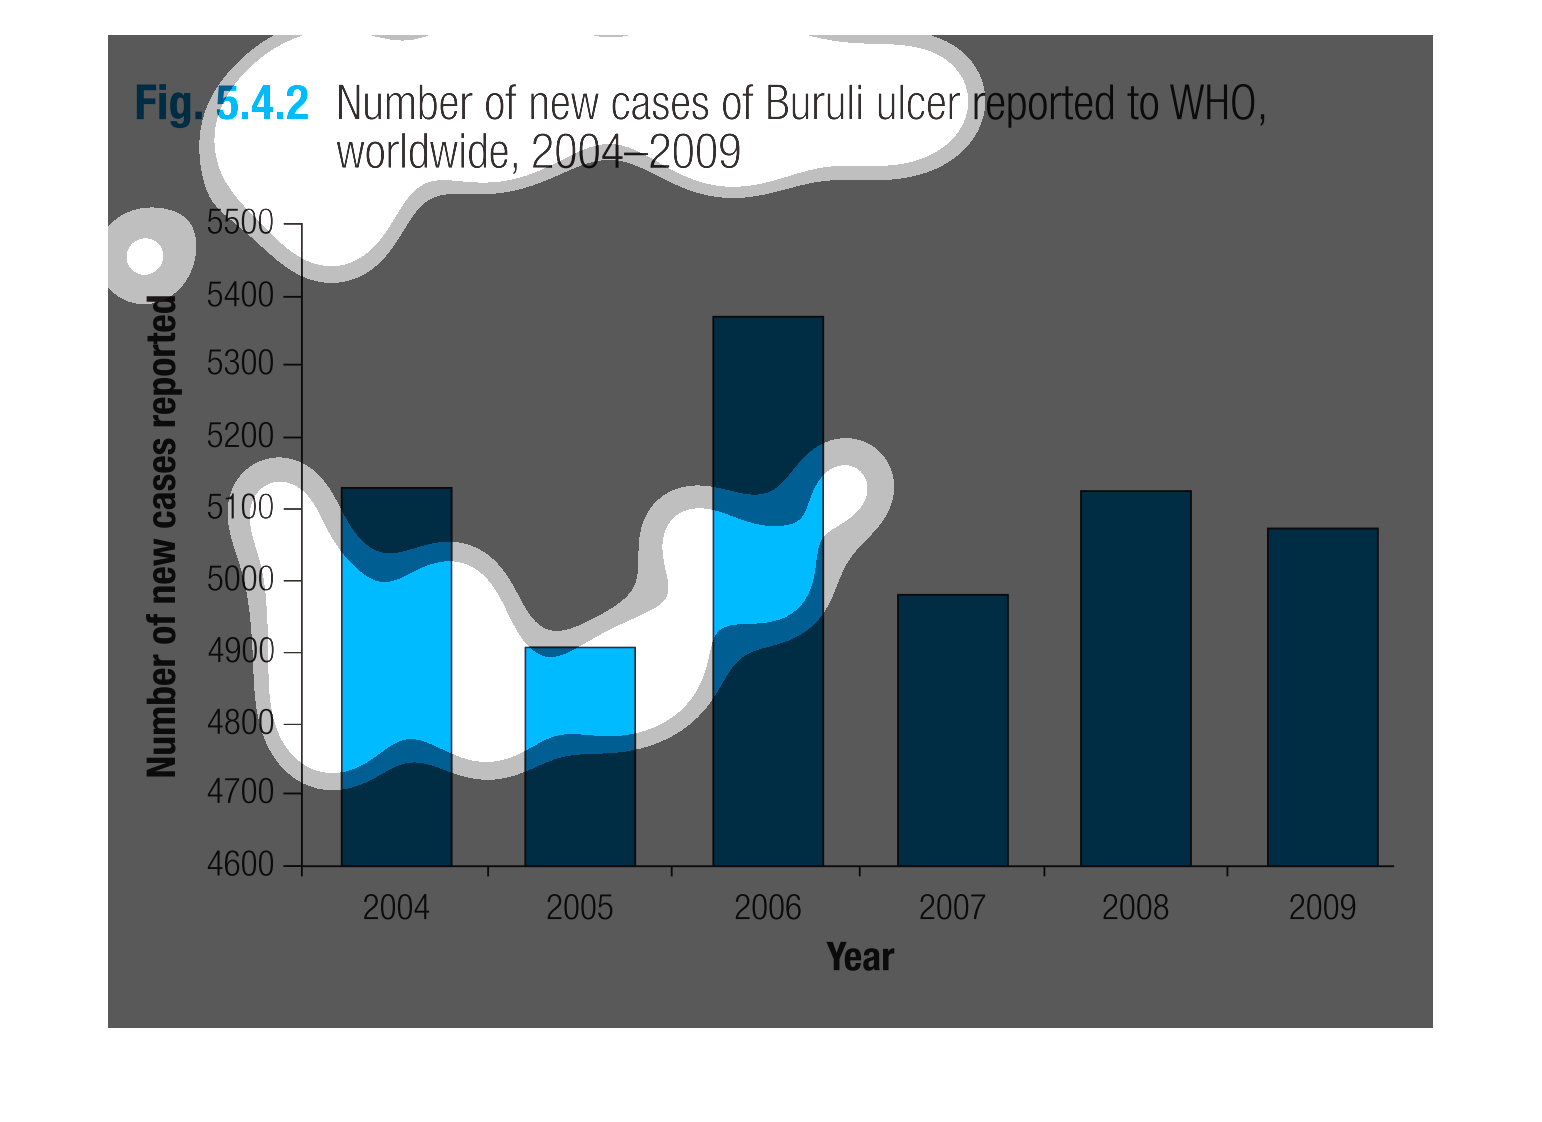
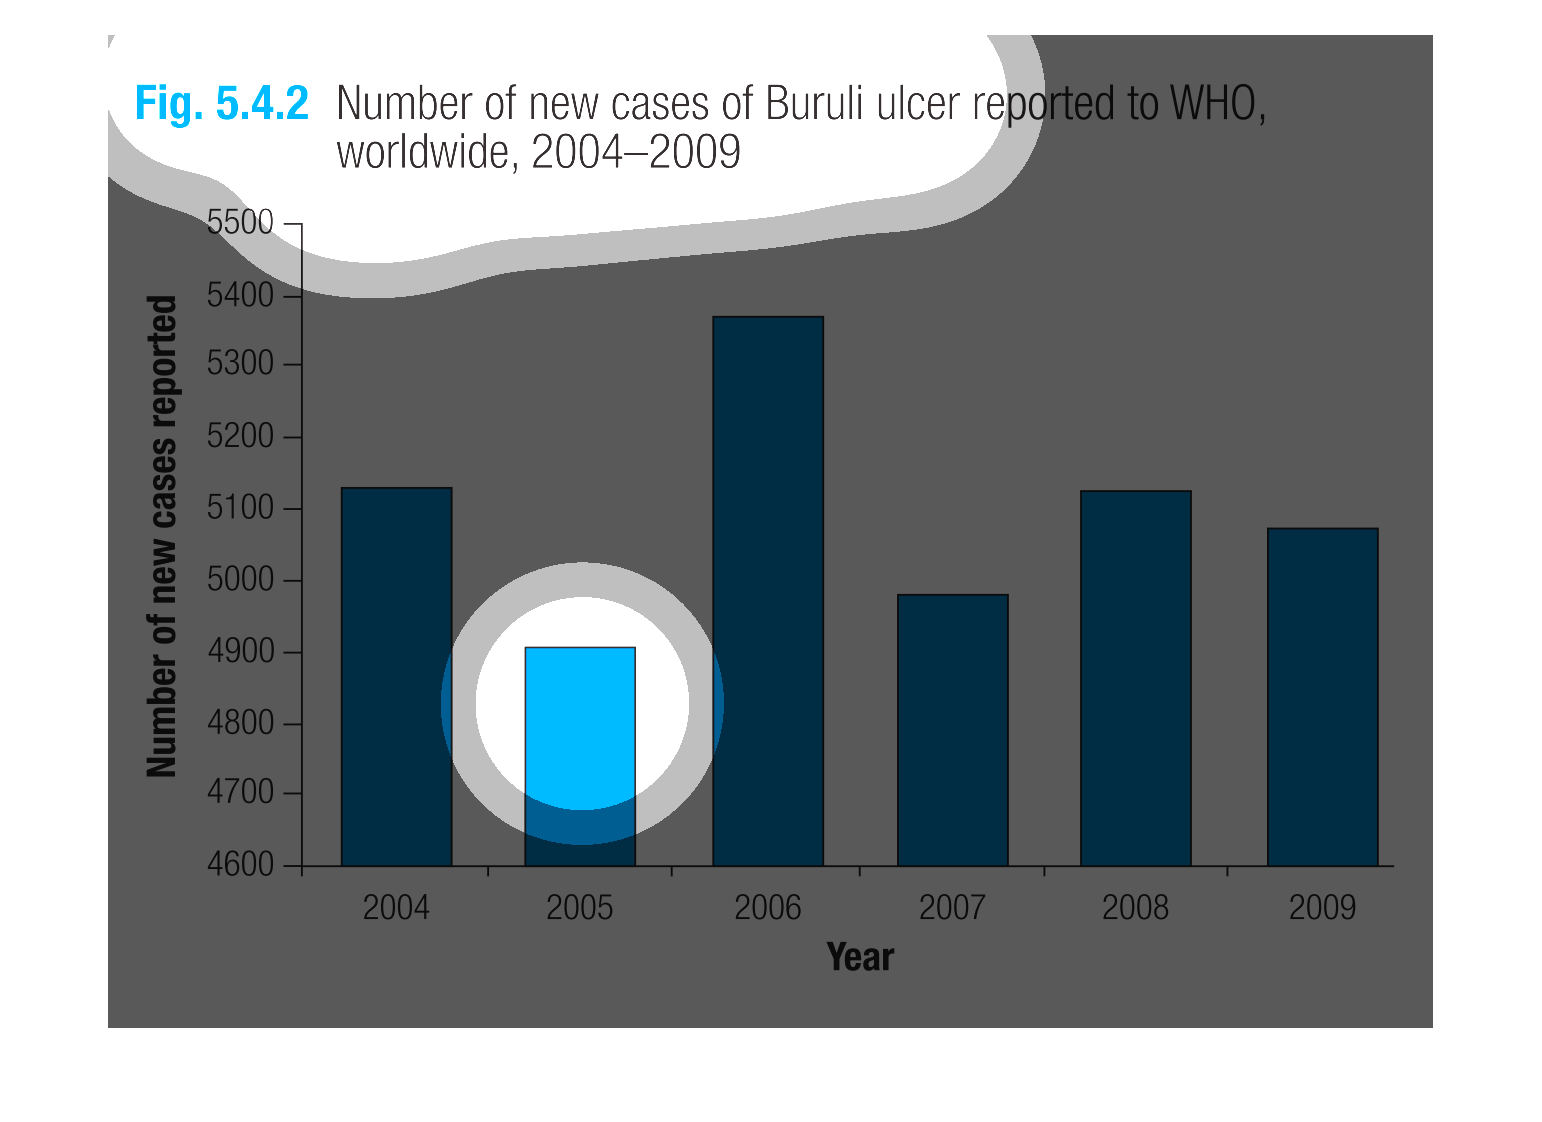
This chart shows the number of new cases of Buruli ulcer reported to WHO worldwide from 2004-2009.
 It specifically shows a large upswing in reports in 2006 with a total well above all other
years at close to 5400.    The lowest year of reports was 2005 with roughly 4900 cases reported.
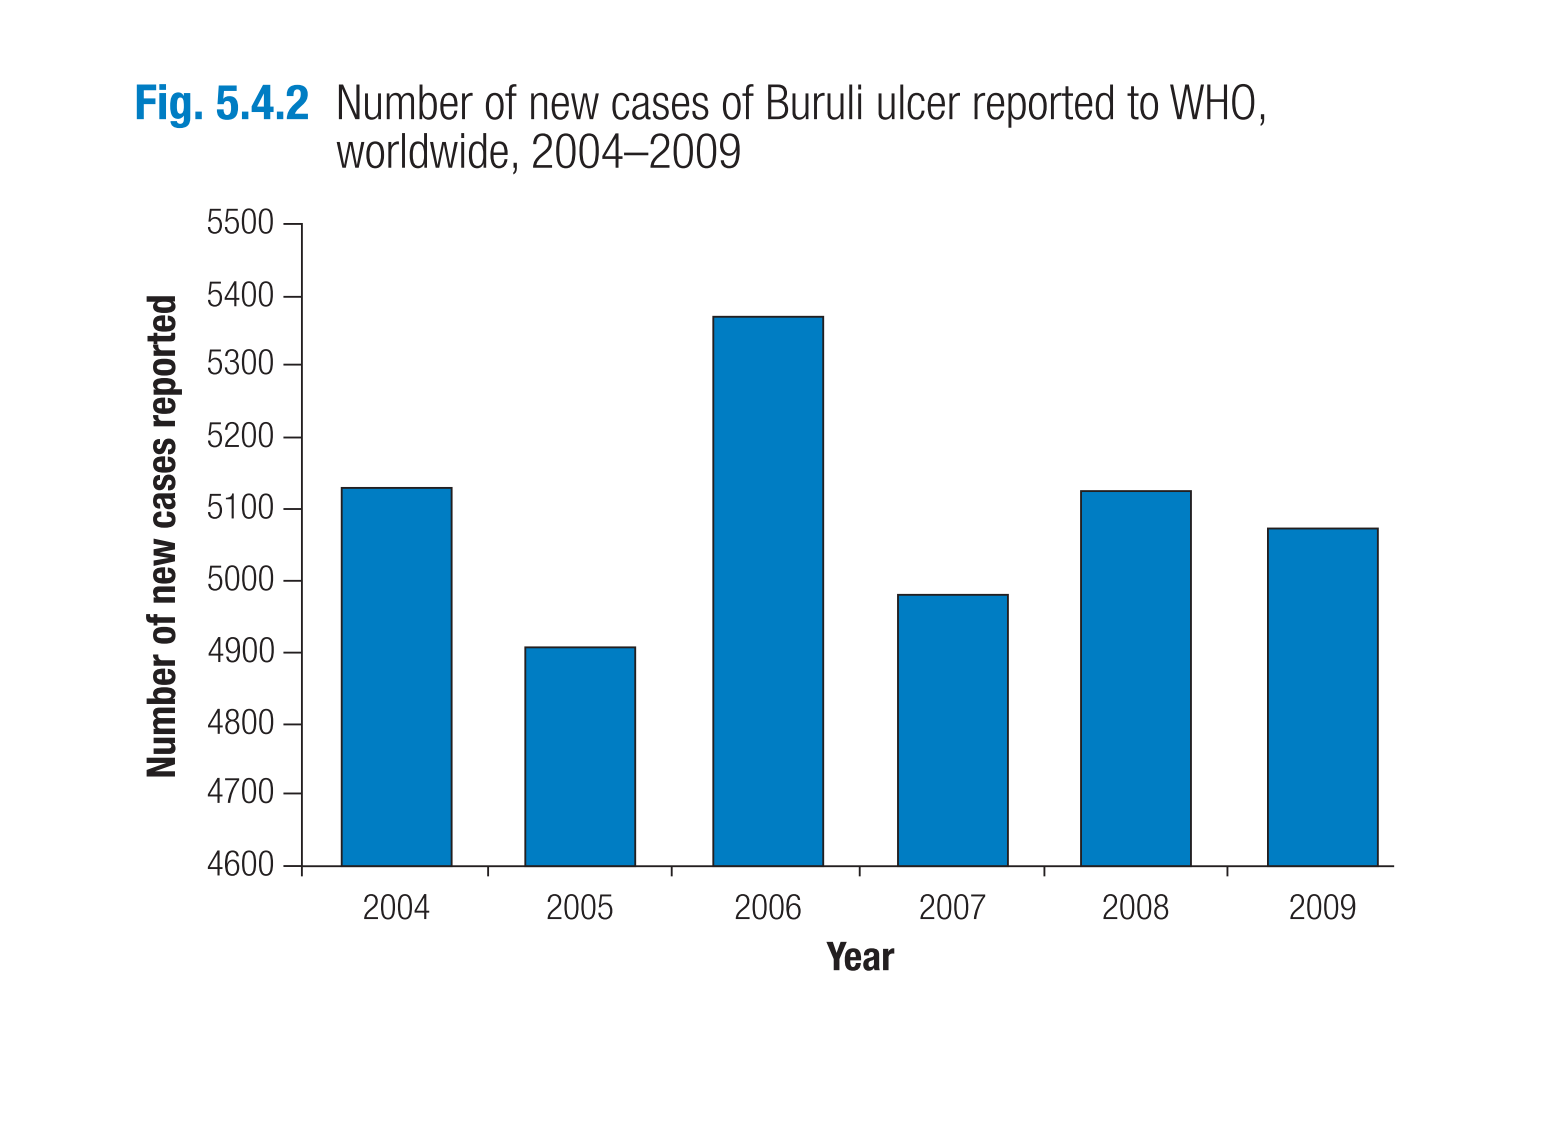
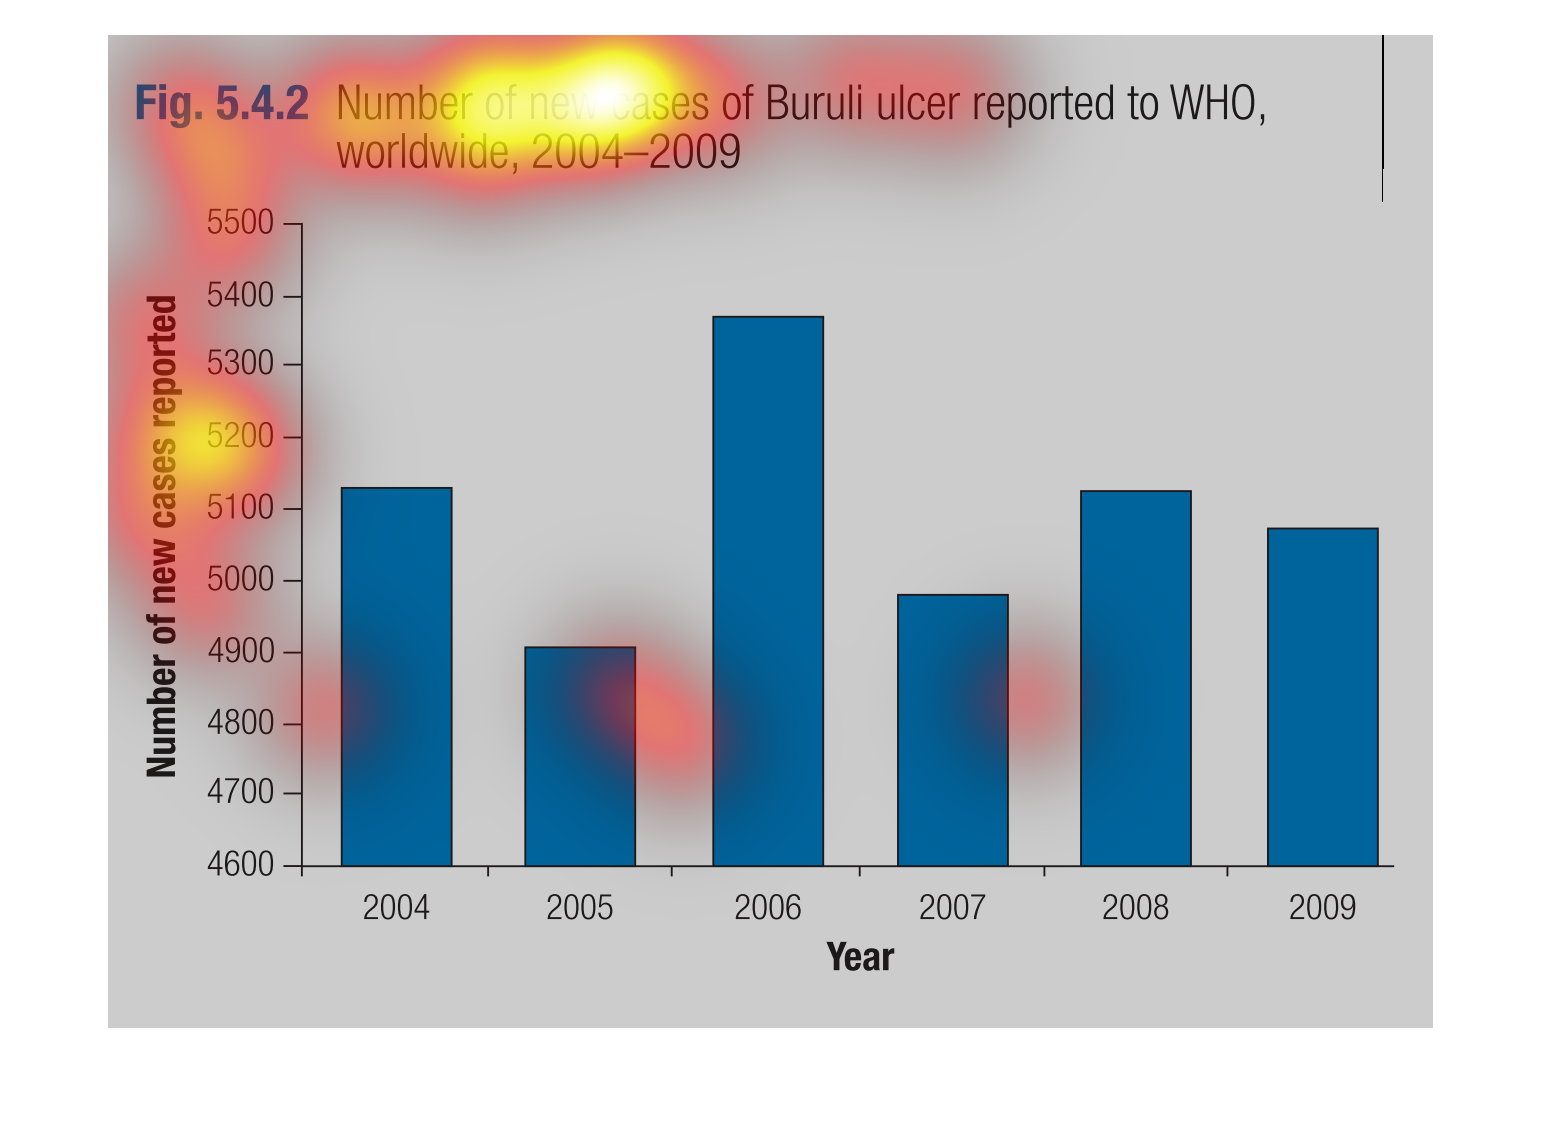
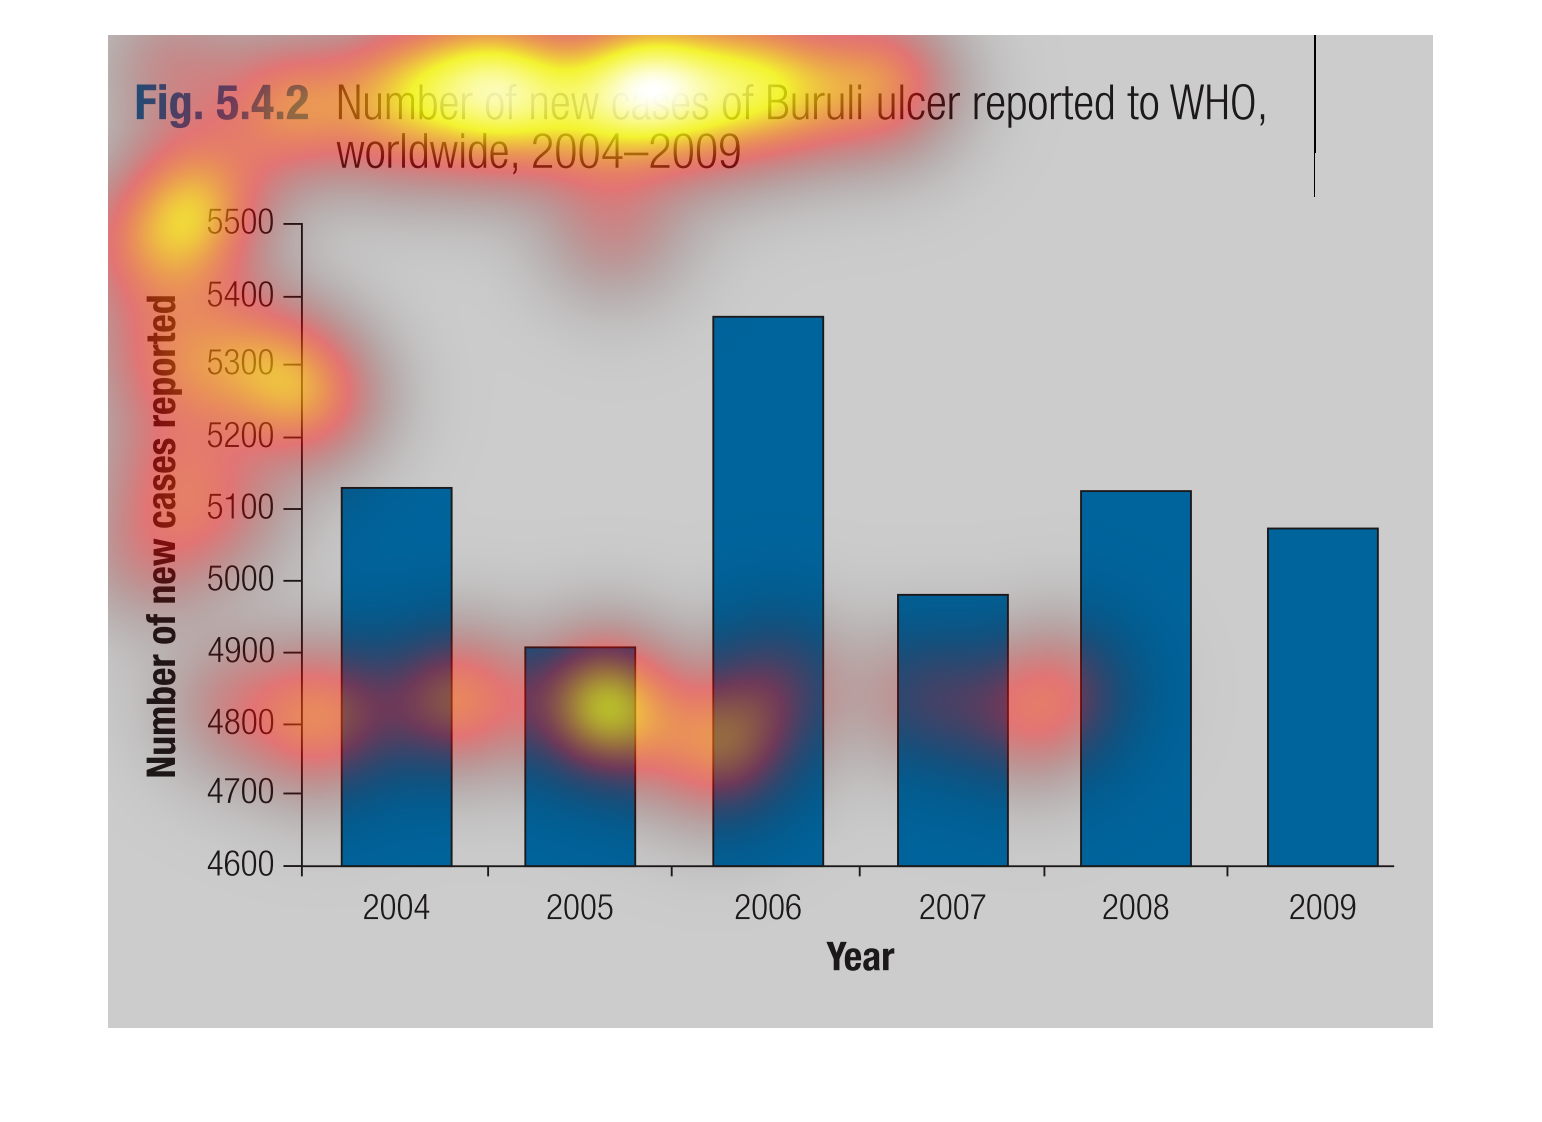
This is a bar chart of the number of Buruli ulcer reported to WHO worldwide from 2004 to 2009.
The data goes up and down between 5400 and 4900 without any real trend. There is a spike in
2006.The Average is somewhere around 5100.
A bar chart infographic showing the number of new cases of buruli ulcers reported to the world
health organization. Showing up and downs from 2000 to 2009