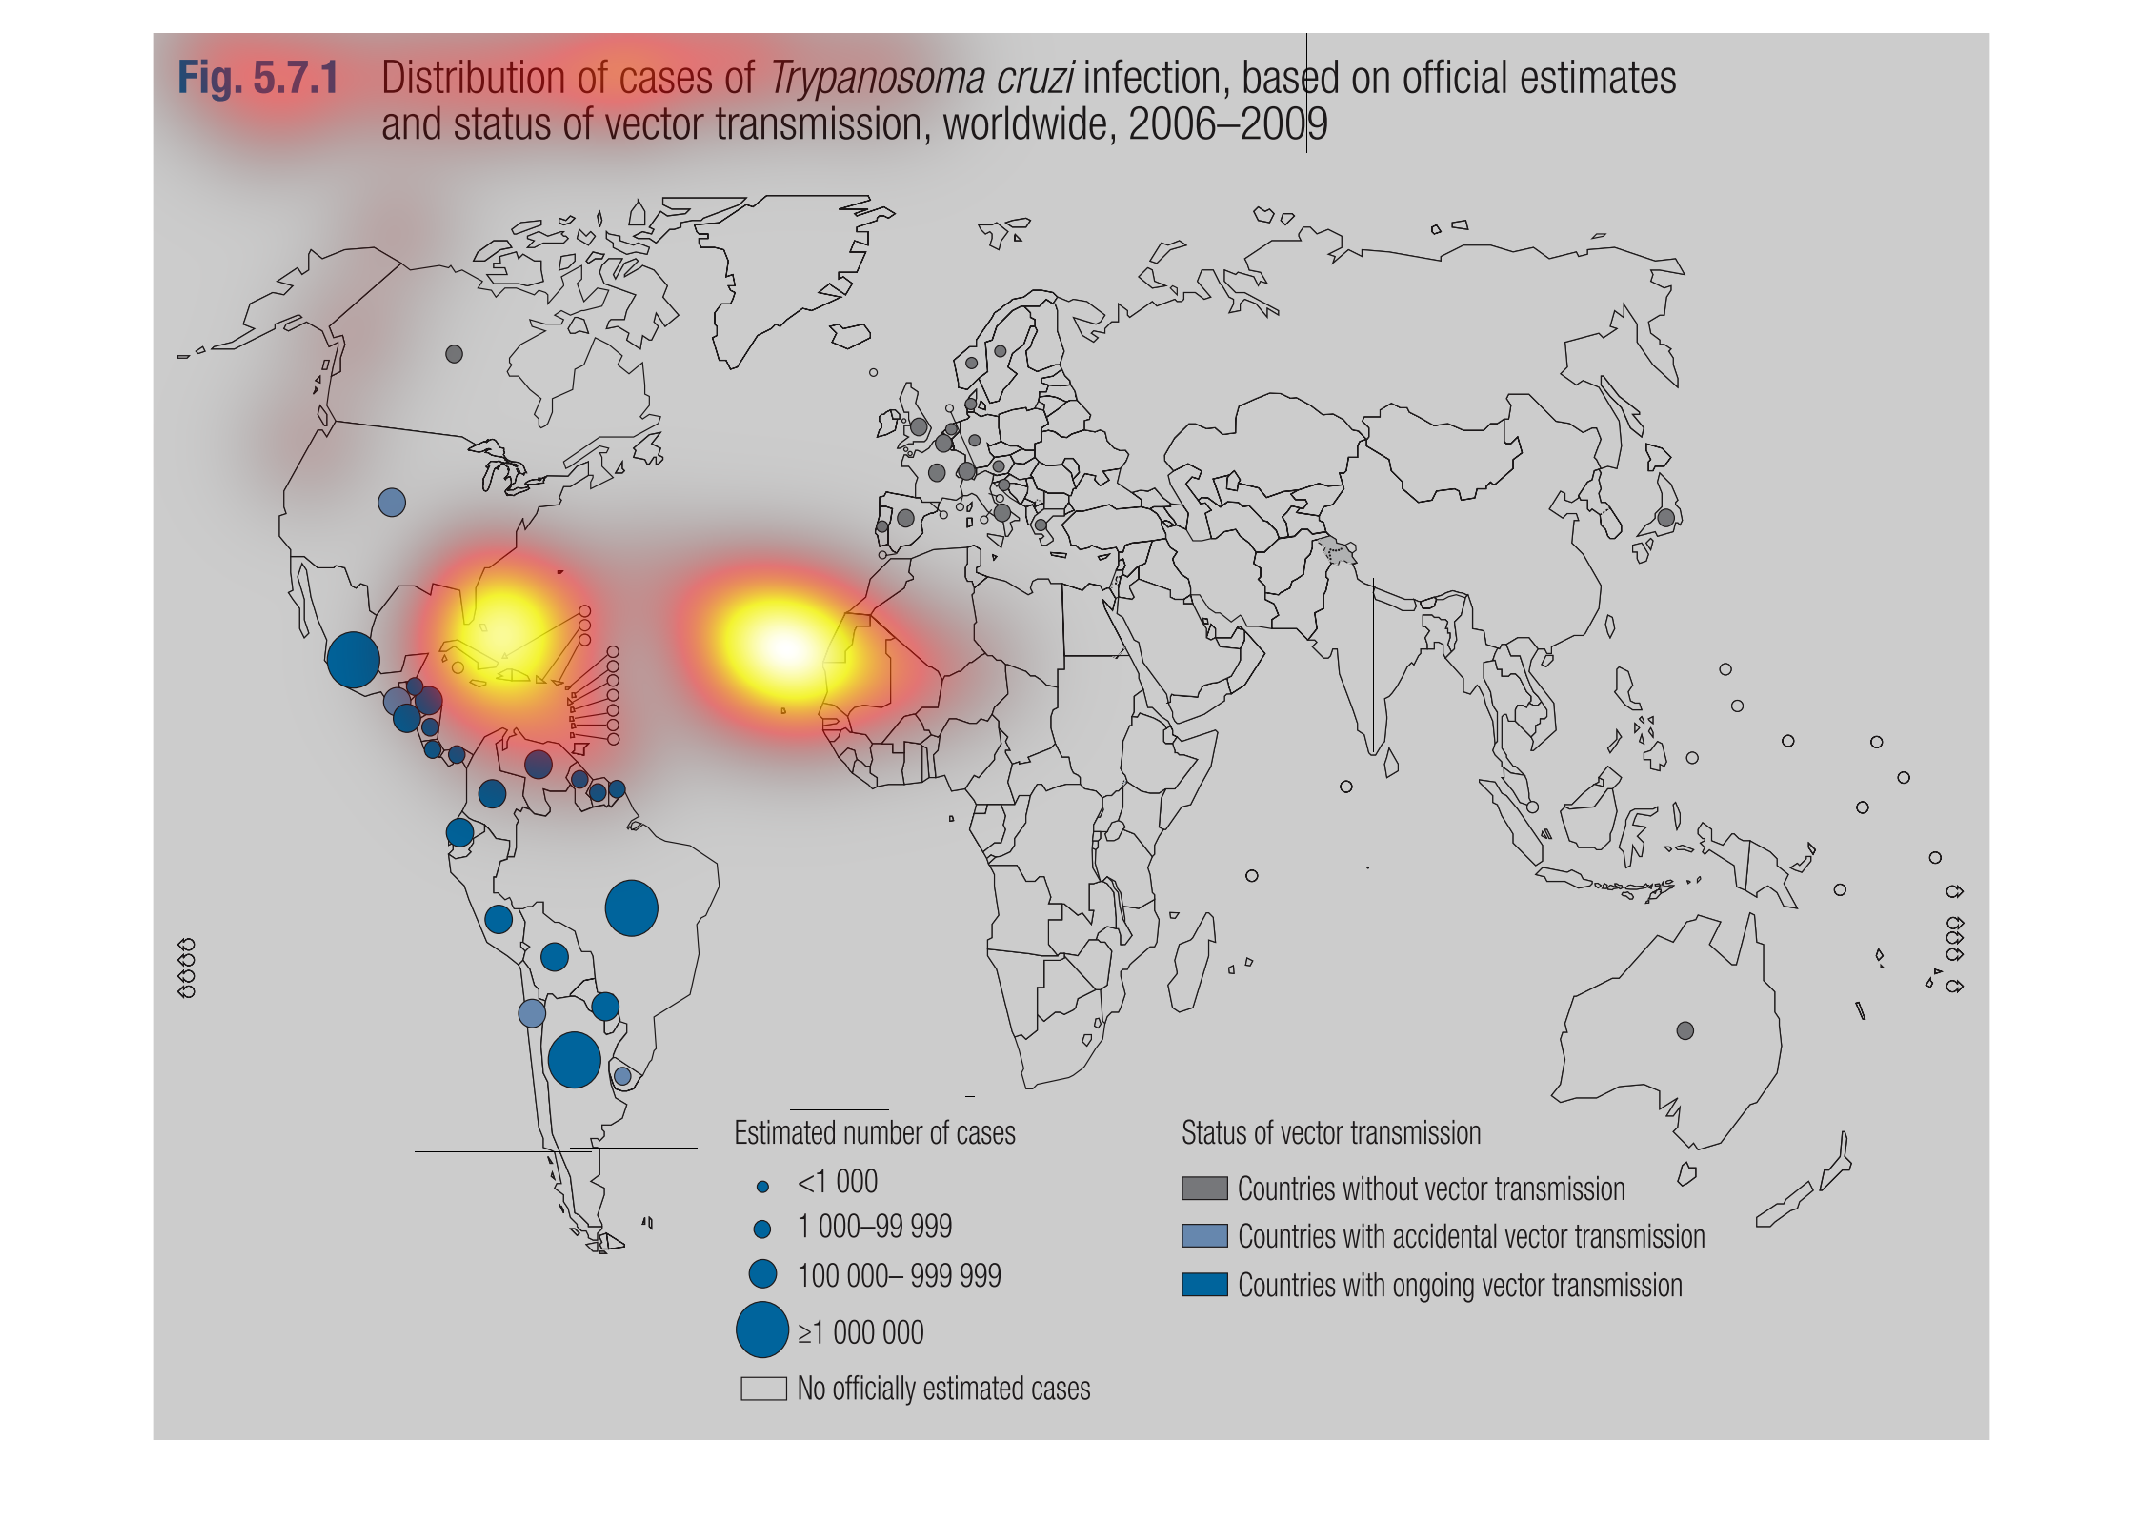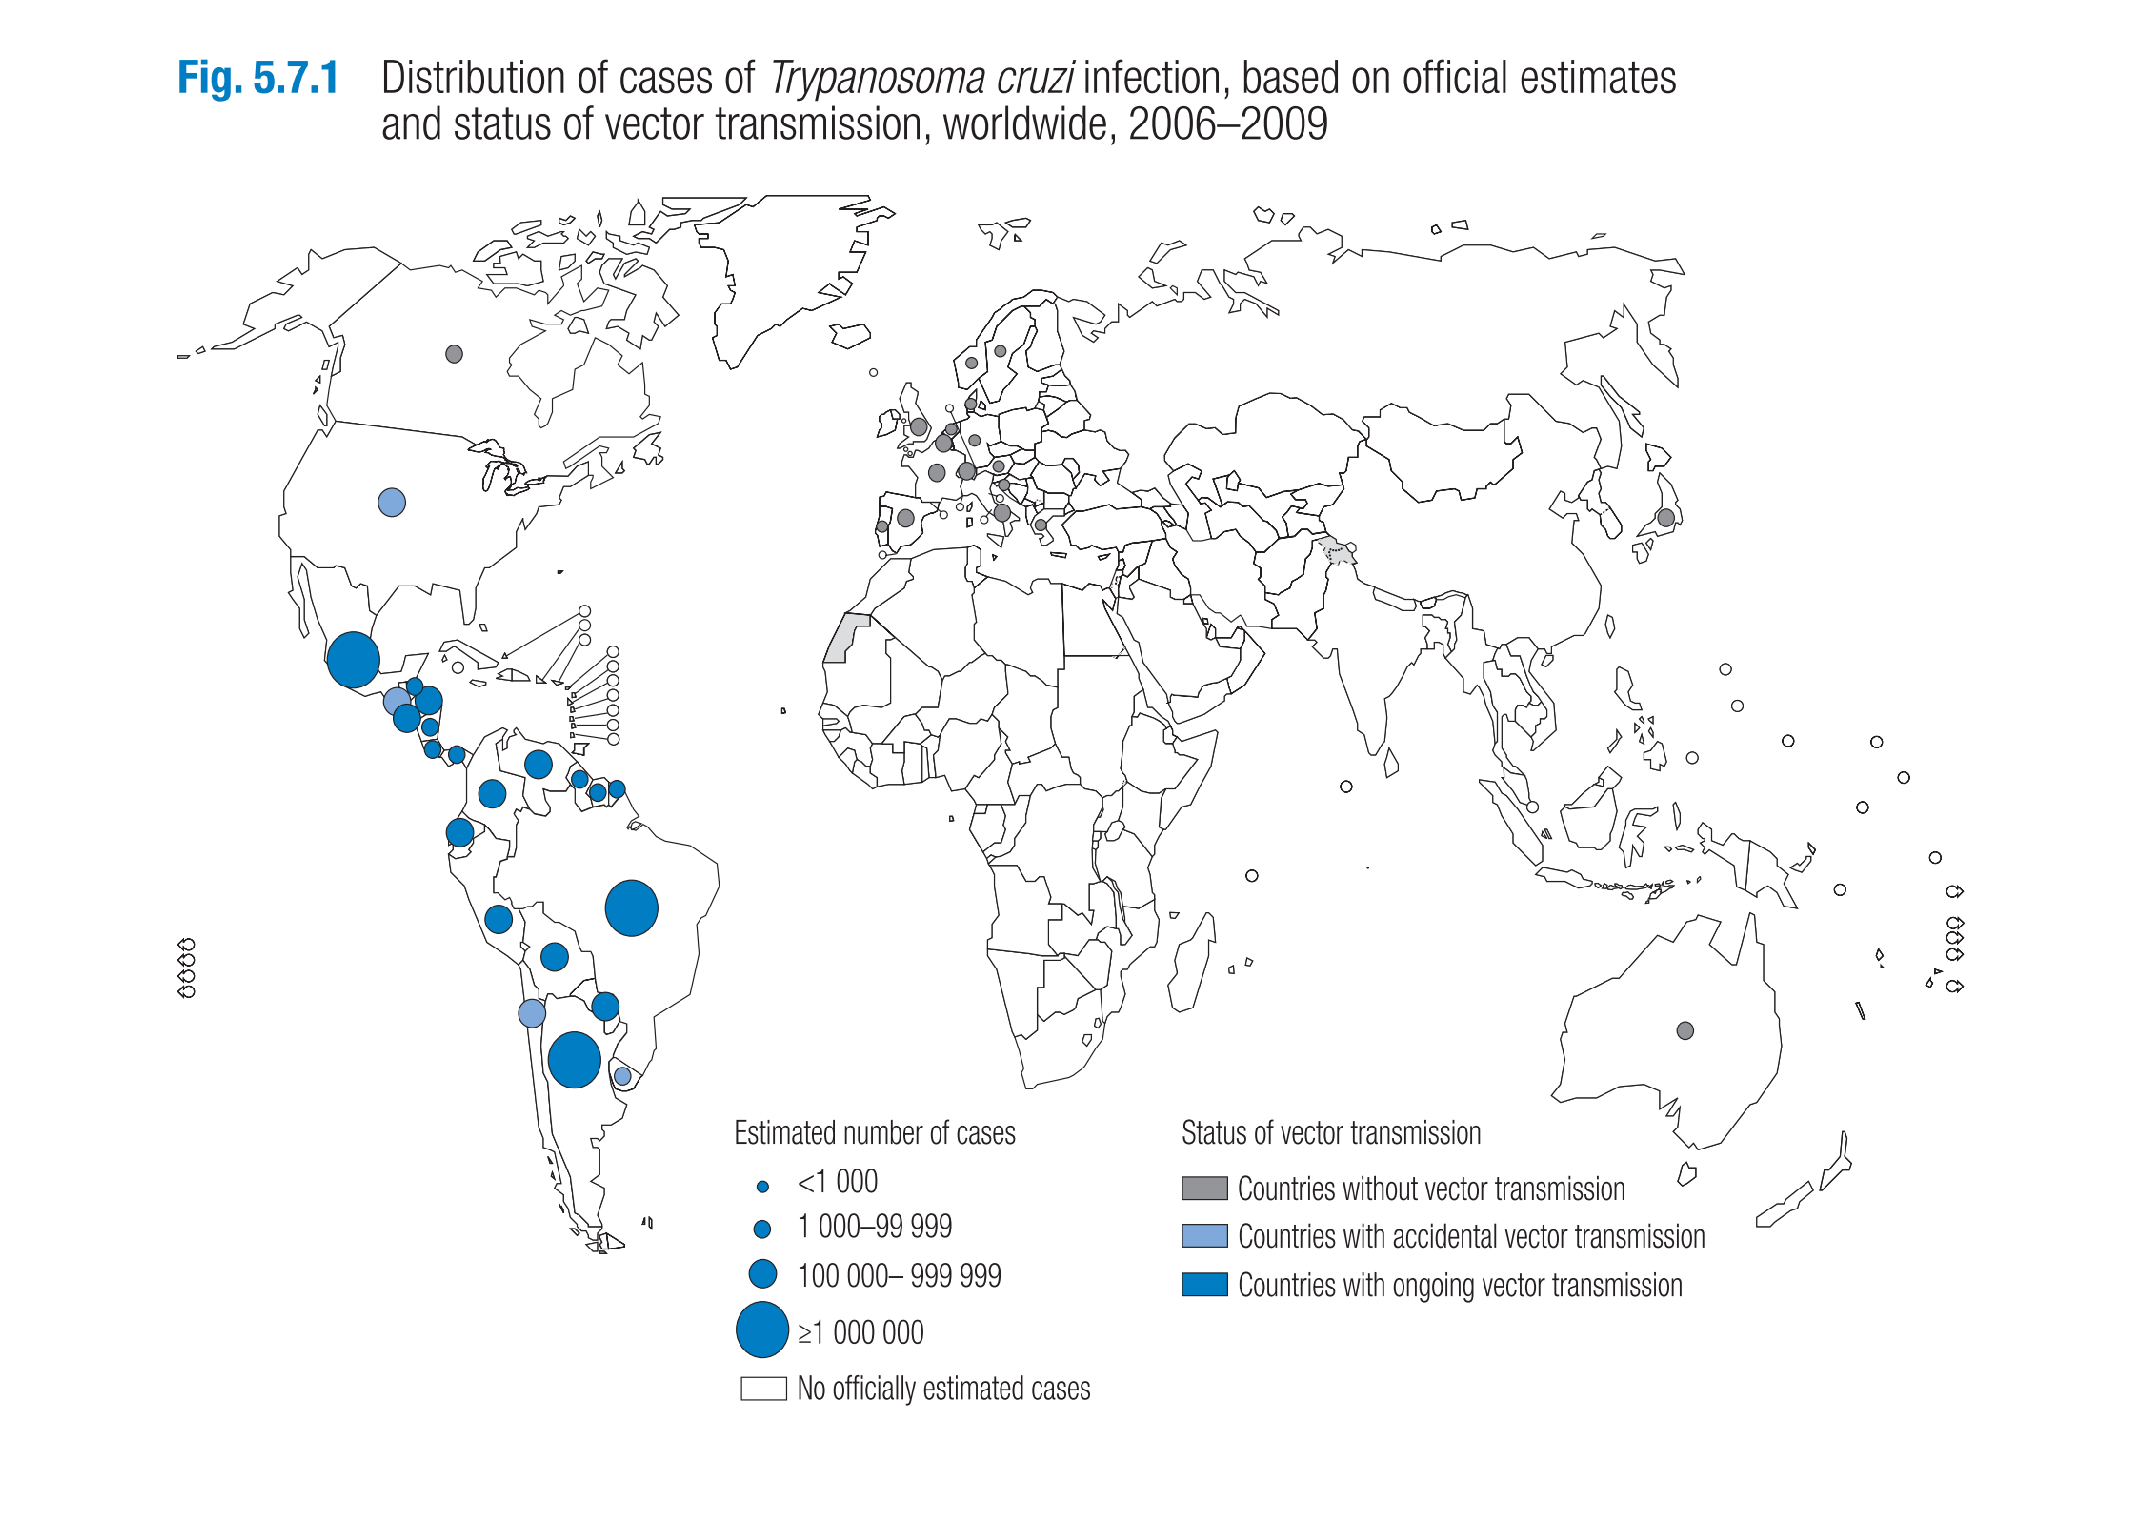
This chart describes distribution of cases of Trypanosoma cruzi infection, based on official
estimates and status of vector transmission, worldwide, for the years 2006-2009.
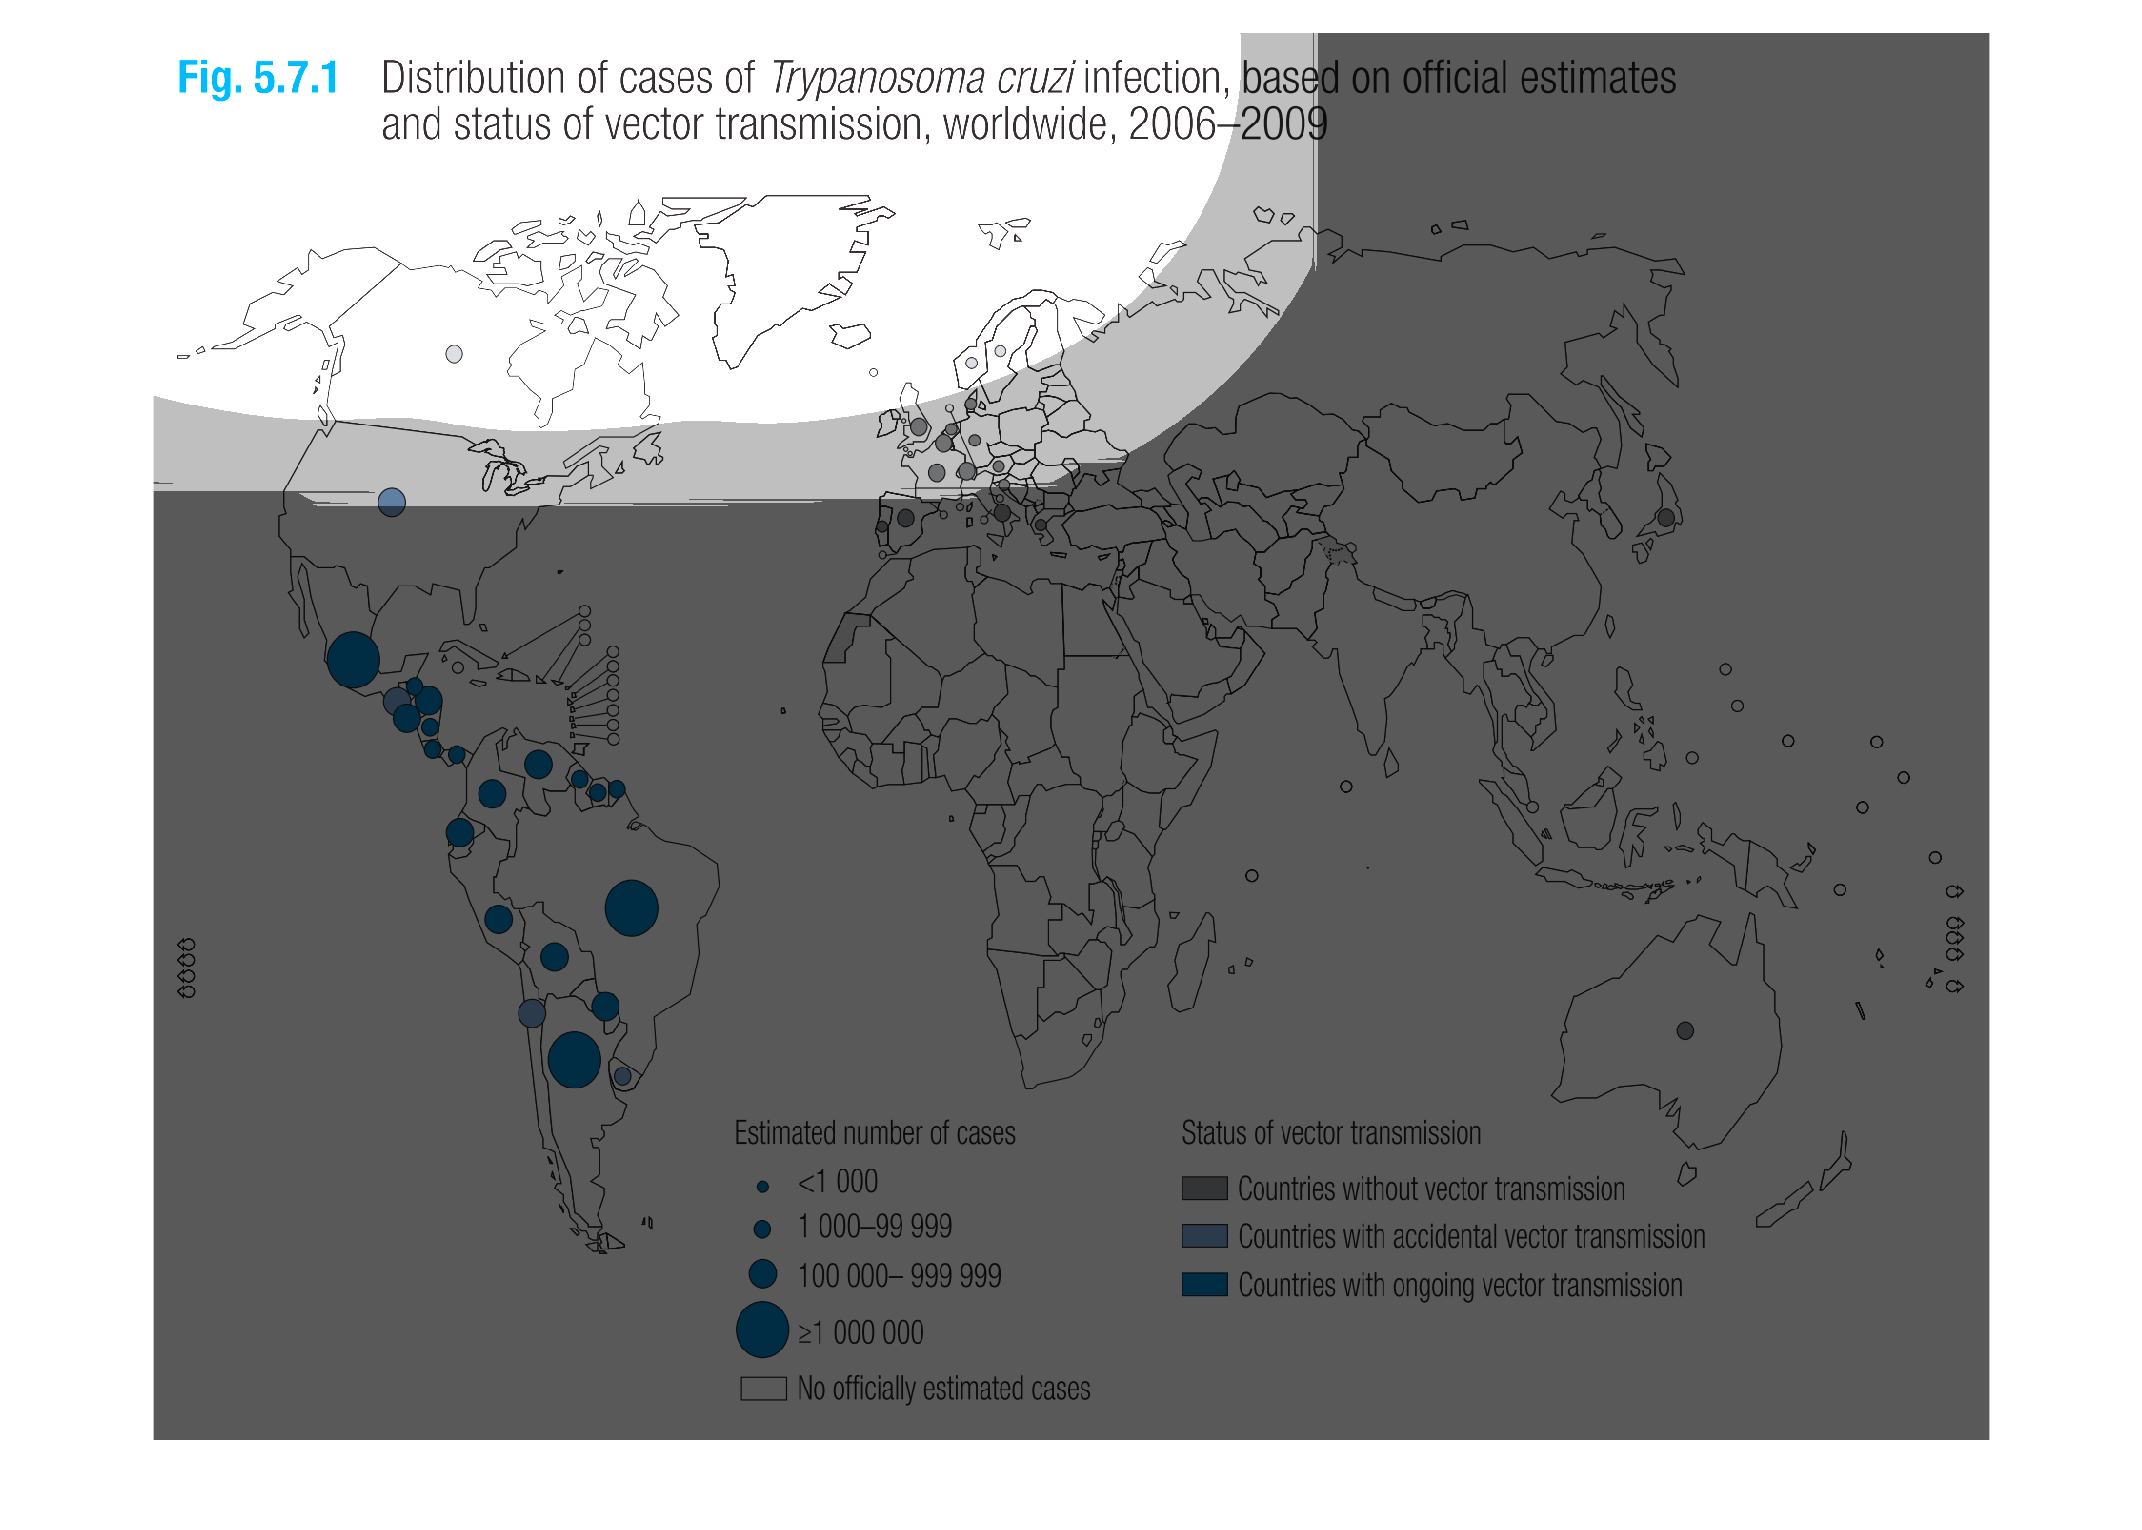
This graph shows the infection of trypanosoma cruzi infection worldwide in the years of 2006-2009.
It also shows status of vector transmission worldwide.
This is a graphical and color coded global map depicting  the distribution of cases of Trypanosoma
Cruzi infections based on official estimates and status of vector transmission from the years
2006-2009.
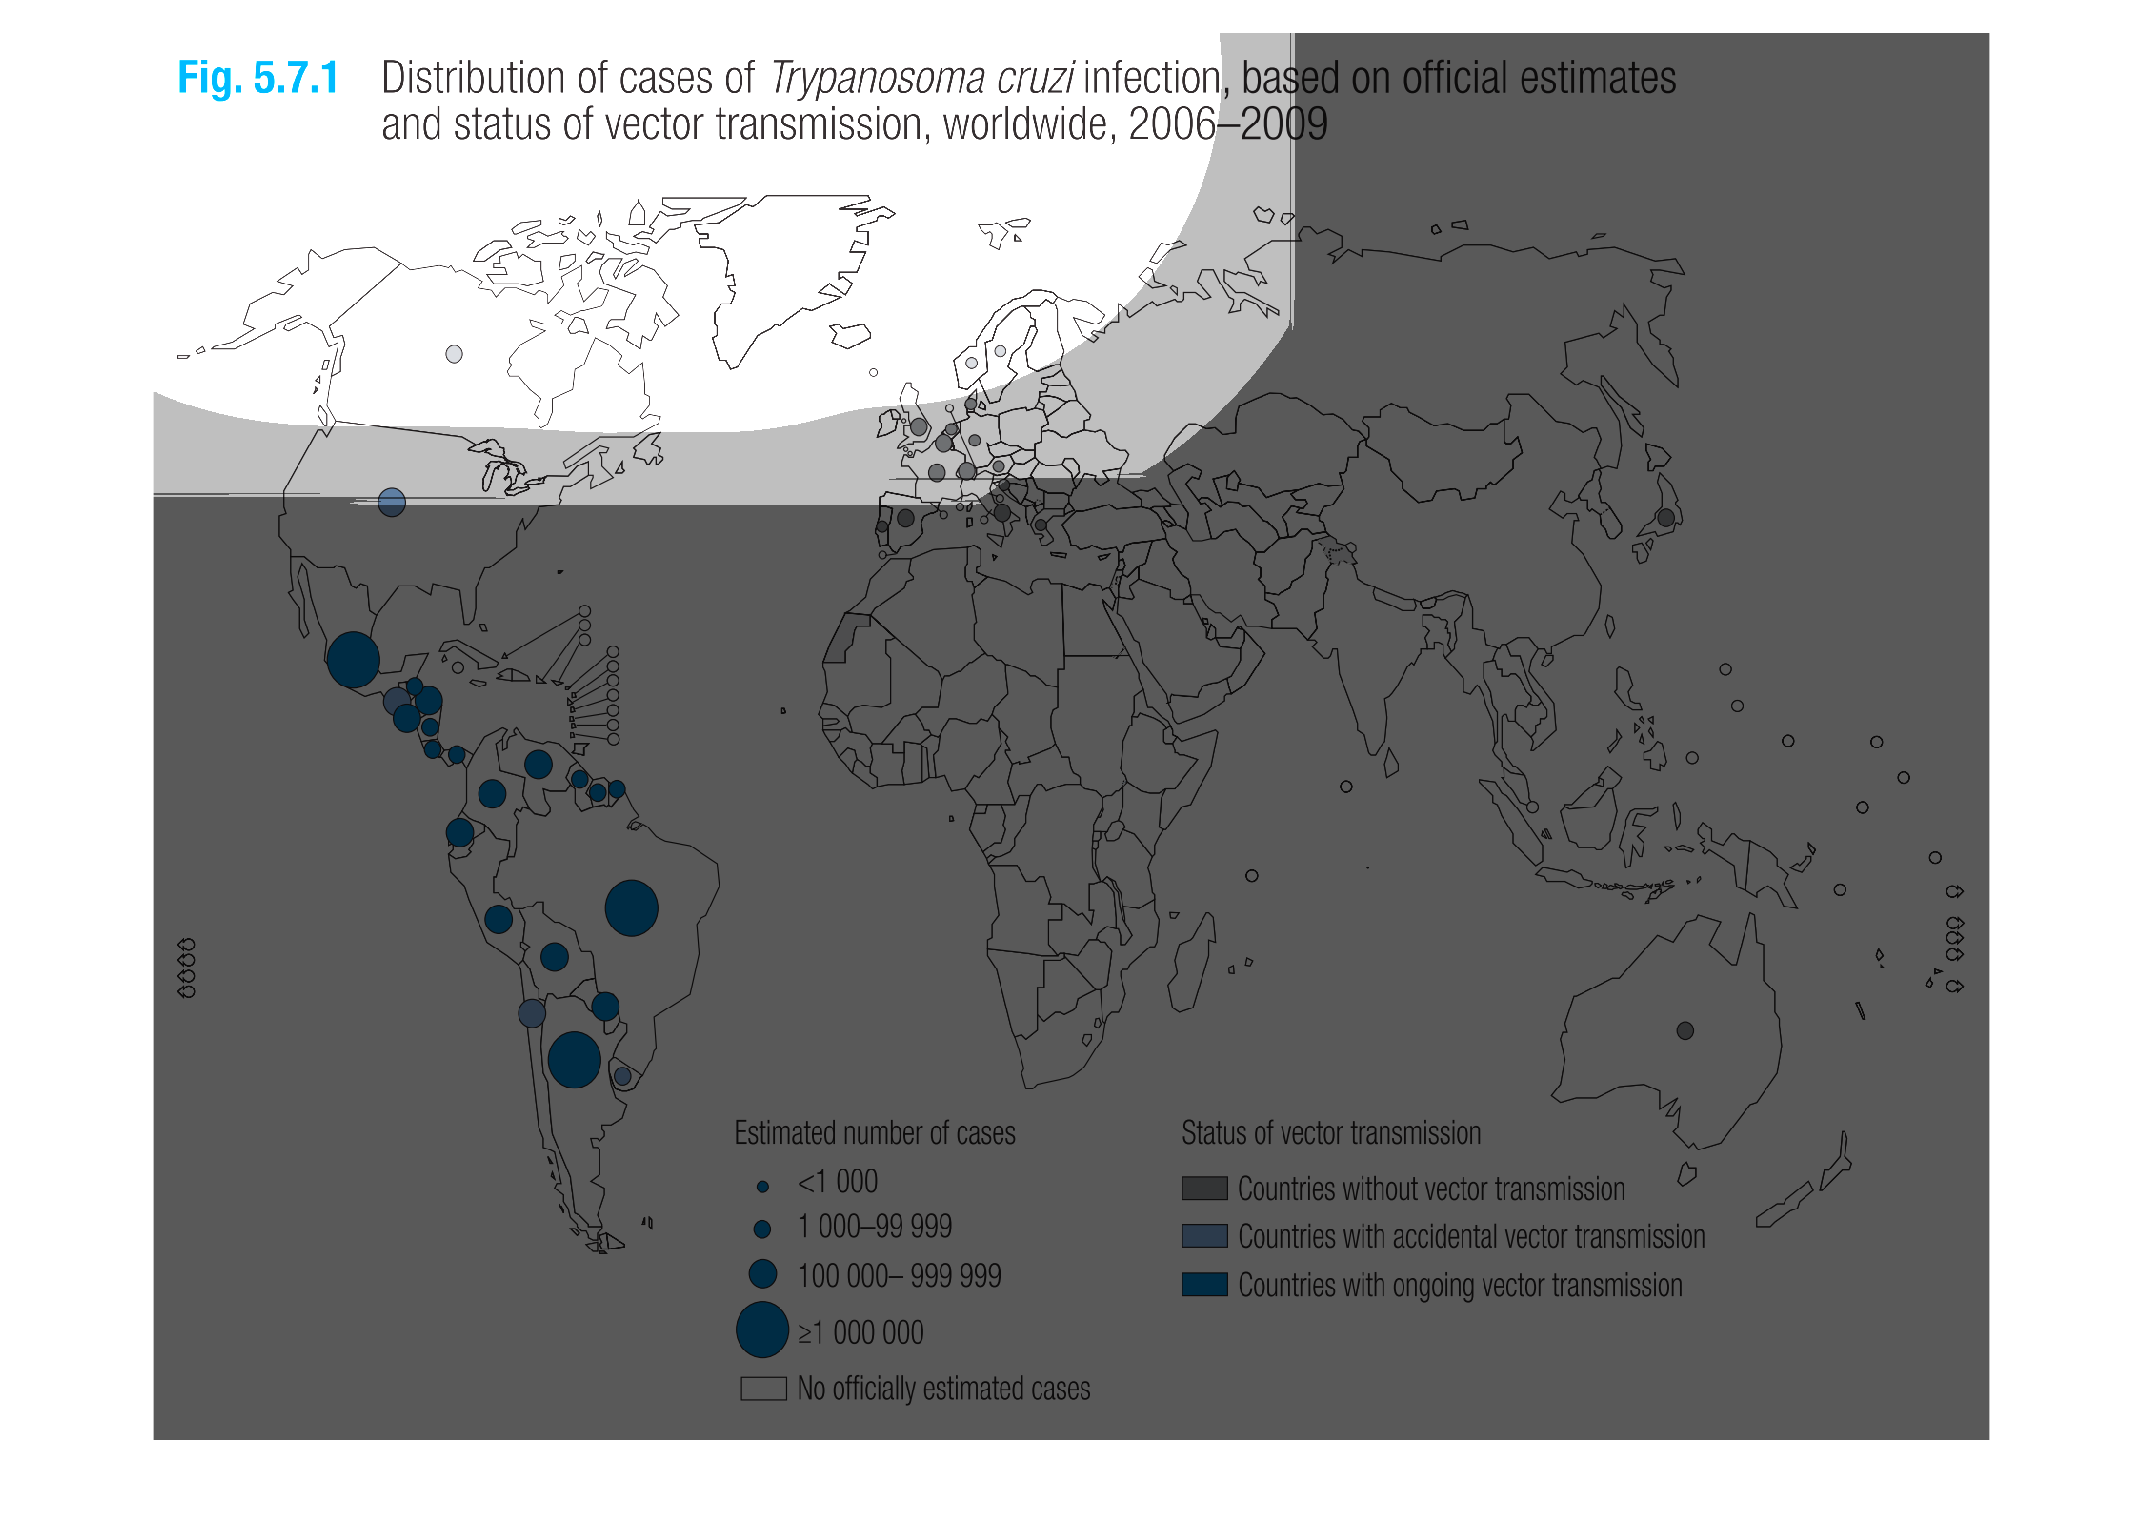
Figure 5.7.1 Shows distribution of Trypanosoma cruzi infection based on official estimates
and status of vector transmission worldwide 2006-2009. Most affected area appears to be the
countries south of the U.S.
The figure presented is titled Distribution of cases of Trypanosoma cruzi infections based
on the official estimates and status of vector transmission, worldwide.
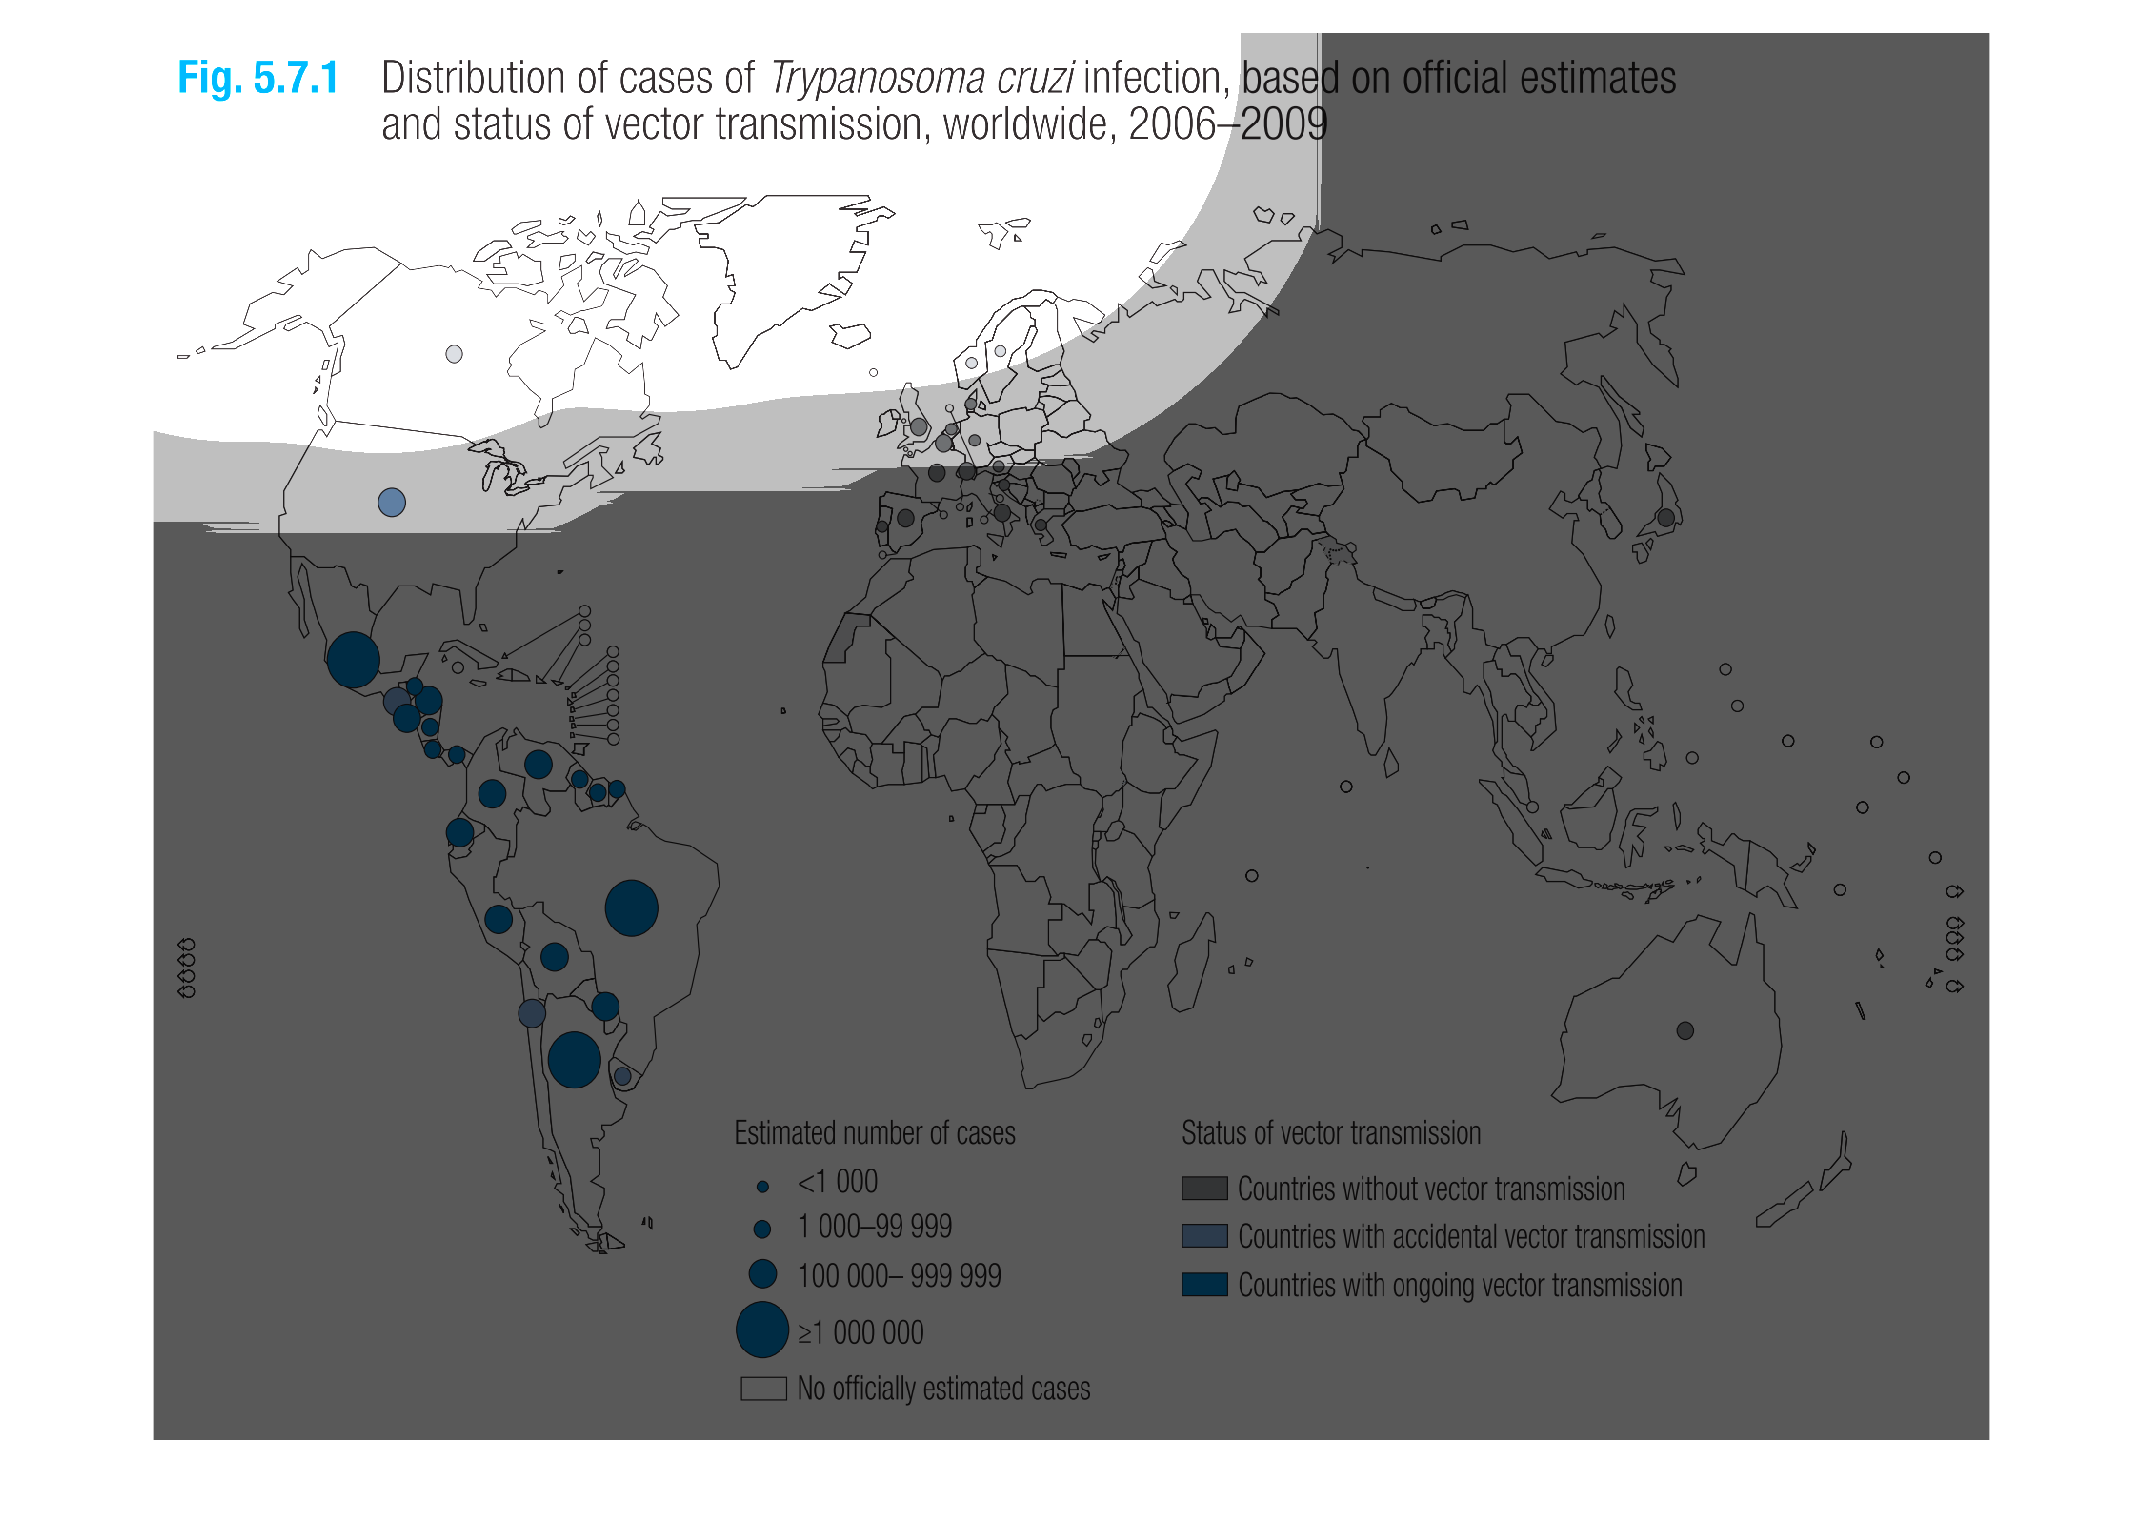
figure 5.7.1 distribution of cases of trypanosoma cruzi infection based on official estimates
and status of vector transmission worldwide 2006 through 2009. Biggest prevalence shown in
mexico and south america, nearly non existent in the rest of the world, few cases in the united
states, non vector transmissions in europe
A map of the world in black and white with continents rendered as lines. The only colors appearing
are blue dots that seem bunched in North and South America. These dots are estimated number
of cases pertaining to vector transmission of Trypanosoma Cruzi infection.
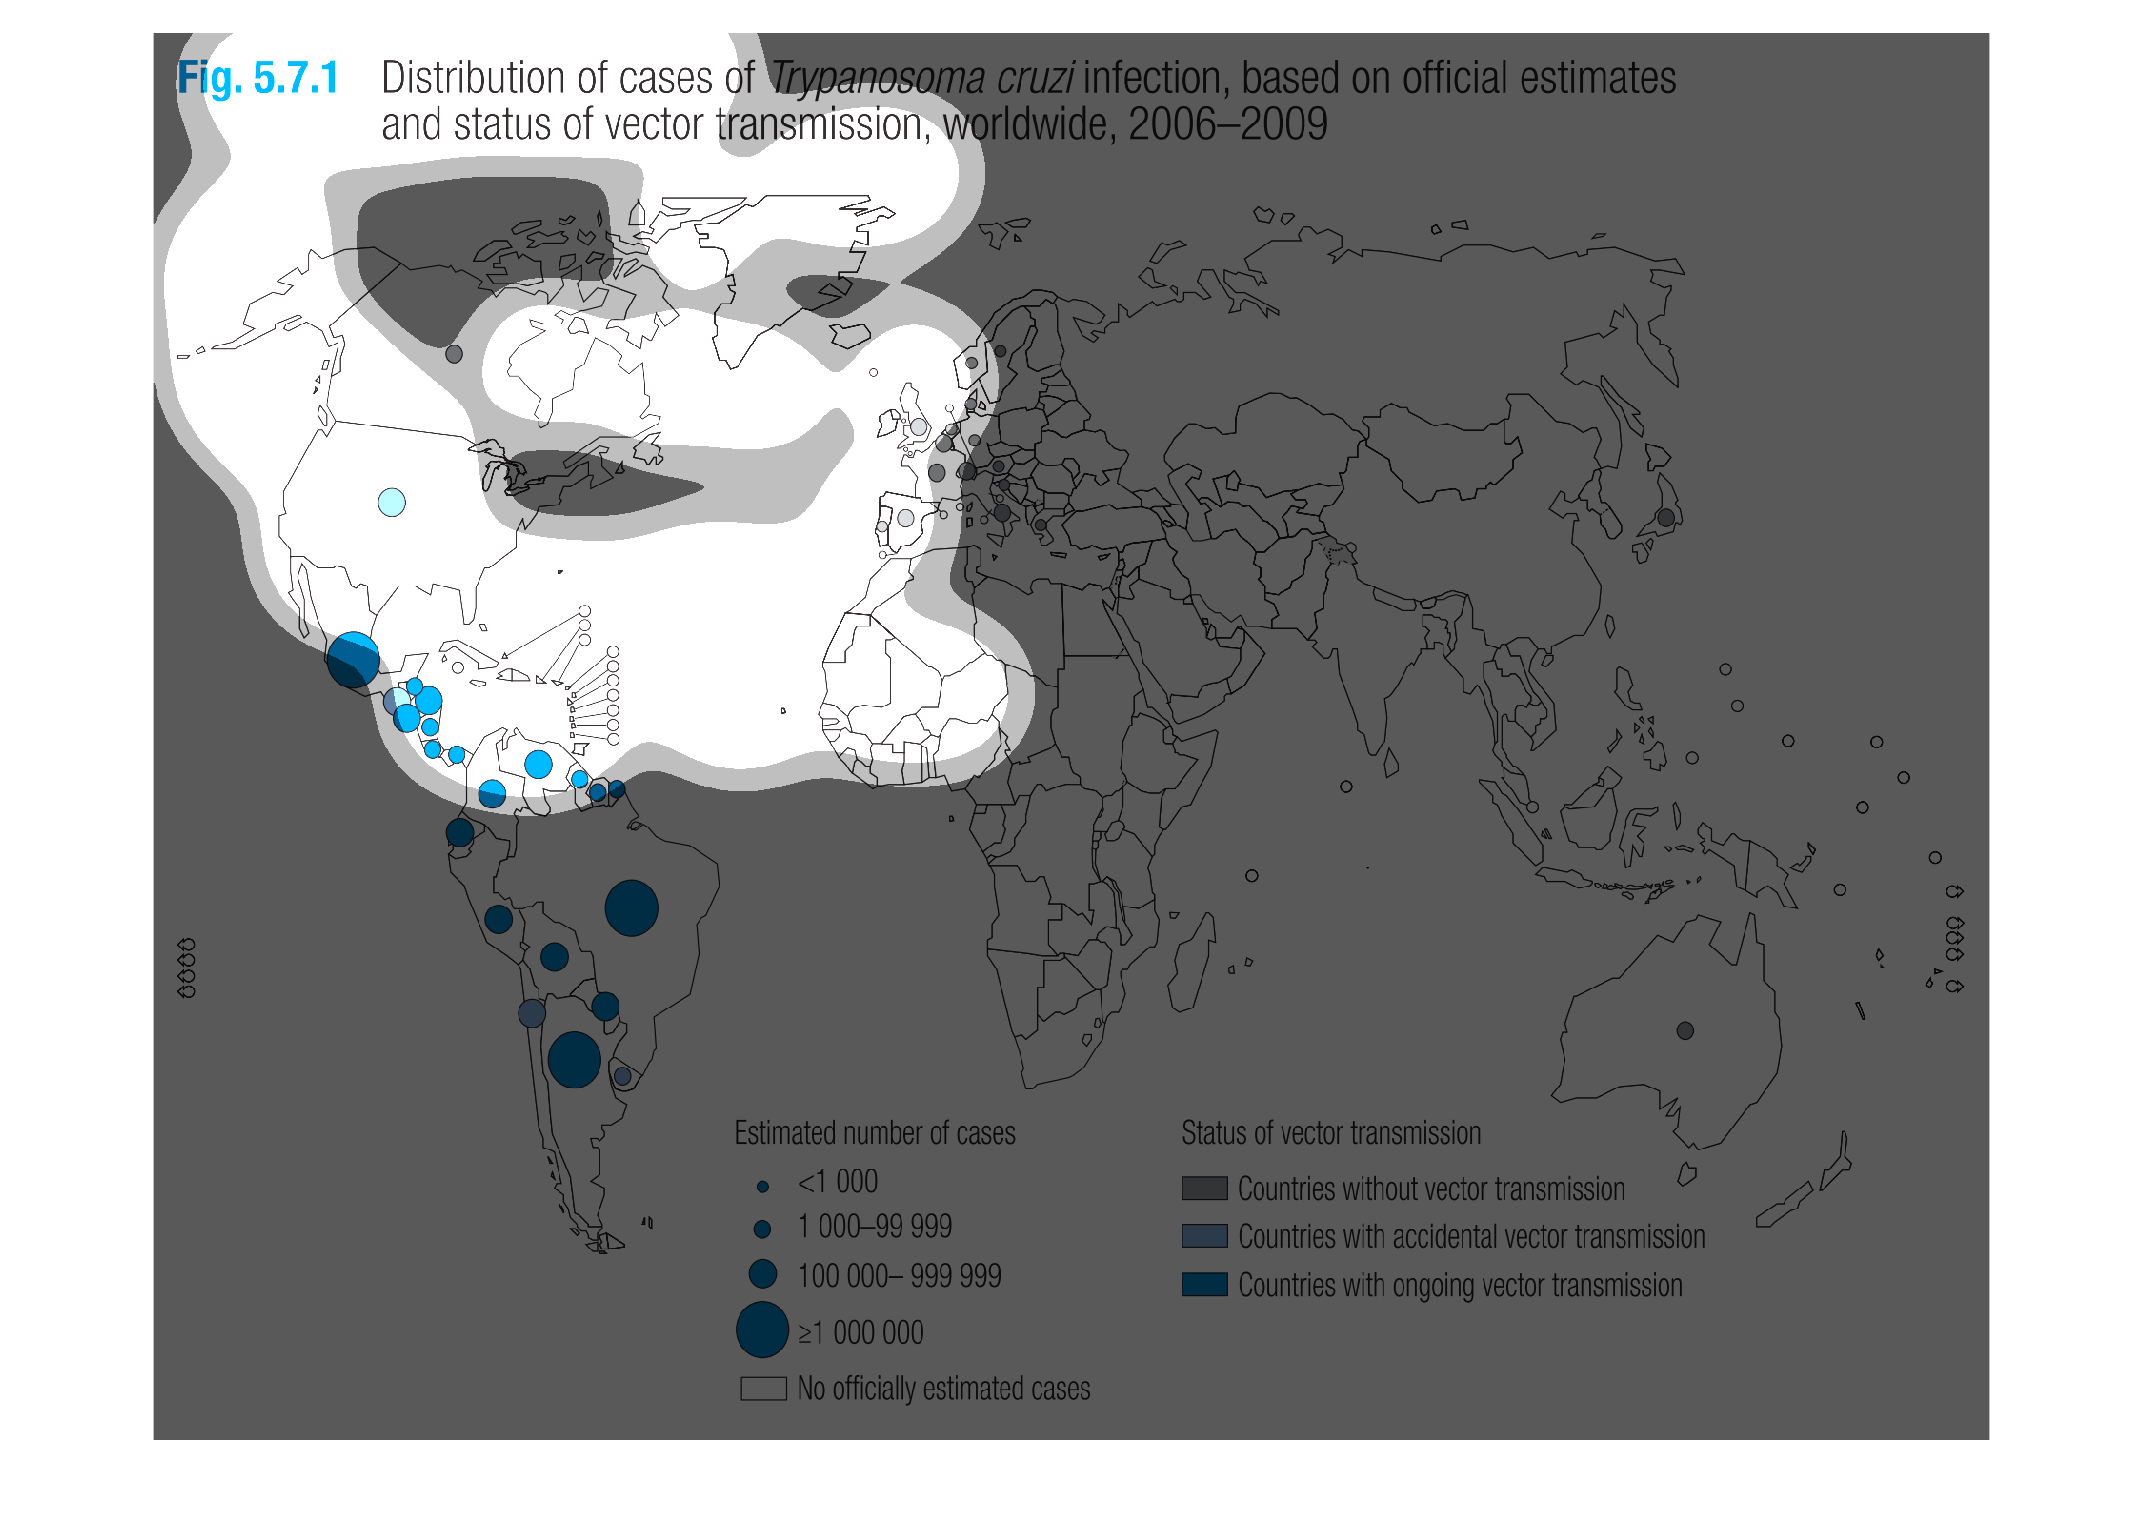
The following chart gives the number of cases of trypanosome cruzi infection based on official
estimates and status of vector of transmissions worldwide from 2006-2009.
This chart describes the amount of cases of trypannosoma cruzi infections and status of transmission
globally from 2006-2009.  Most infections occur in Mexico and south America.
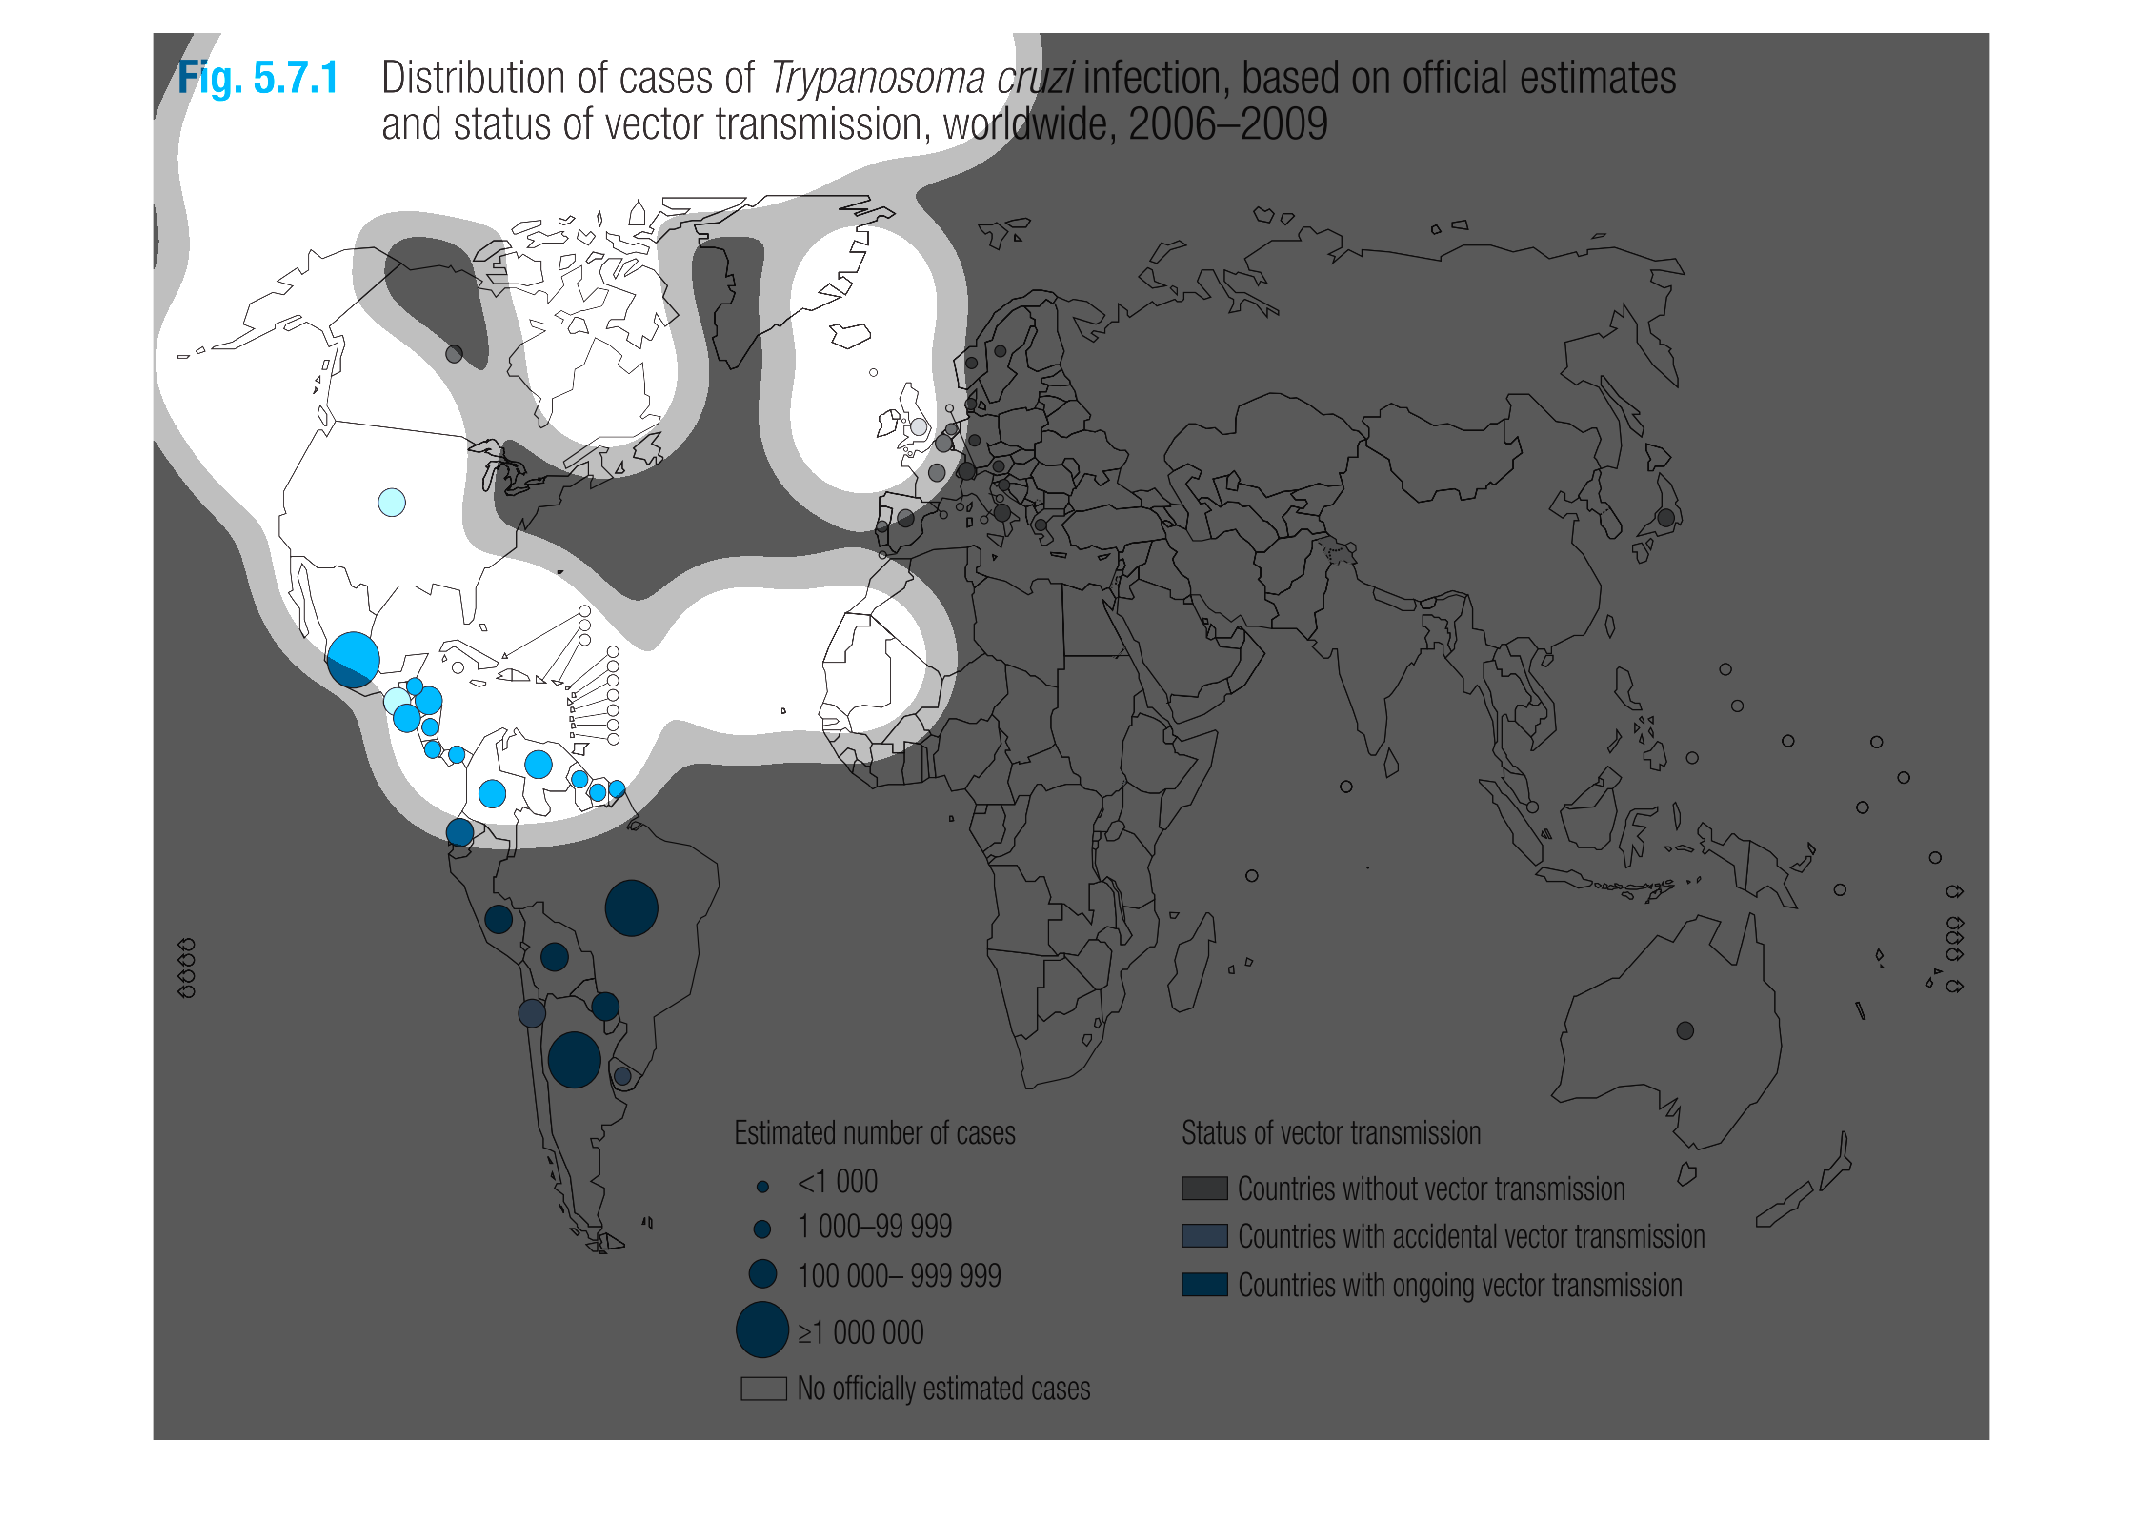
Chart showing distribution of cases of trypanosoma cruzi infection, based on official estimates
and status of vector transmission worldwide 2006 - 2009.
This chart shows the distribution of Trypanosoma cruzi infections. Areas in South America
are the highest as well as high areas in Mexico and Central America.
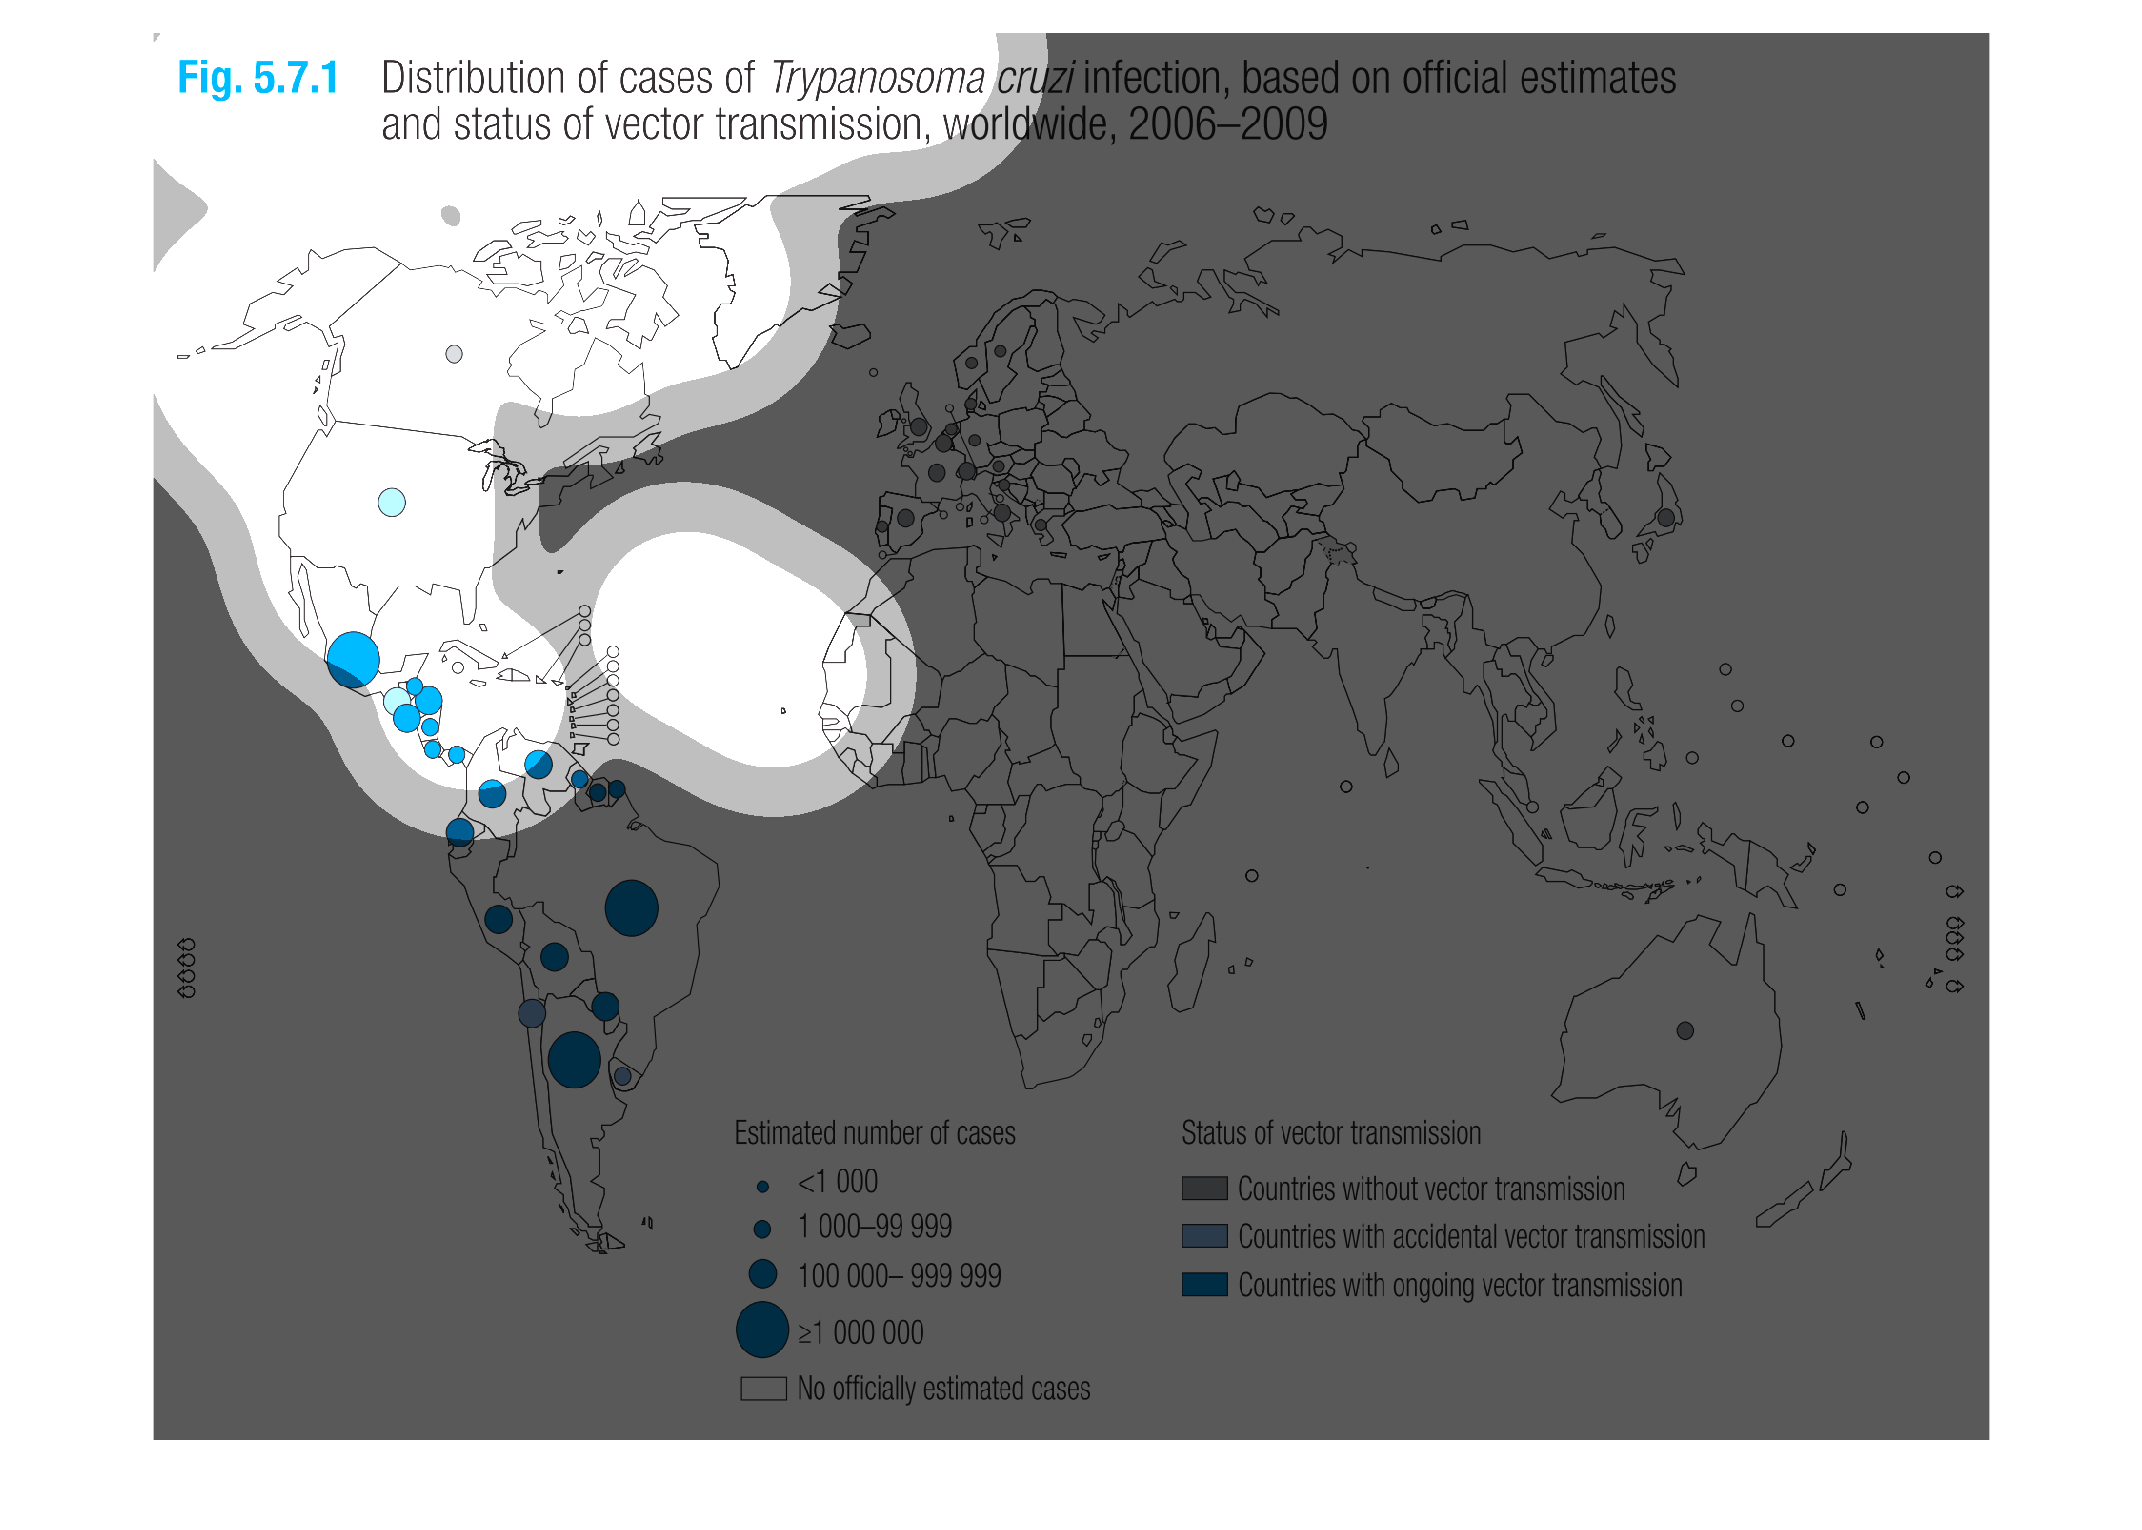
The image describes the distribution of T. Cruzii infection worldwide and the relationship
between T. cruzii infection and vectors for transmission on a global scale.
This image is titled "Figure 5.7.1: Distribution of Cases of Trypanosoma cruzi infection,
based on official estimates and status of vector transmission, worldwide, 2006-2009". This
visual looked at both estimated number of cases and status of vector transmission. Categories
for the estimated number of cases included "less than 1,000", "1,000 to 99,999", "100,000
to 999,999", "greater than 1,000,000", and  "no officially estimated cases". Categories for
the status of vector transmission include "countries without vector transmission", "countries
with accidental vector transmission", and "countries with ongoing vector transmission".