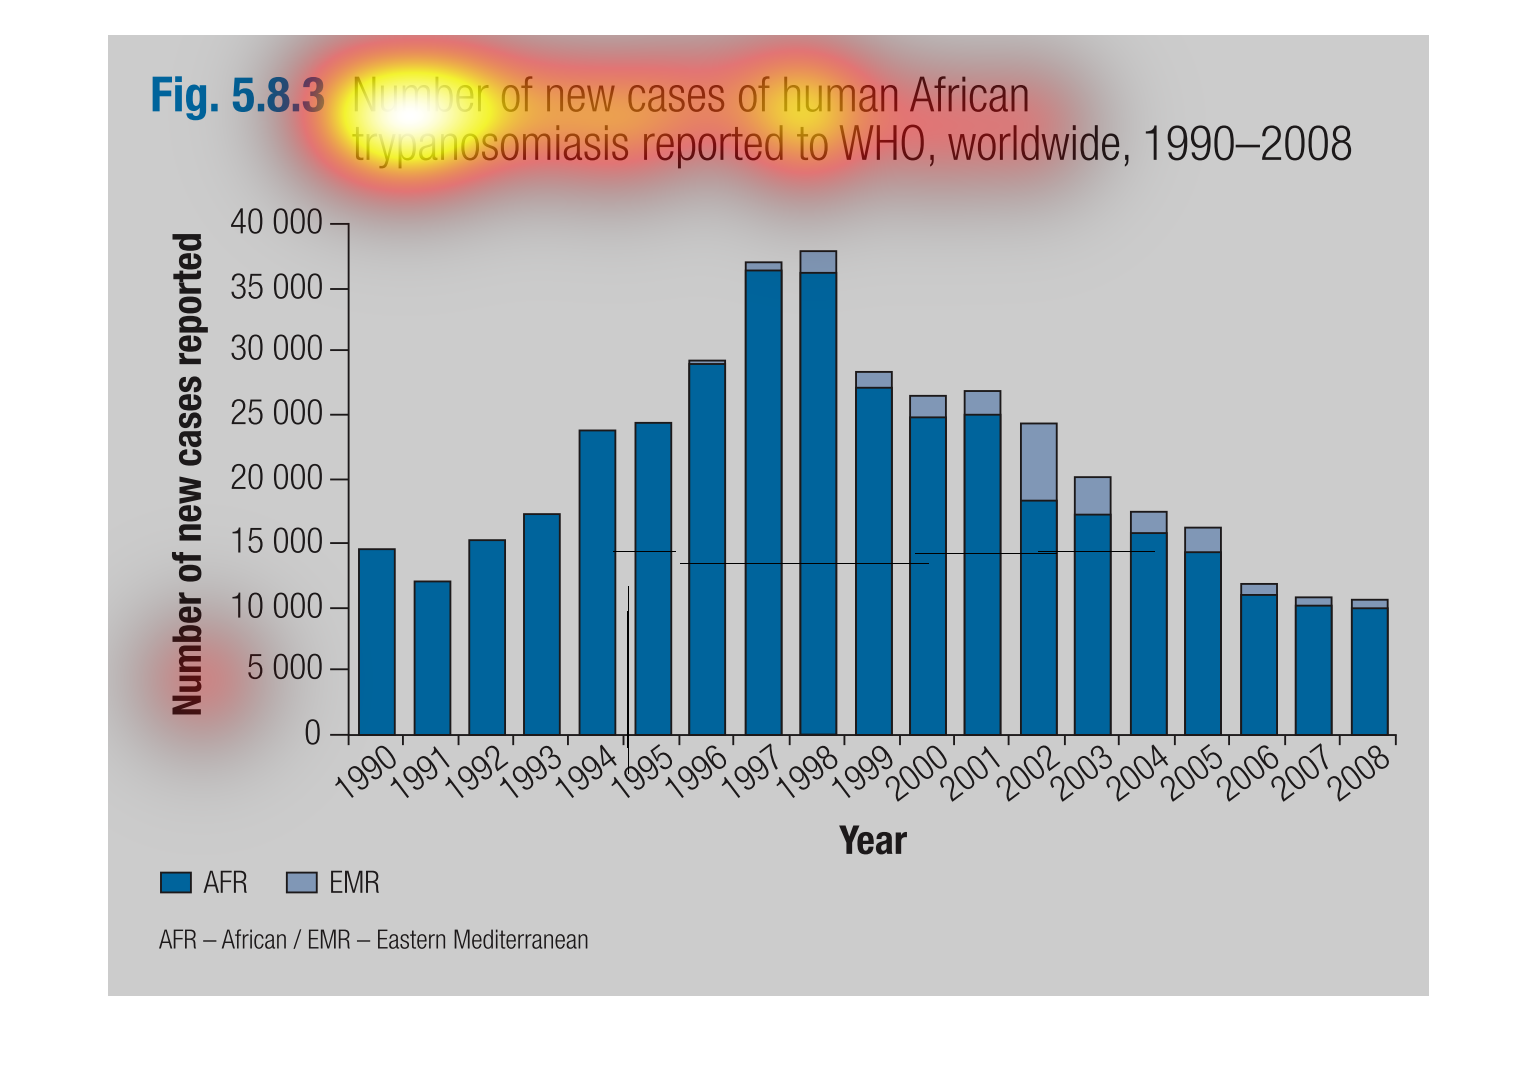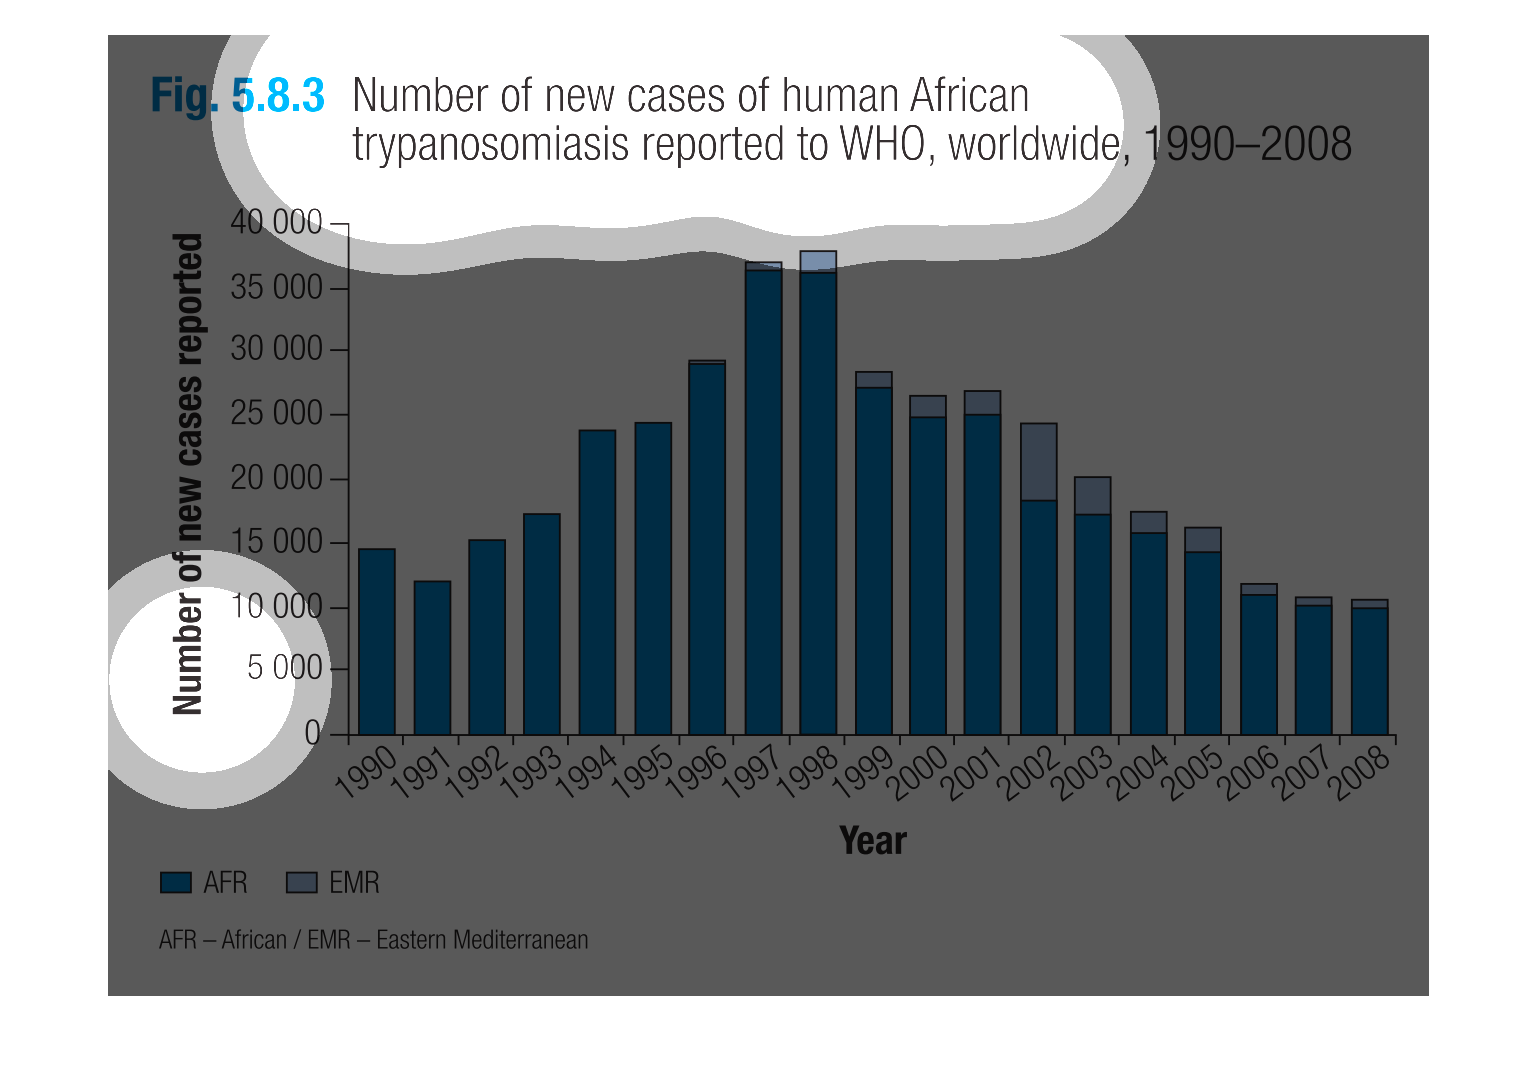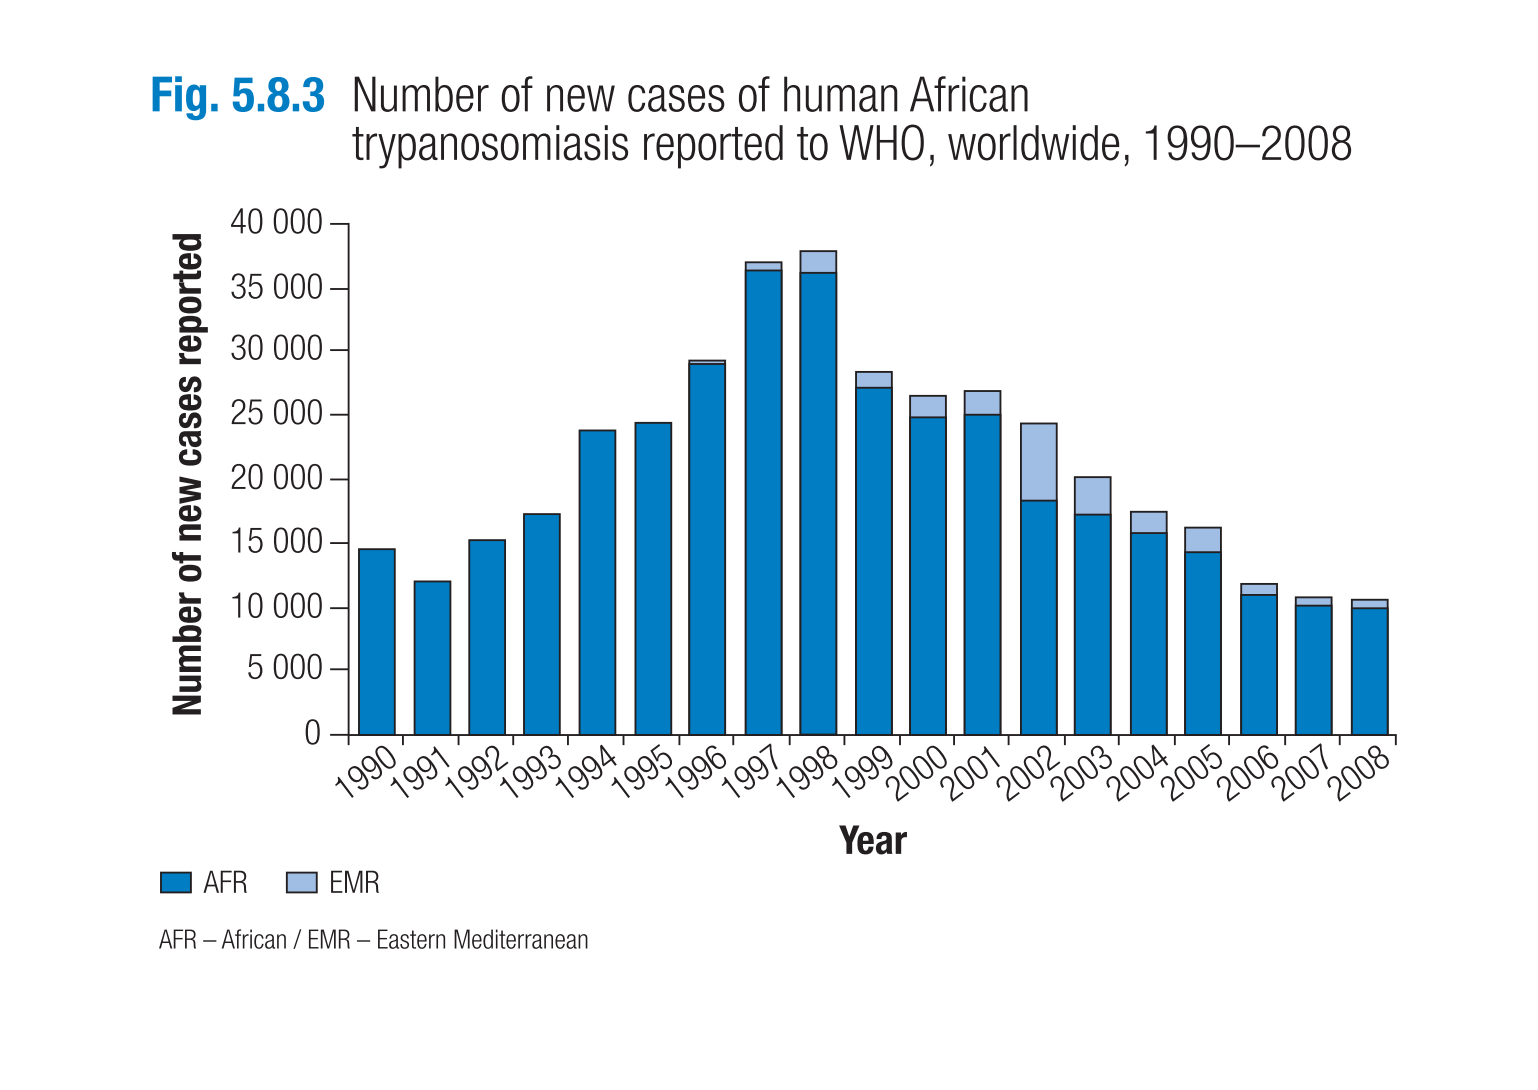
This chart describes the number of new cases of human African trypanosomiasis reported to
WHO, worldwide, for the years 1990 through 2008. The highest spikes on the chart occur in
1997 and 1998.
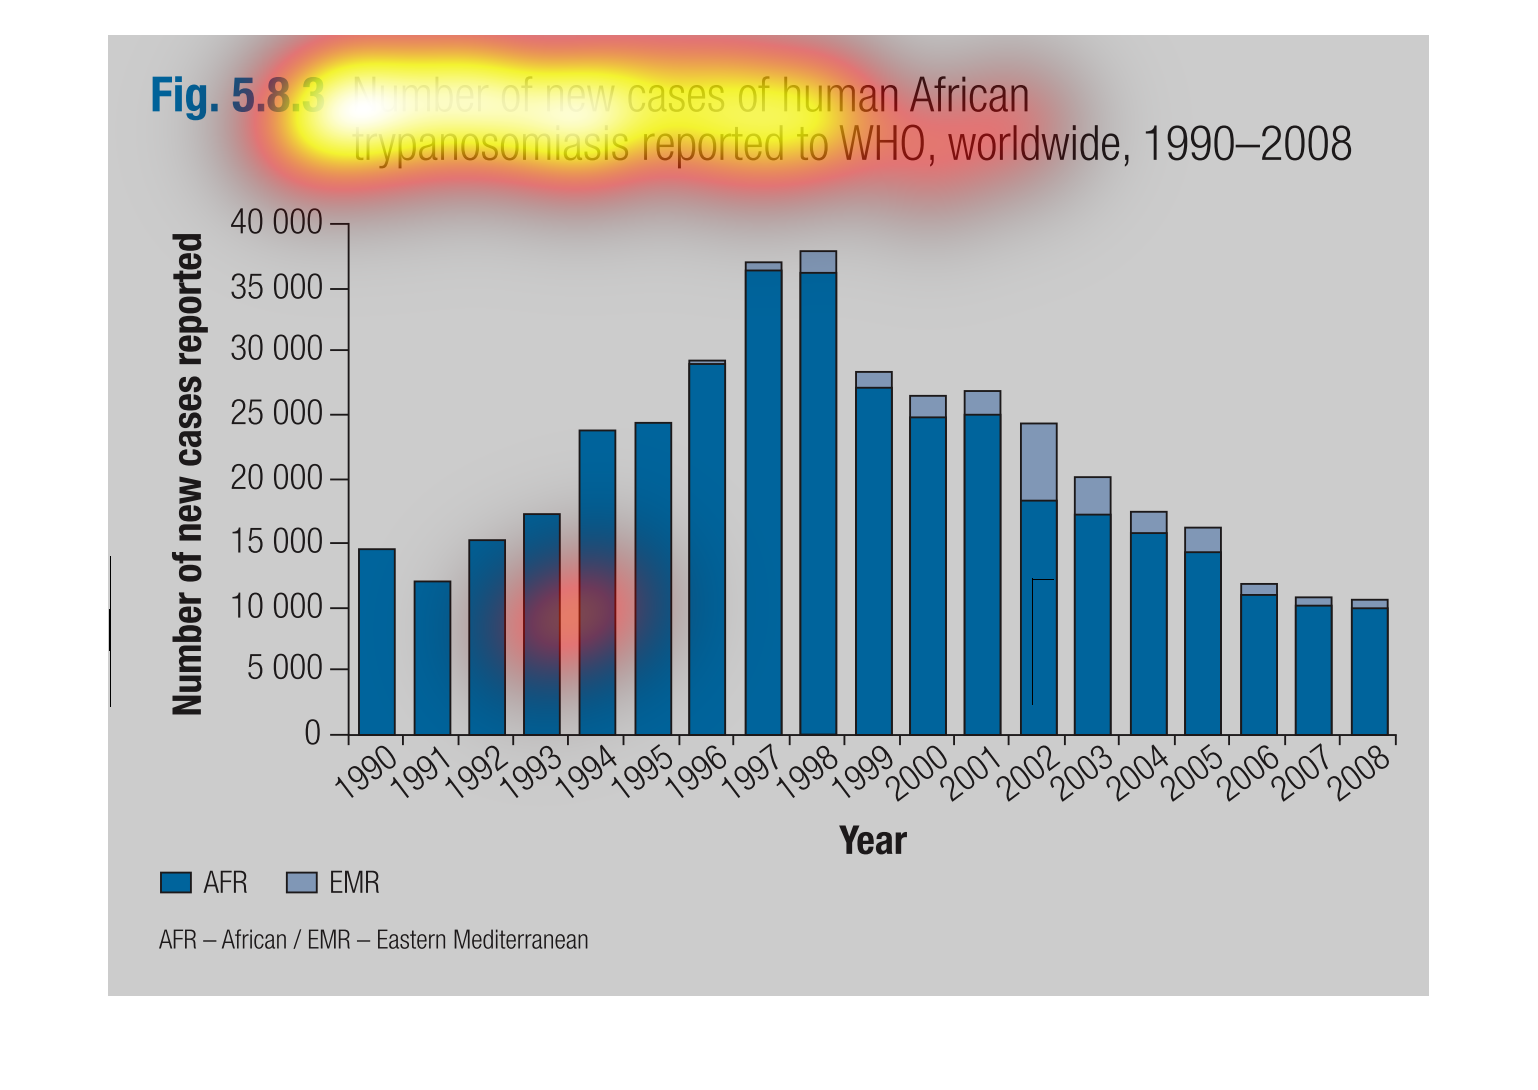
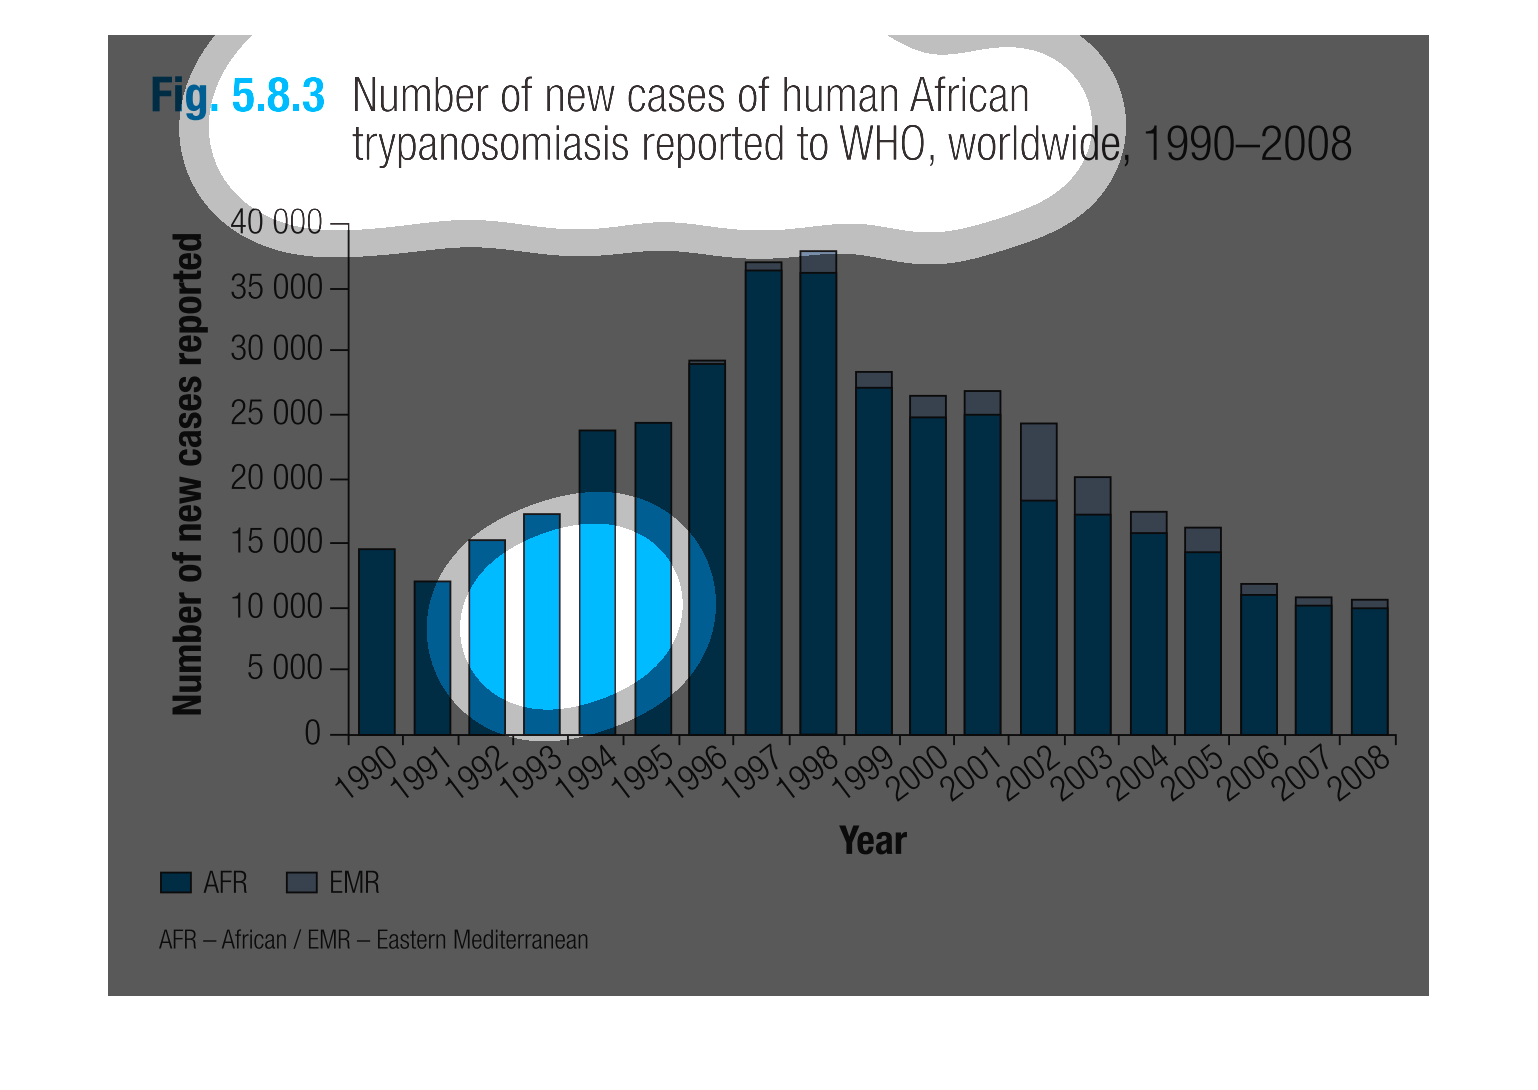
This graph shows the number of cases of African trypanosomiasis reported to WHO, worldwide
from 1990-2008. Cases have shown anywhere from 5000 through 40000 cases.
The chart depict the rate of human African trypansomiasis thet were reported to WHO in the
years of 1990 through 2008. Highest reported rates came between 1996 and 1999
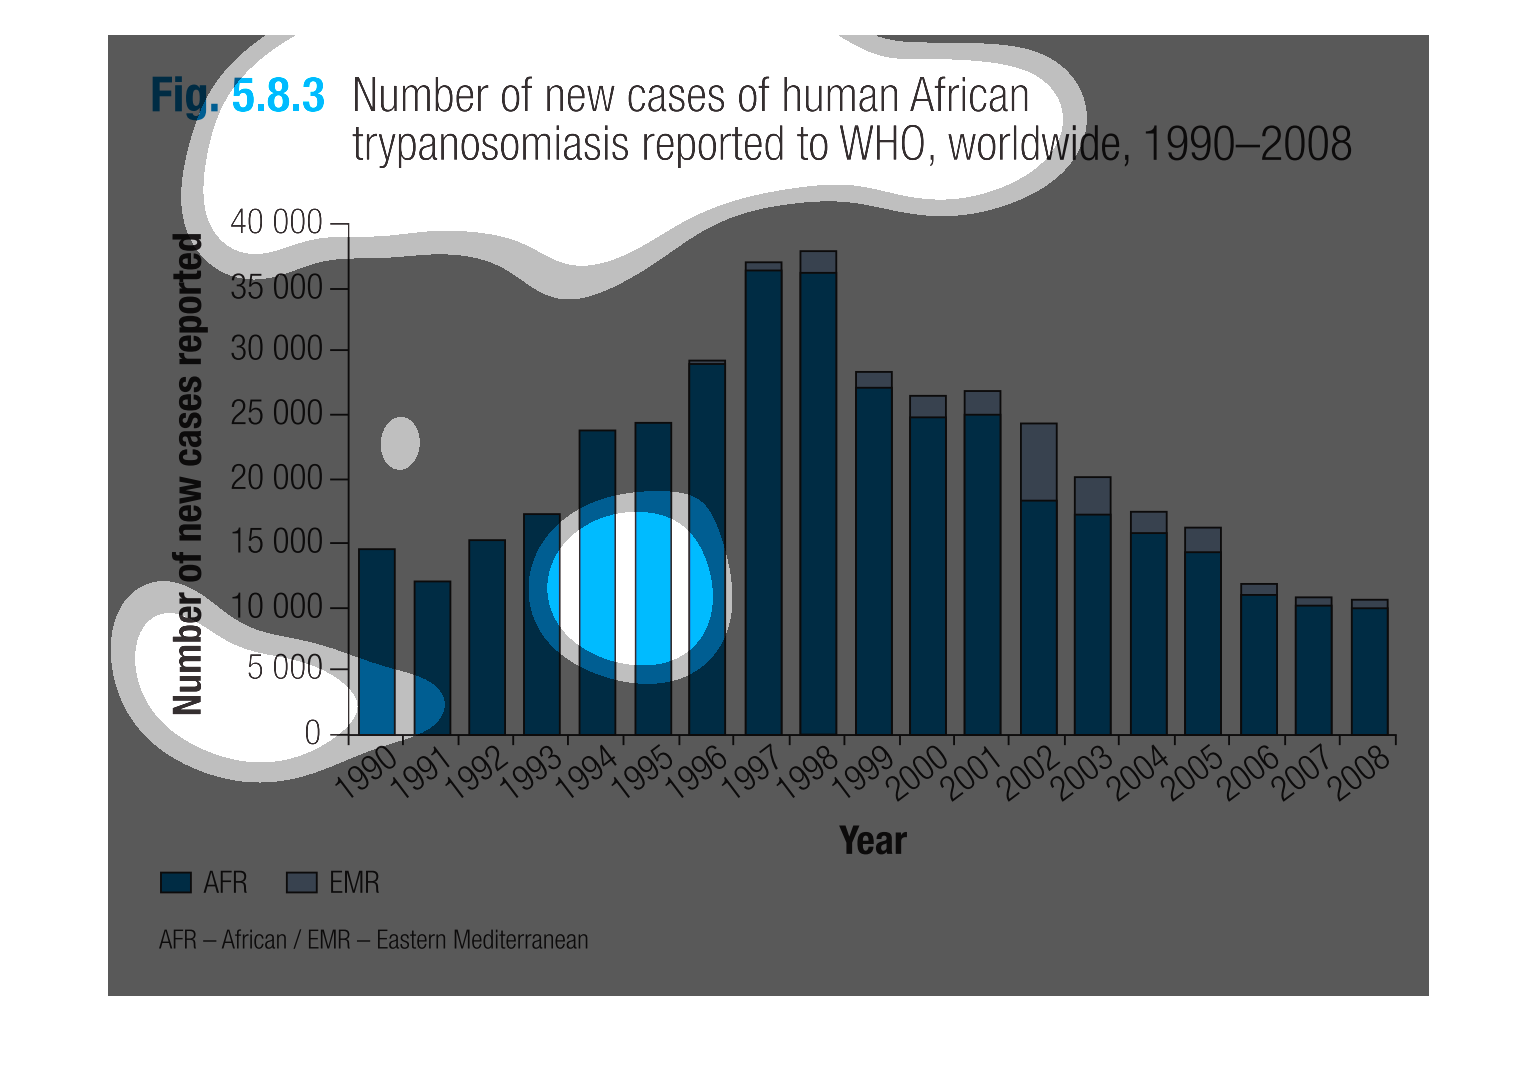
This handmade chart shows the number of cases of African trypanosomia over a decade from the
1990s to the 2000's. it shows how it peaked and then went down.
The graph displays the number of new cases of human African trypanosmiasis reported to WHO
worldwide between the years 1990-2008.The graph splits up the information into two regions:
Africa and Eastern Mediterranean.
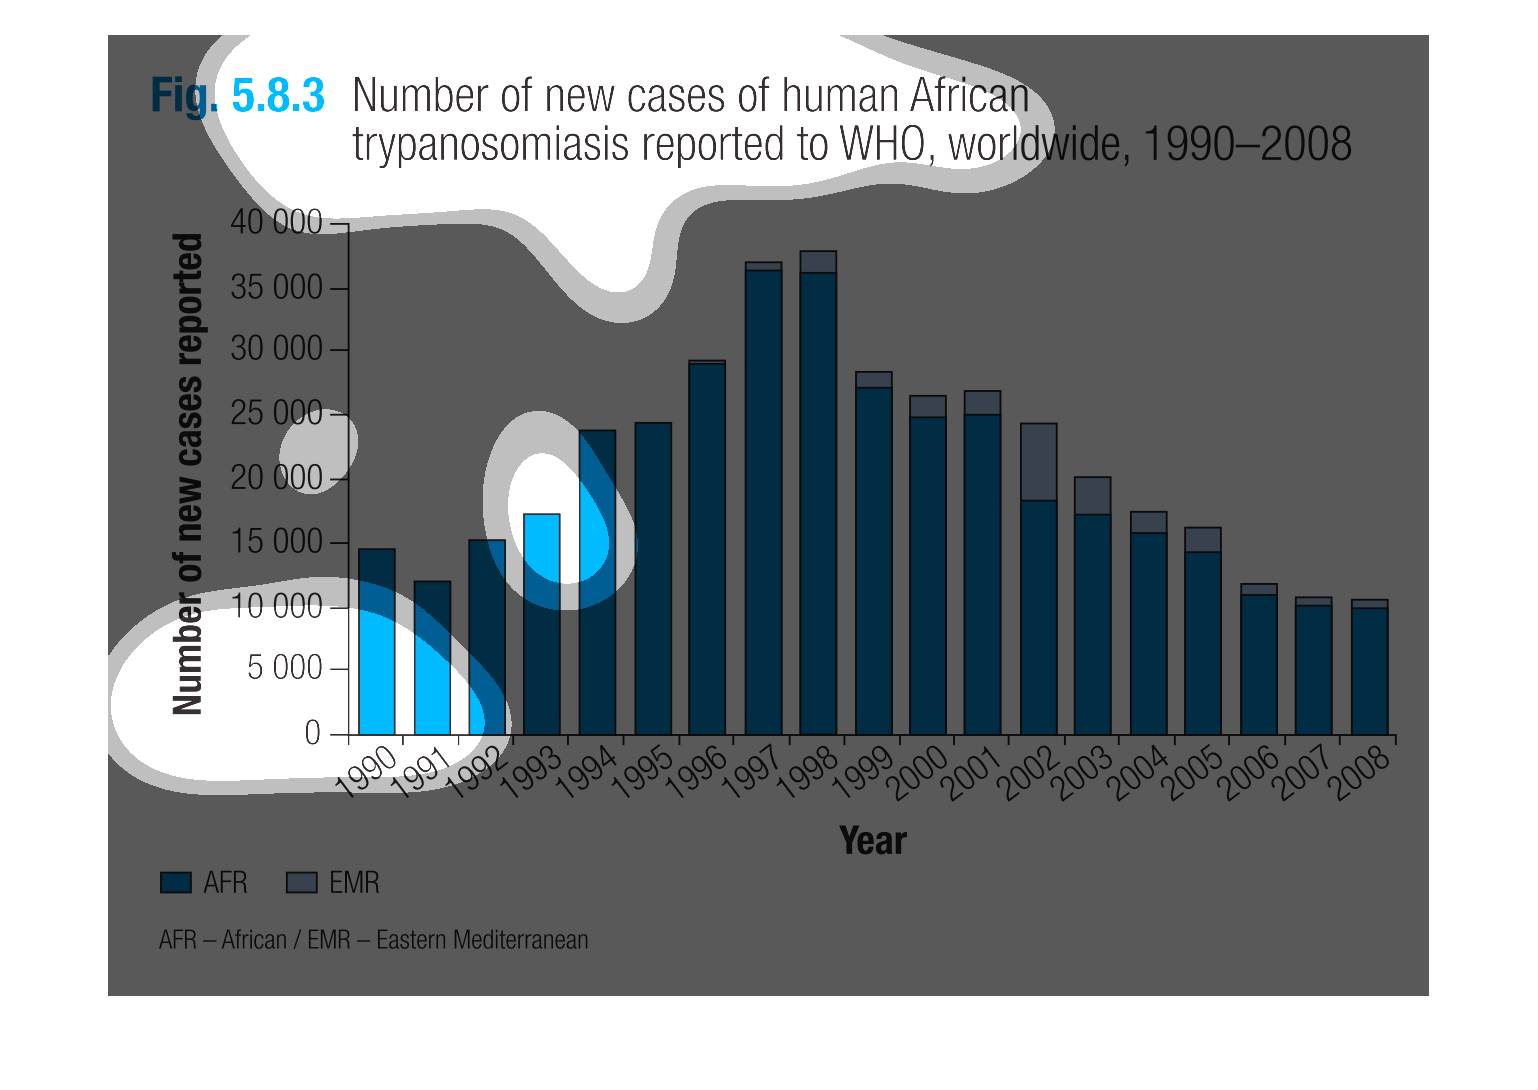
A disease in Africa reached its peak in 1997, but incidents have decreased since then. Data
exists up until 2008, when there were around 10,000 cases.
This graph shows the number of new cases of human african trypanosomiasis reported to world
health organization, from 1990 to 2008. The year spans the horizontal axis, while the bars
are color coded by african and european countries, with the african countries being much taller.
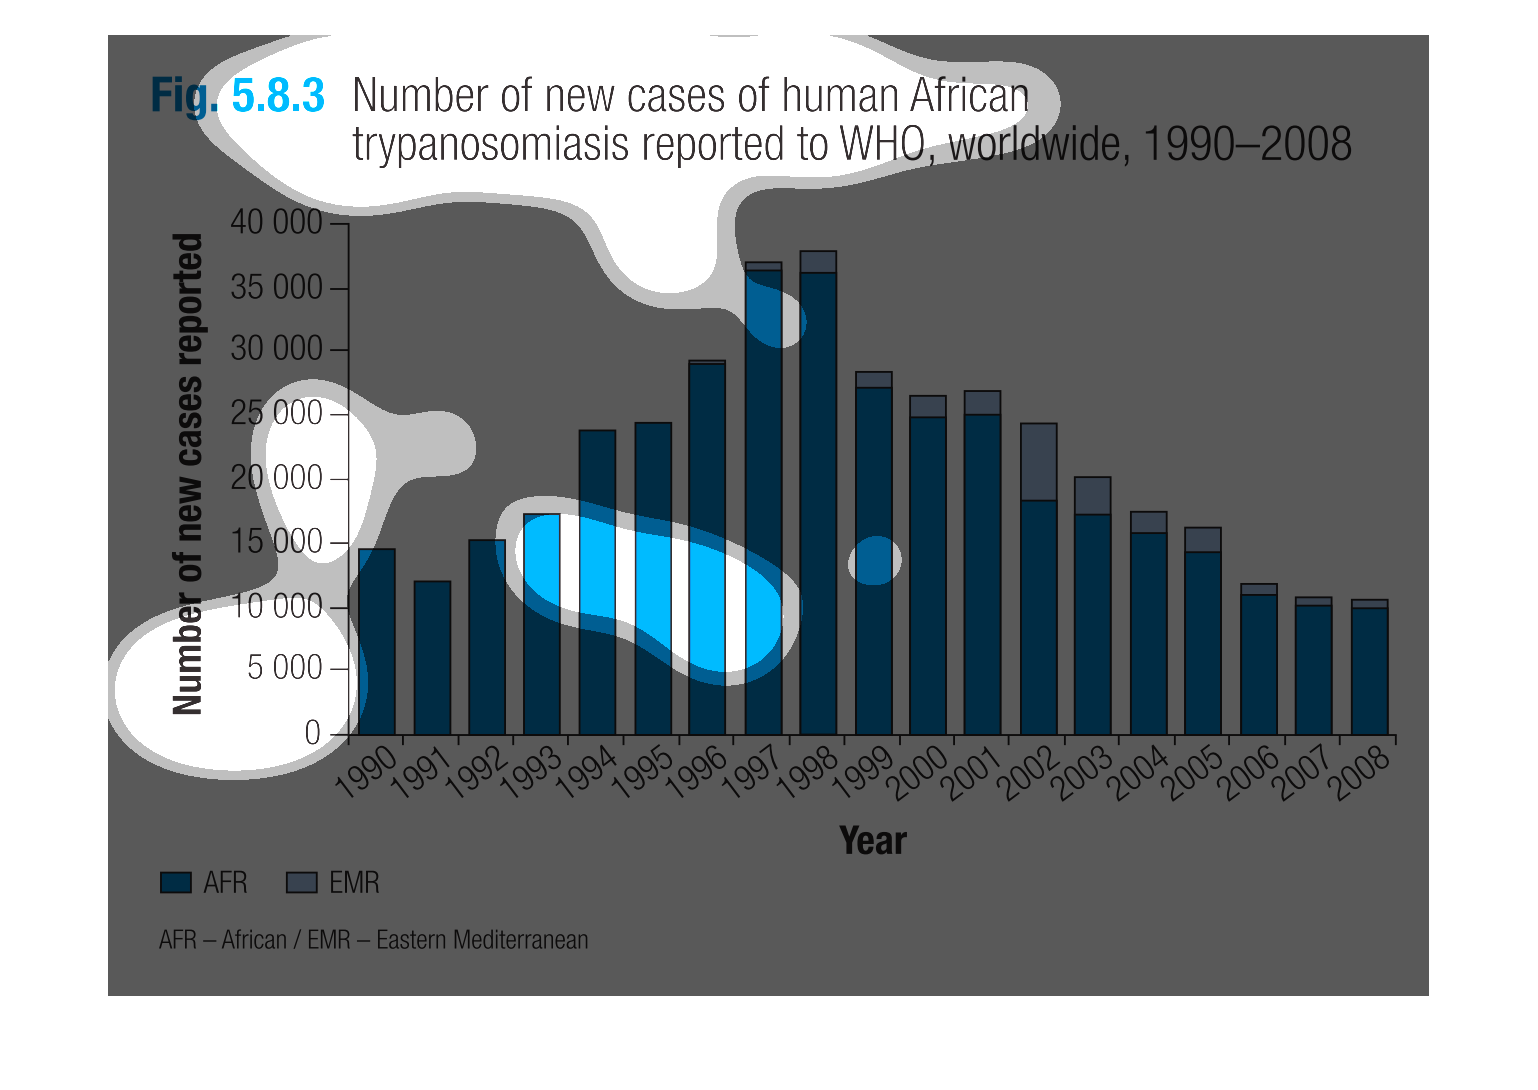
This is a graph that tracks the incidences of a certain disease over time. It is a graph that
is produced by the World Health Organization. It is a bar graph.
The bar chart represent number of new cases of human African trypanosomiasis reported to WHO,
worldwide, 1990-2008. on y axis is the number of new cases reported and x axis is the year
reported.
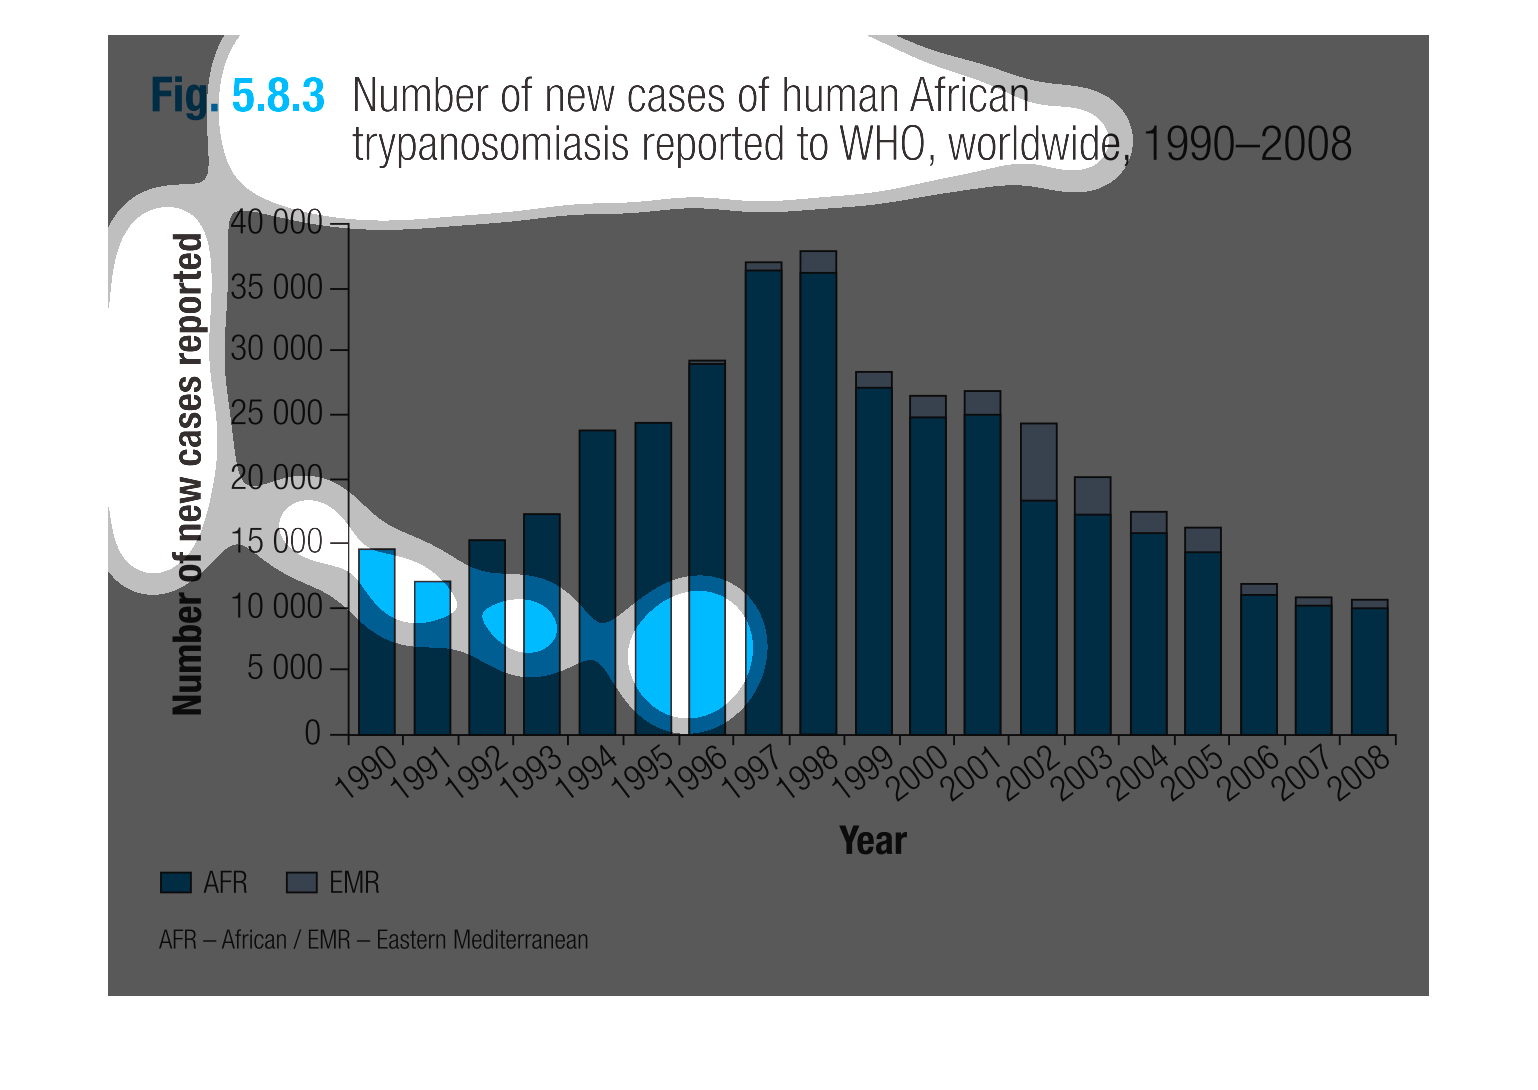
This chart graphs the number of new cases of African trypanosomiasis that have occurred over
the last 18 years, from 1990 to 2008. New cases peaked in 1997 and 1998 and since then, the
disease has been on the decline, falling to pre 1990 levels now.
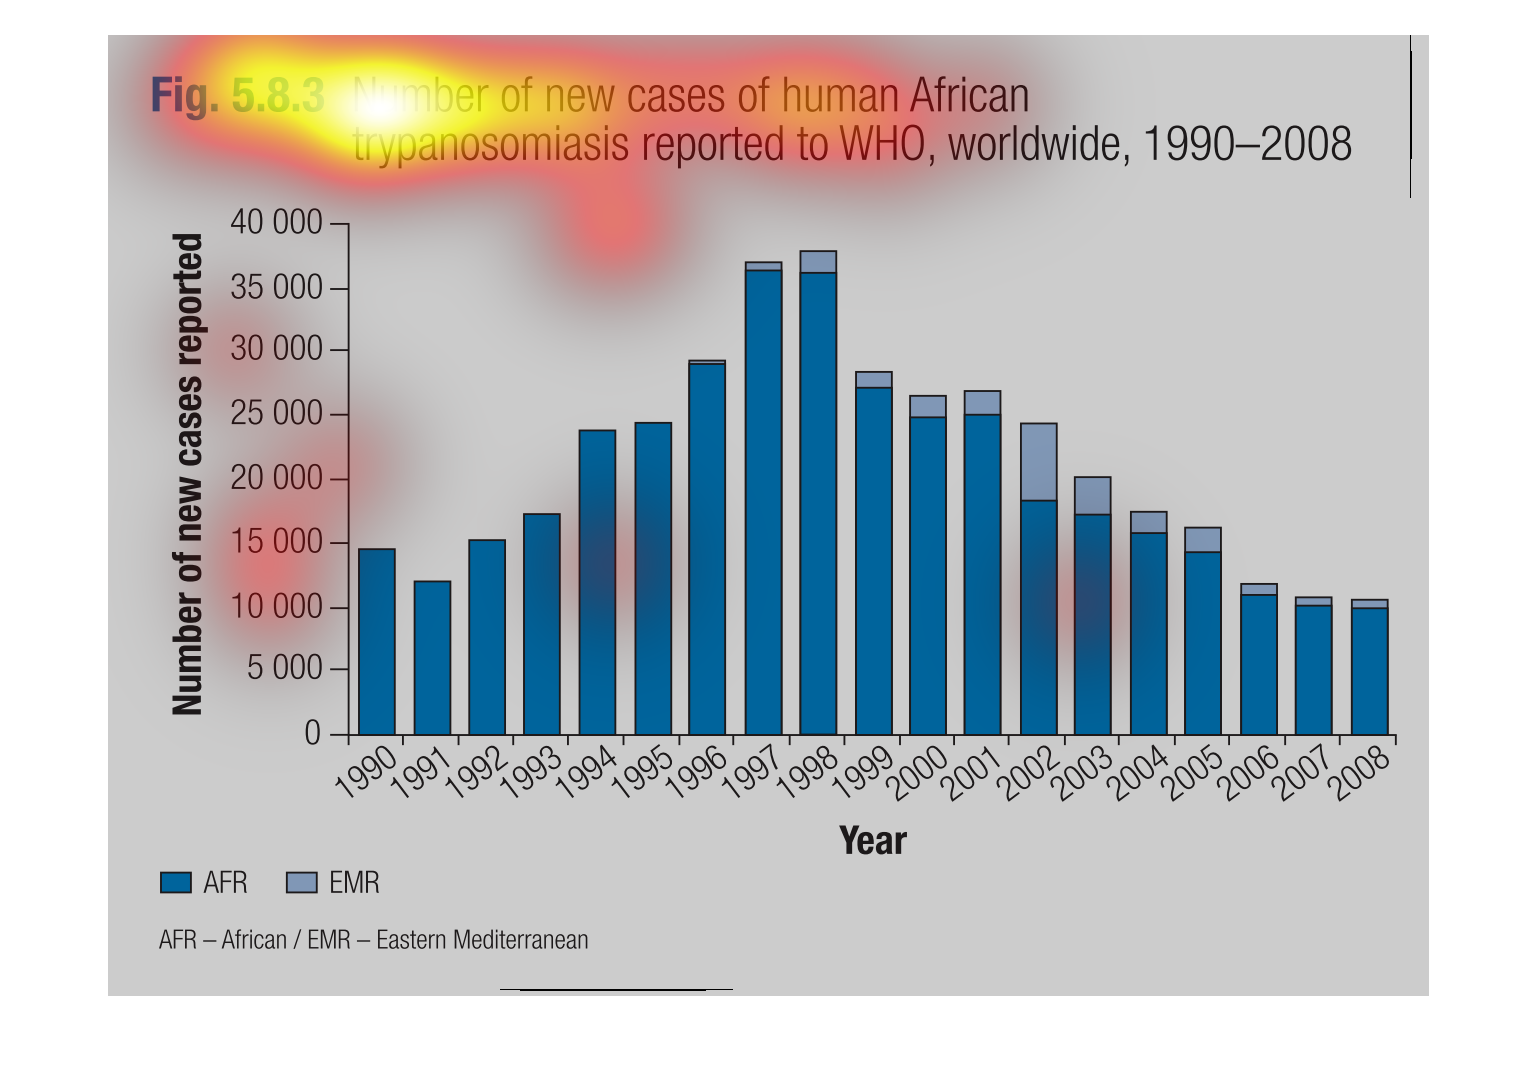
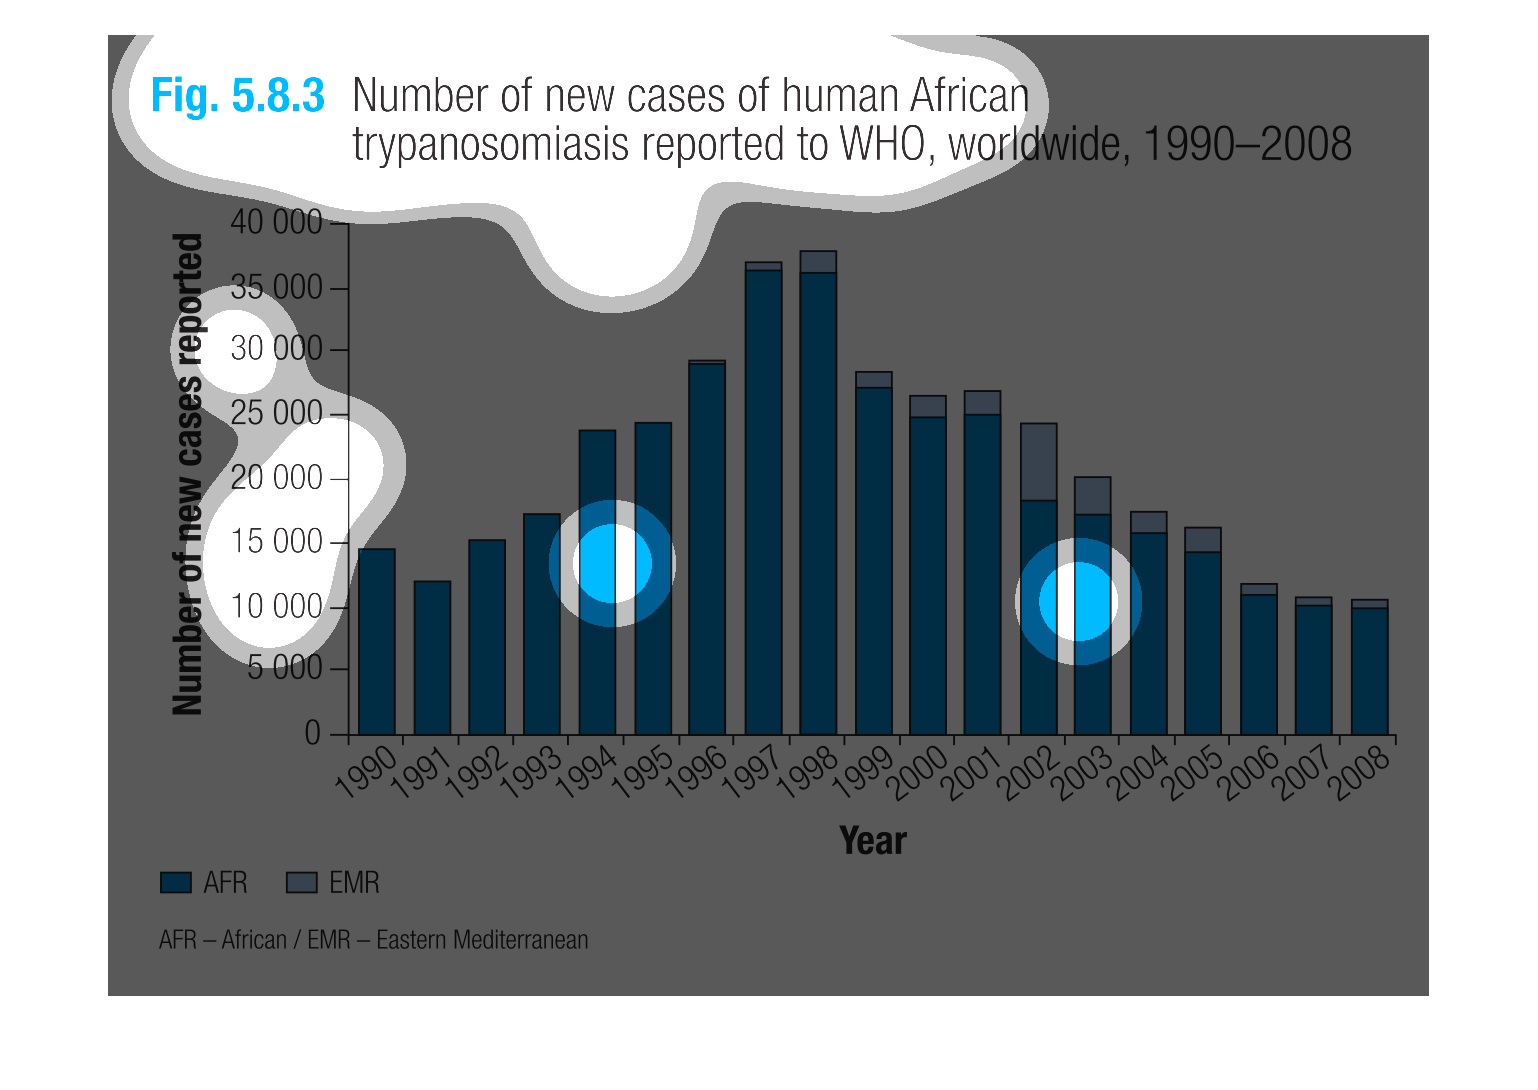
Number of new cases of human African trypanosomiasis reported to WHO, worldwide, 1999-2008.
The years 1997 and 1998 were the highest in new cases reported.
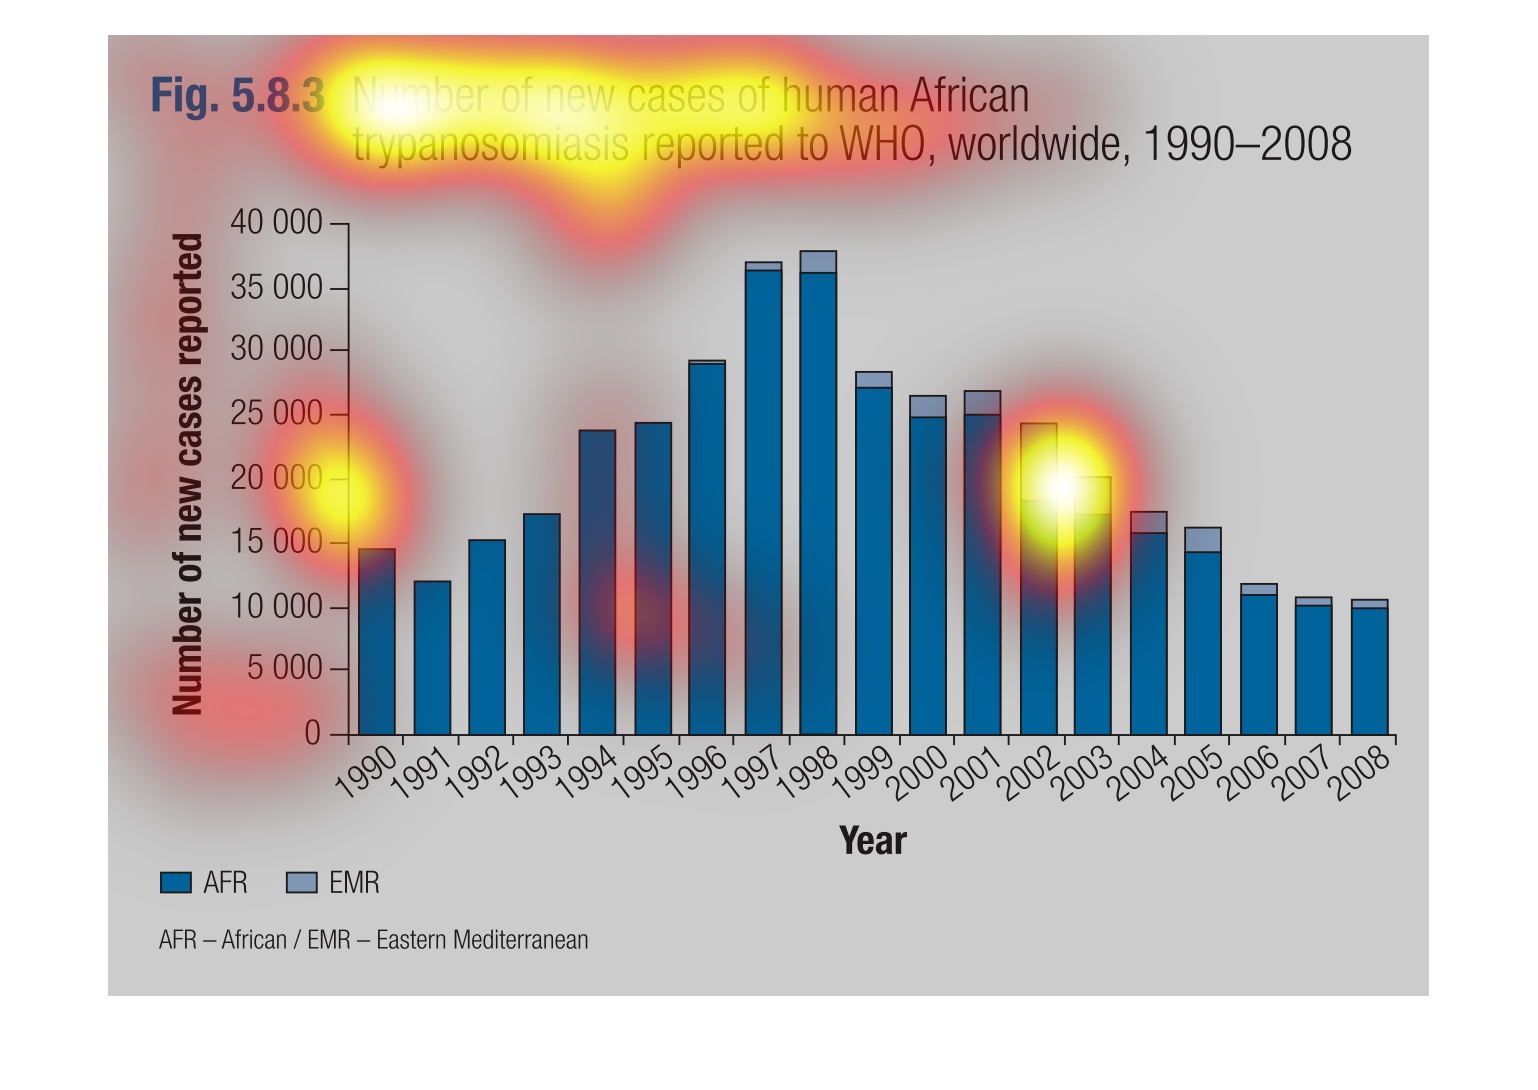
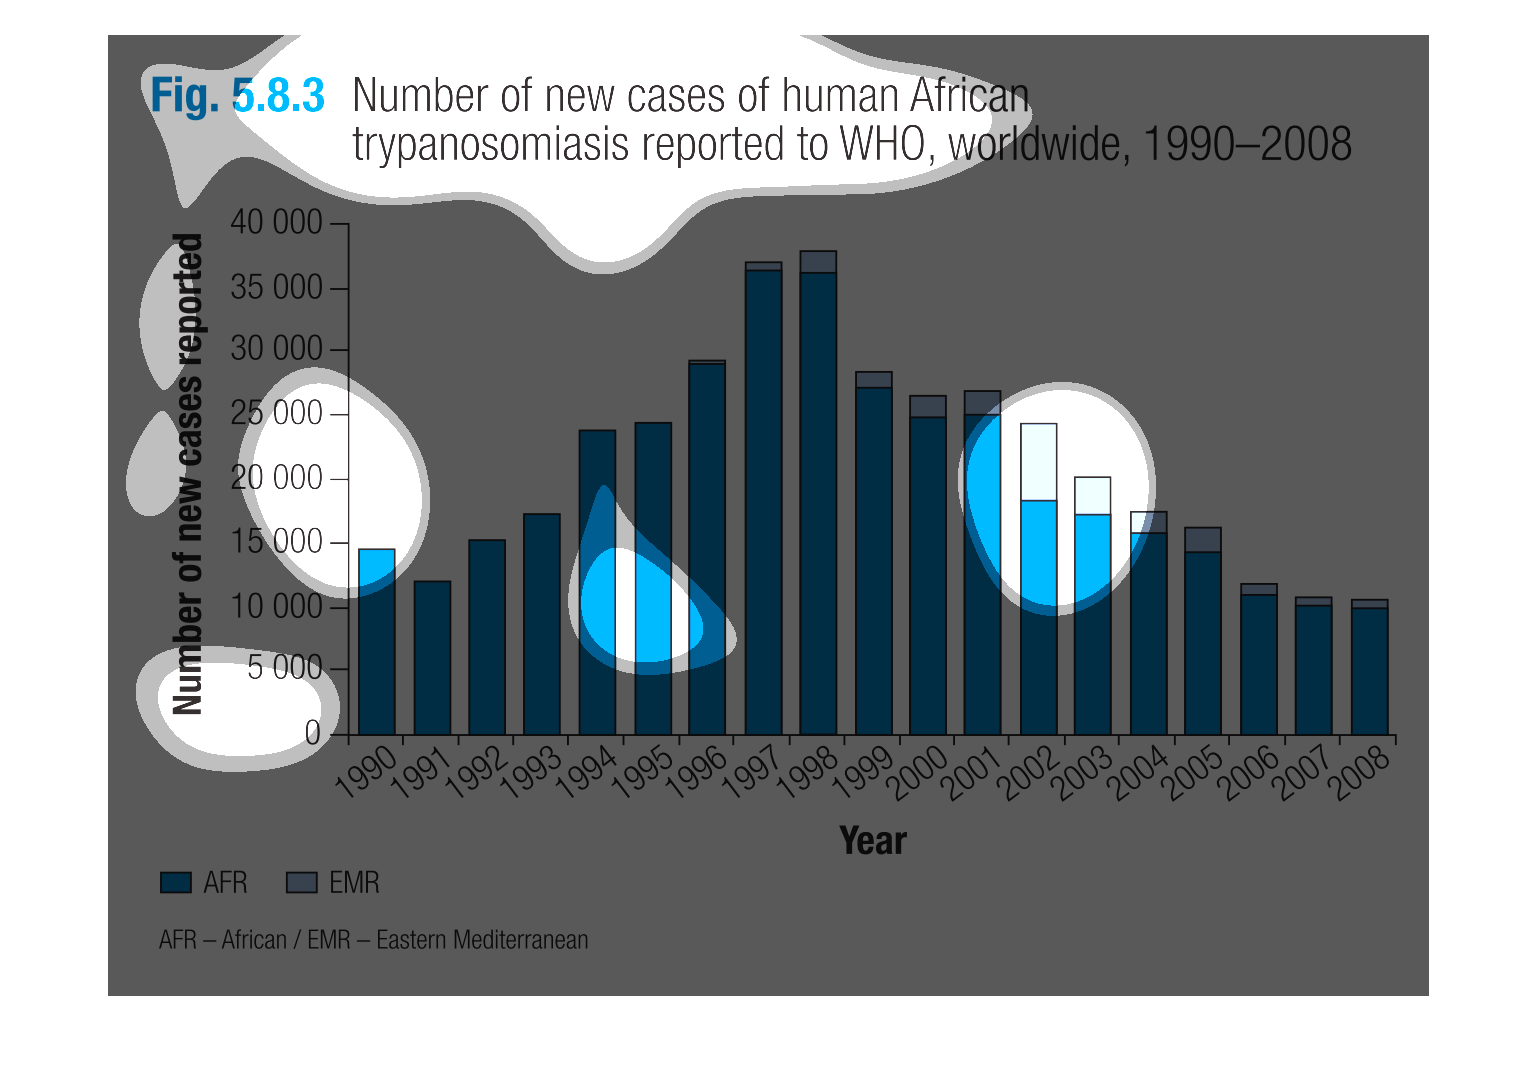
Figure 5.8.3 shows the number of new cases of human African trypanosomiasis reported to WHO
from 1920- 2008. Reports peaked in 1997 and 1998. Reports declined significantly after 1998.
Between 1990 and 1998, Trypanosomiasis cases rose steadily, to a peak of about 35,000 new
cases per year. Most new cases were recorded in Africa.  After 1999, new cases began to drop,
to about 10,000 cases in 2008.
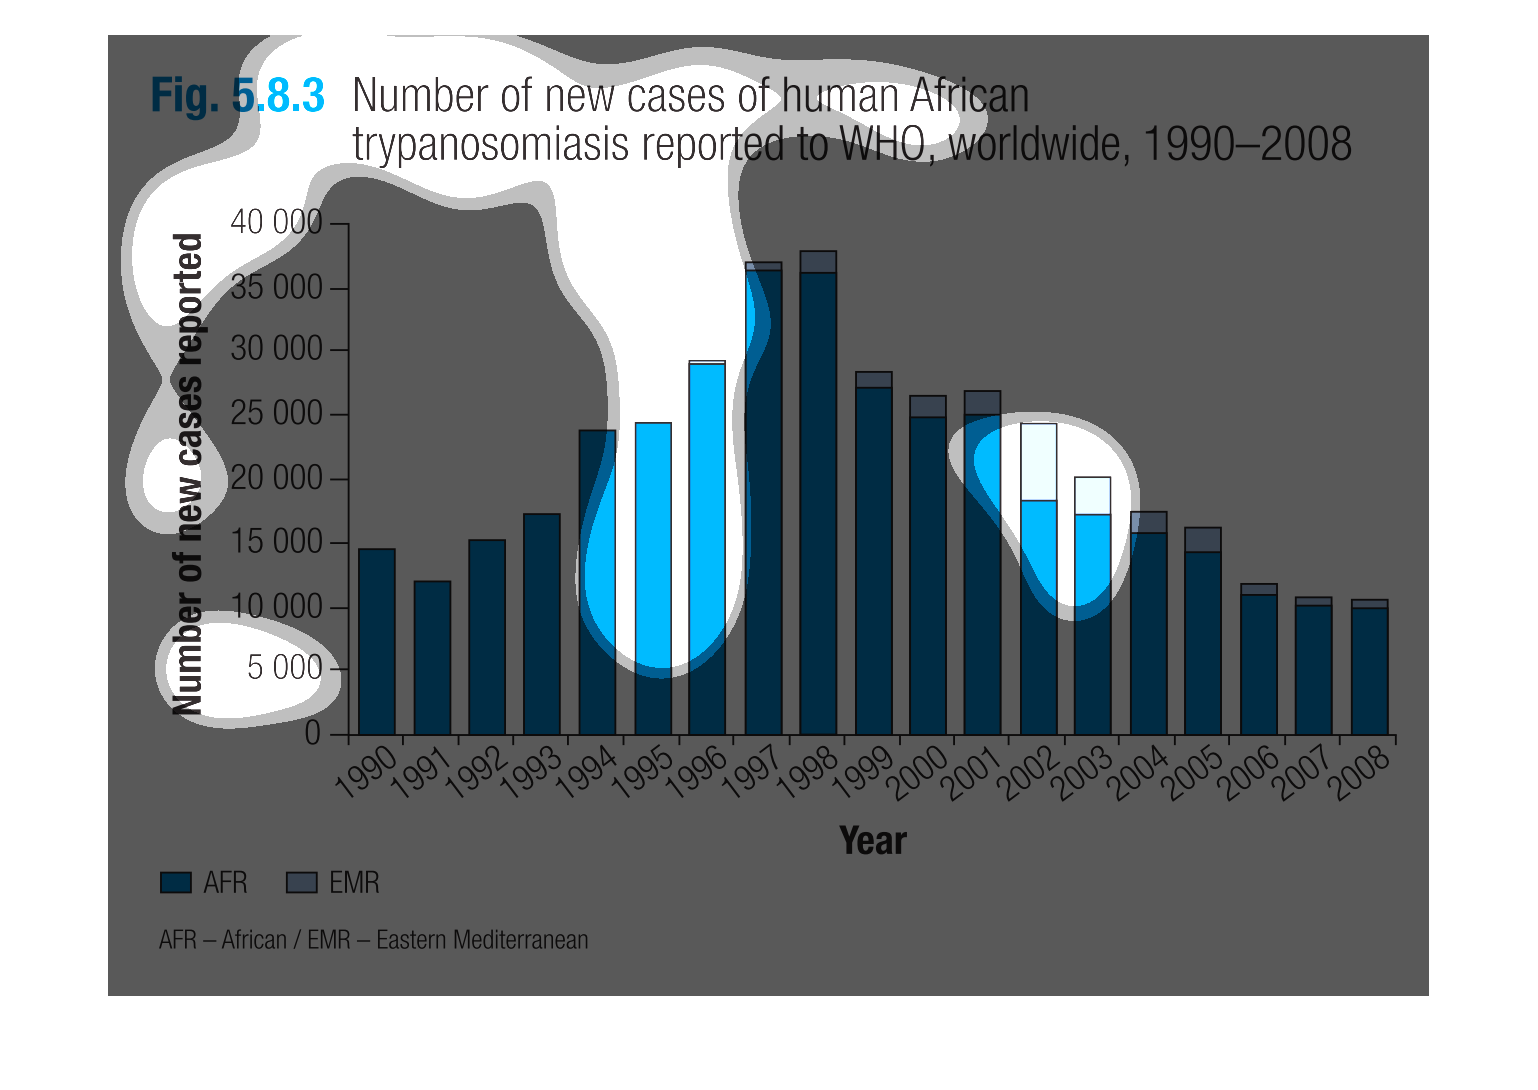
This graph illustrates the number of new cases of African trypanosomiasis reported to WHO
worldwide from 1990 to 2008.  AFR has the highest incidences by region.