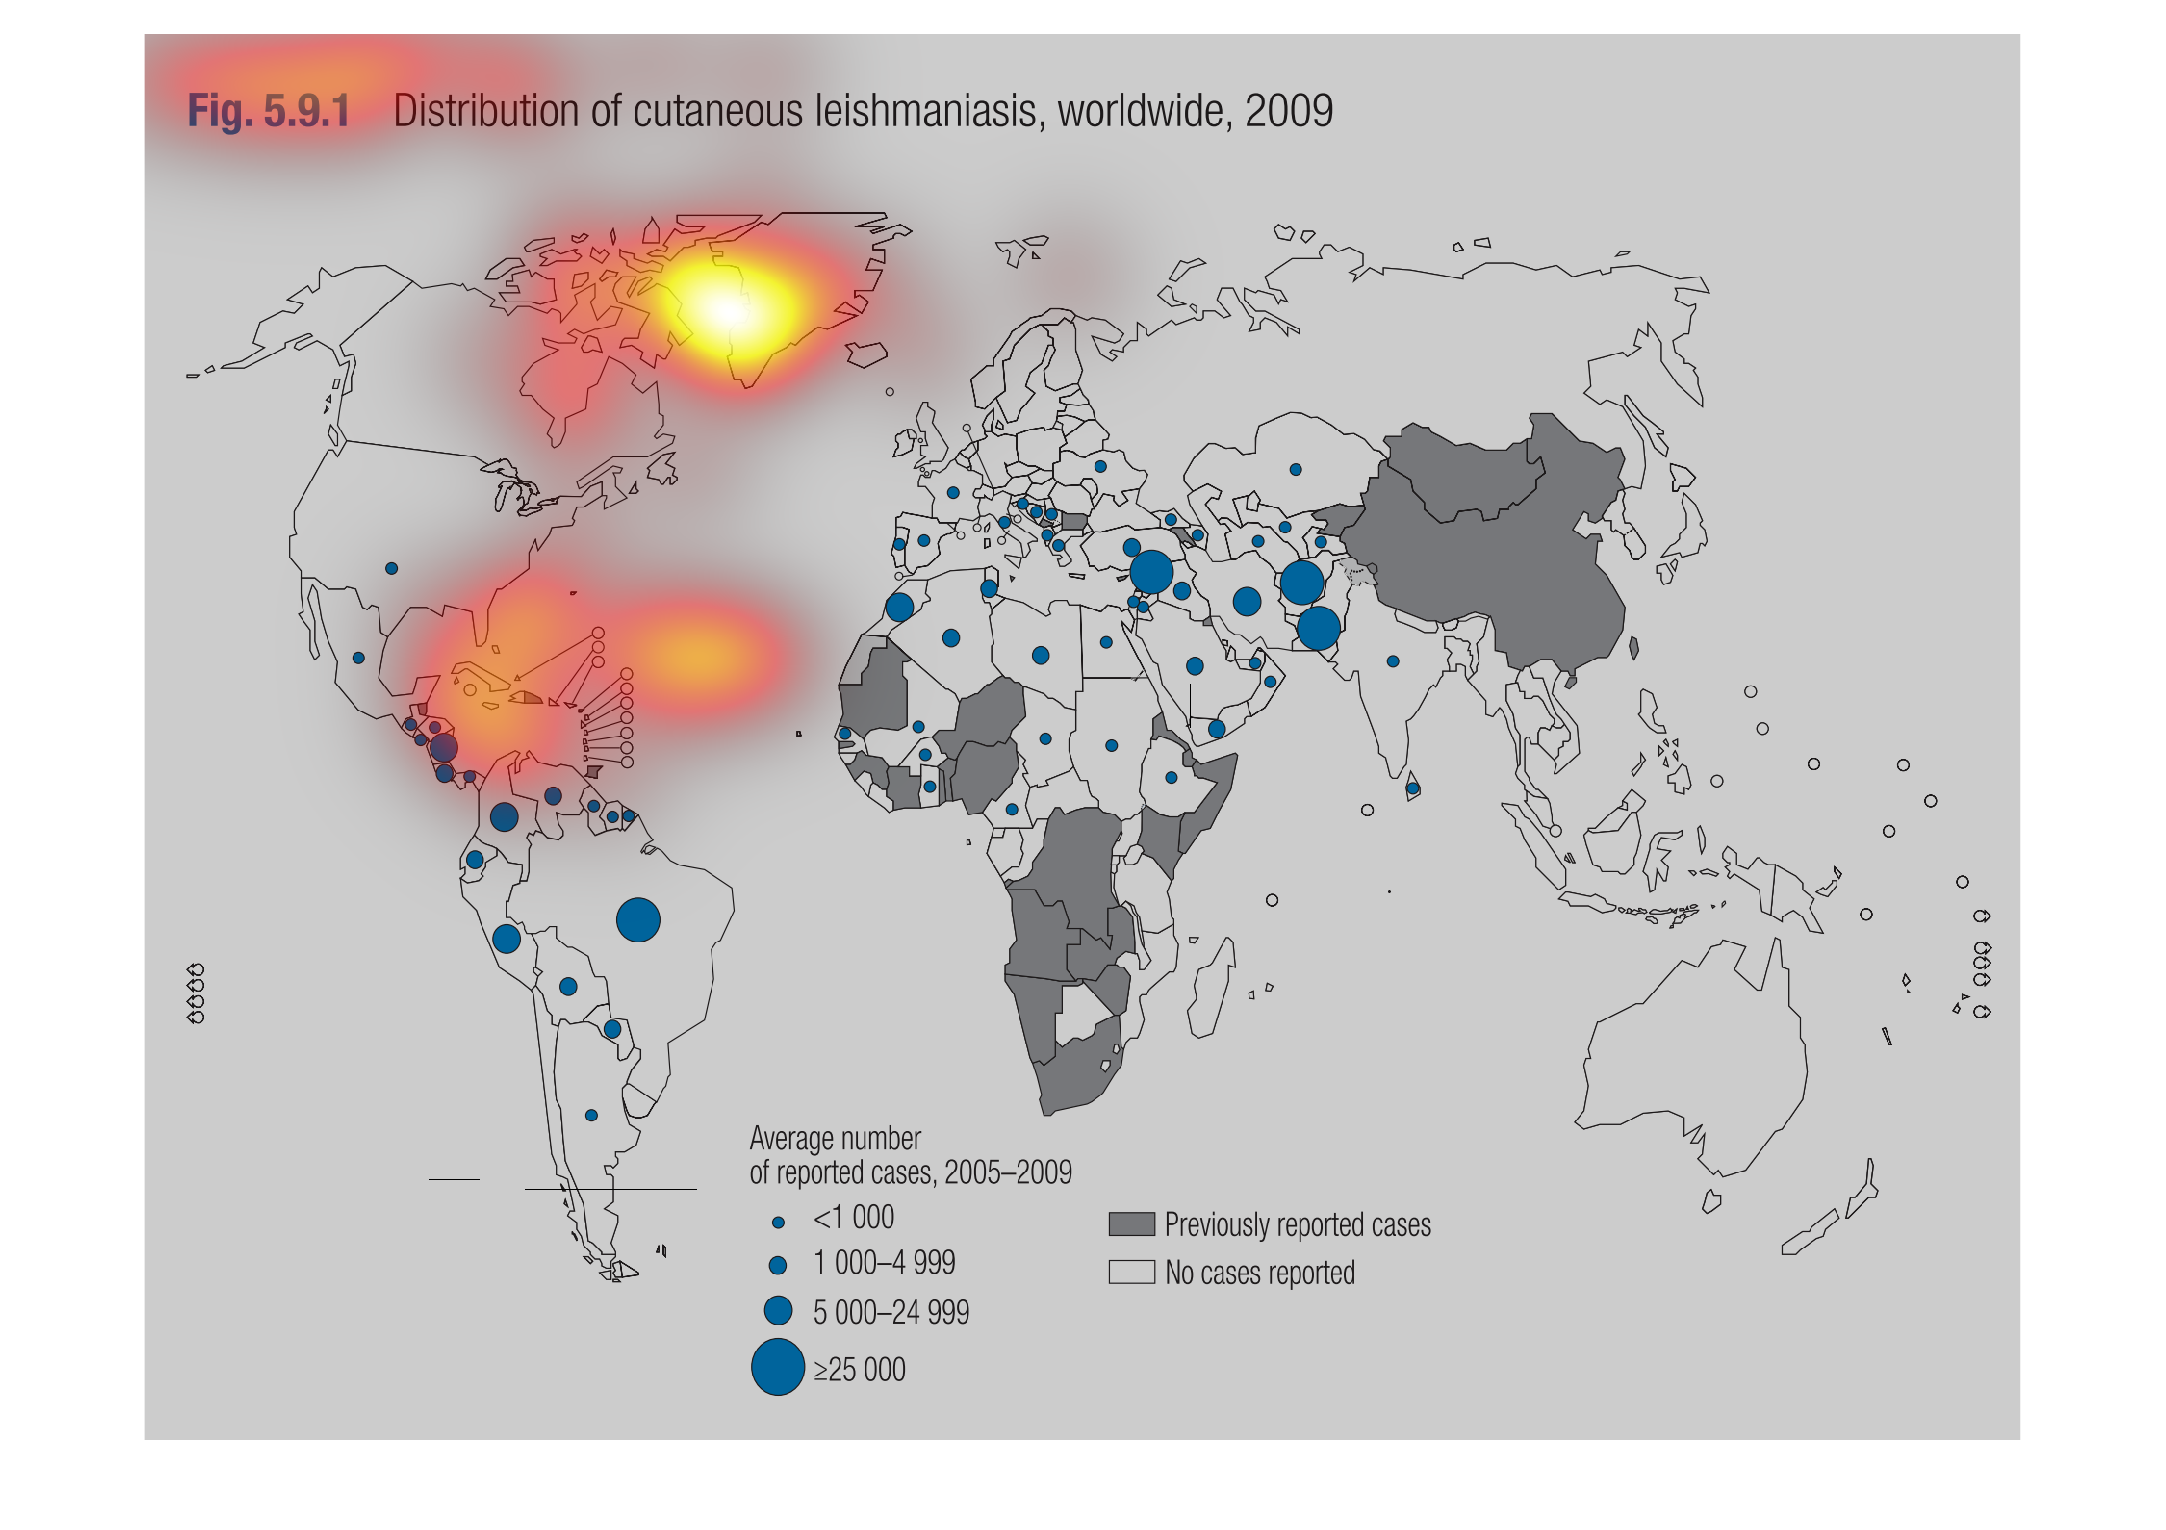
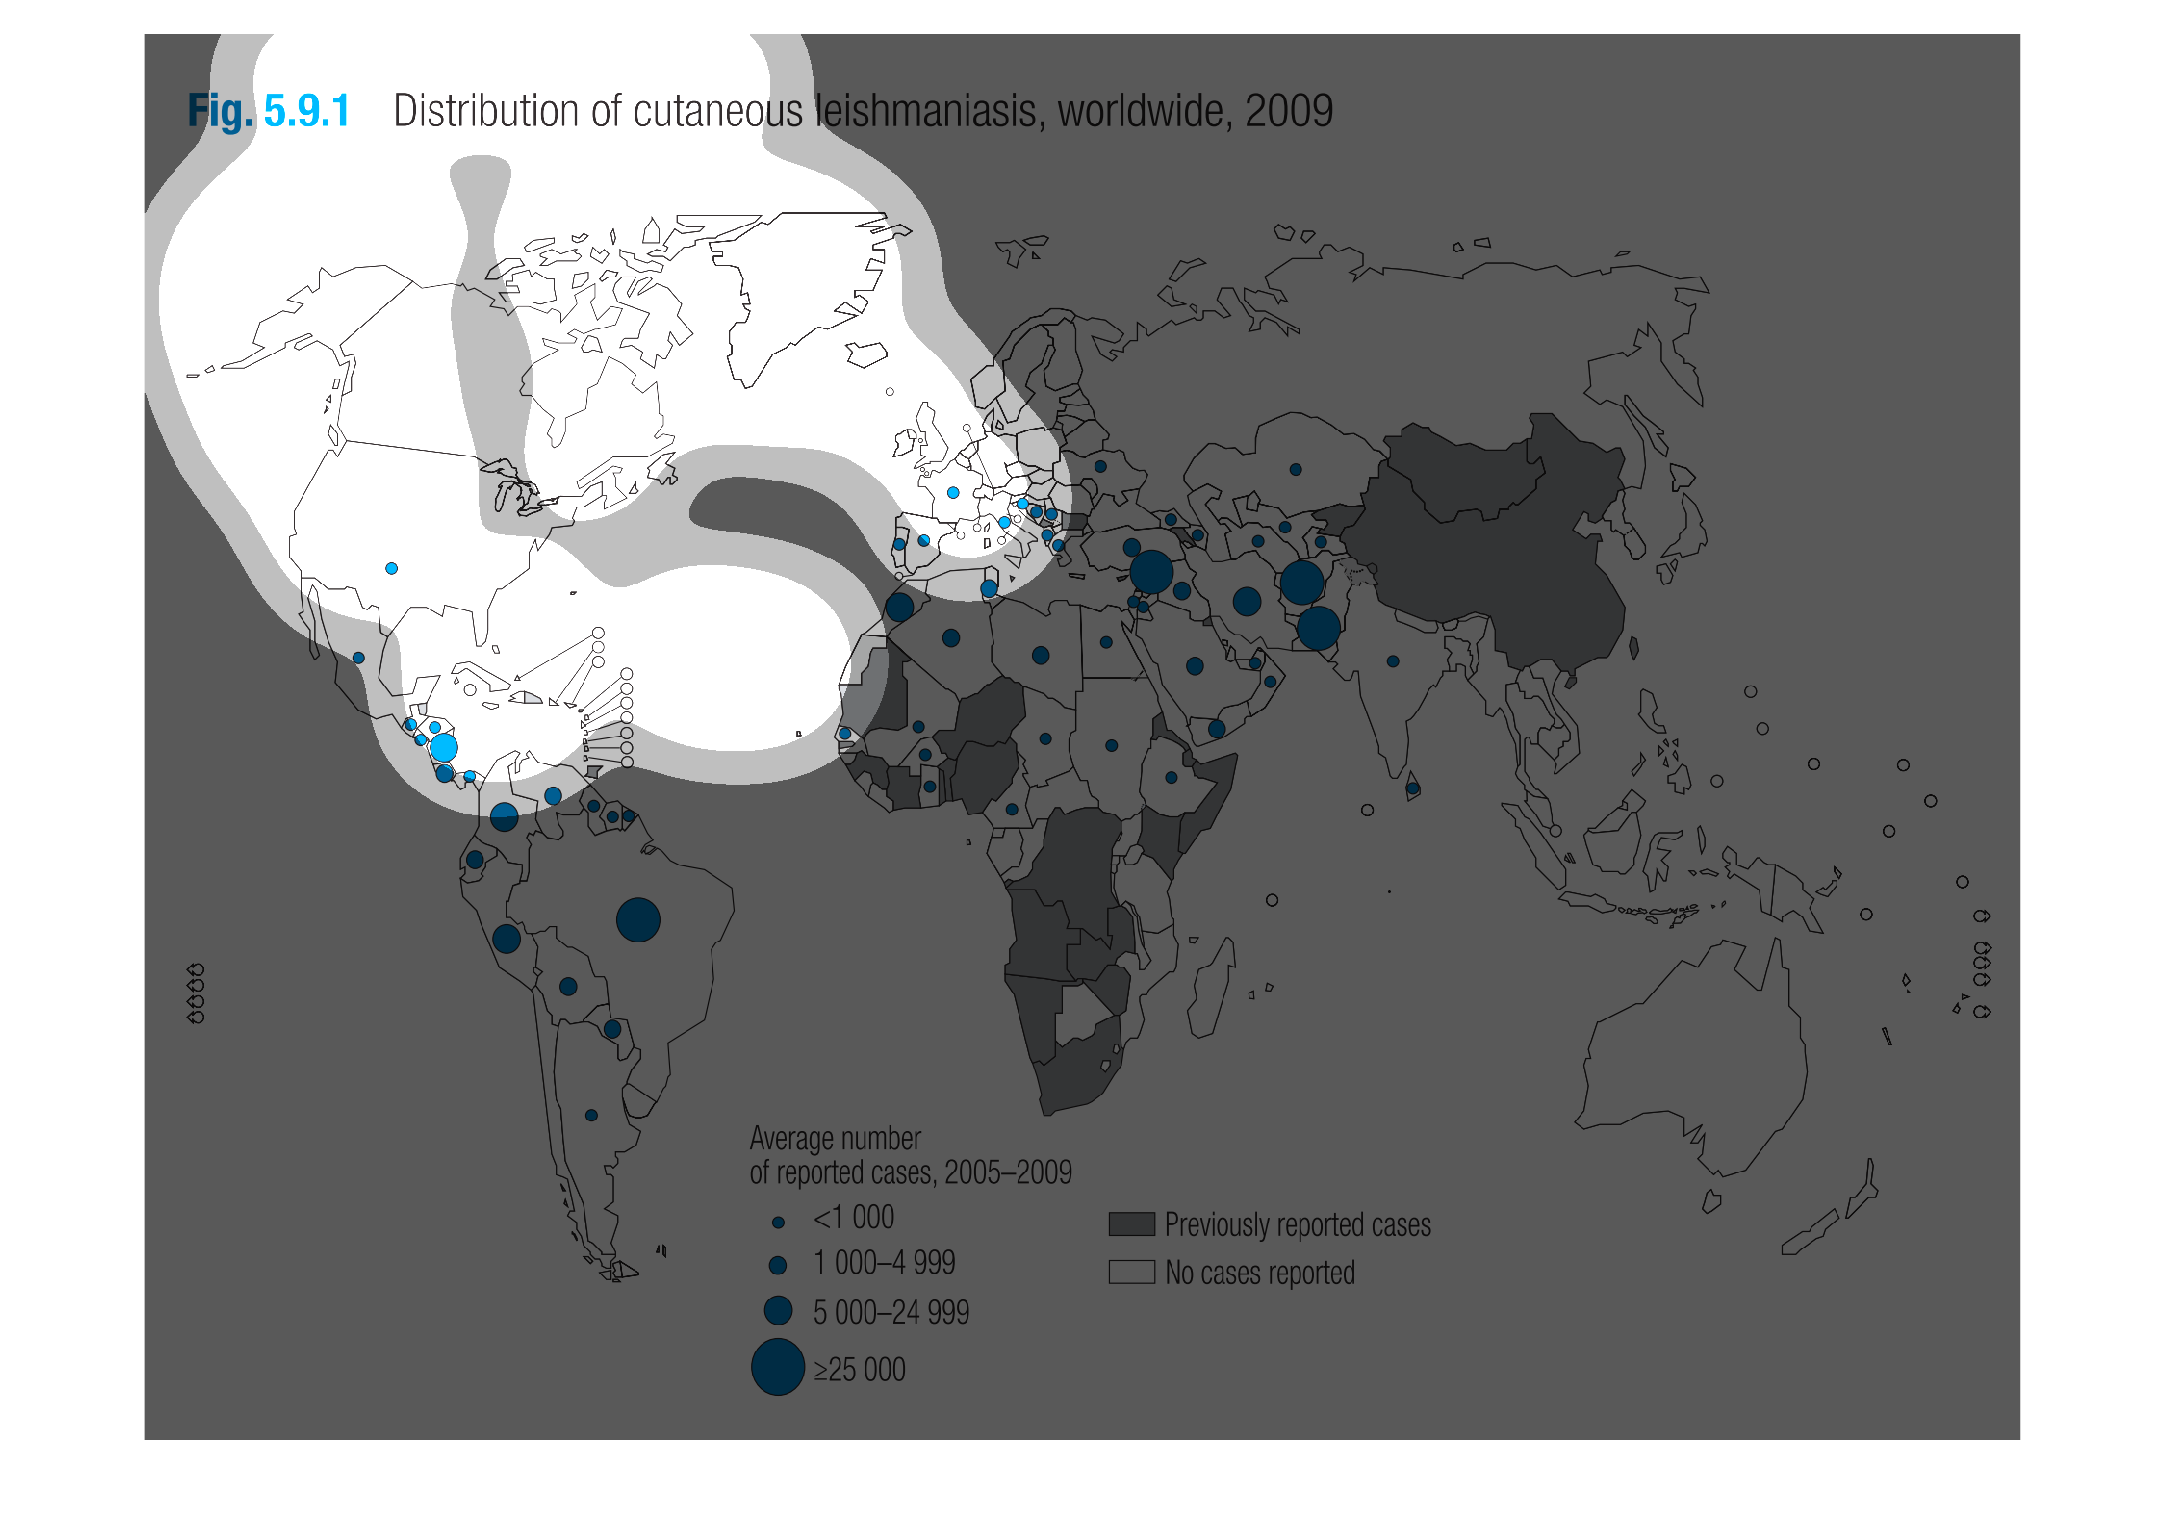
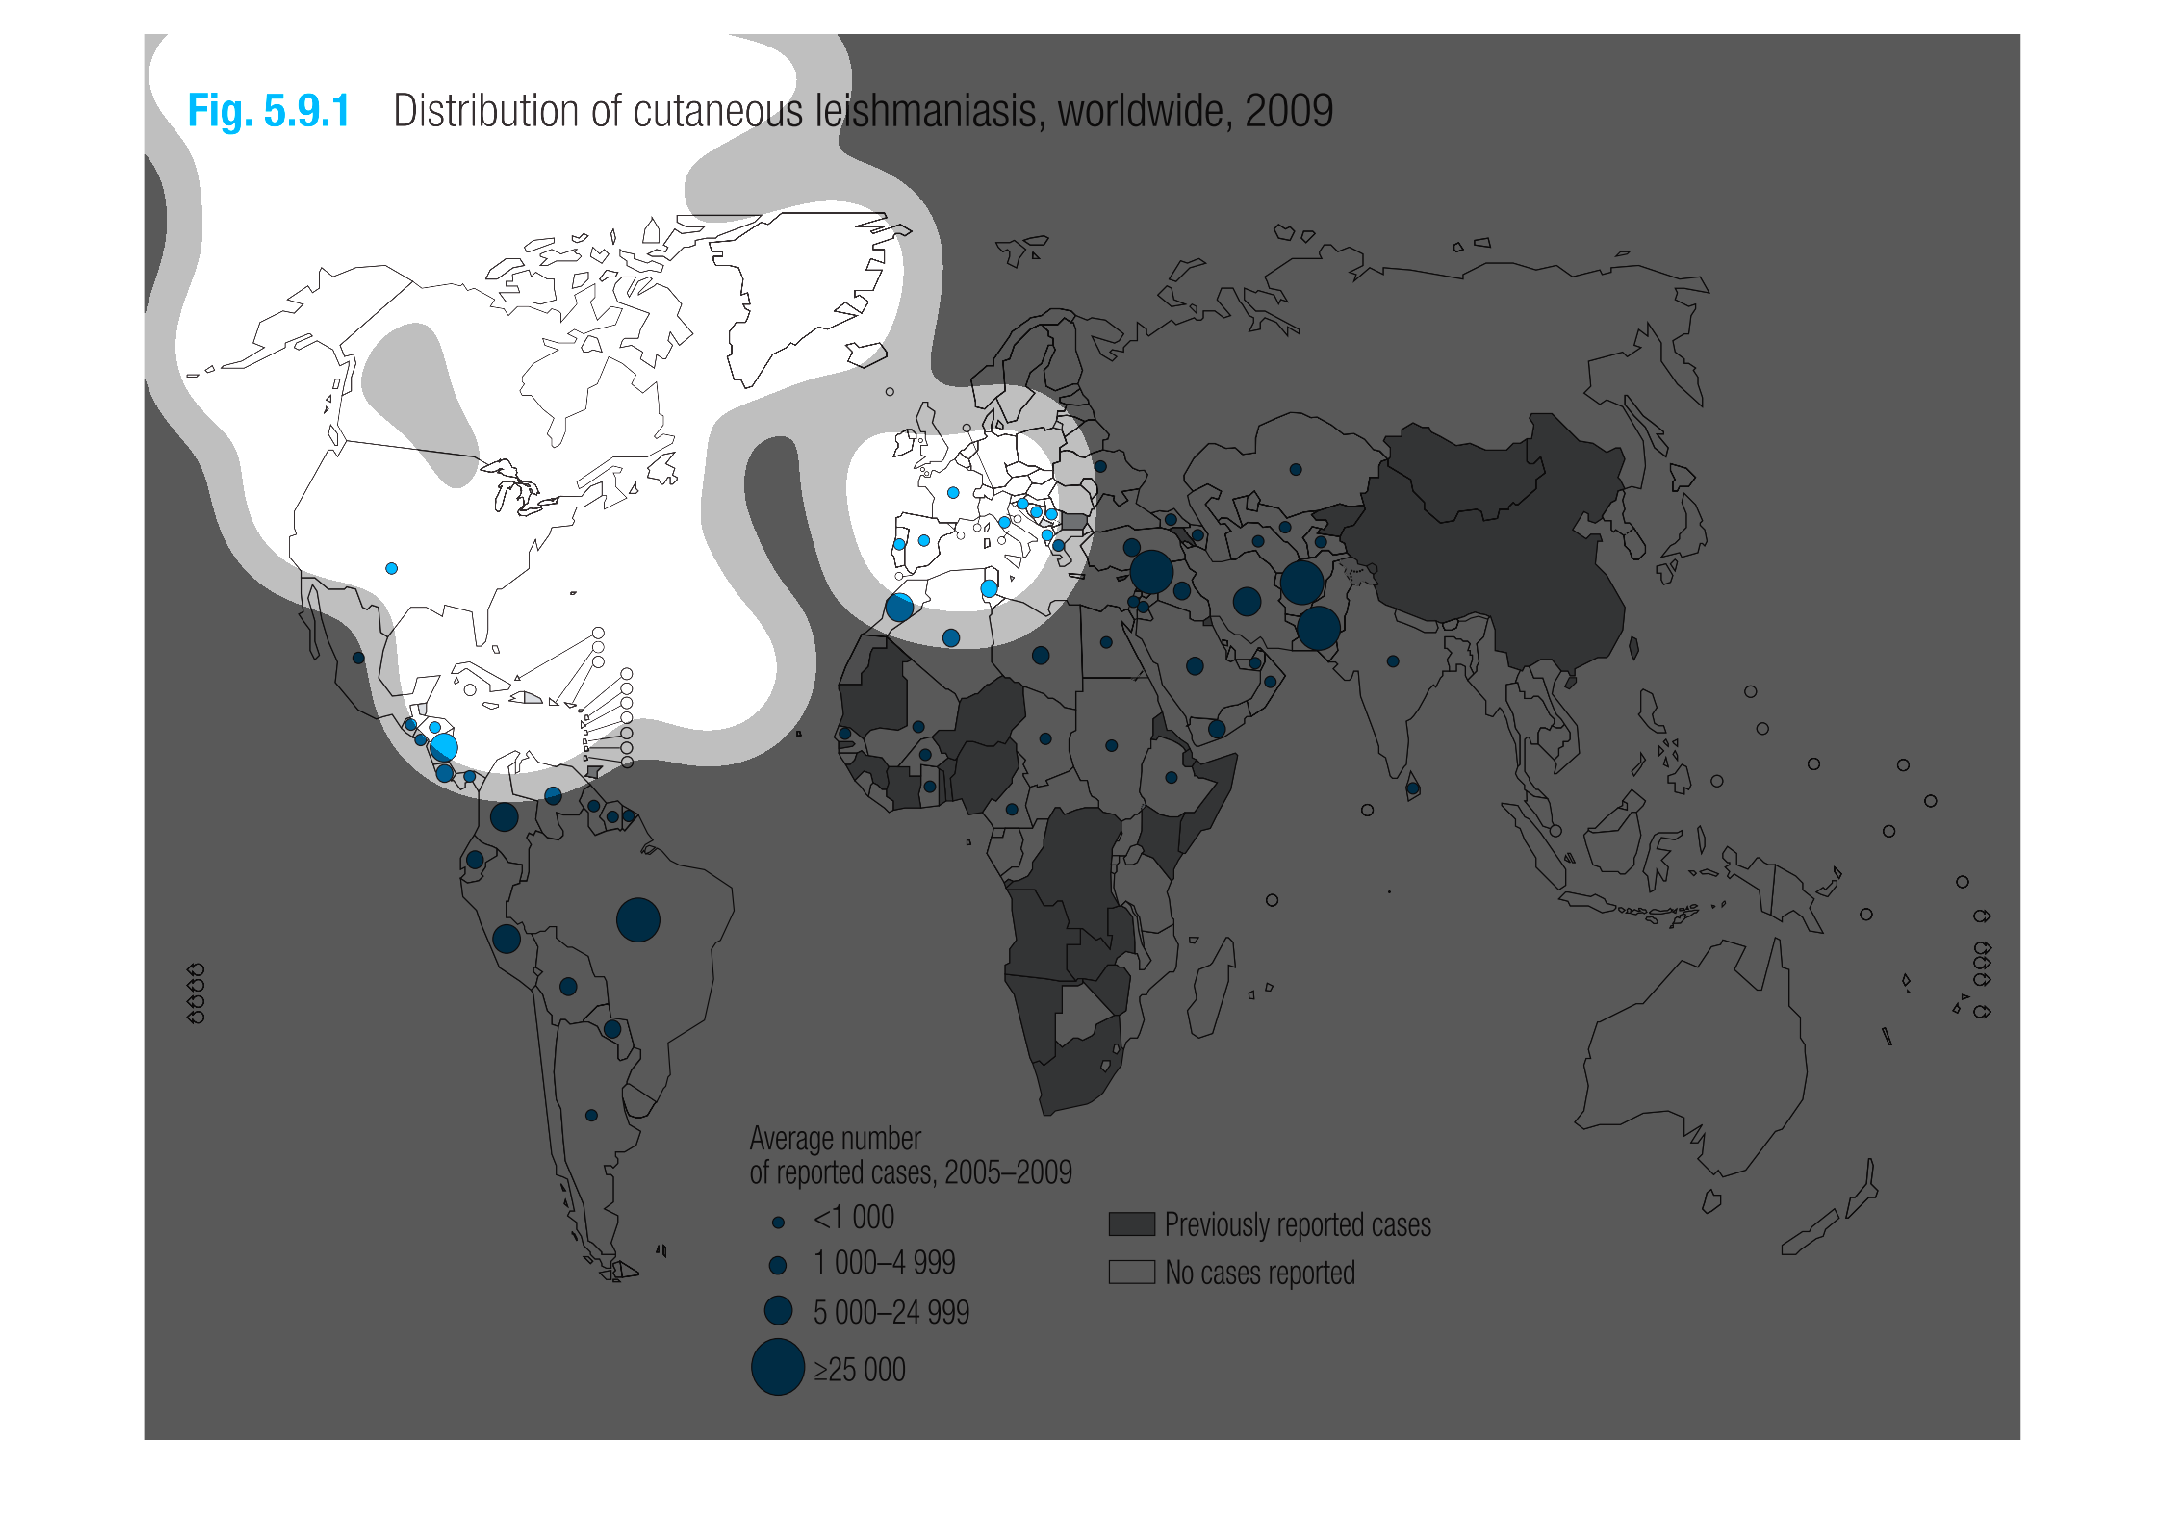
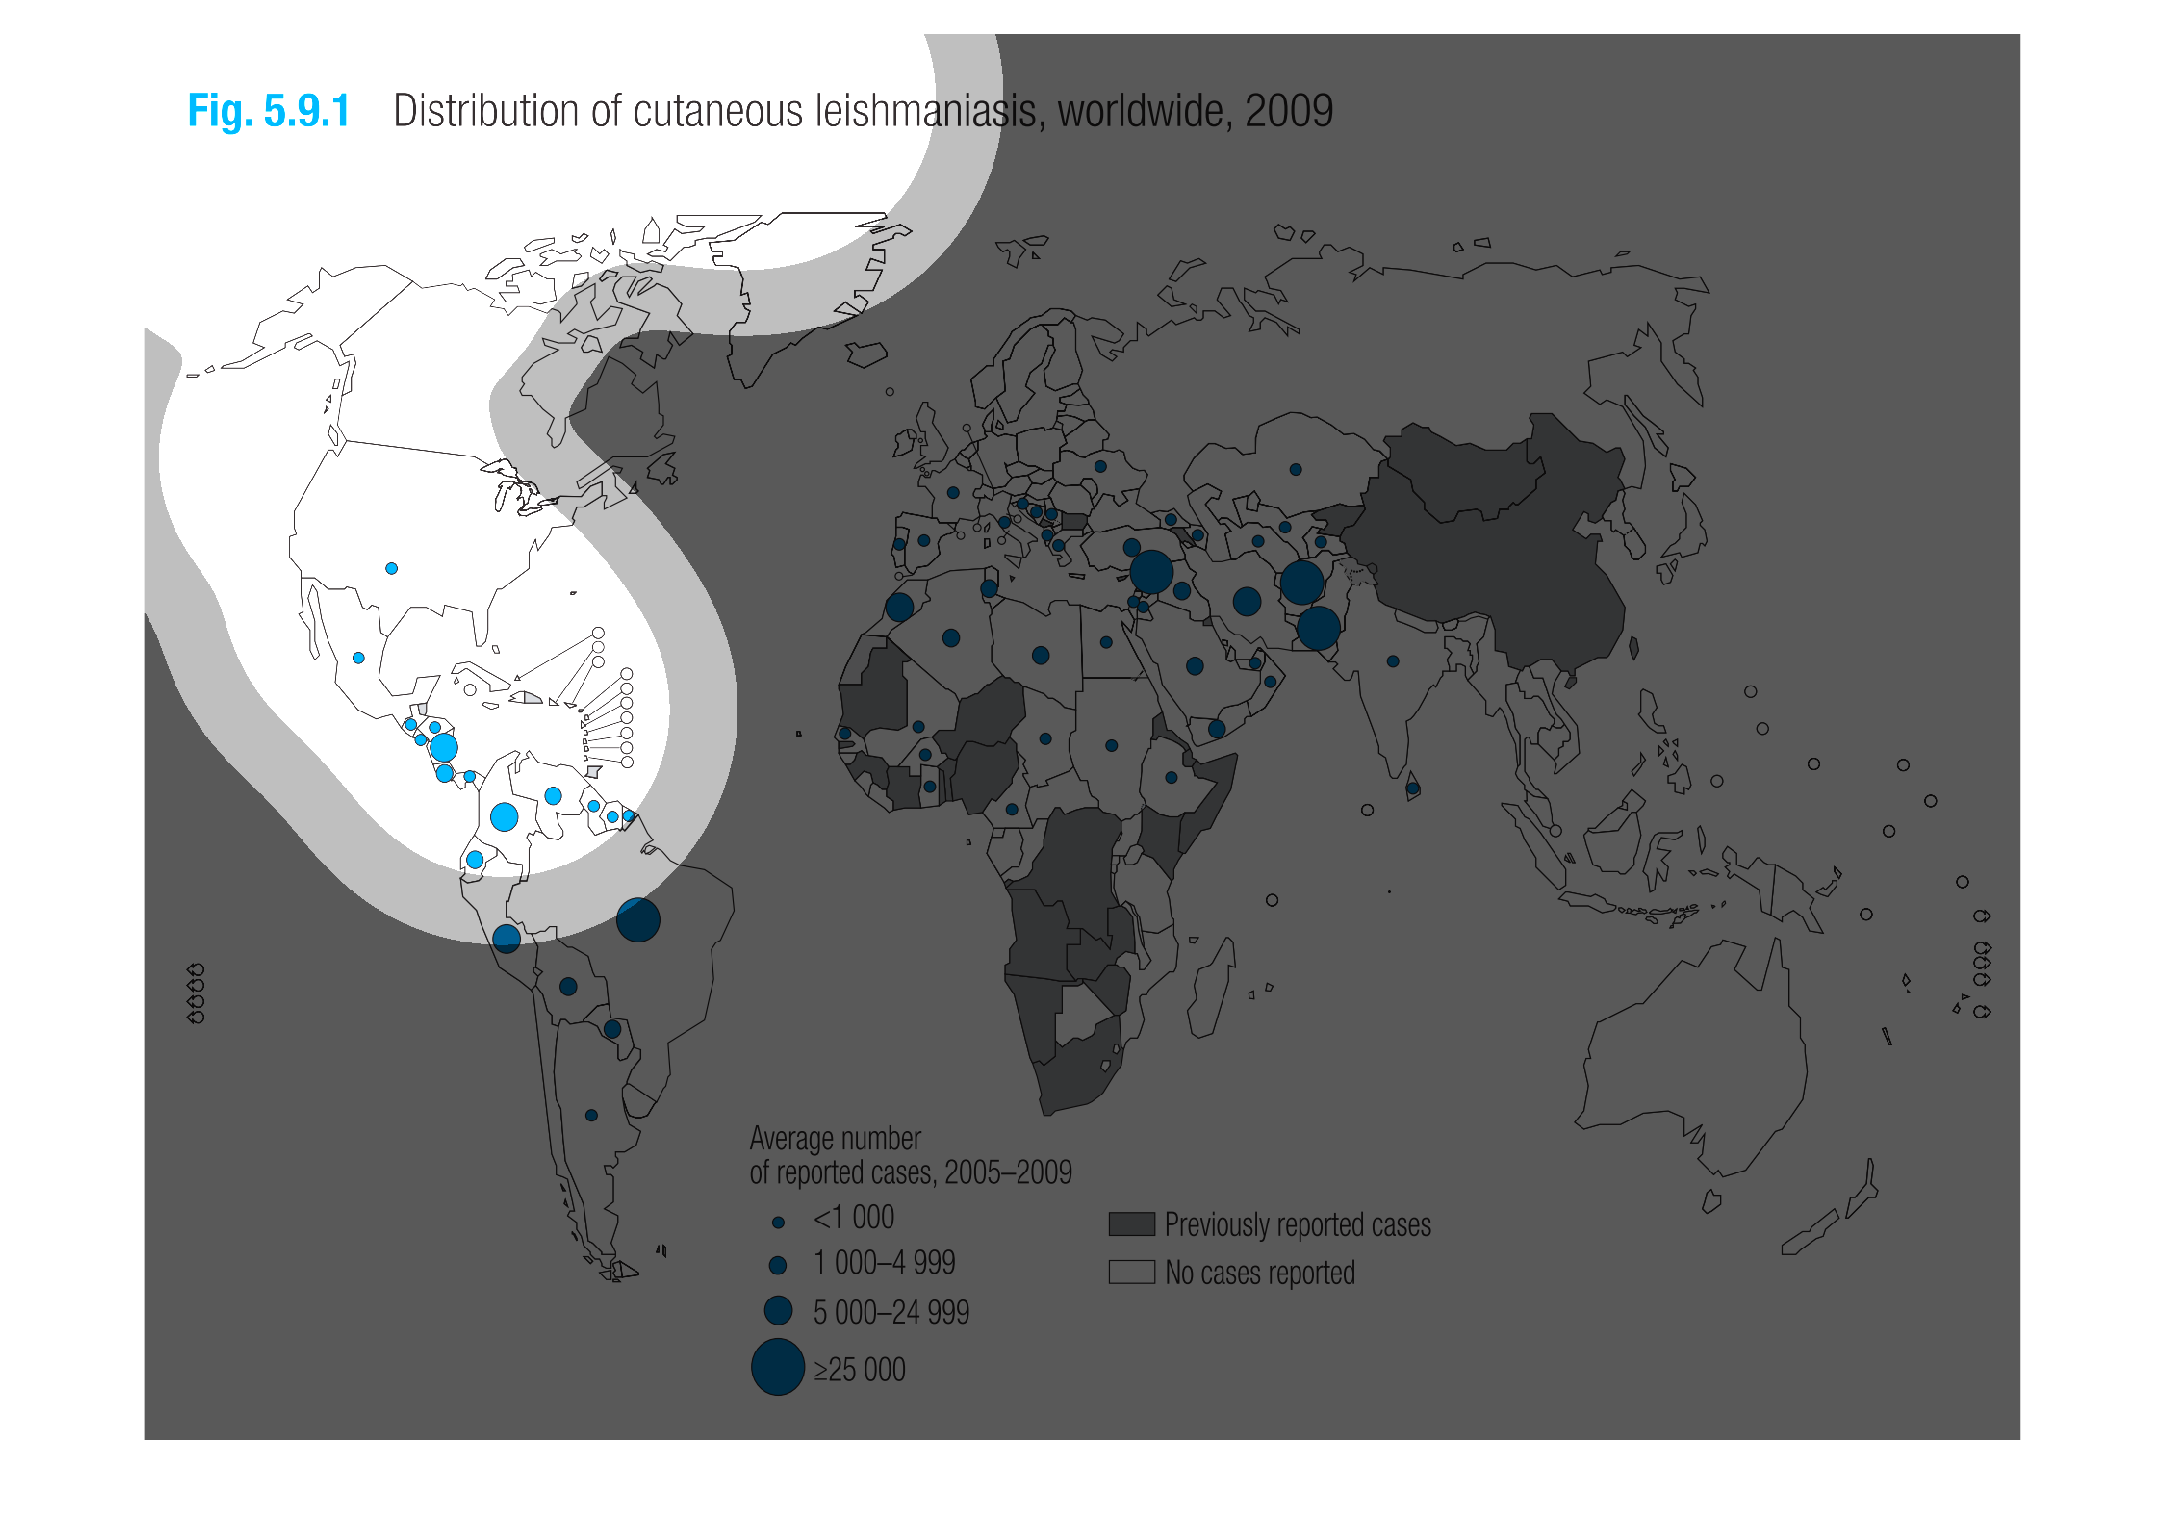
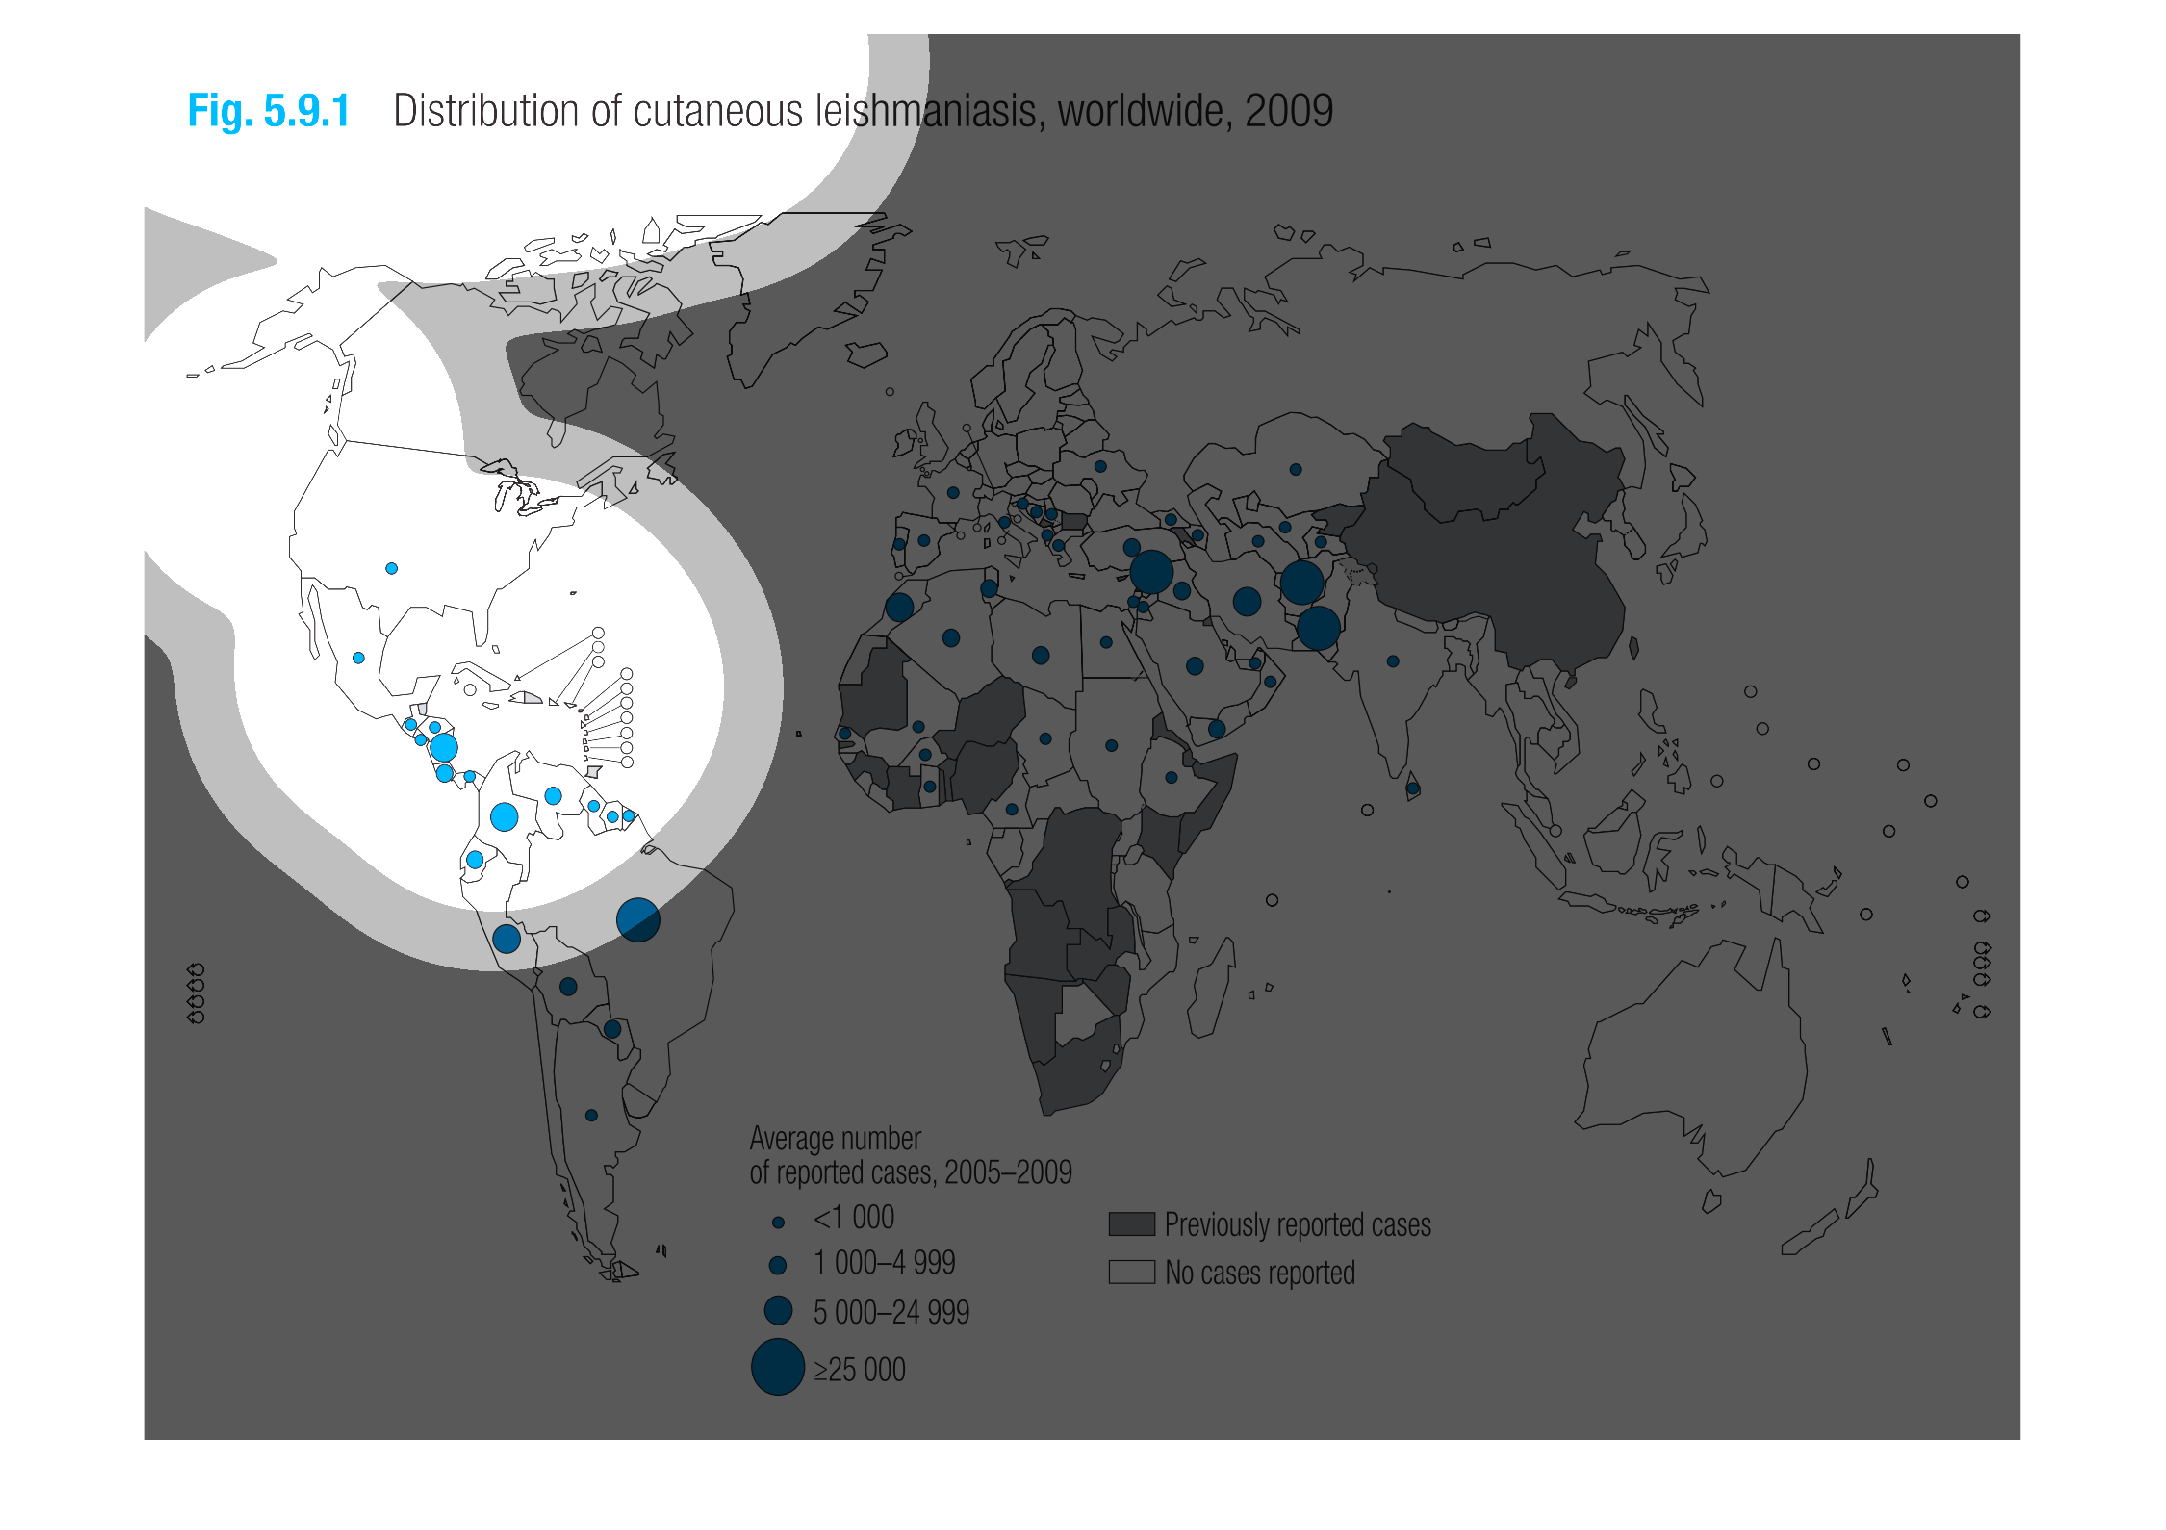
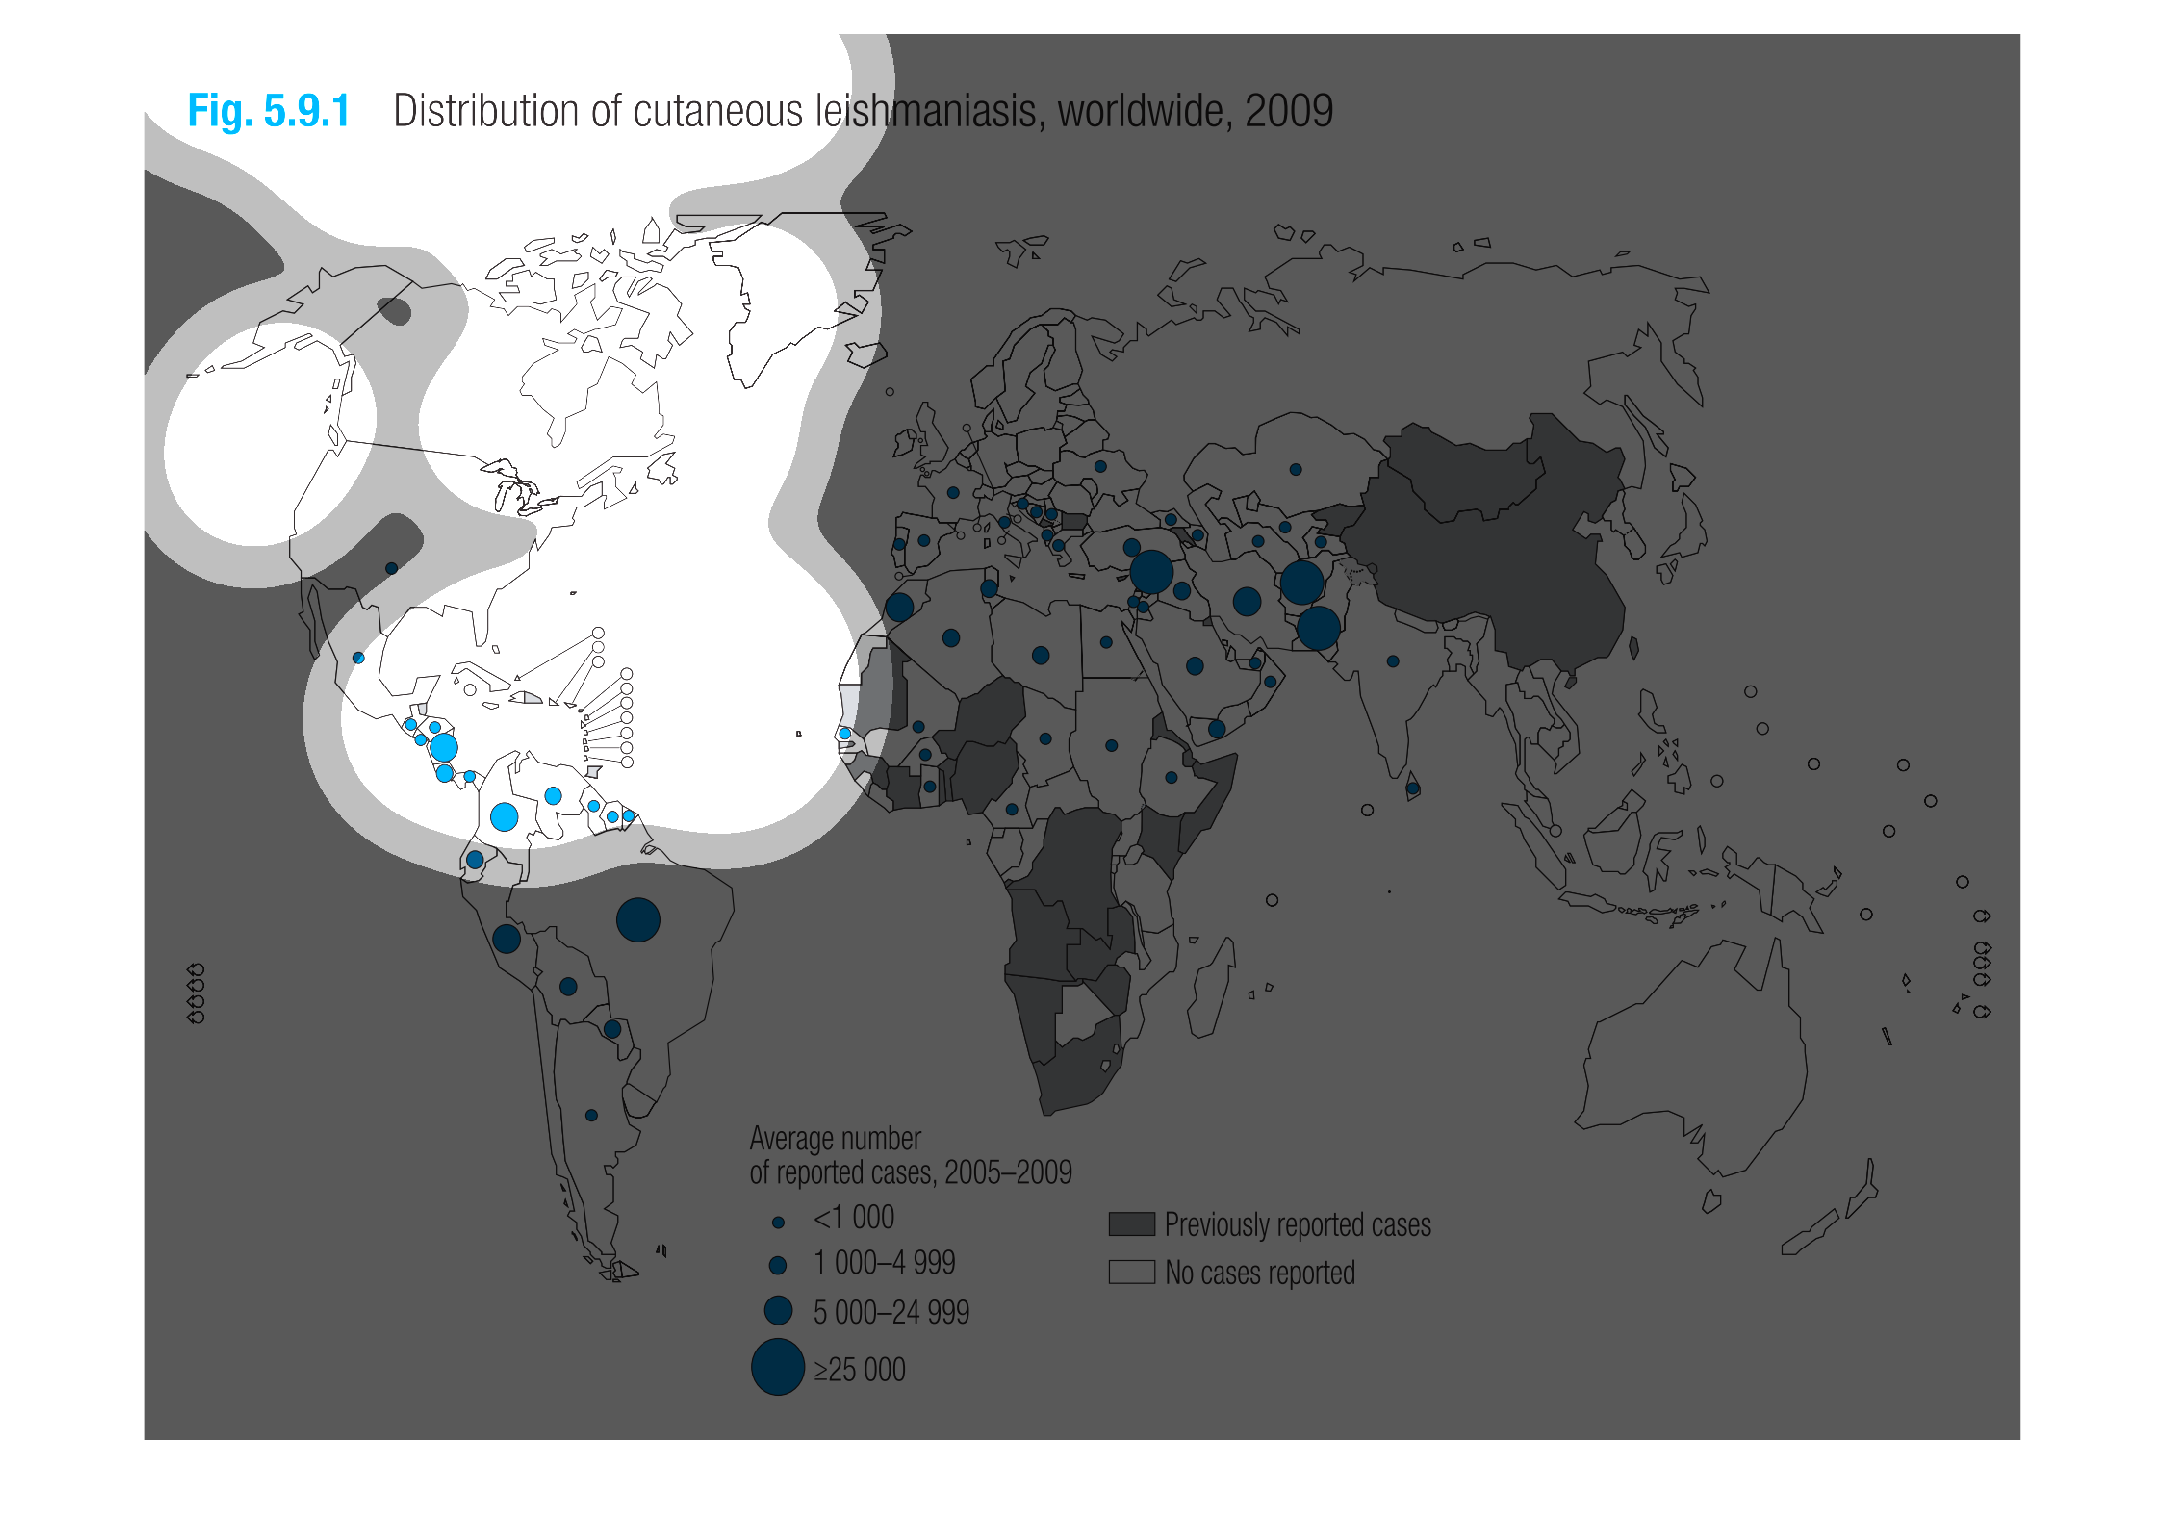
This chart describes distribution of cutaneous leishmaniasis, worldwide, for the year 2009.
Different categories on the chart are represented by different sized balls.
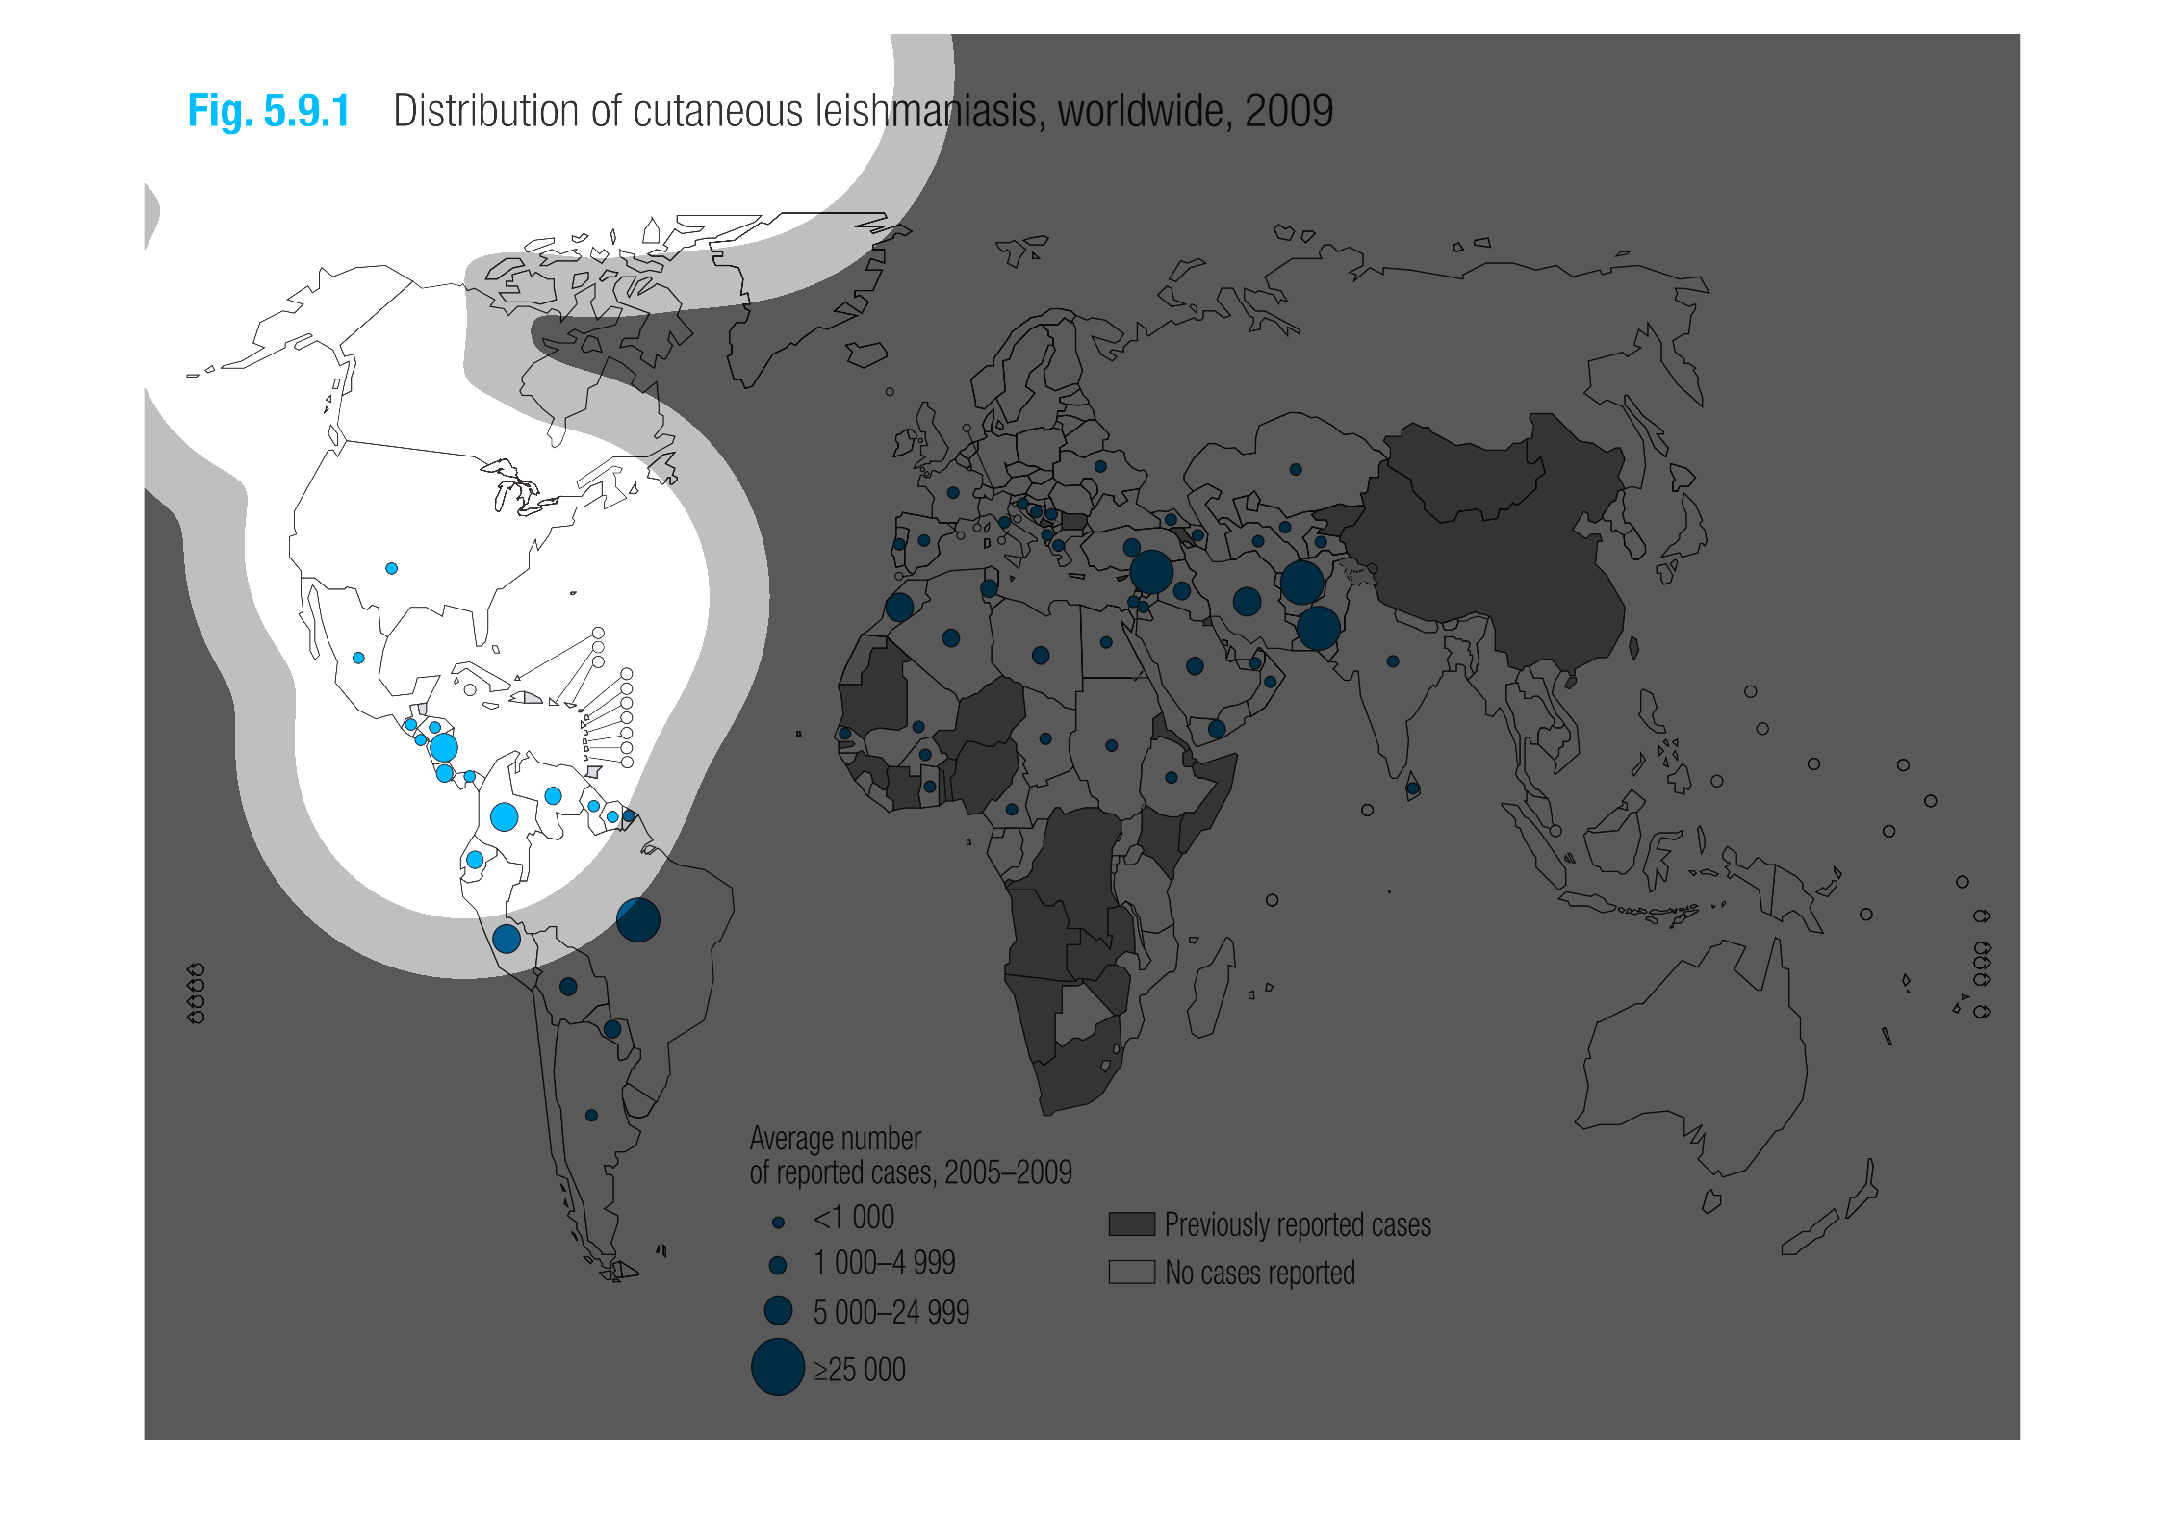
This is a map of the distribution of cutaneous leishmaniasis in 2009 across the world. The
larger the blue dots the more people are affected. It appears that a large portion is in central/south
america.
Distribution of cutaneous leishmania worldwide in 2009. This condition is highly present in
middle eastern countries and latin american countries but basically non existent everywhere
else in the world.
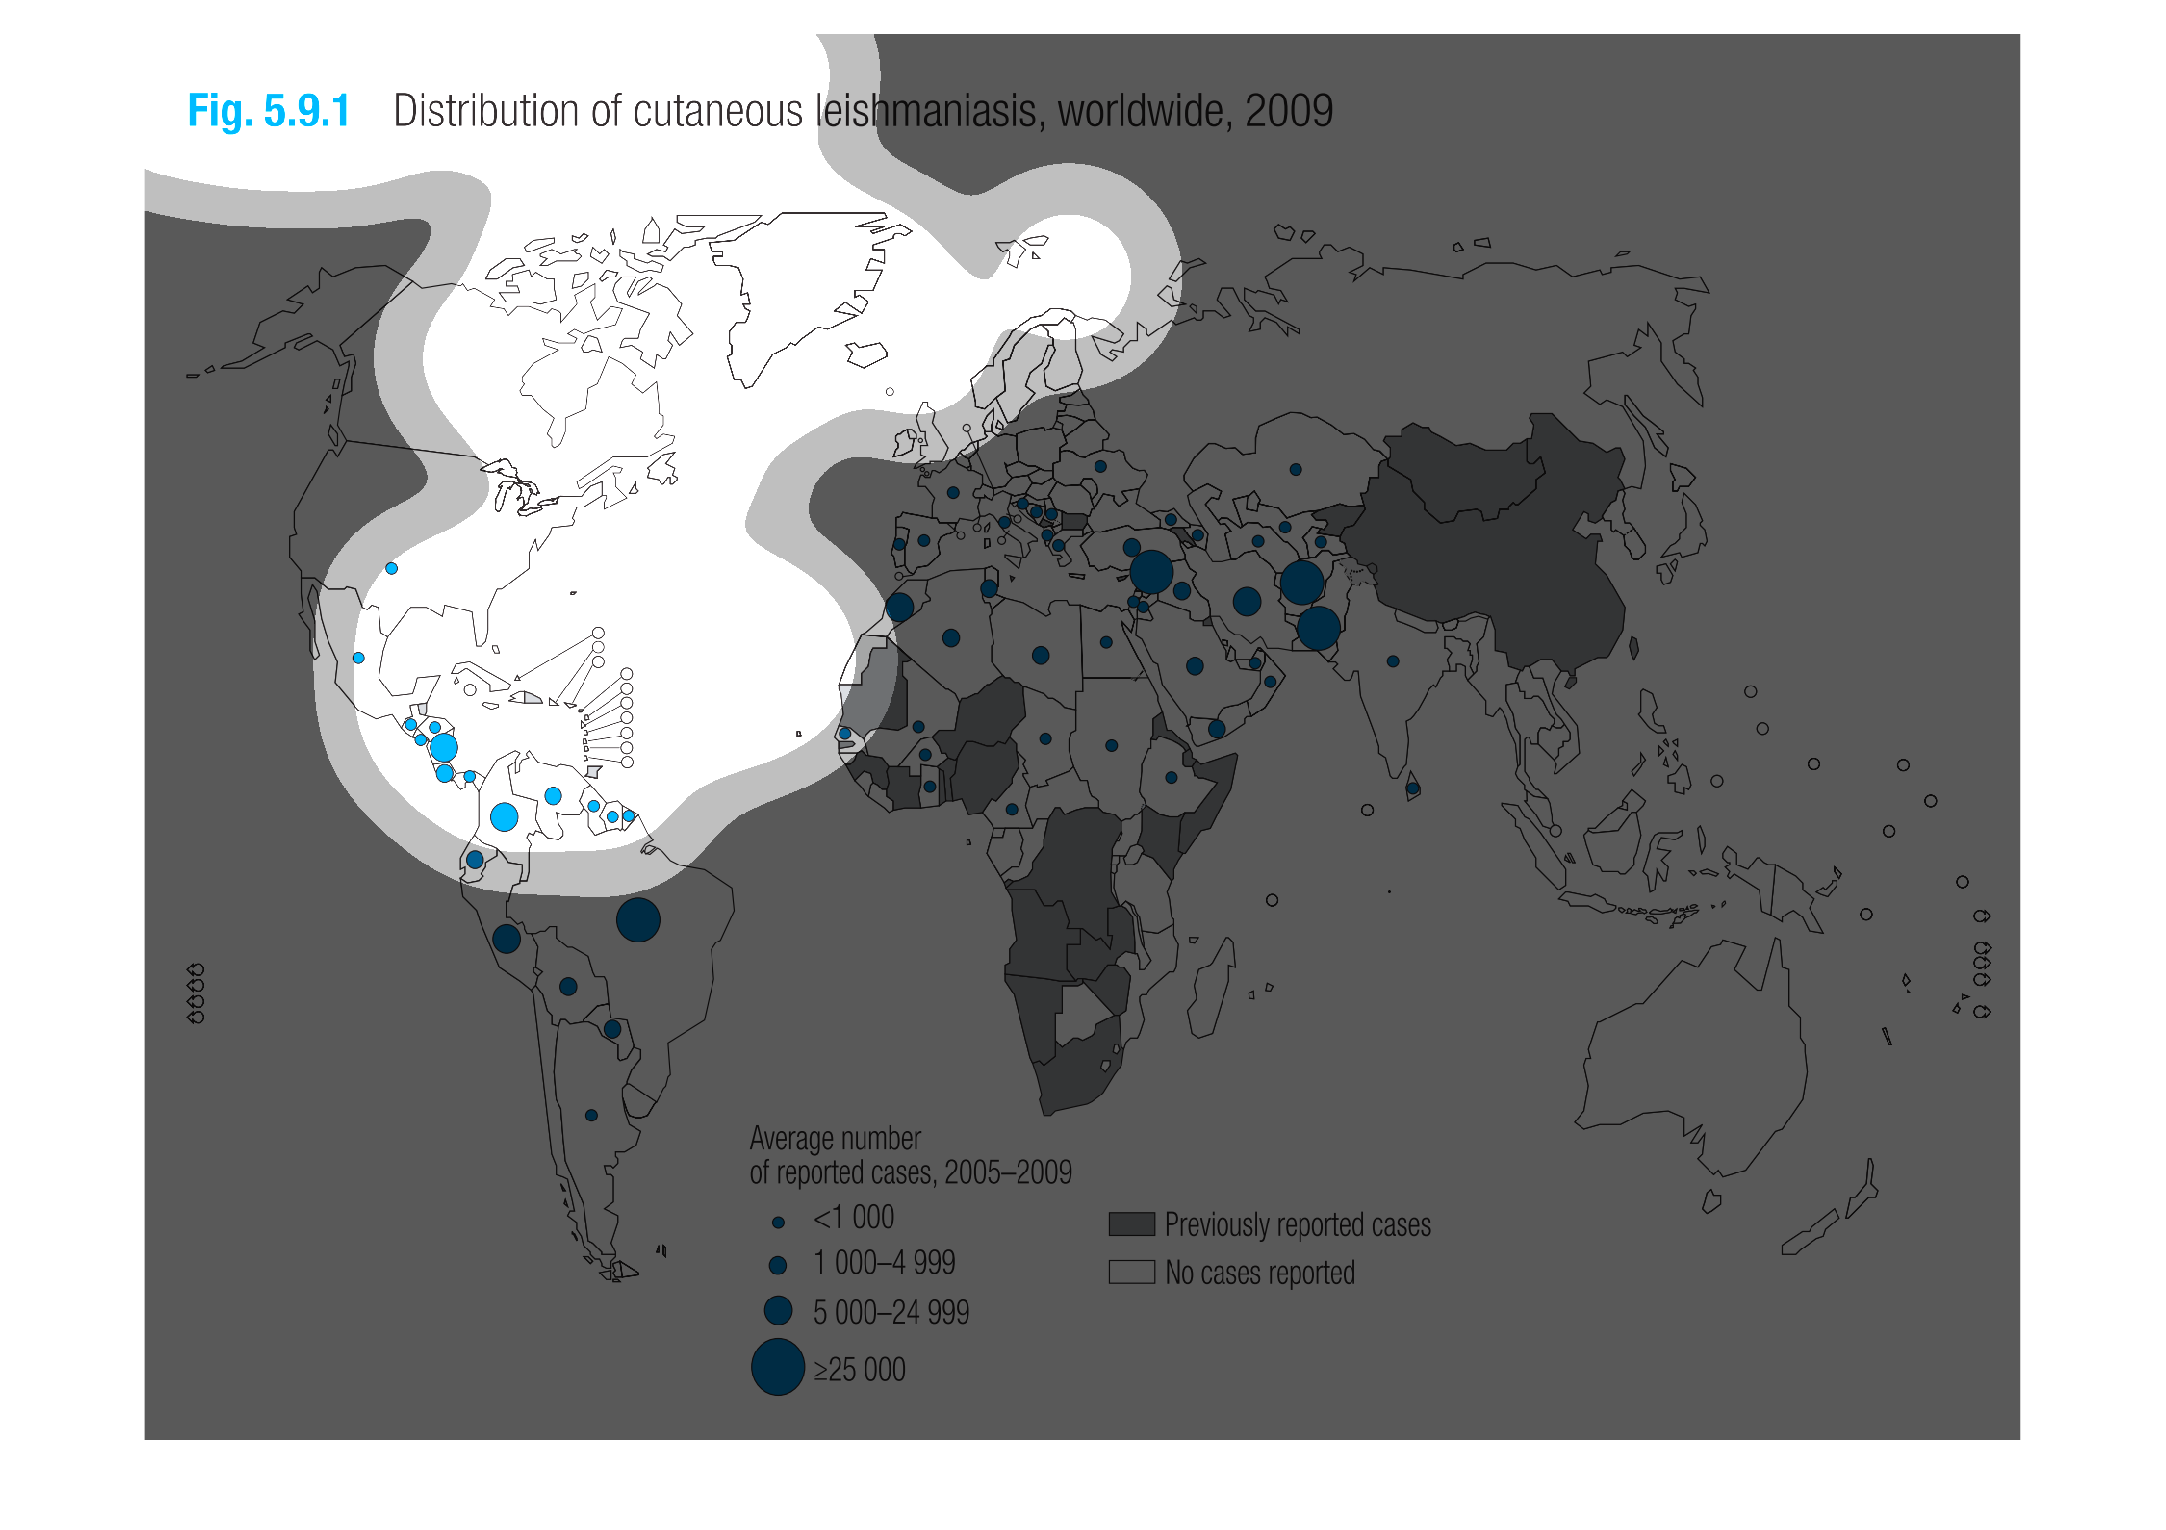
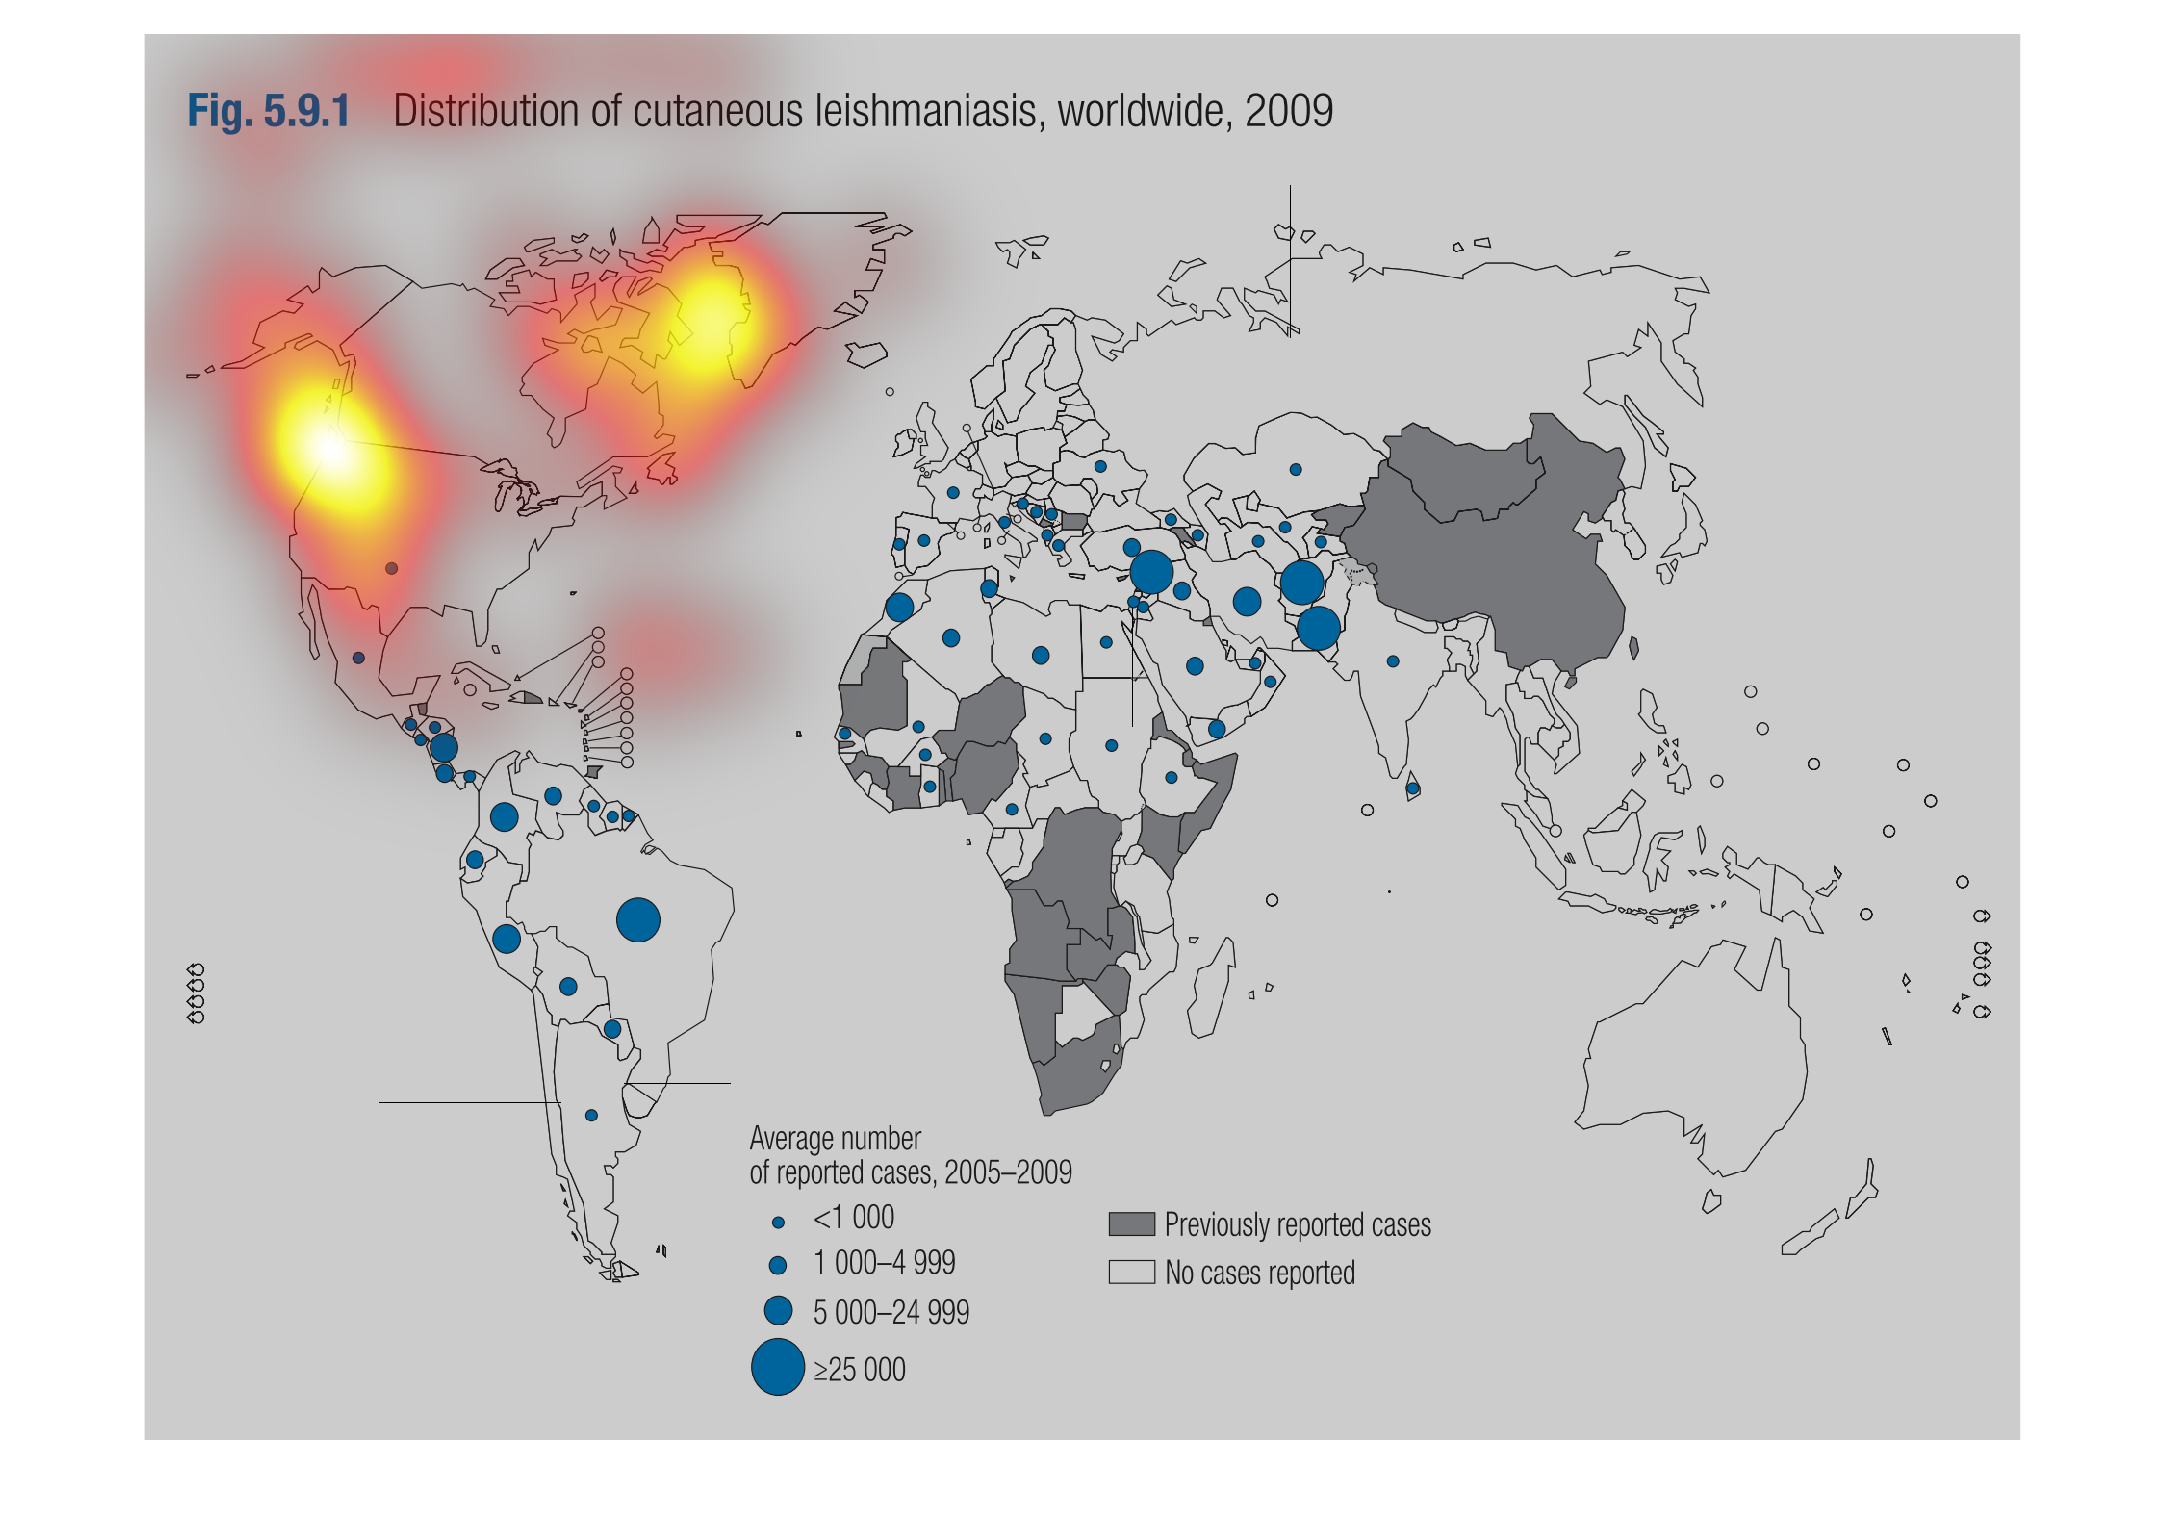
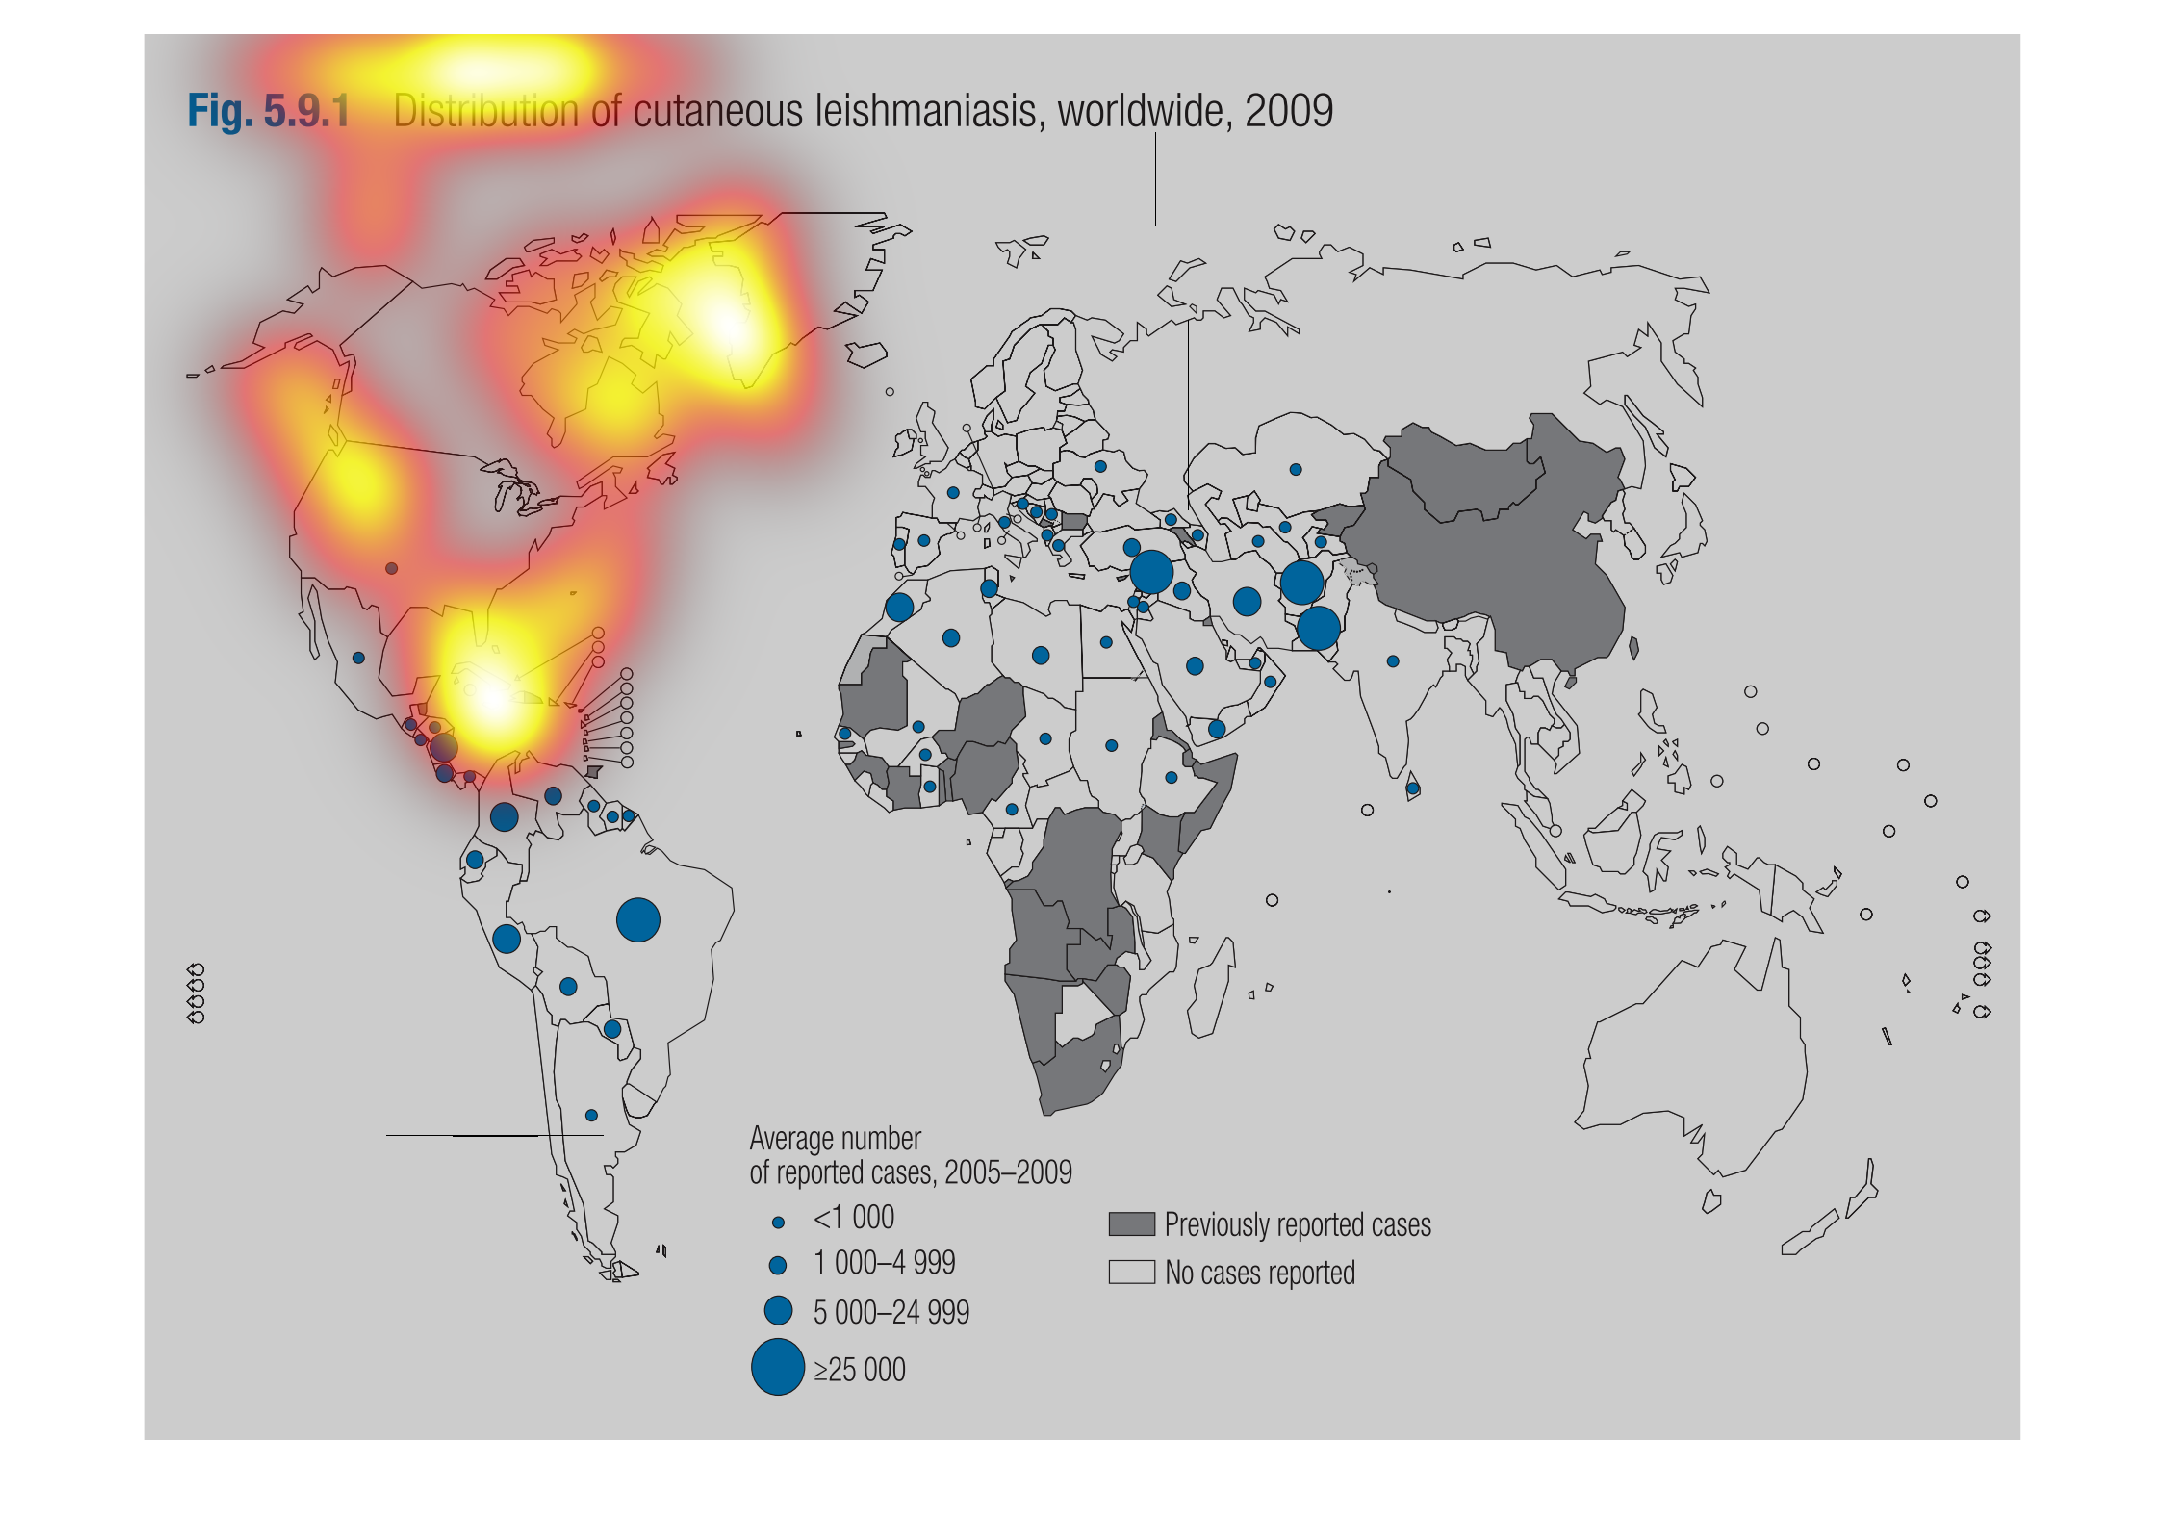
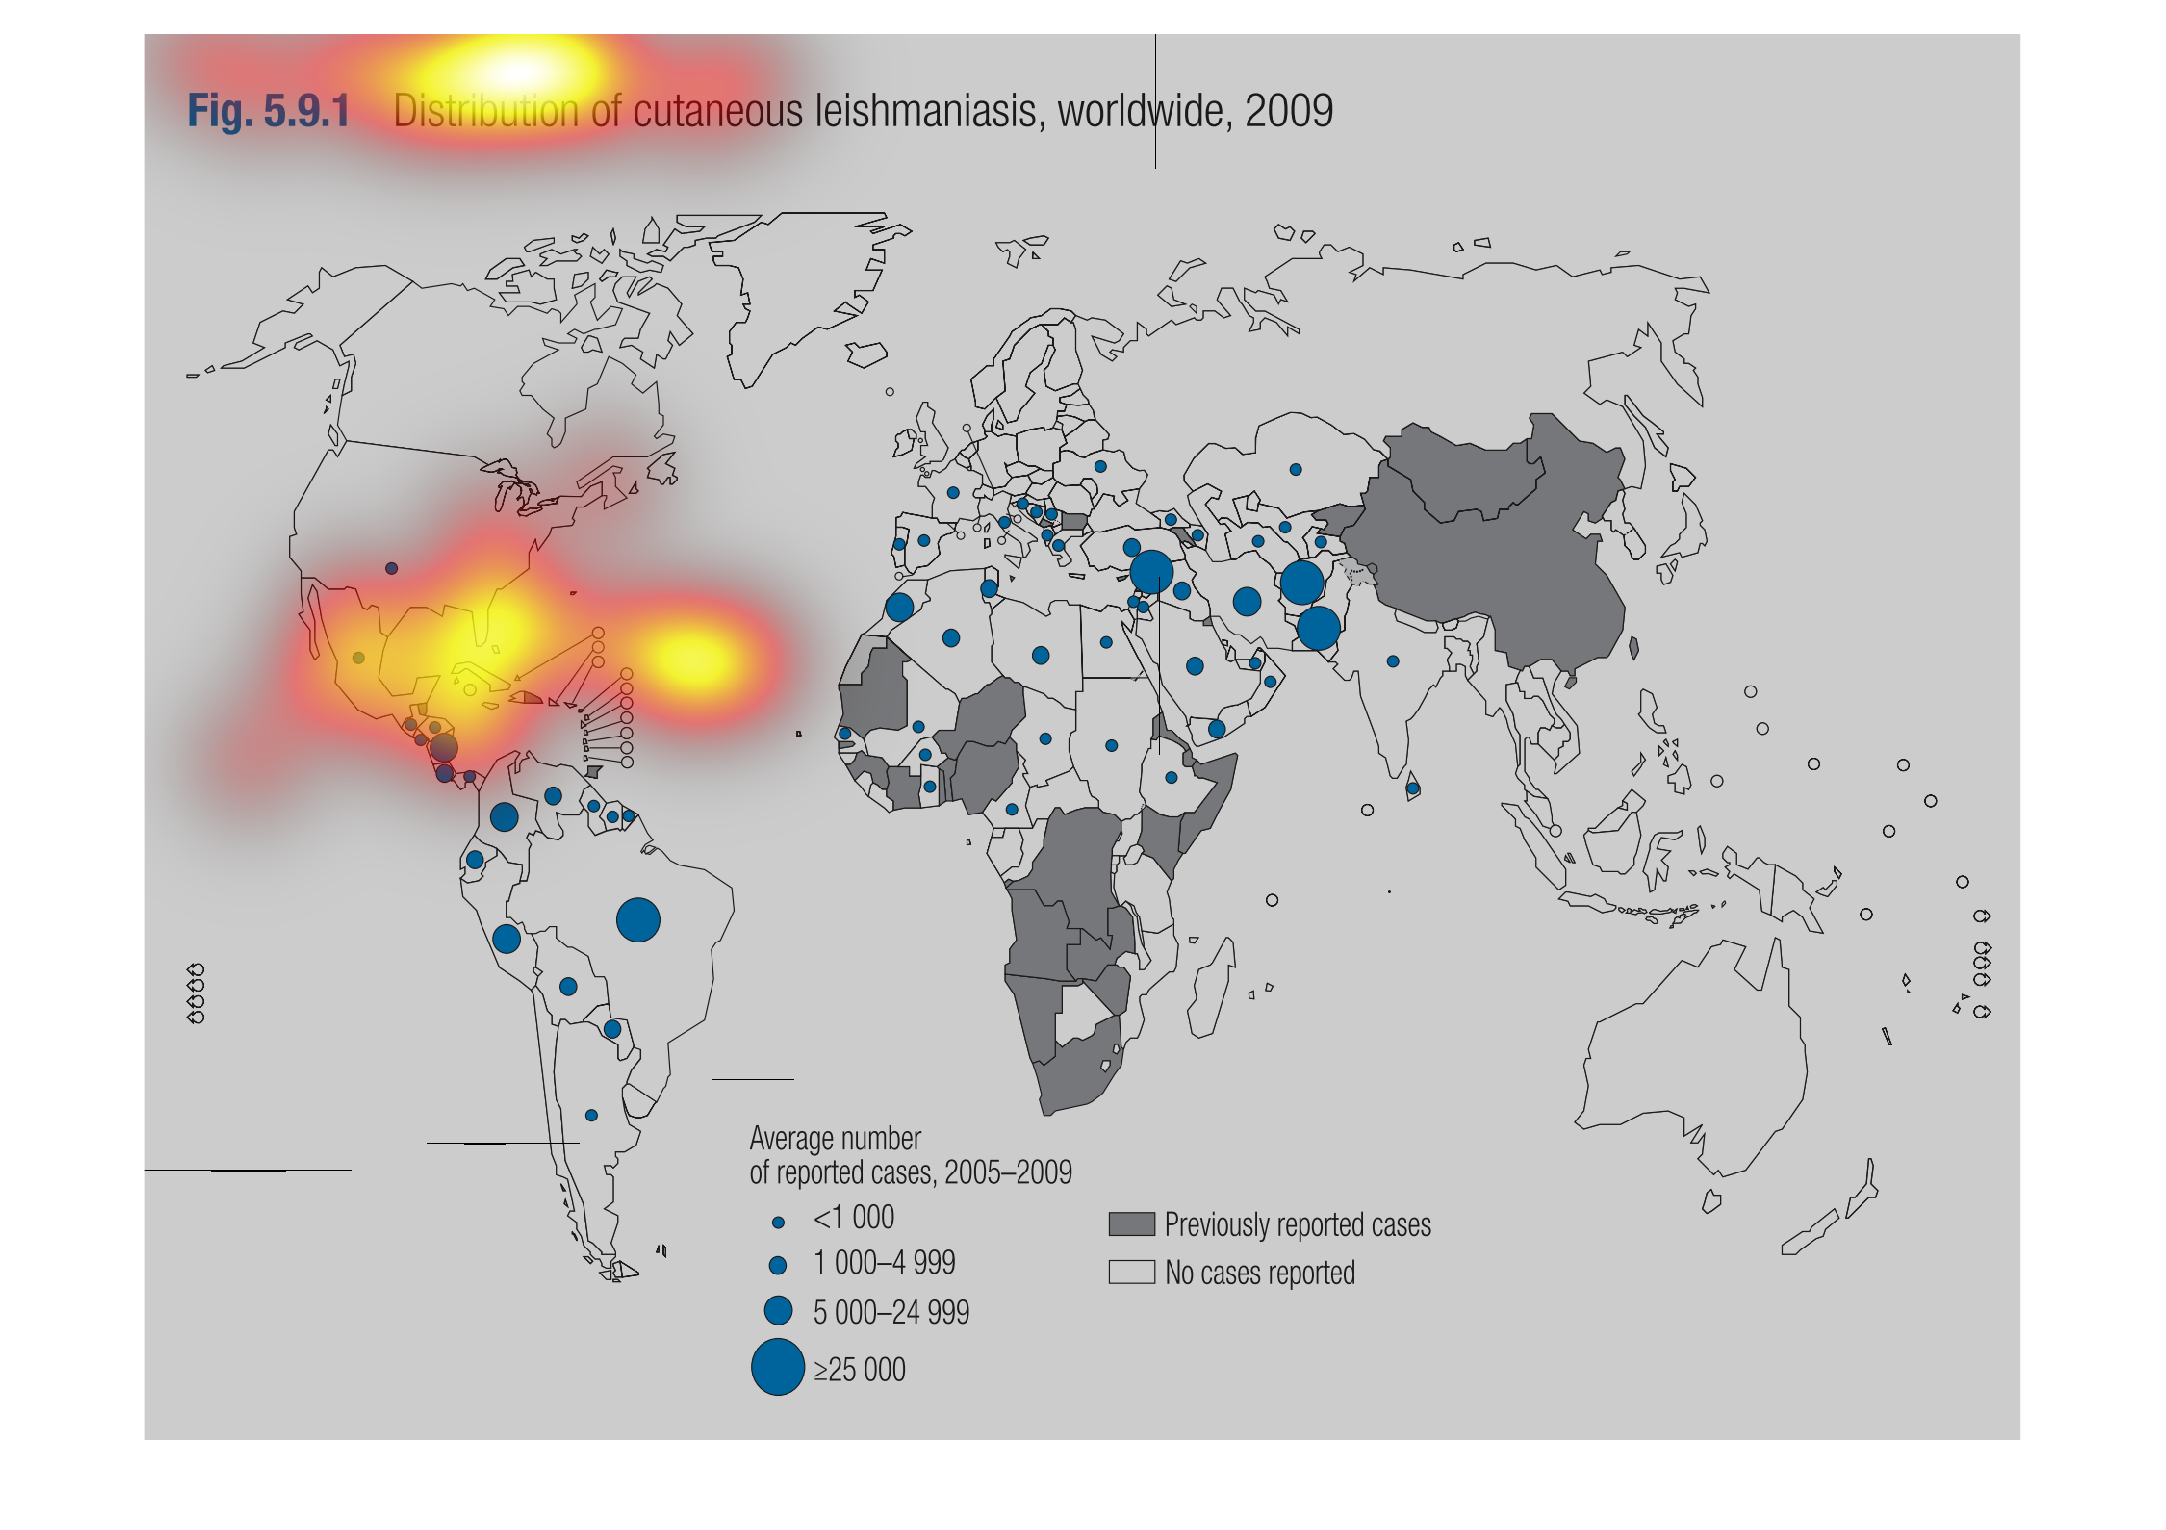
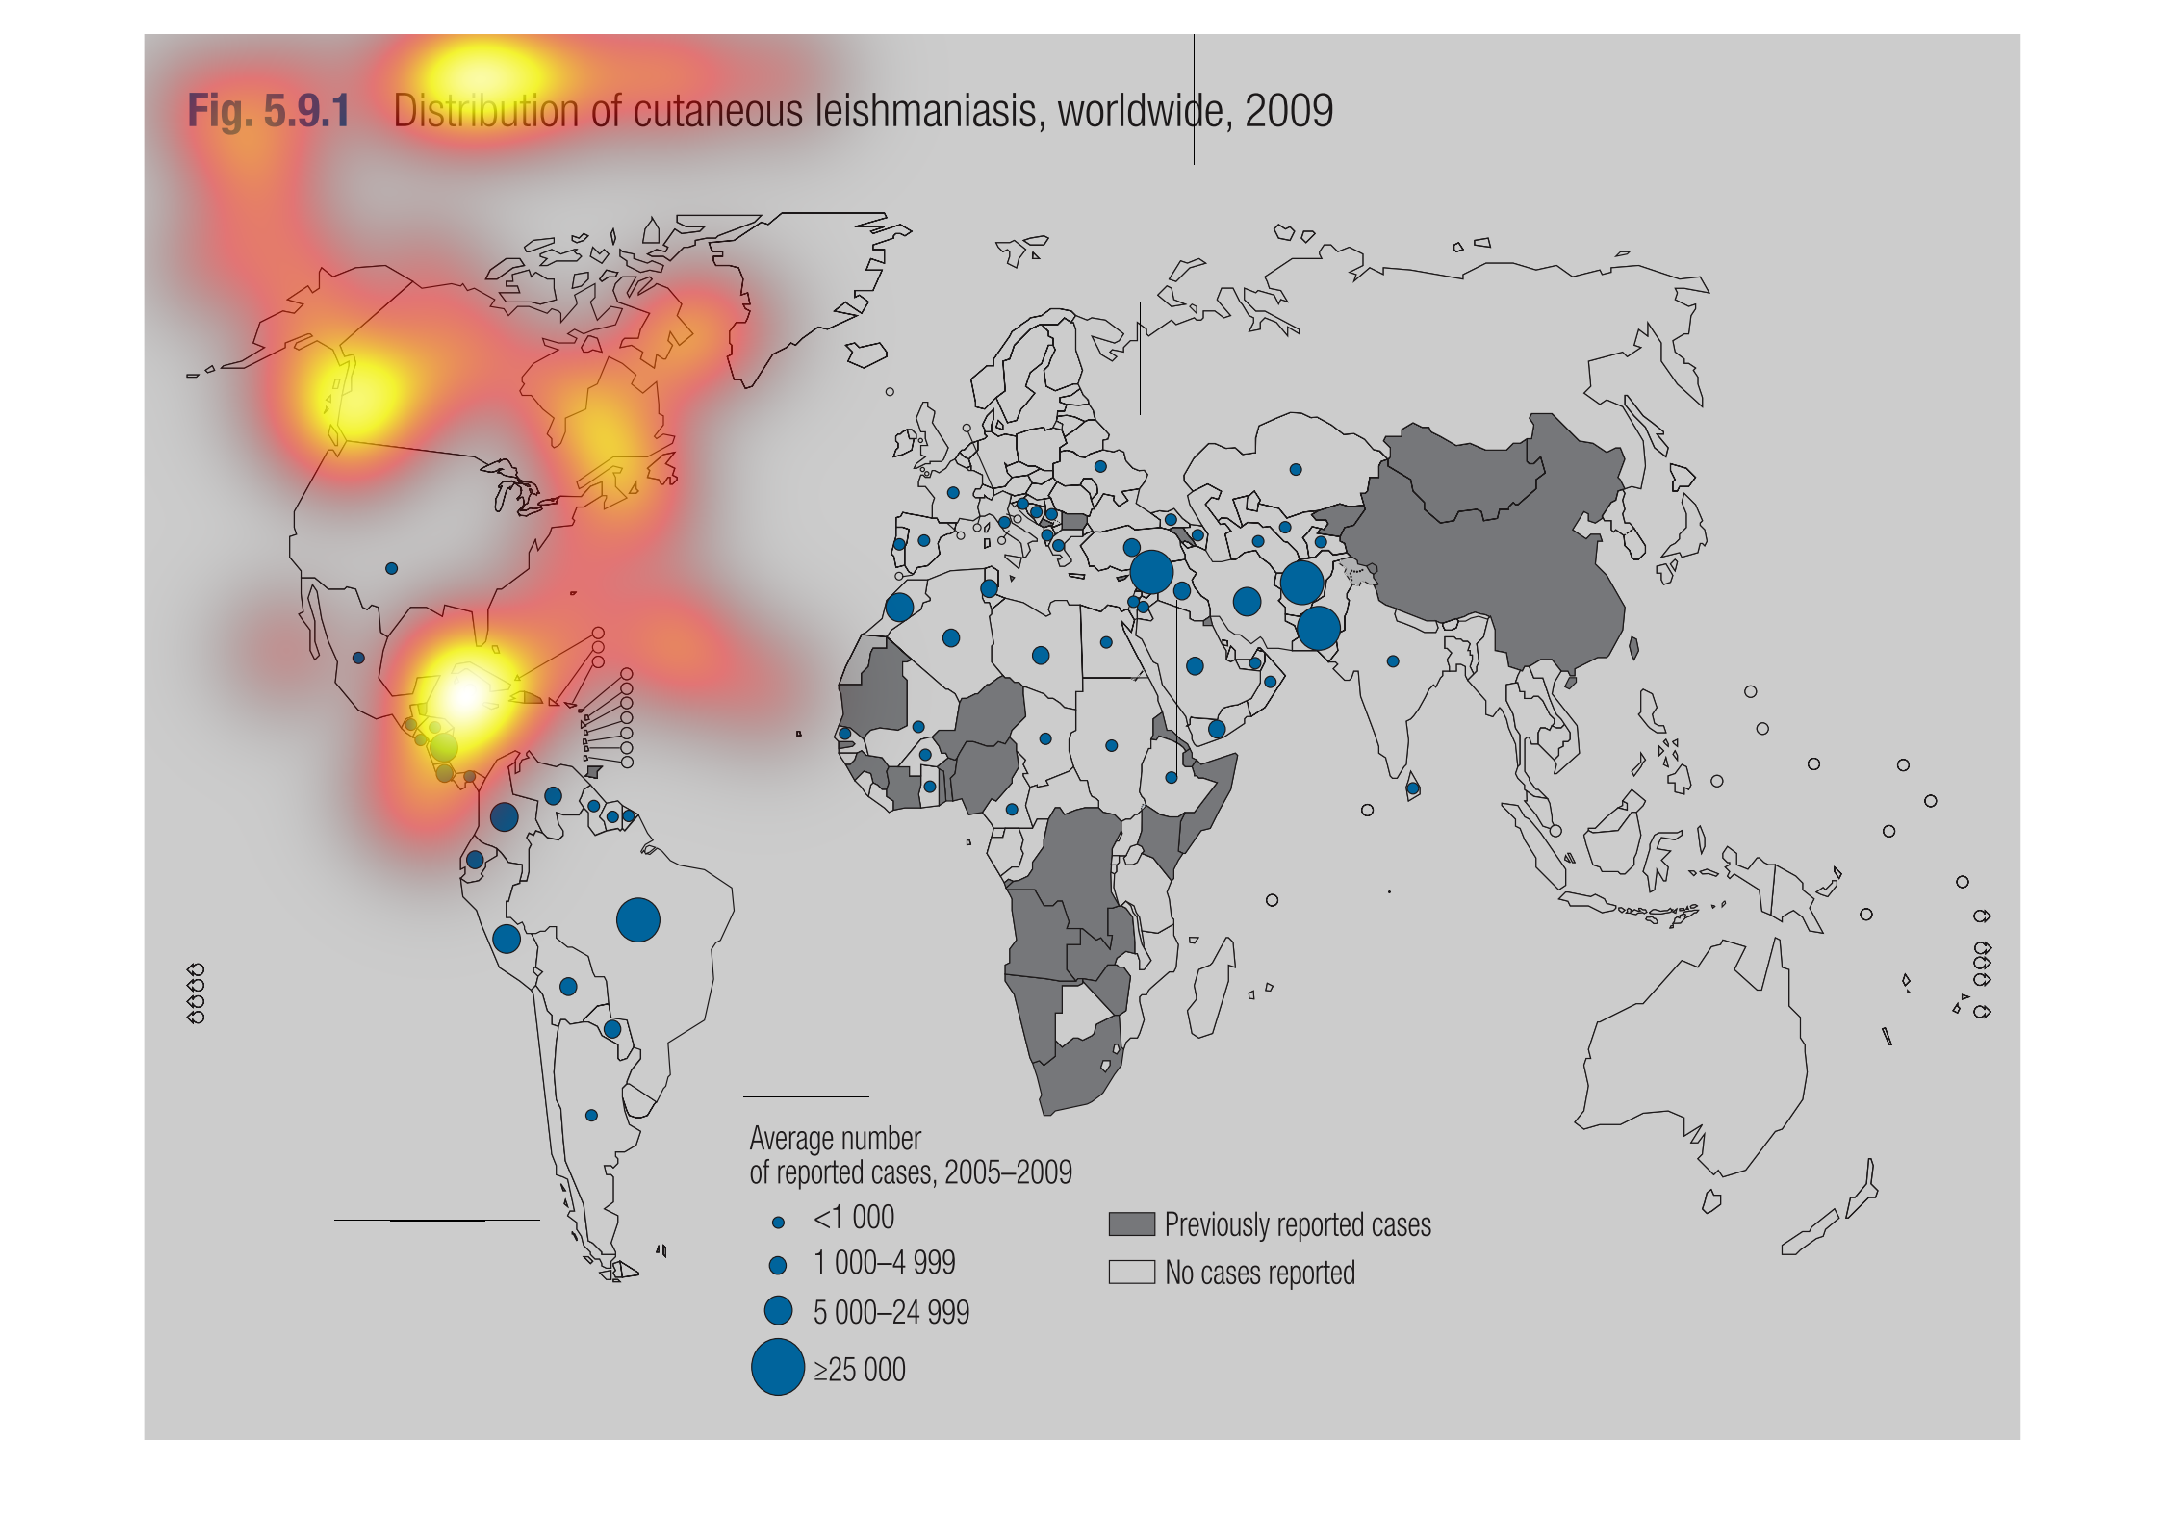
The chart below depicts a global views of distribution of cutaneous leishmaniasis worldwid
in the year of 2009. The US seemed to get little to nothing
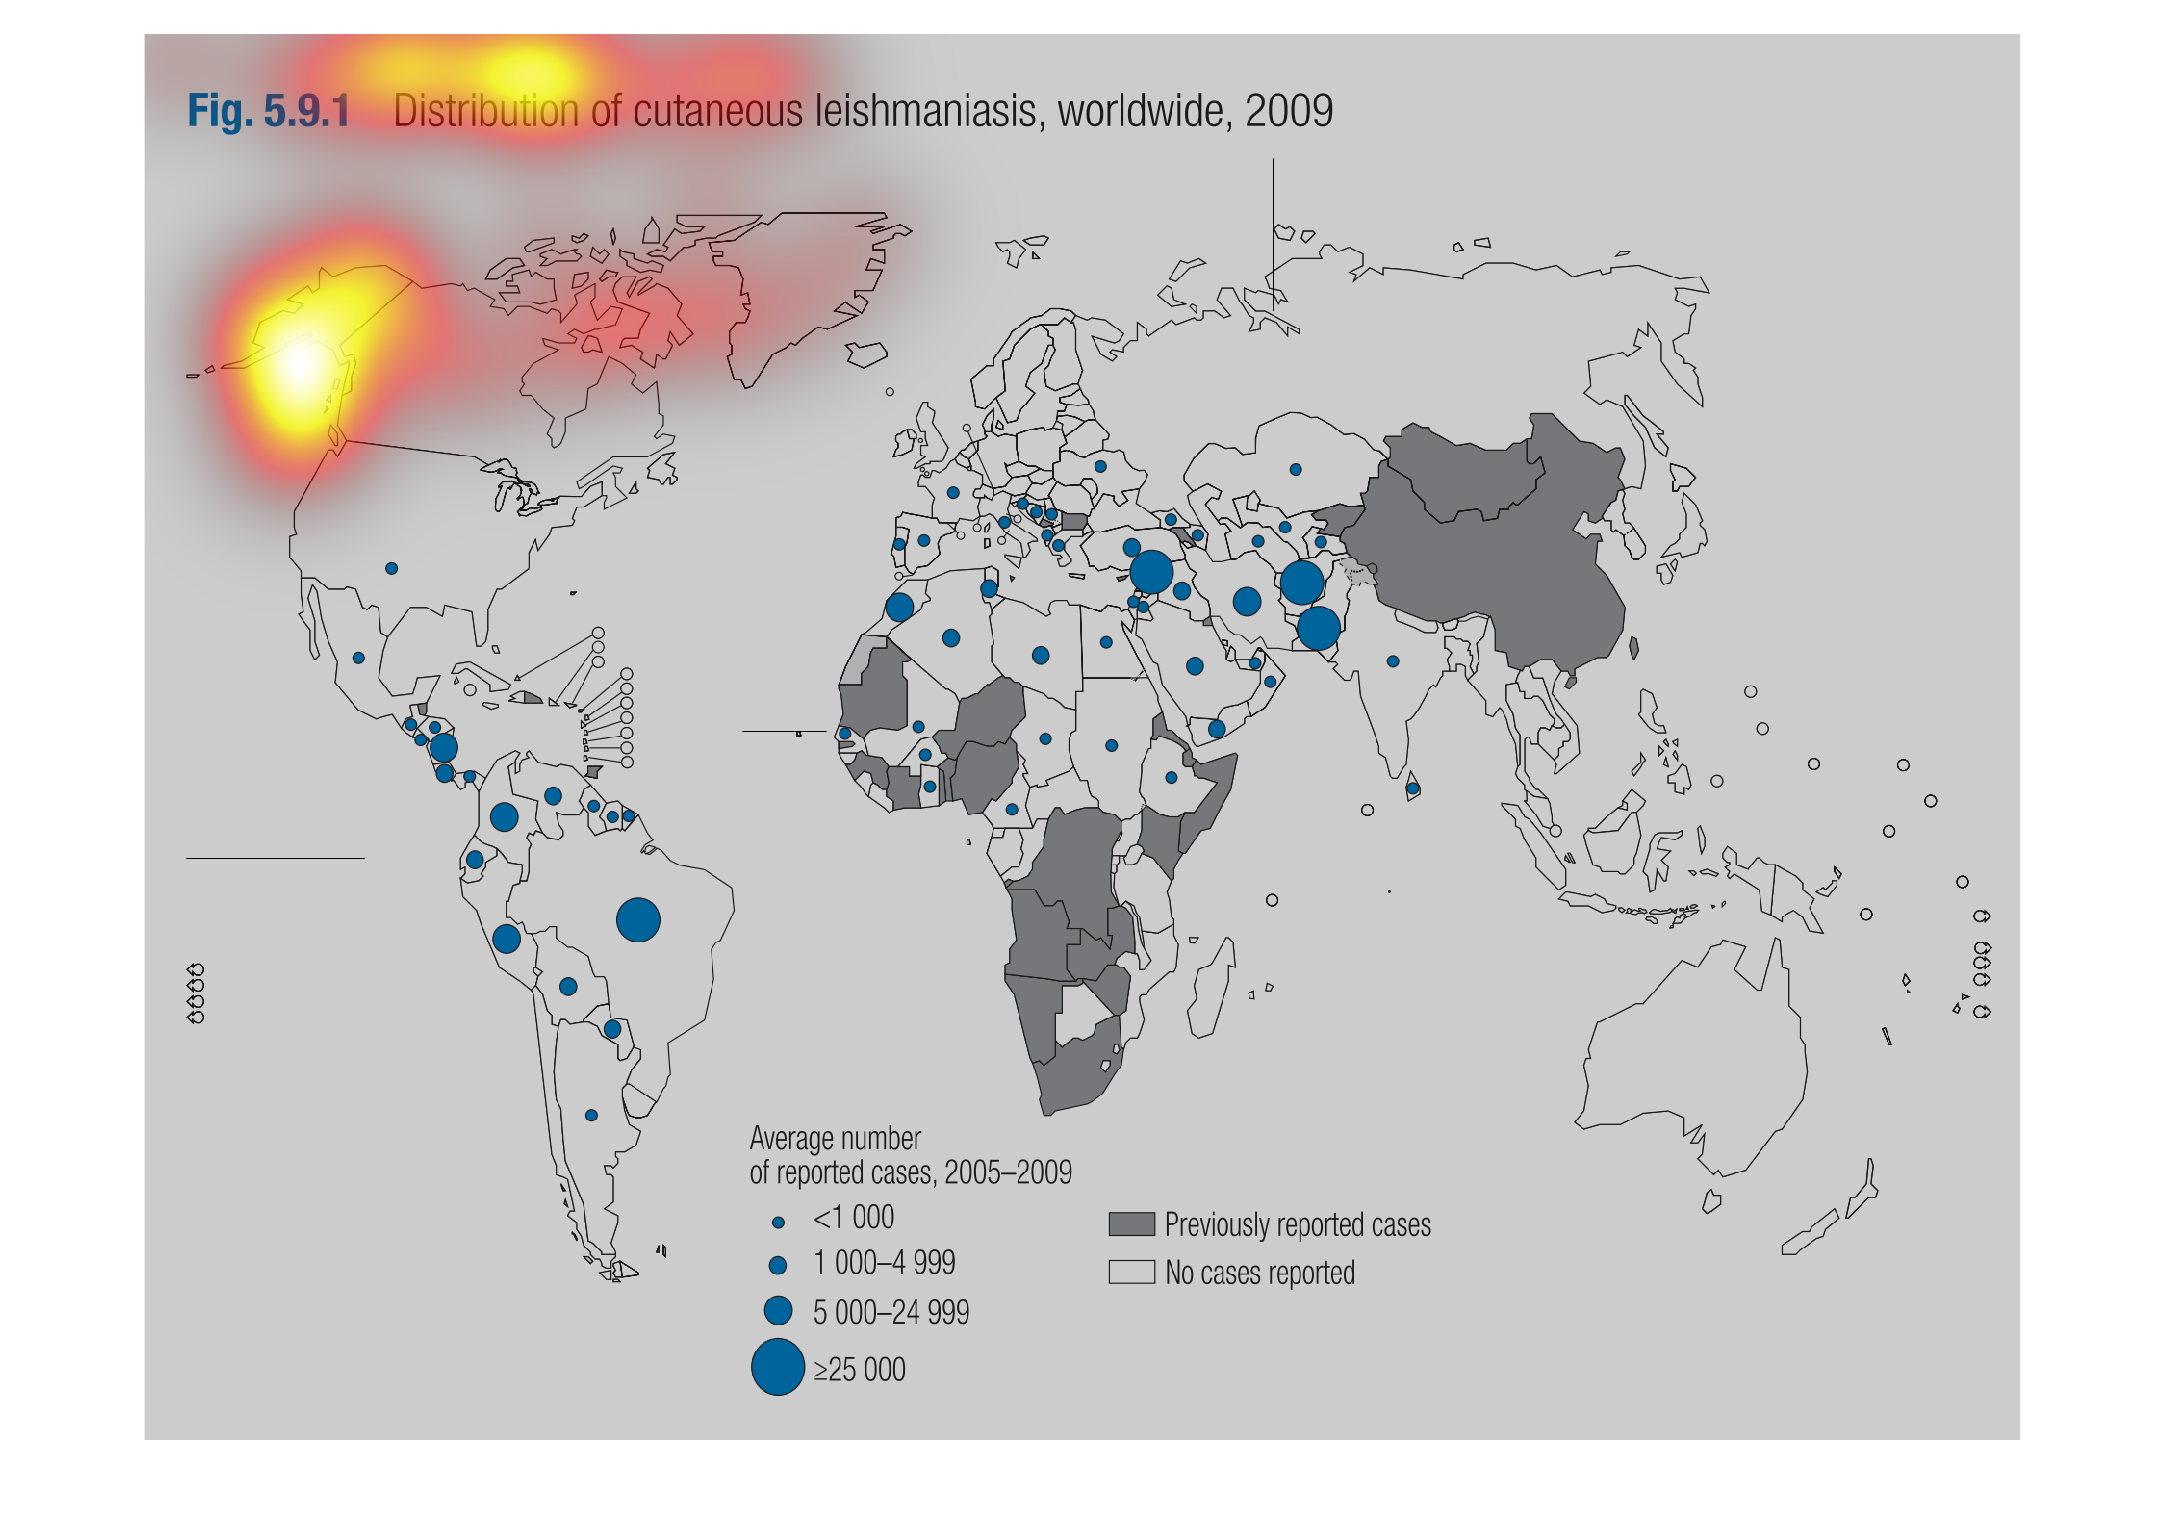
The distribution of cutaneous leishmaniasis world wide in 2009. Very few areas in the United
States of America have had any outbreaks of this disease. In some areas of Africa and China
there have been previous outbreaks and a some current cases in some areas. In South America
there are many current outbreaks, but not many previous ones. Australia has not current or
previous cases.
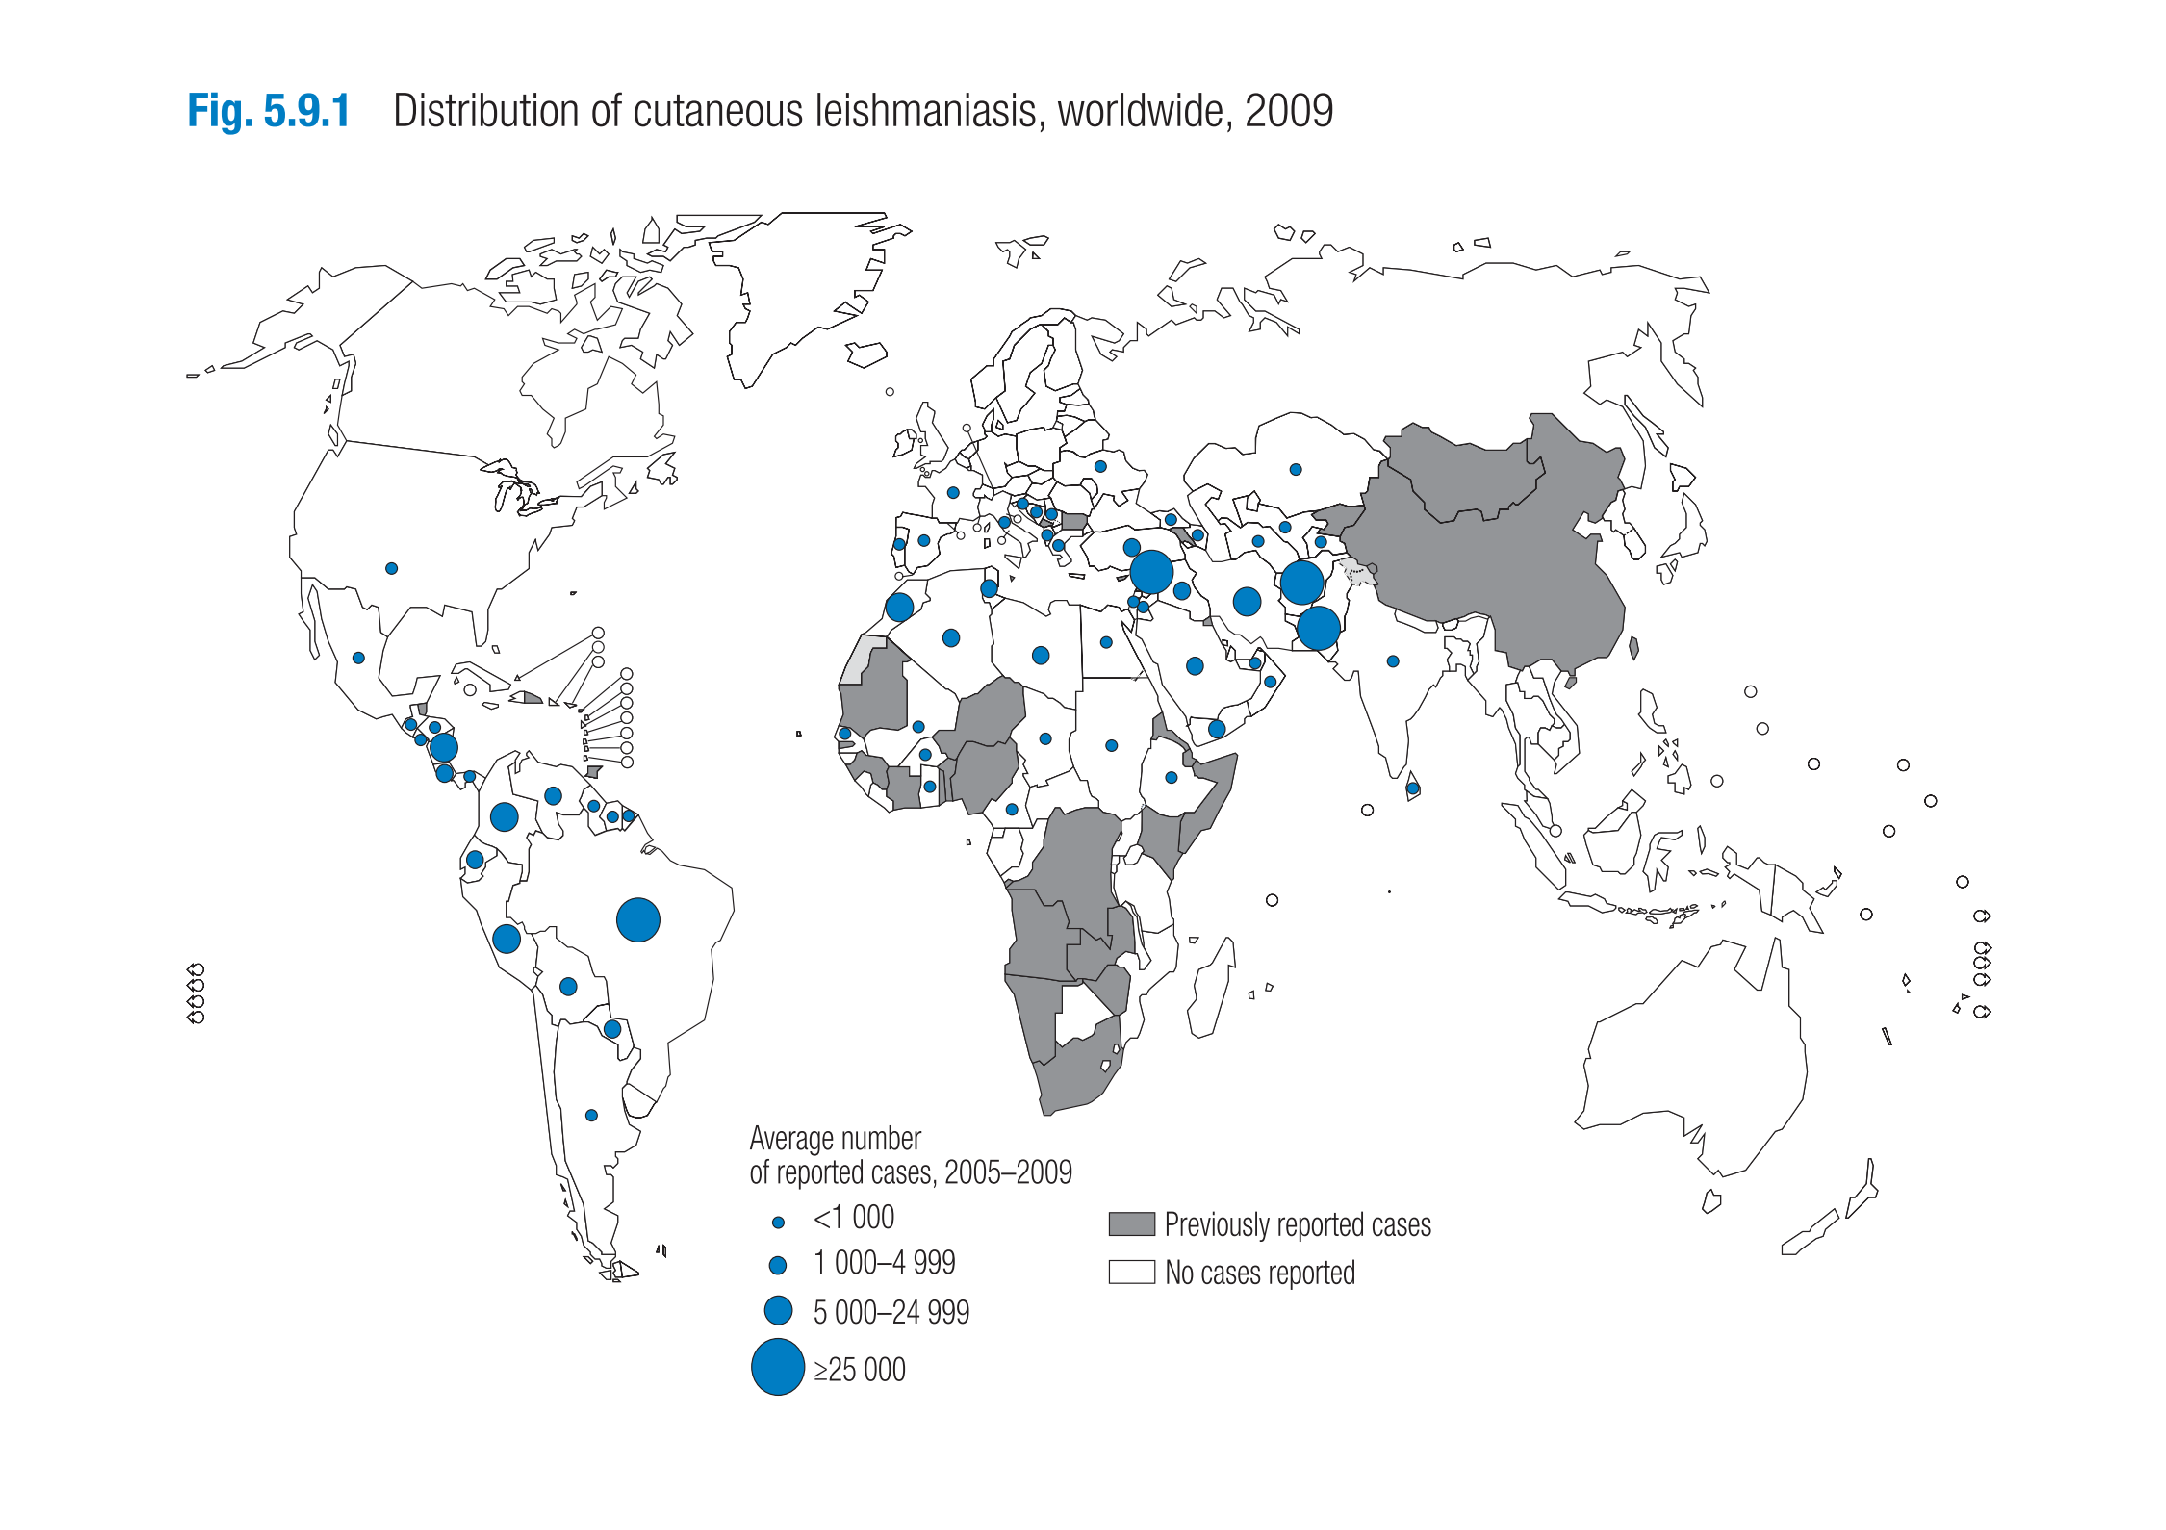
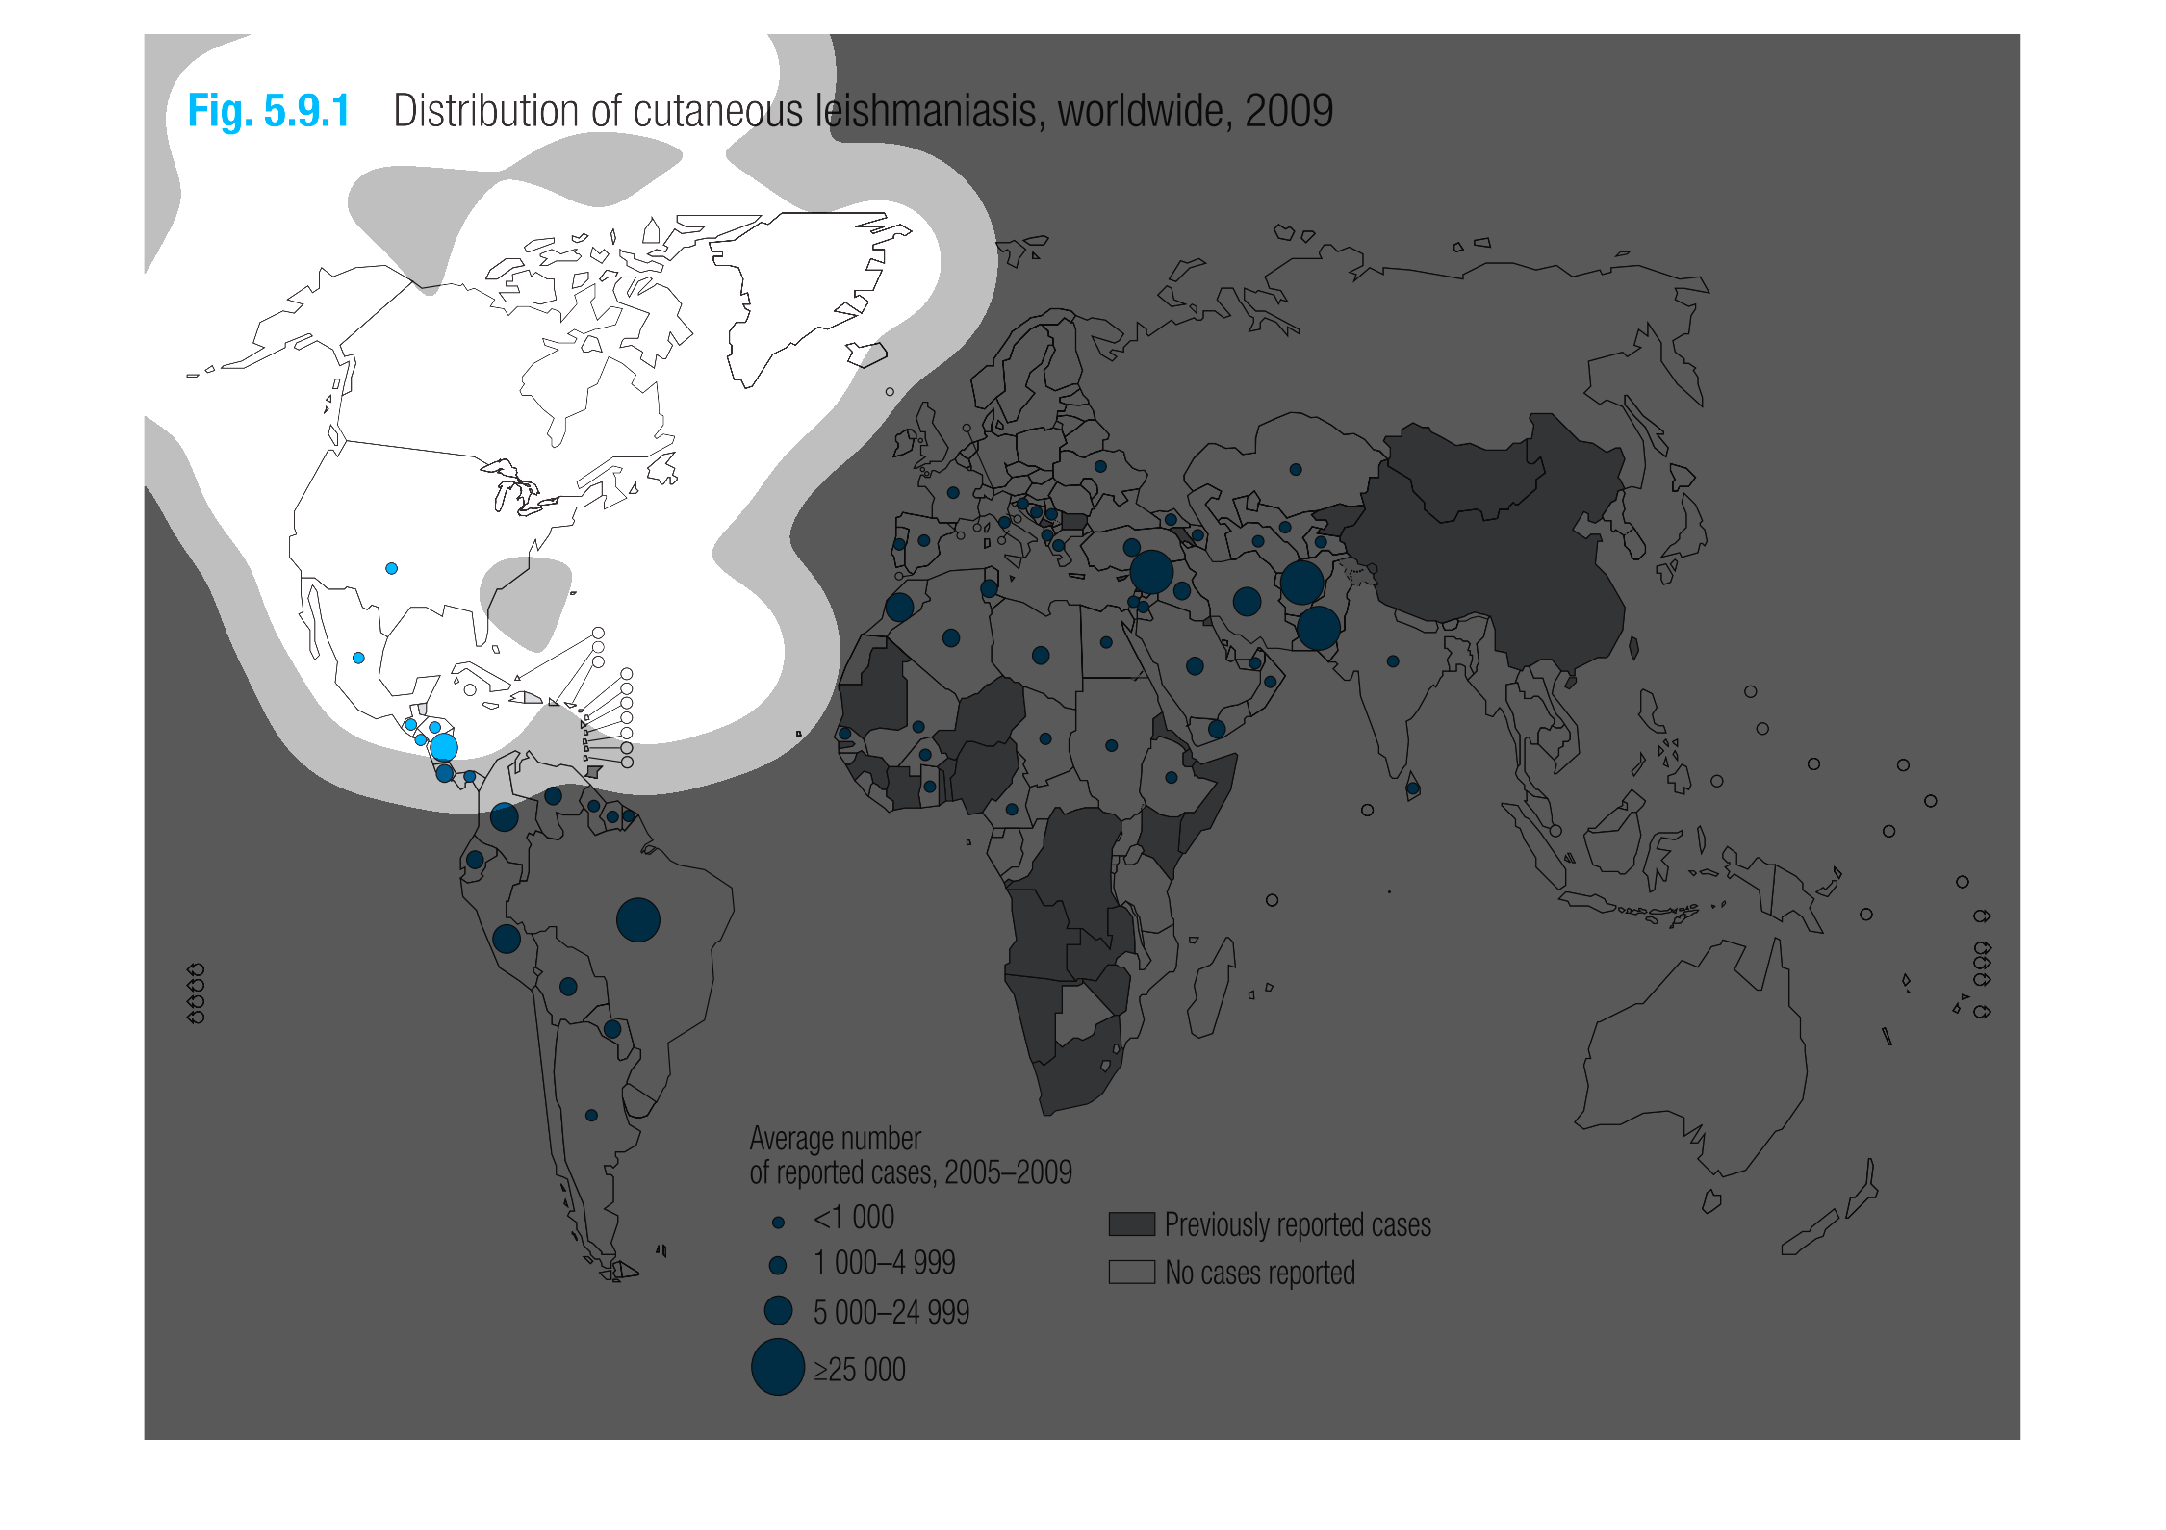
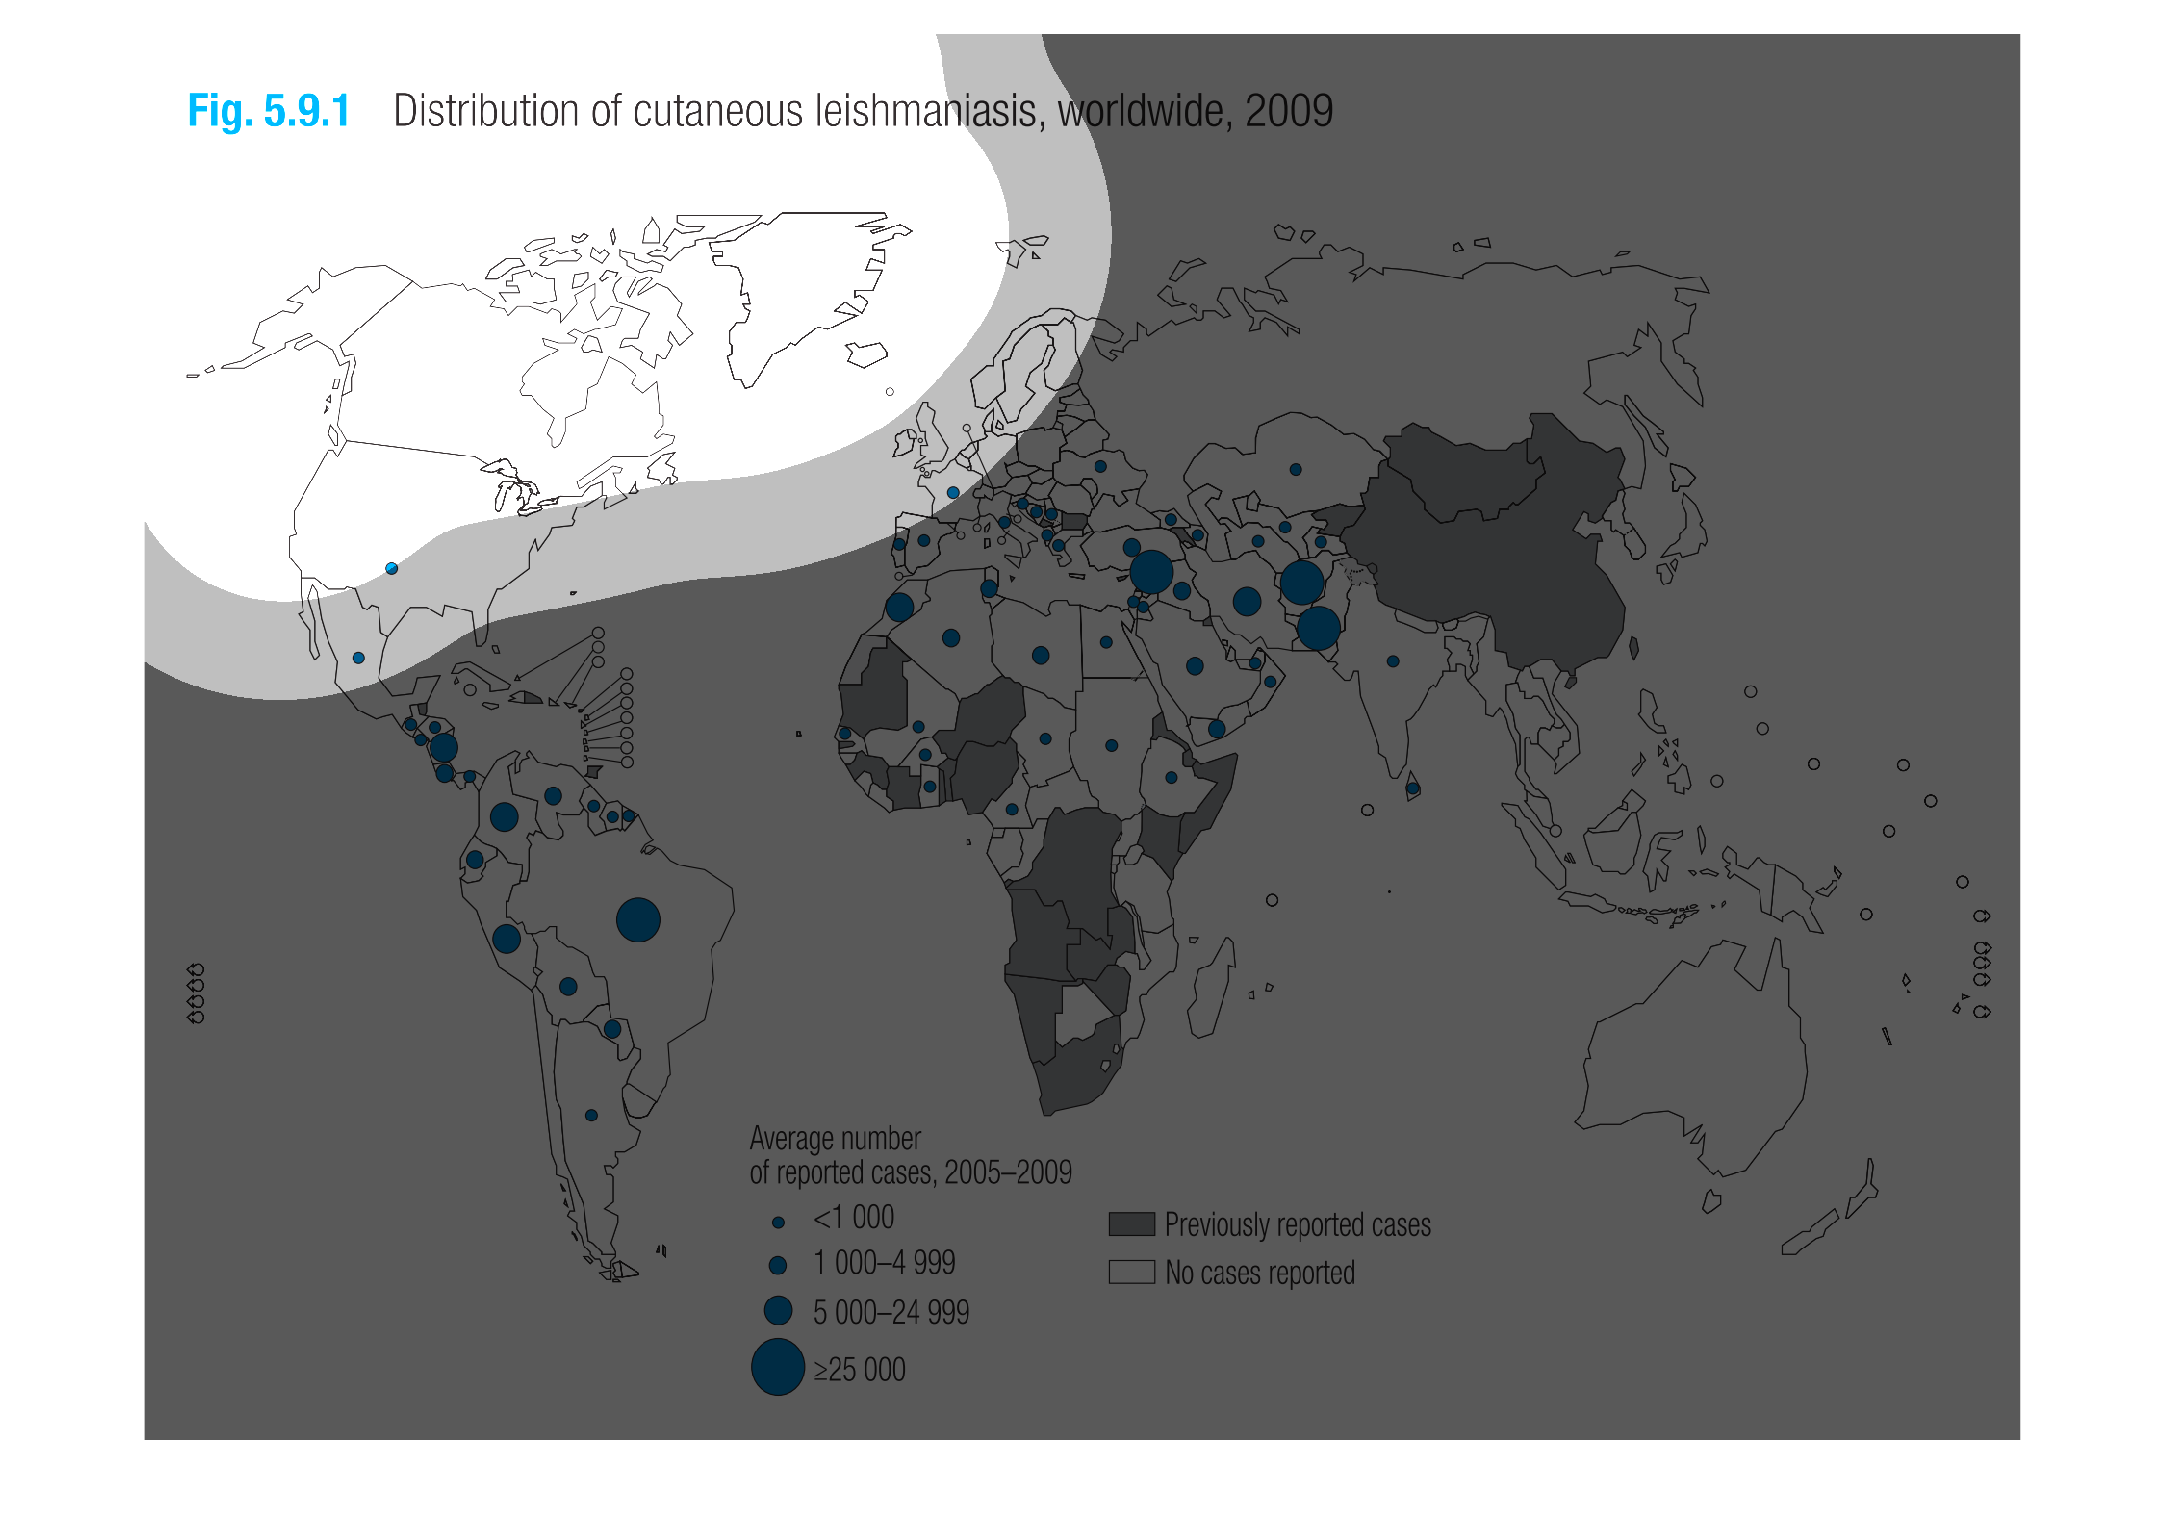
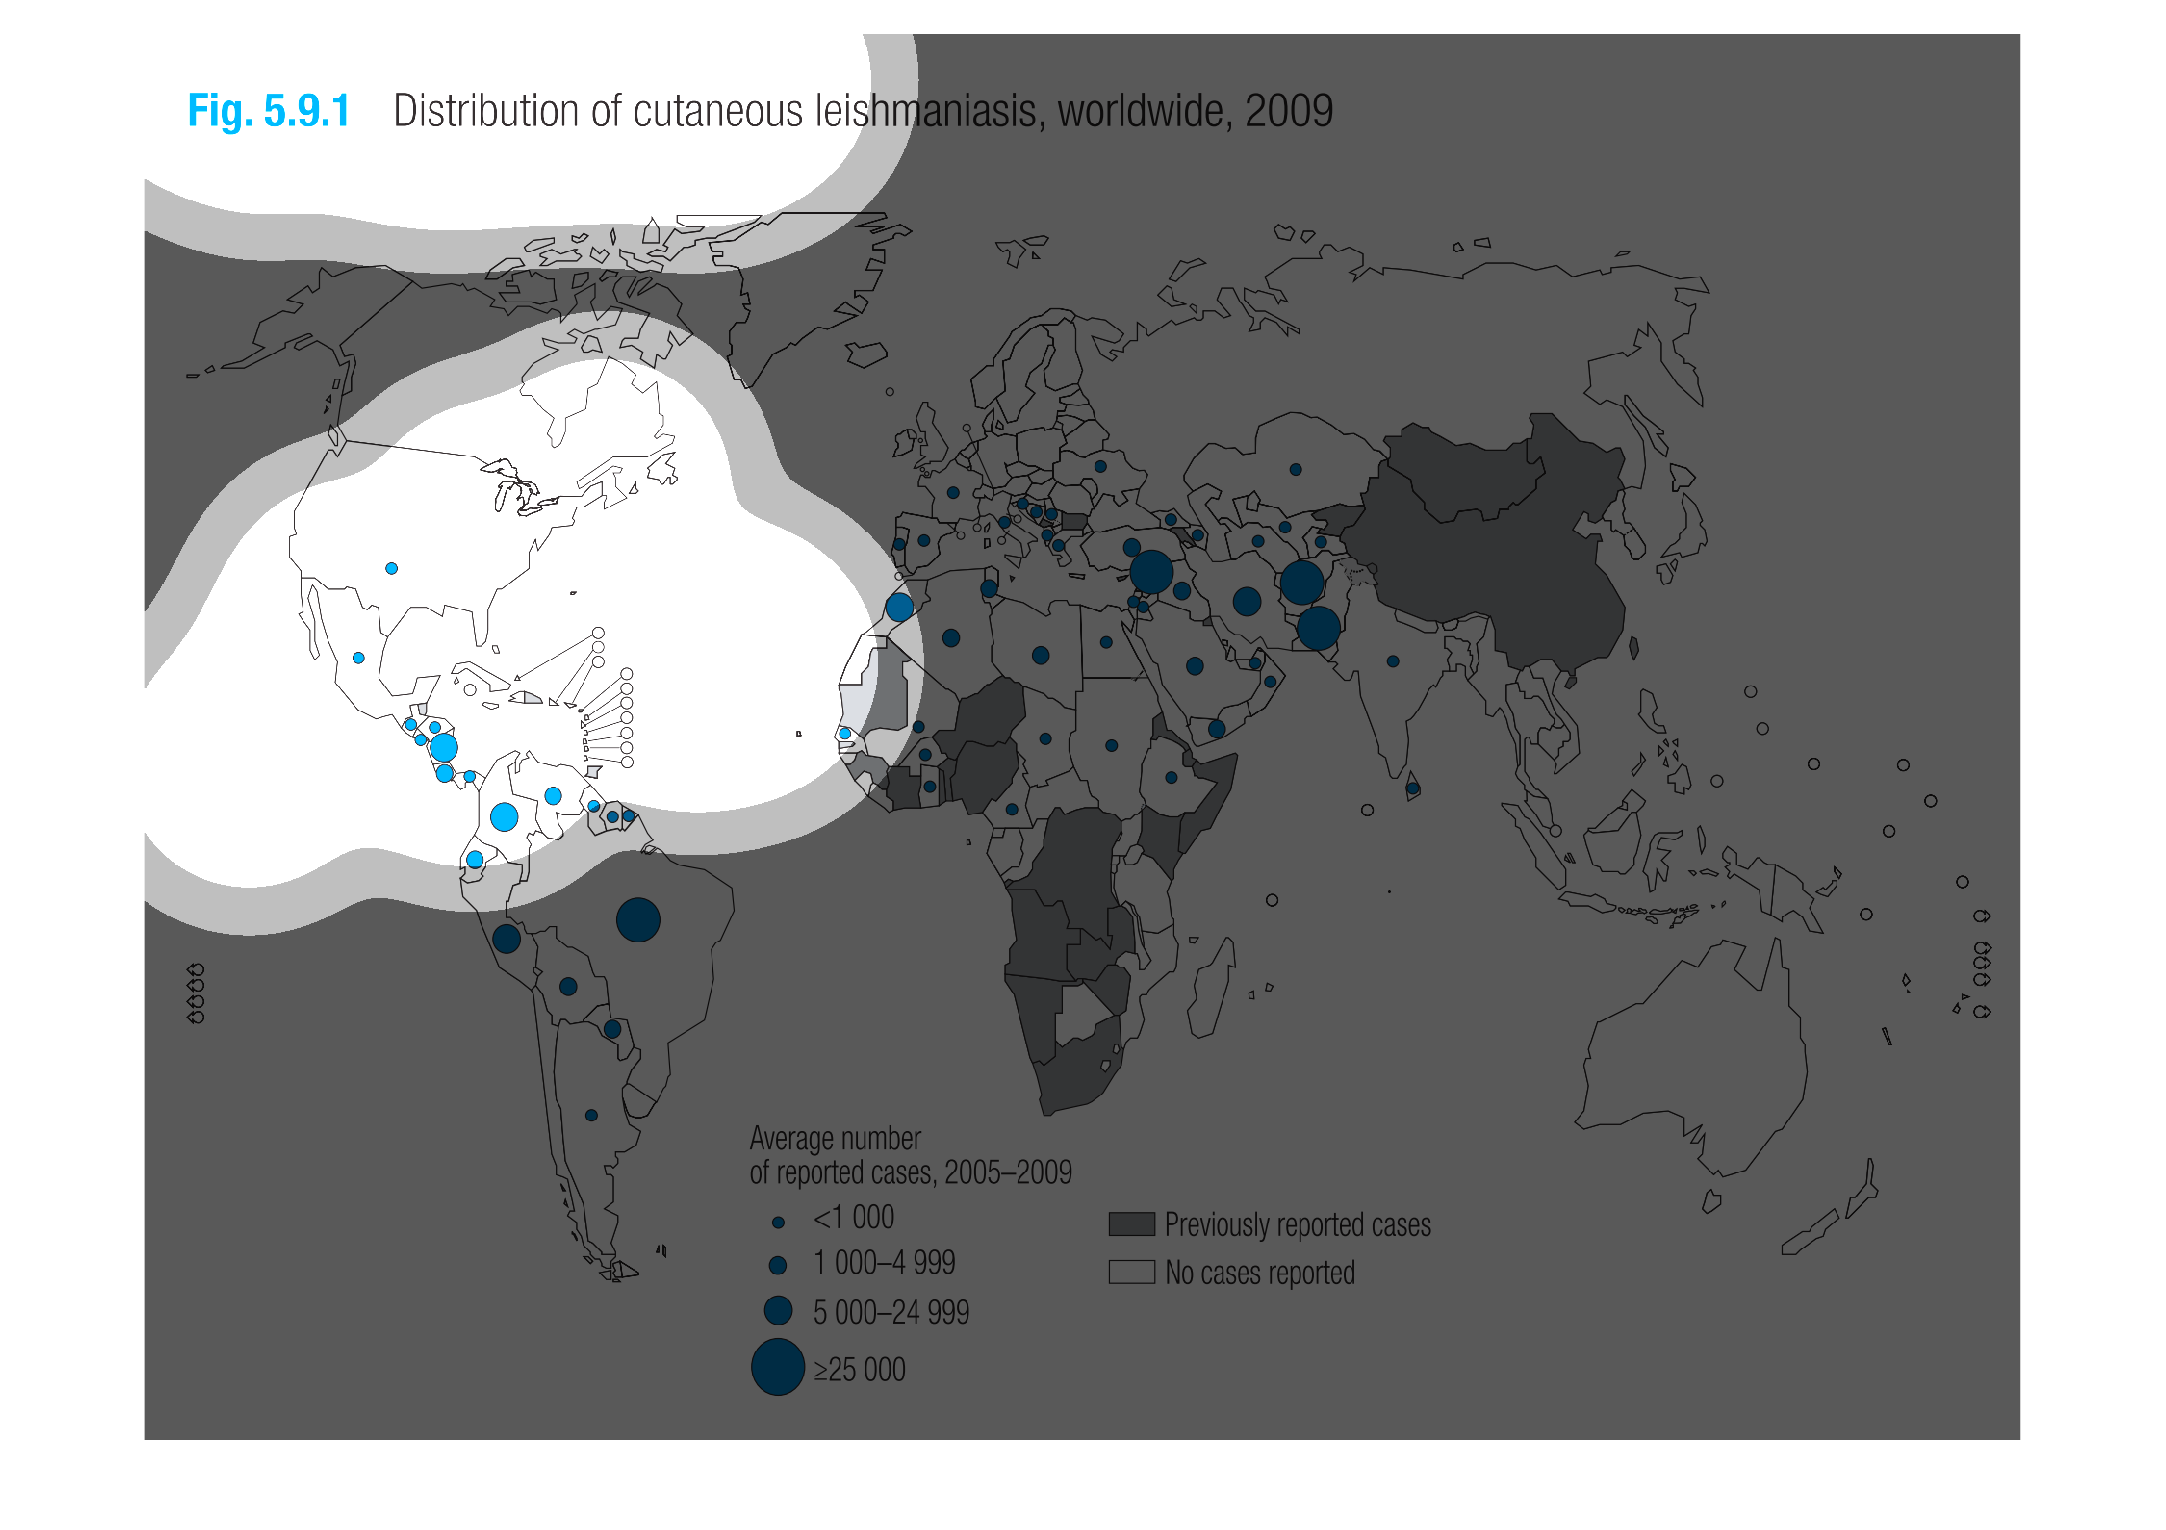
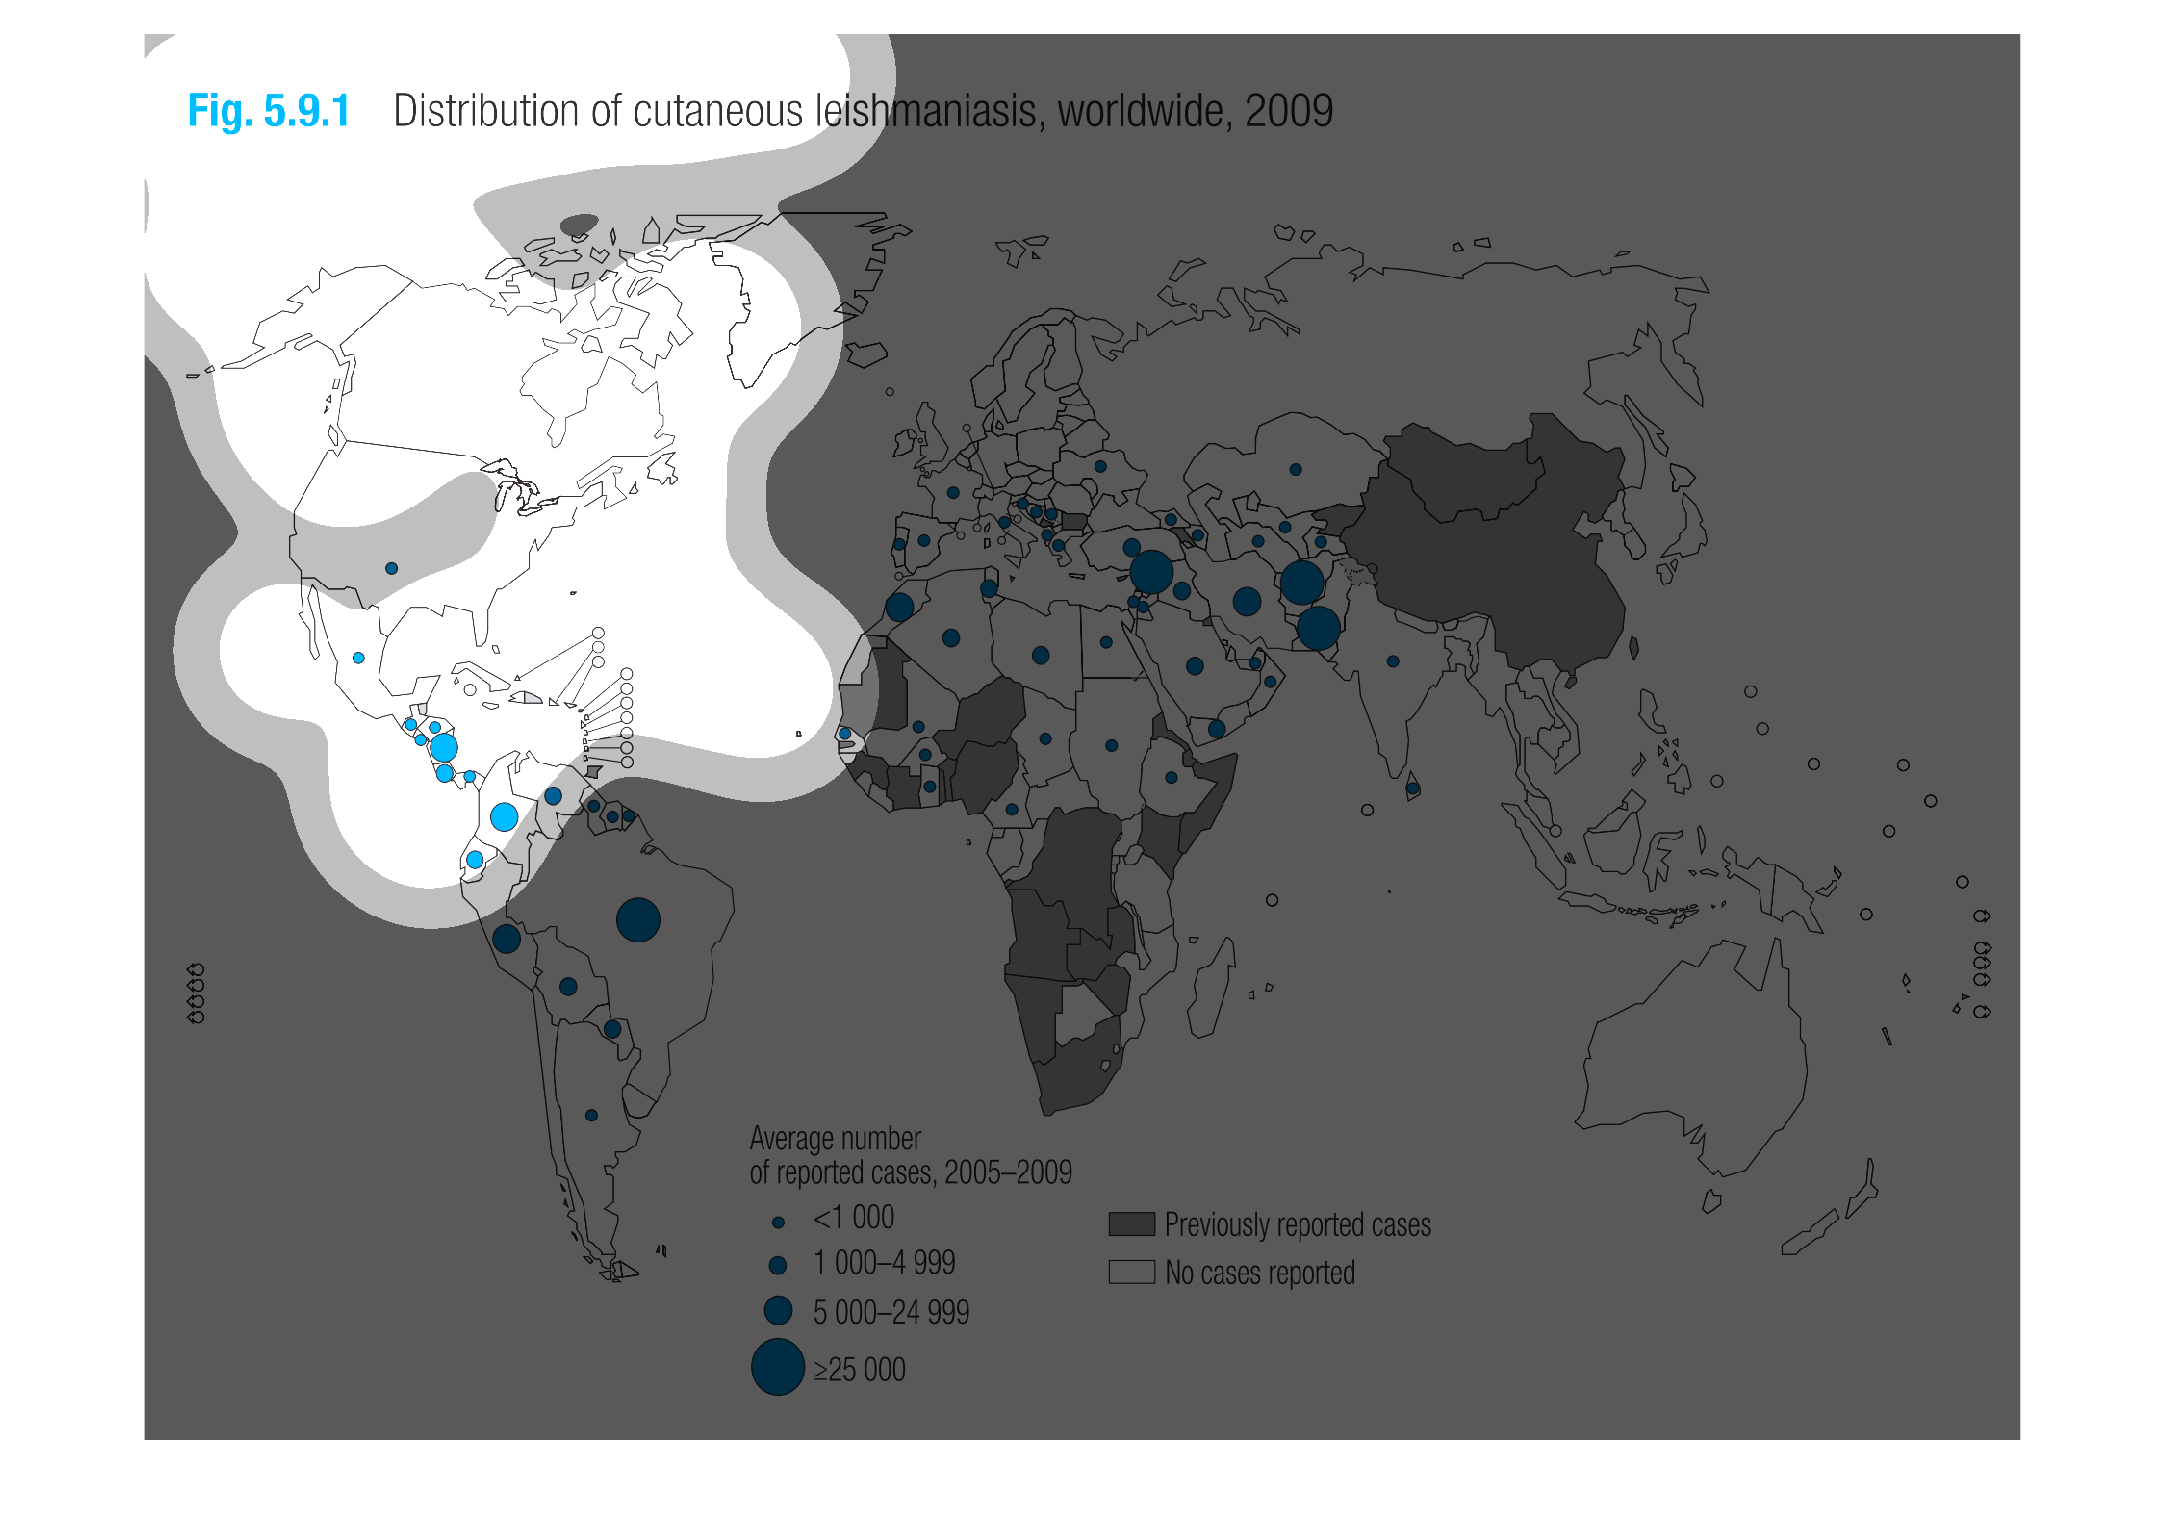
Distribution of worldwide cutaneous leishmaniasis, average number of reported cases between
2005-2009.  The largest number of cases was greater than 25,000 and occurred in Asia and South
America.
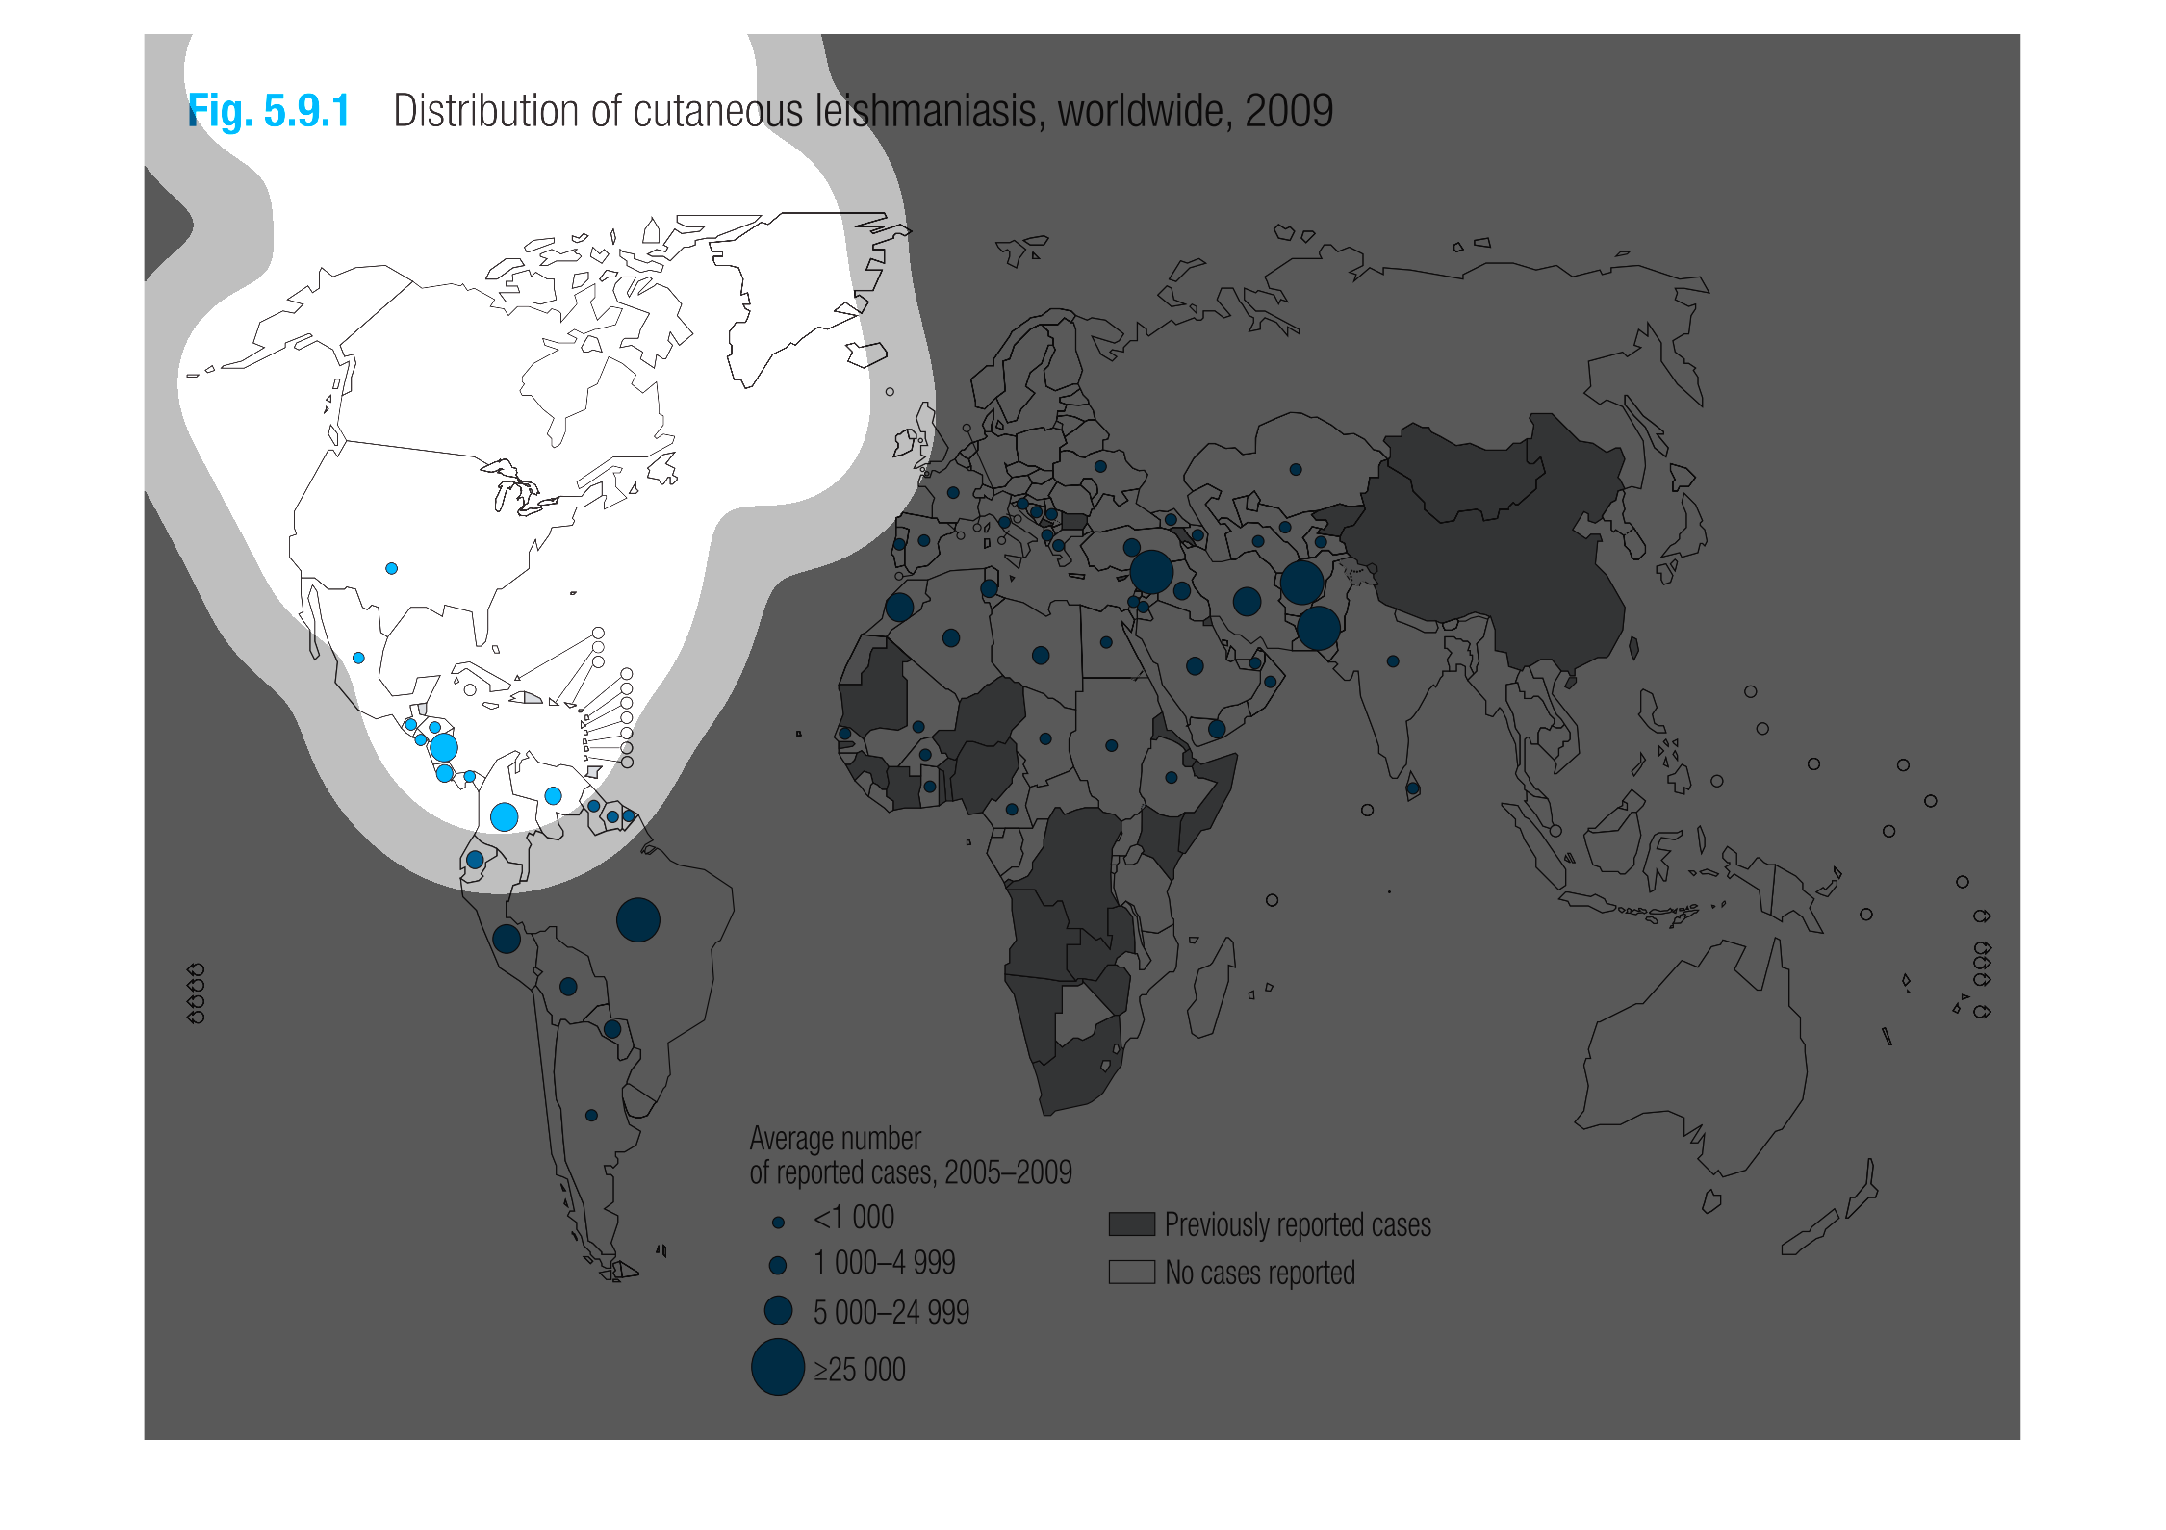
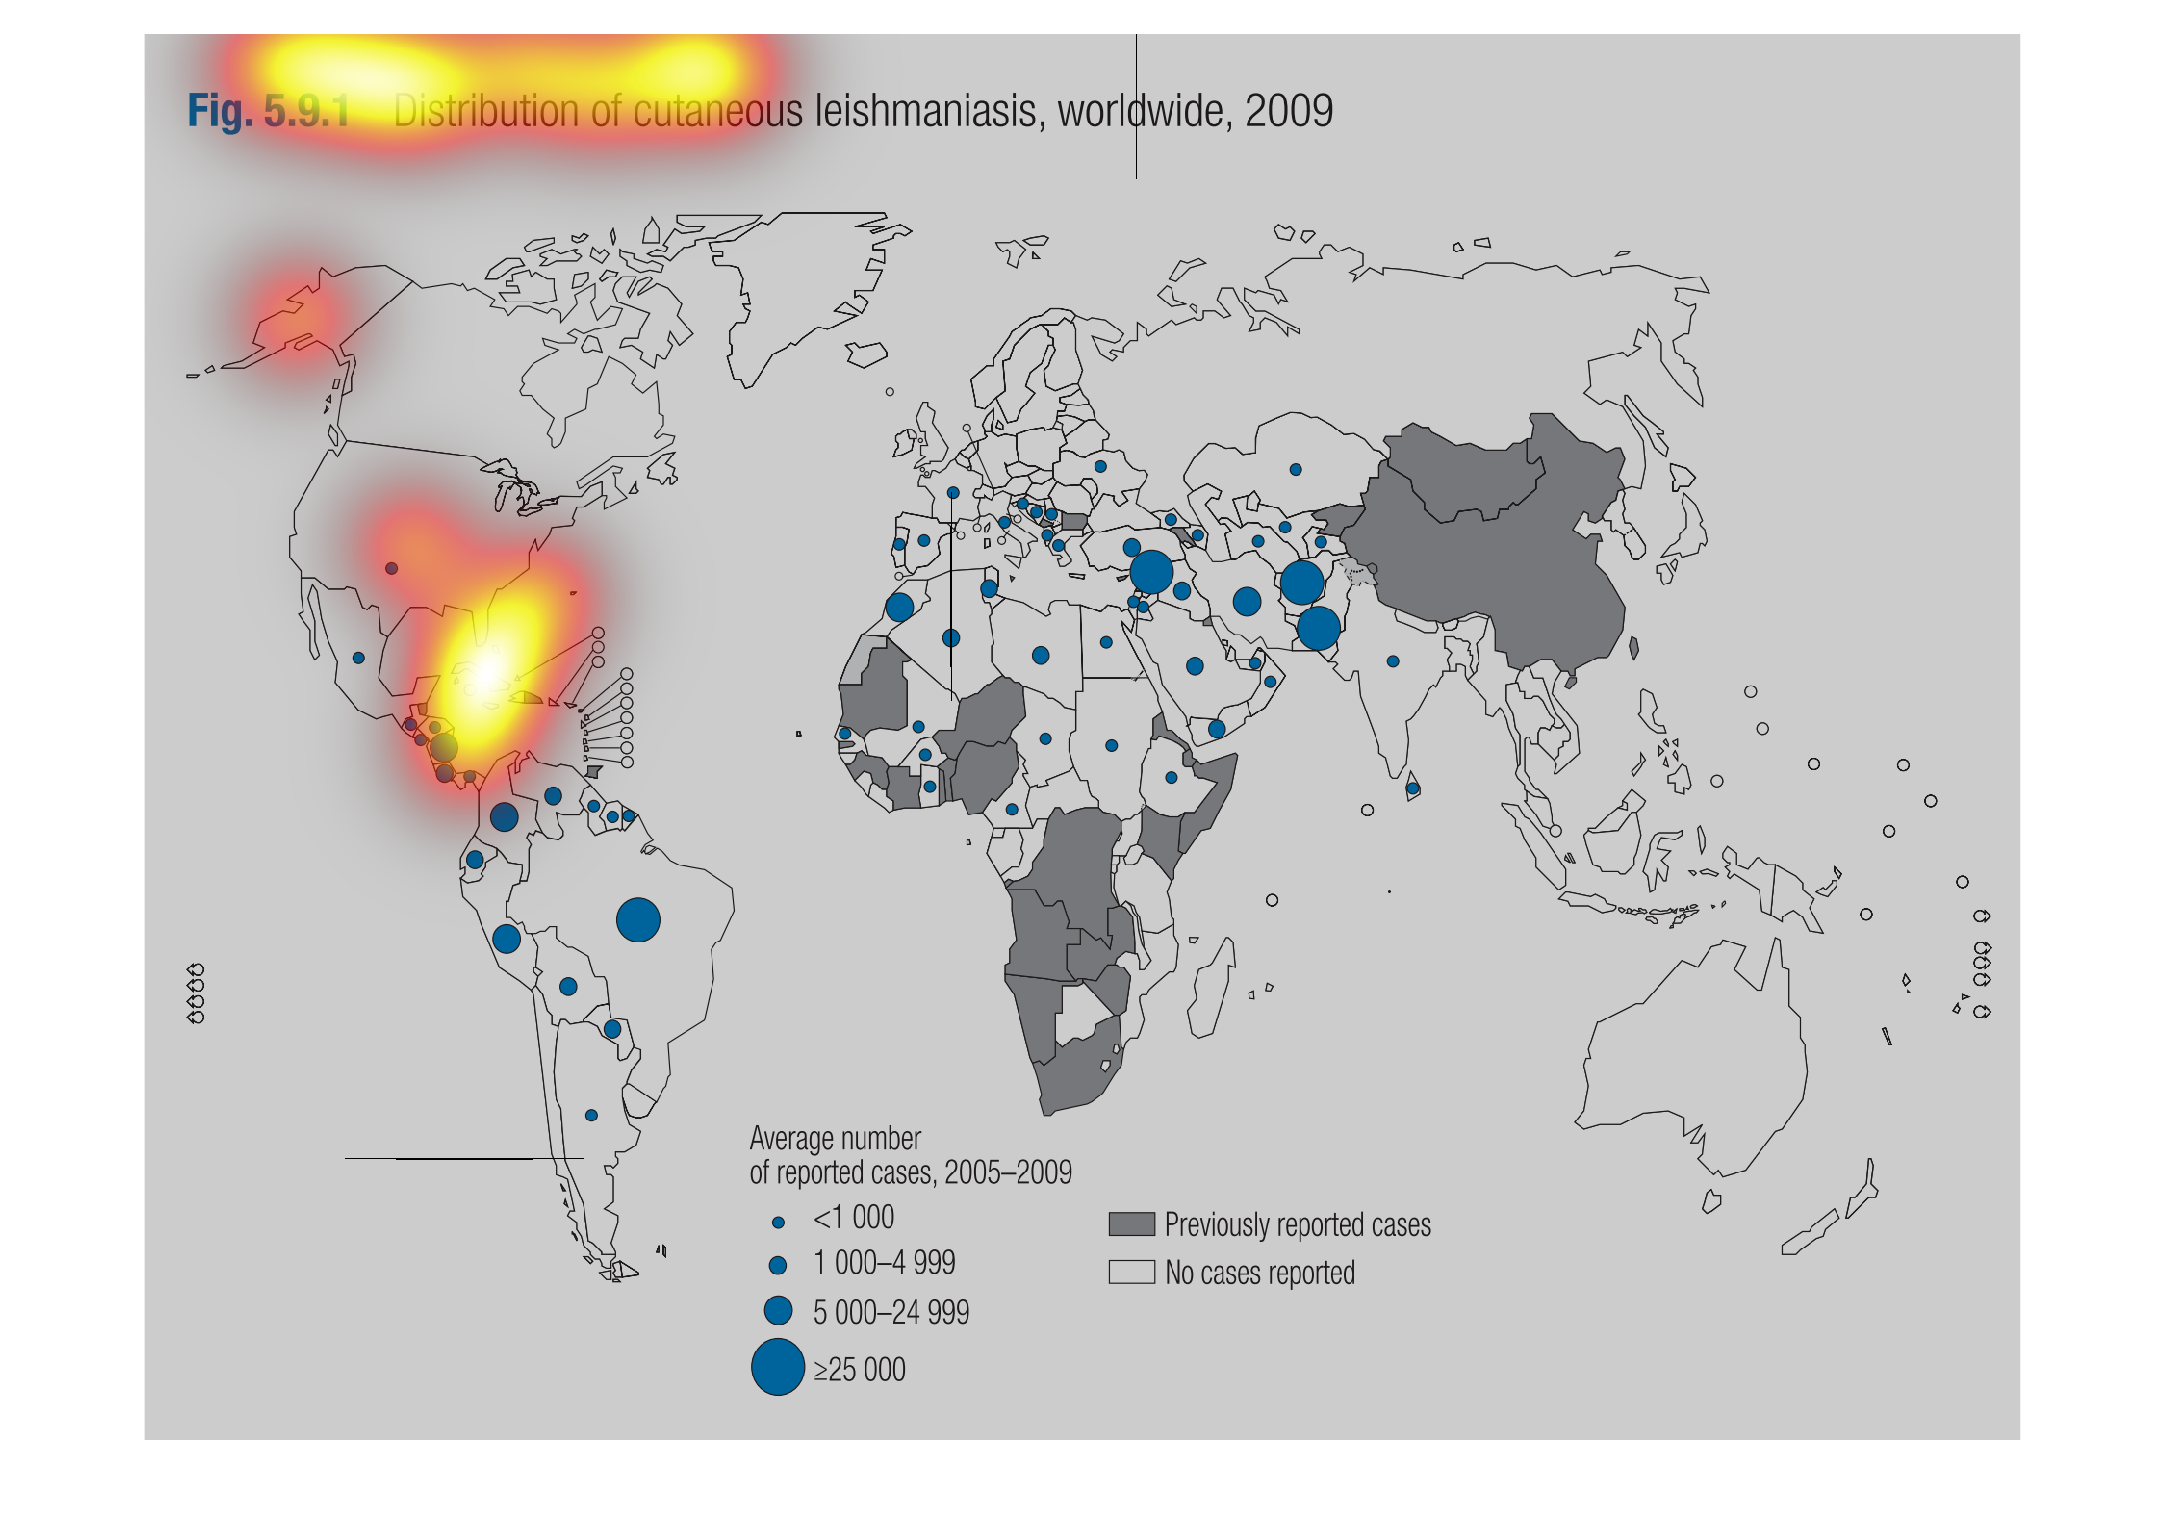
This chart shows the incidence of the disease cutaneous leishmaneisis around the world. It
shows how Africa generally has the highest infection rate
This image is a world map showing the distribution of cutaneous leishmaniasis worldwide in
2009.  The level of reported cases is broken down into segments.  Each segment is given a
different size of blue dot.  The color gray also shows that there were previously reported
cases while white shows no cases reported.  The colors and dots are then plotted in the appropriate
countries/areas on the map.
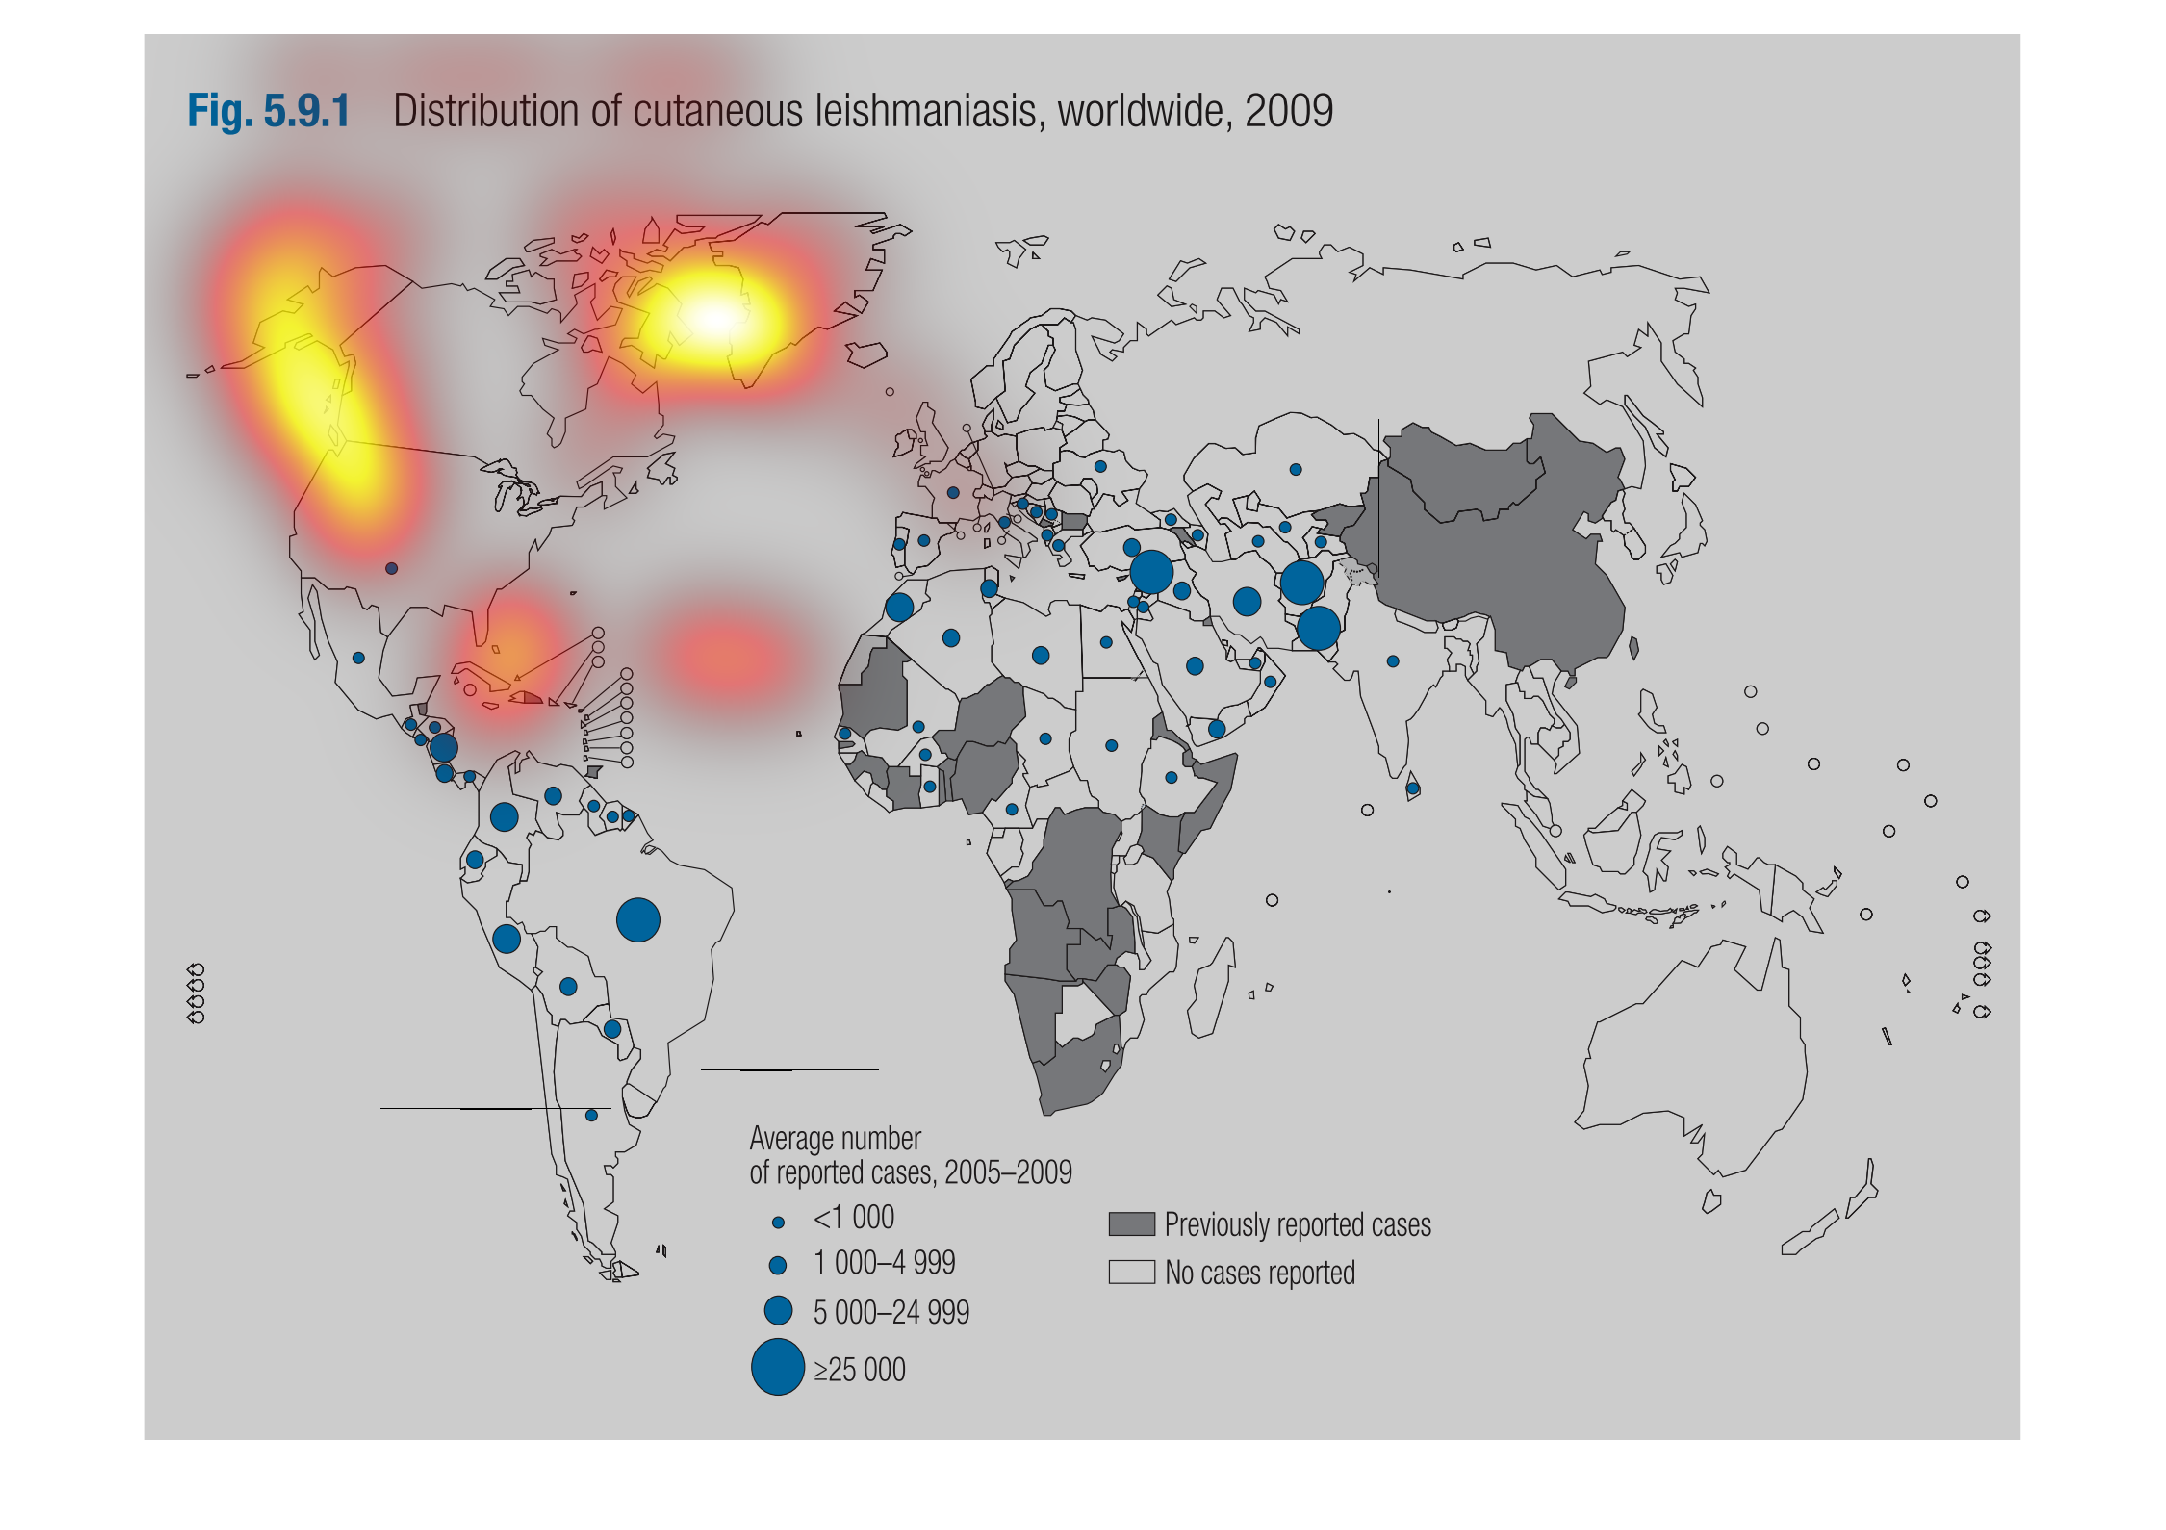
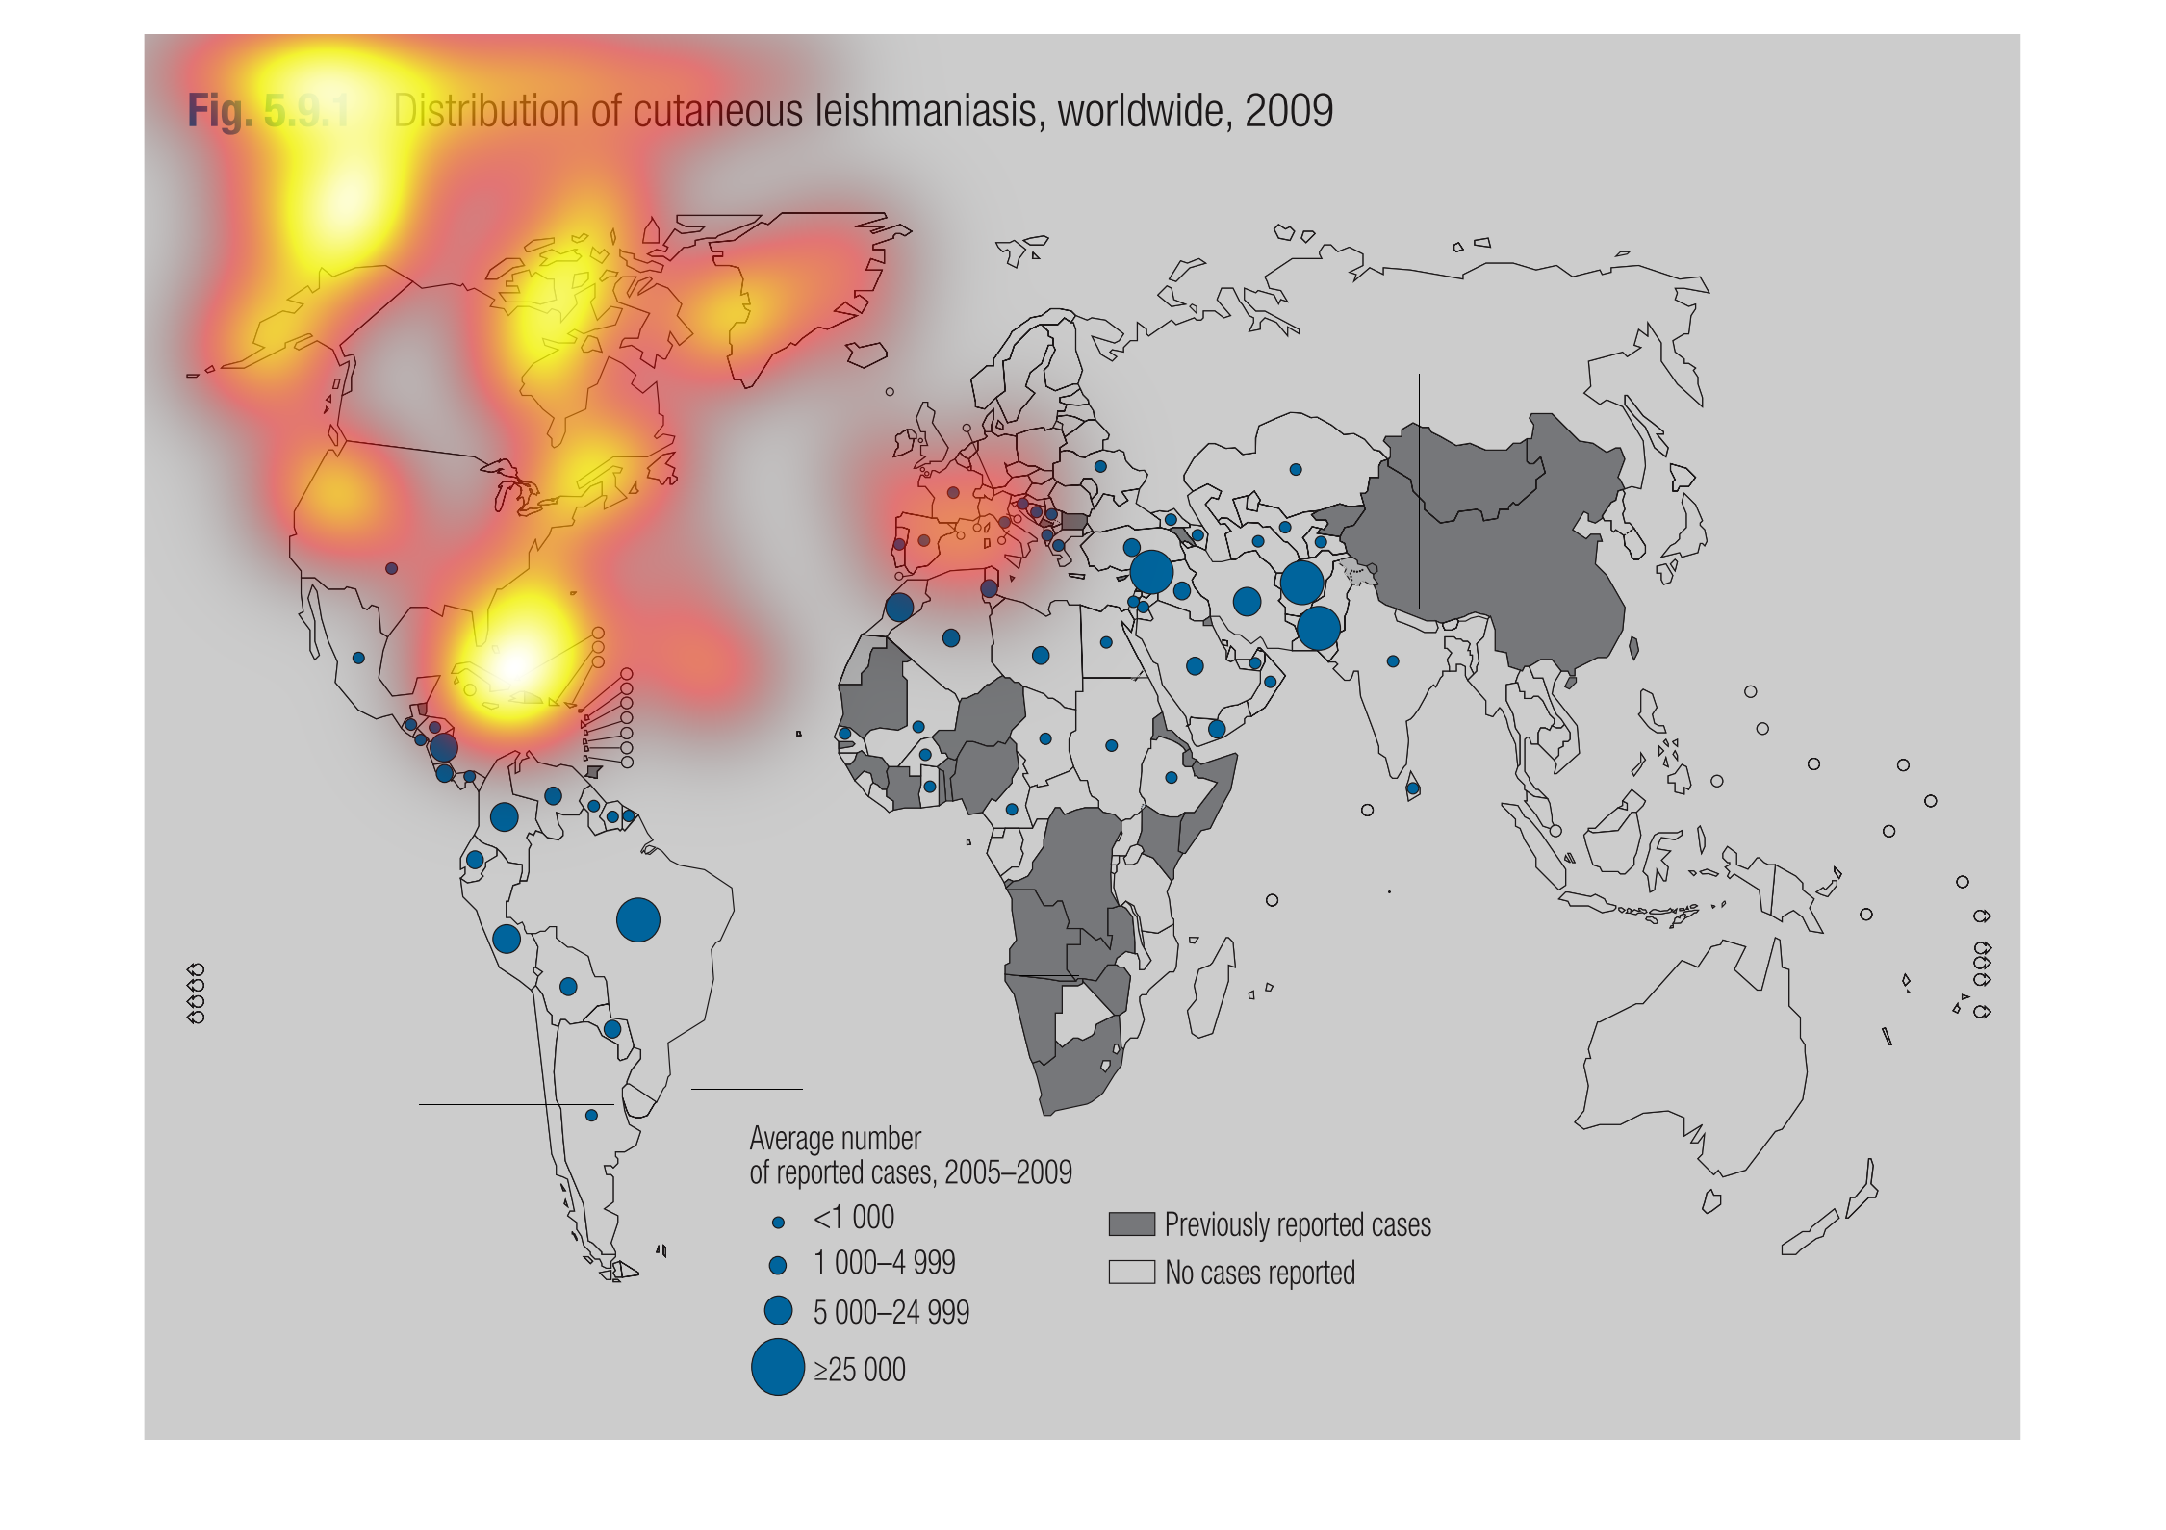
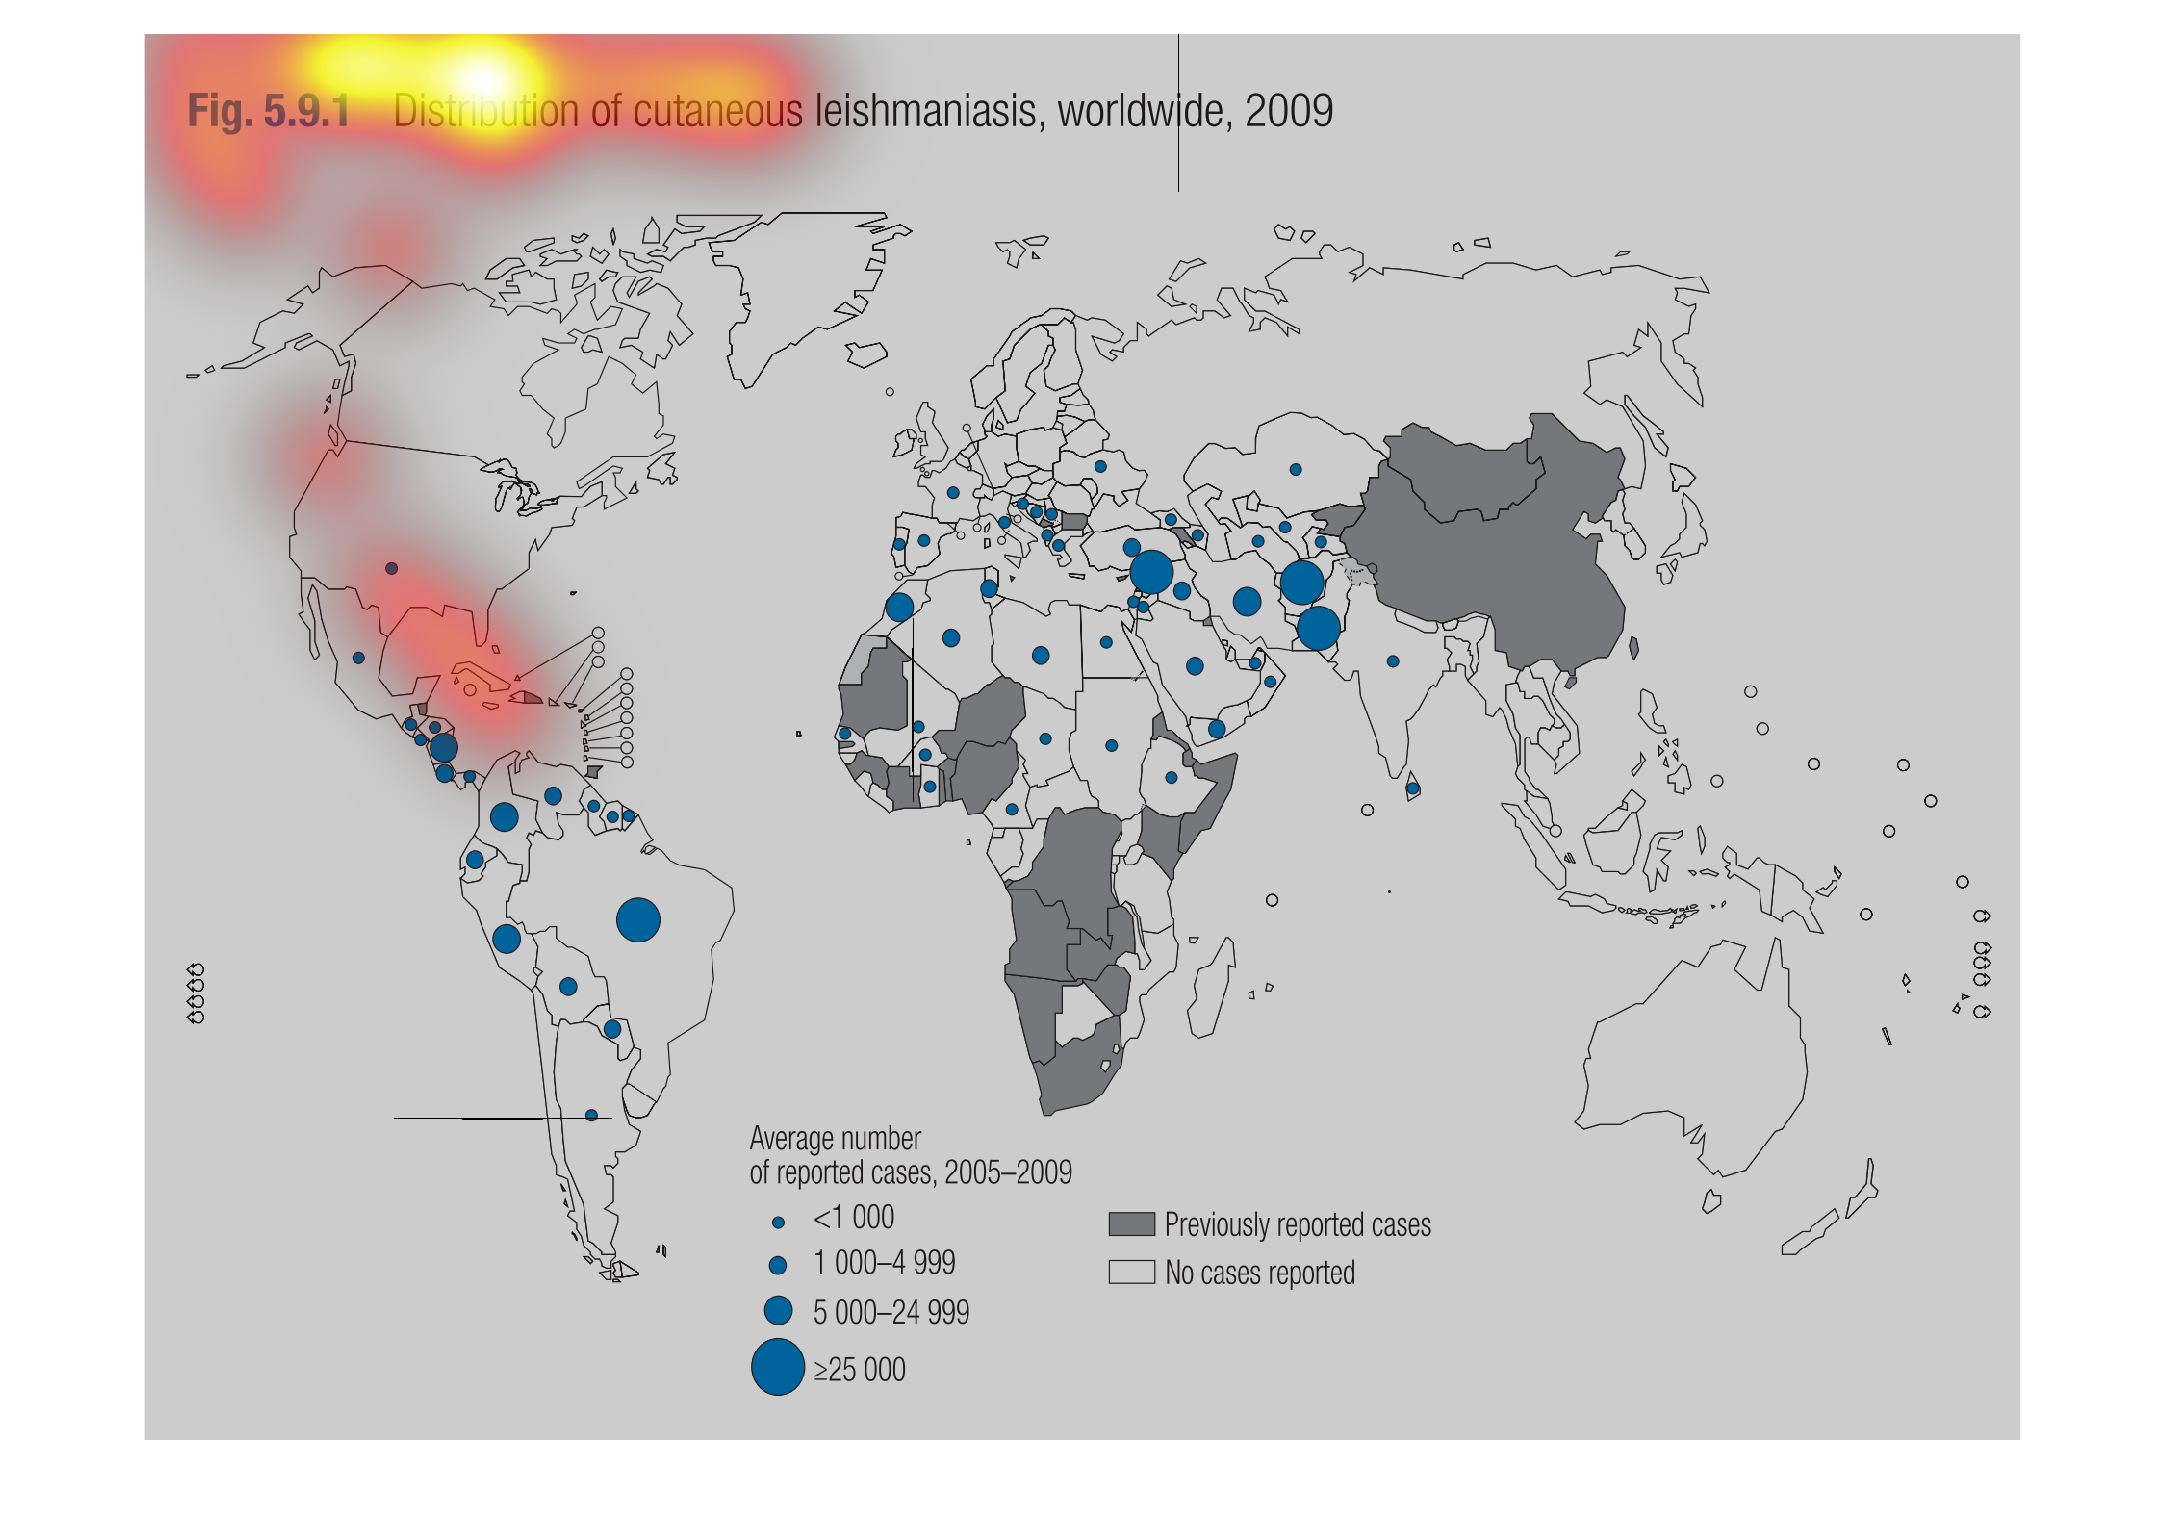
This chart describes distribution of cutaneous leishmaniasis, worldwide for the year 2009.
Different percentages on the chart are represented by different sized balls.
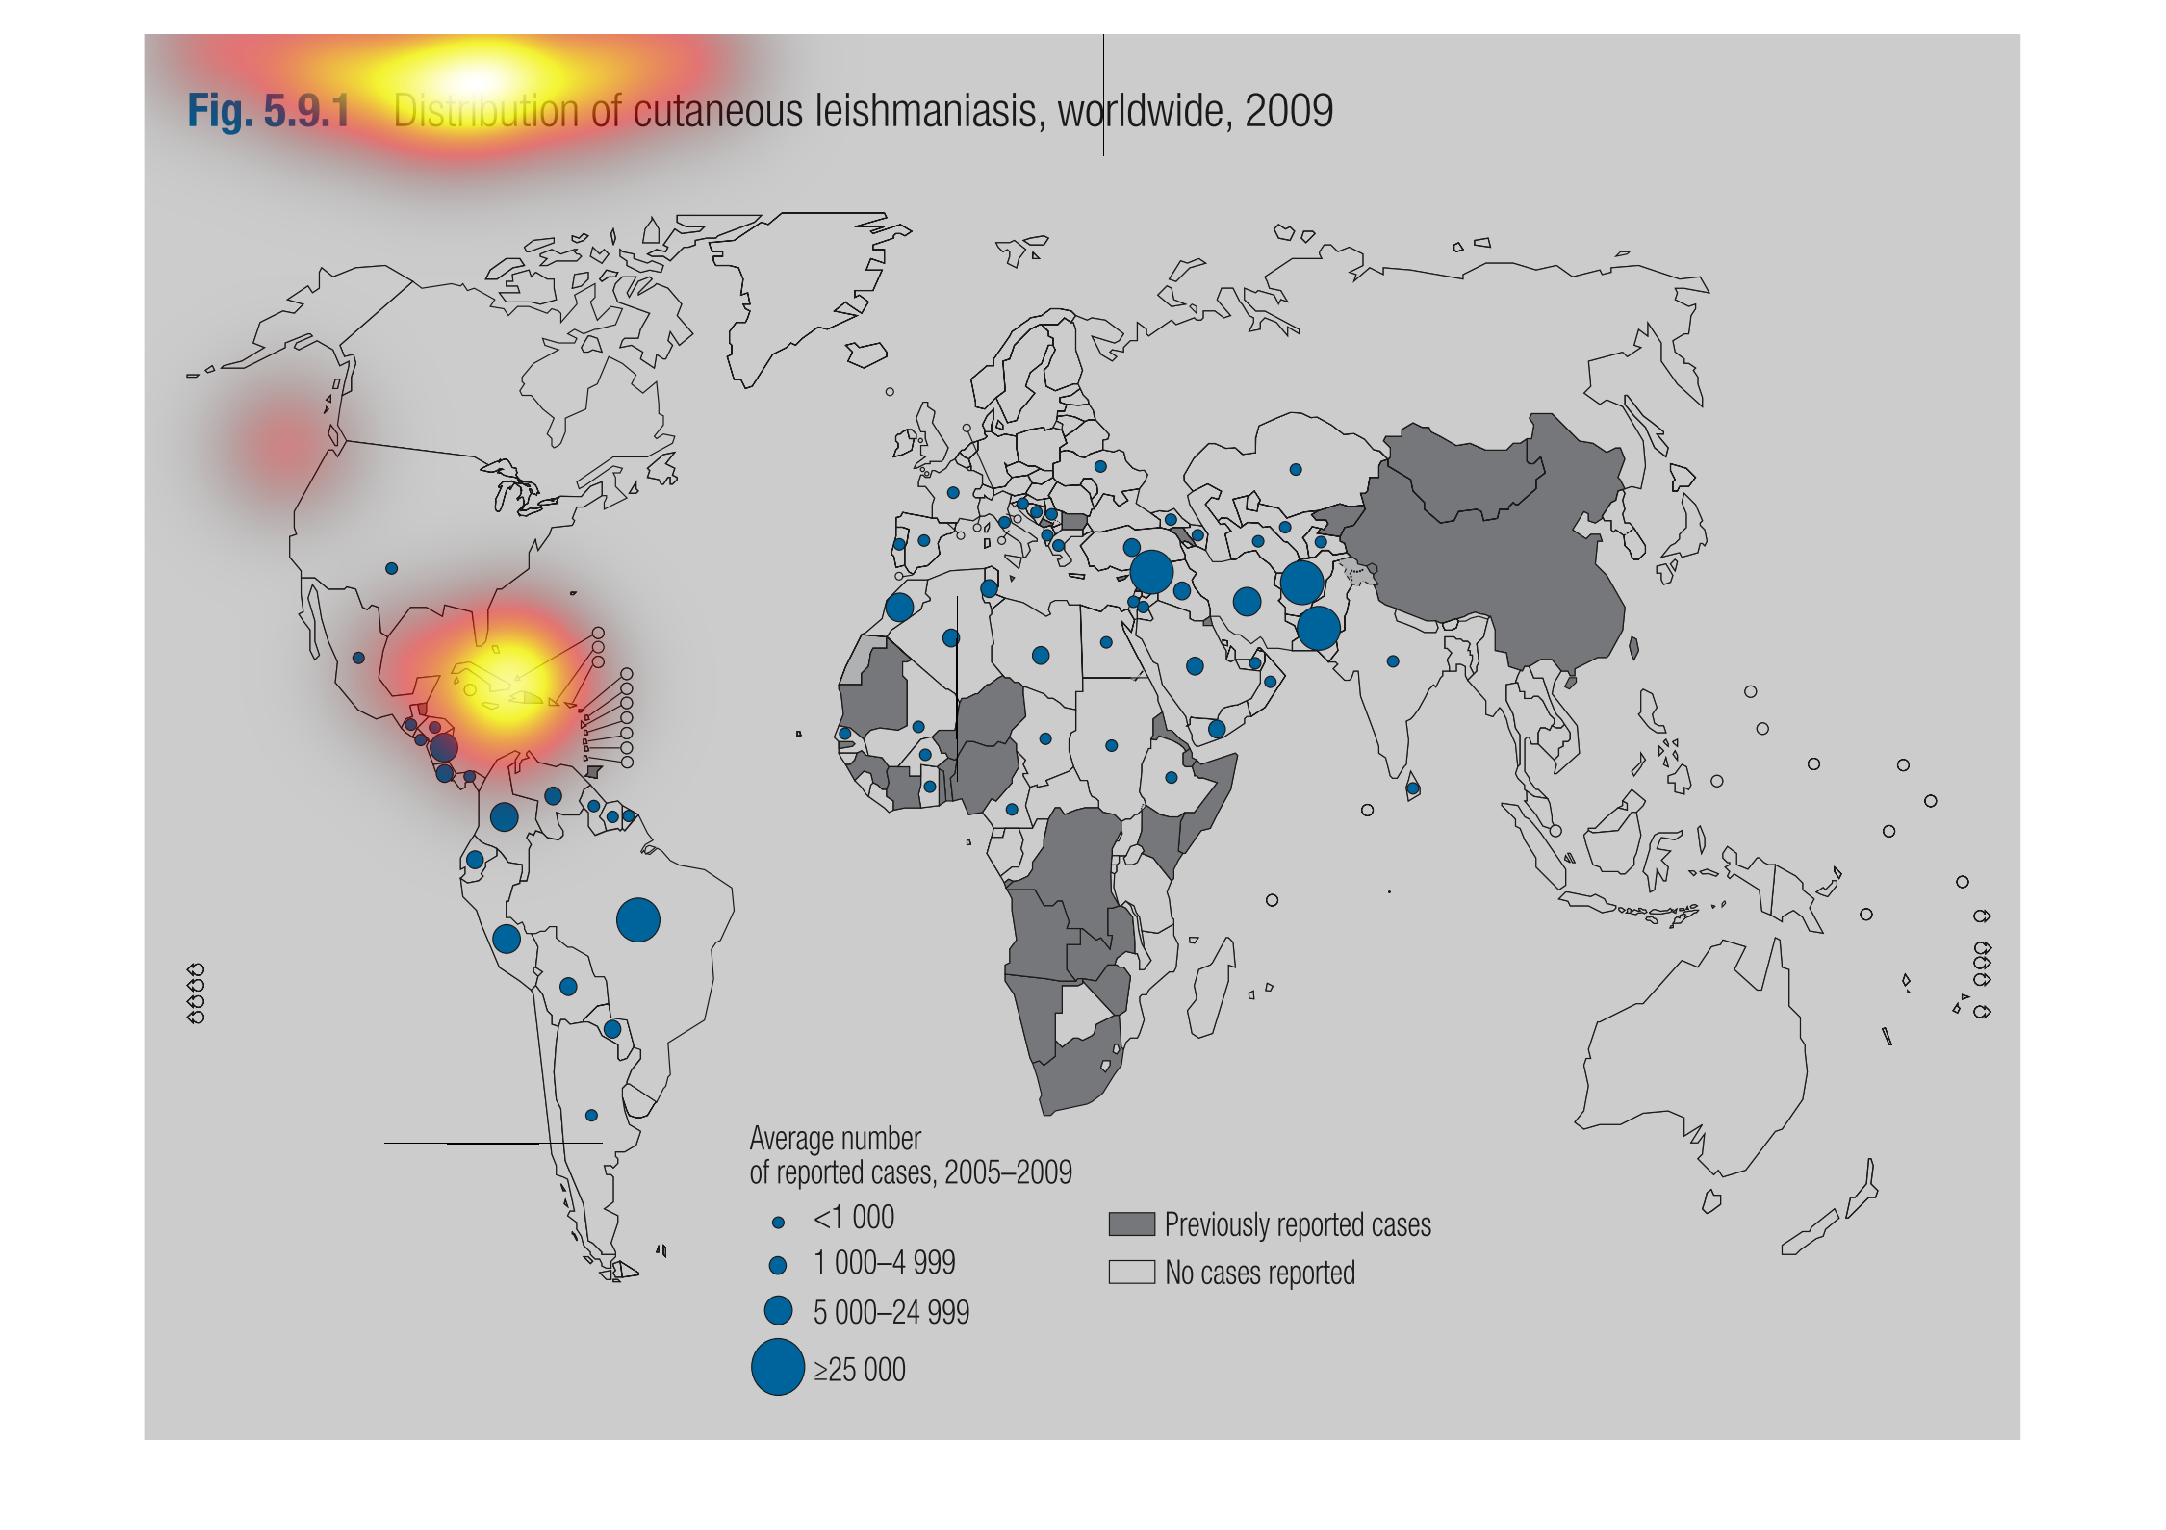
This world map denotes the distribution of subcutaneous leismanisis worldwide, in 2009. The
amount of cases are denoted by the size of circles. Countries are shaded by grey being previously
reported cases, and no shading means no reported cases.
This is a graphic that shows the occurences of a certain diseas on a global basis. It shows
more occurences as bigger dots on the world map. Gray areas indicate that previous cases have
been reported.
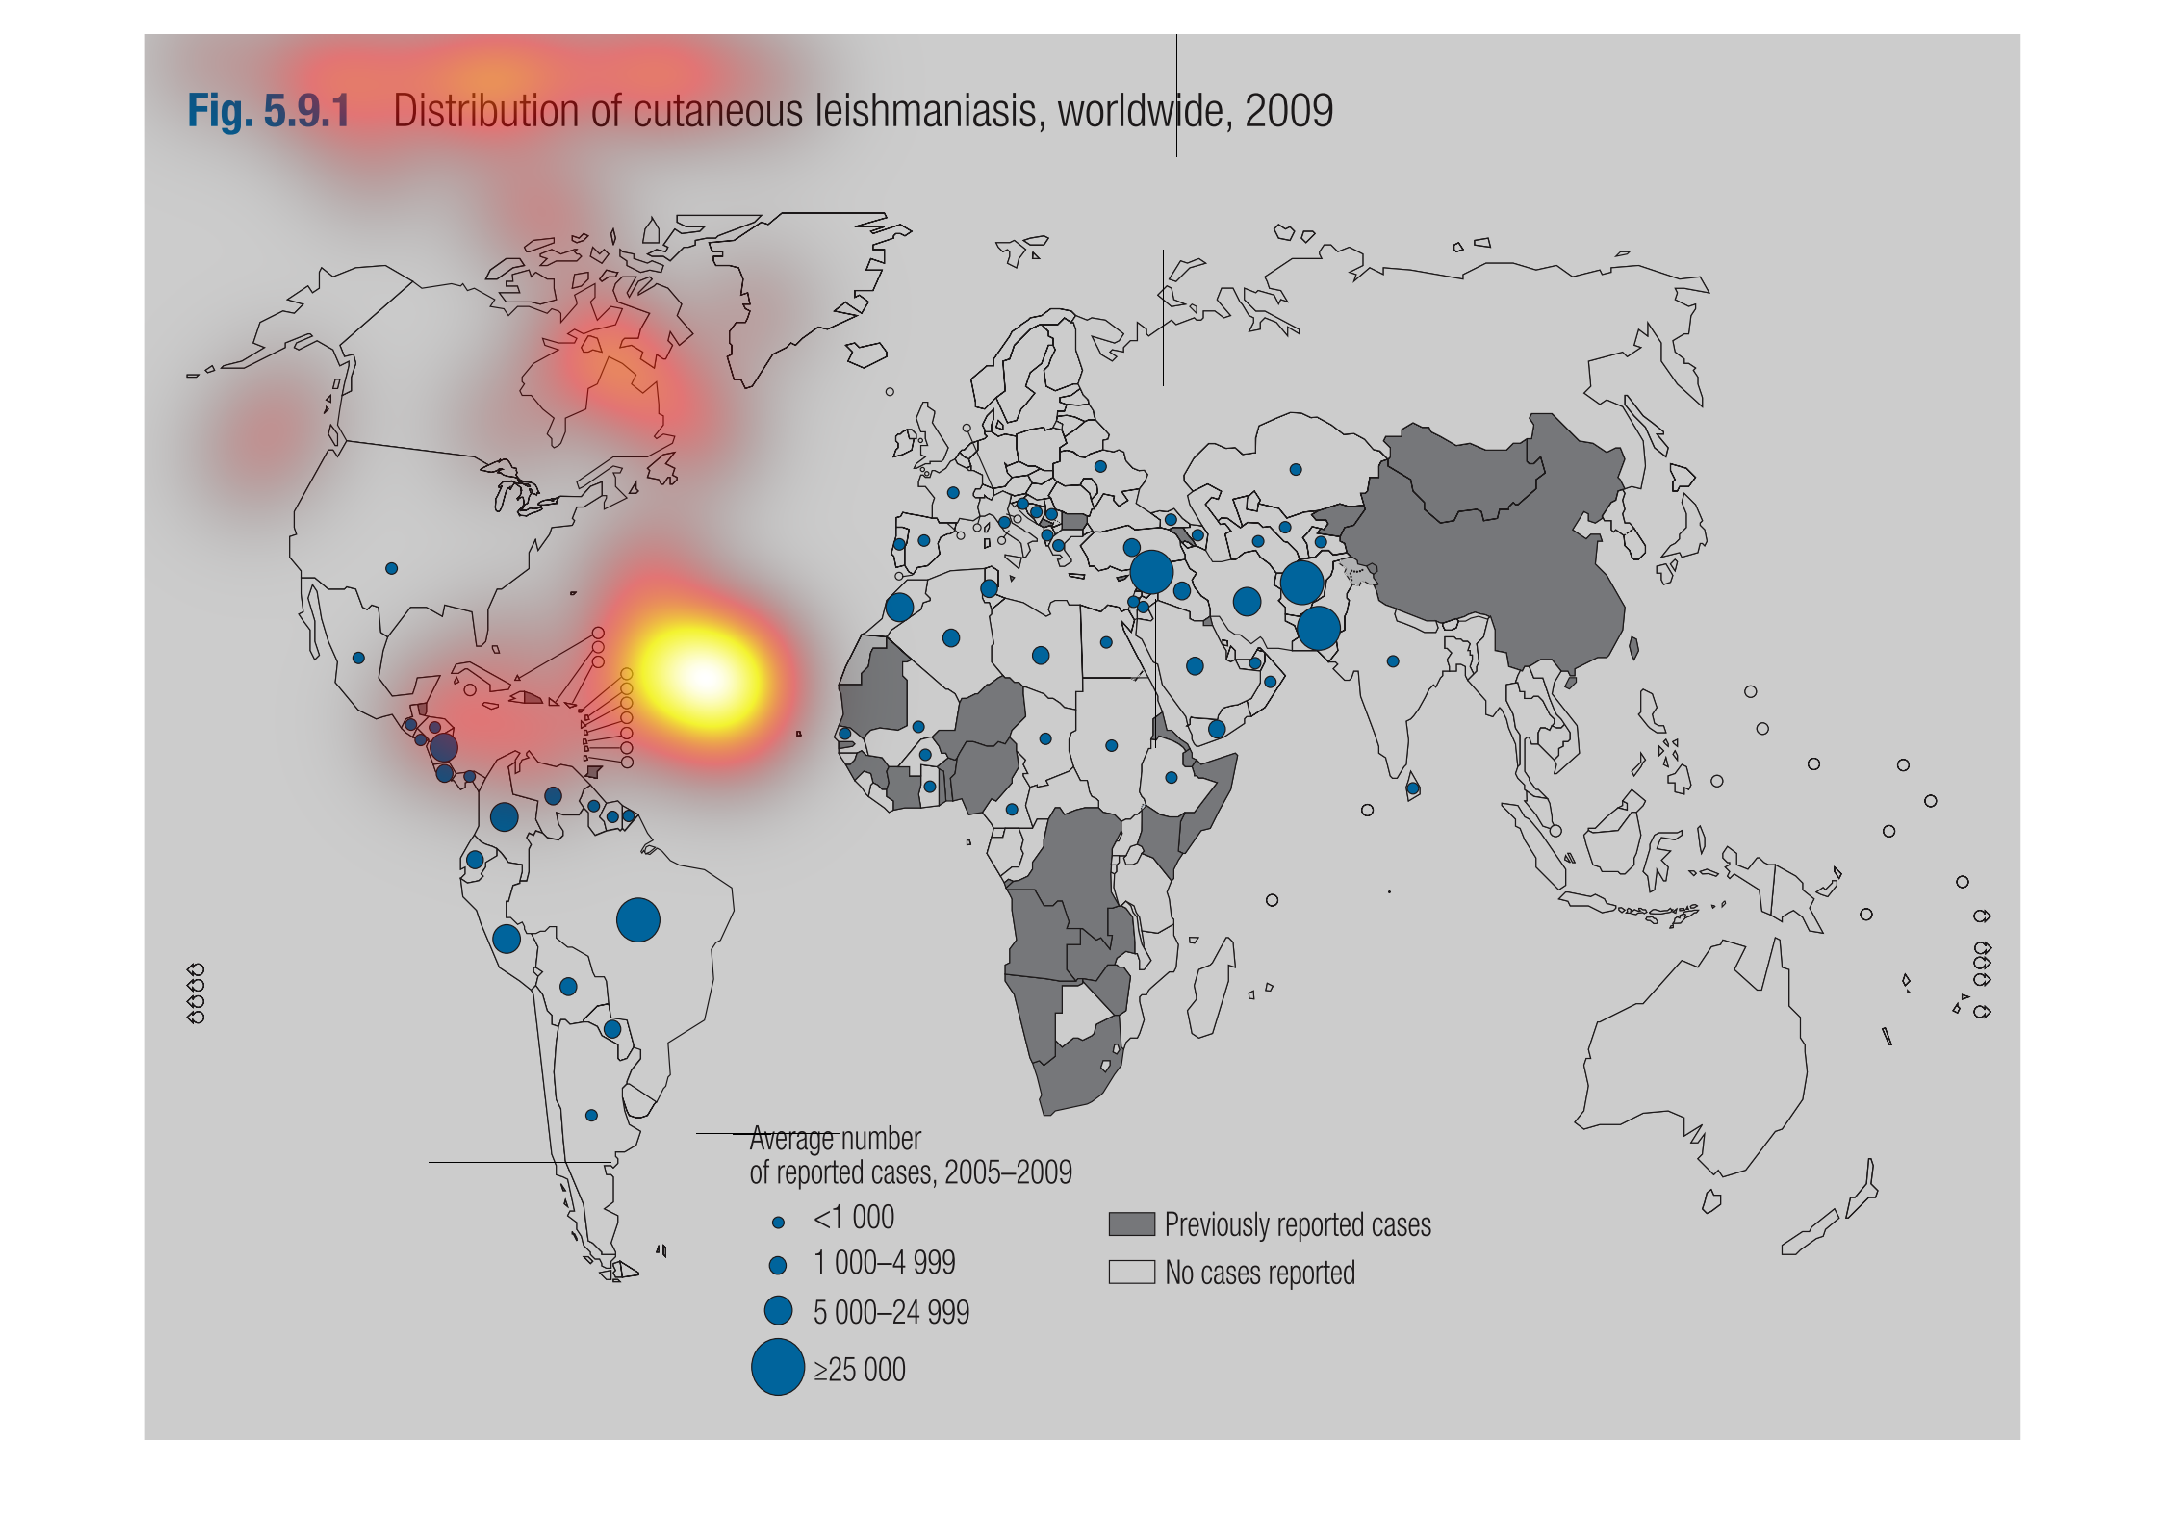
This graph maps the incidences of cutaneous leishmaniasis around the world. China and central
Asia saw high rates, as well as the Arab peninsula and Southern and Western Africa.
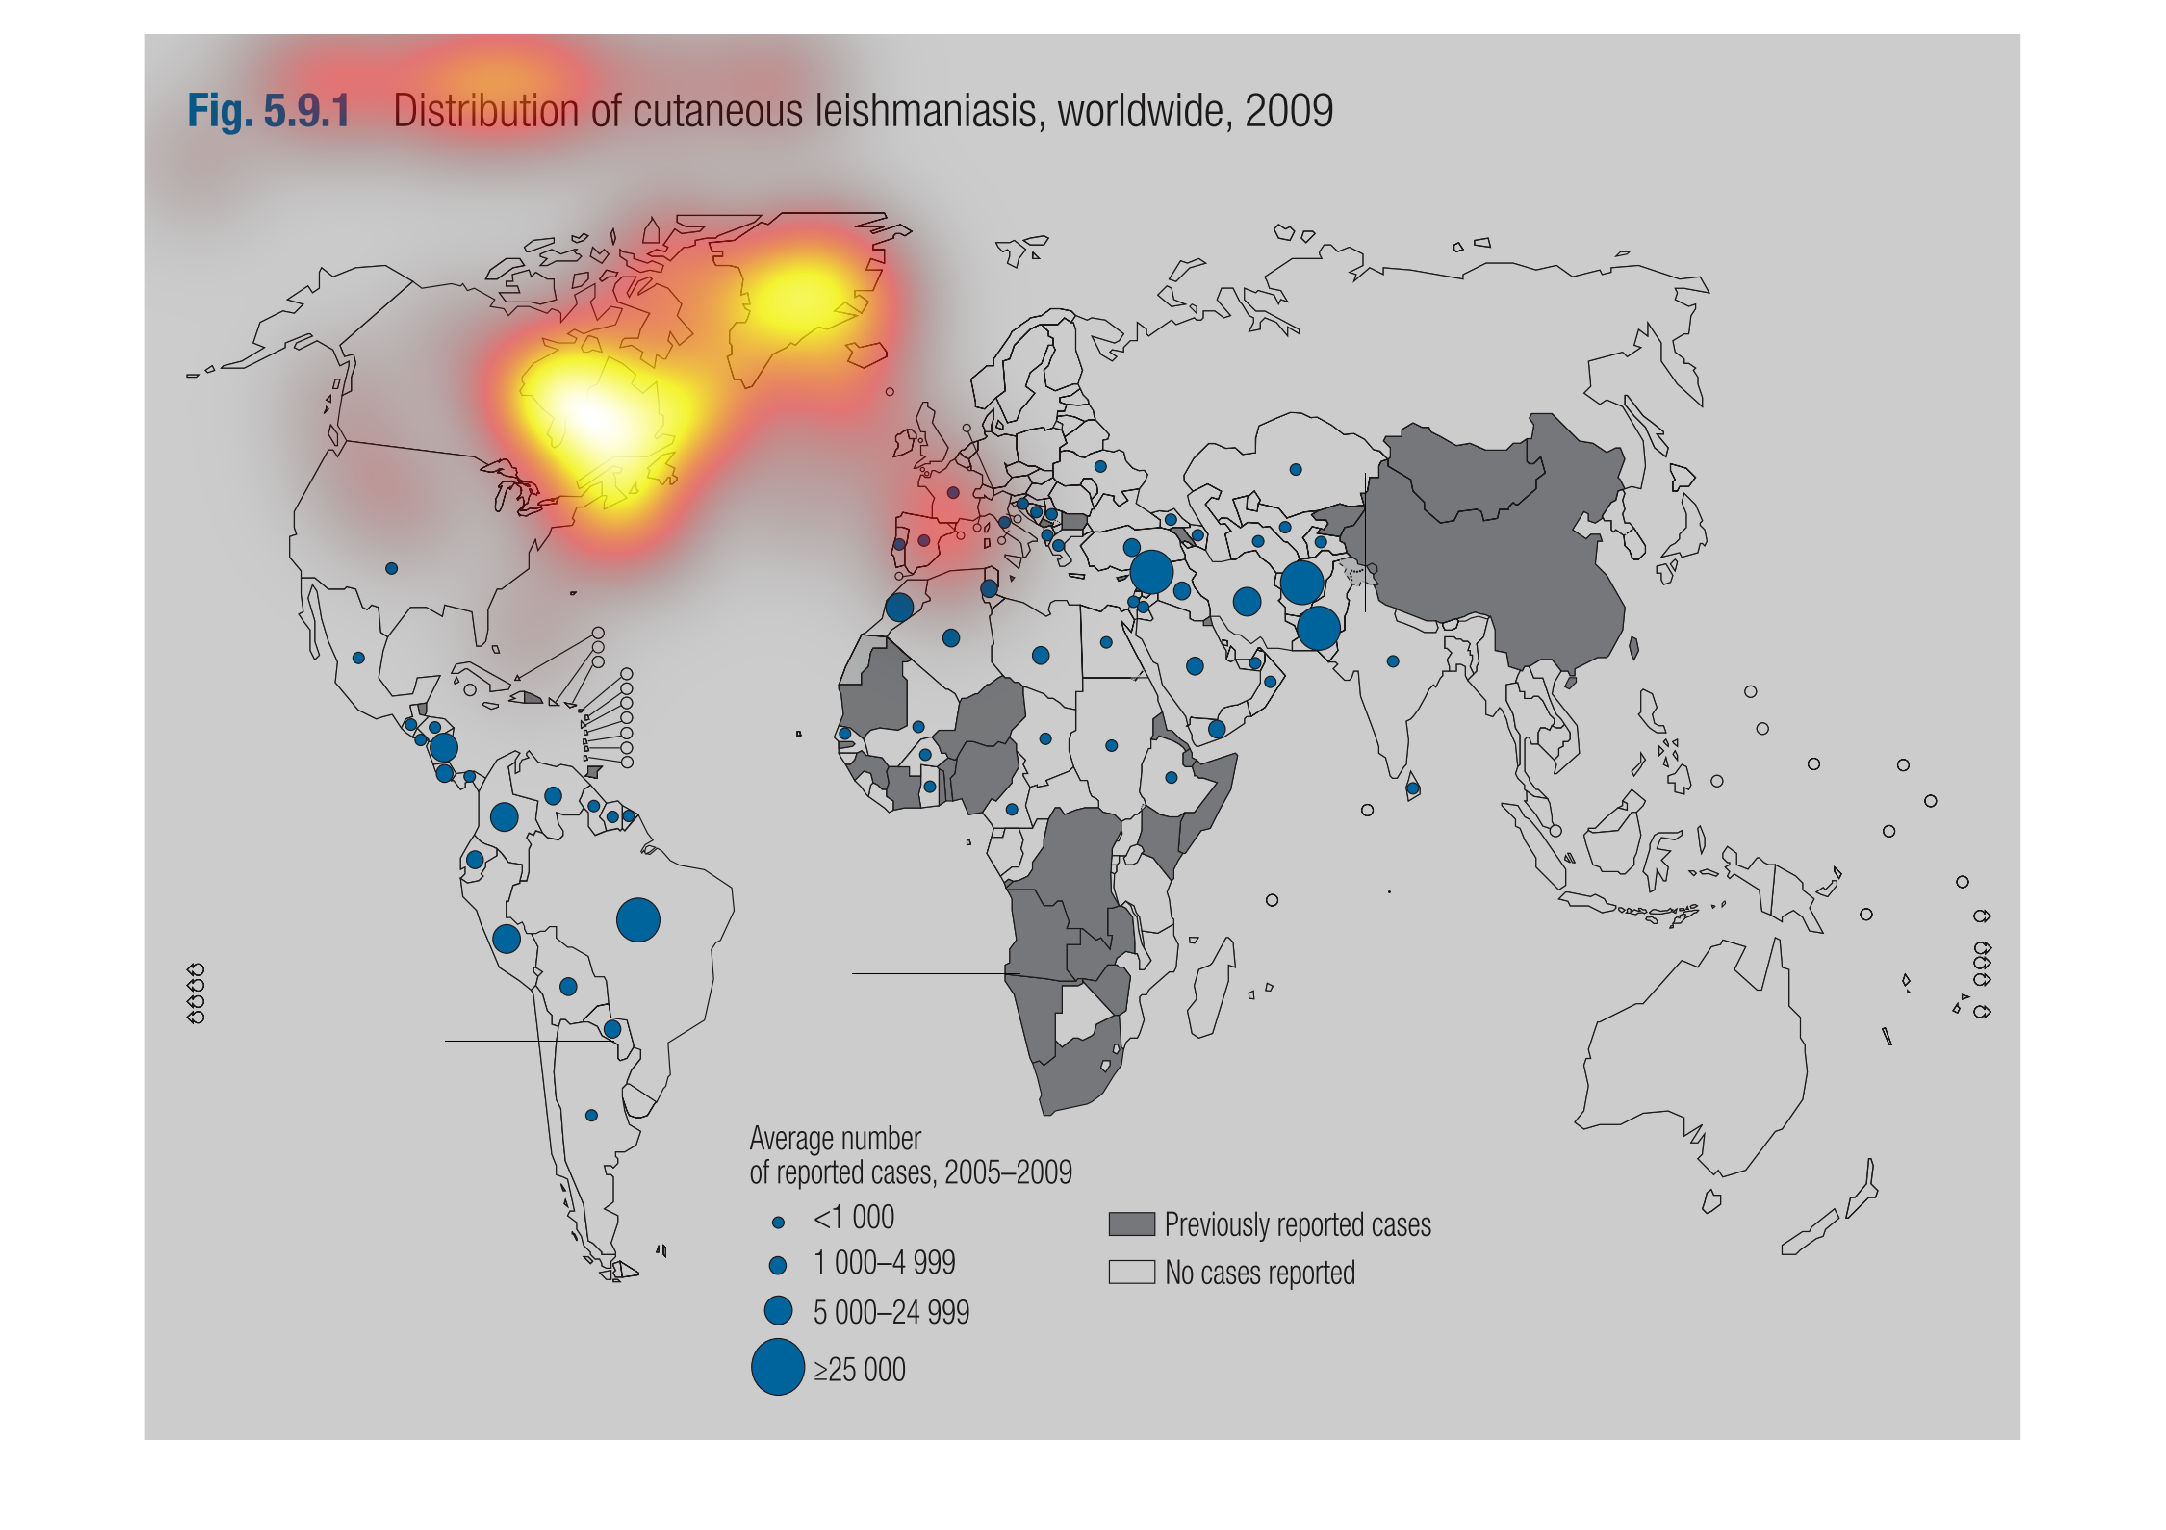
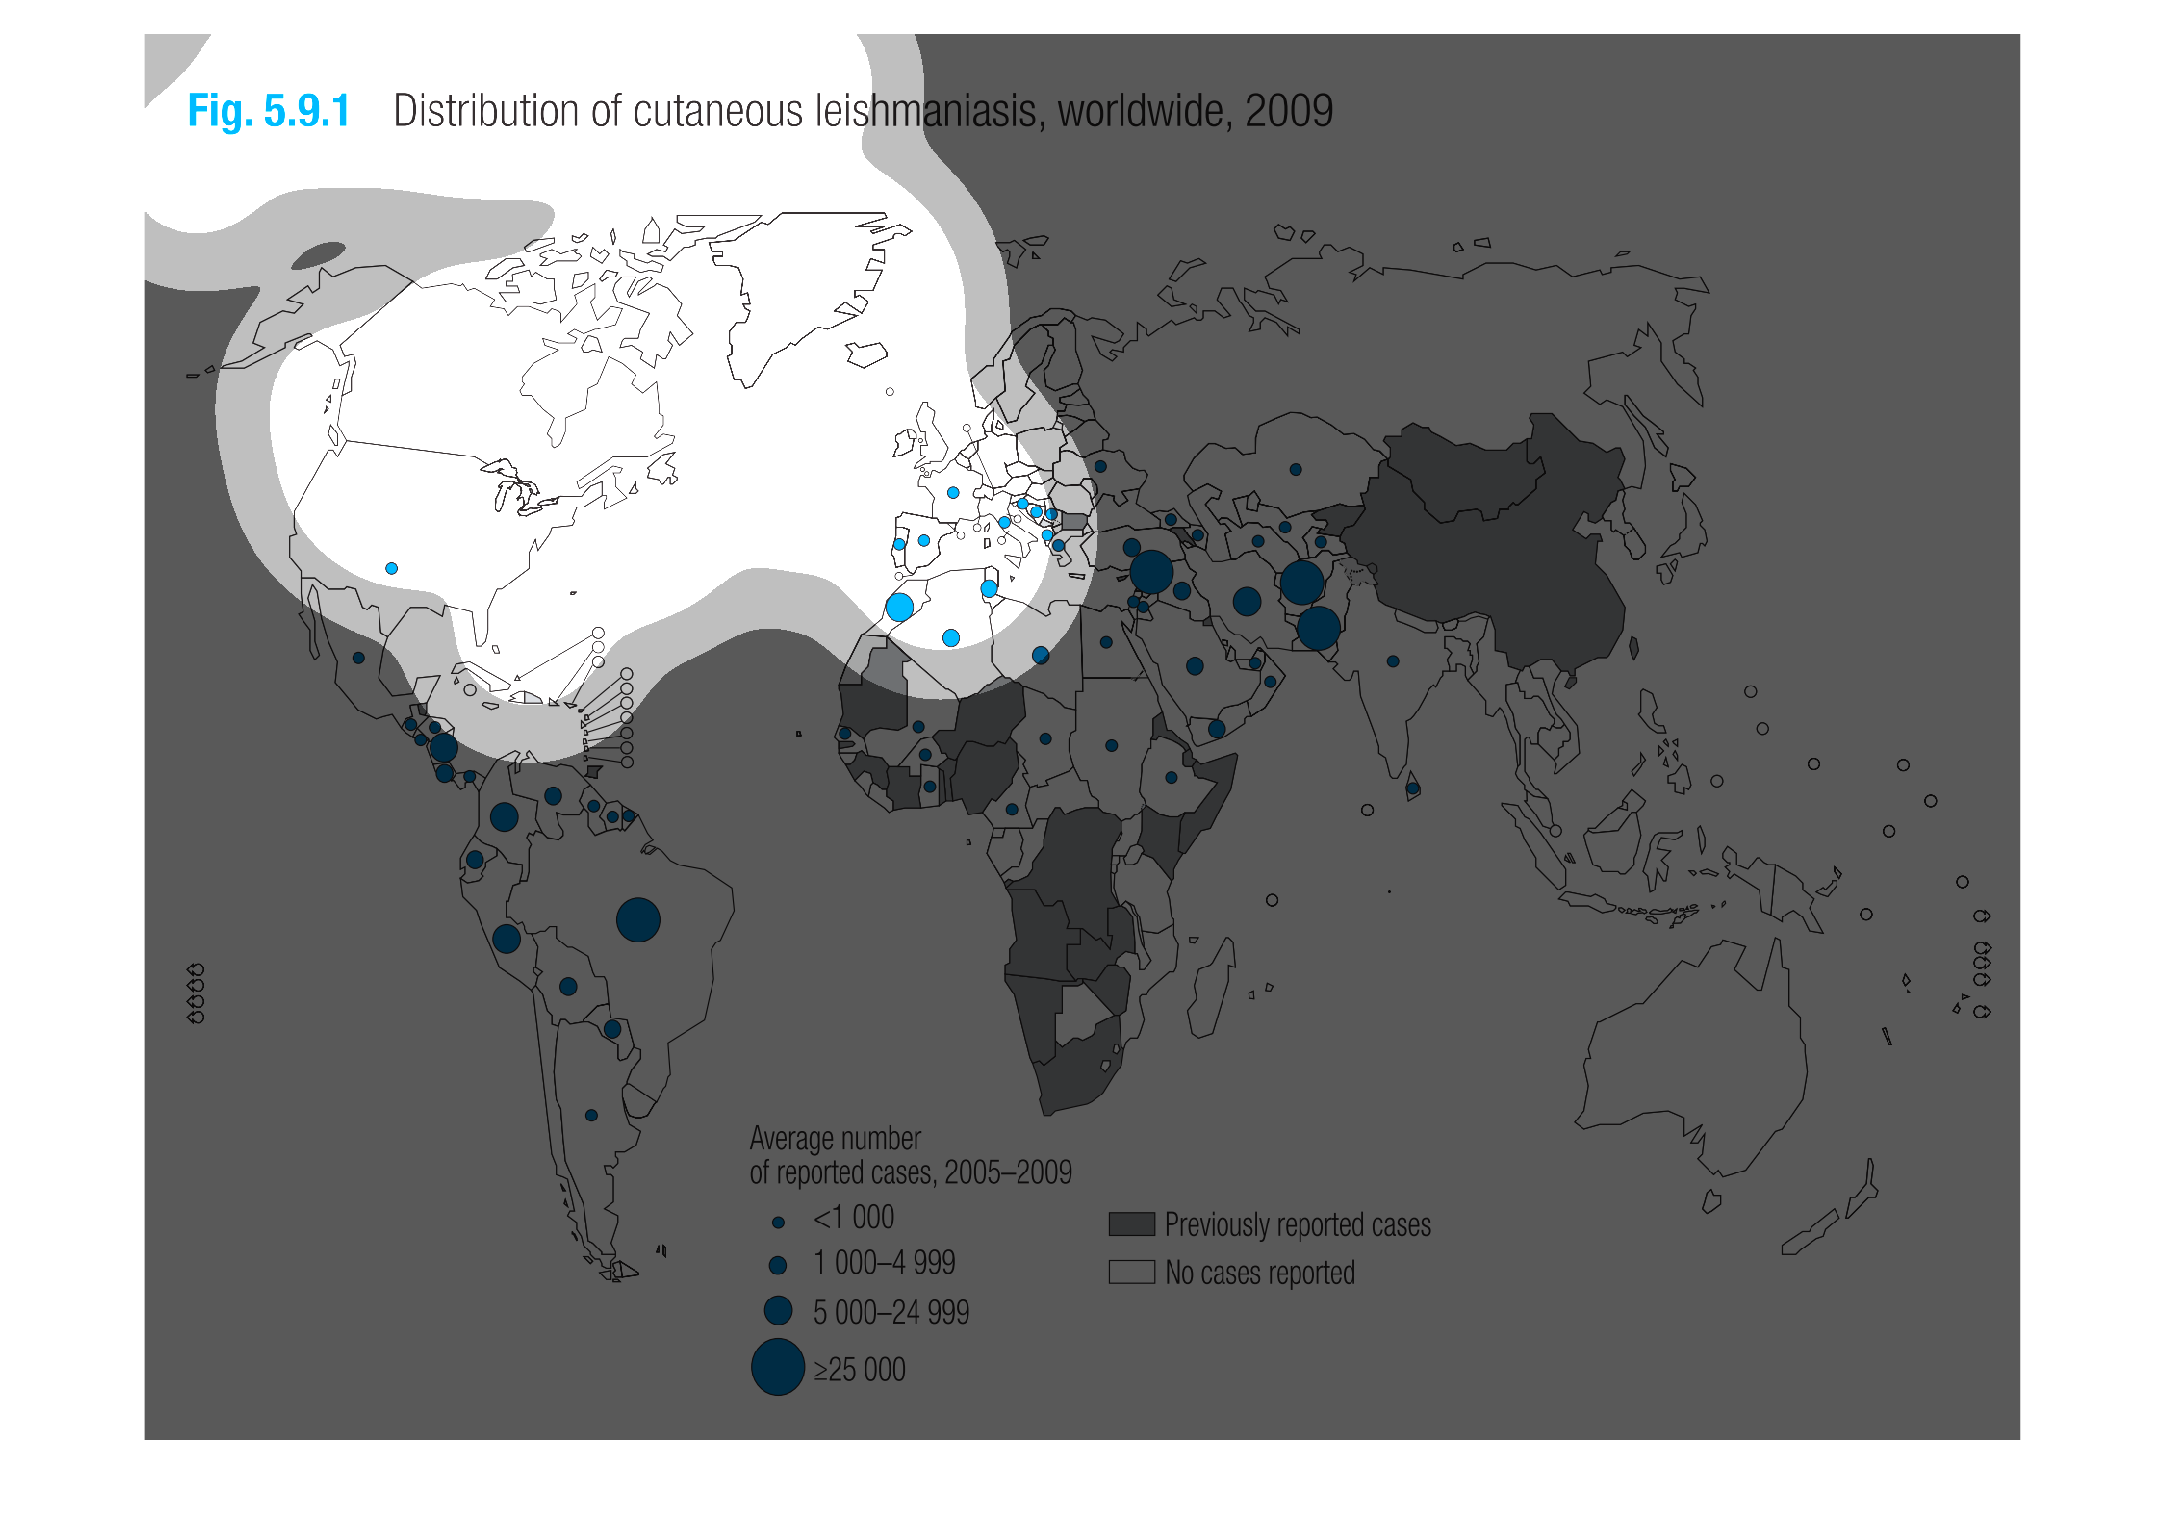
Figure 5.9.1 shows the distribution of cutaneous leishmaniasis worldwide in 2009. The middle
east had the most new cases with more than 25,000. Many parts of Africa already had reported
cases.