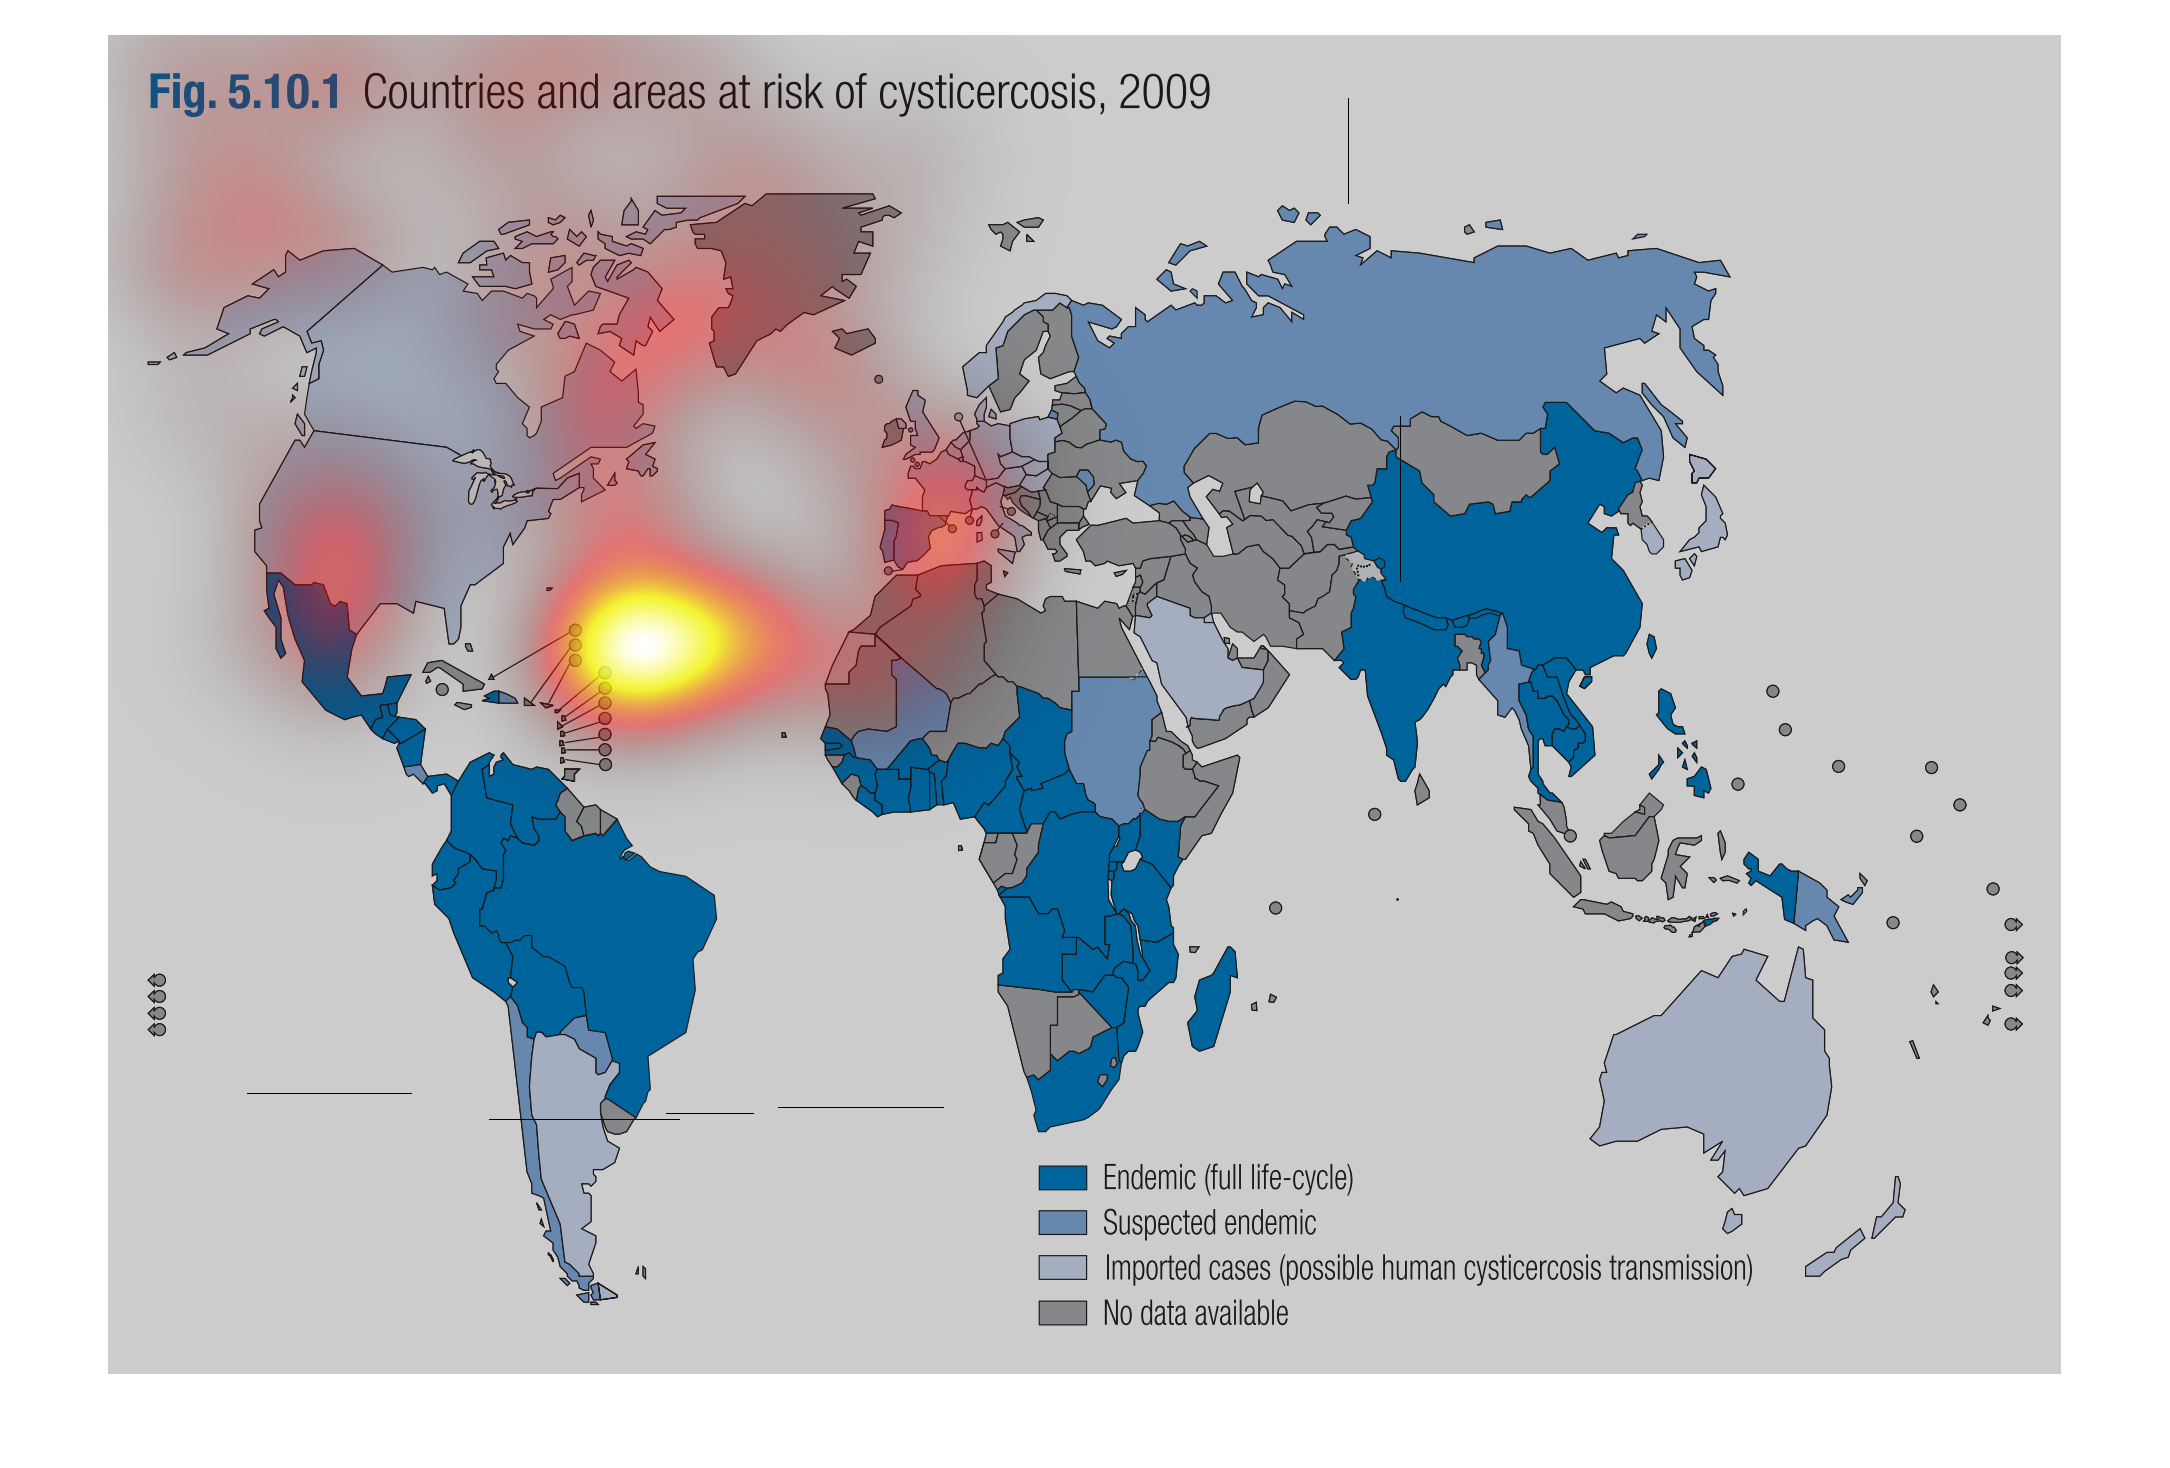
This handmade chart shows the areas of risk of the disease cysticercosis around the world.
It shows how mostly undeveloped countries have this disease
This is a world map showing the cases of some disease.  The information is considered by how
the disease enters the country: endemic, suspected endemic, or imported.  These are shown
in shades of blue.   For some countries, no data is available, and these are shown in gray.
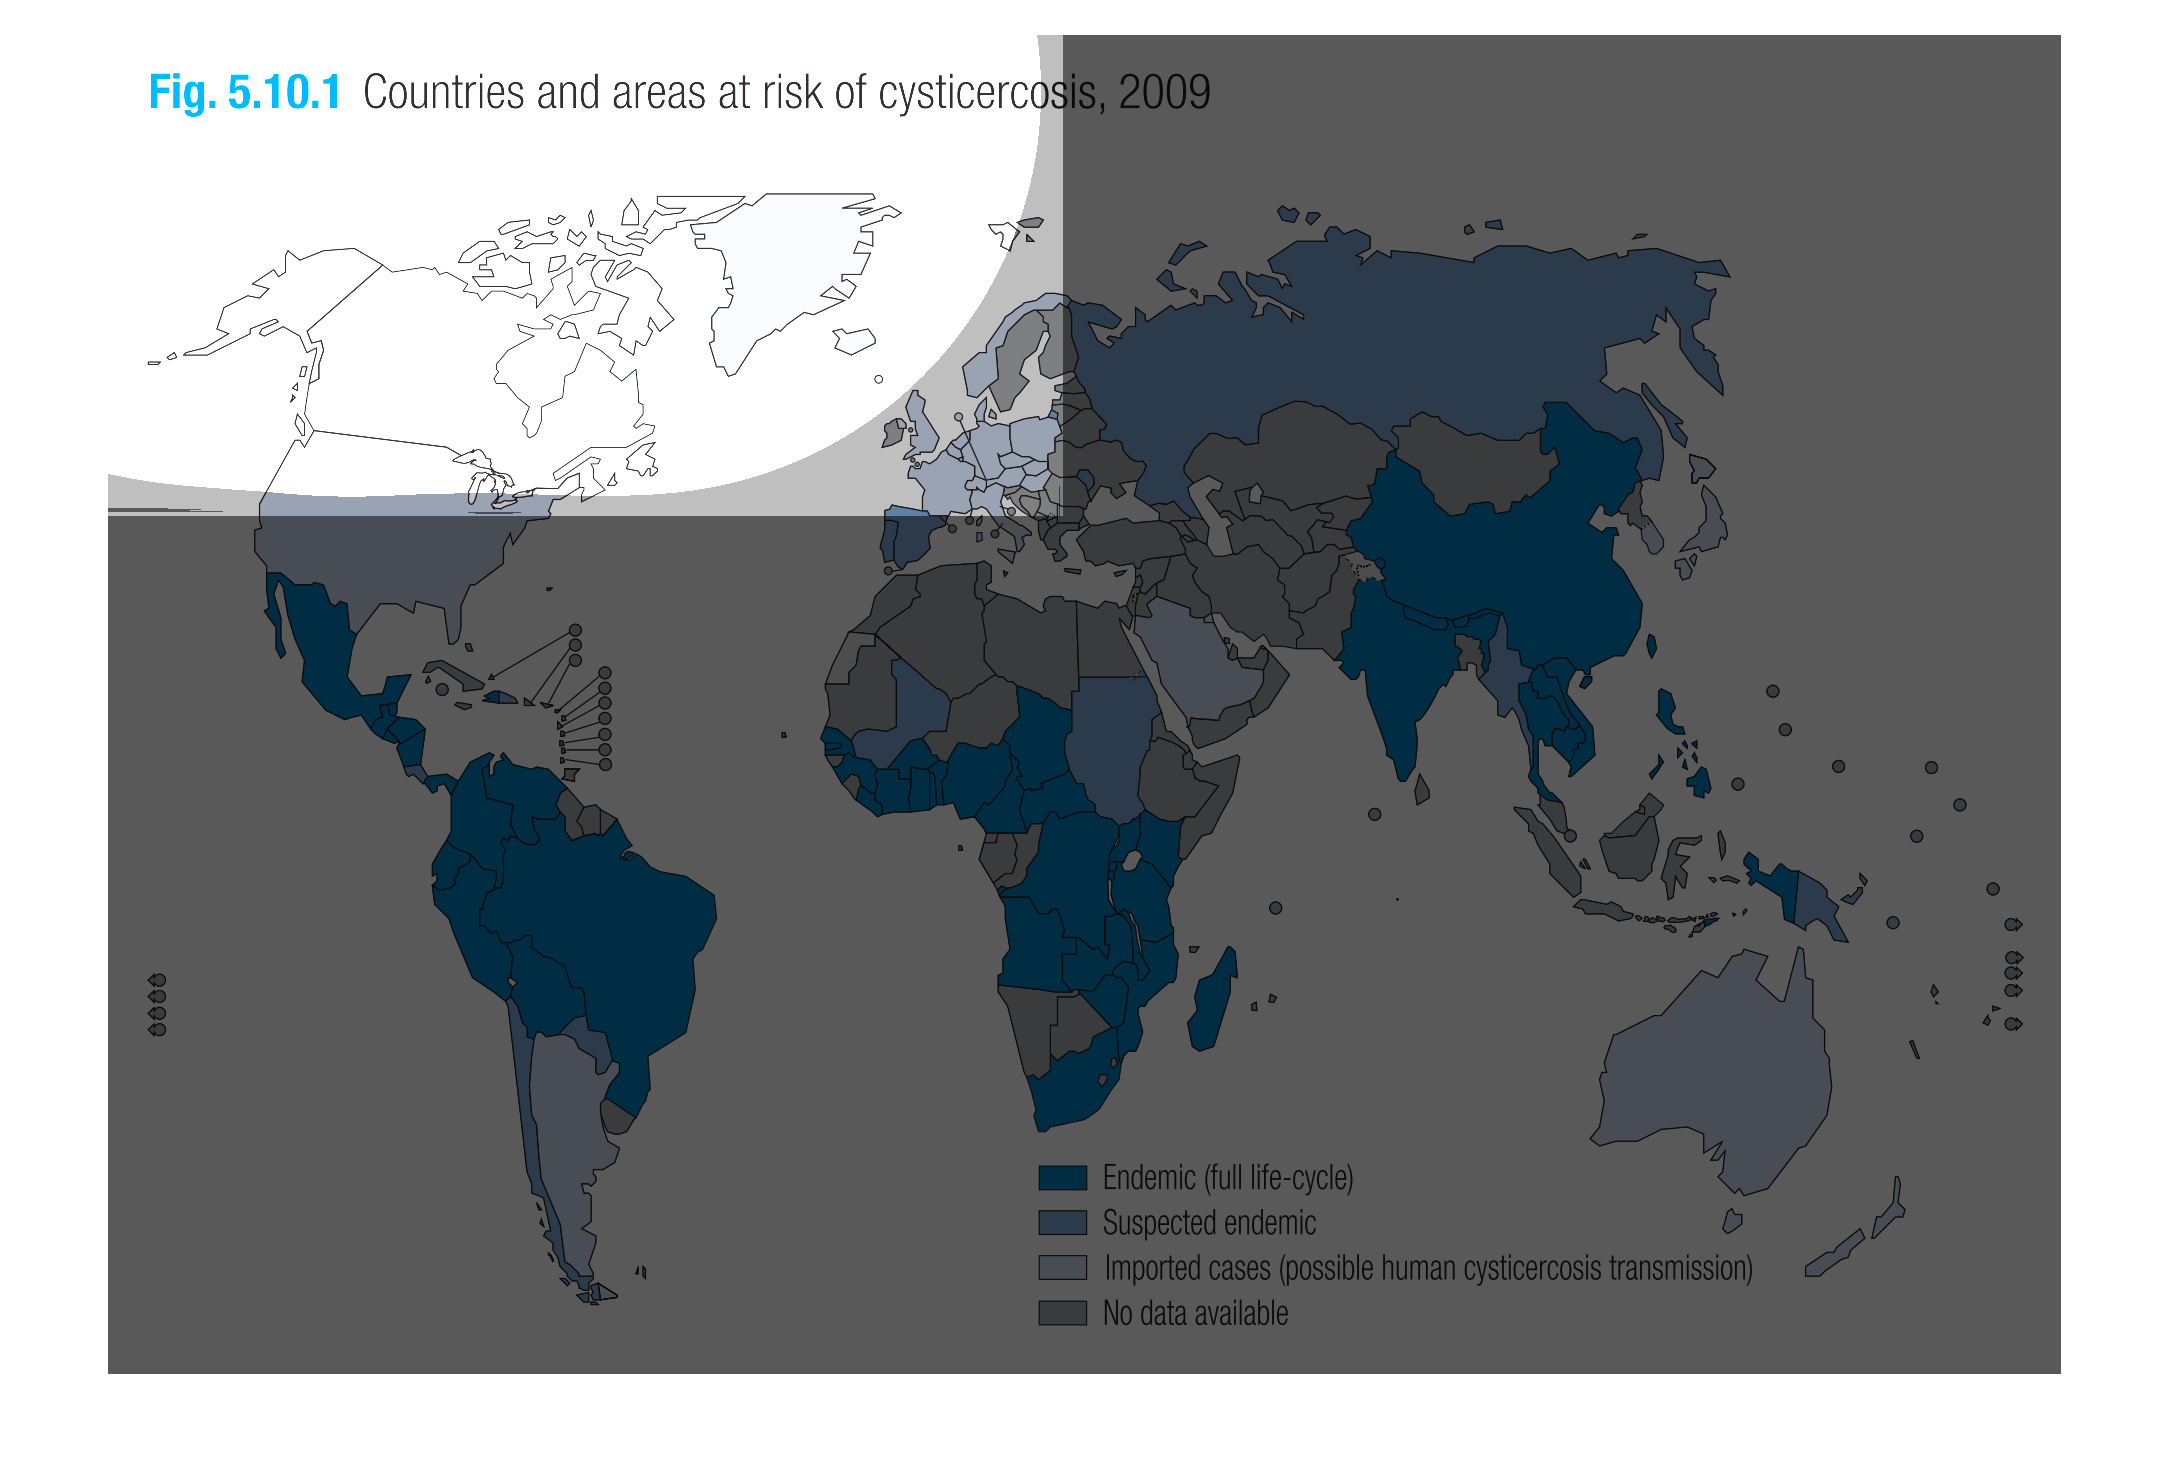
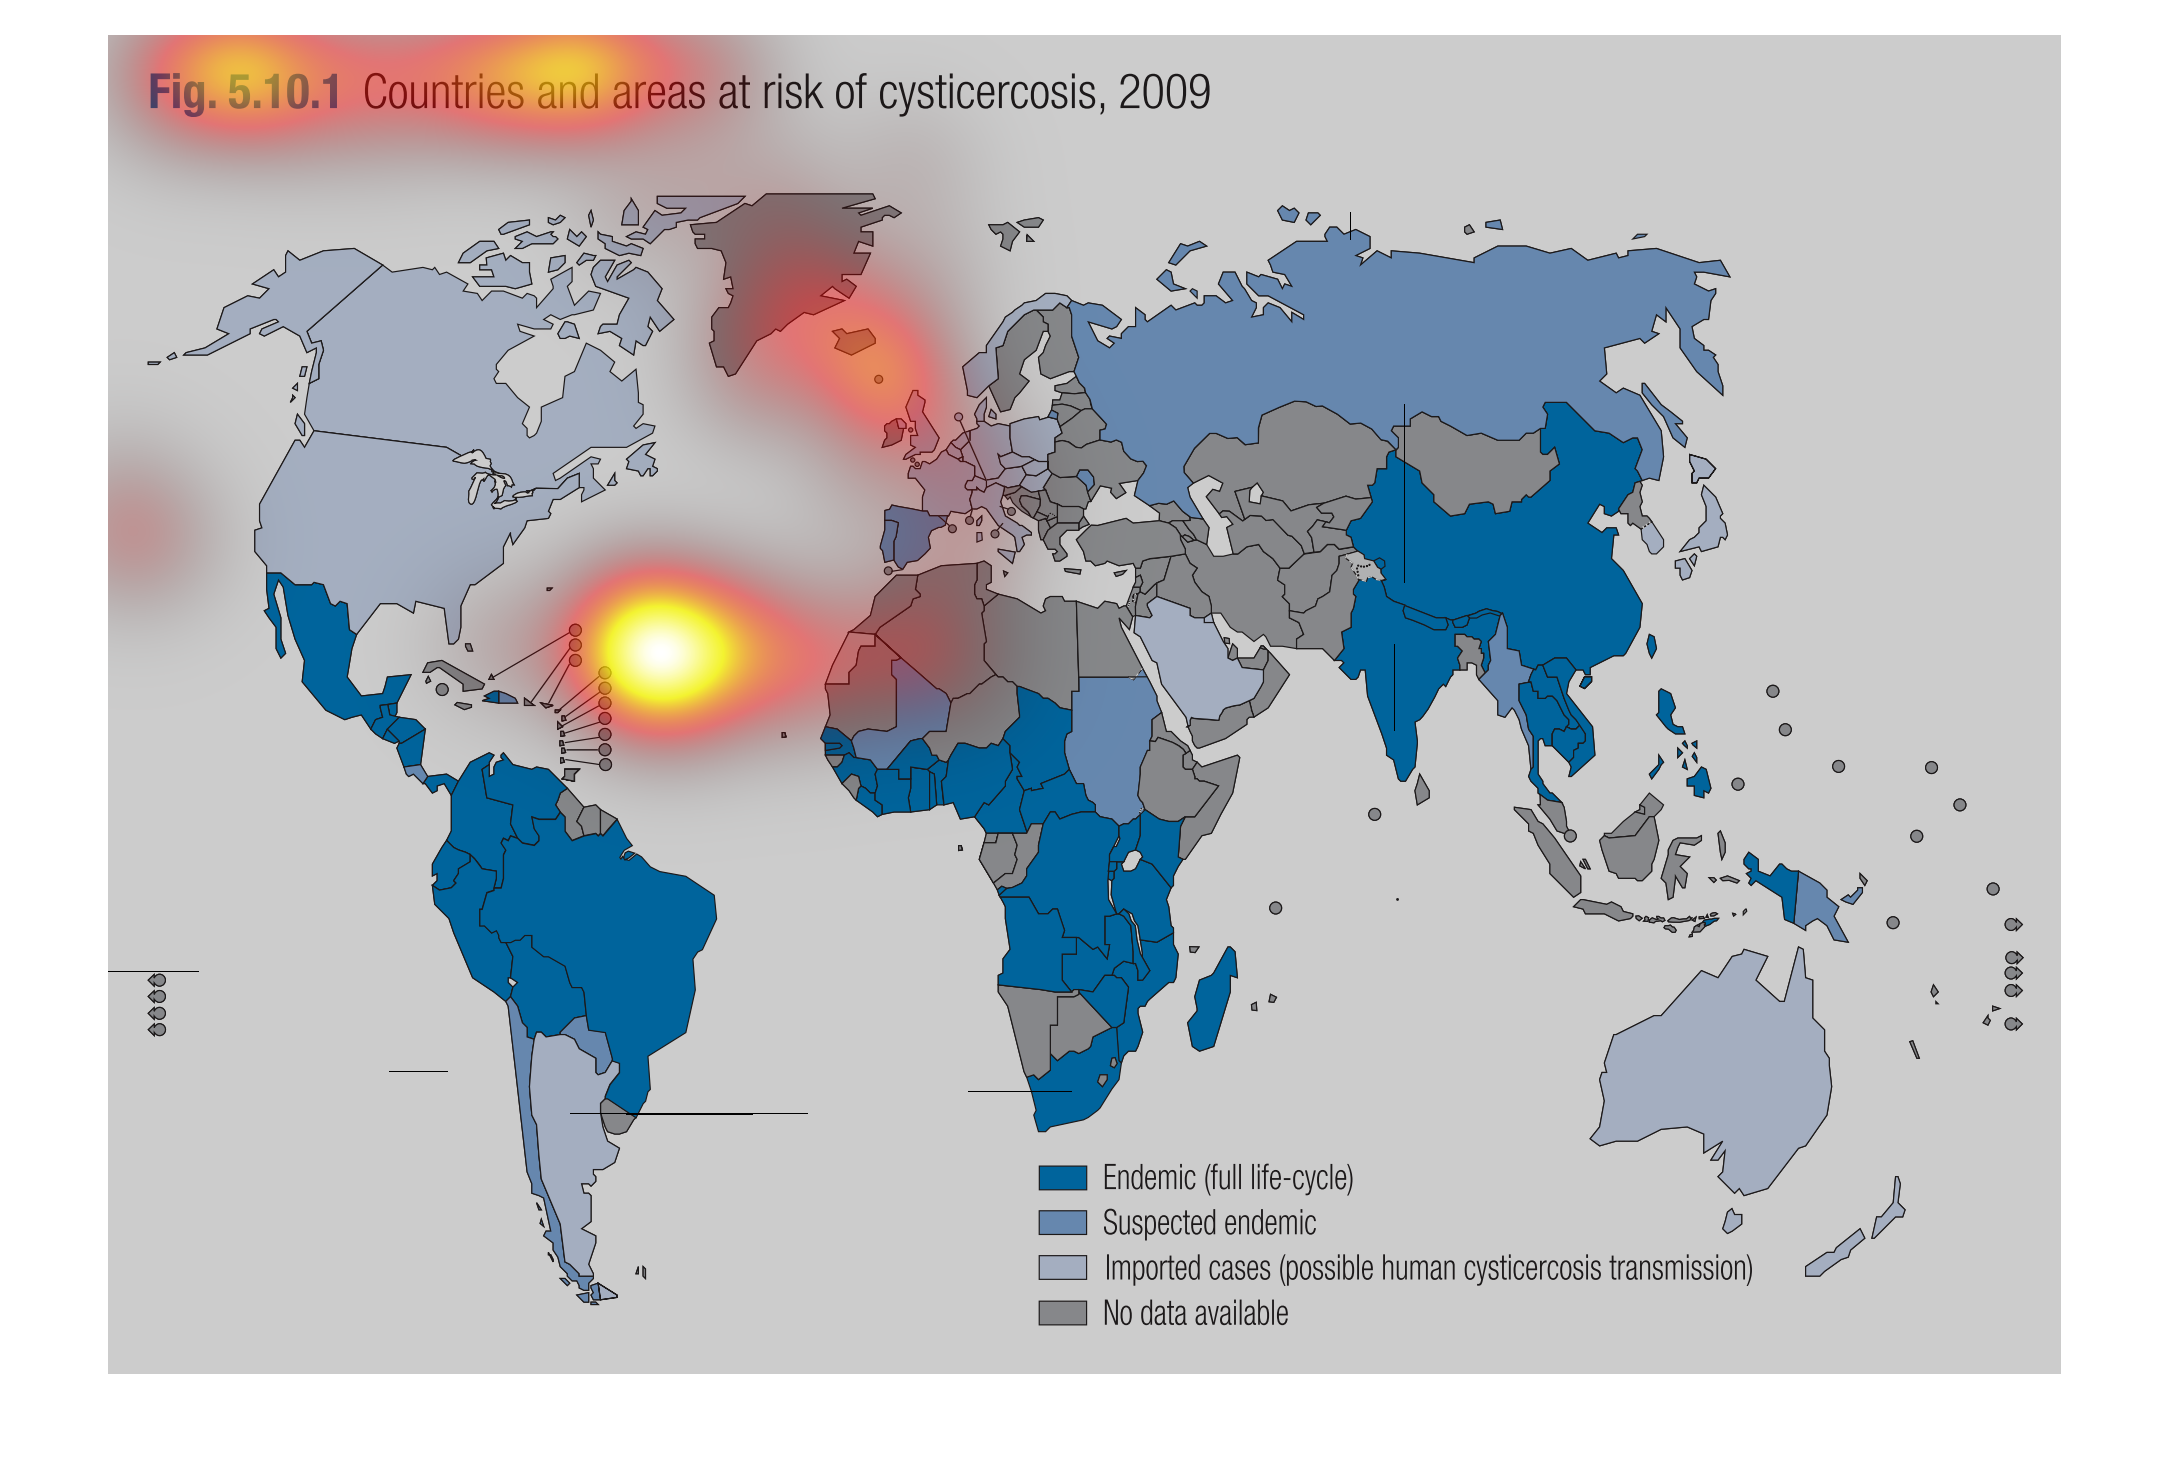
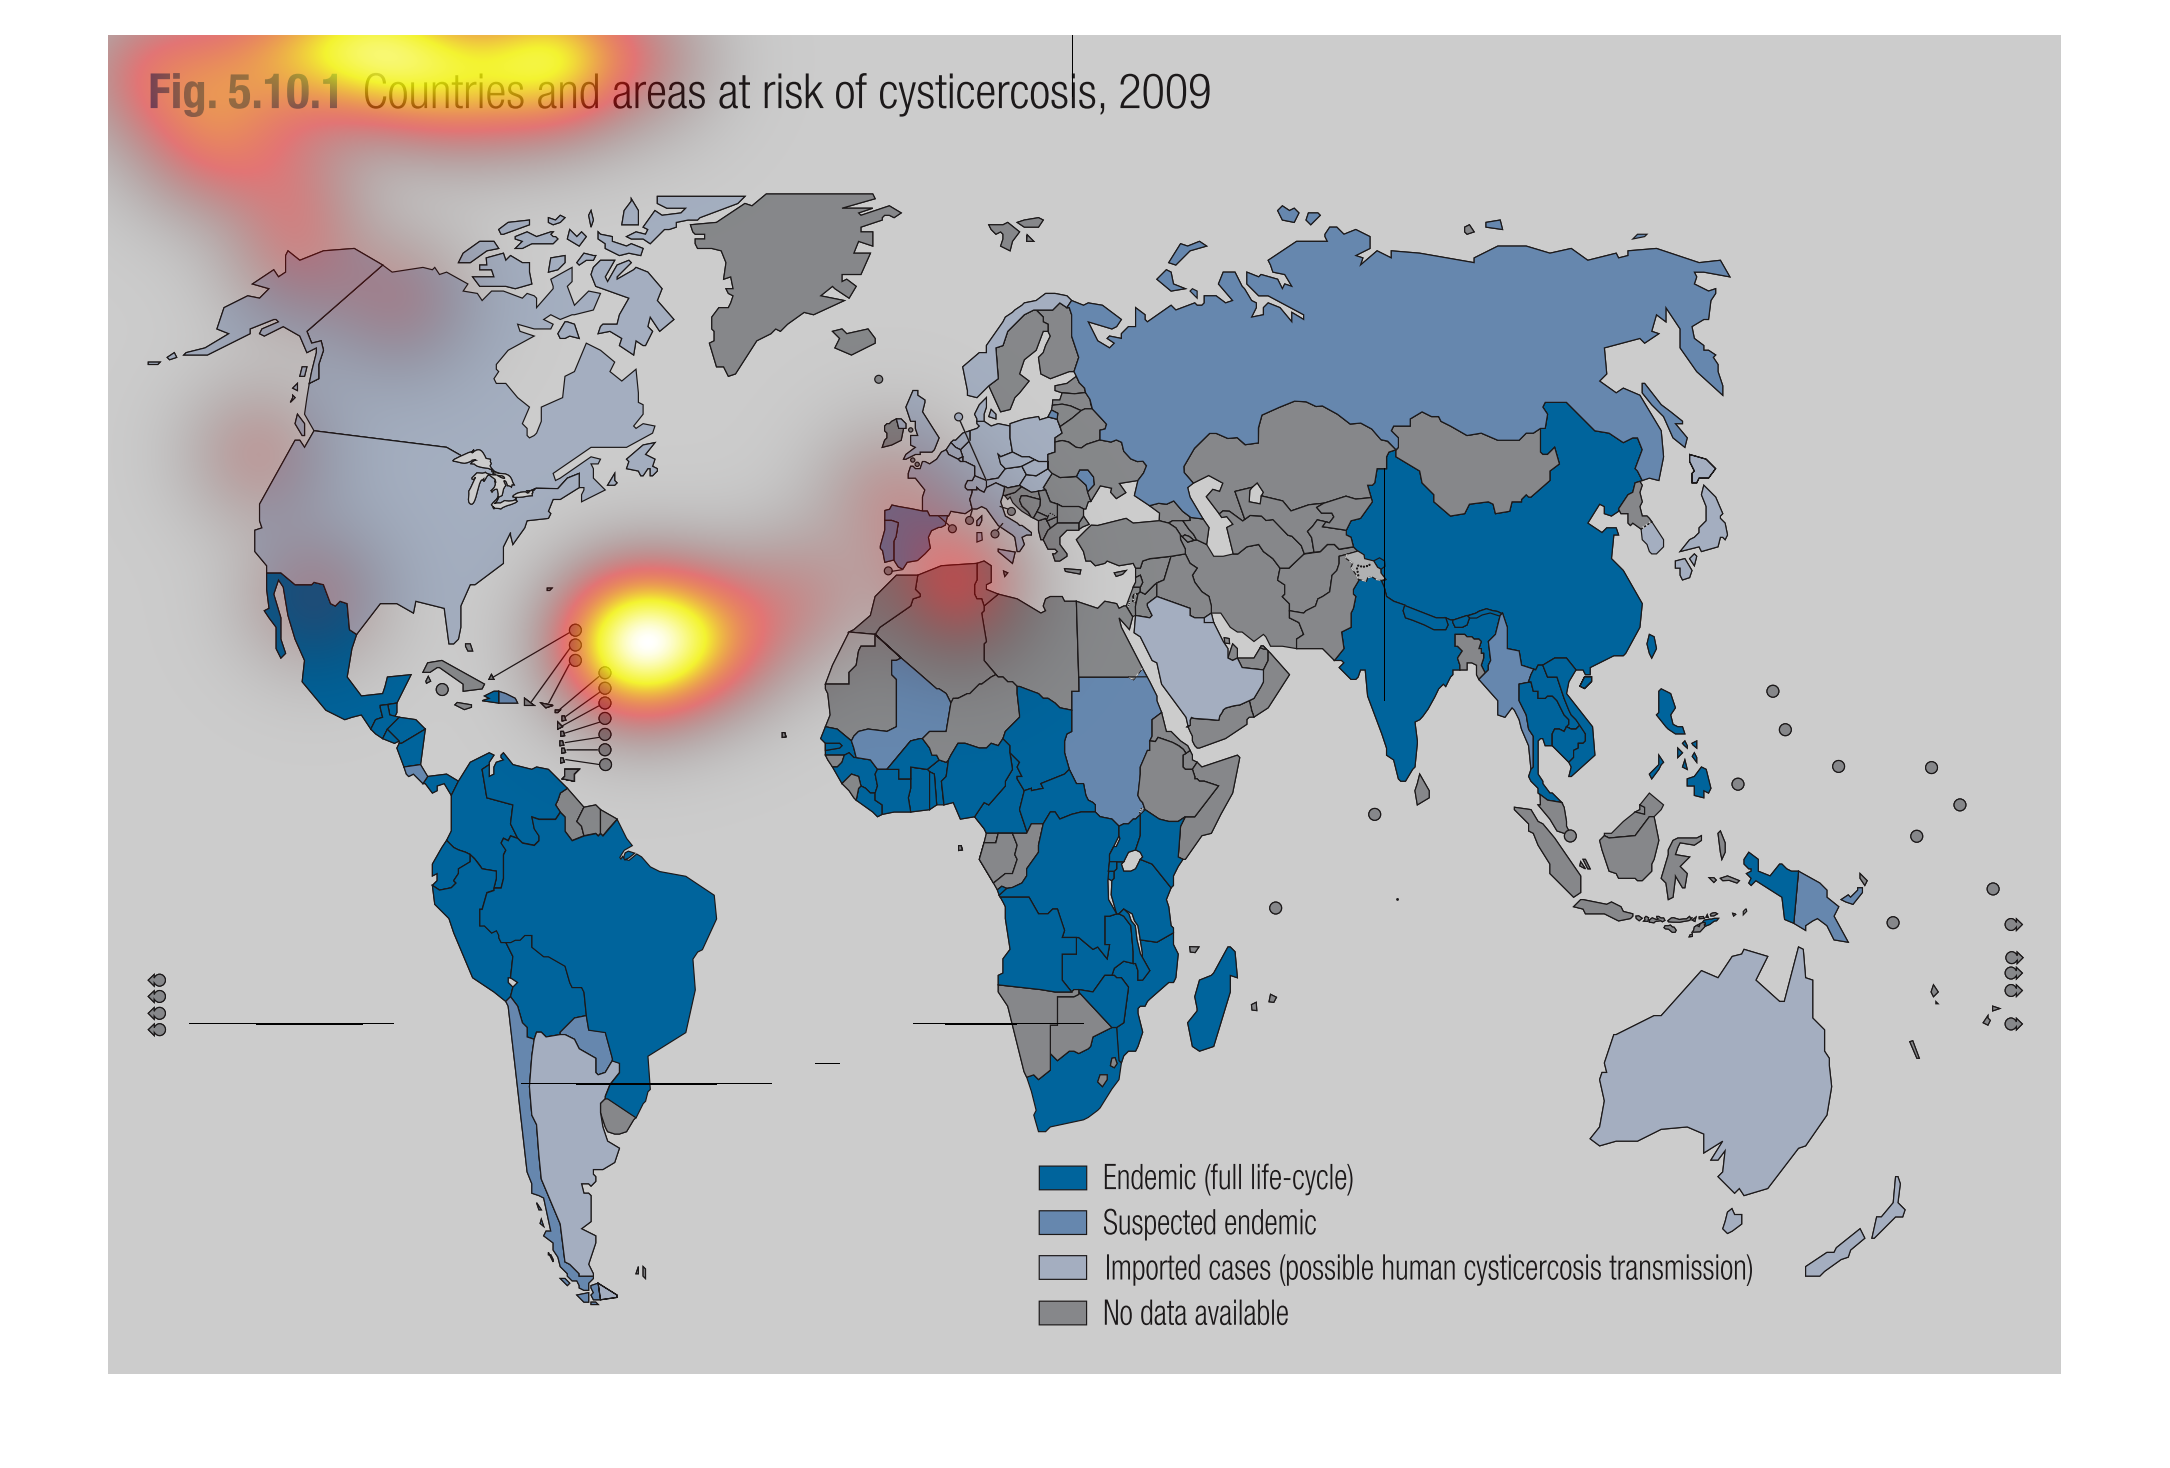
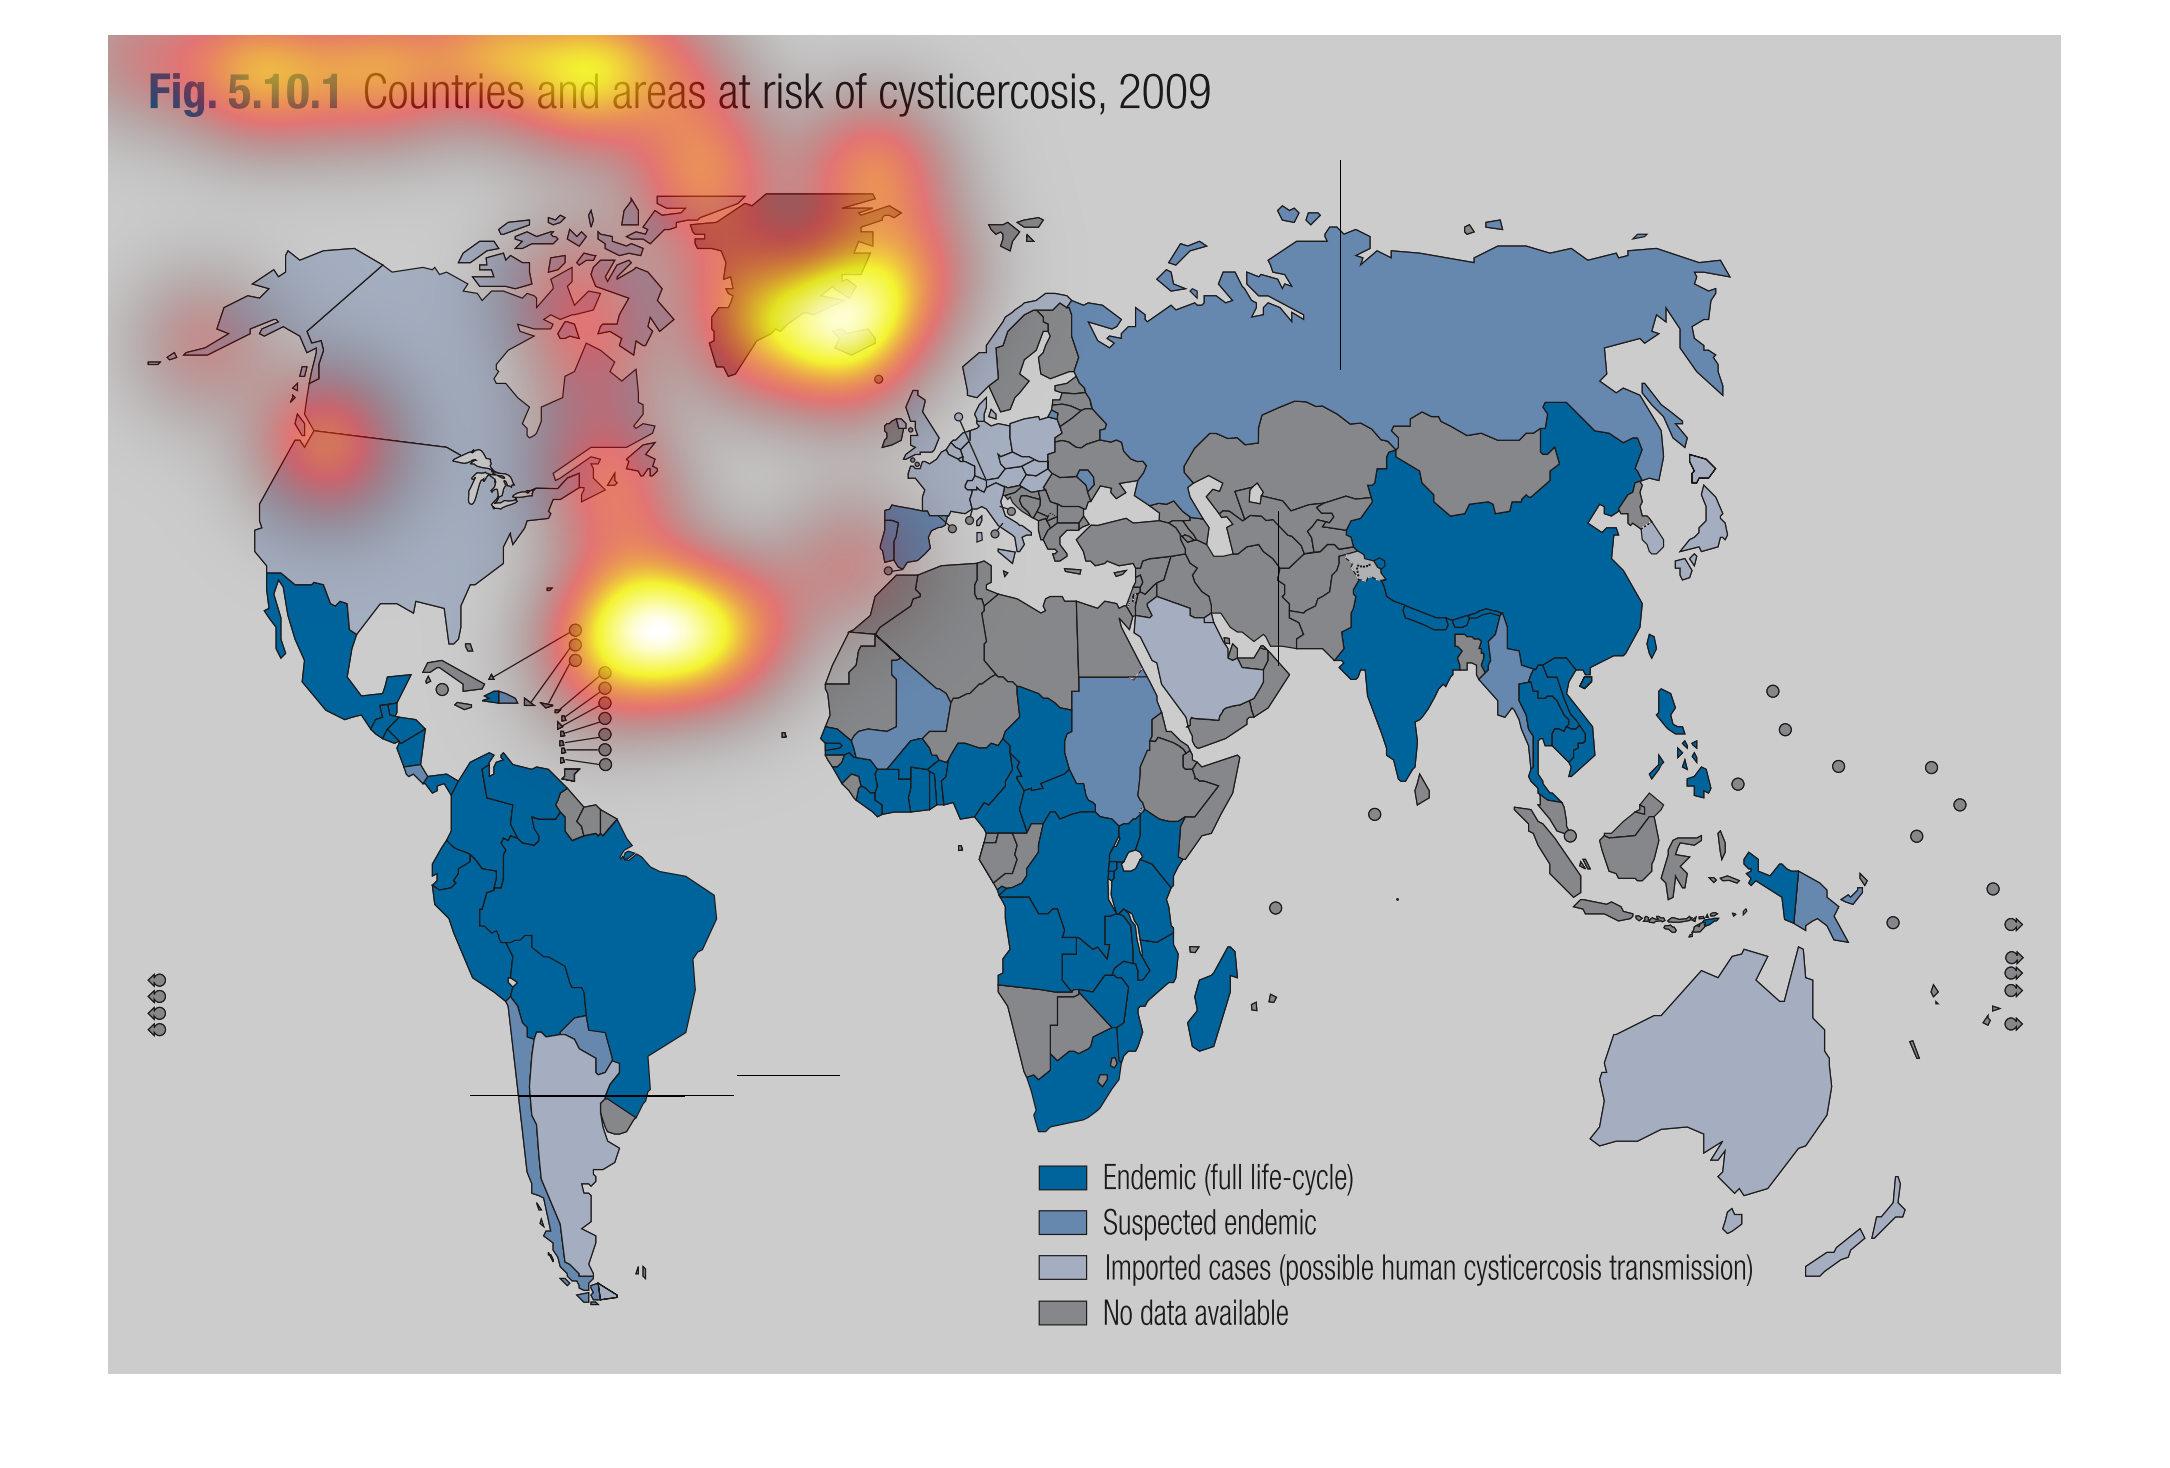
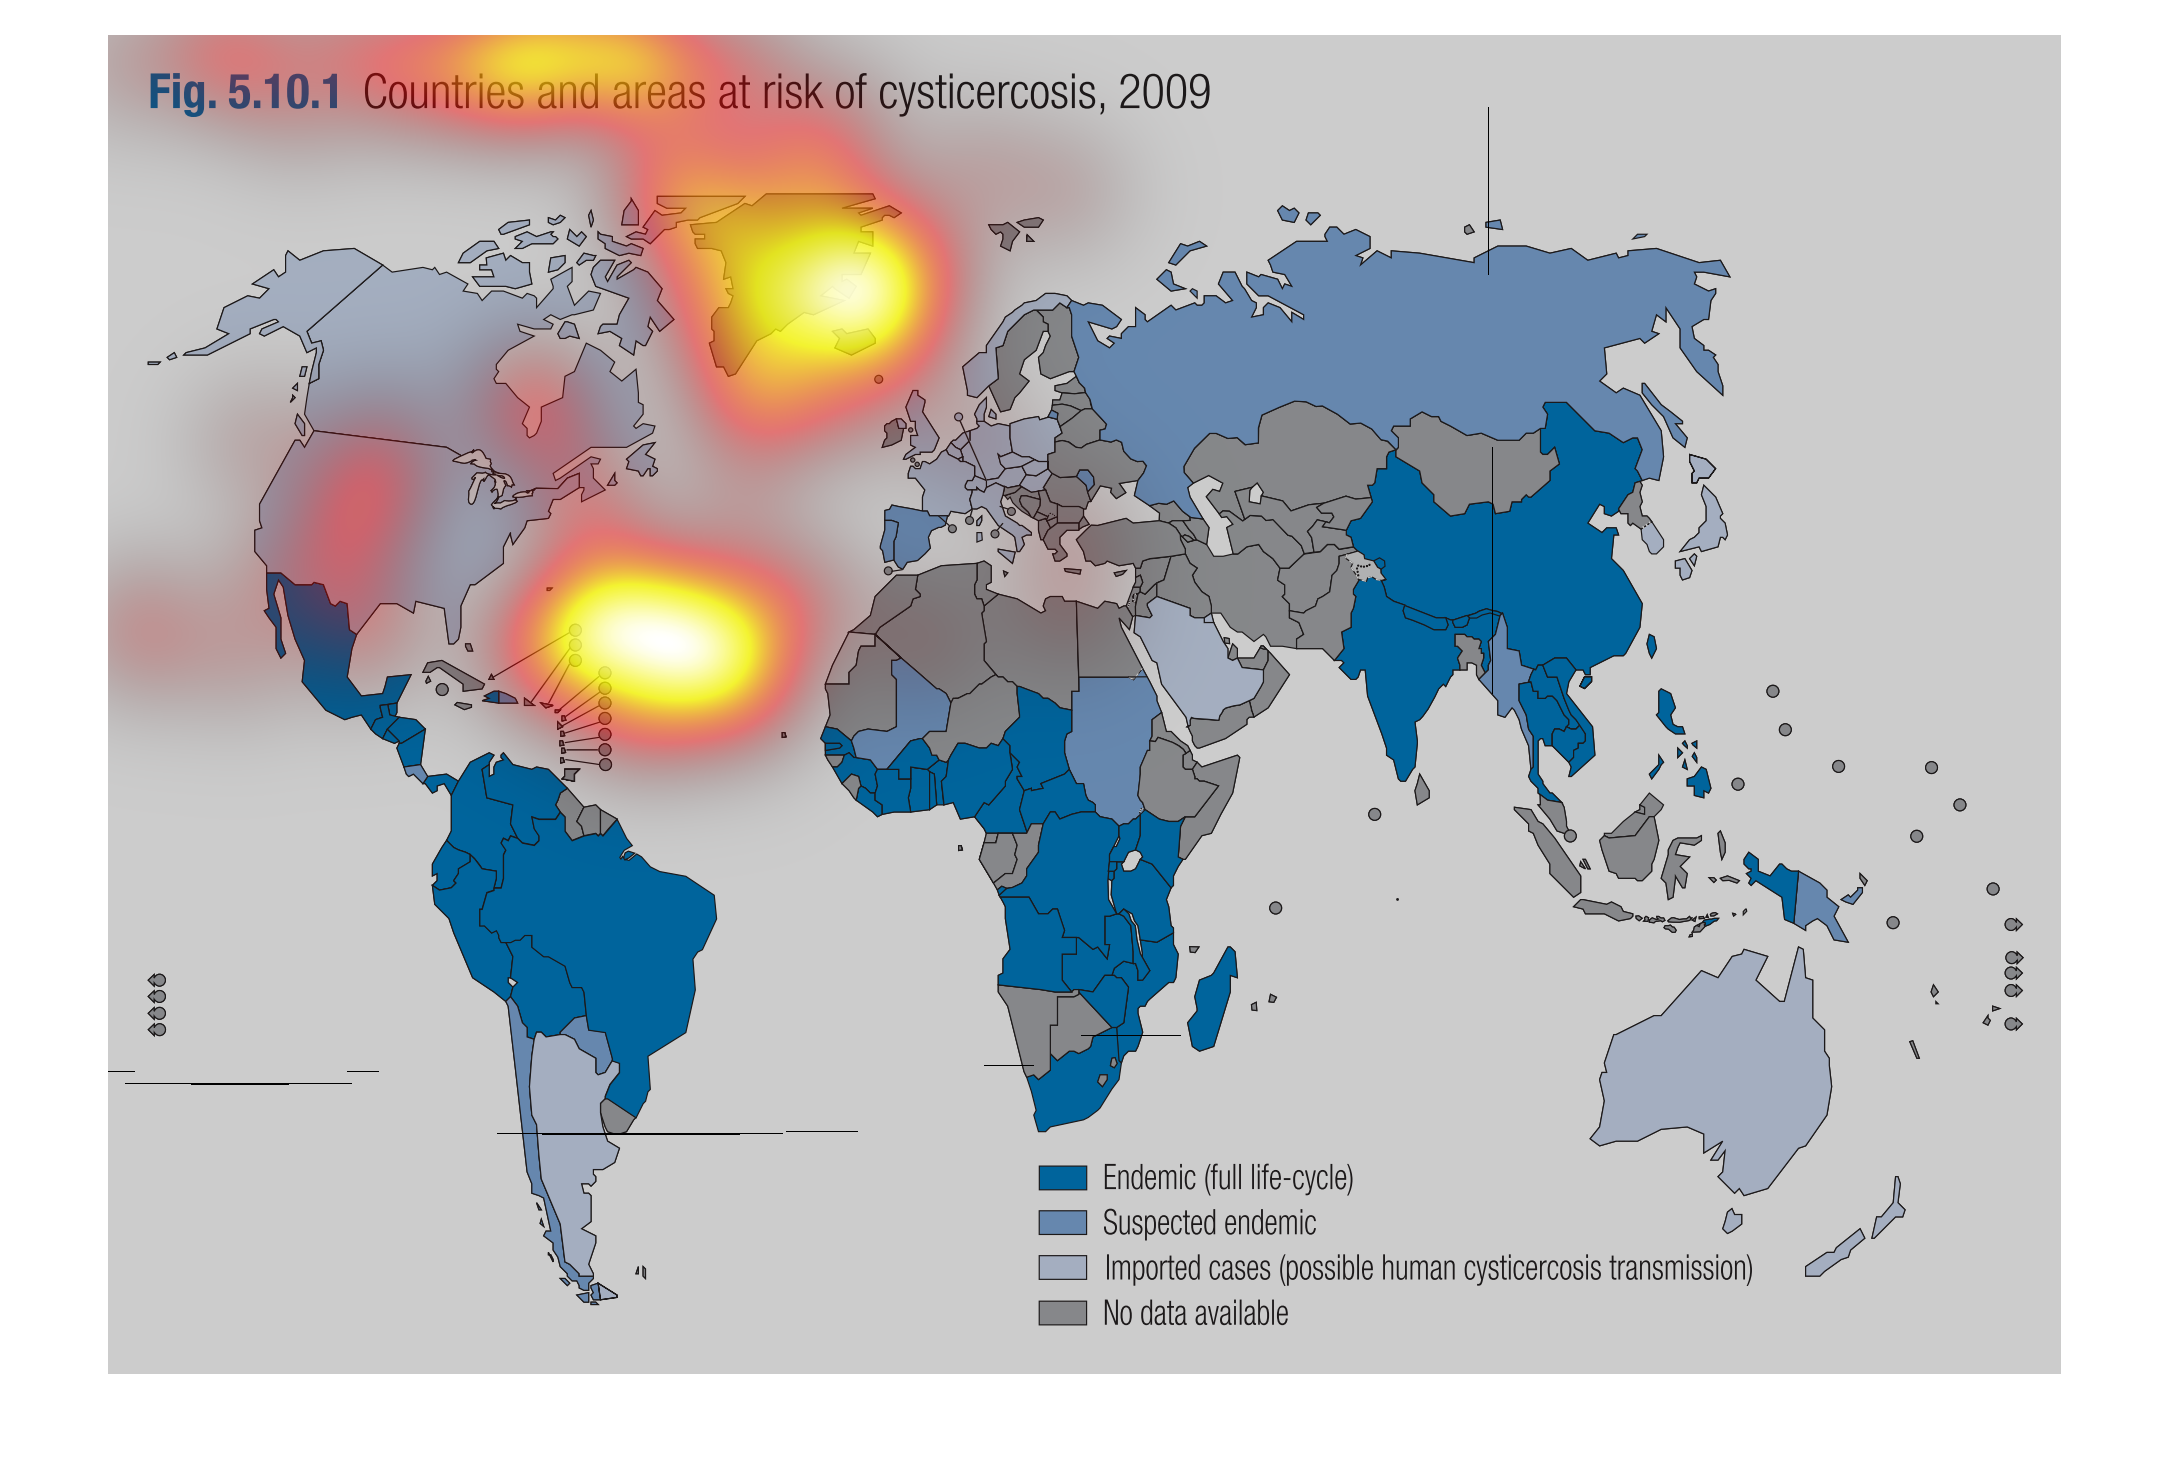
This map shows countries and areas of risk for cysticercosis as of 2009. Areas that are colored
dark blue show where cysticercosis is considered an endemic. These areas include Mexico, northern
South American, parts of Africa and parts of Asia. Areas colored light blue are areas in which
thereare imported cases. These areas include the US and Canada, Australia, and parts of Europe,
Africa, and Asia. There are a few areas of the world in which there is a suspected endemic,
and many in which there is no data available.

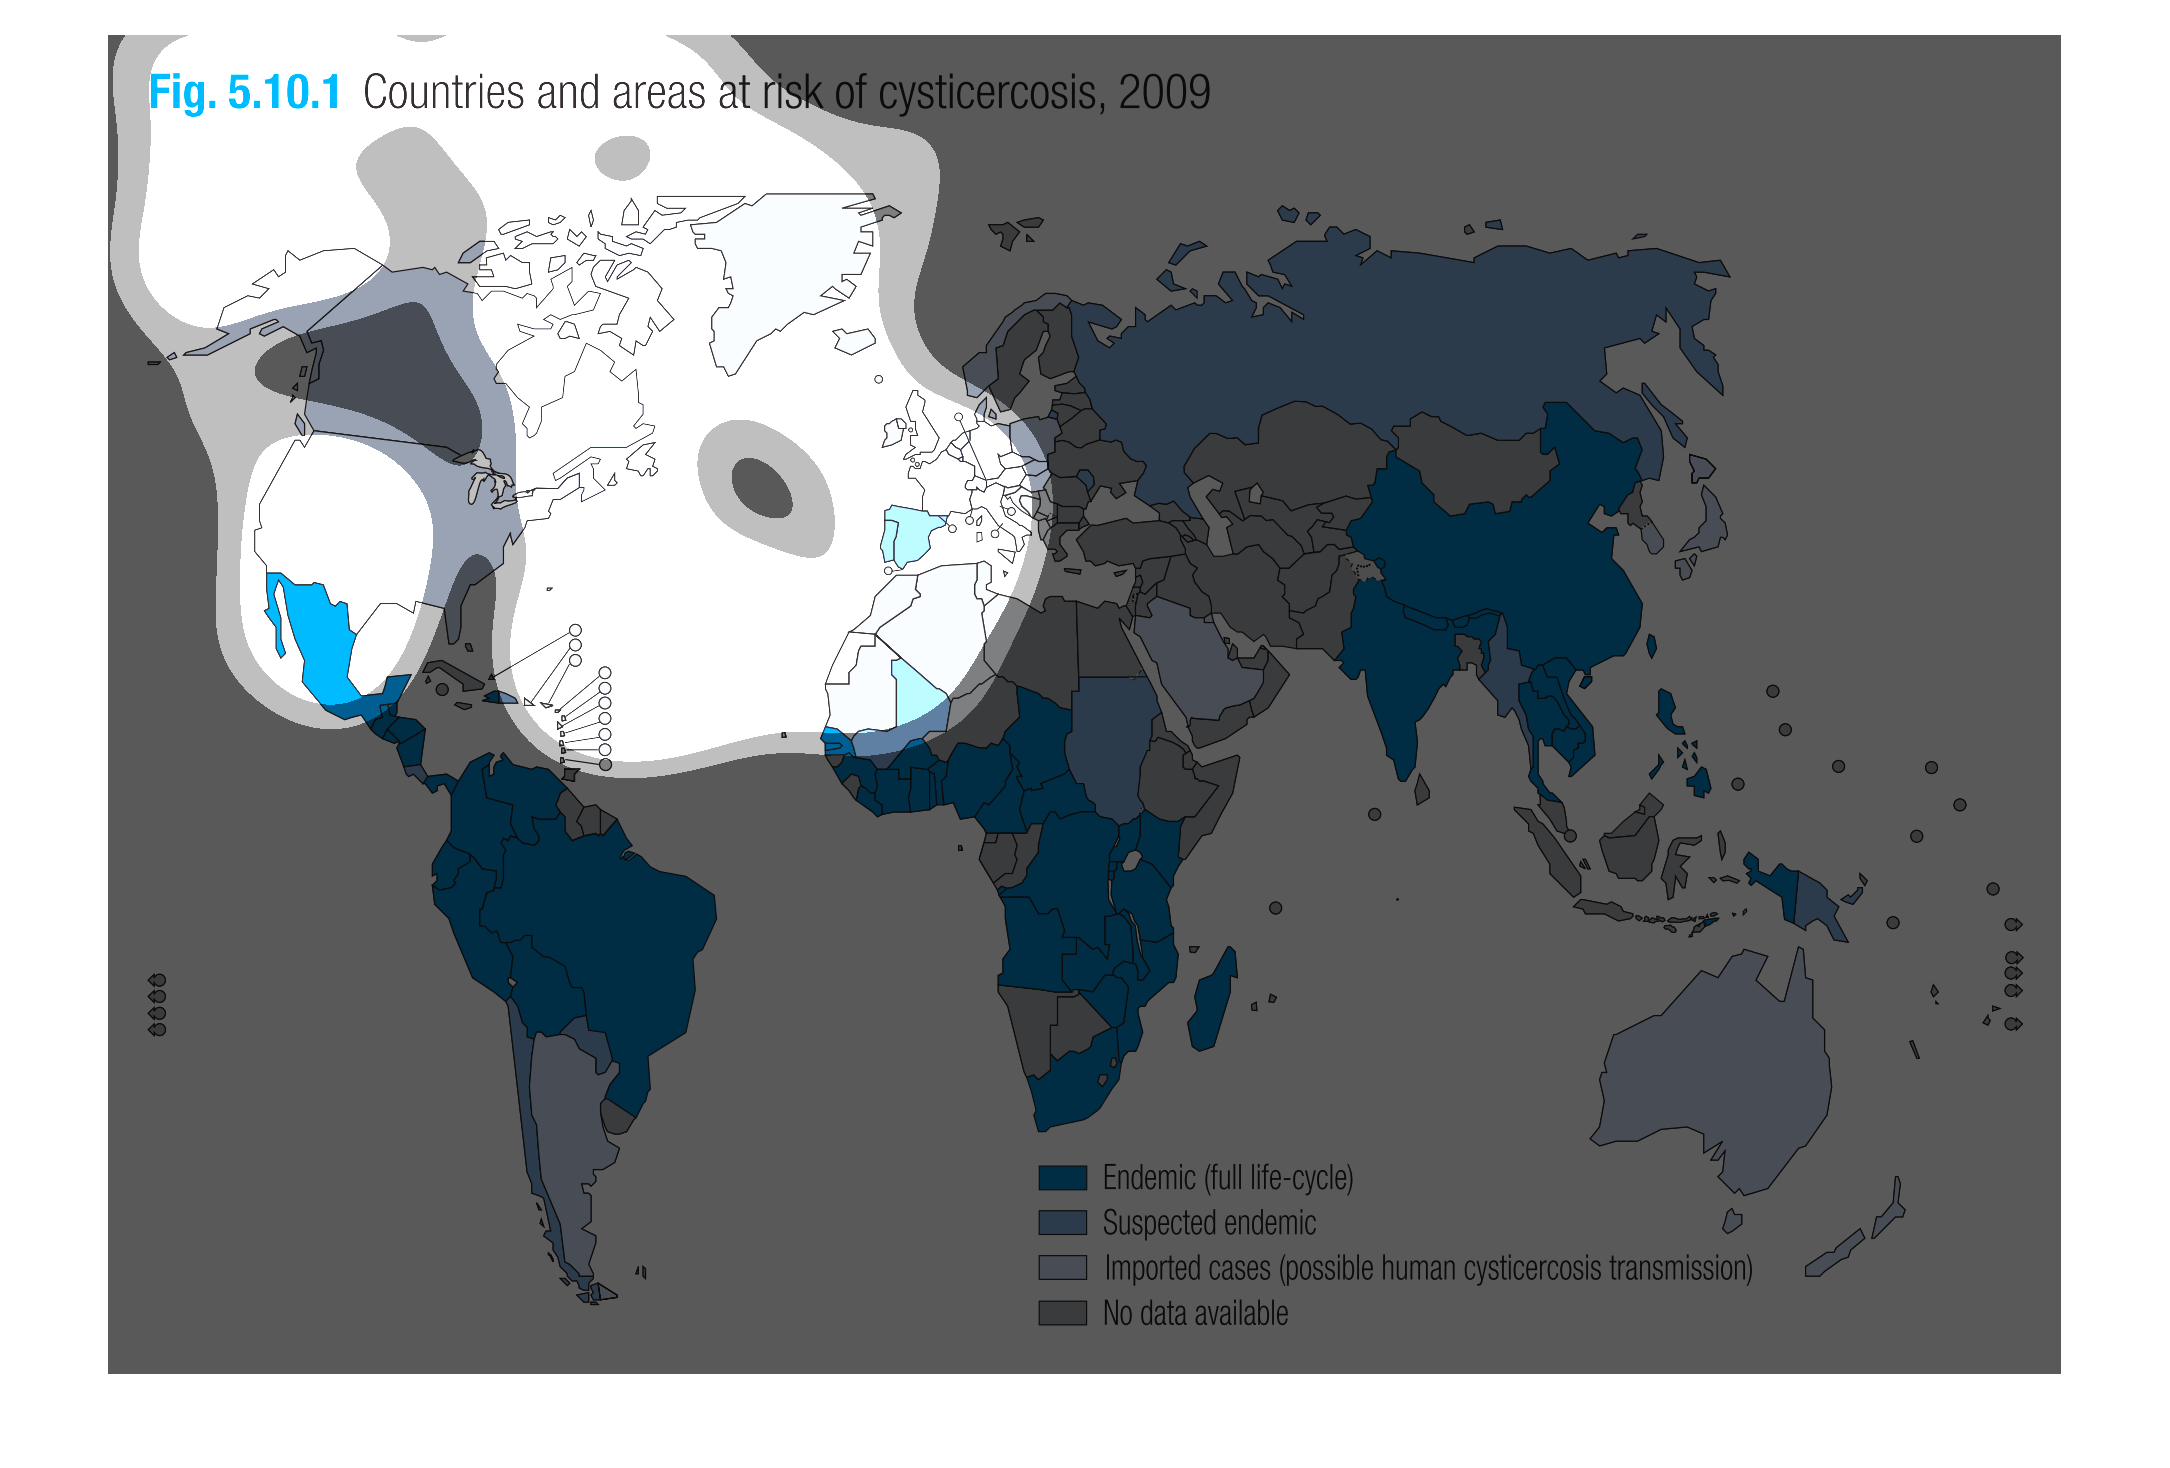
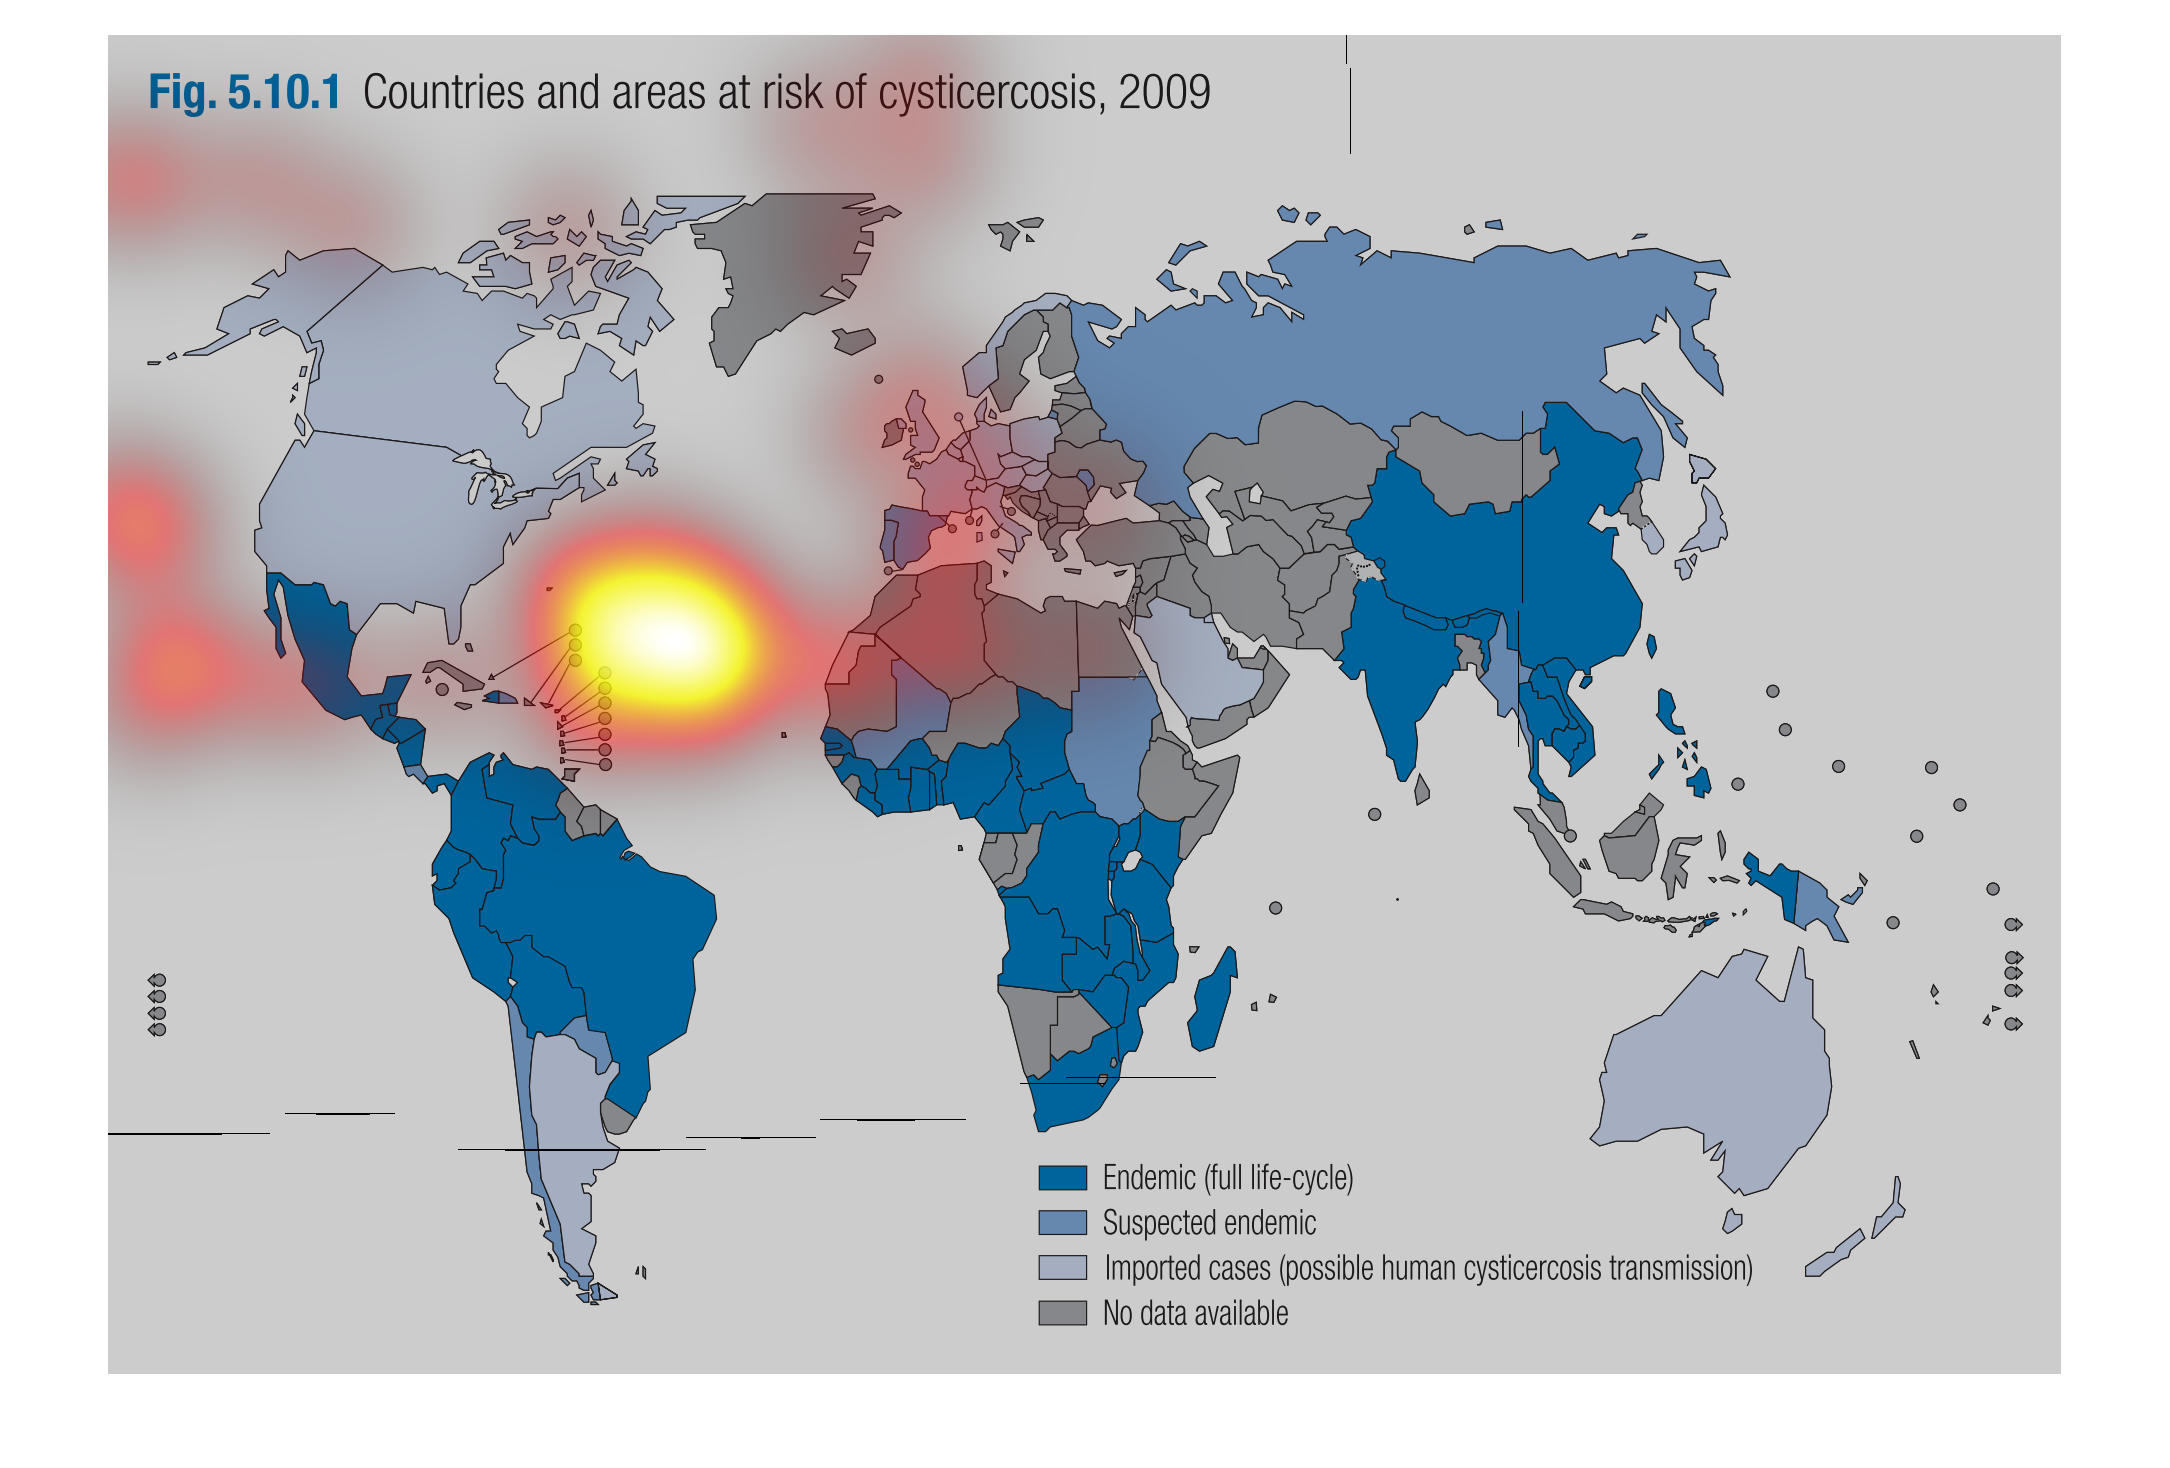
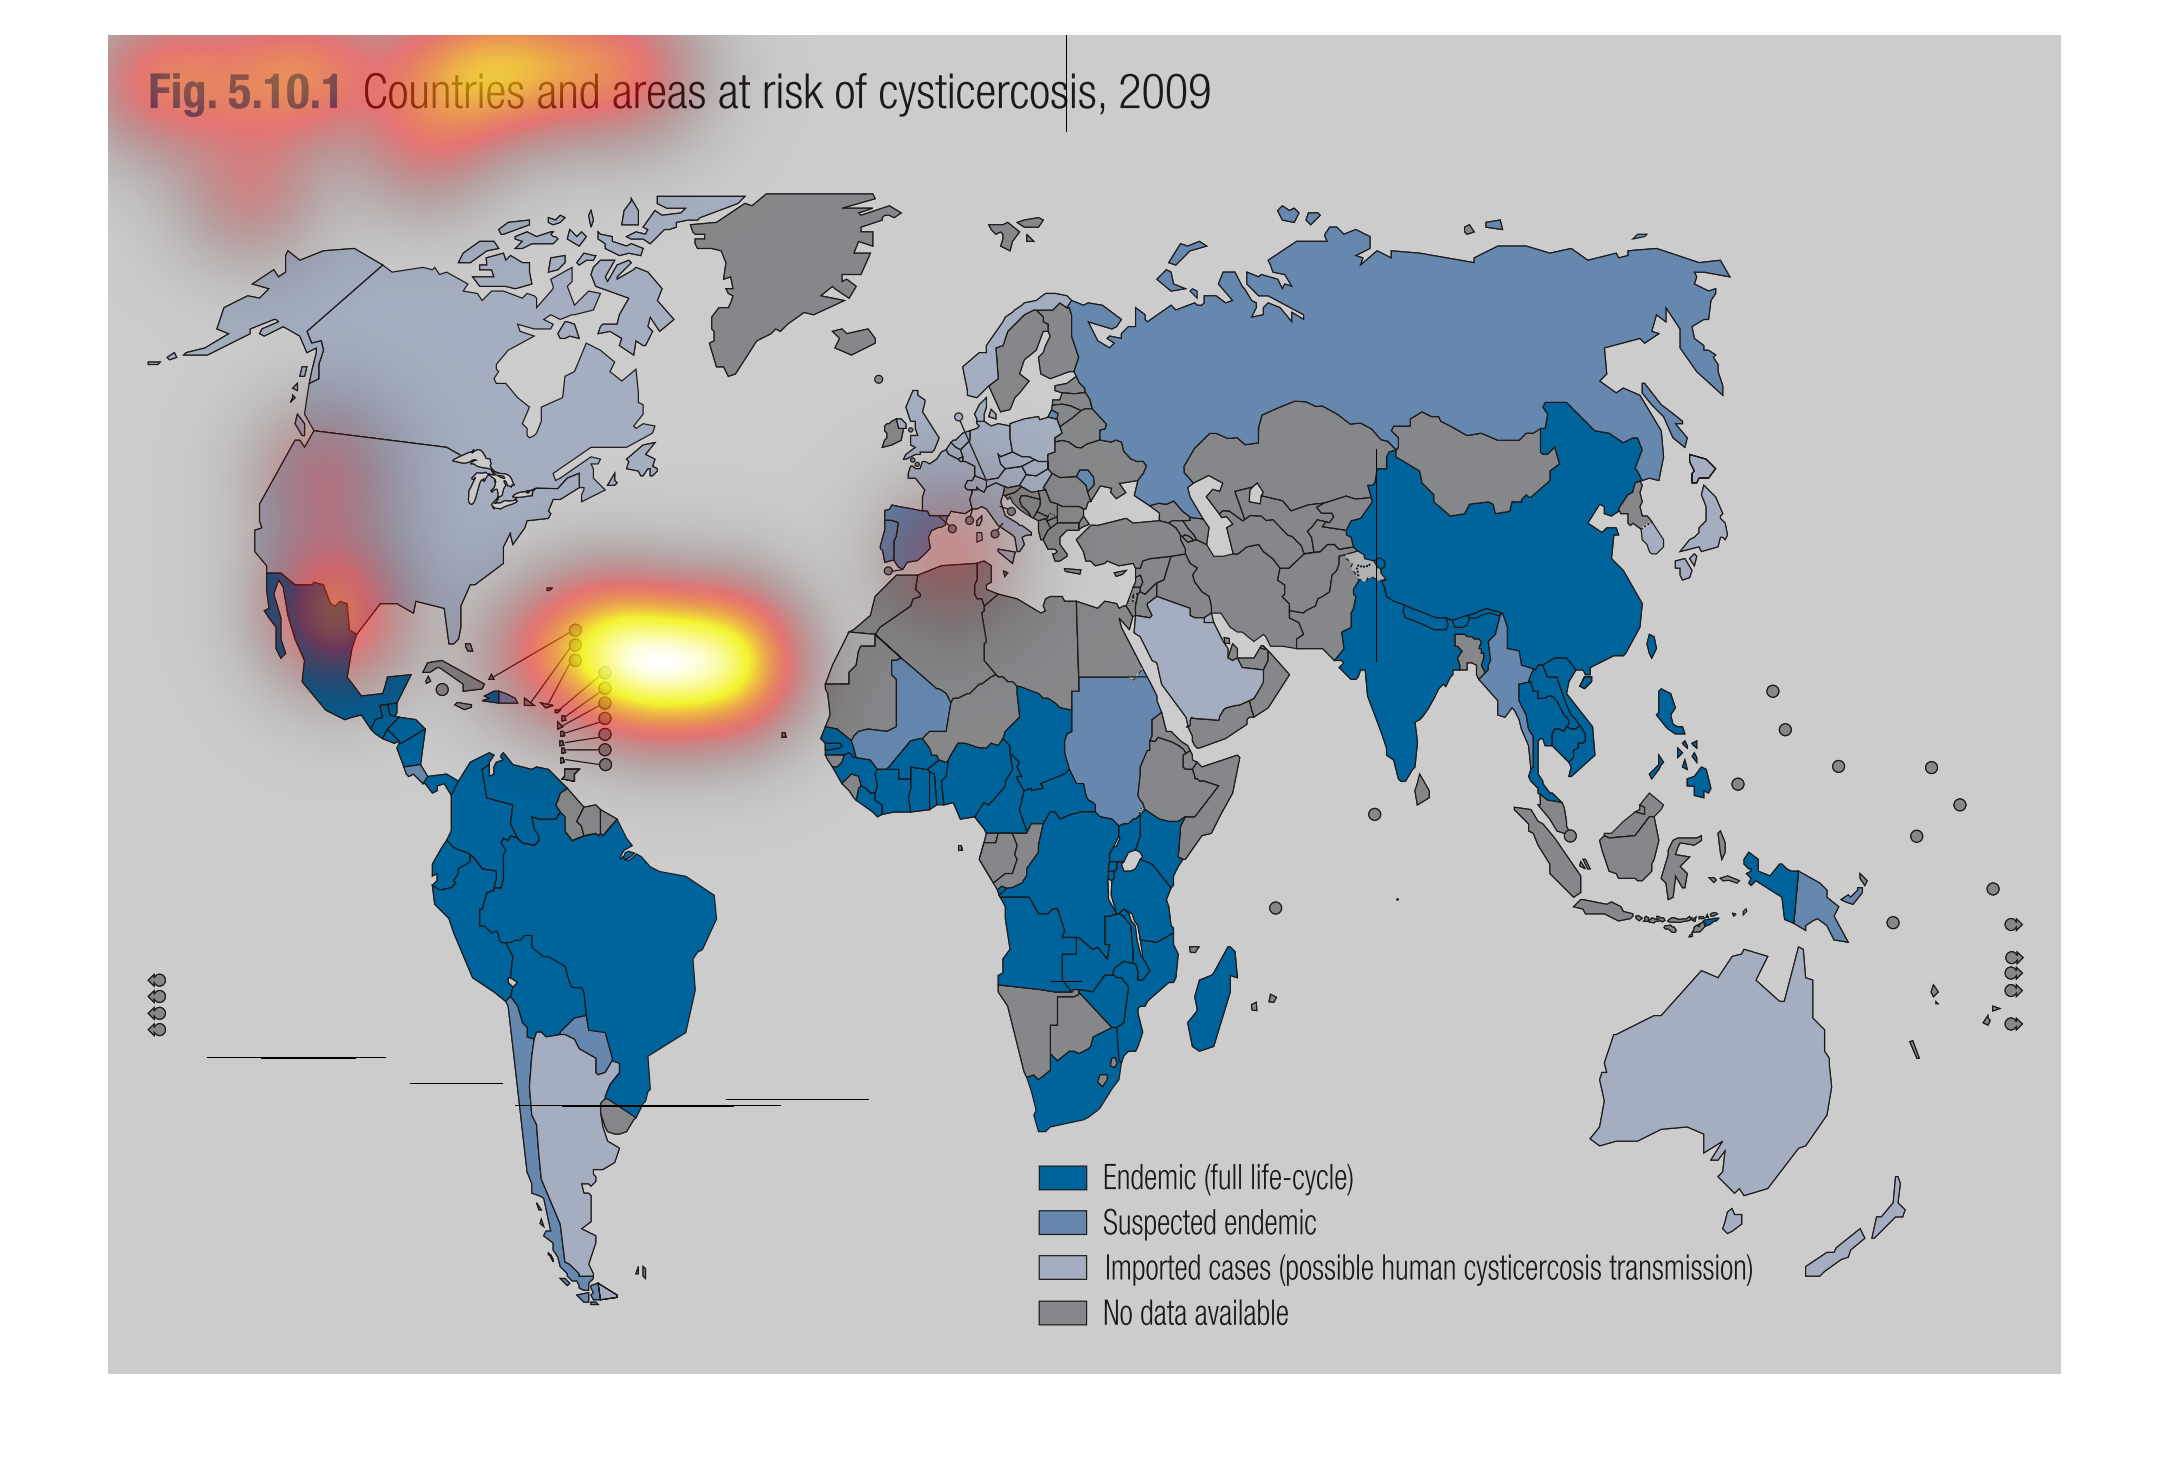
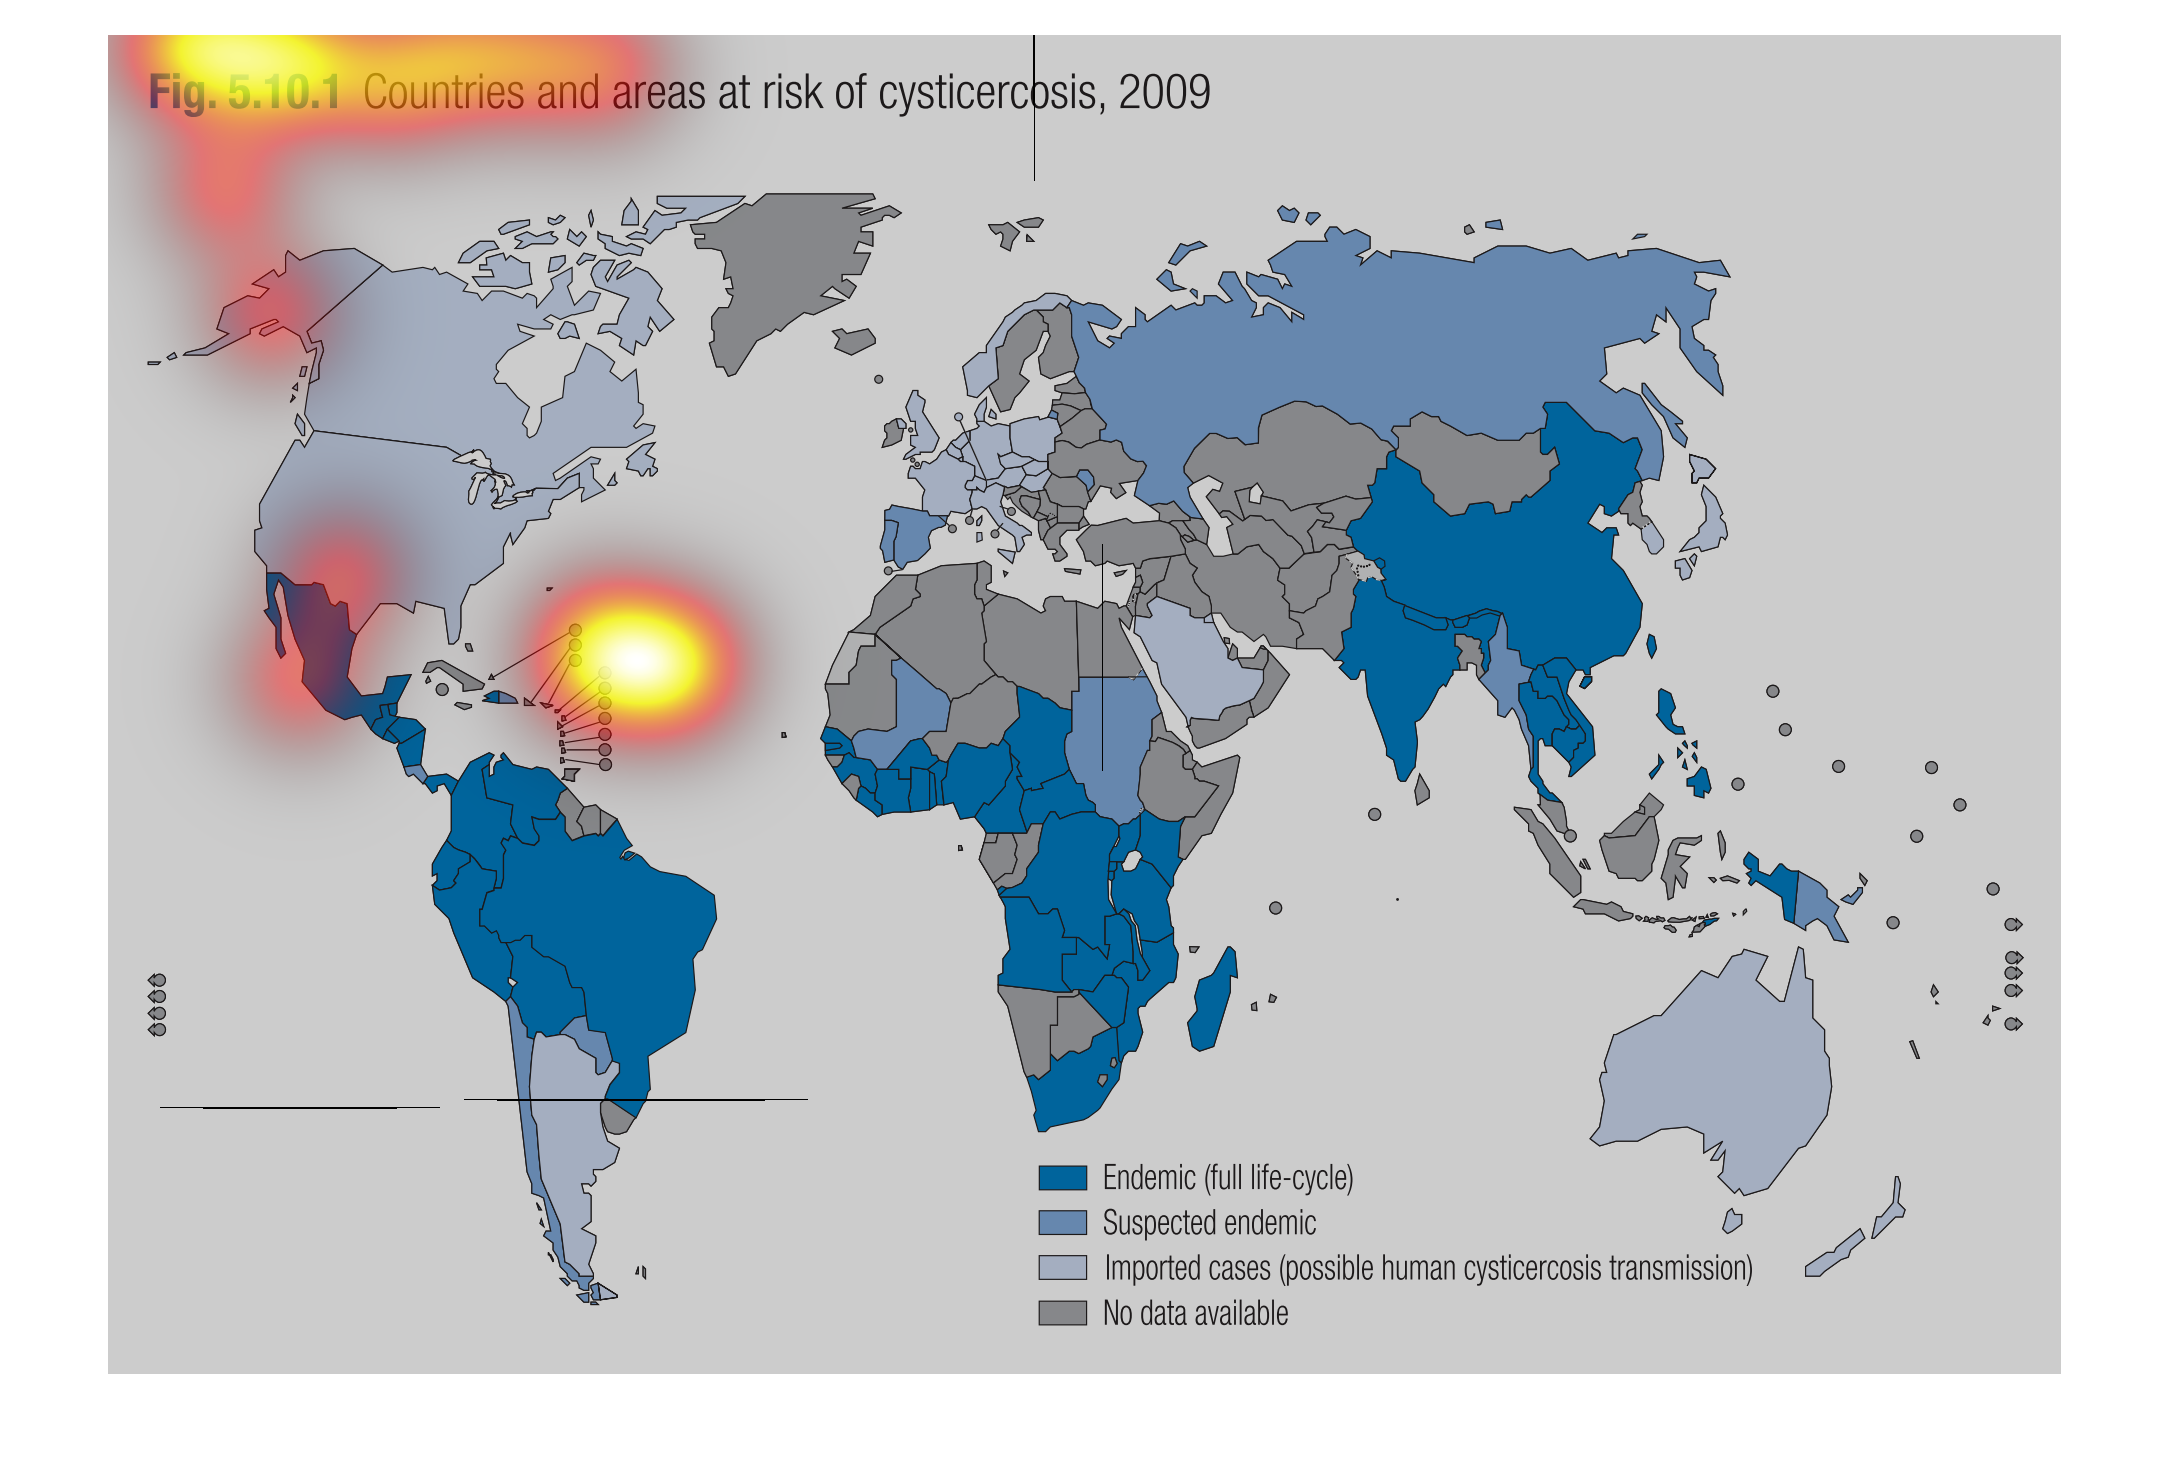
This is a 2009 graph that describes the countries and areas at risk of cysticercosis. Parts
of Mexico, South America, Africa, and East Asia have the biggest risk of the endemic.
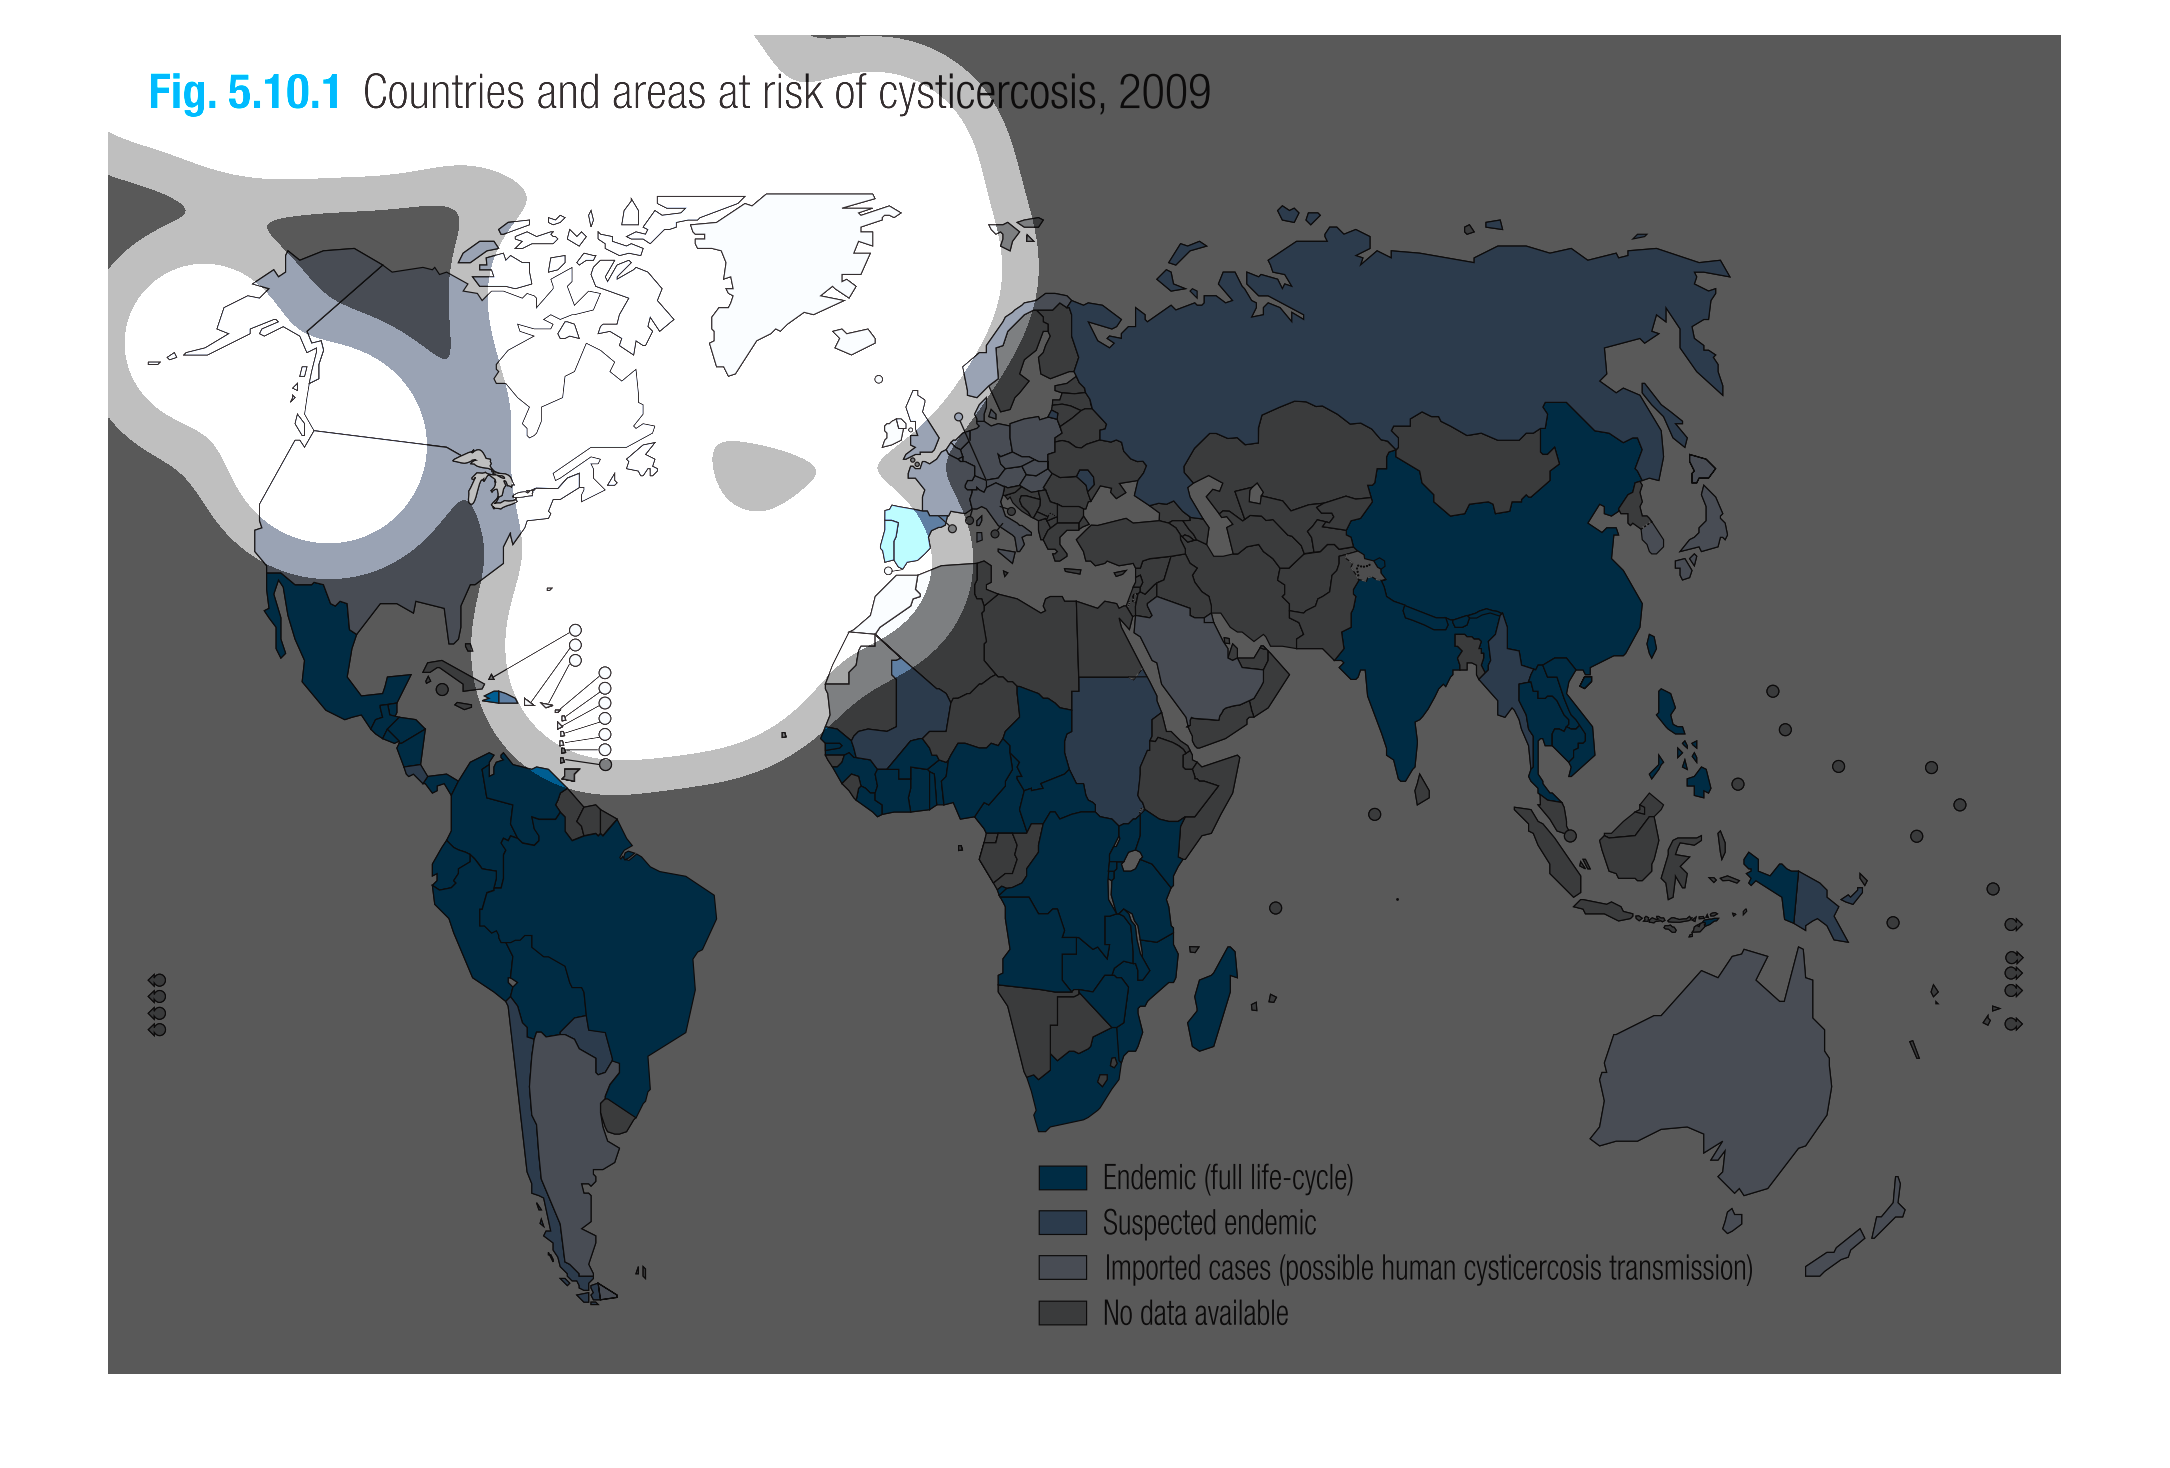
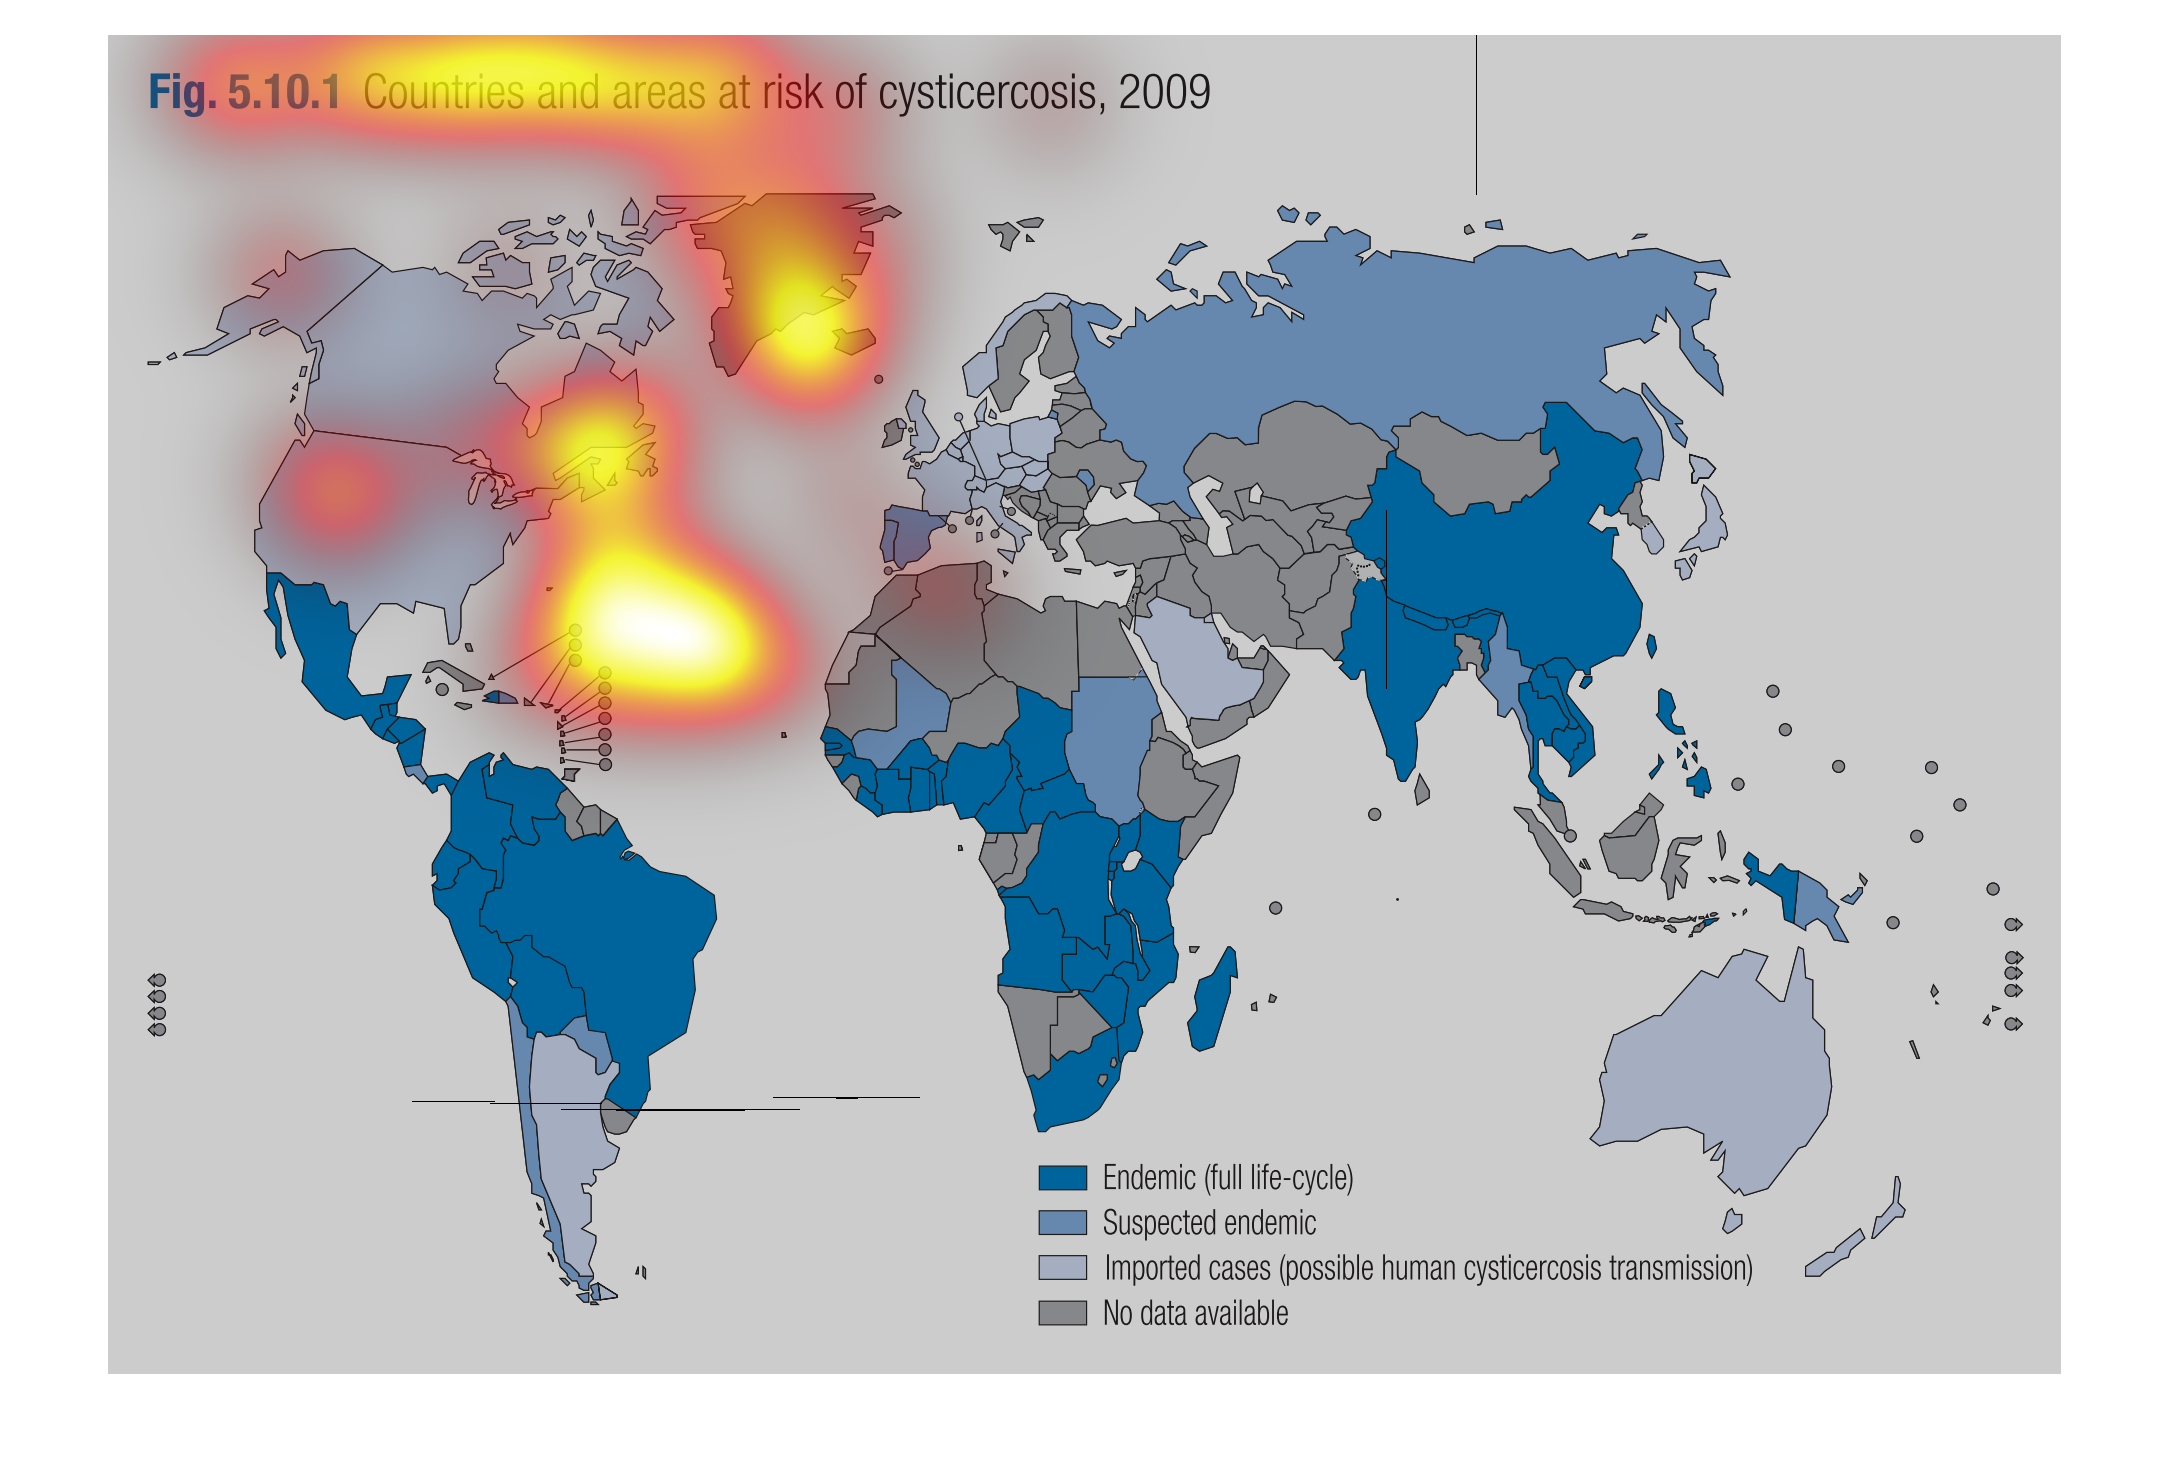
Countries and their risk of cystercosis, 2009.  The map shows a endemic risk of cystercosis
in Central and South America, as well as most of Africa and Asia.  Areas which are considered
first-wold have a lower risk of the disease.  There also seems to be a lower risk in the very
north and very south of the world.
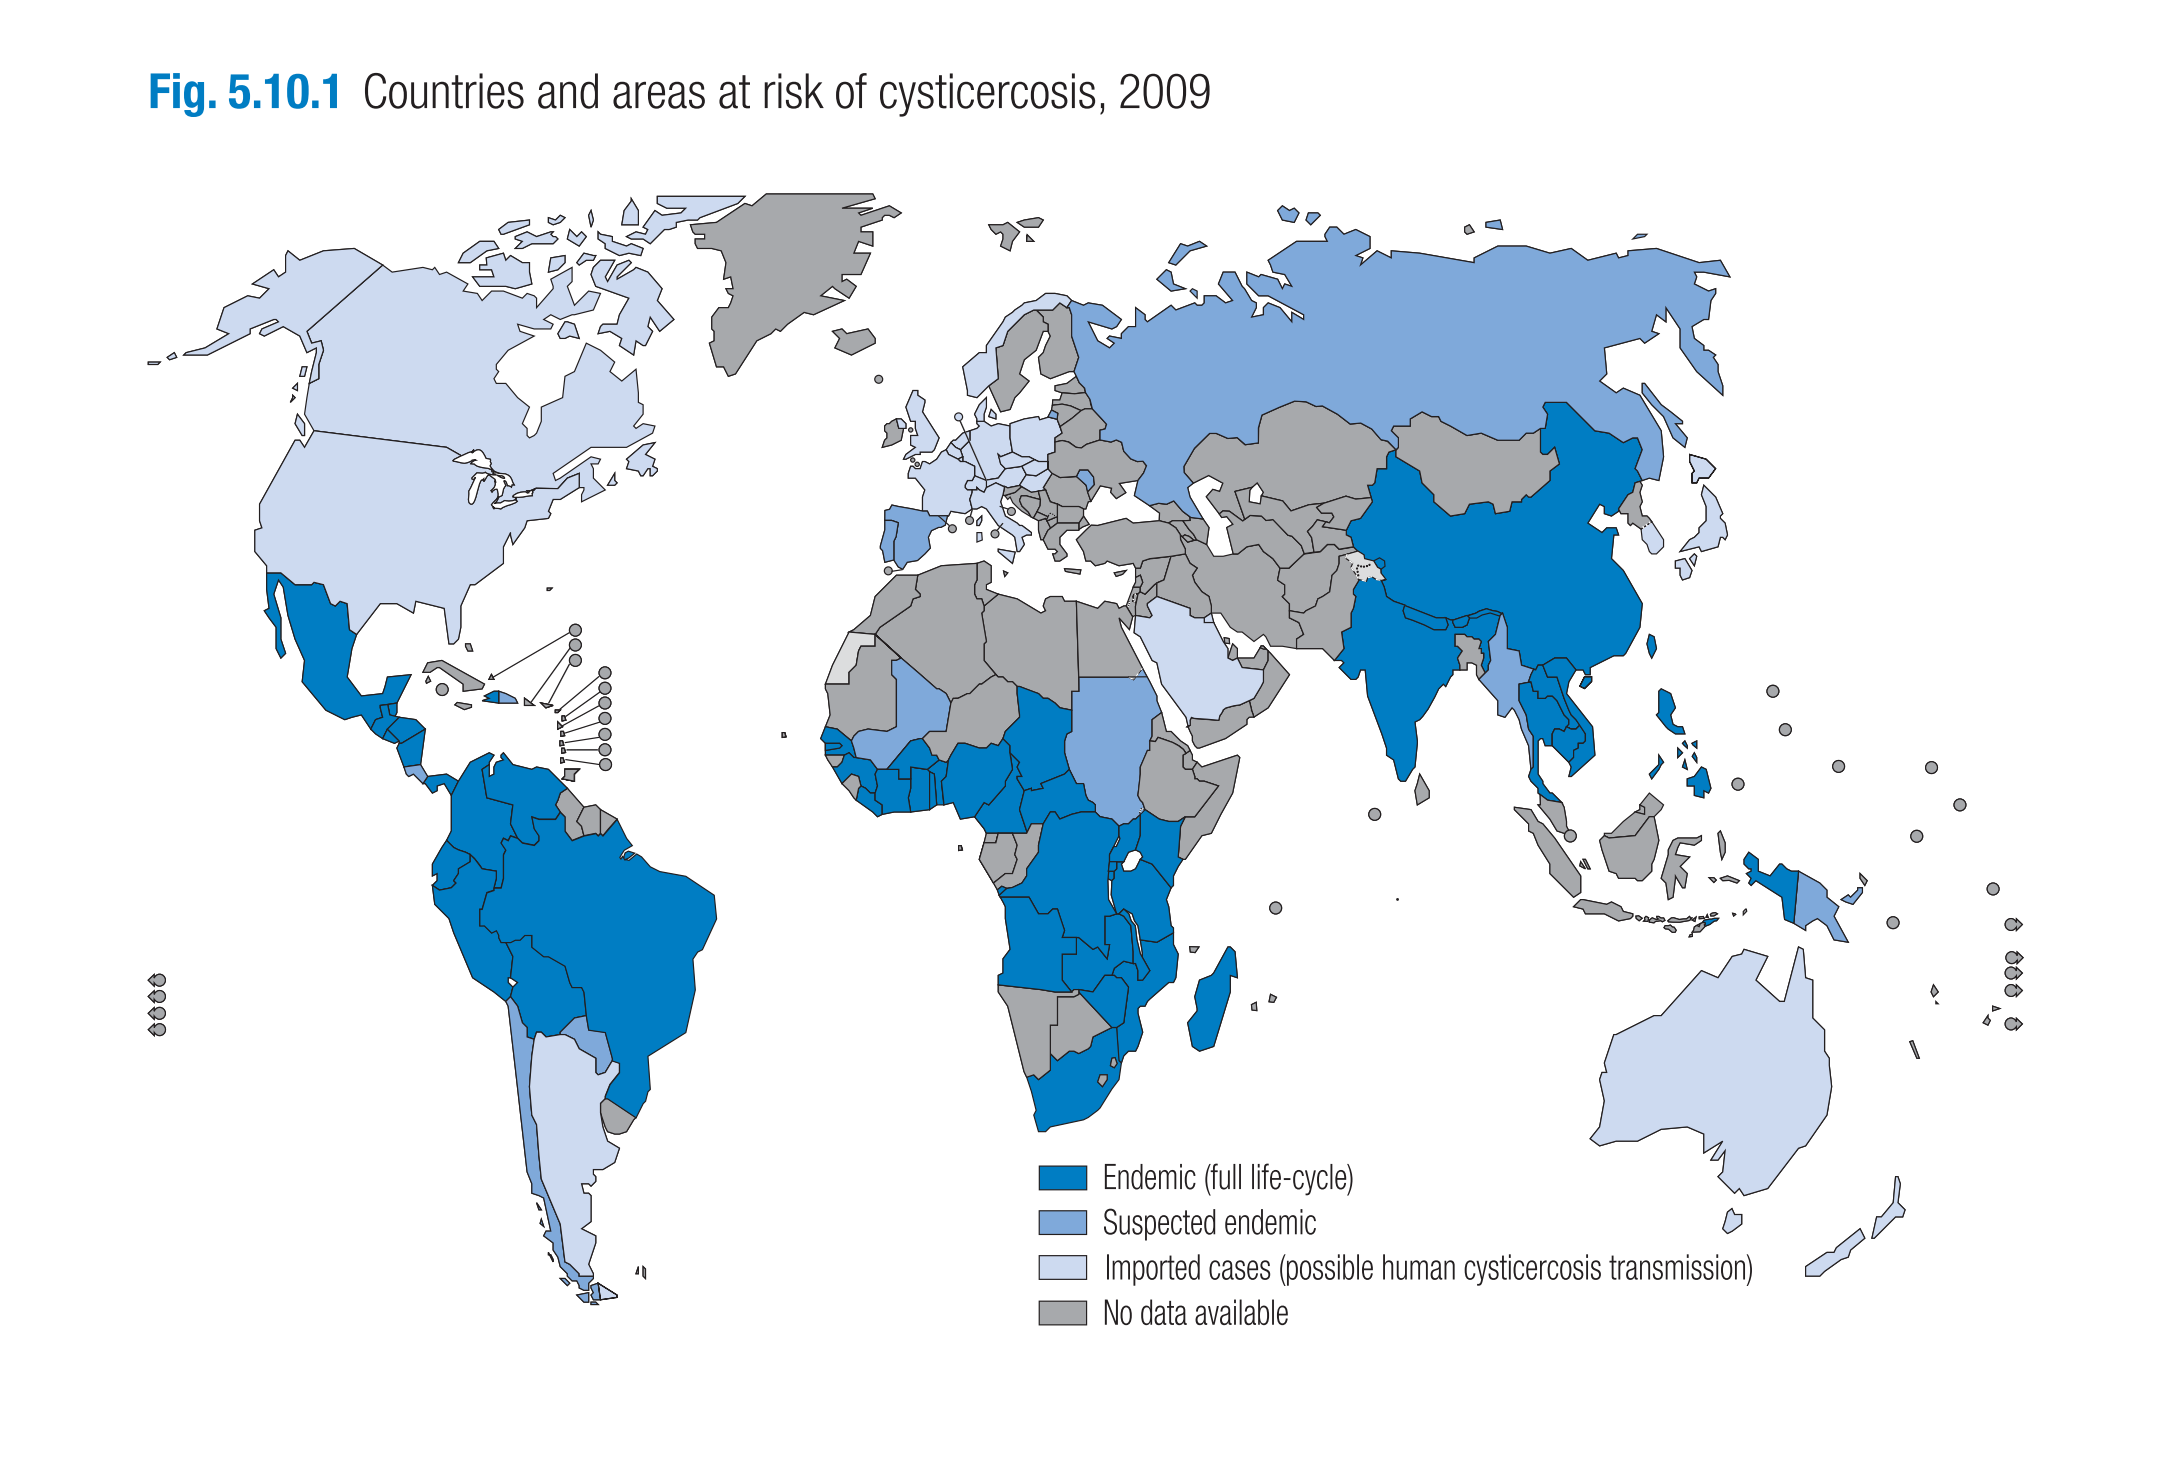
This graph explains the countries that are more at risk of cysticercosis. Darker blue regions
mean that there is a more of a chance that it exists. Loosely, third world countries are more
at risk.
This chart describes countries and areas at risk of cysticercosis for the year 2009. Different
categories on the chart are represented by different colors.
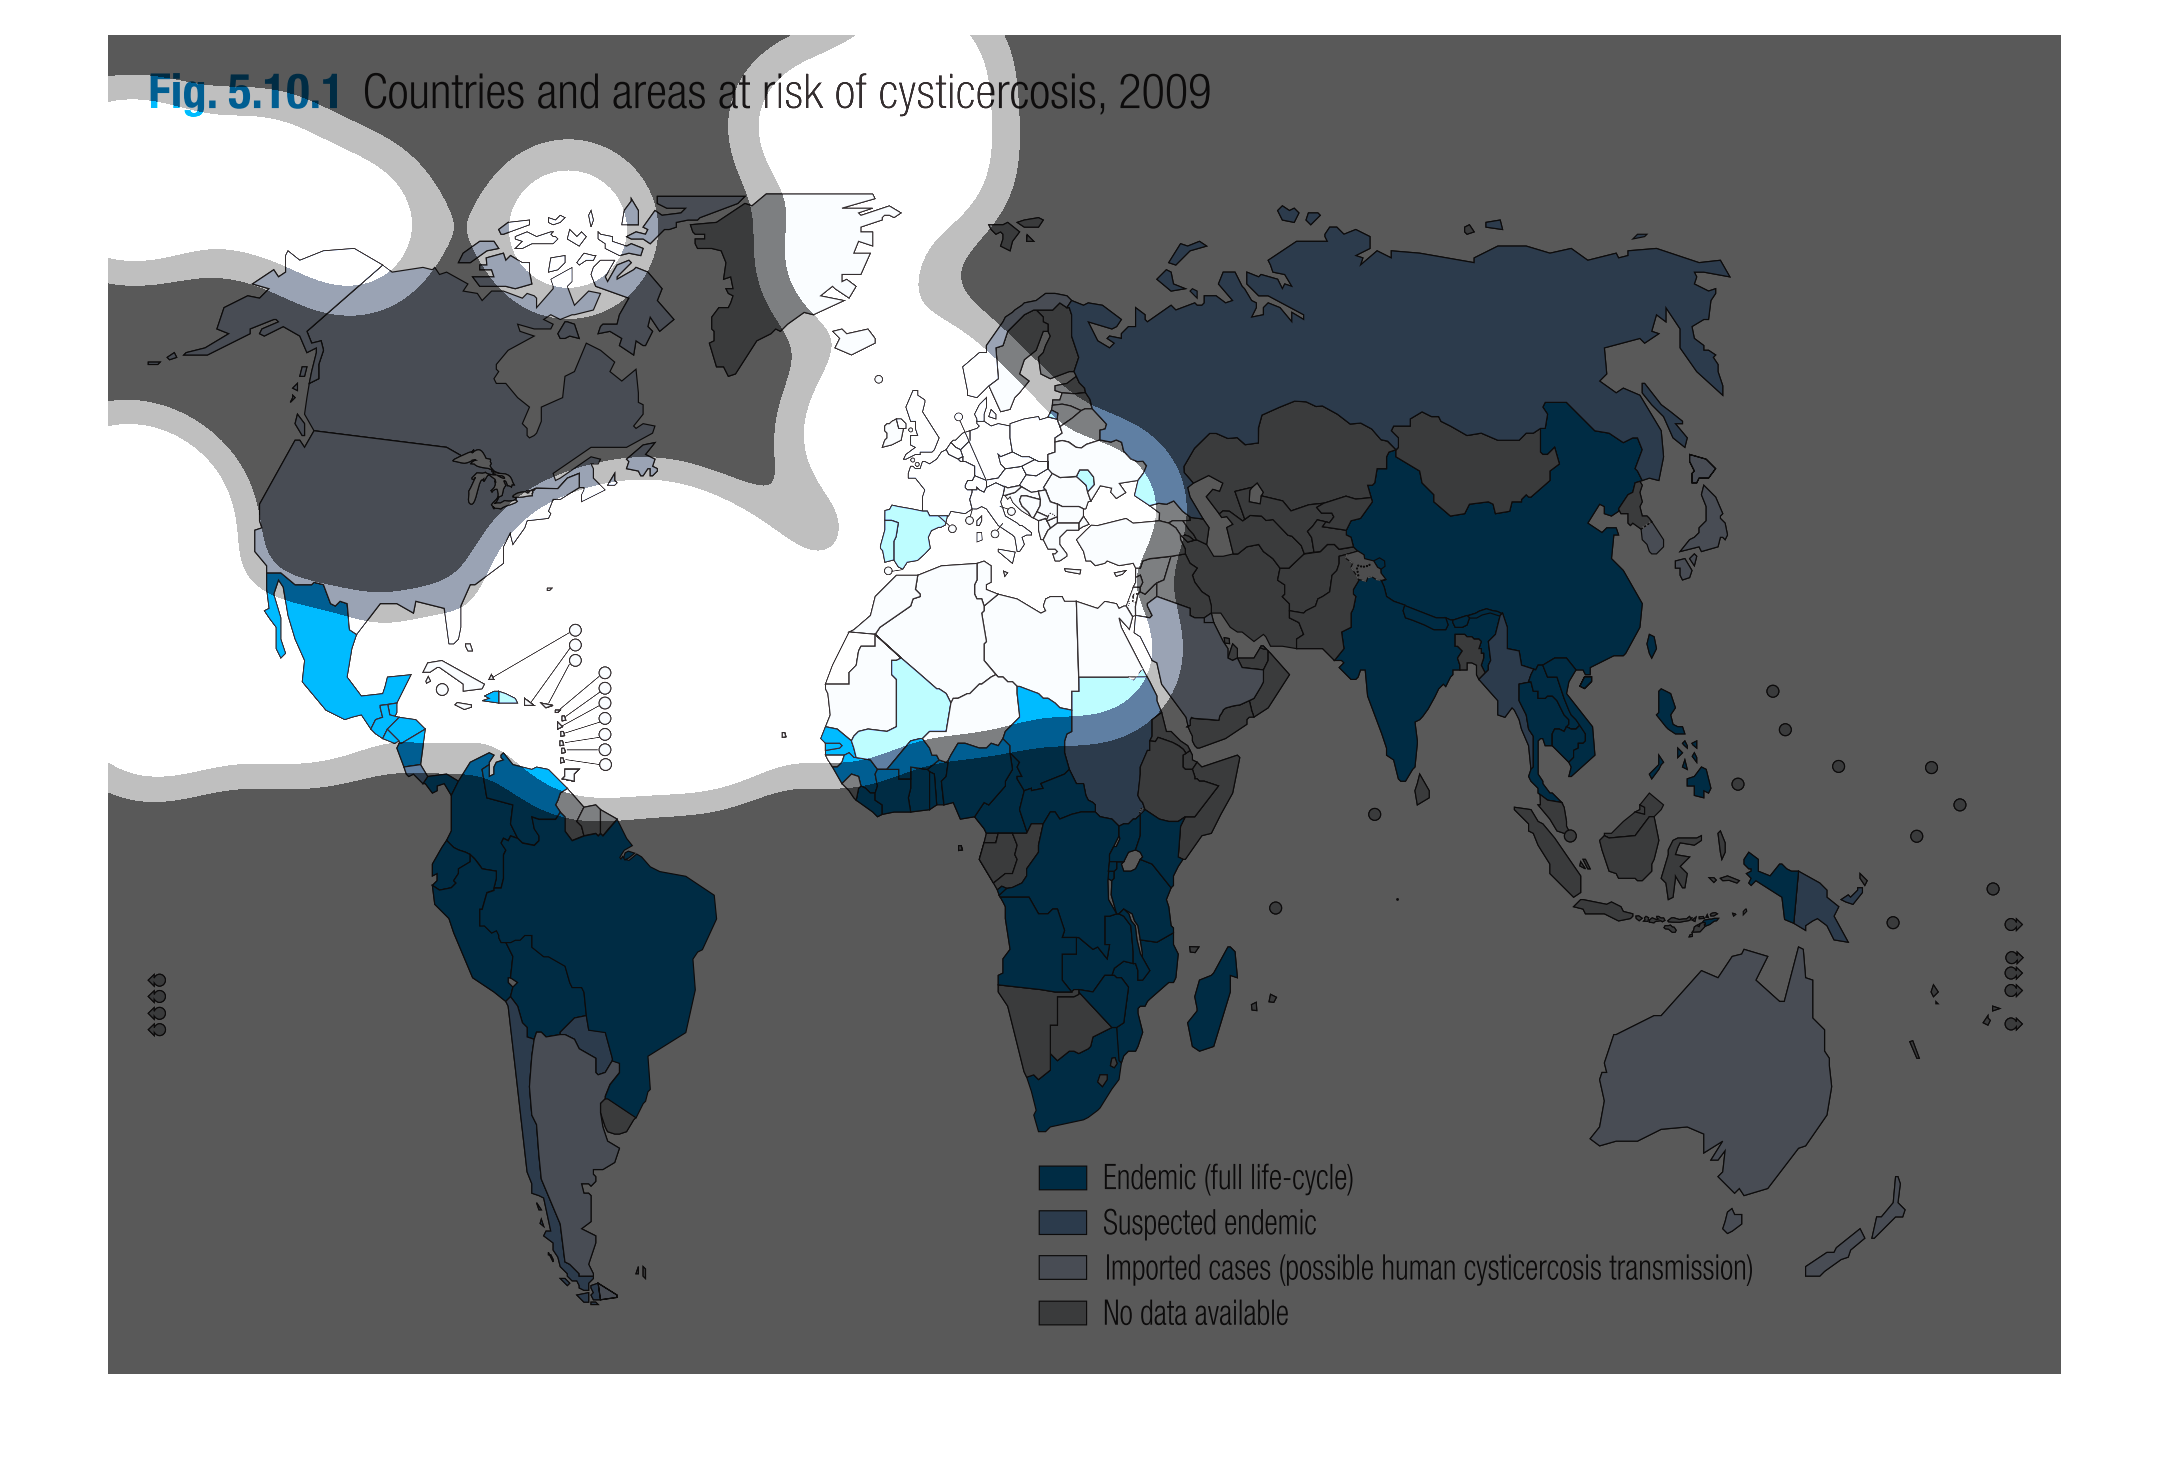
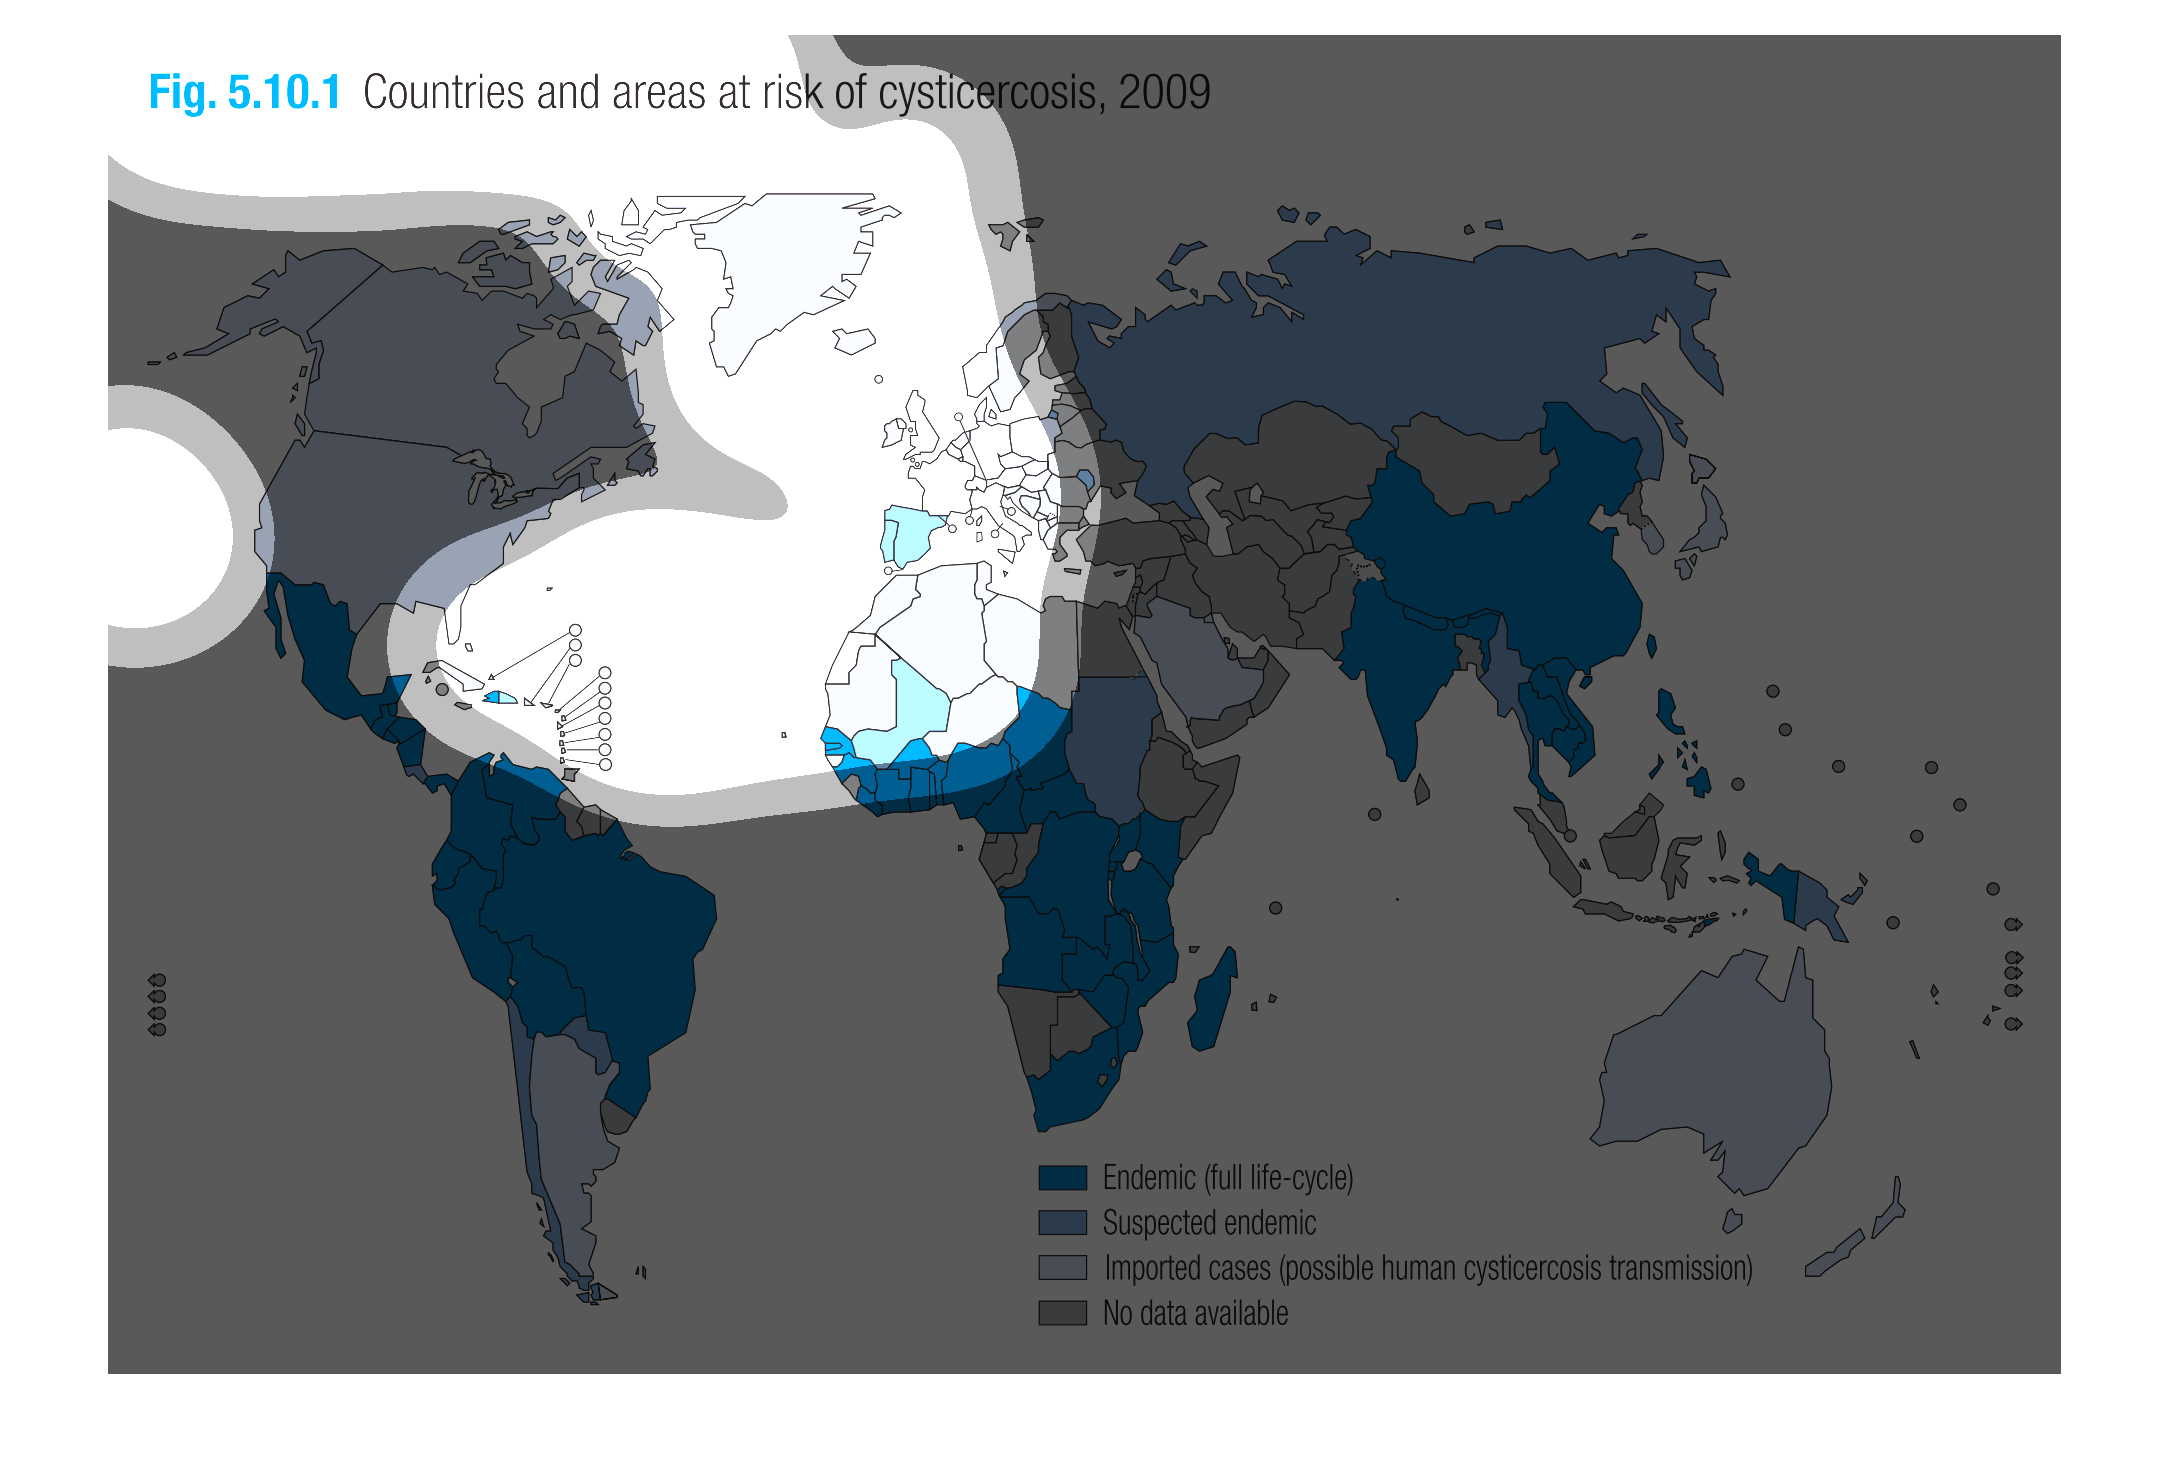
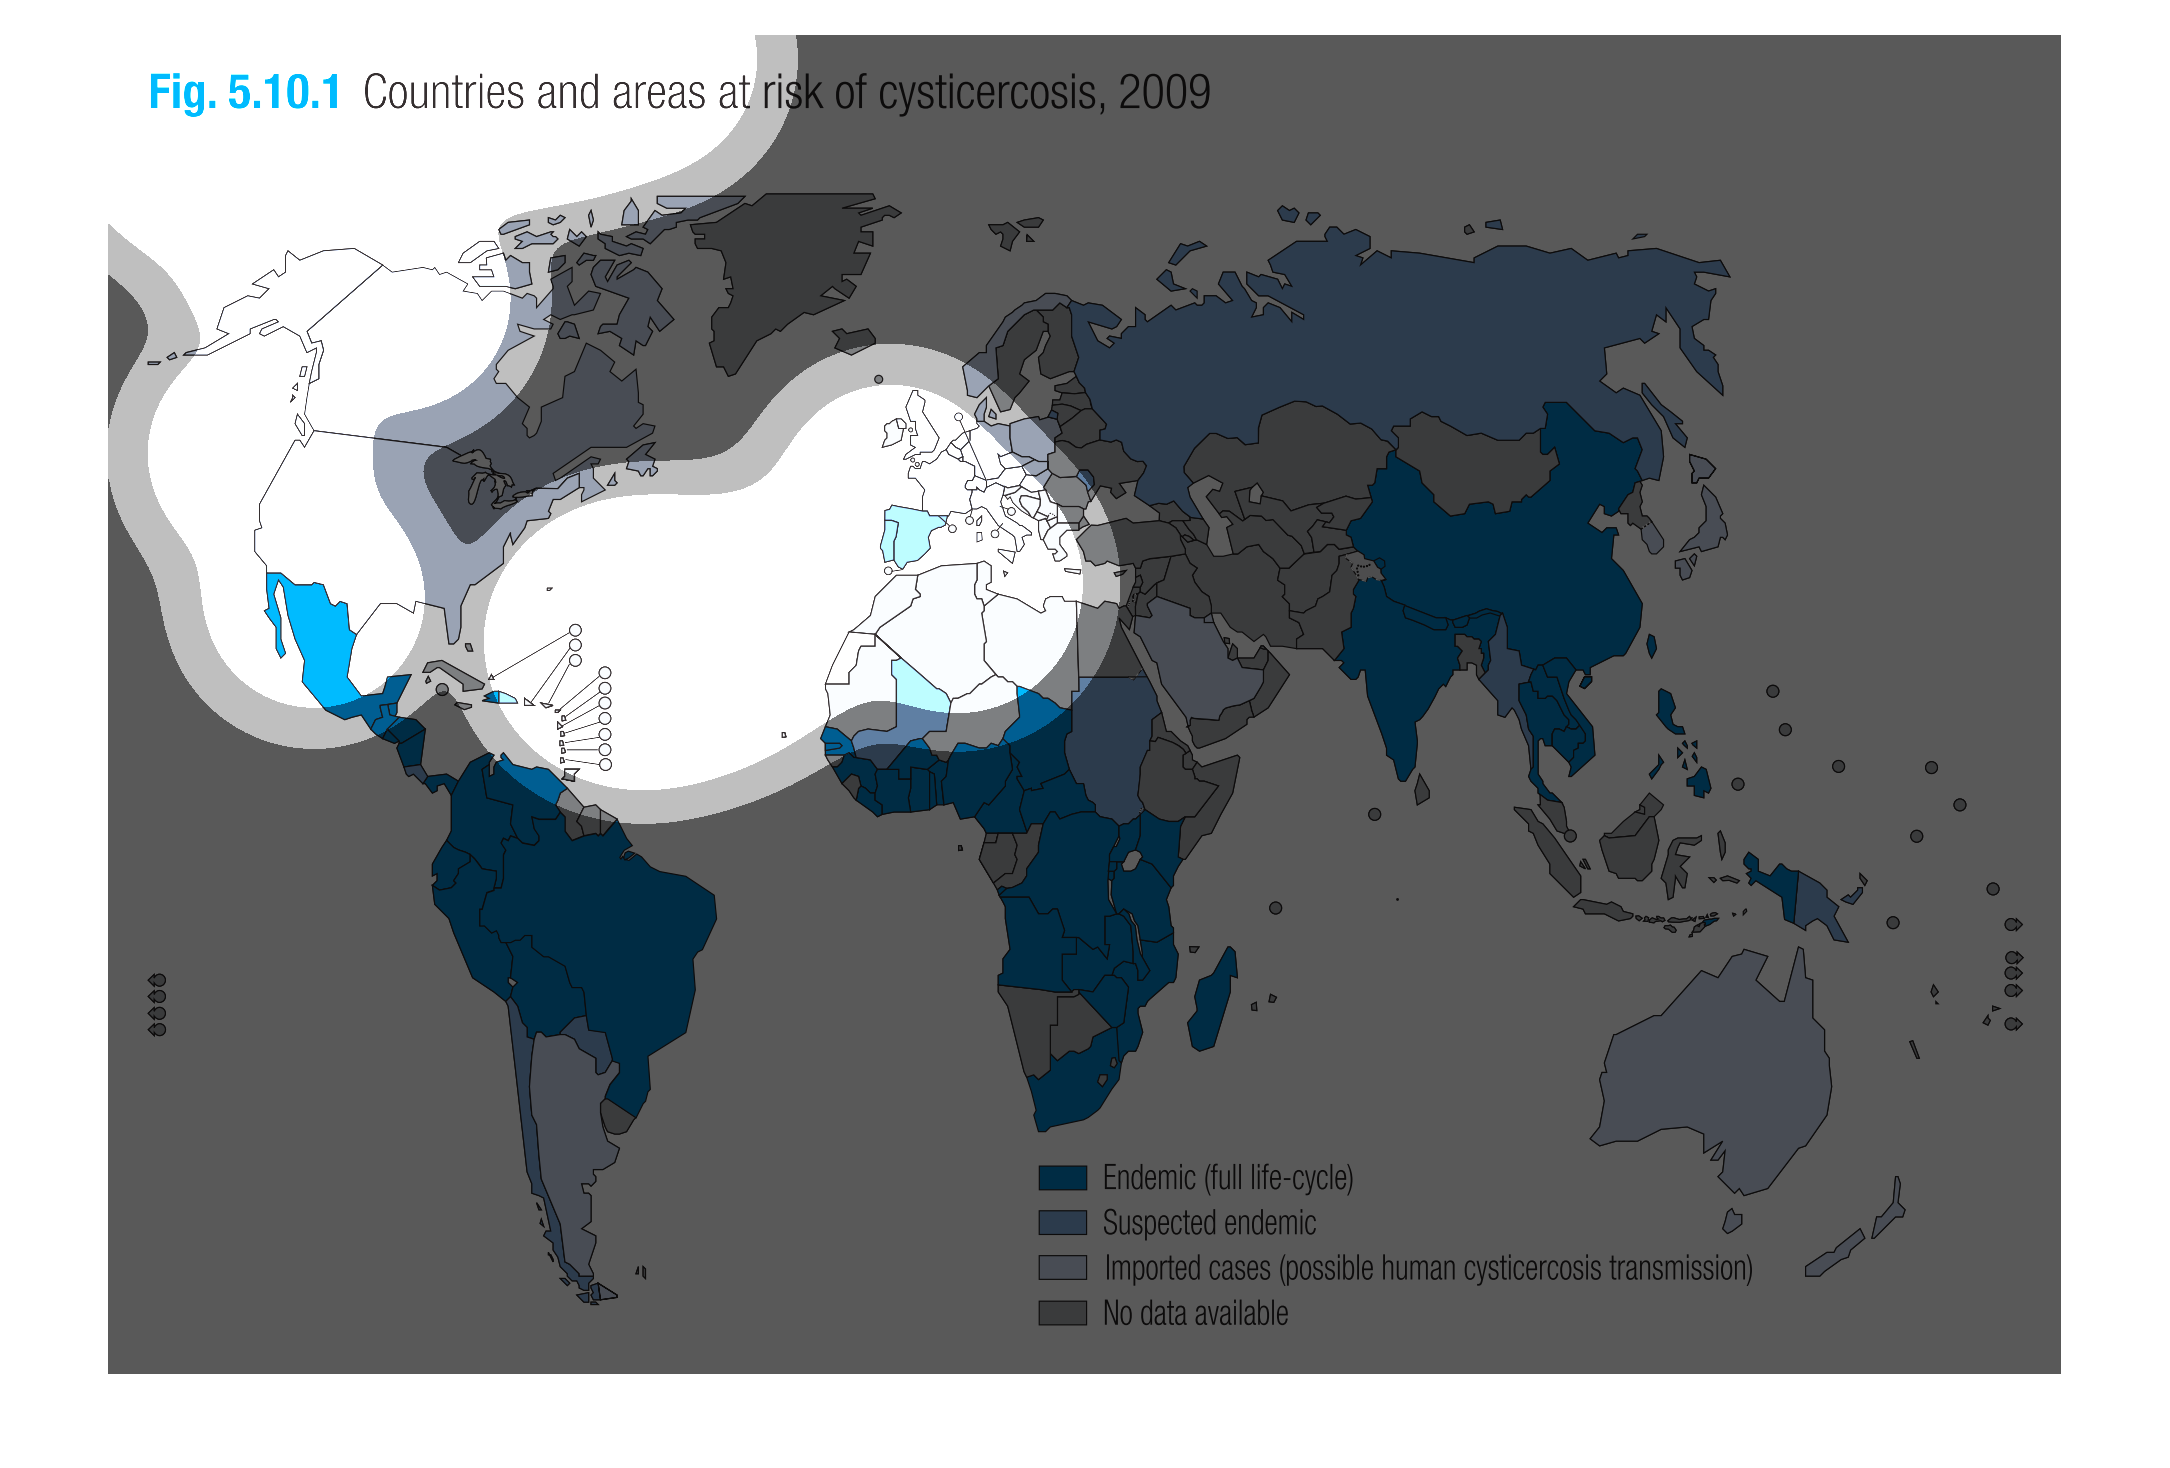
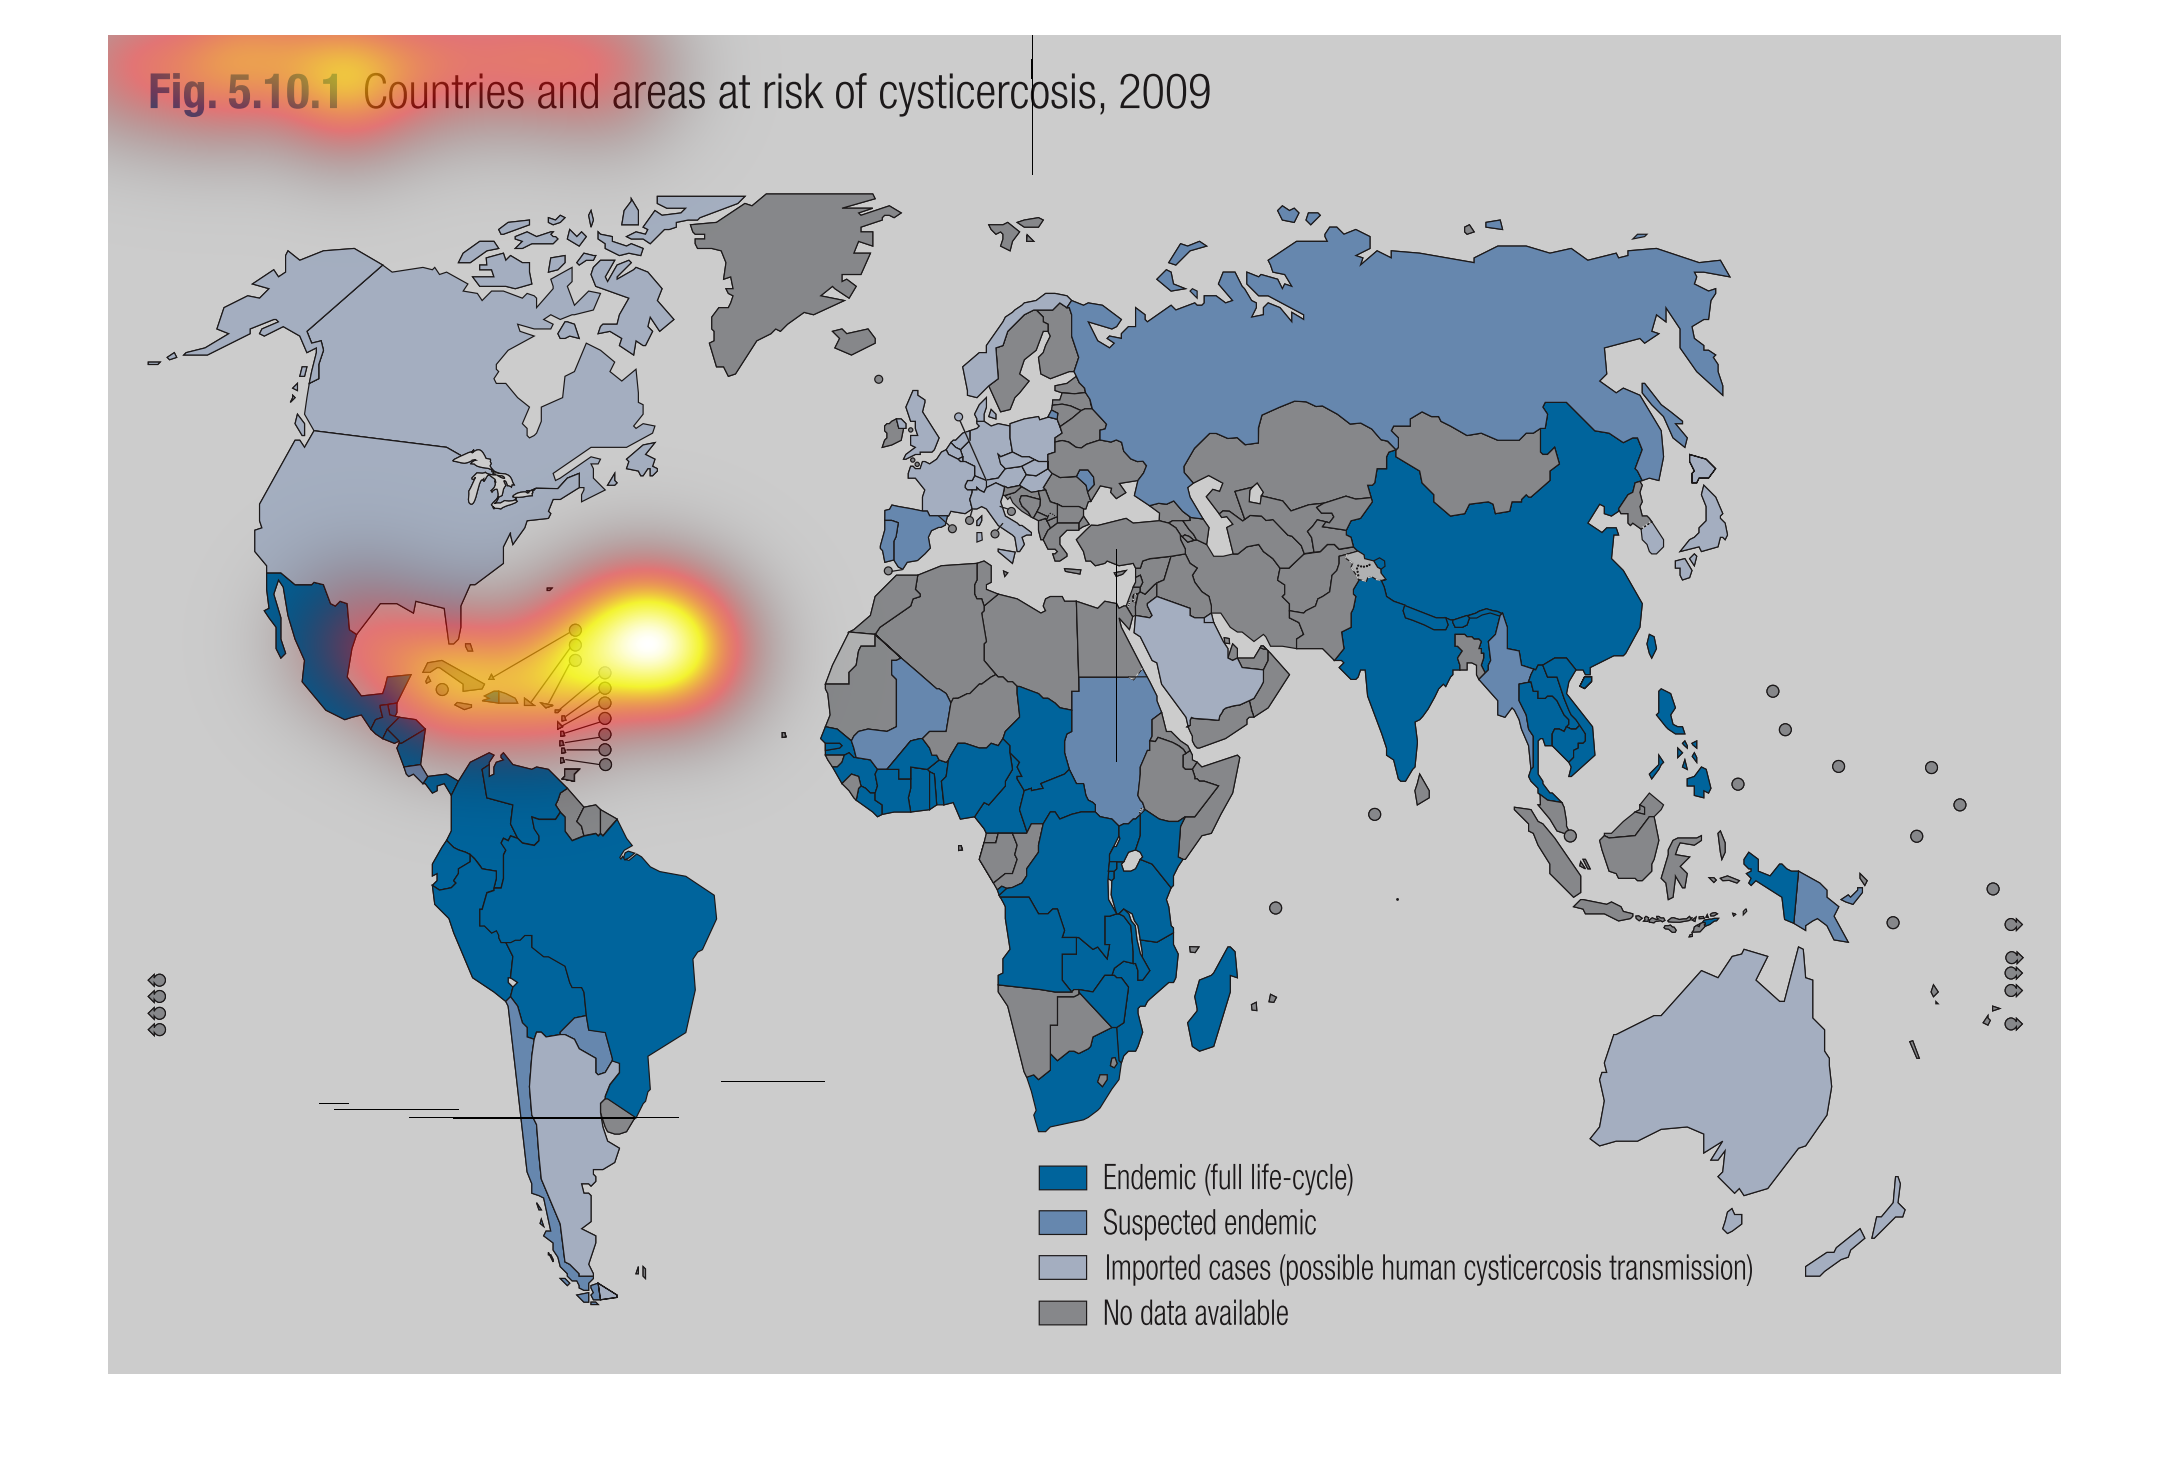
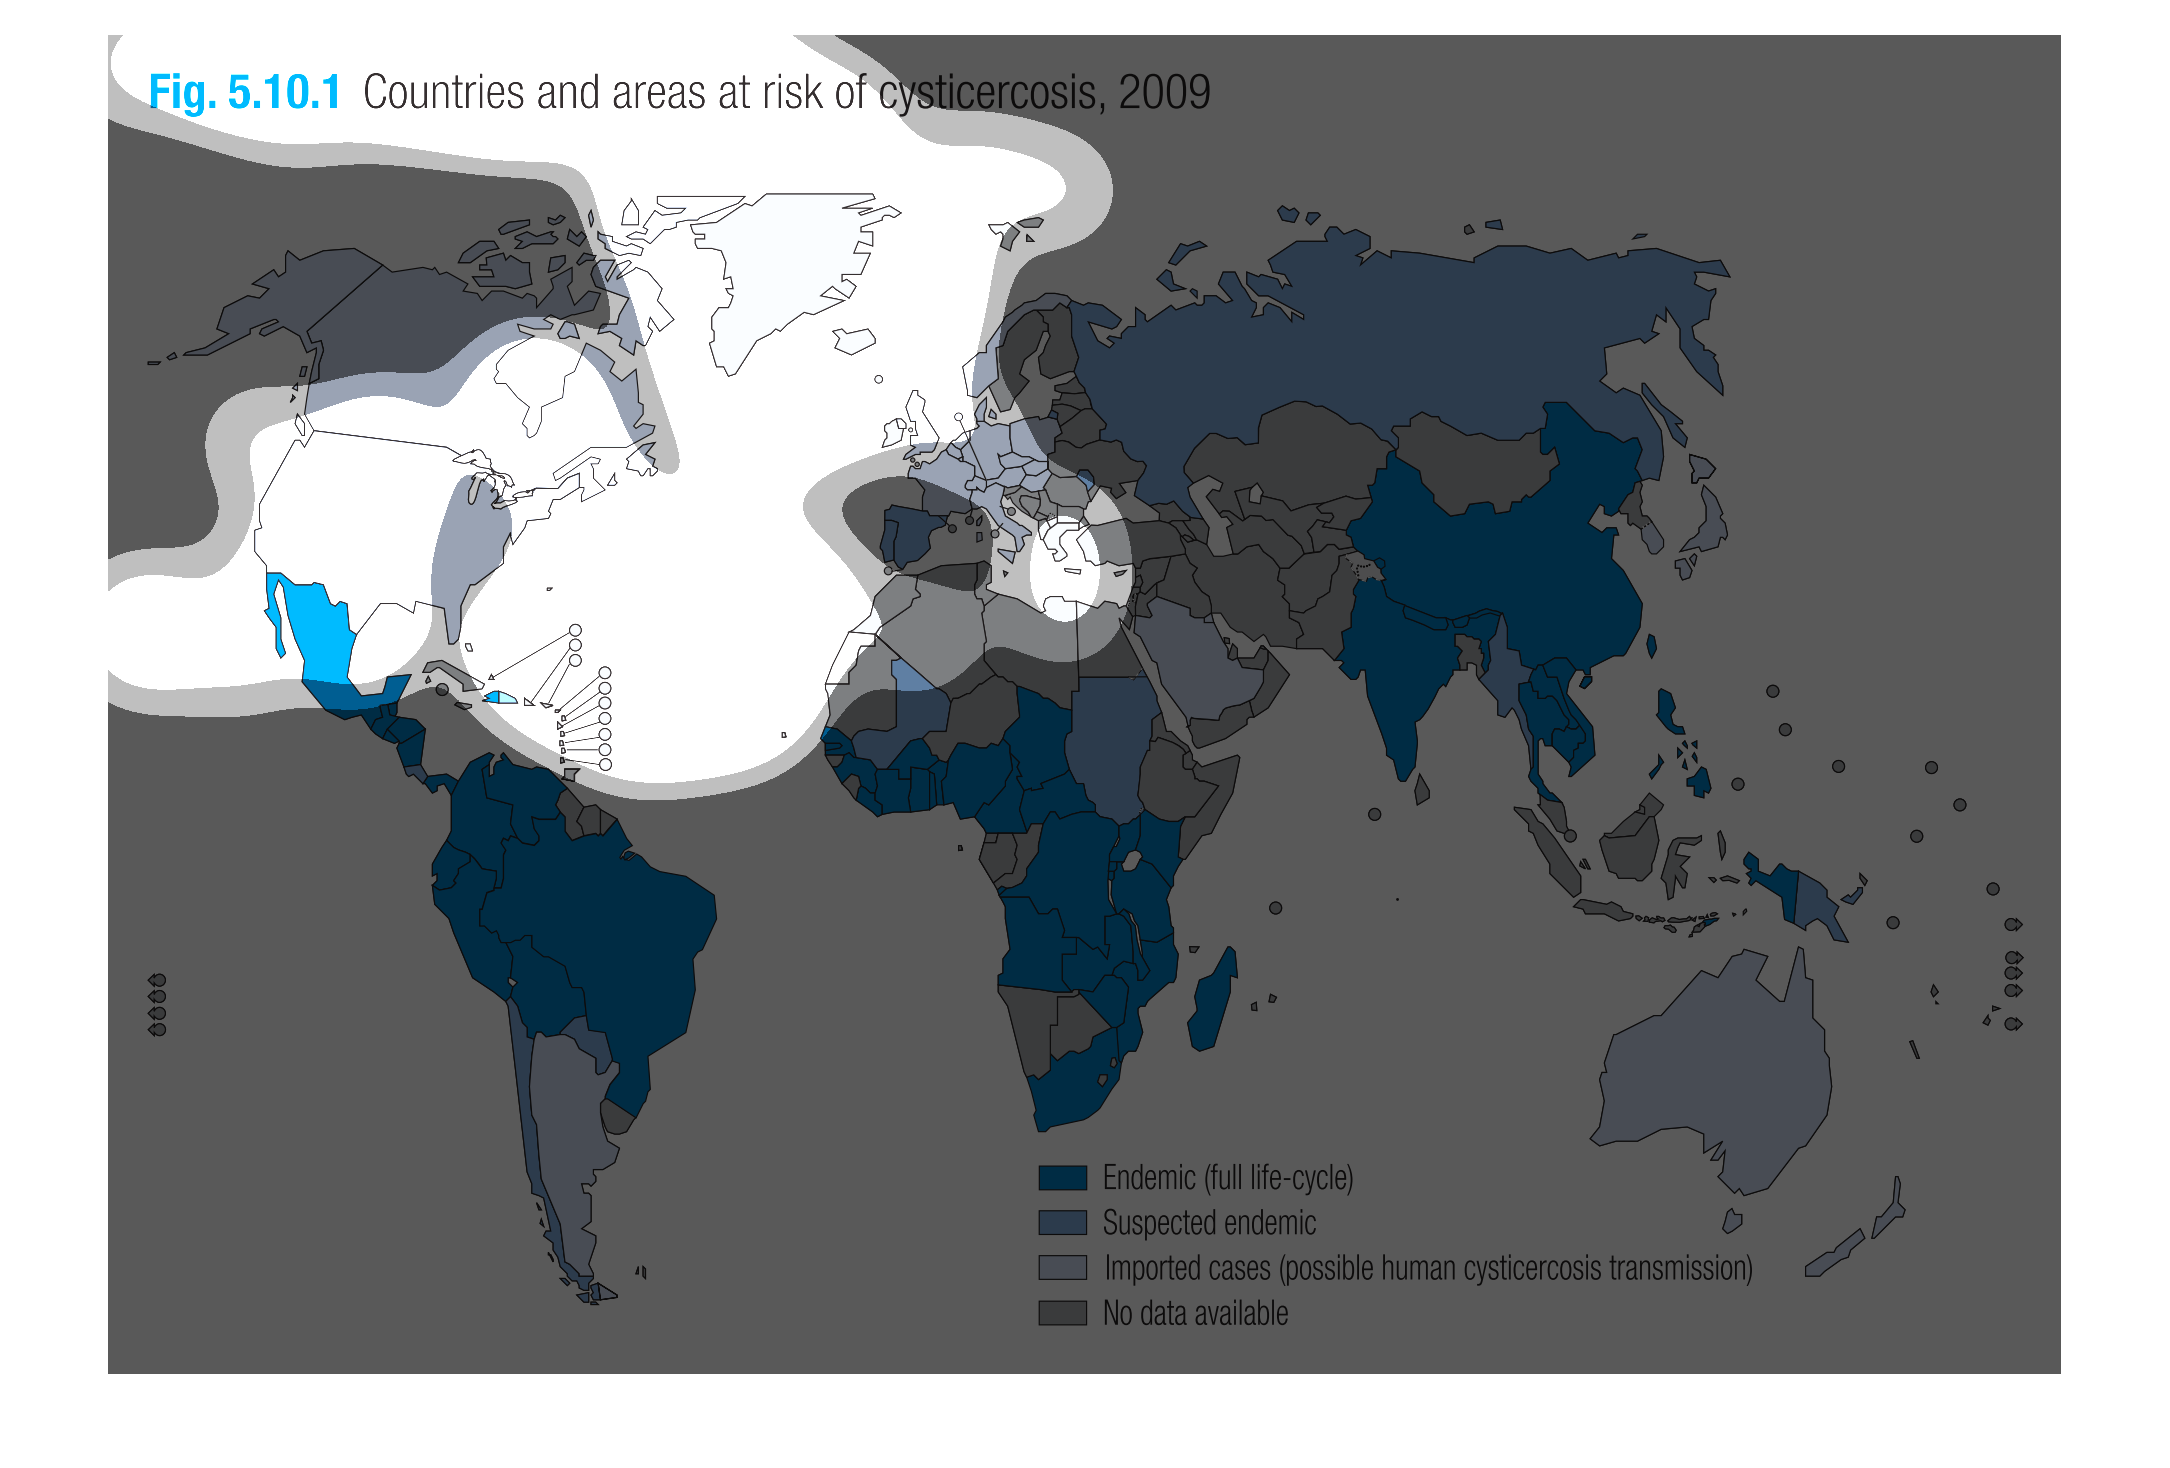
This shows countries and areas as risk of cysticercosis in 2009. The areas with an endemic
(full life cycle) are China, India, parts of Africa, central and south America.
This image shows a world map.  It depicts the countries and regions at risk of cysticercosis
in 2009.  Different levels of risk are listed and given a color.  The world map is then color
coded according to this chart to show the levels of risk for each area of the map.
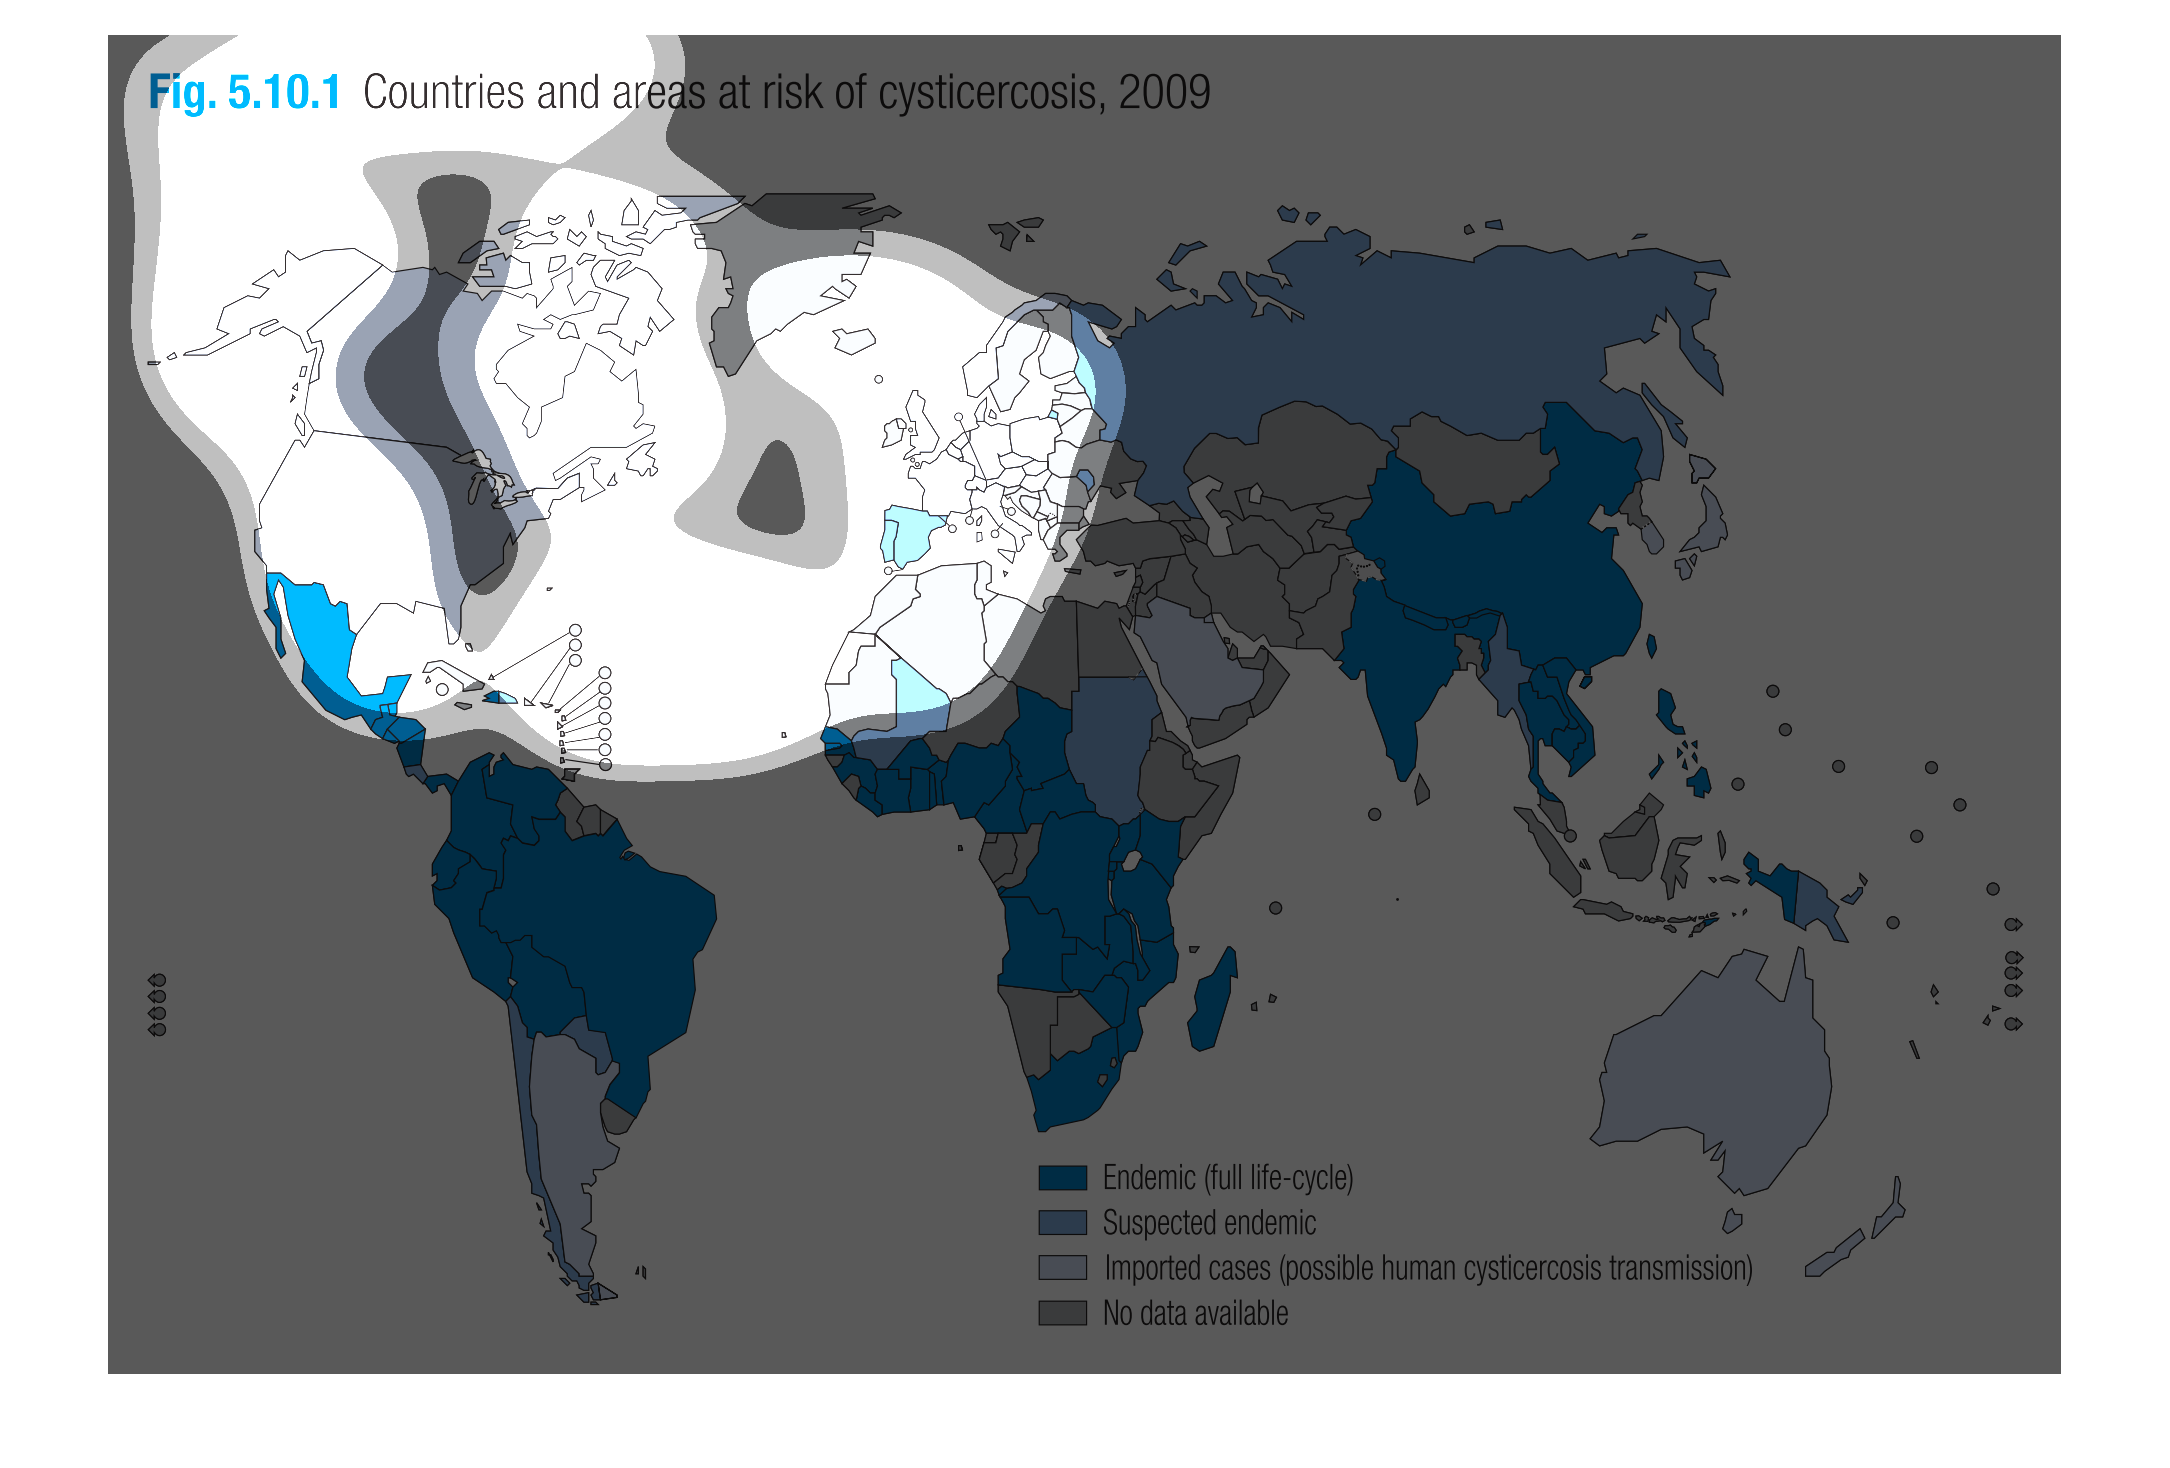
This chart describes about countries and areas of risk of cysticercosis at the year of 2009.
India, china, brazil are highly risk of endemic, the full life cycle.
The following chart gives the risk of each country for cysticercosis in the year of 2009.
The data presented shows countries in South East Asia and those around the equator to be of
the highest risk.
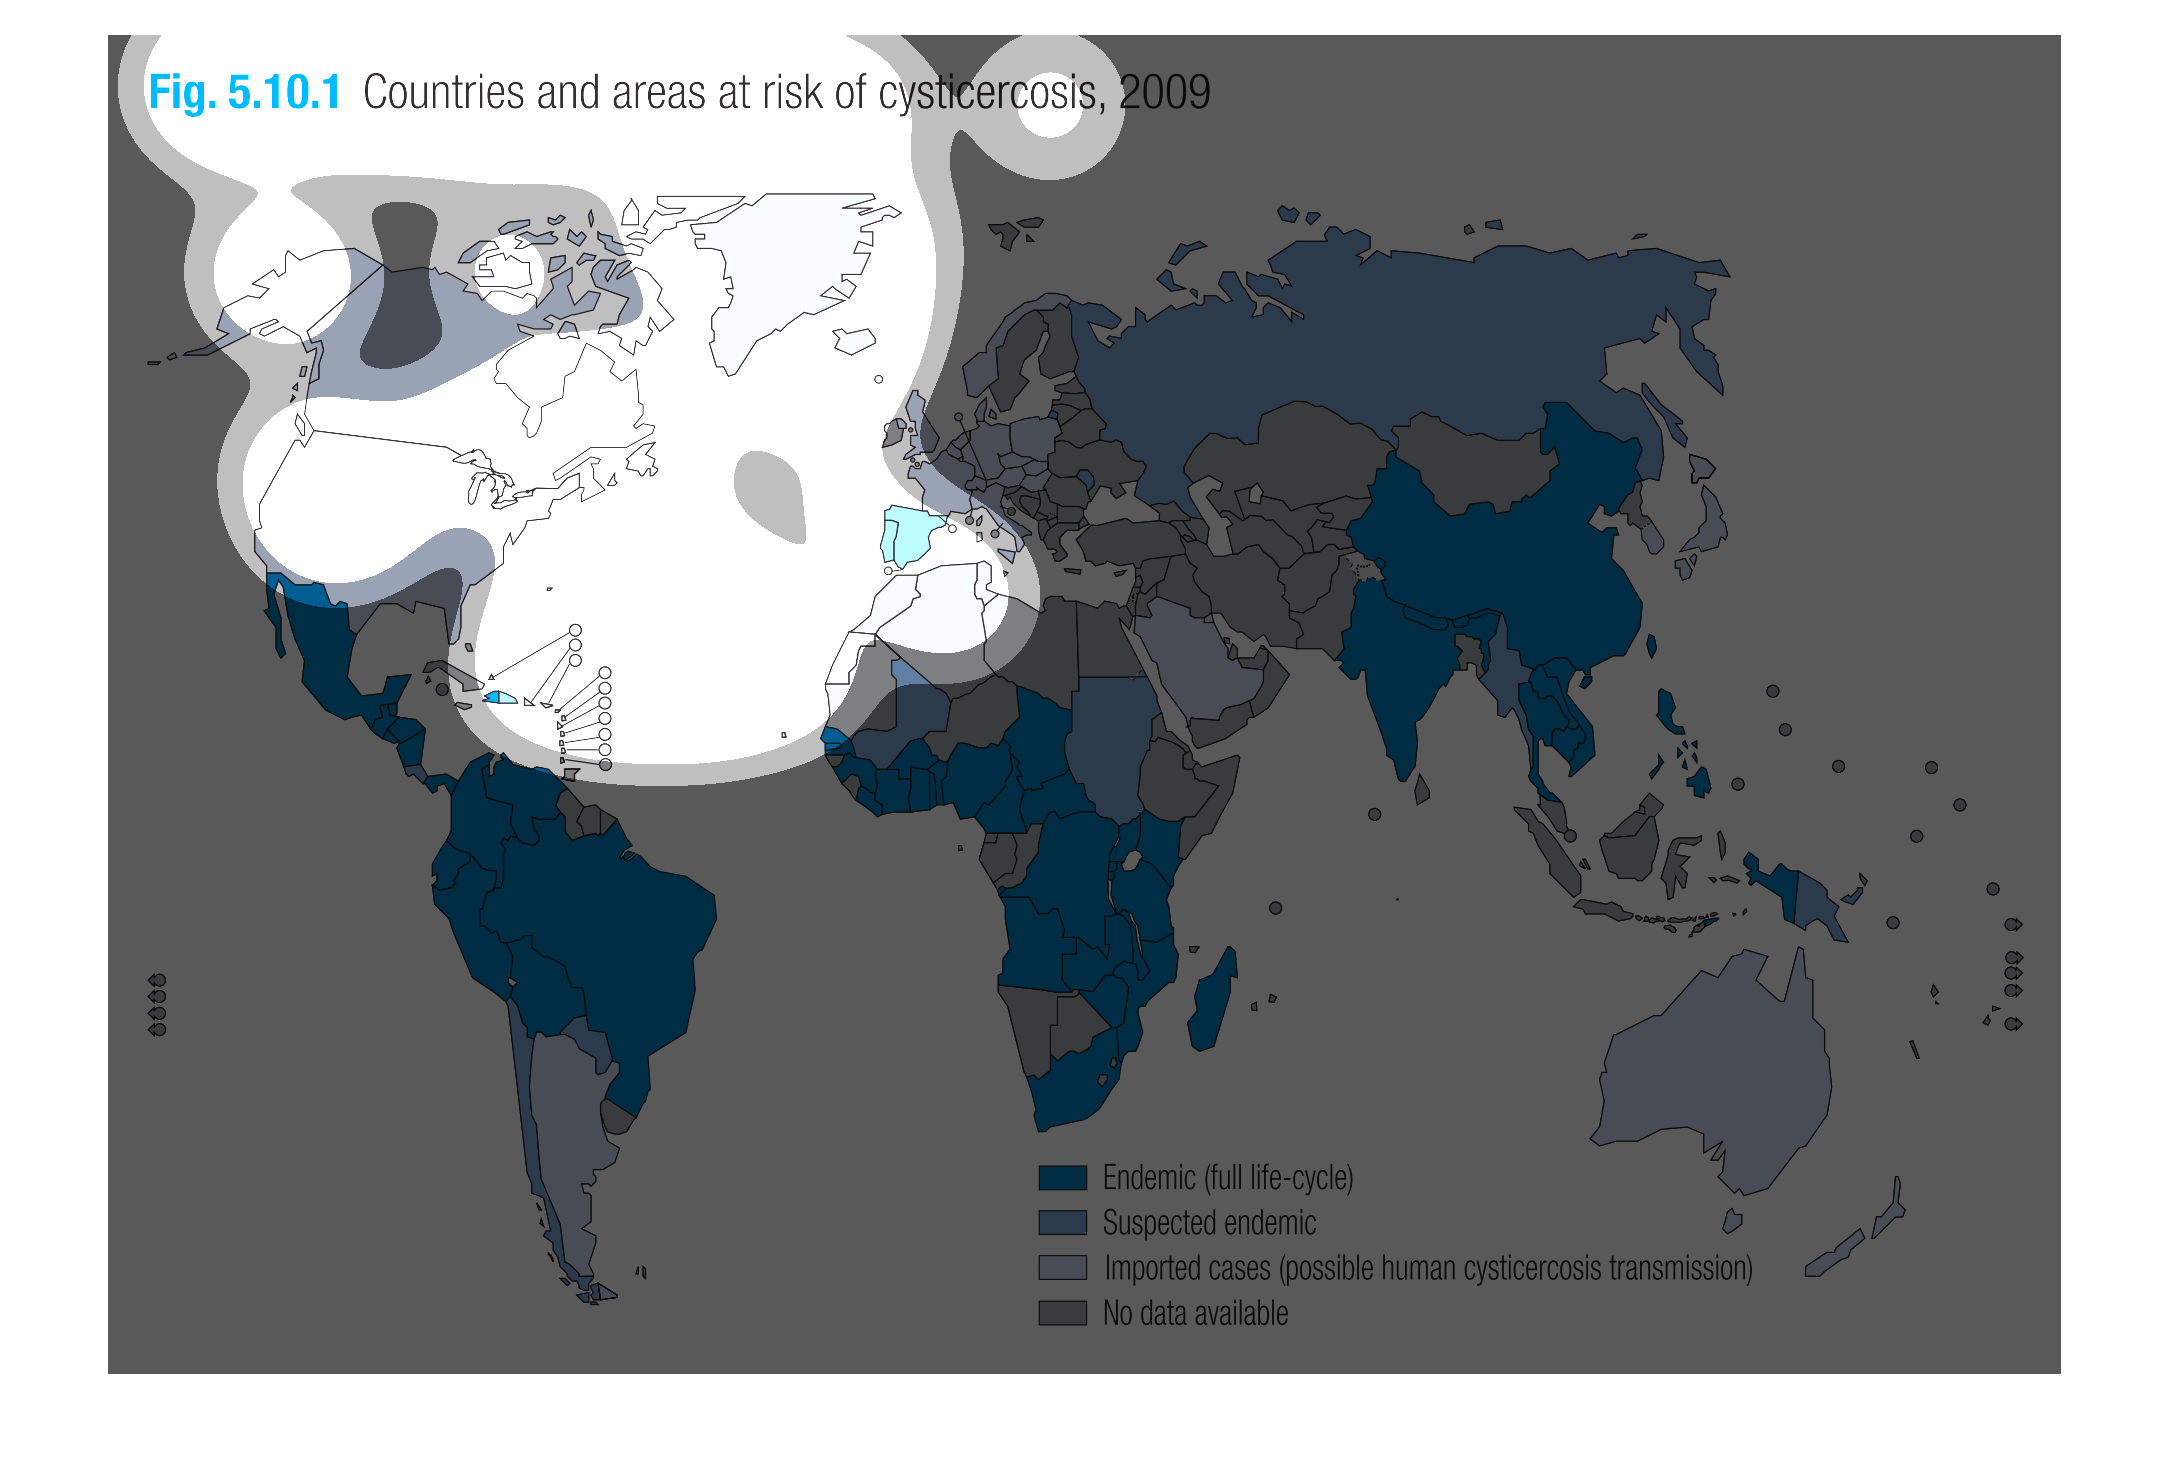
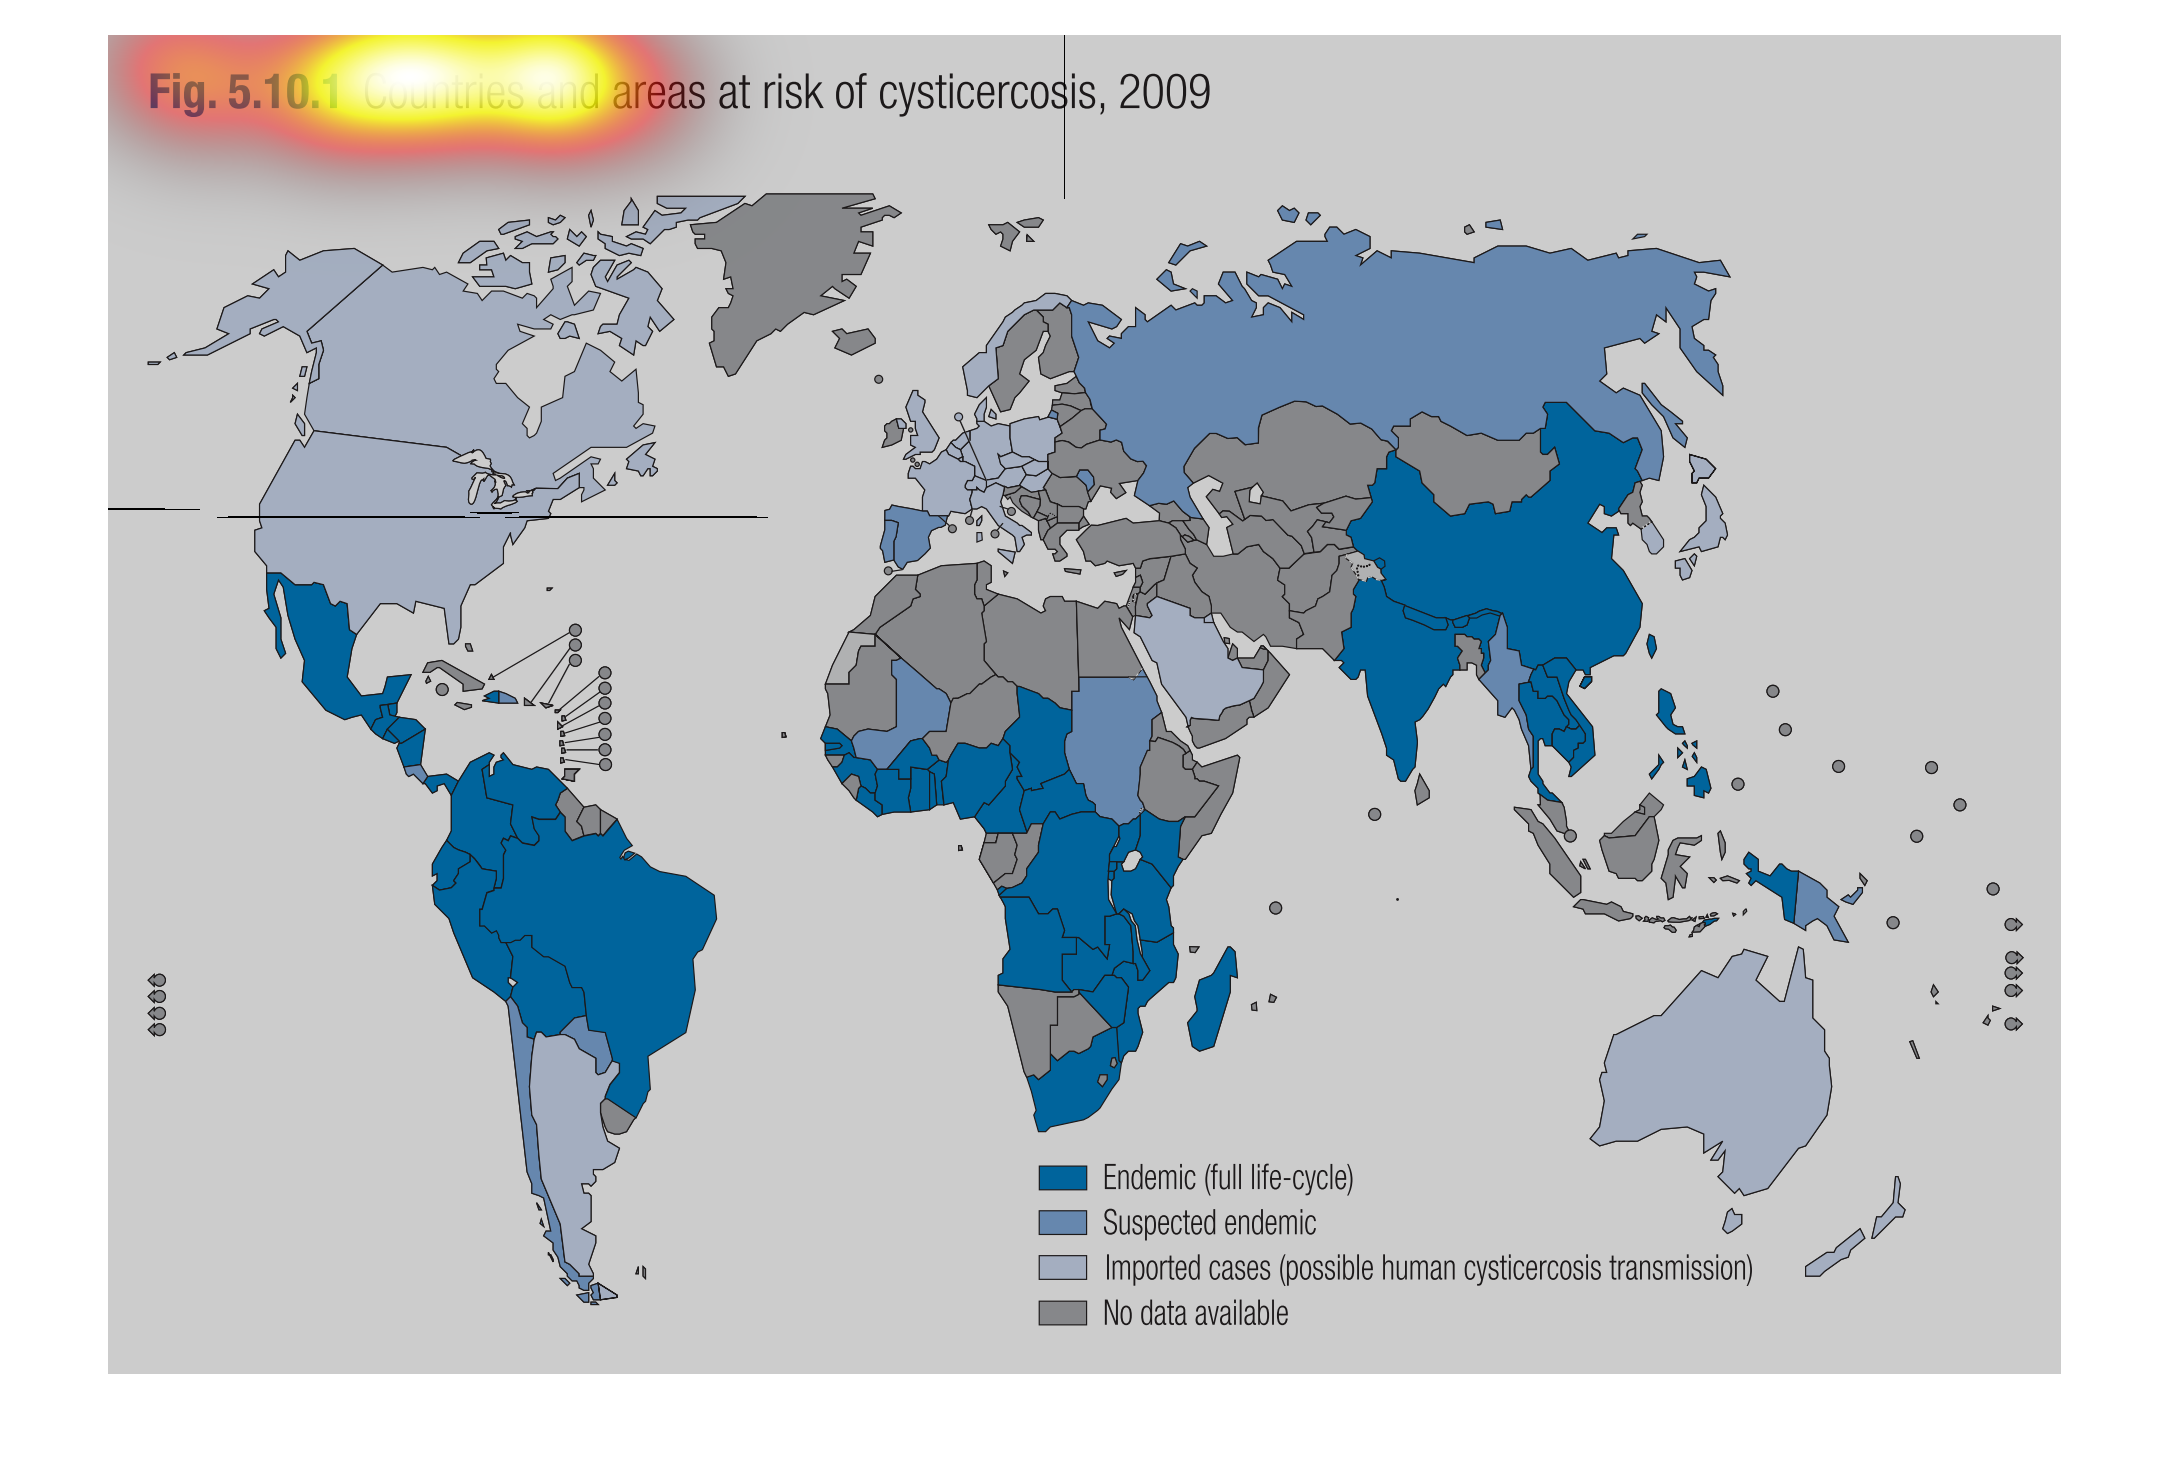
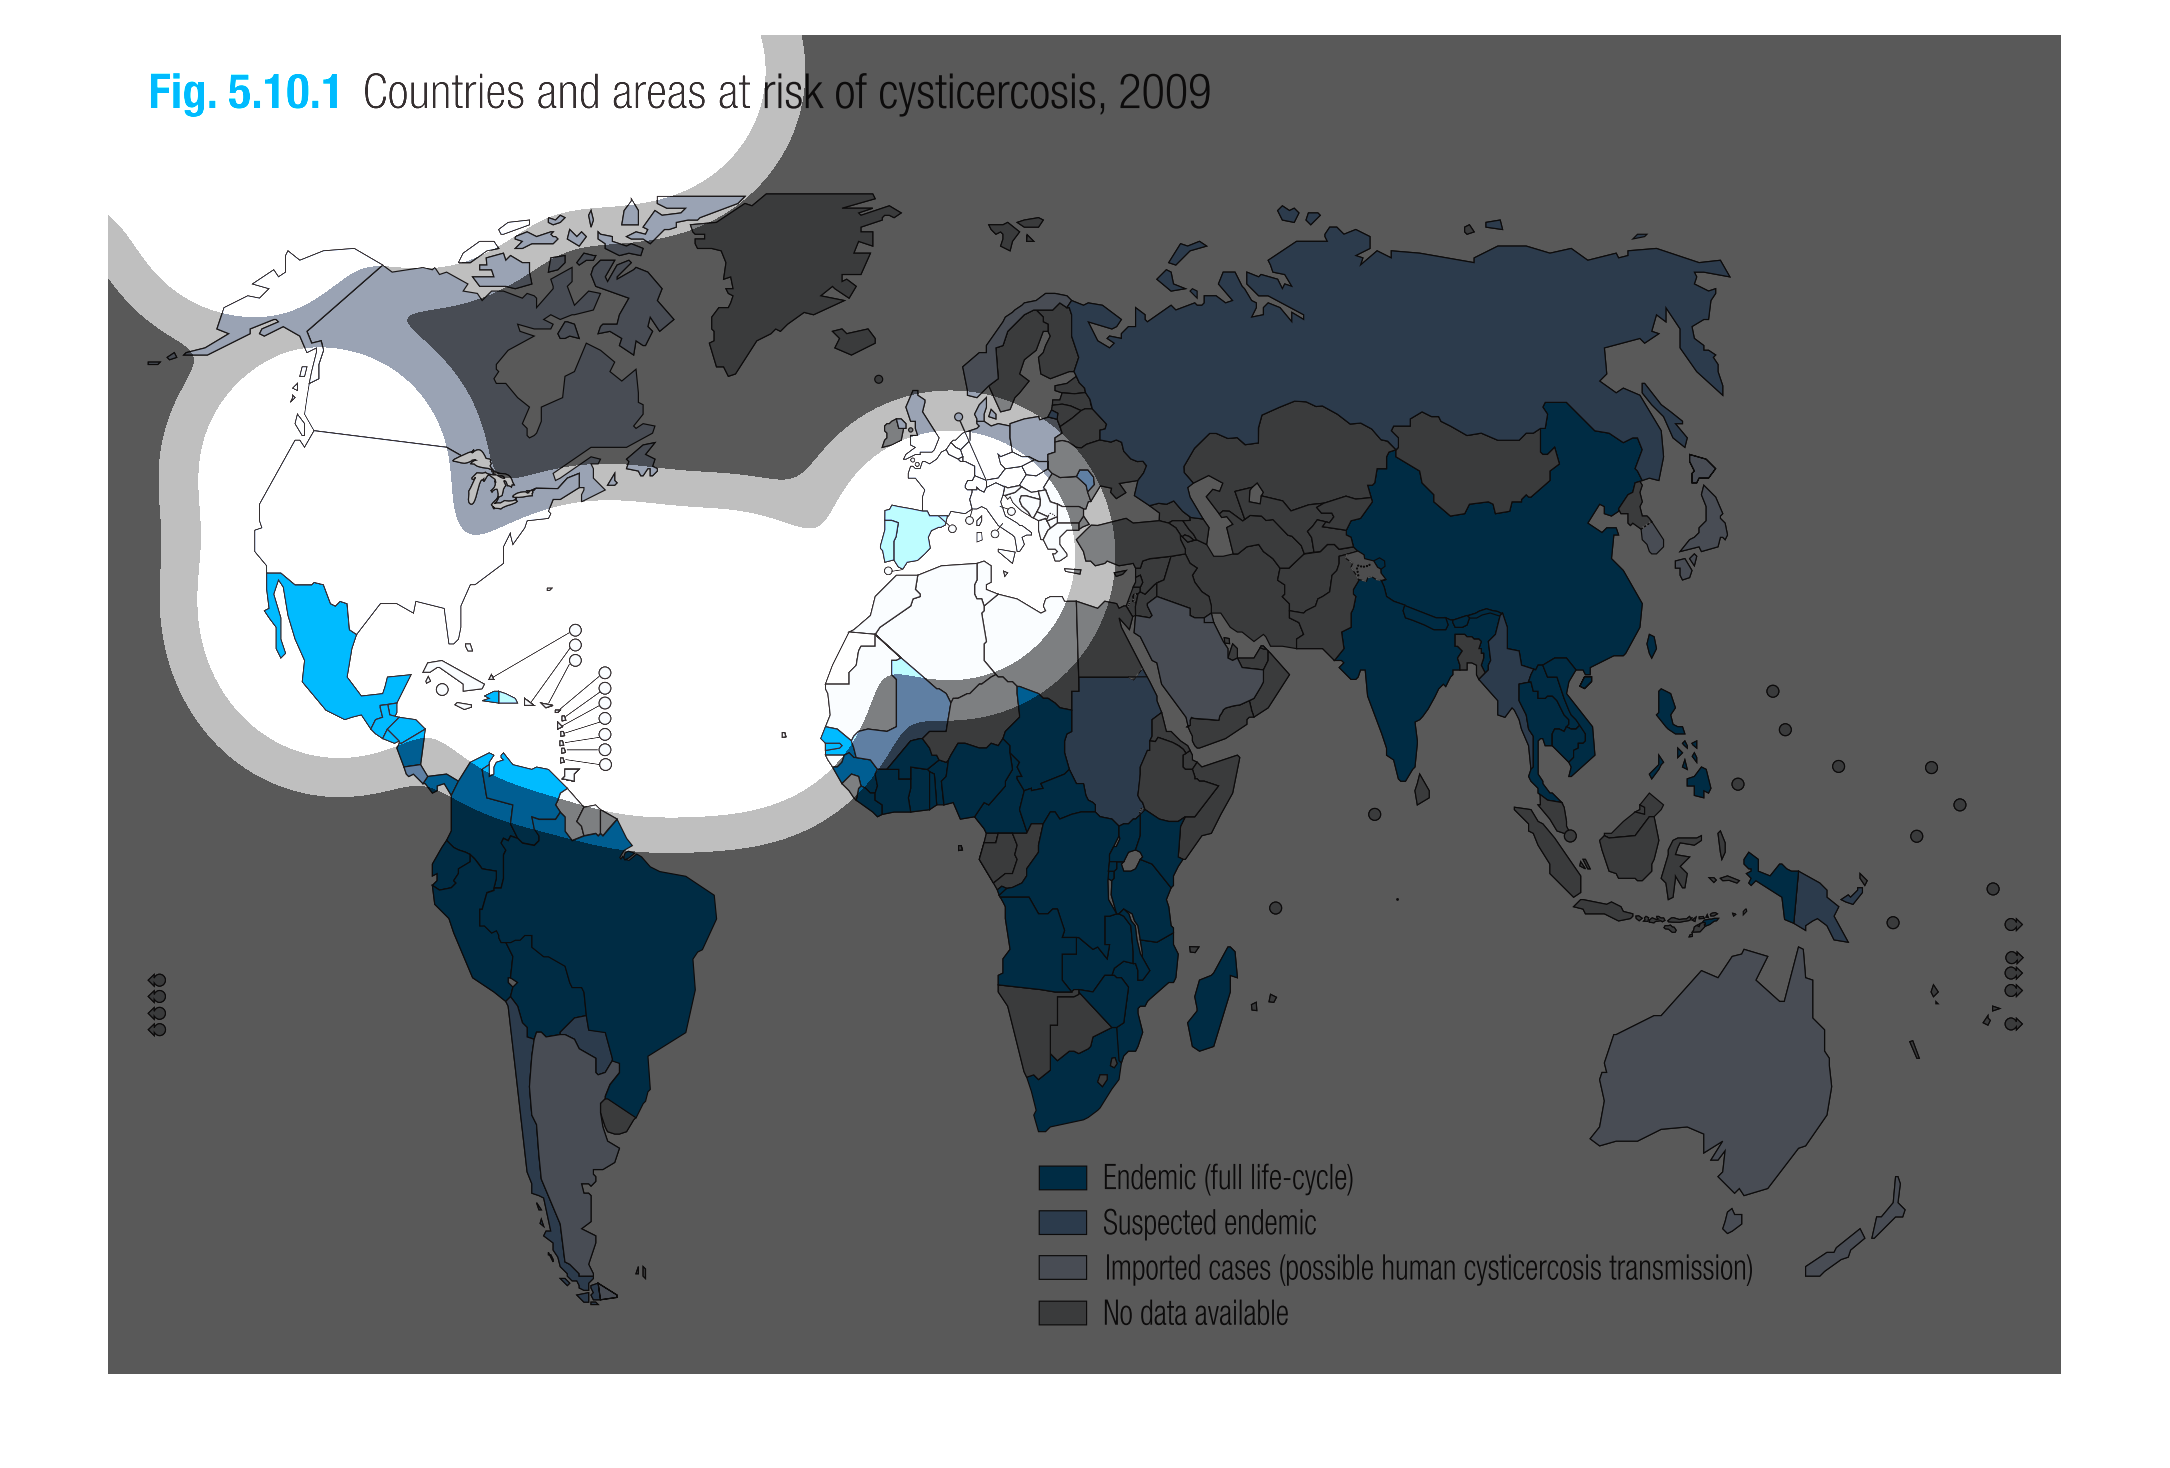
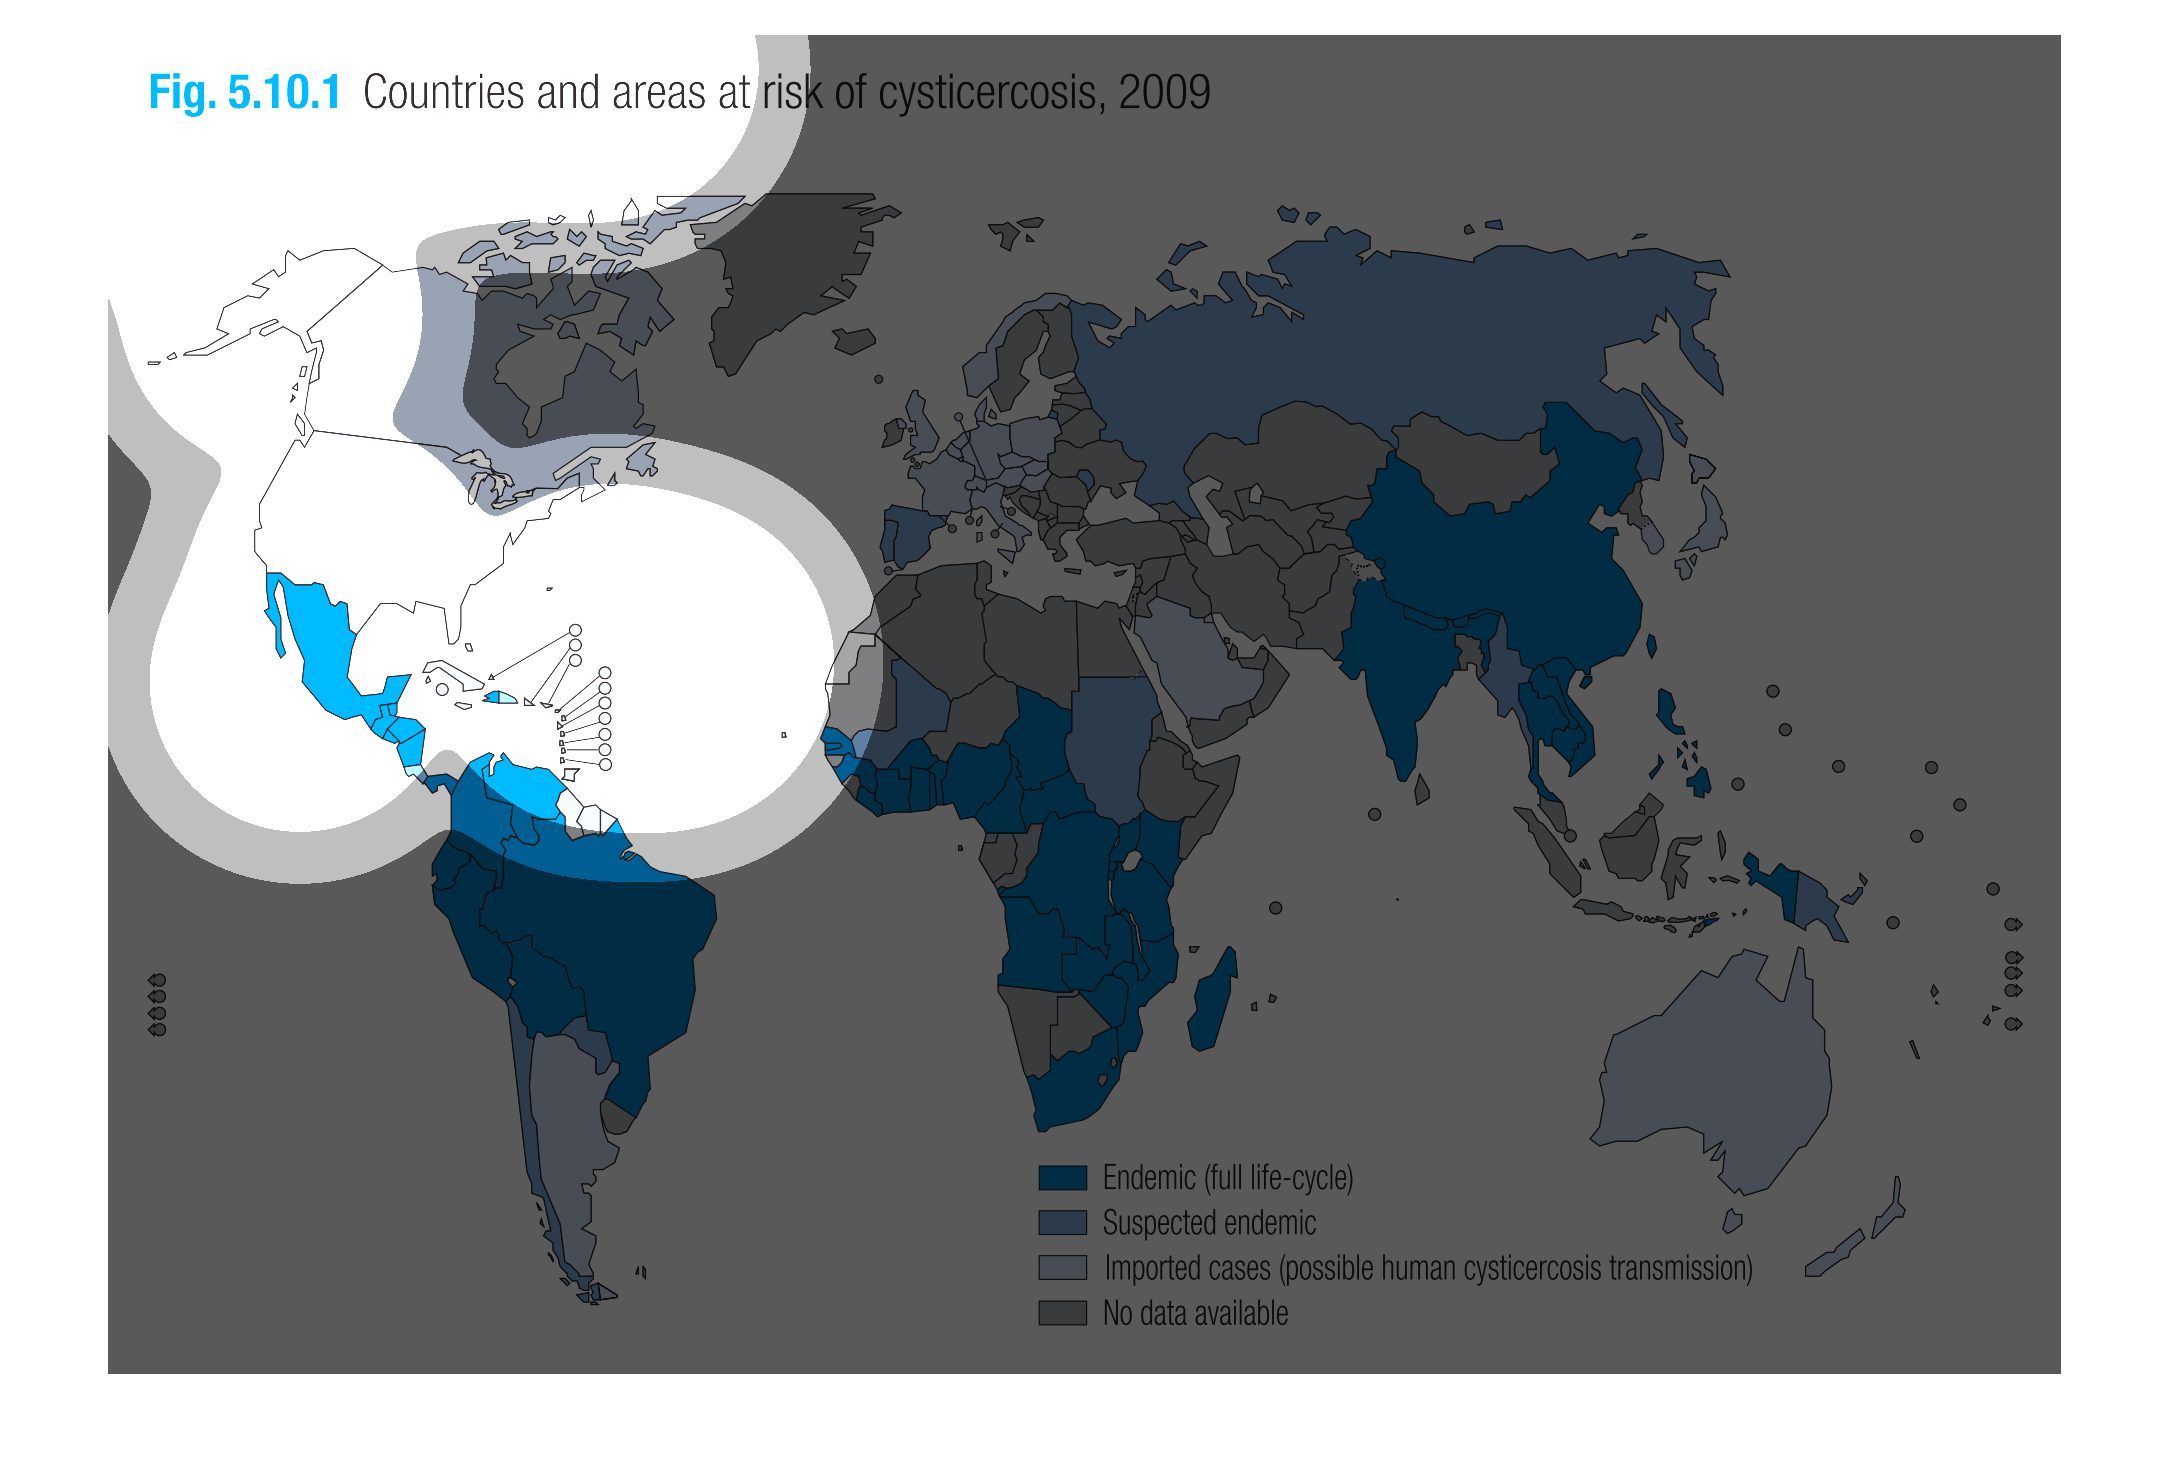
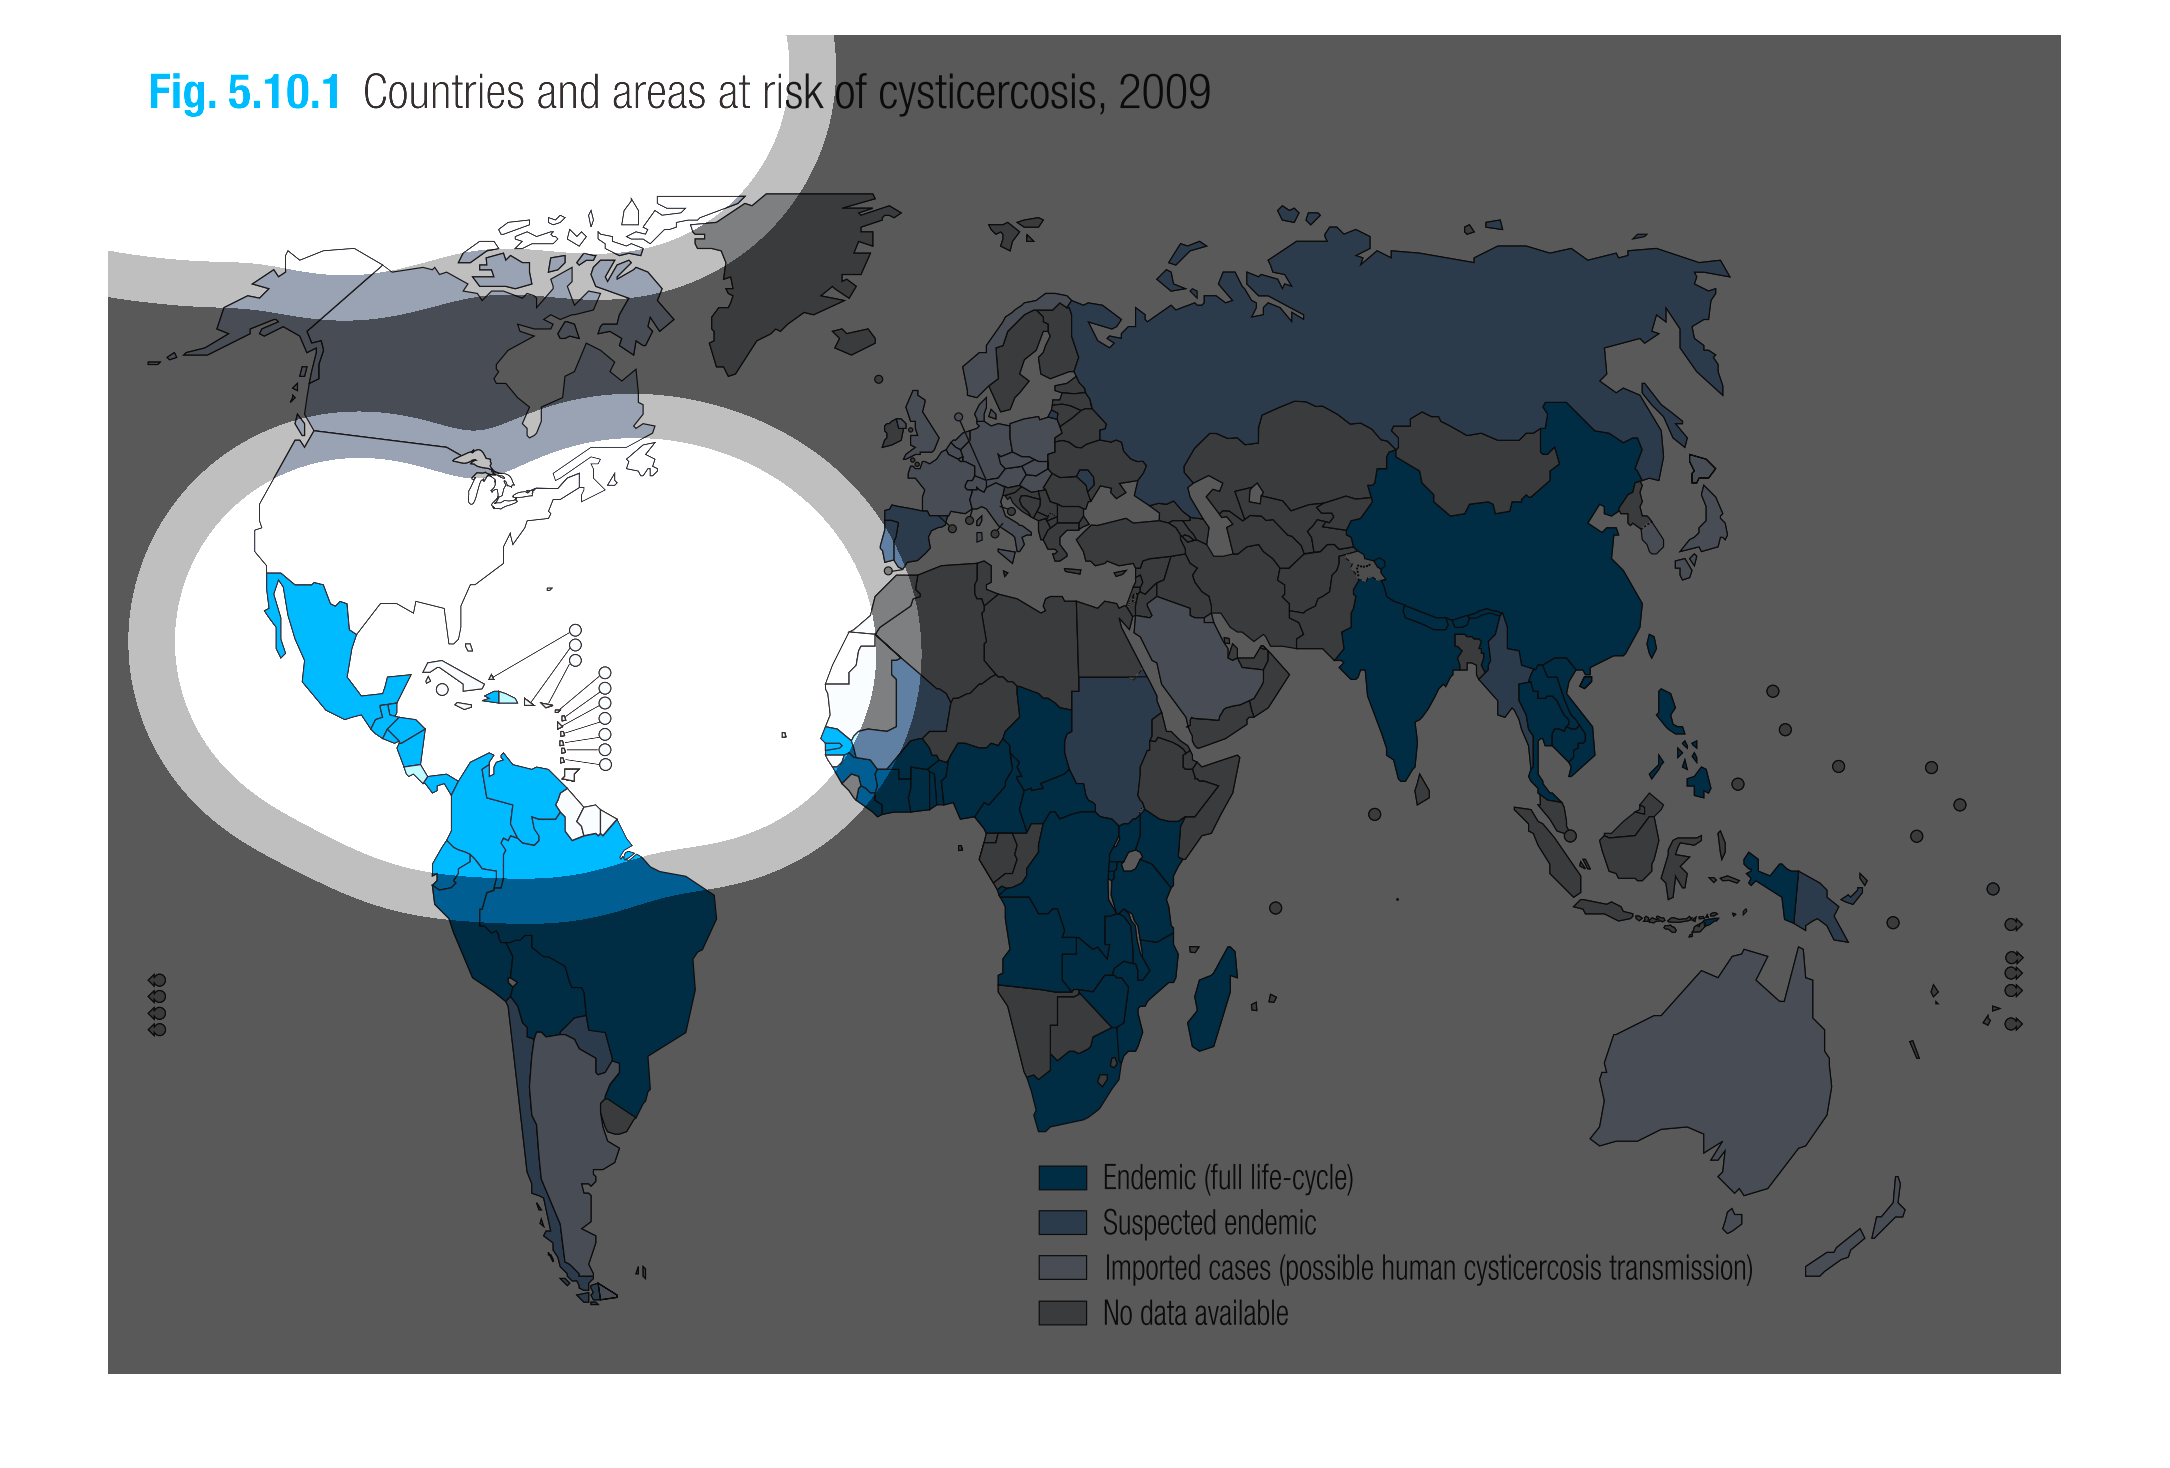
This chart shows which countries and areas were at risk of cysticerosis in 2009. The endemic
(full life-cycle) was mostly in the southern regions of this area as well as the East. The
Northwest and Southeast areas had the most imported cases of possible human transmission of
cysticerosis. The Northeast region had suspected the endemic. The central regions mostly had
no data available.