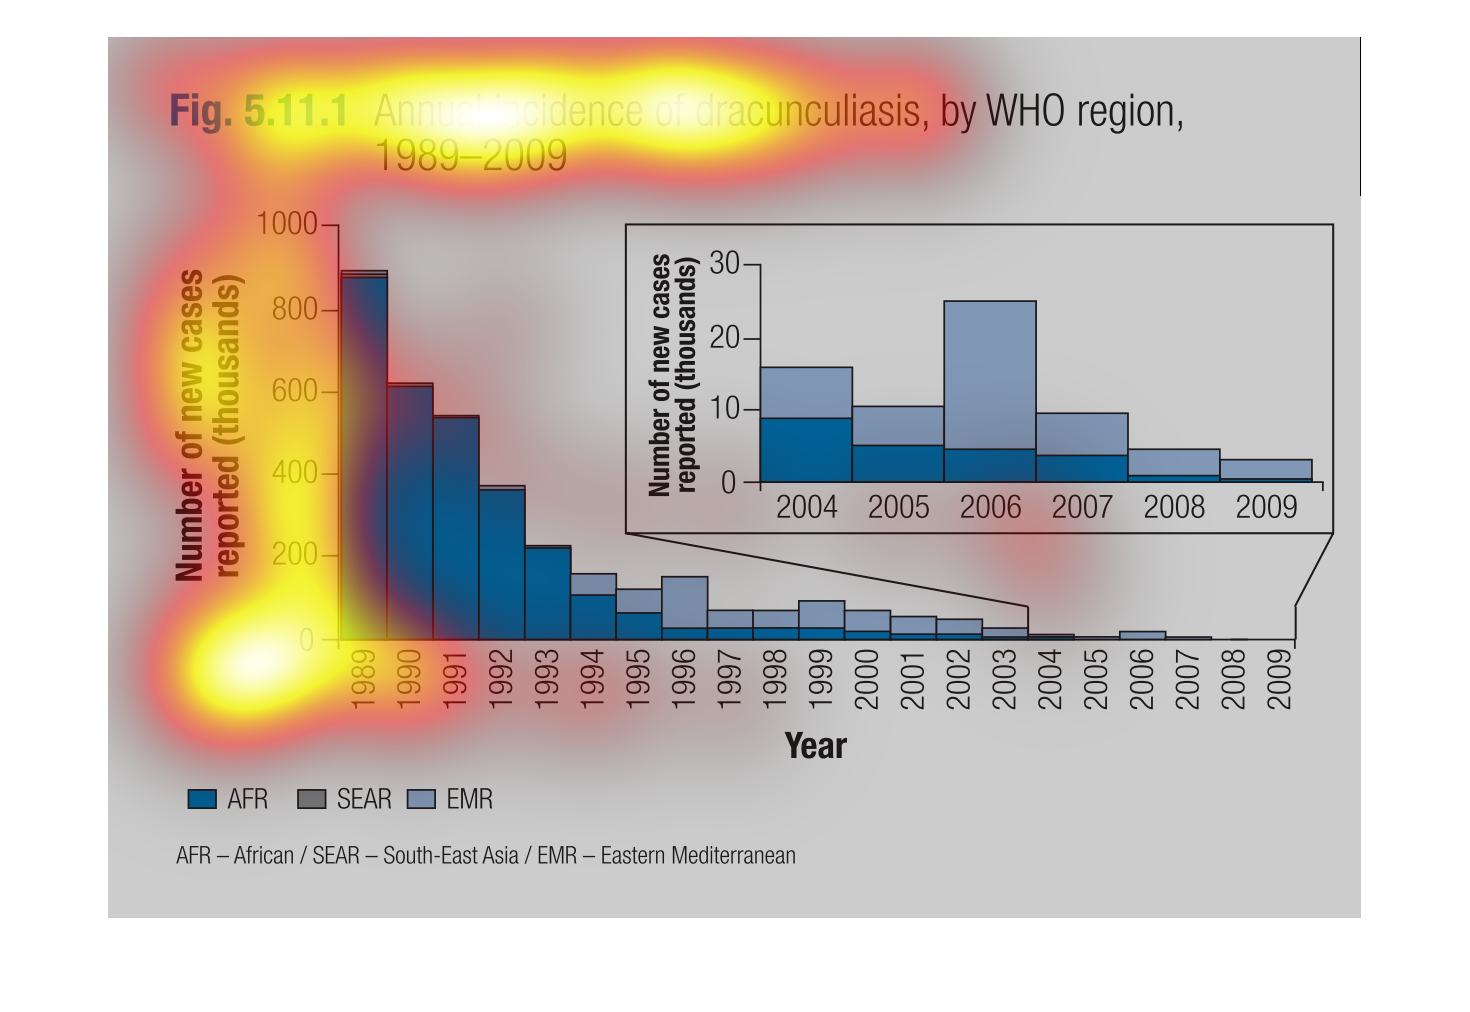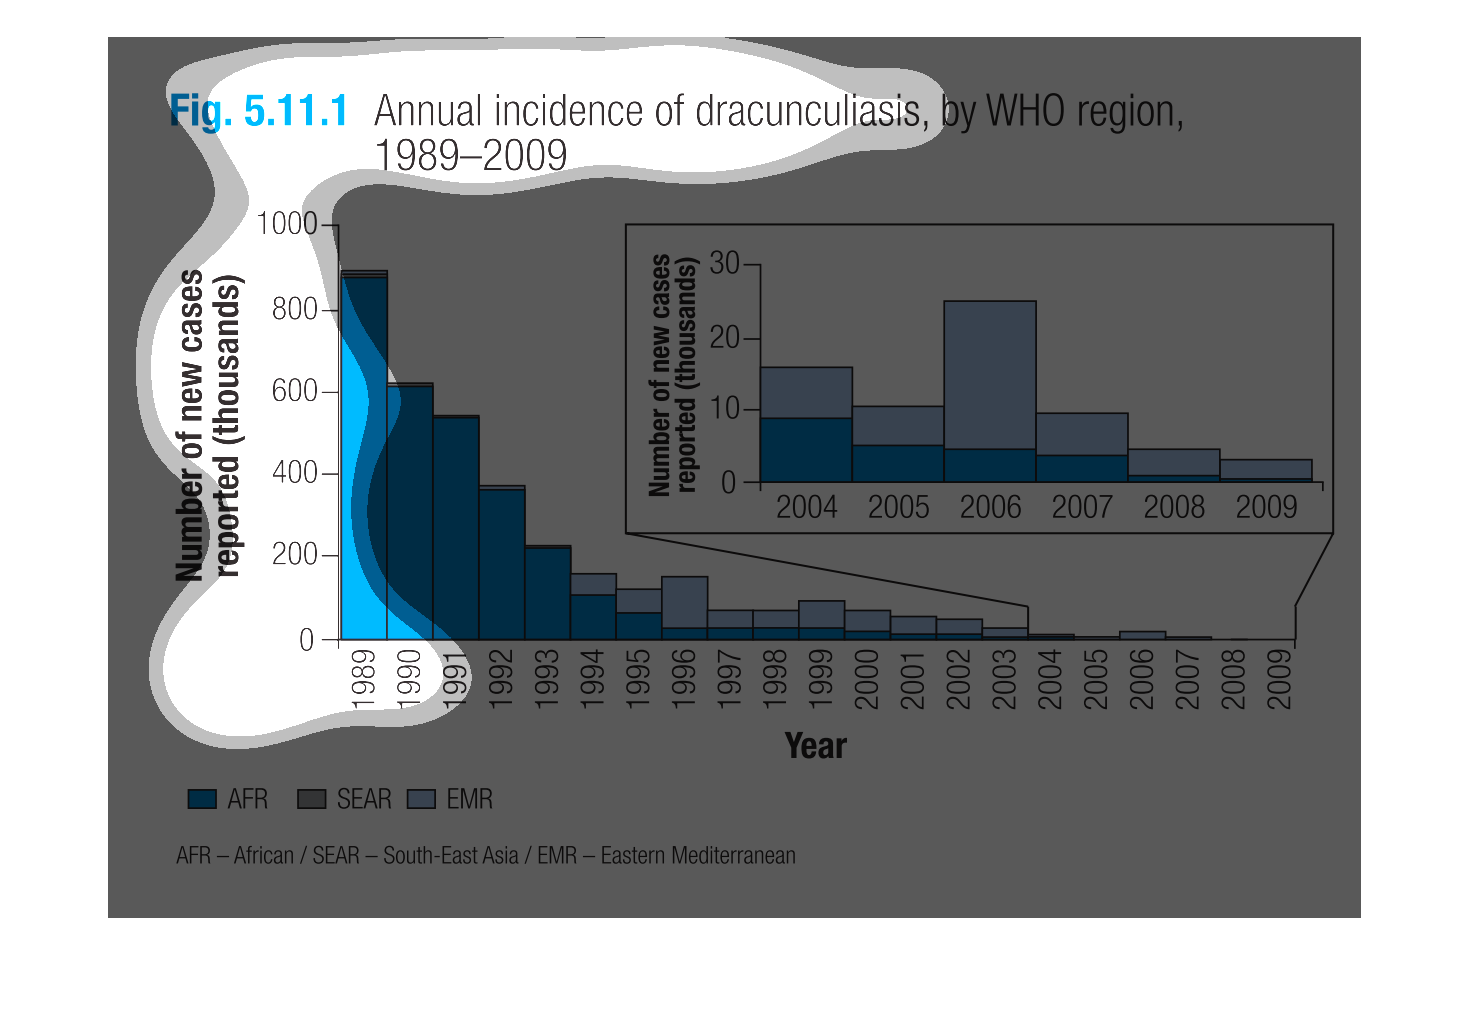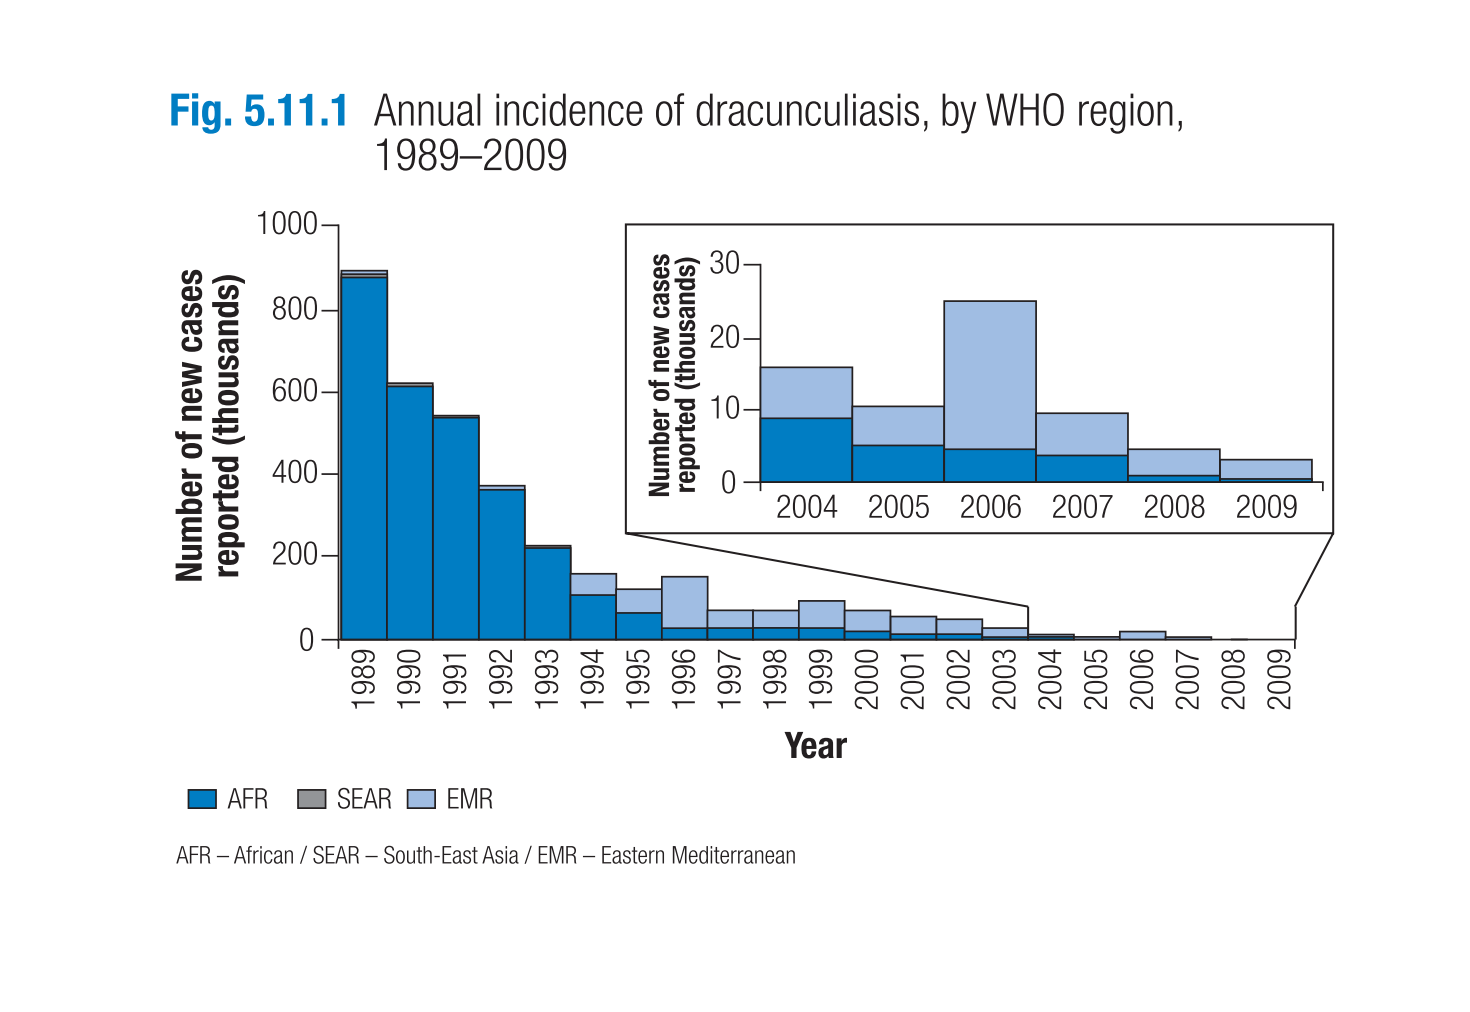
Titled Figure 5.1.1 Annual Incidence Dracunculiasis, by WHO region, 1989-2009. Bar graph that
shows the number of new cases reported in the thousands.
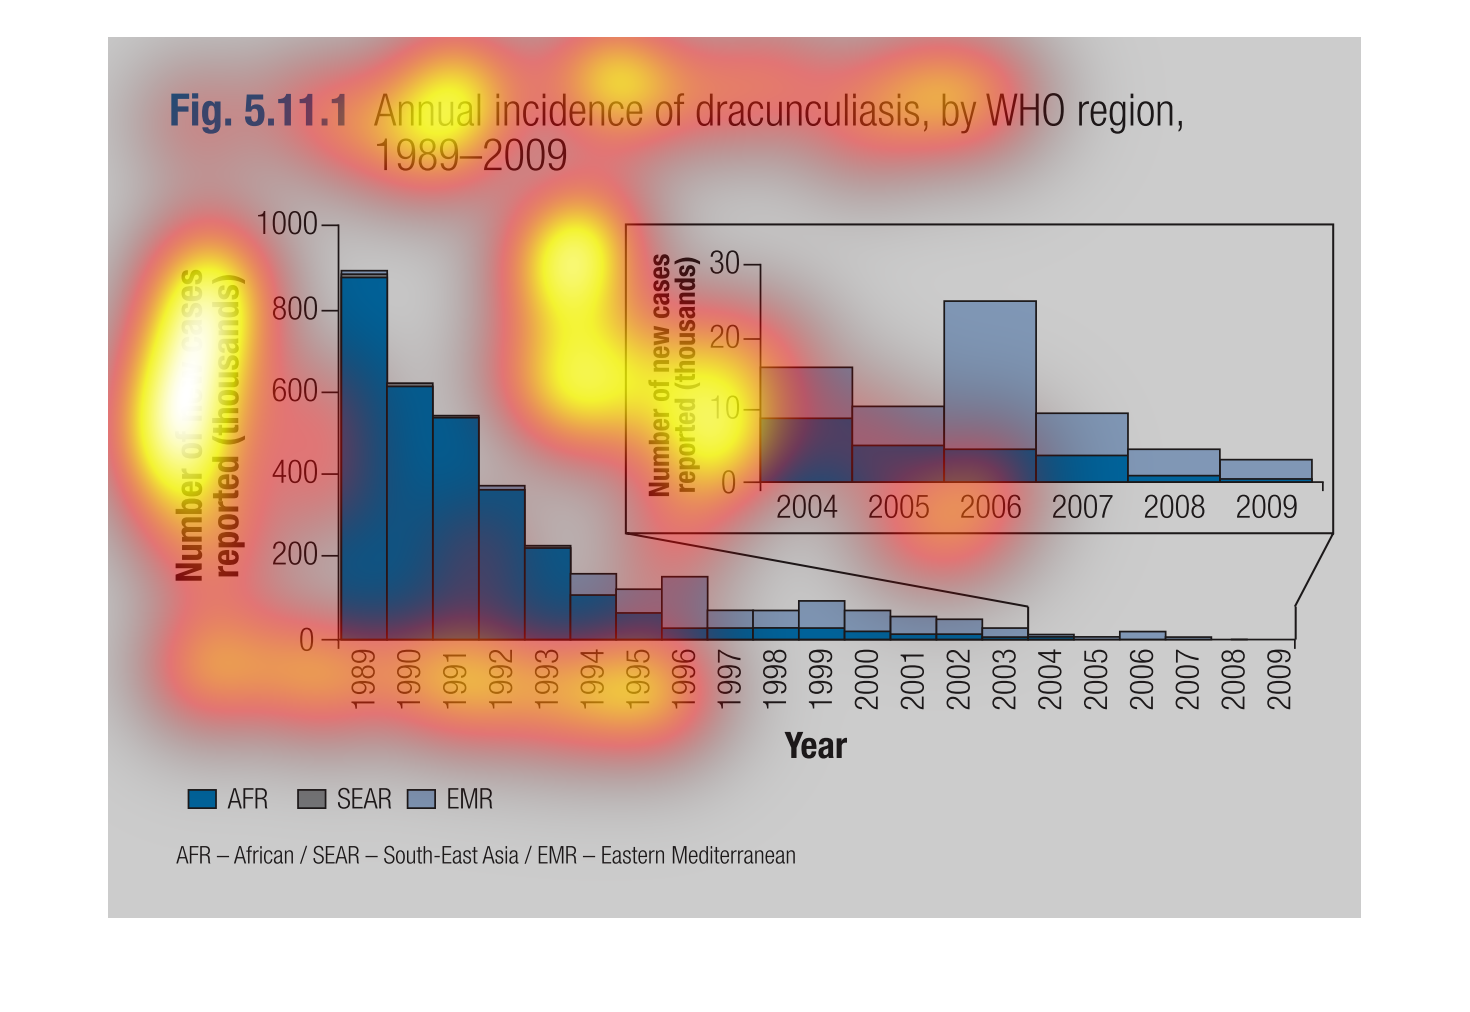
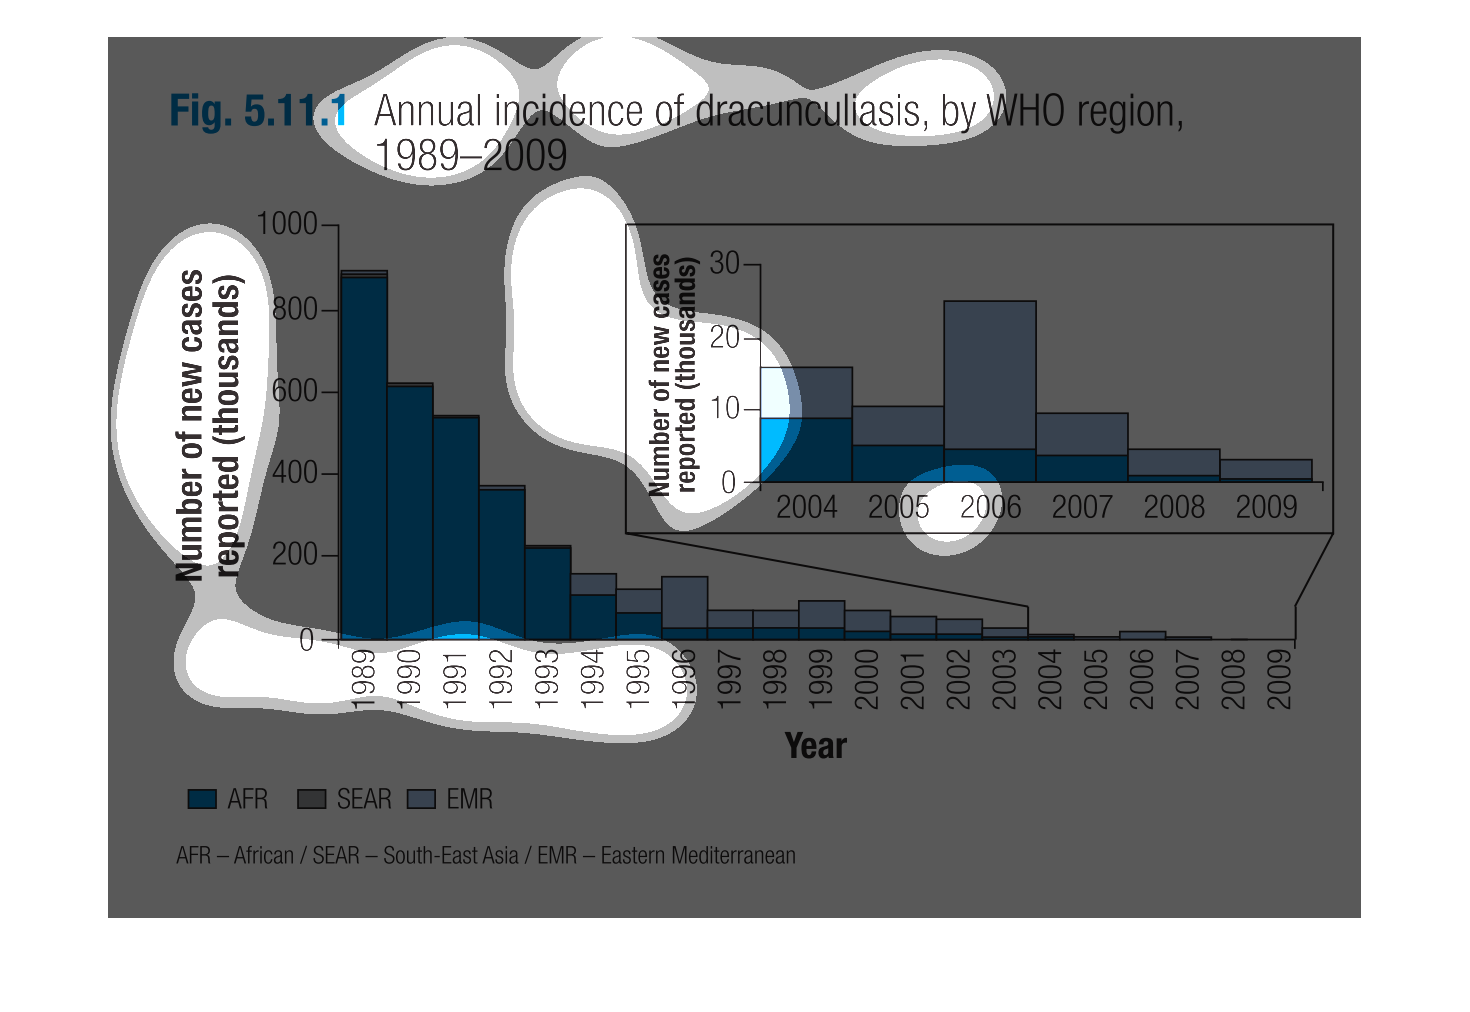
This image shows or depicts in statistical bar graph format the annual incidence of dracunculiasis
by WHO region covering a 20 year time span from 1989-2009.
This is a chart that breaks down the newly reported instances of dranculiasis by year and
region for the years of 1989-2009. The breakdown is by thousandths for the African, South
East Asian, and Eastern Mediterranean areas.
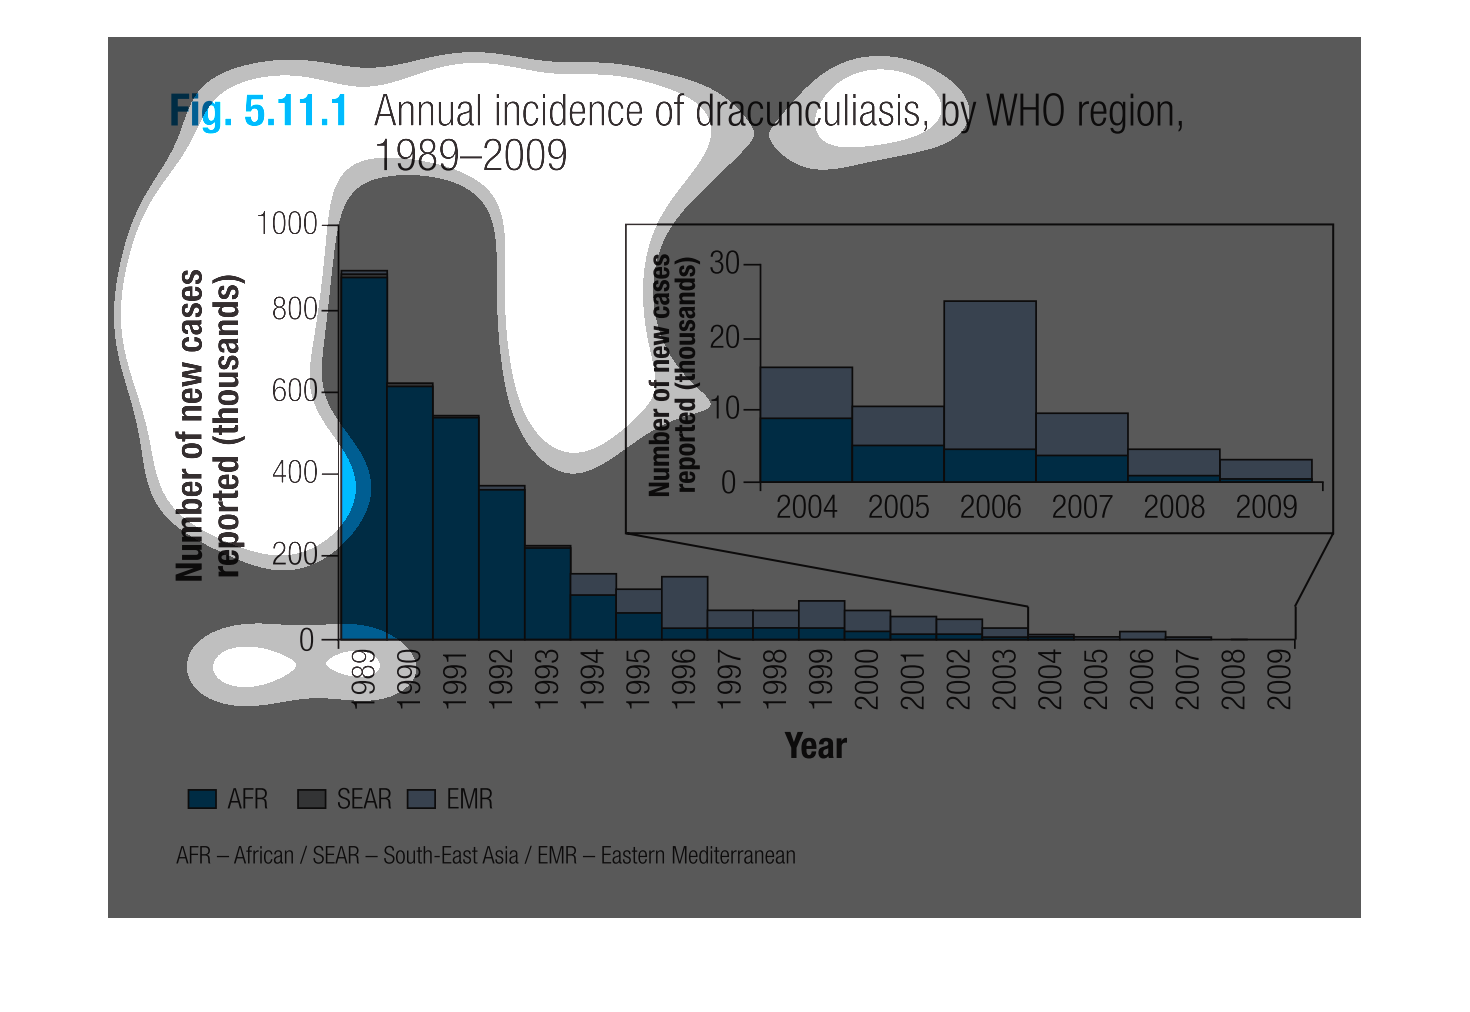
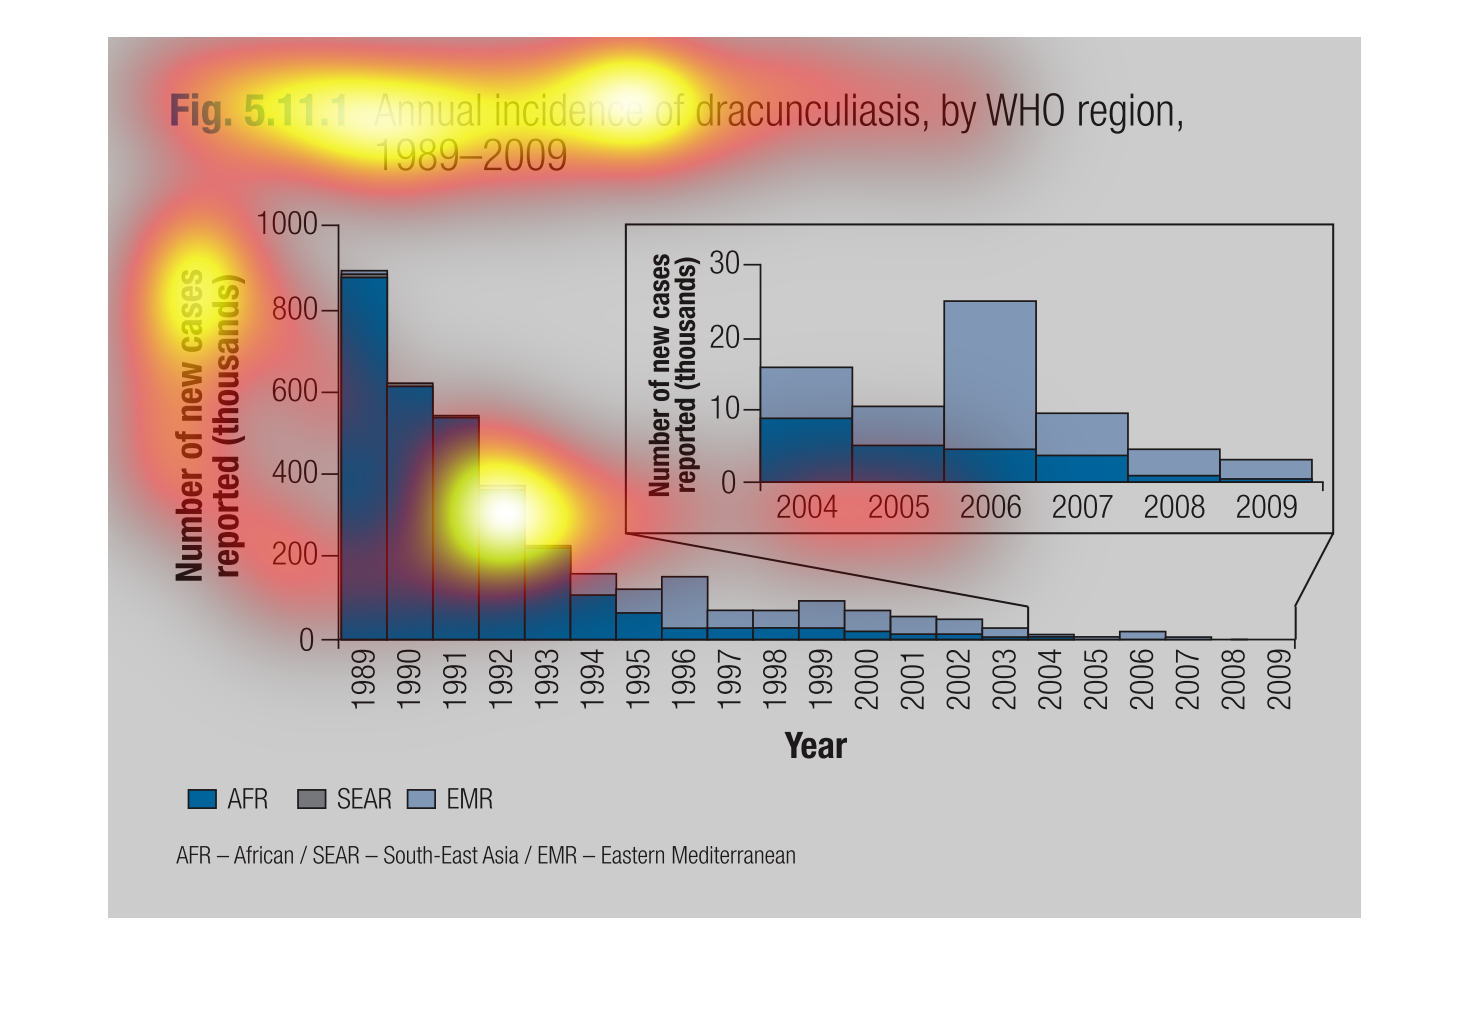
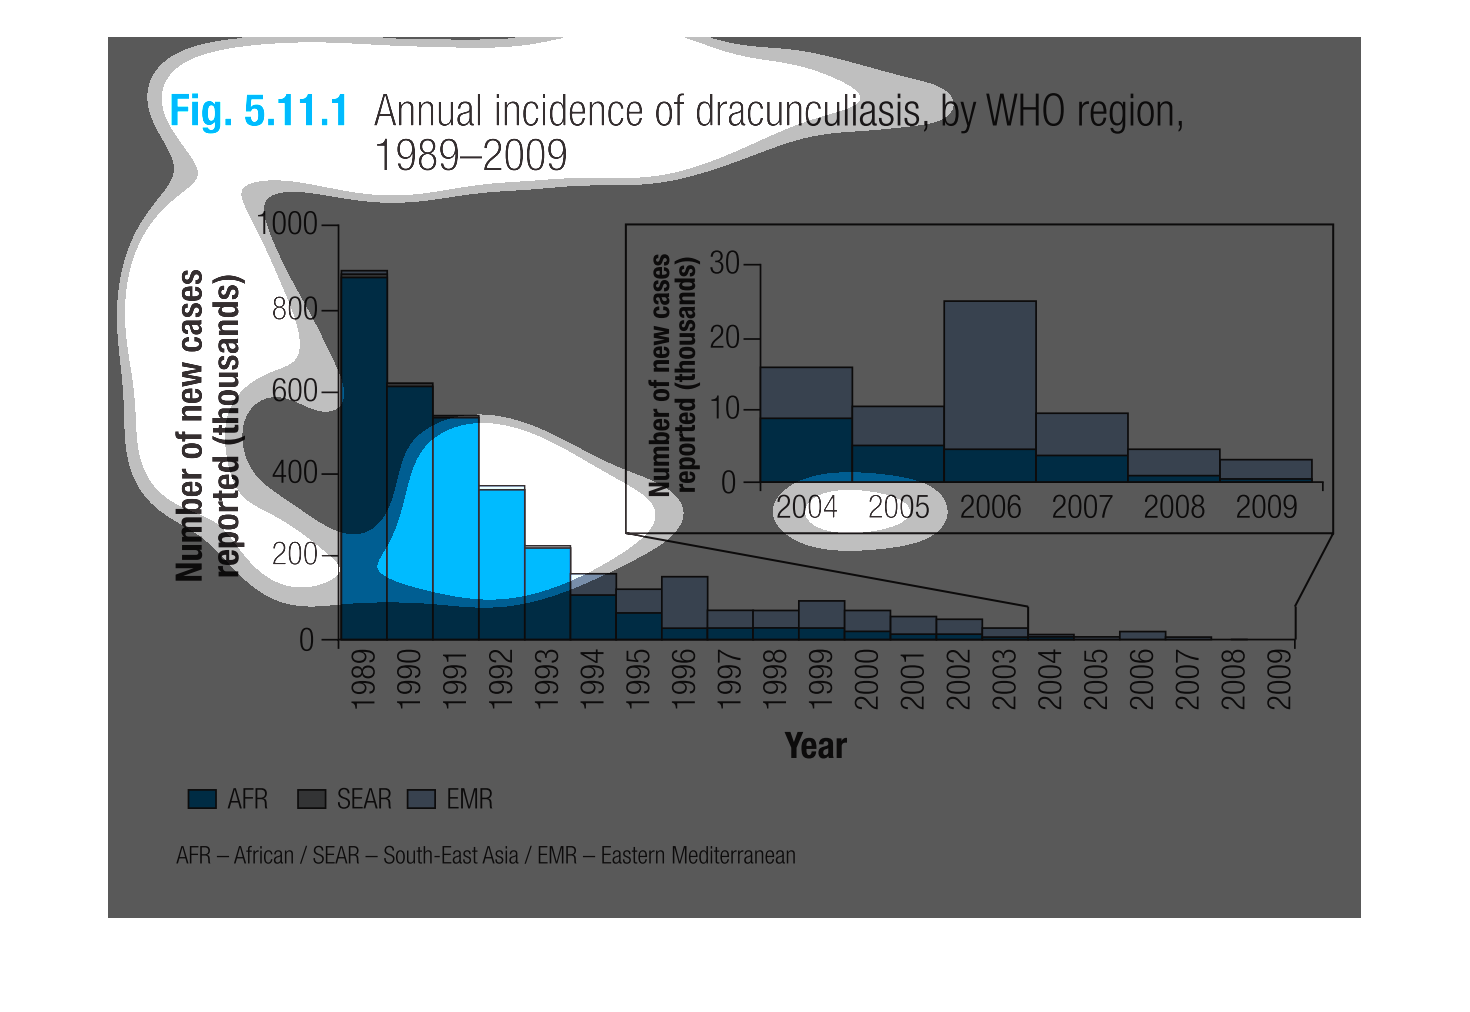
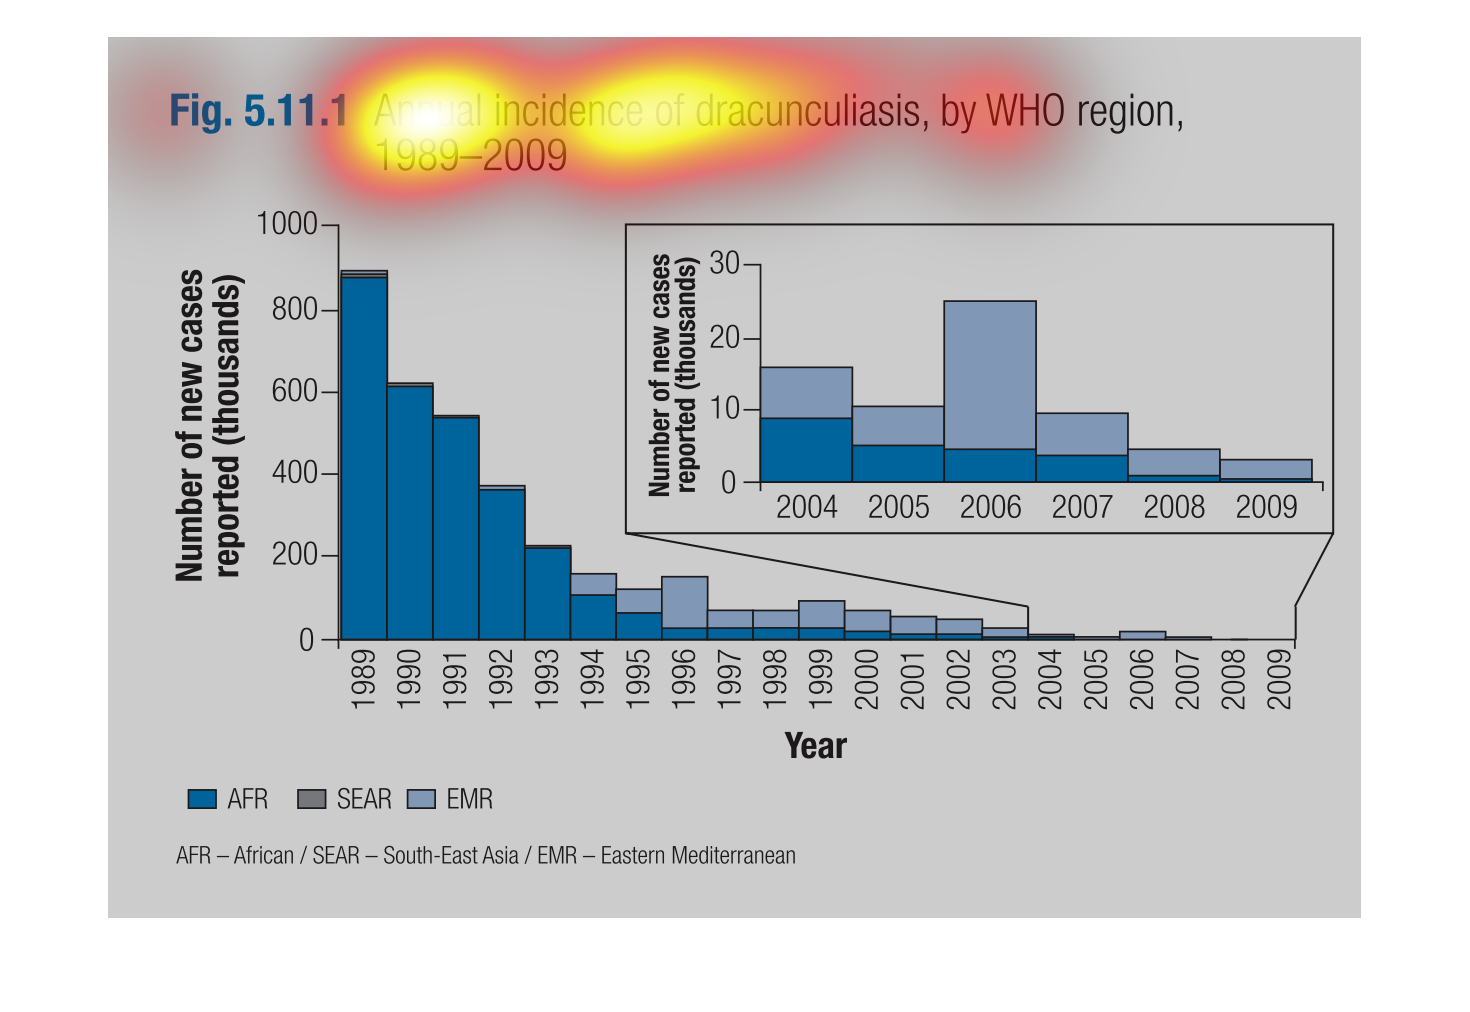
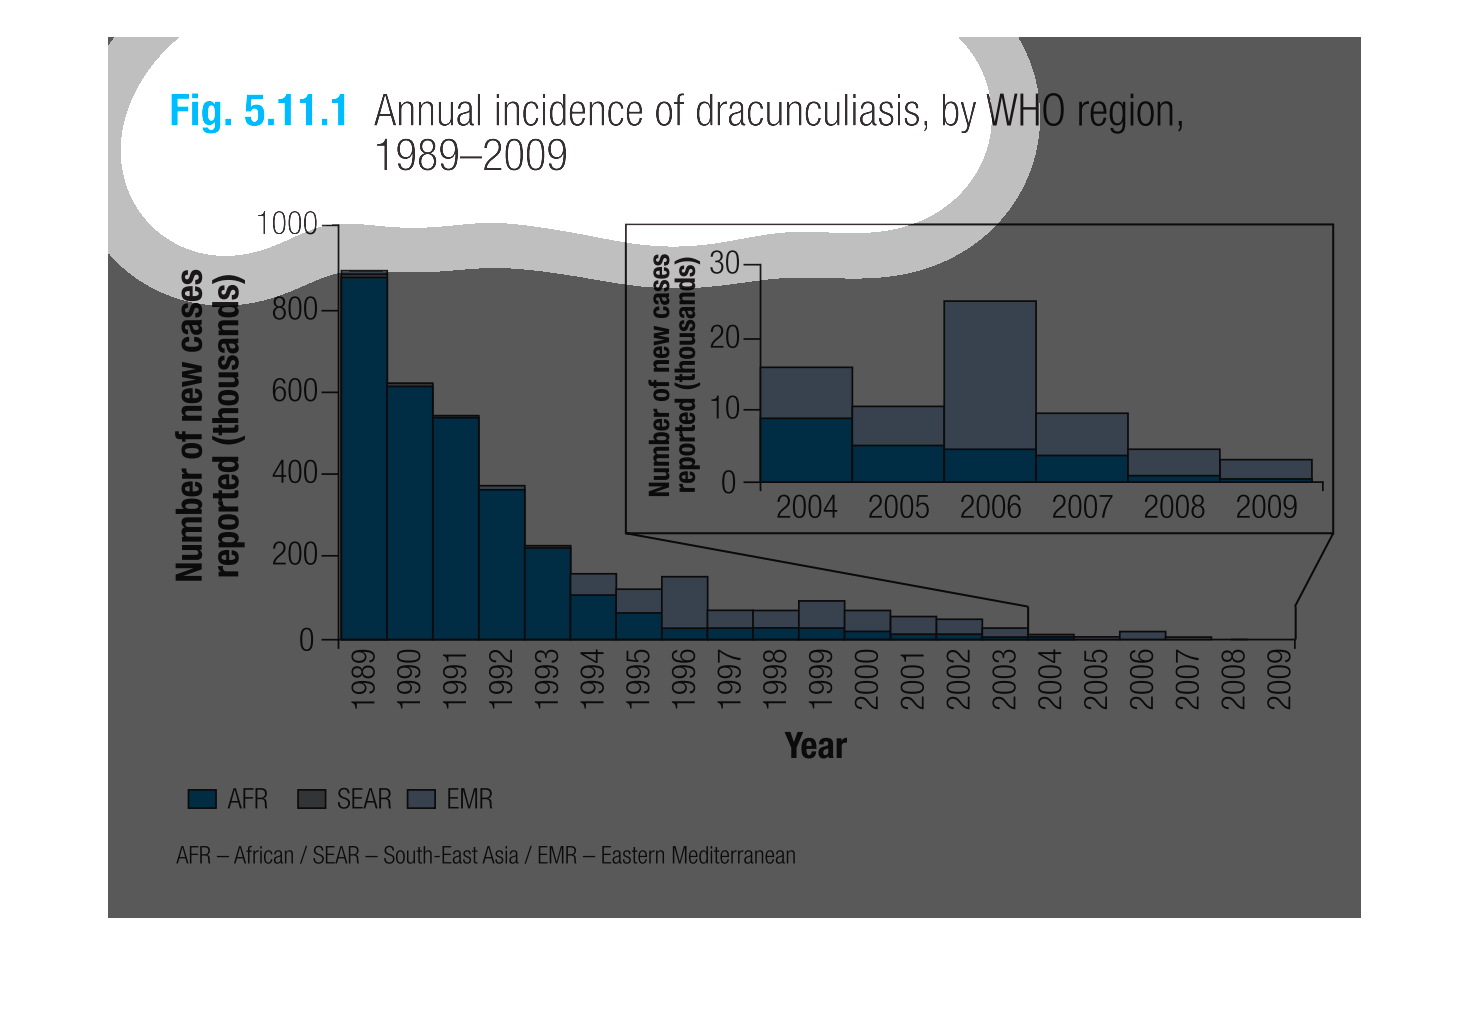
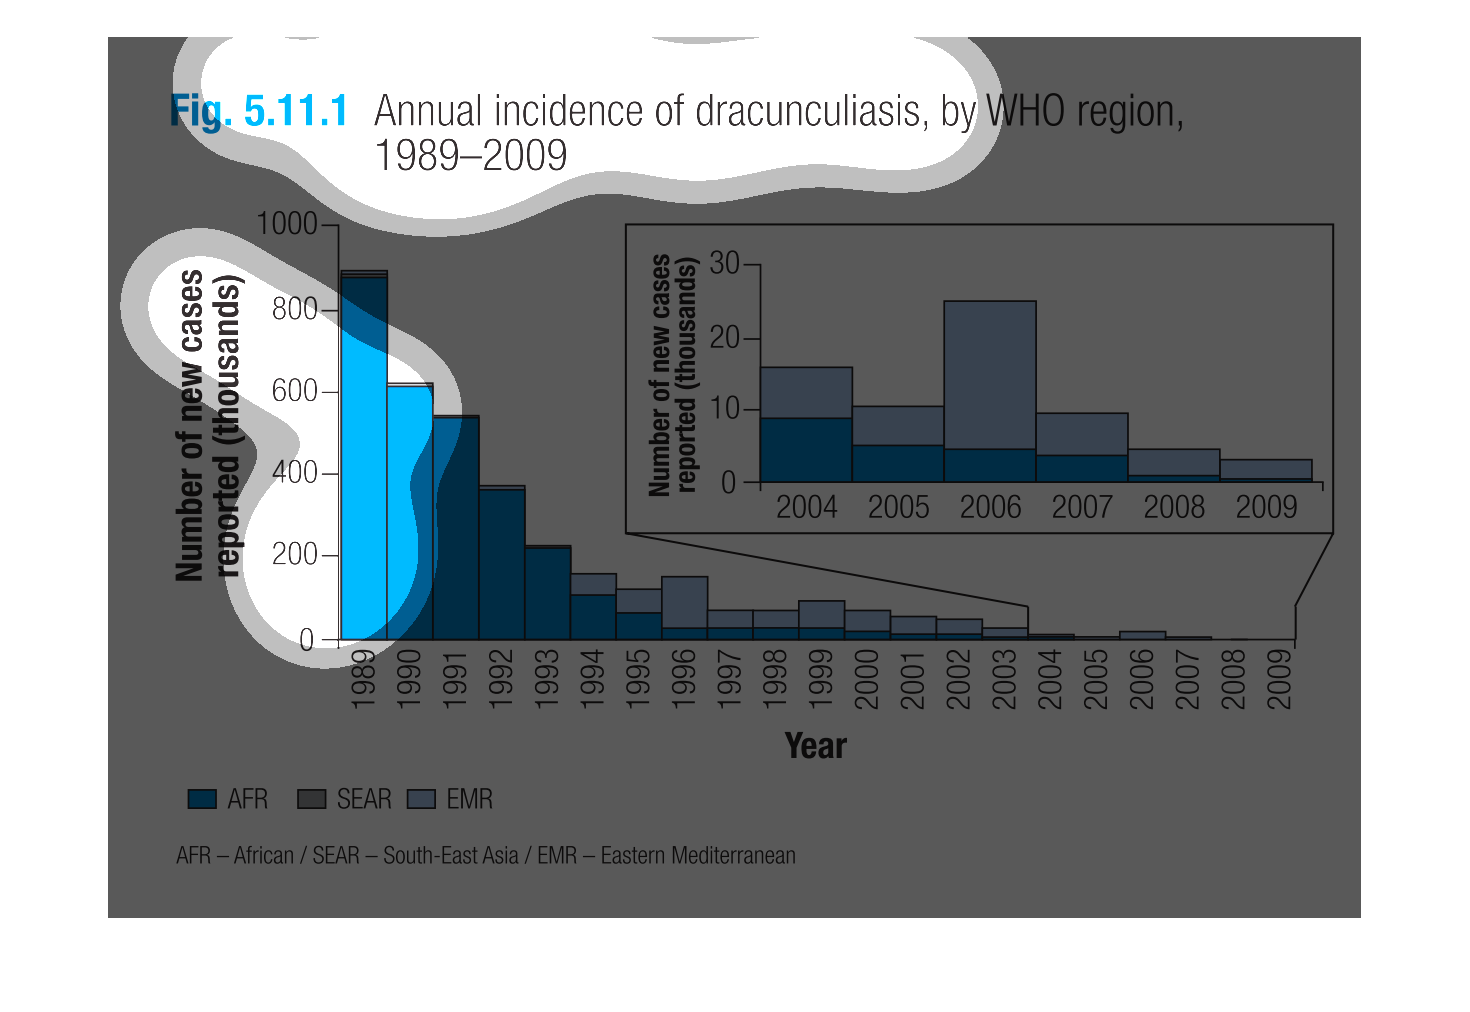
figure 5.11.1 annual incidence of dracunculiasis by WHO region. 1989 through 2009. Y axis
is number of new cases reported by thousands, X axis shows during which years as previously
mentioned. We see a rapid decline between 1989 and 1994, a continued drop but at a MUCH slower
rate to almost non existence
The graph is a bar graph depicting the annual number of incidents of dracunculiasis during
the years from 1989 to 2009. The incident numbers are broken down by region as defined by
the WHO.
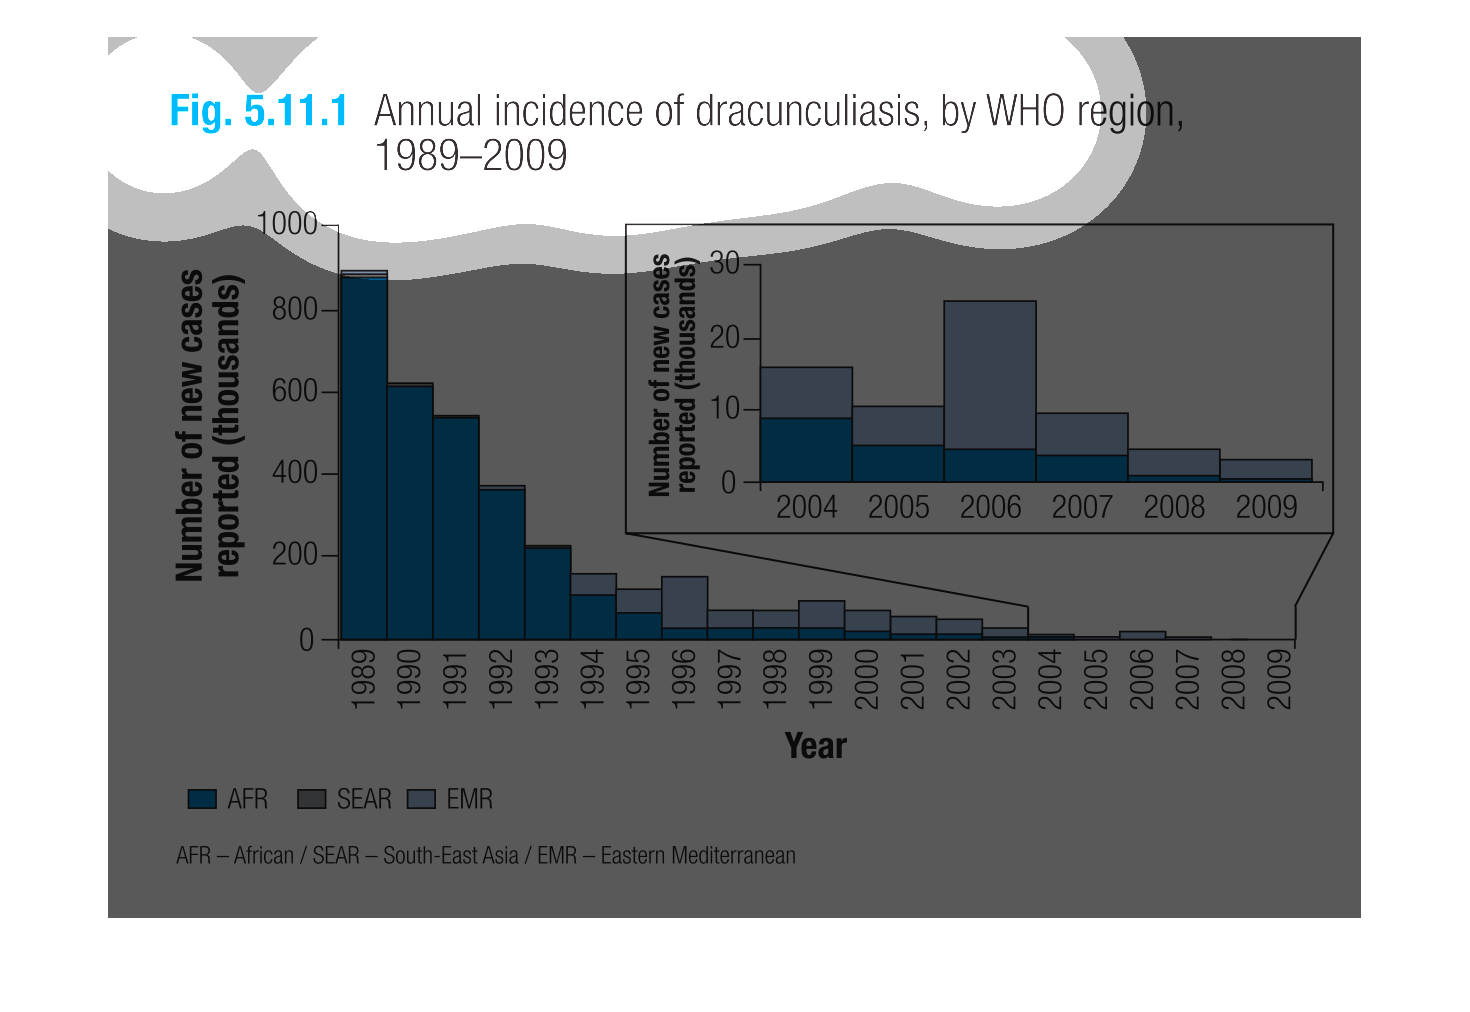
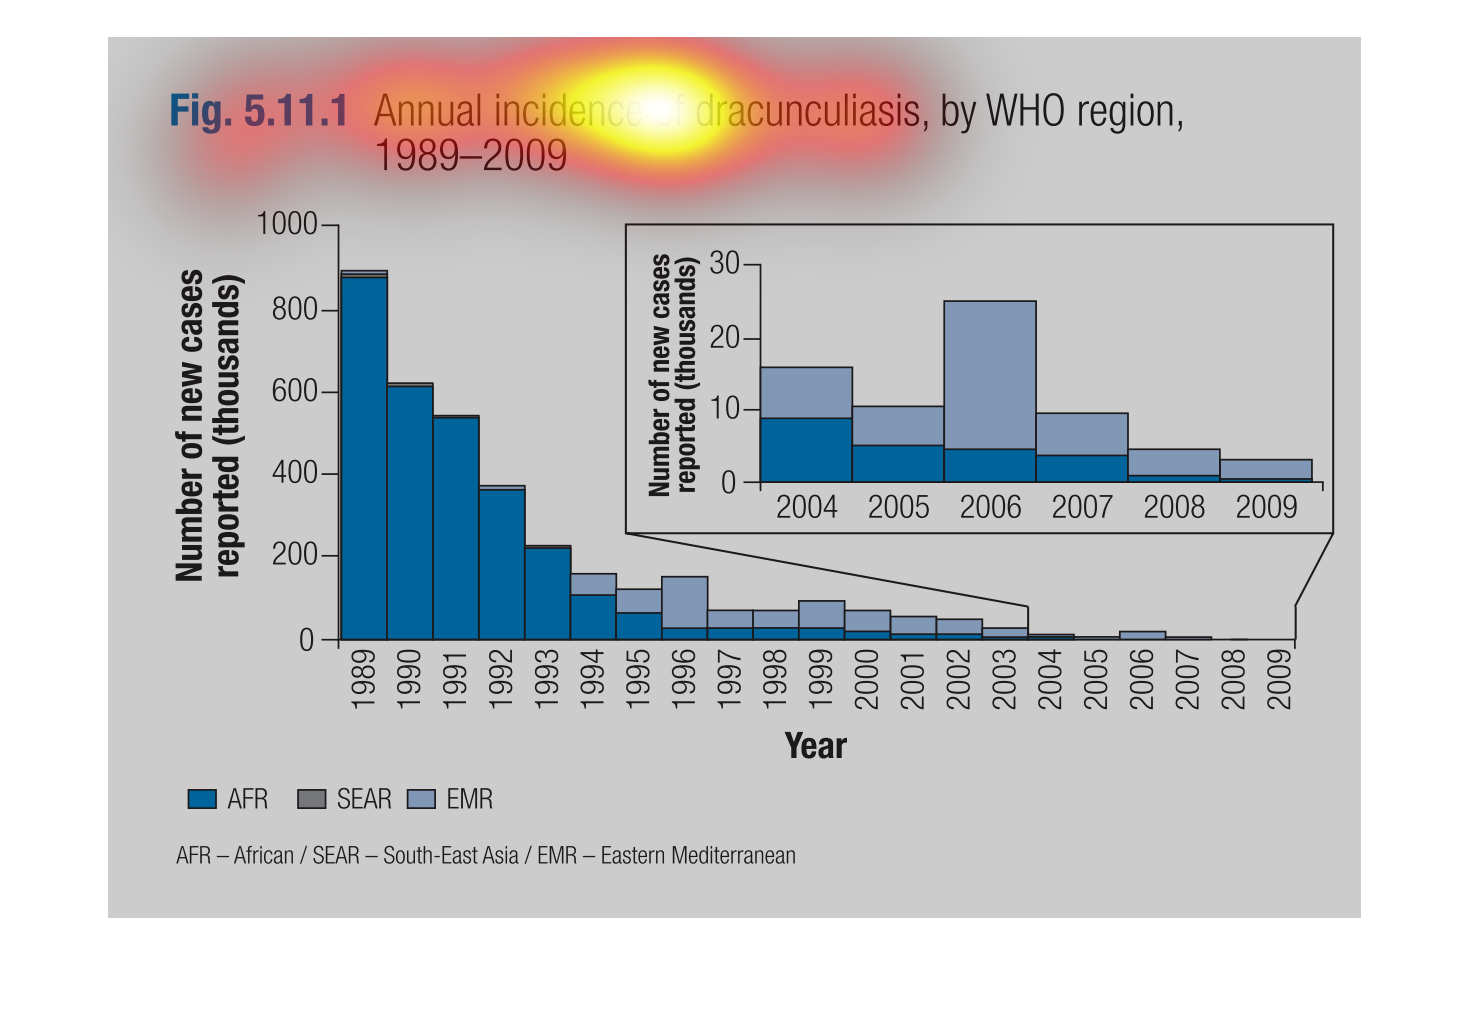
This is a graph of the annual incidences of  dracunculiasis by WHO region. The number of cases
has decreased dramatically since 1989, with virtually no cases by 2009.
This handmade chart shows the incidence of dracunculiasis, which I am not sure what it is
or how to interpret this chart since it lists number of days
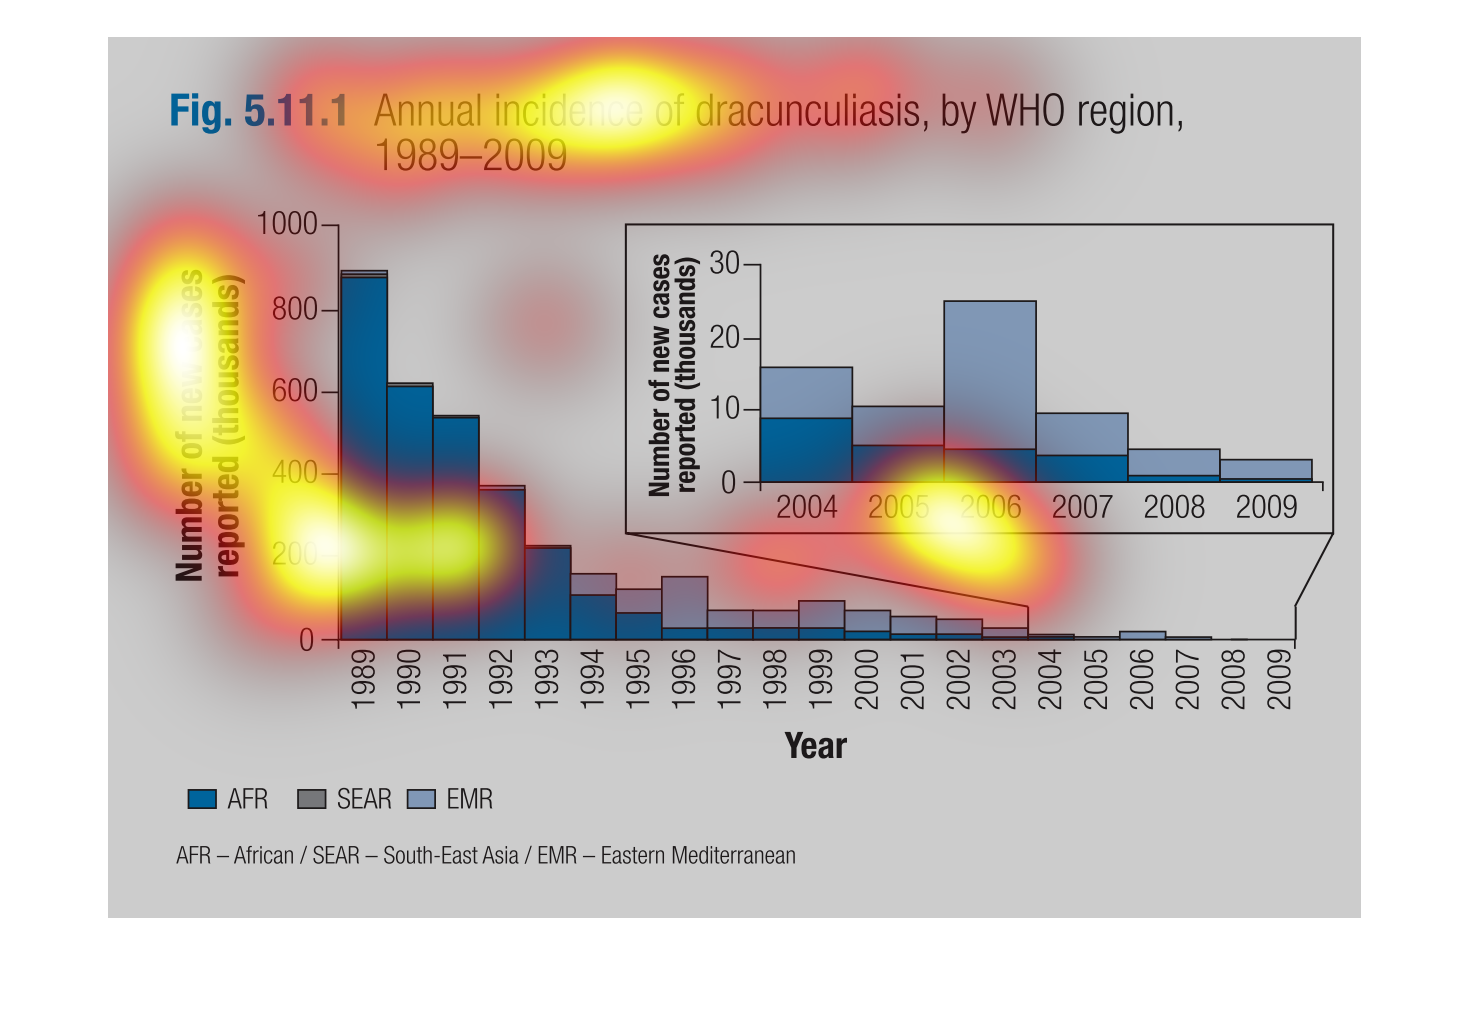
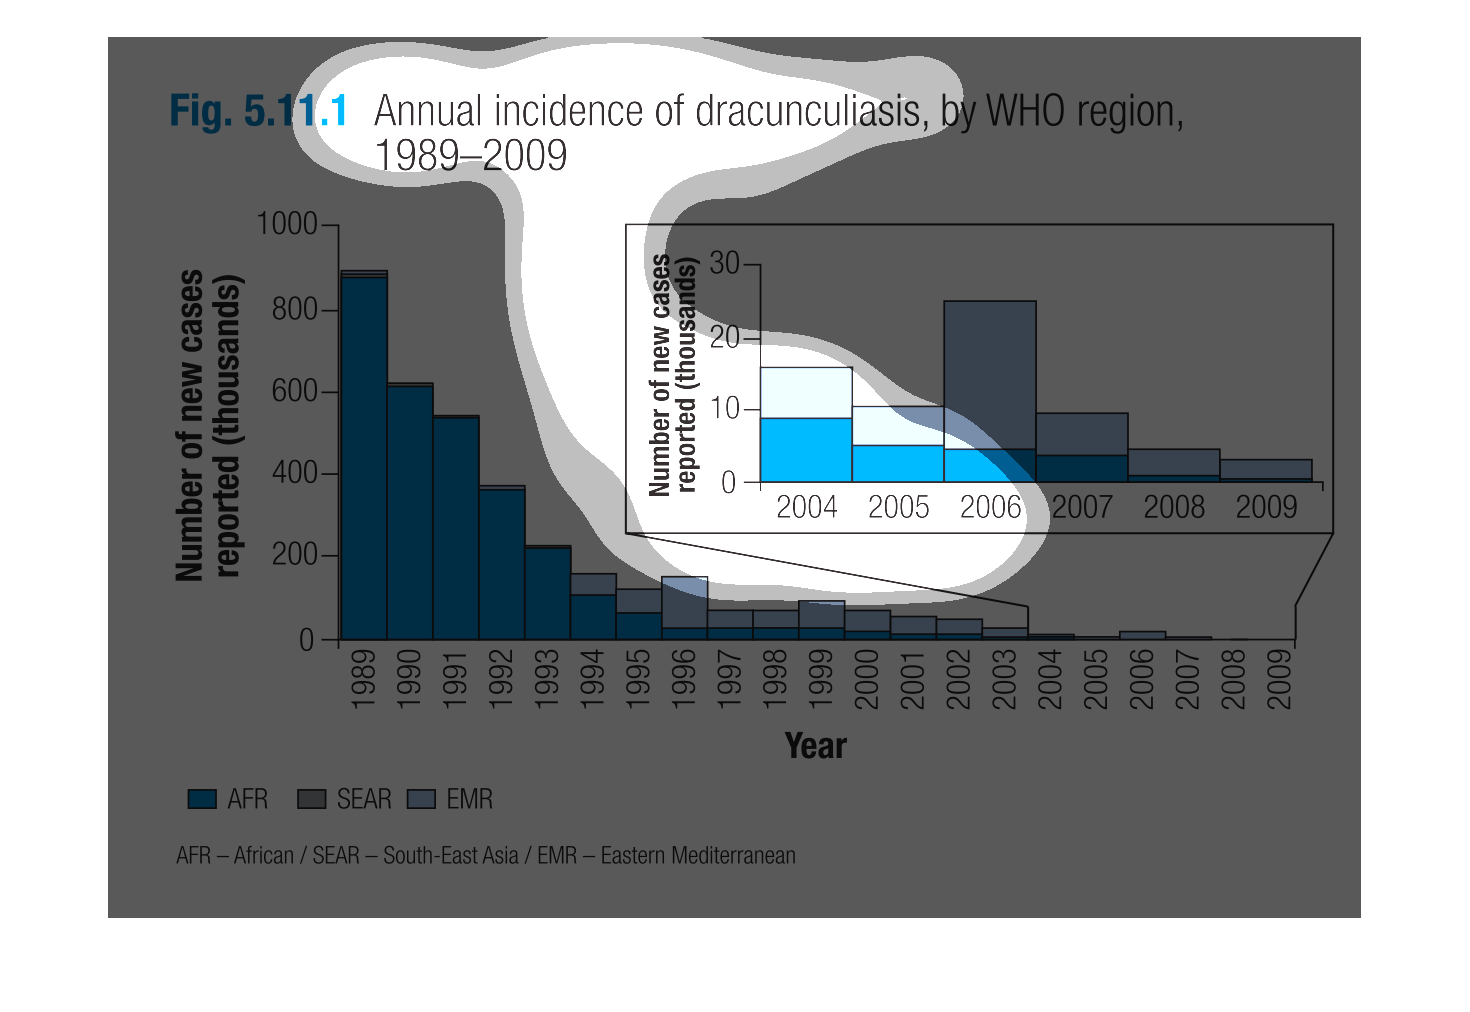
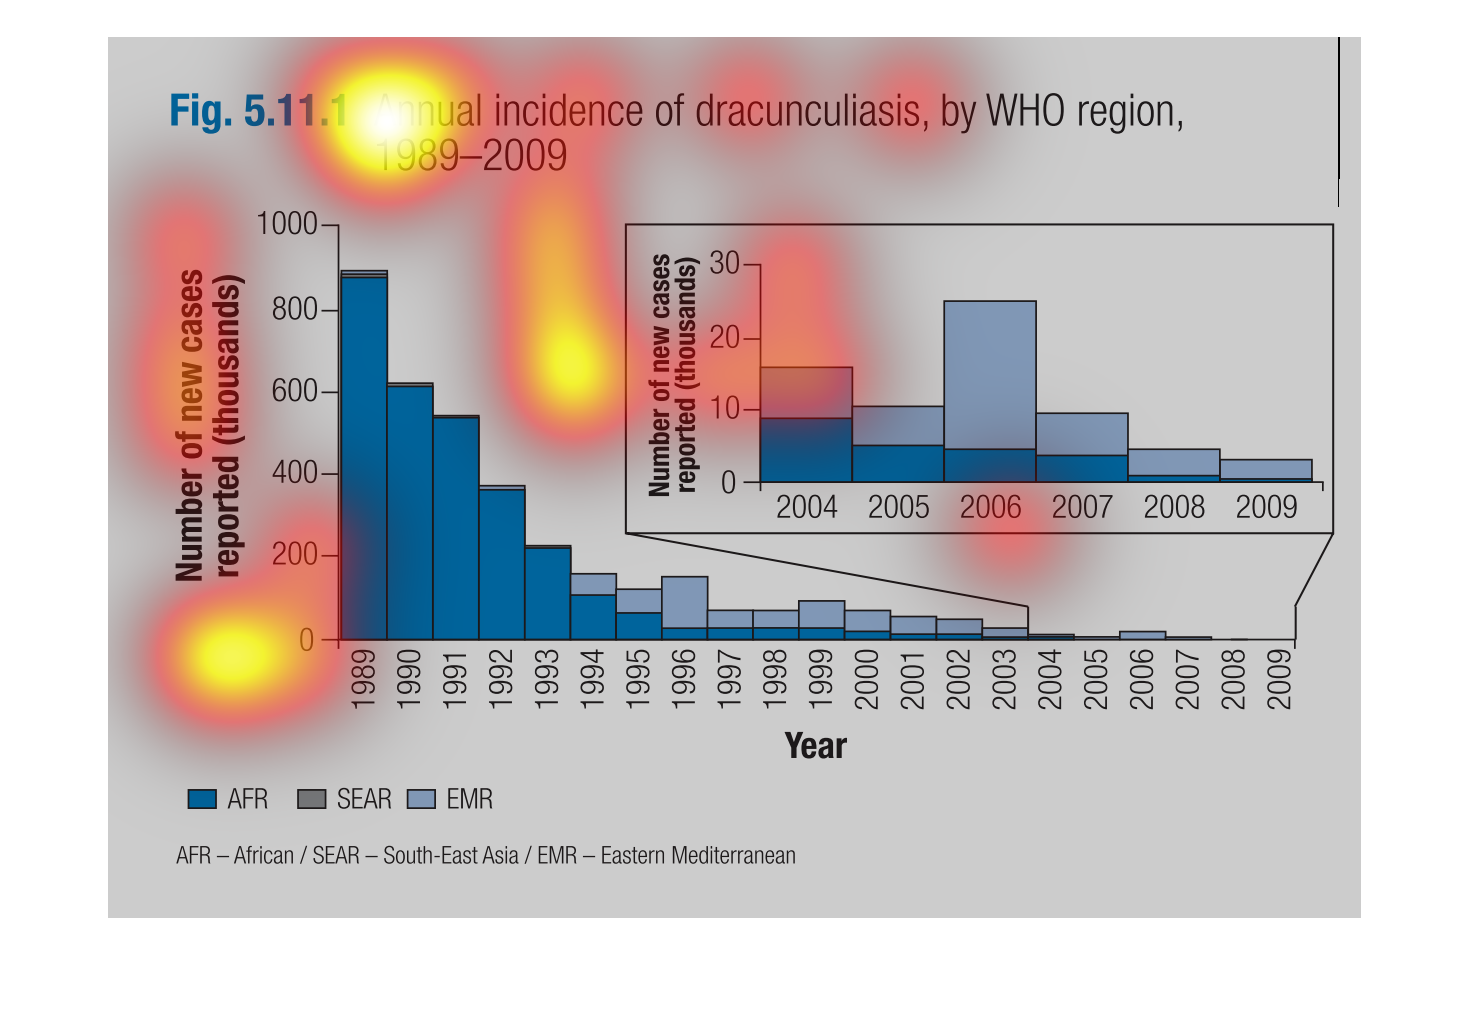
The image on the left hand side shows the dramatic decrease of the annual incidents of dracunculiasis
from 1989 through 2009.  For the first decade of this experiment this disease was common,
however it has dramatically decreased.  However, there was a small spike in 2006 that probably
got people worried it would get more attraction but that period did not last very long.
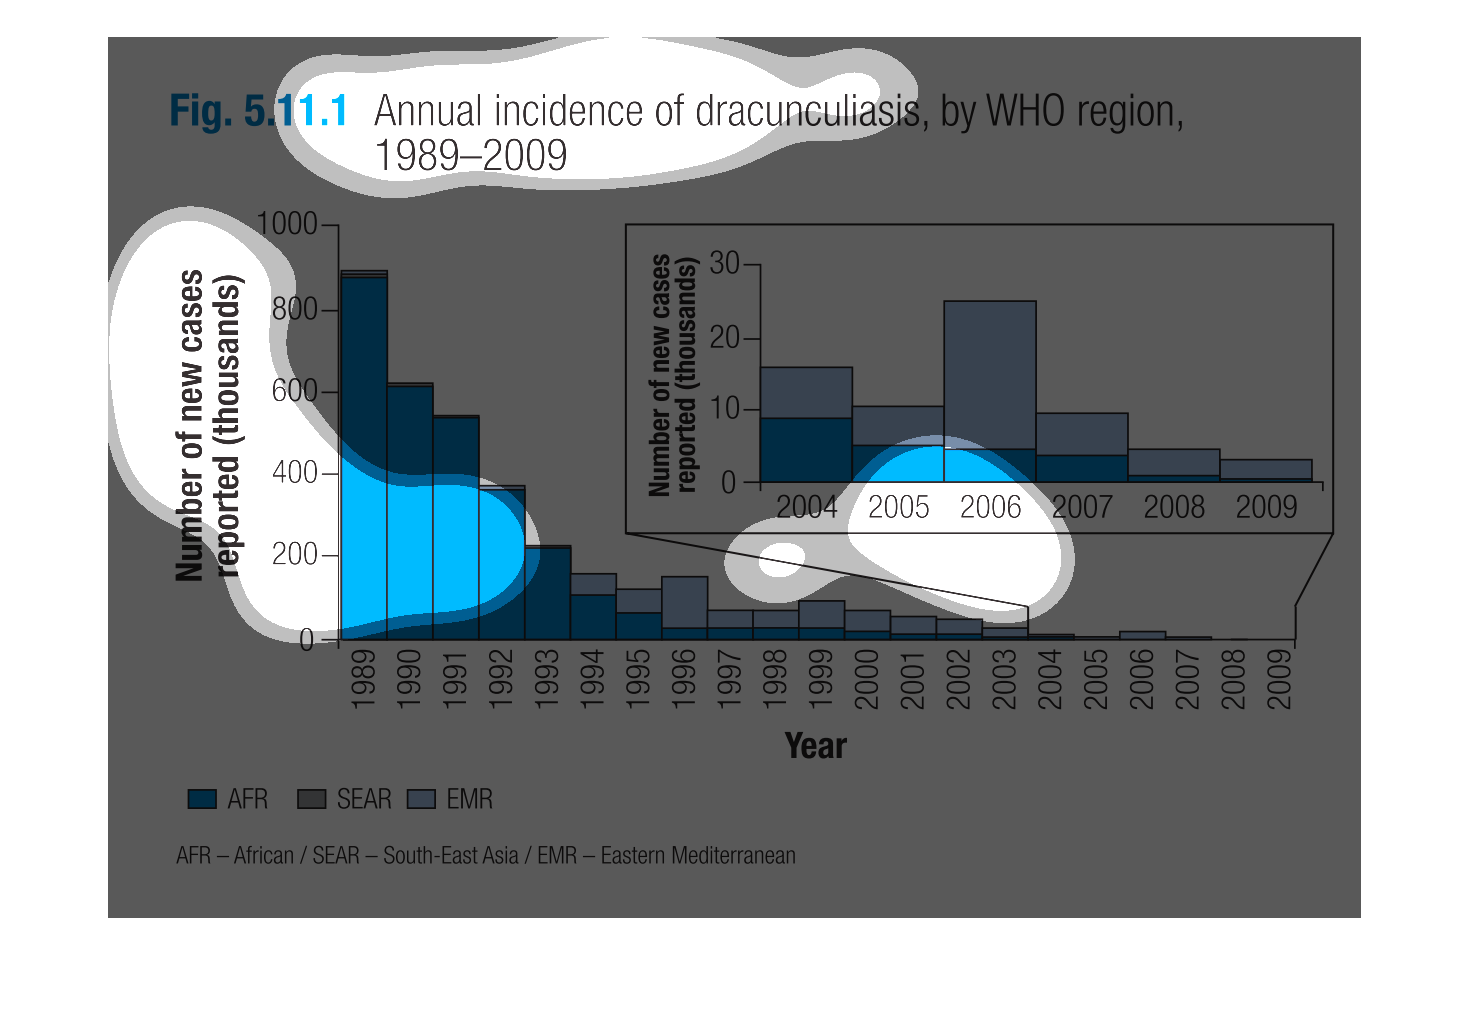
This chart describes annual incidence of dracunculiasis, by WHO region for the years 1989
through 2009. Categories on the chart include AFR, SEAR, and EMR.
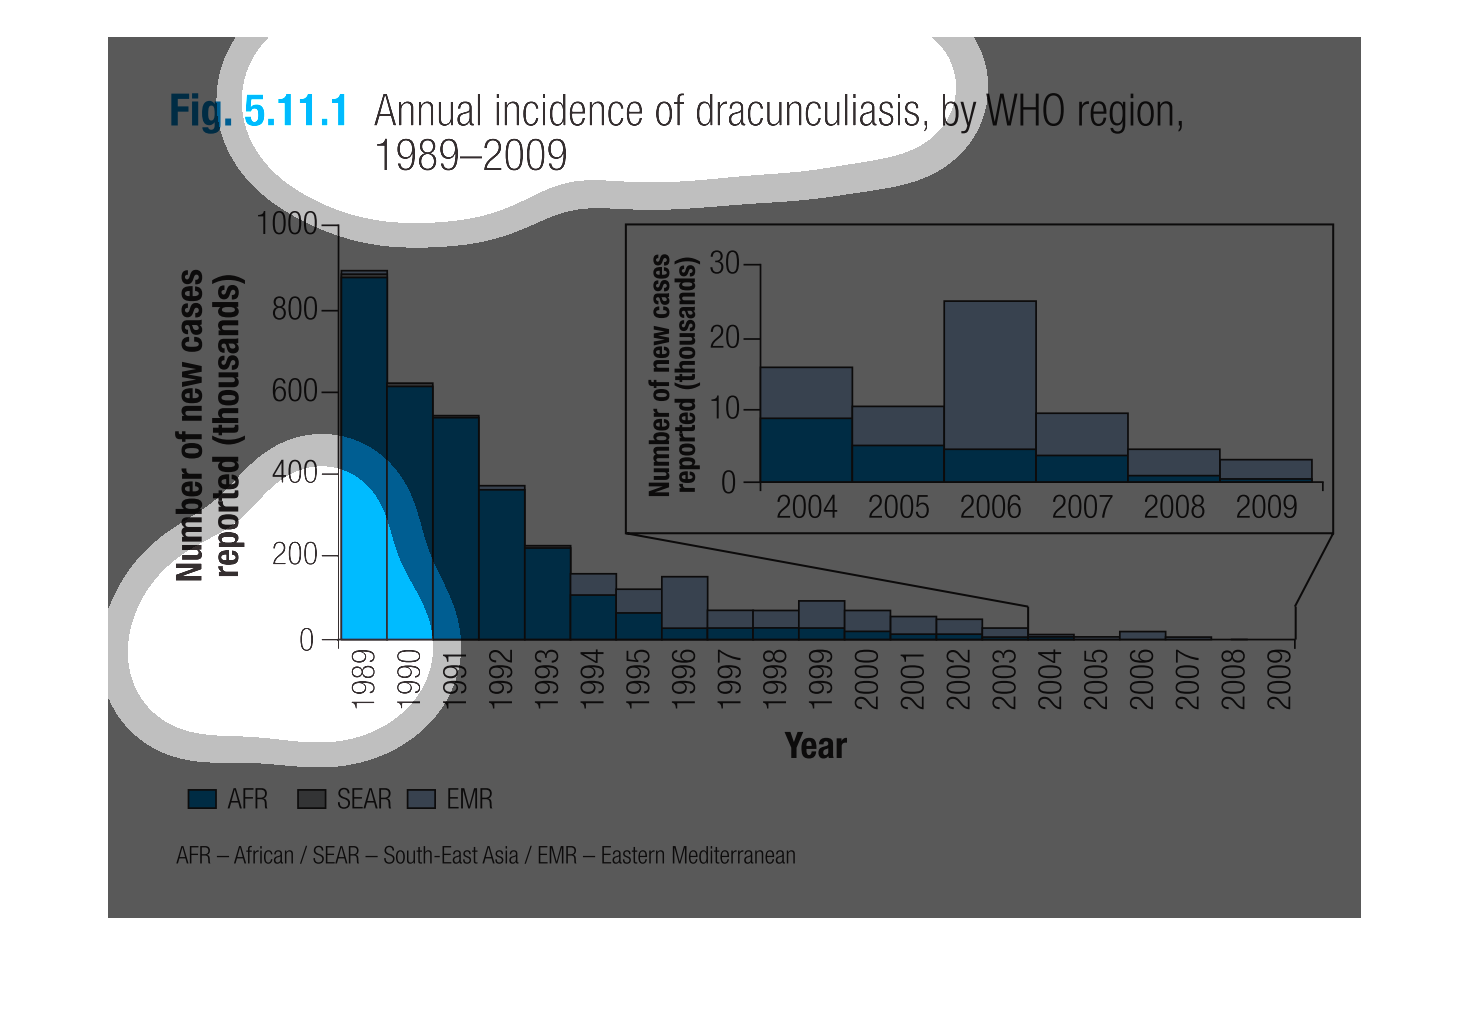
This chart shows the annual incidence of dracunculiasis by WHO region (Africa, Southeast Asia,
and Eastern Mediterranean) from 1989-2009. In 1989 the number of new cases was at its highest
rate at 900,000. By 2009, that number was reduced to less than 10!
This chart describes annual incidence of dracunculiasis, by WHO region, for the years 1989
through 2009. The highest peak on the chart comes in the year 1989.
This graph illustrates annual incidence of draculiasis by WHO region from 1989 to 2009.  It
illustrates the number of new cases reported and the majority are in the AFR and SEAR region.
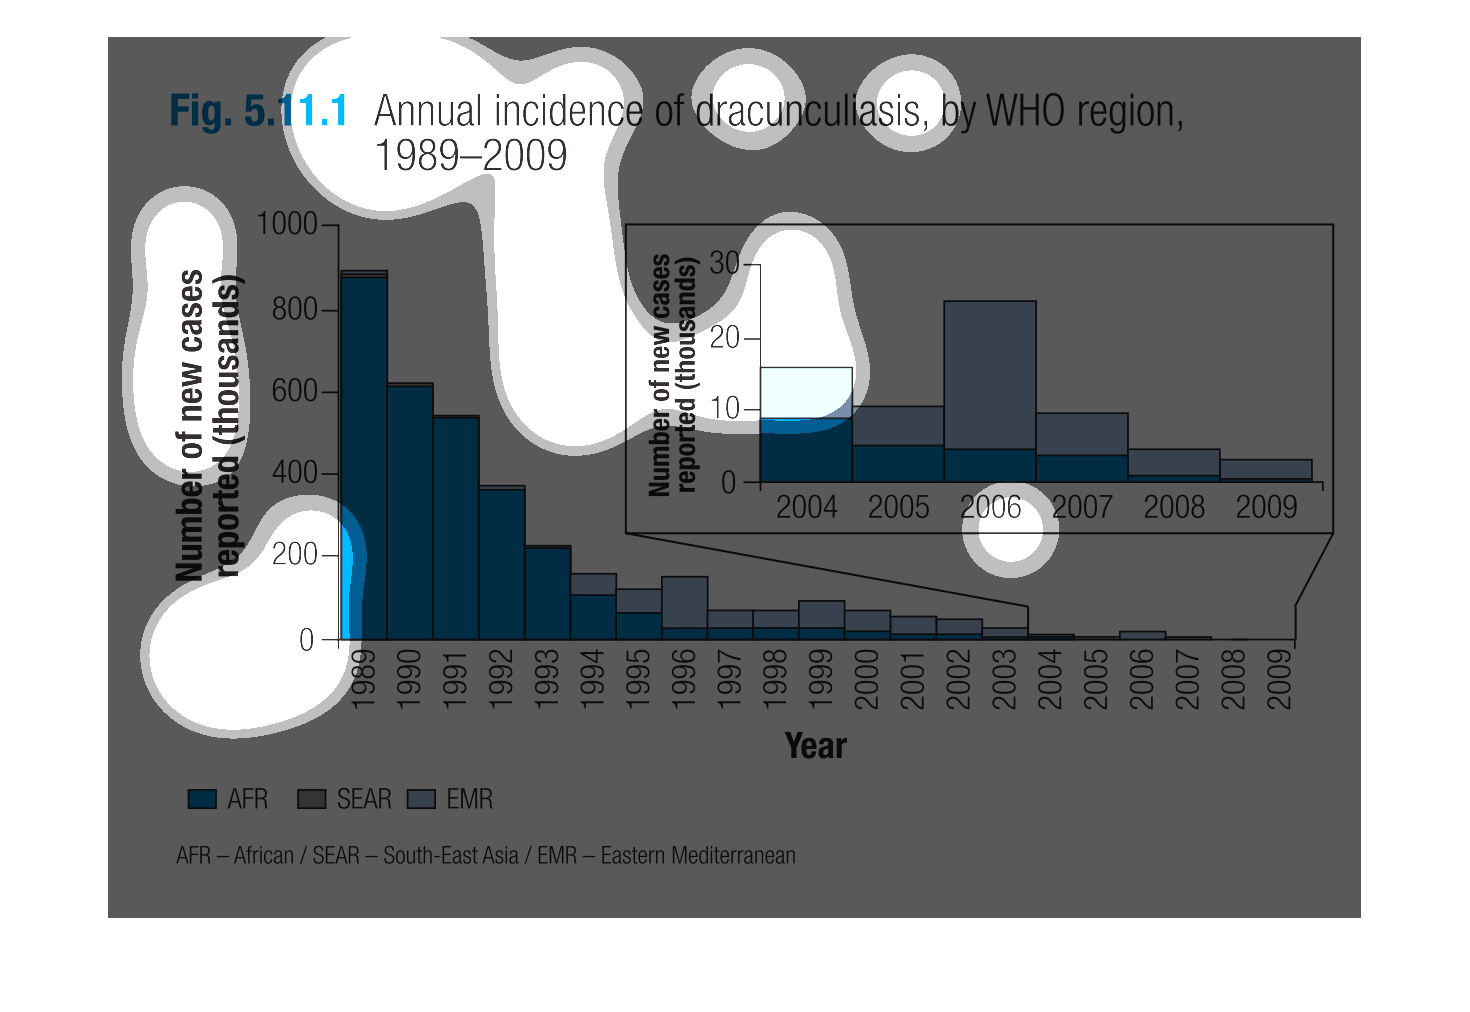
This chart describes the annual incidences of dracunculiasis by region between the 1989 and
2009. Southeast Asia appears to have has the most cases in 1989, though the number of cases
have decreased very much over time.