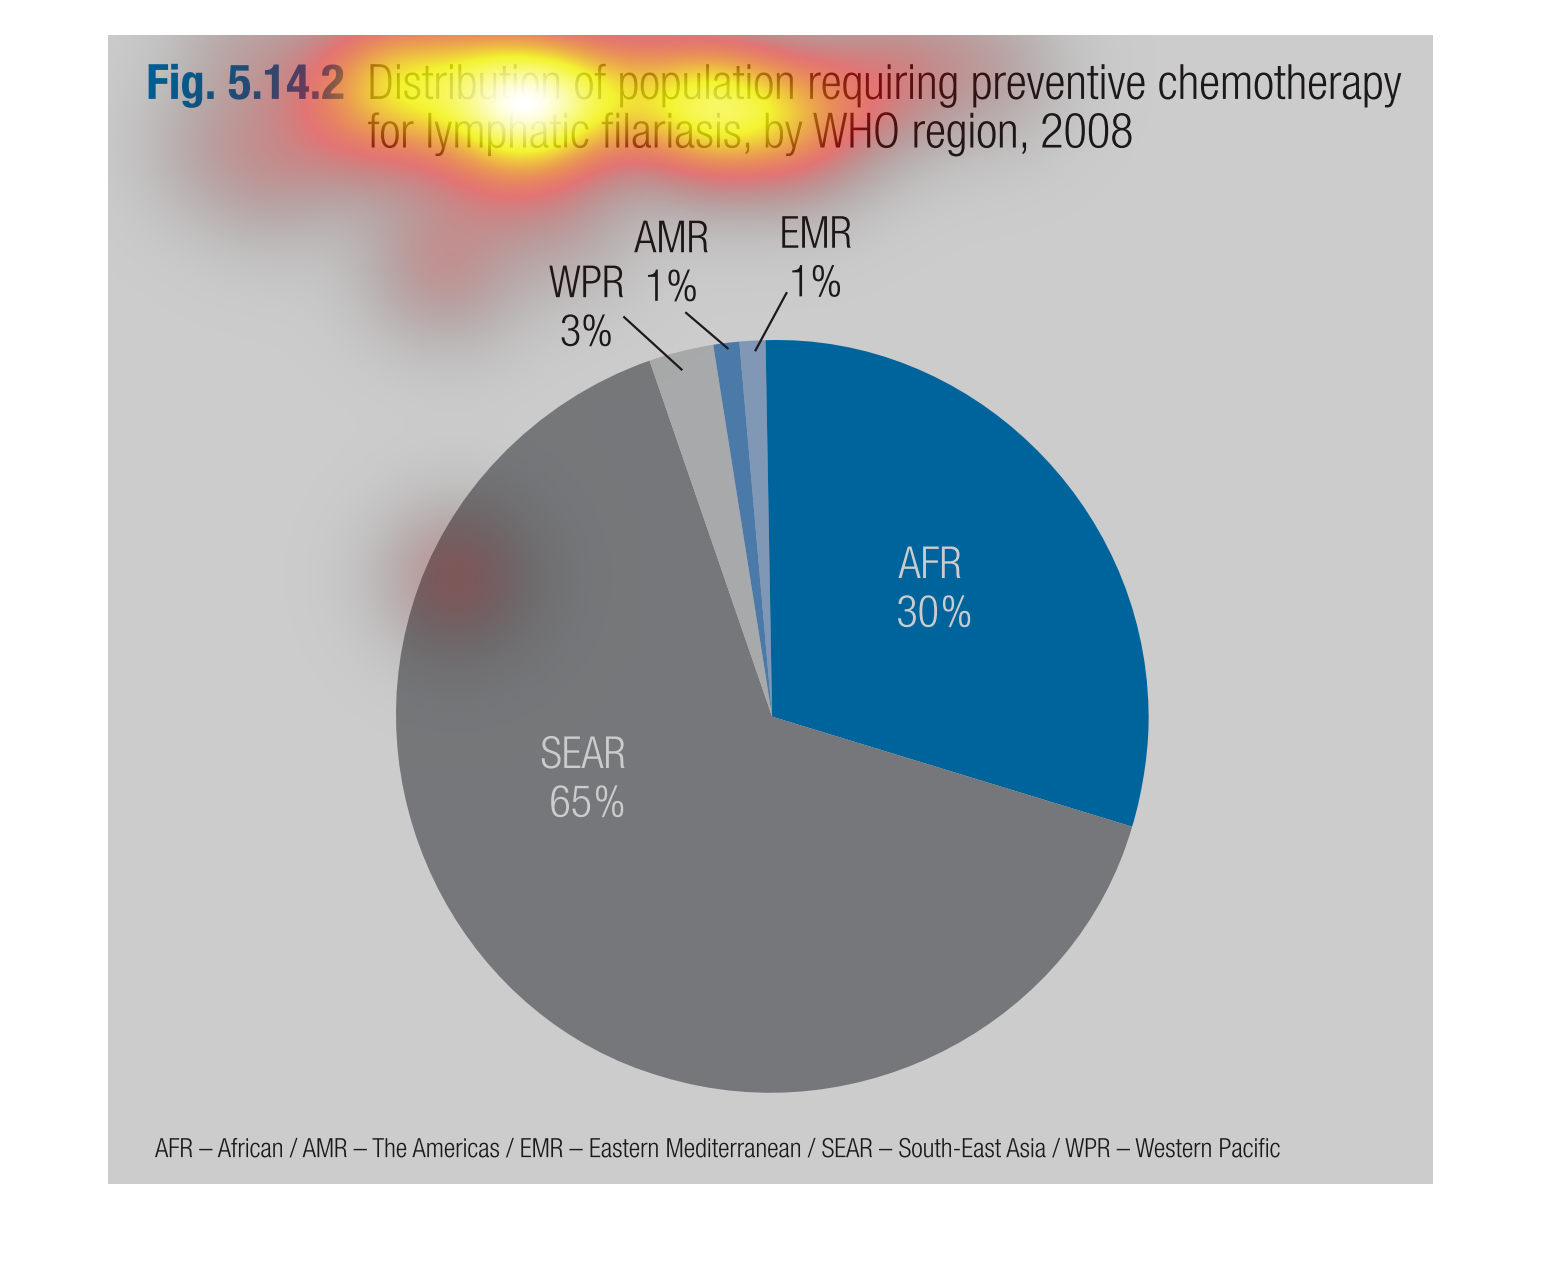
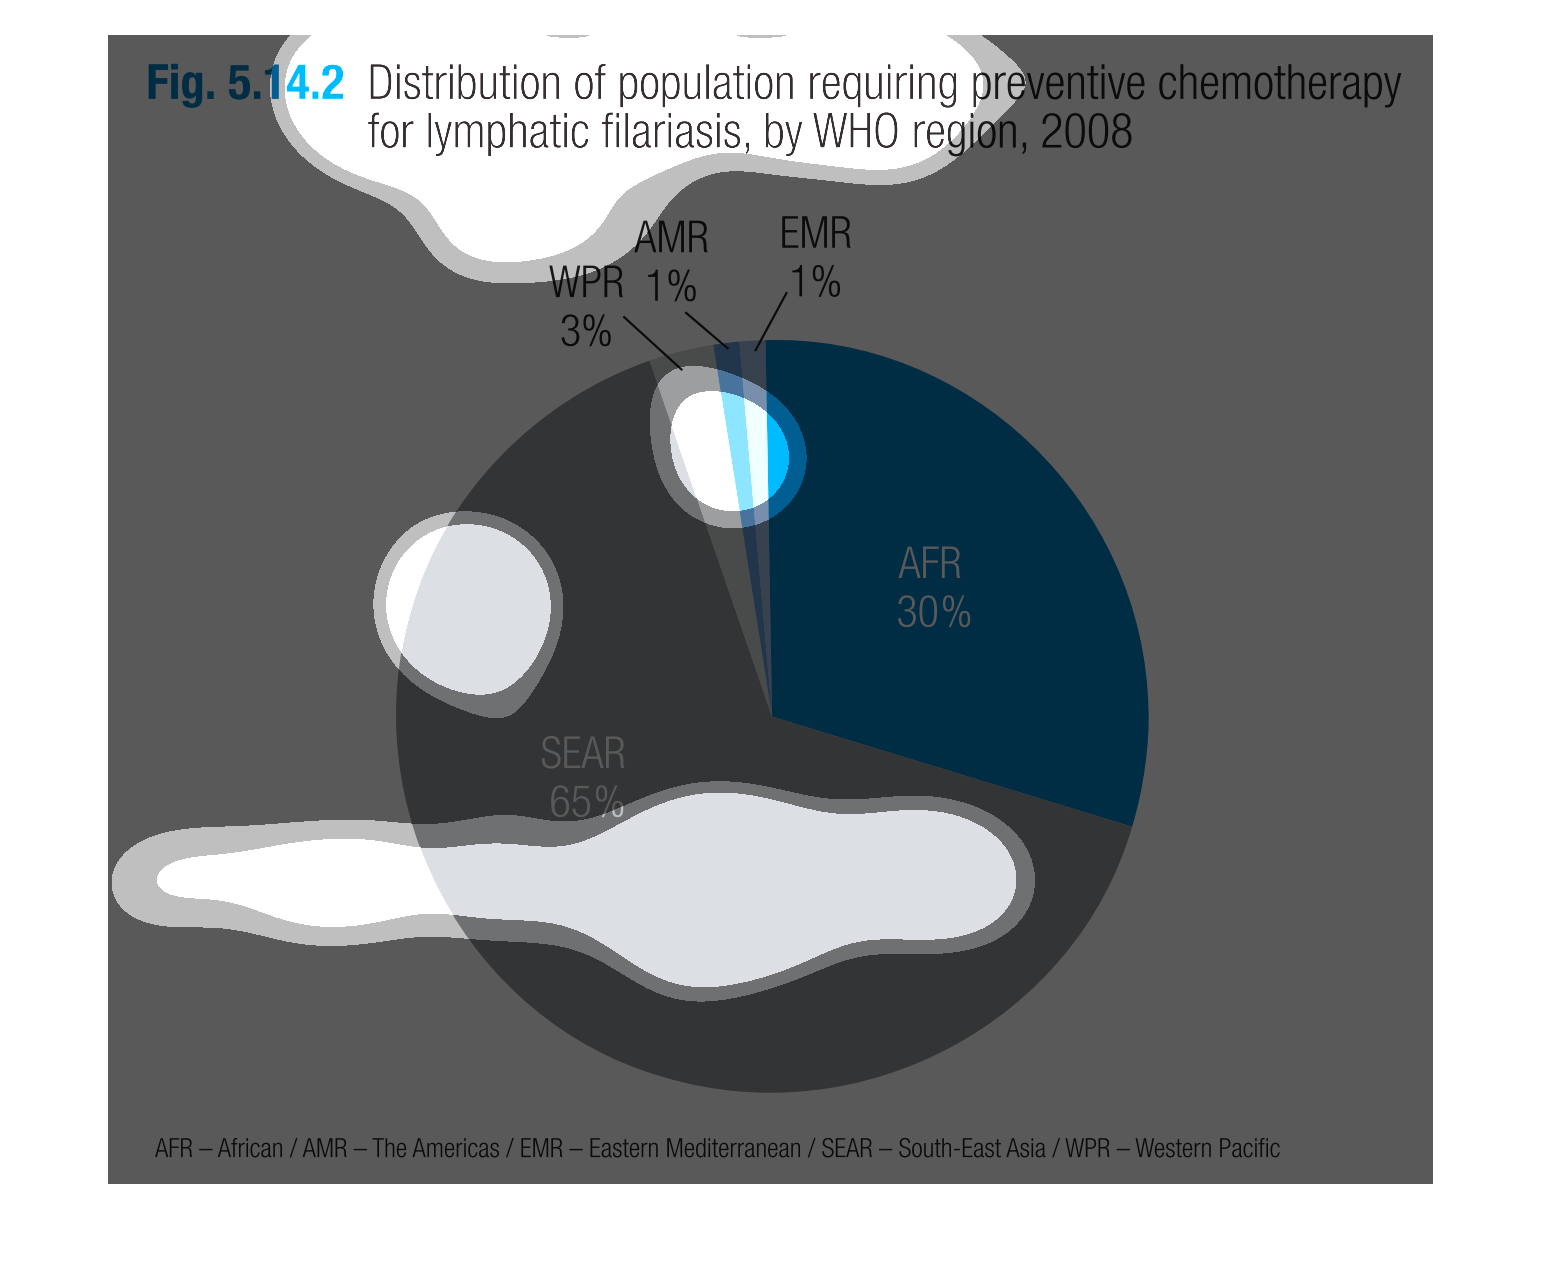
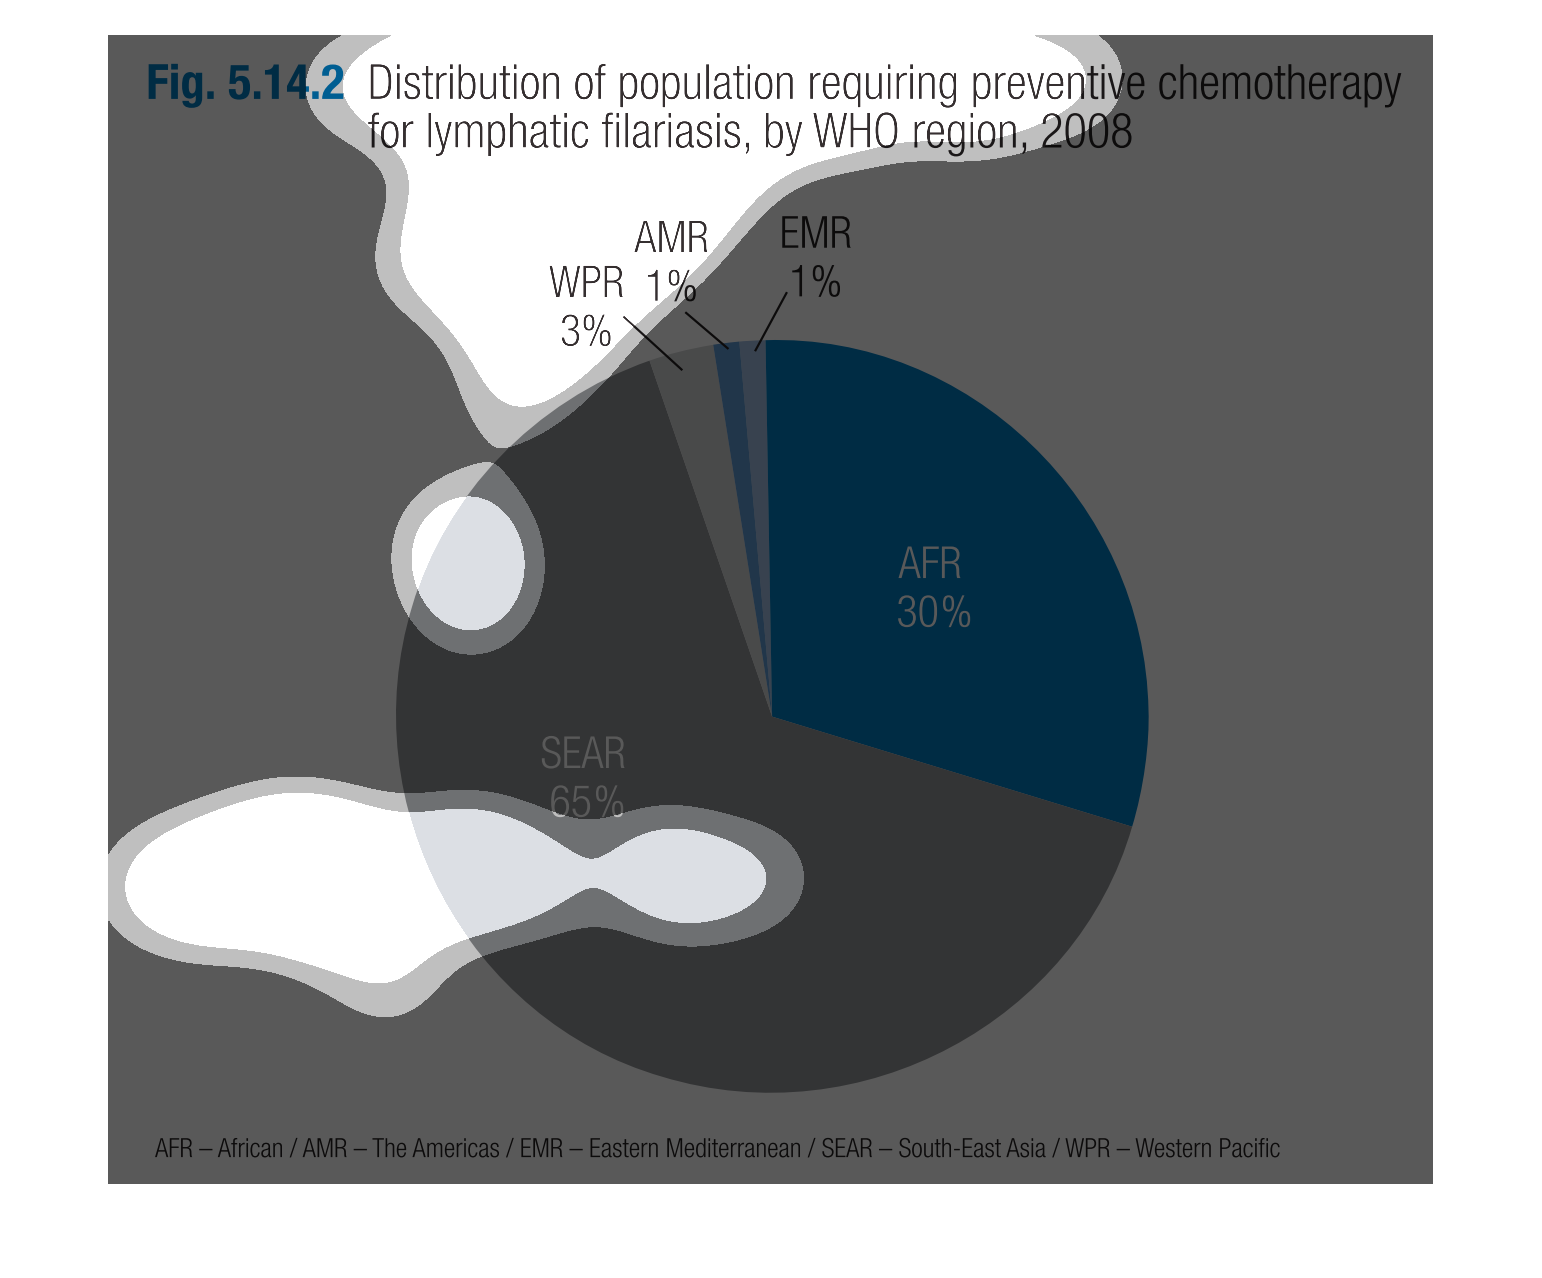
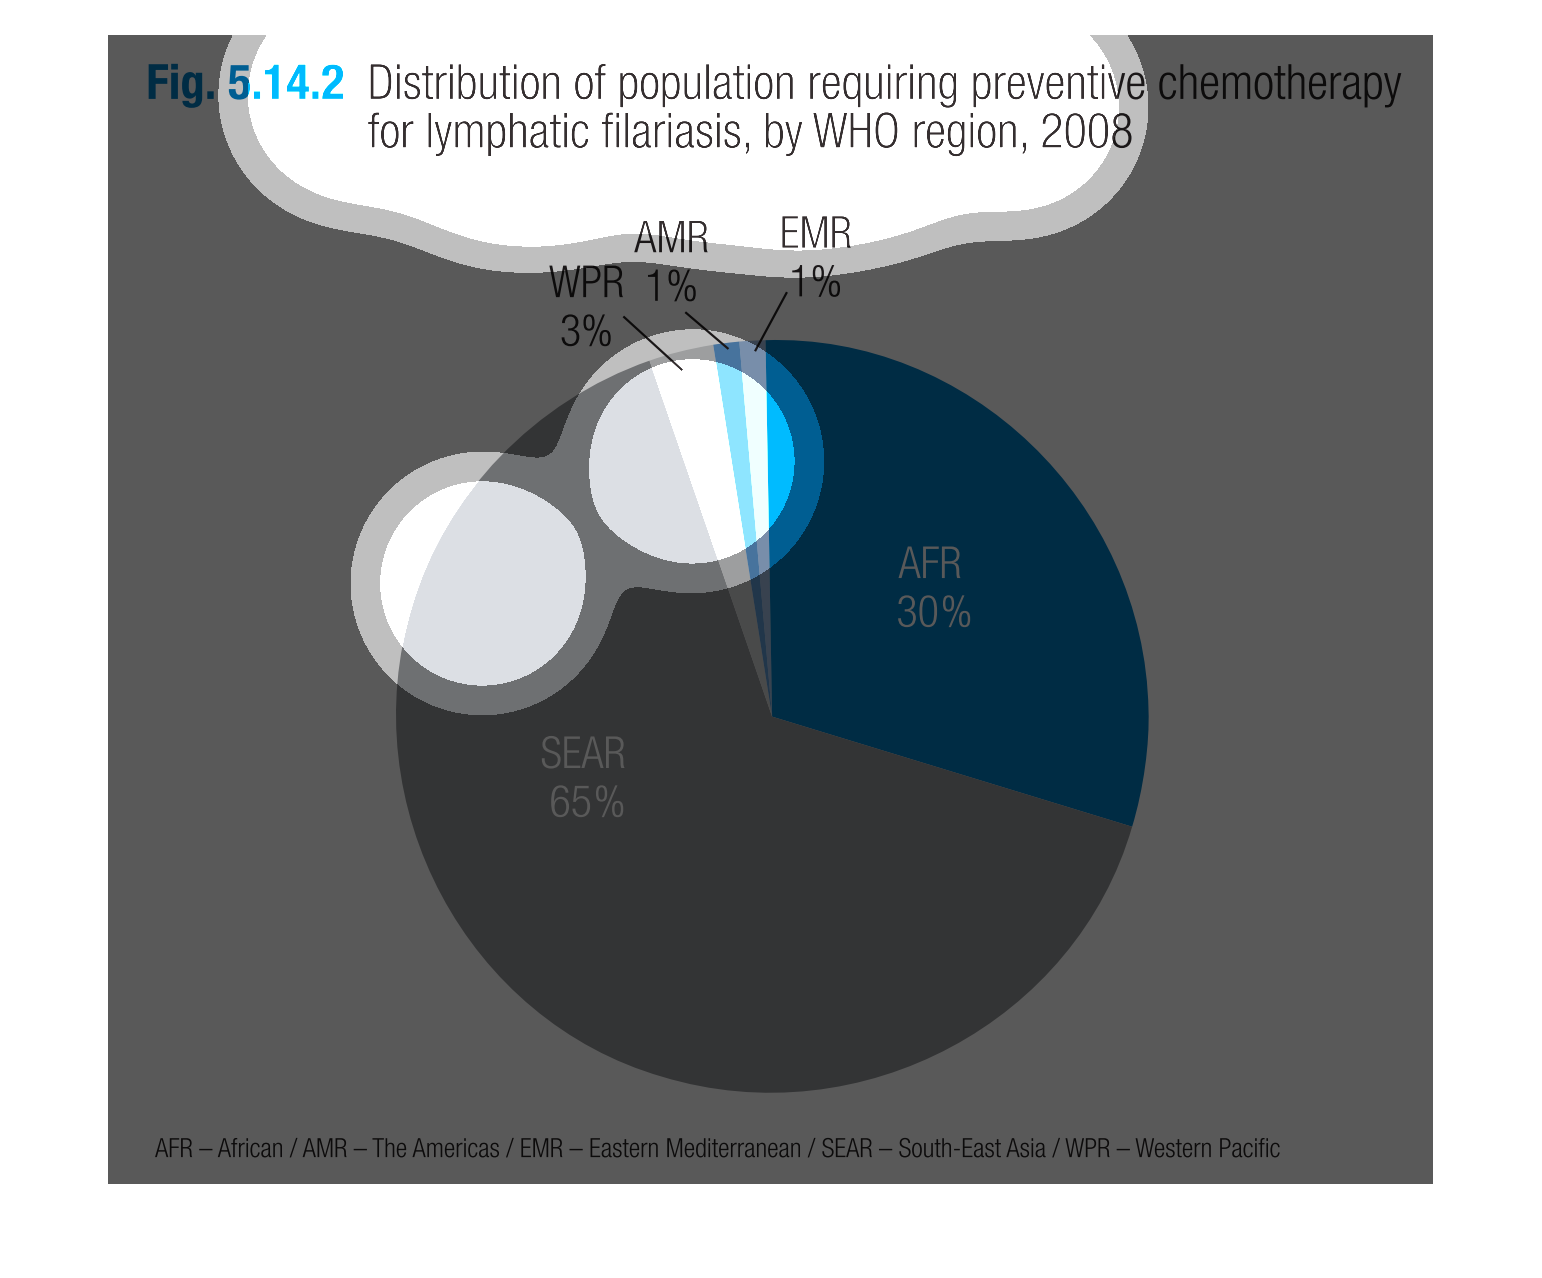
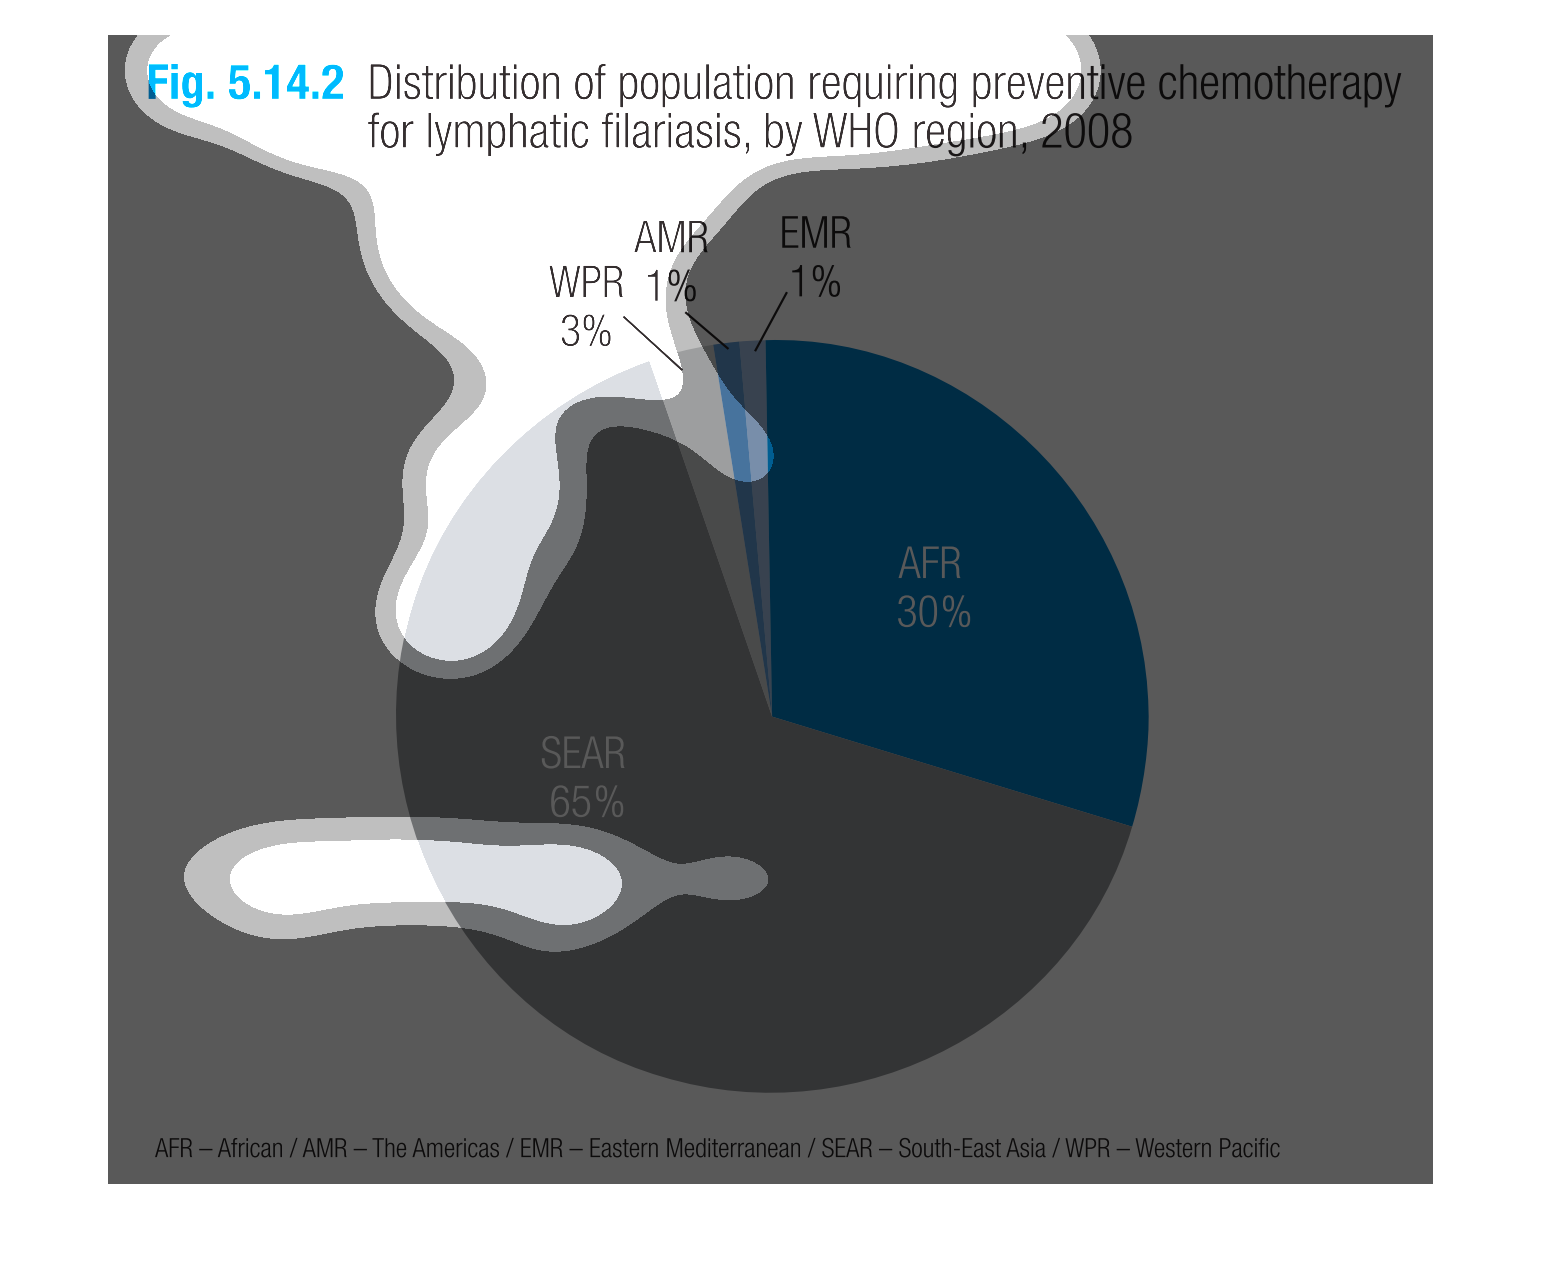
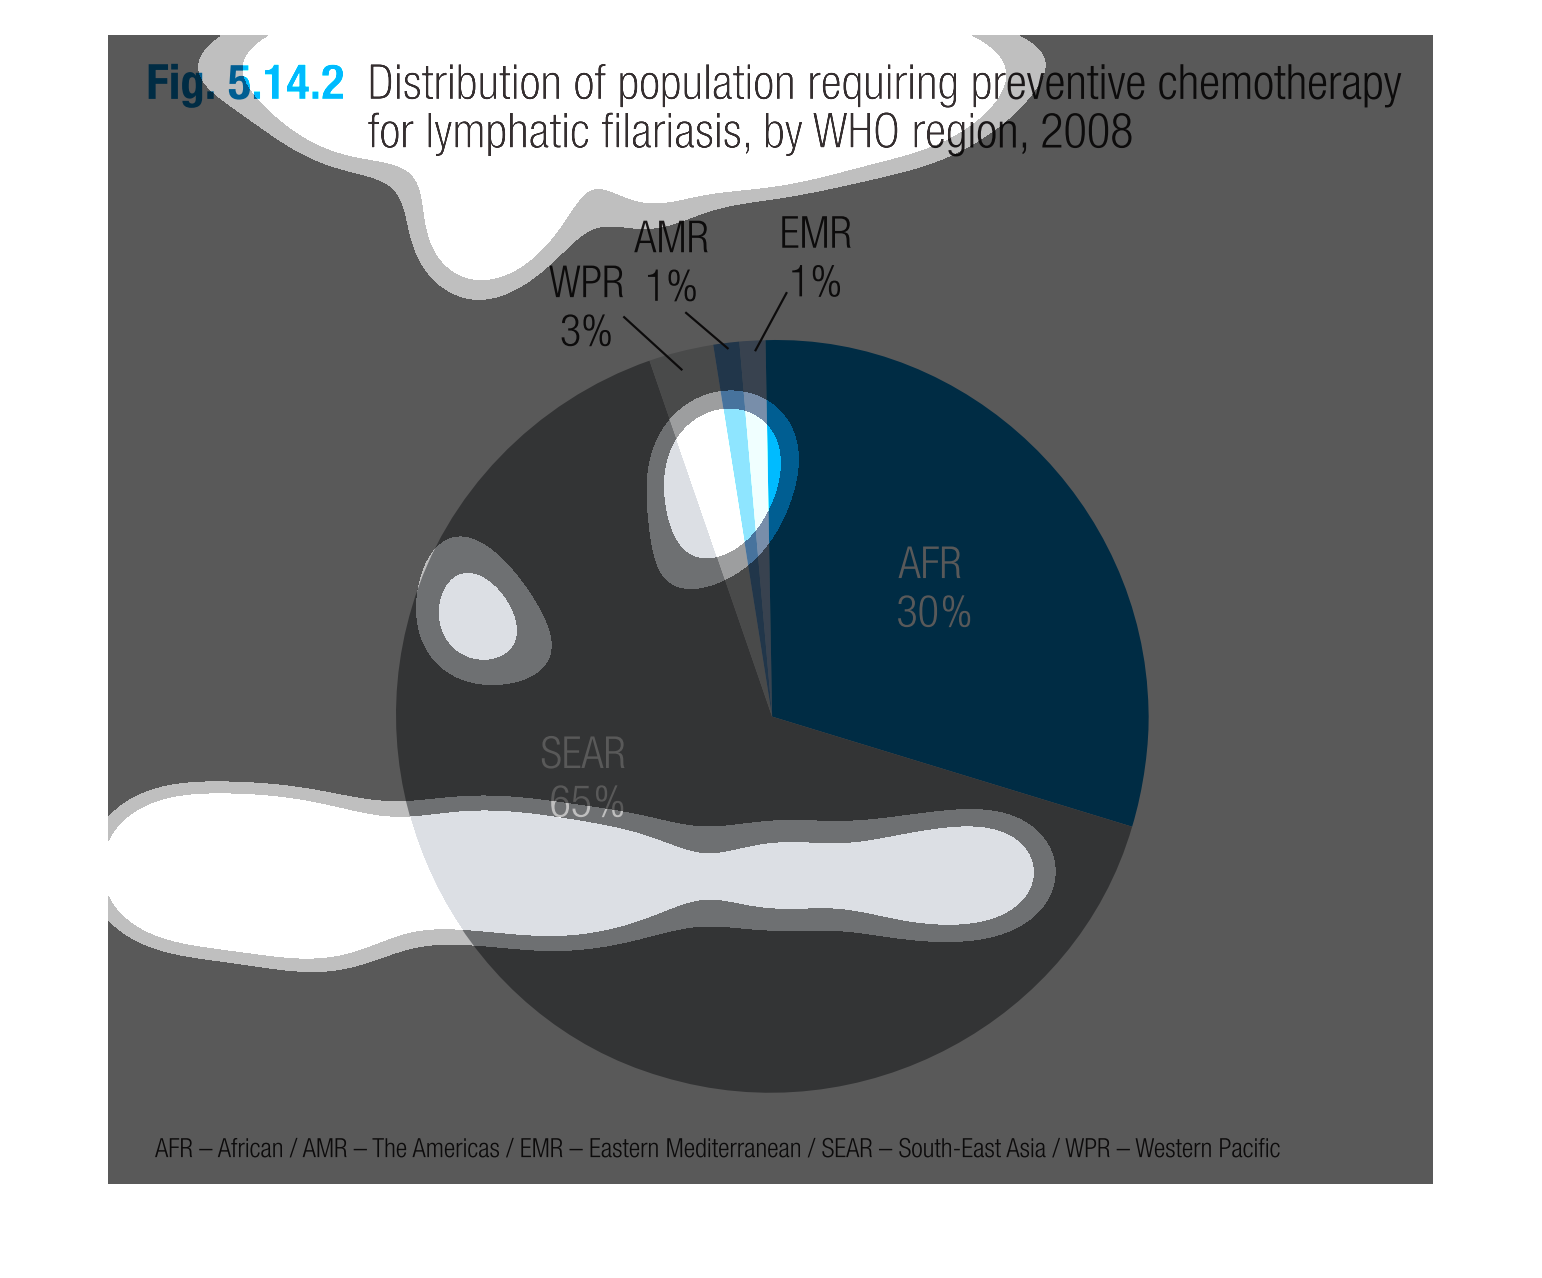
The image depicts a pie chart of the distribution of population requiring preventative chemotherapy
for lymphatic filariasis, by WHO region, in the year 2008. Regions include: Africa, The Americas,
Eastern Mediterranean, South East Asia, and Western Pacific. South East Asia and Africa require
the most treatment, with South East Asia taking top spot, and Africa following behind.
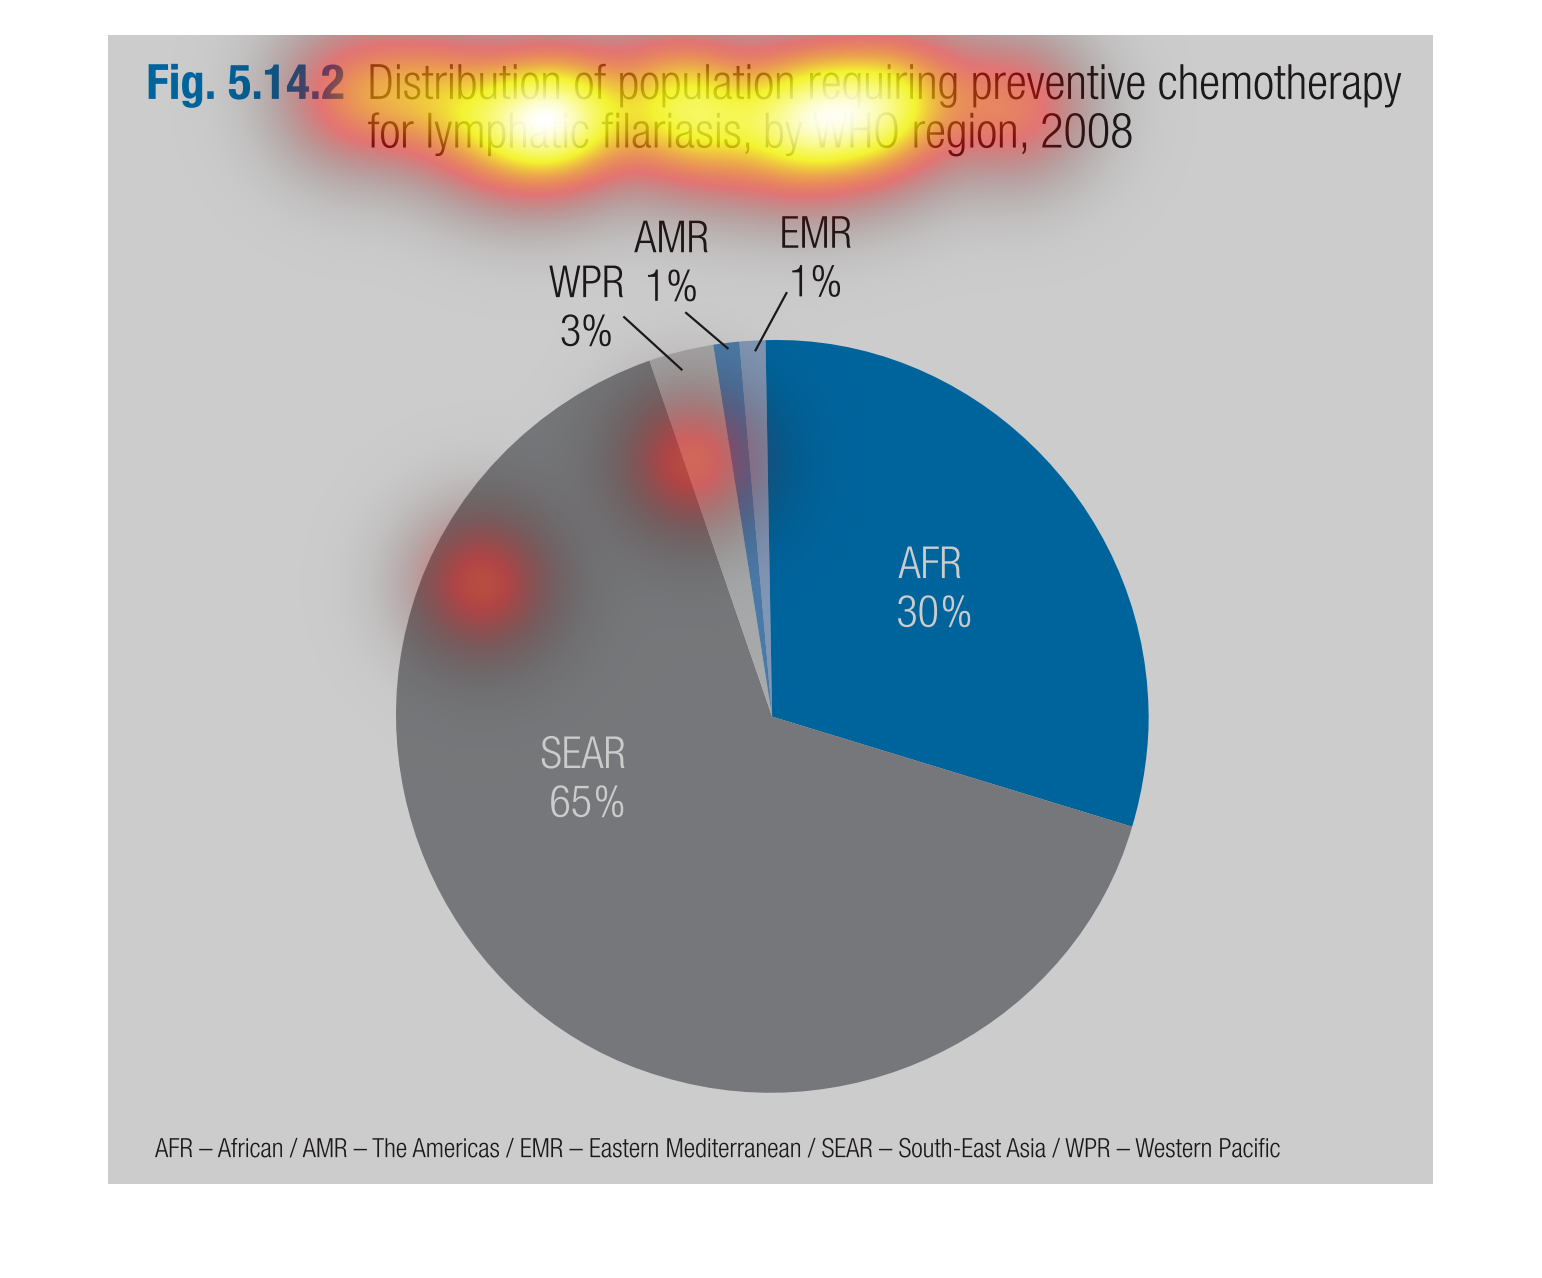
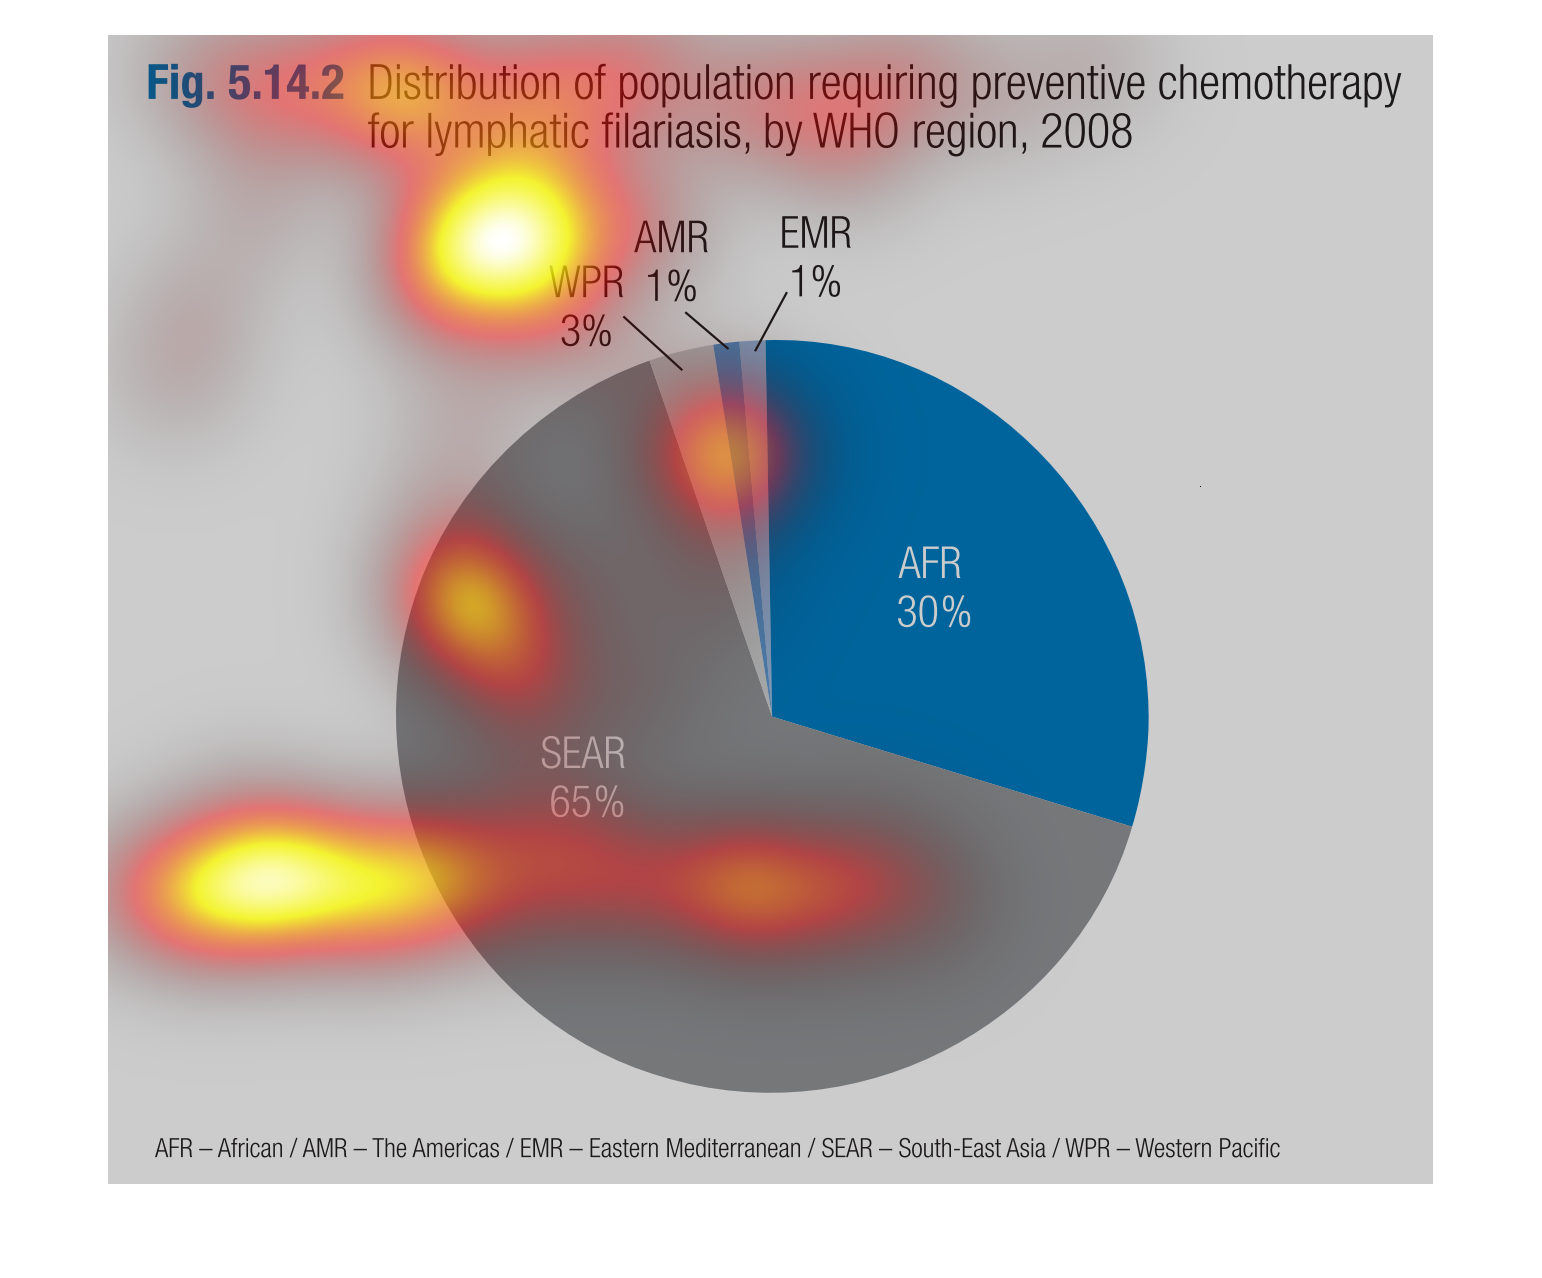
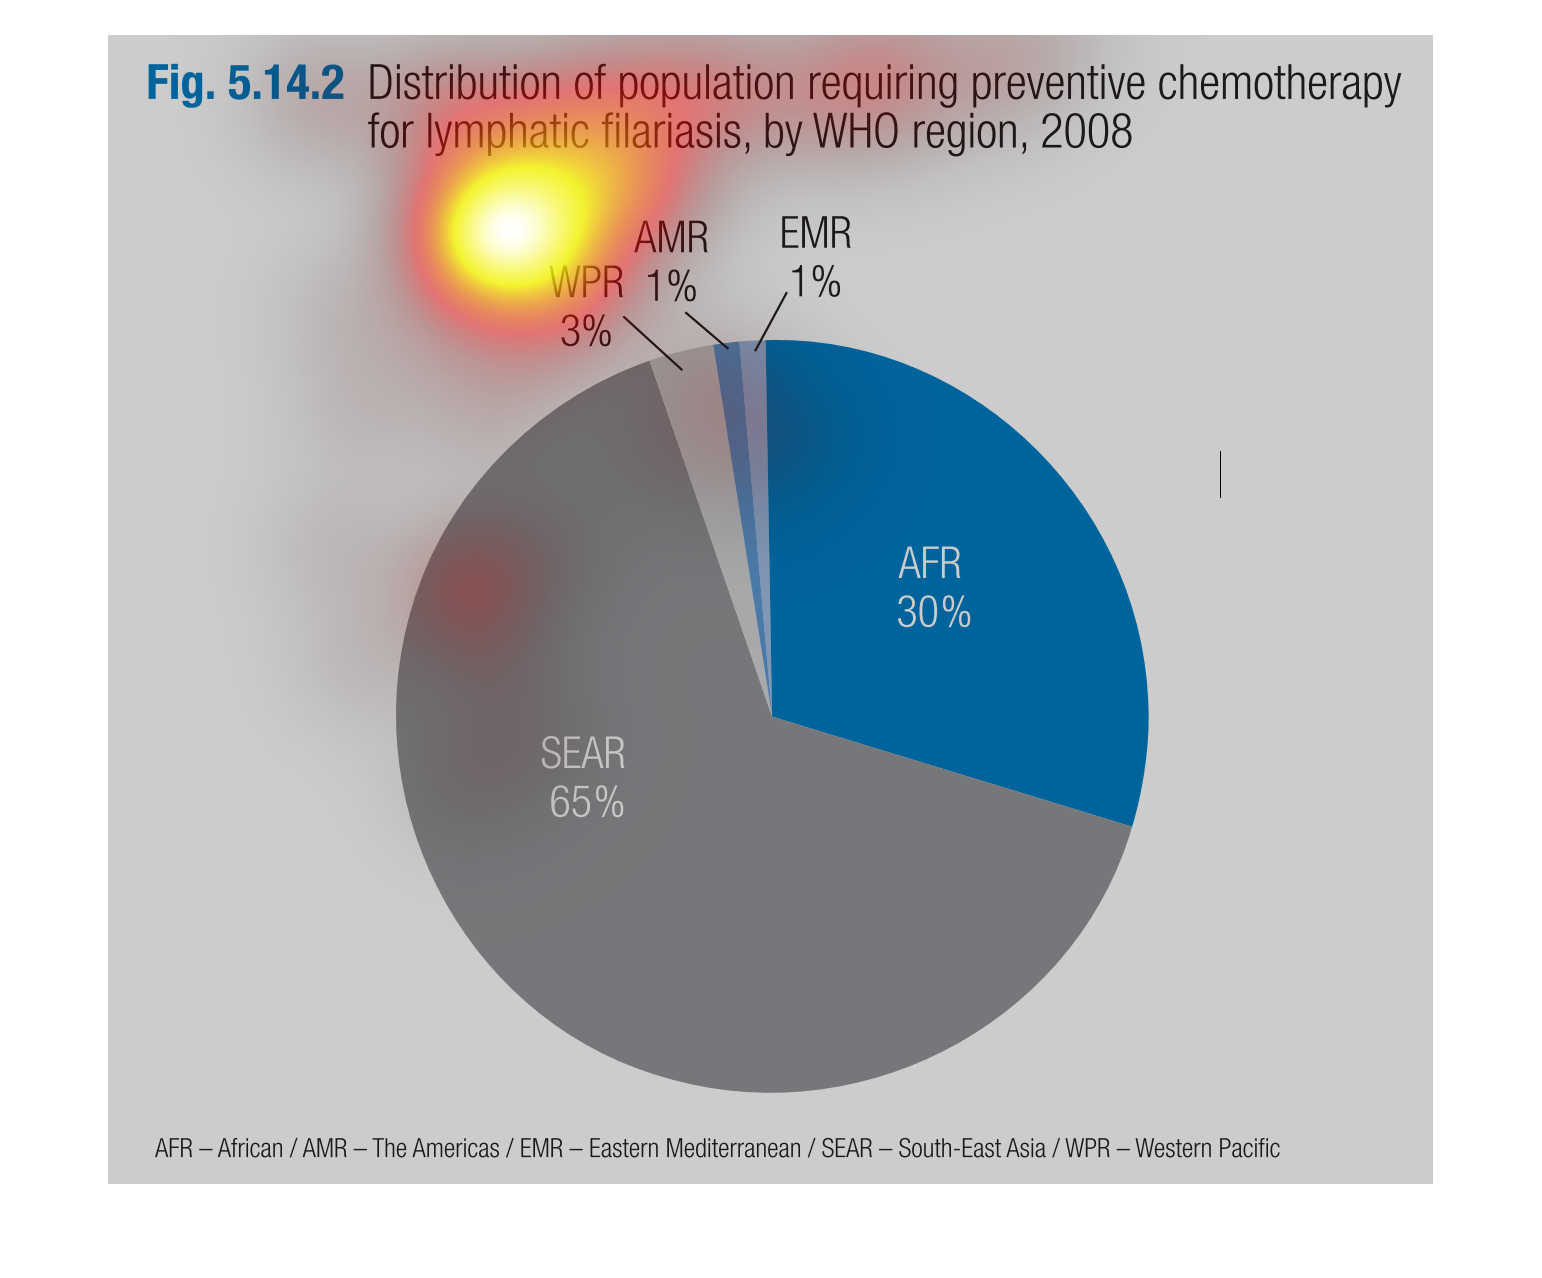
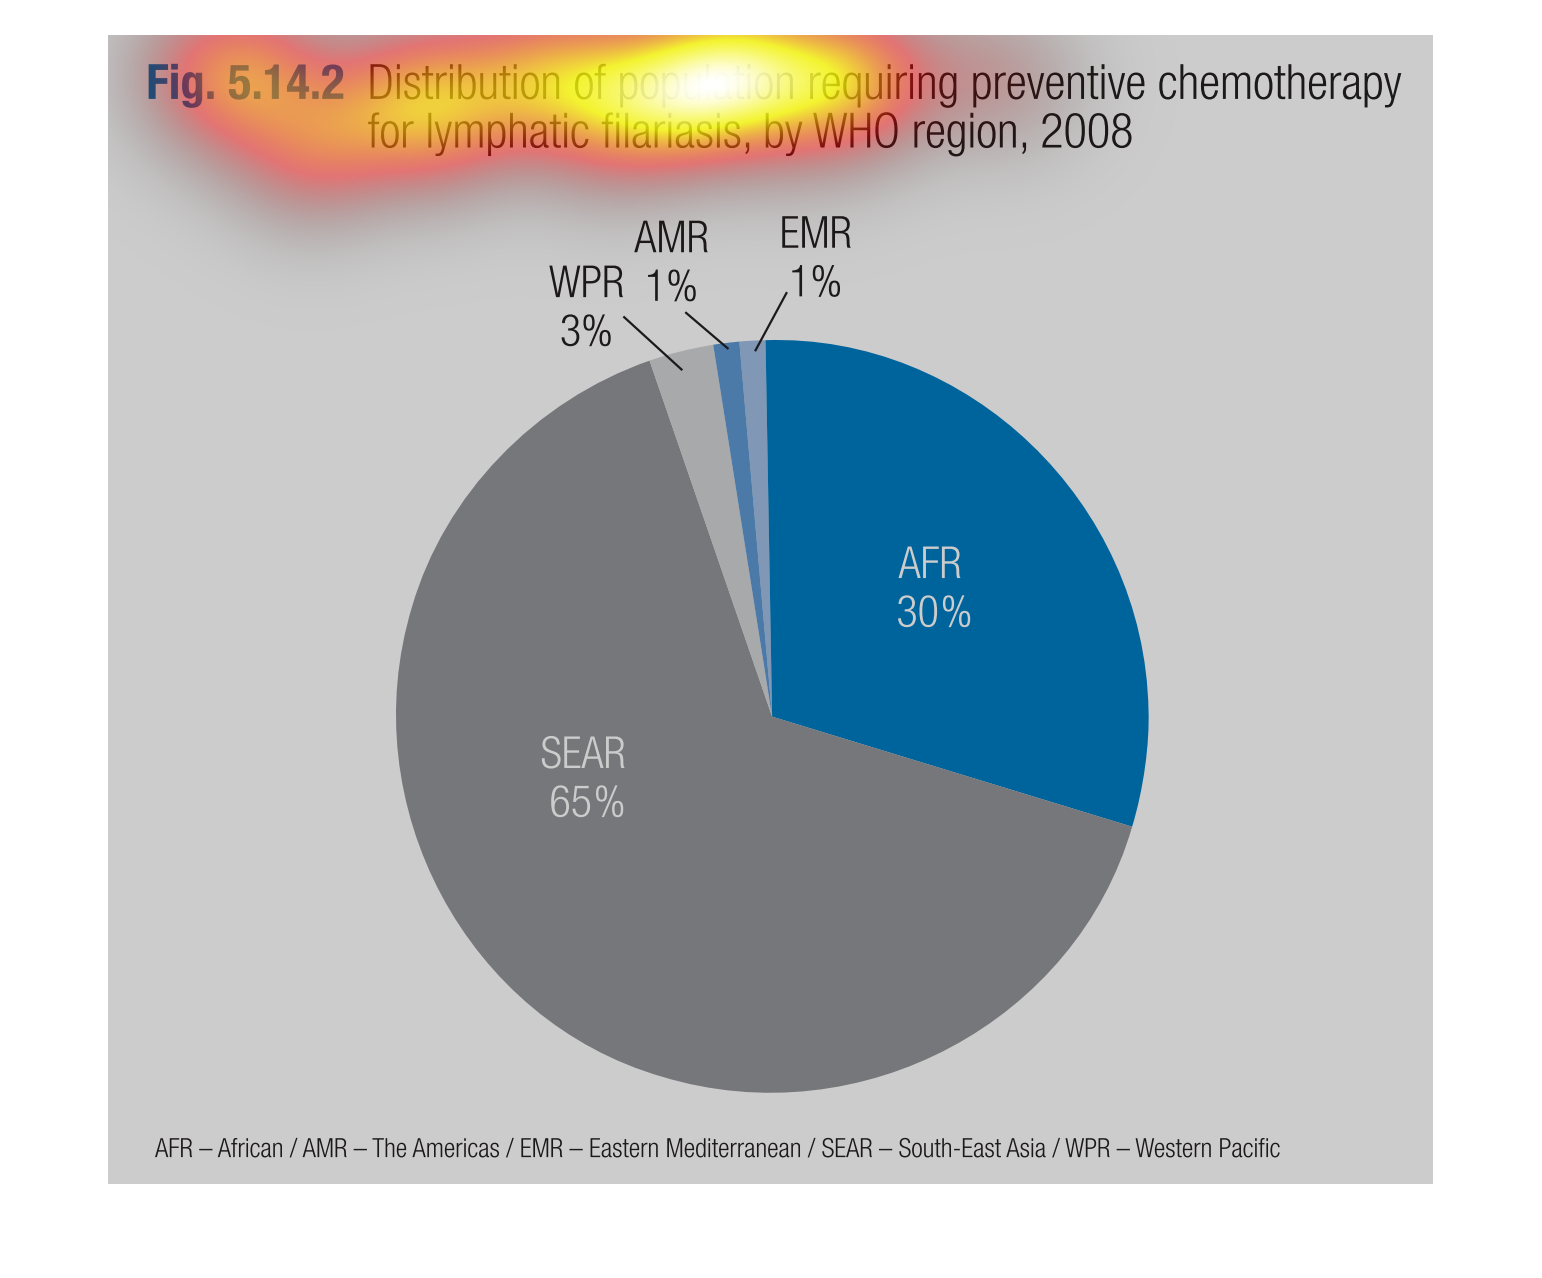
This chart describes distribution of the population requiring preventive chemotherapy for
lymphatic filariasis, by WHO region, for the year 2008. With SEAR having the largest percentage.
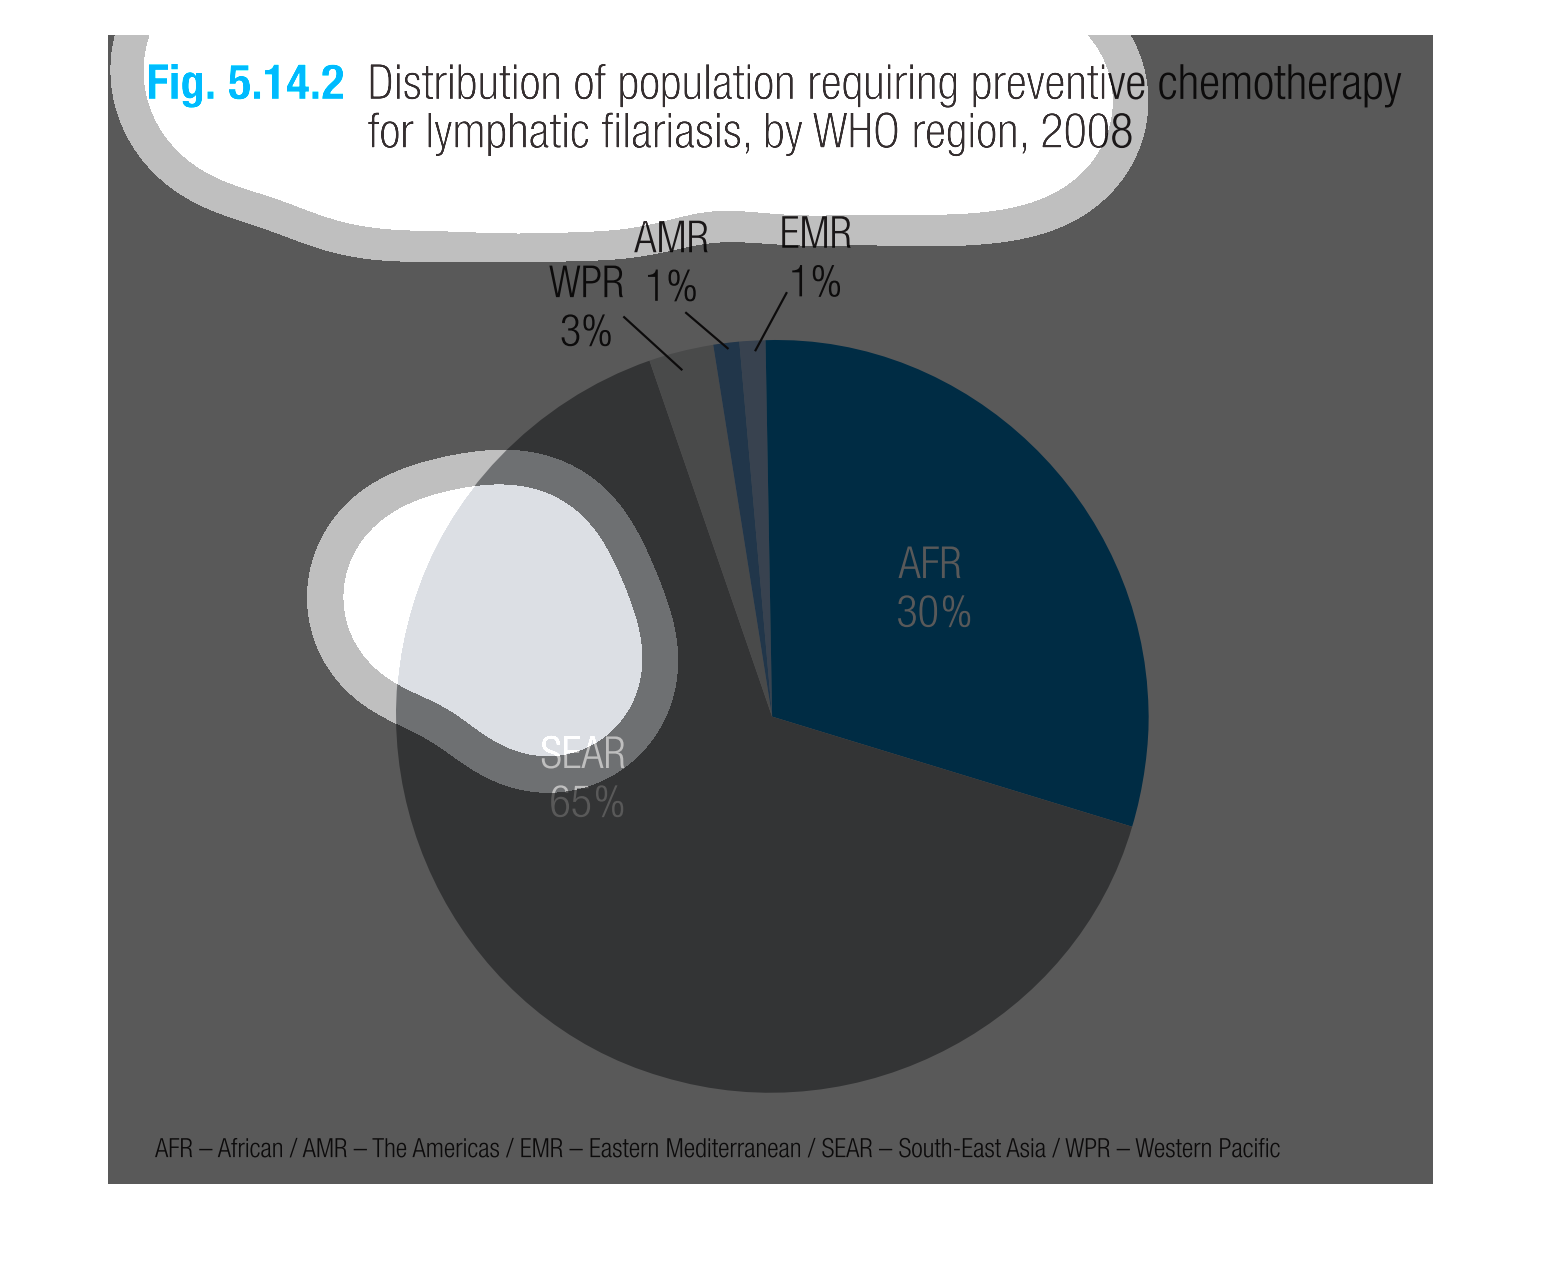
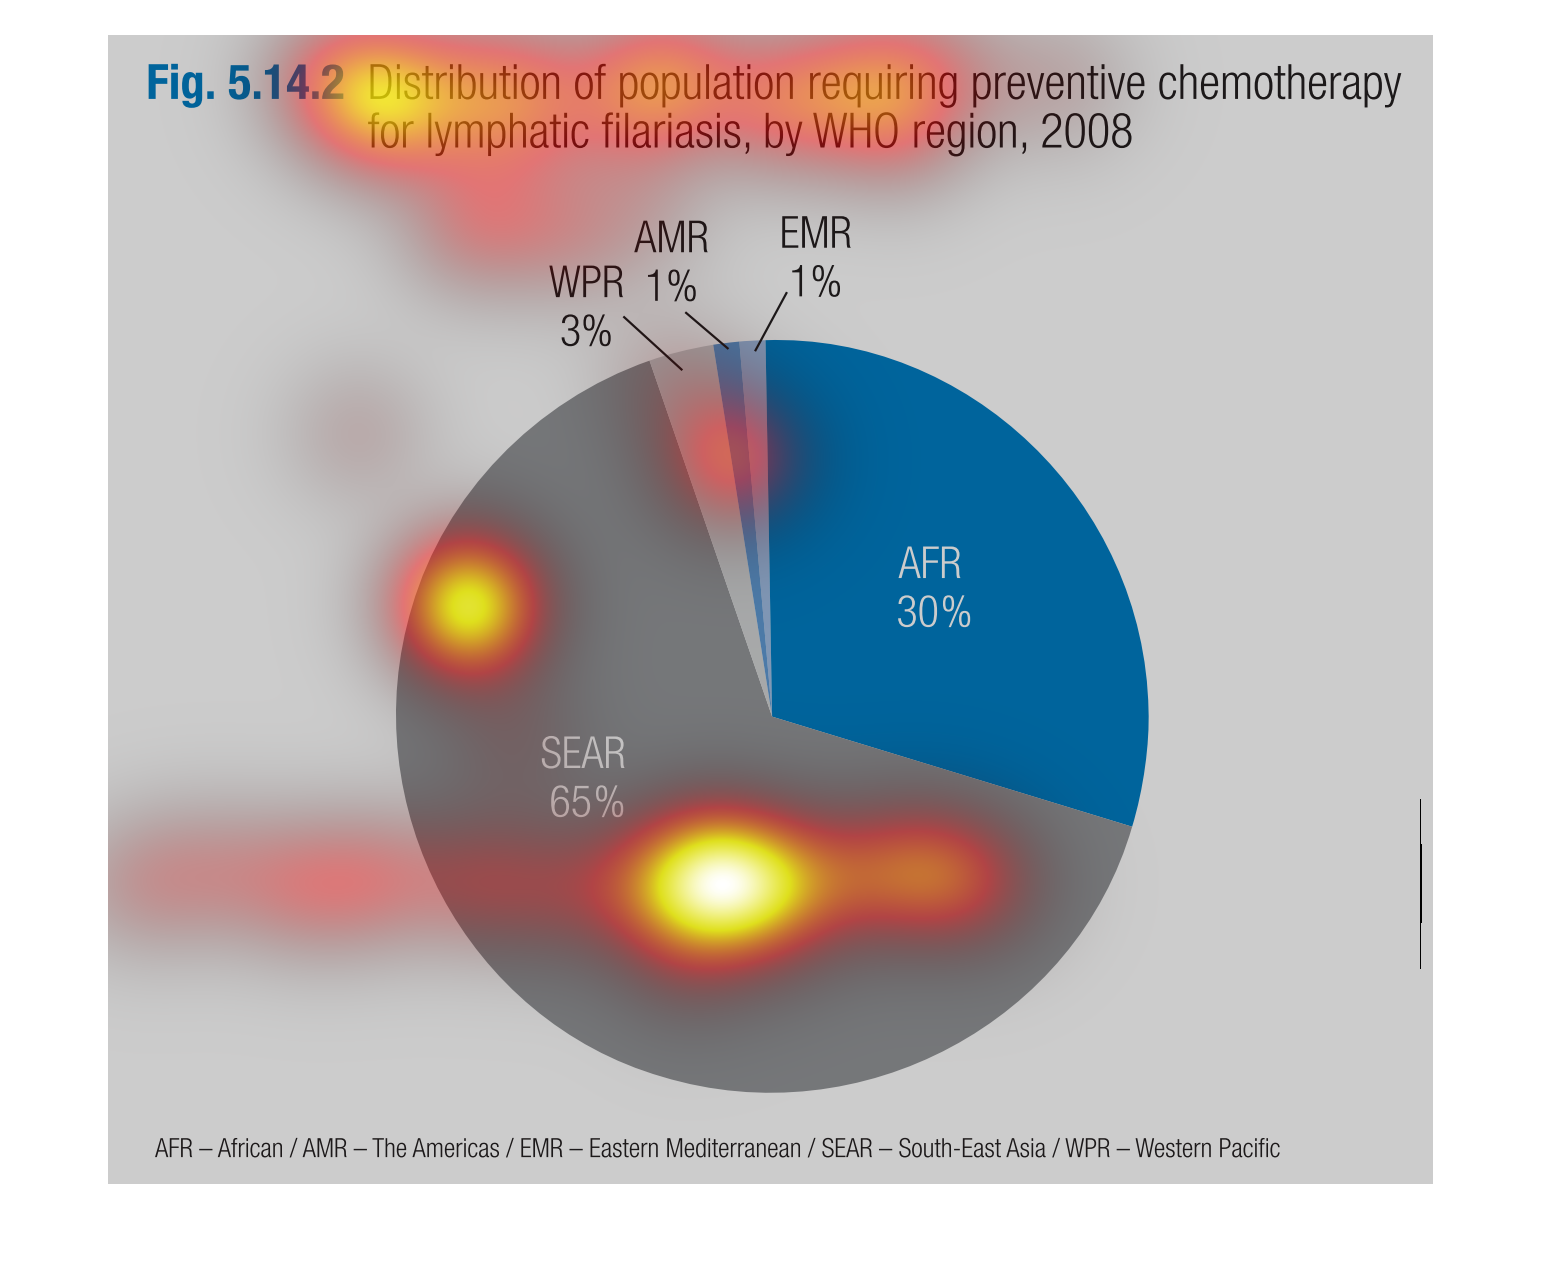
This graph shows the distribution of the world's population who need preventative chemotherapy.
The highest percentage by a large amount is in the South-East Asia region. The lowest percentage
is tied between the Americas and the Eastern Mediterranean.
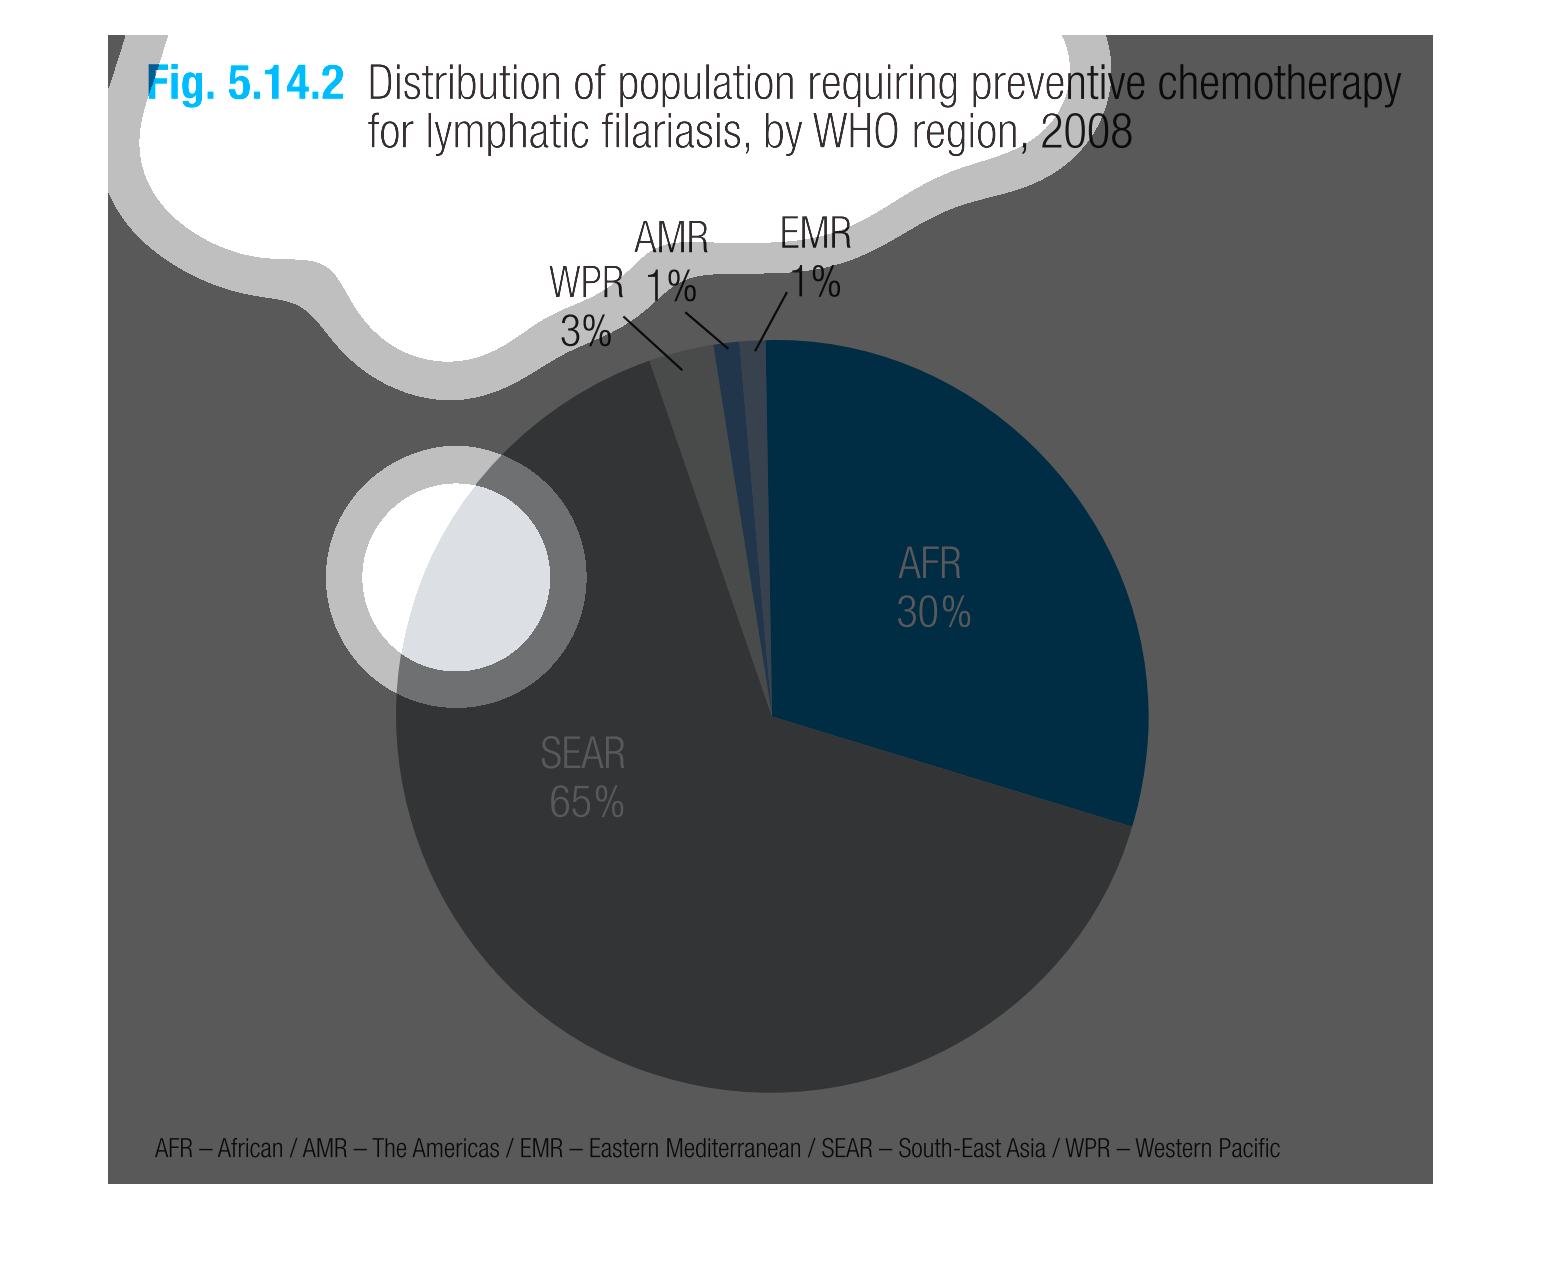
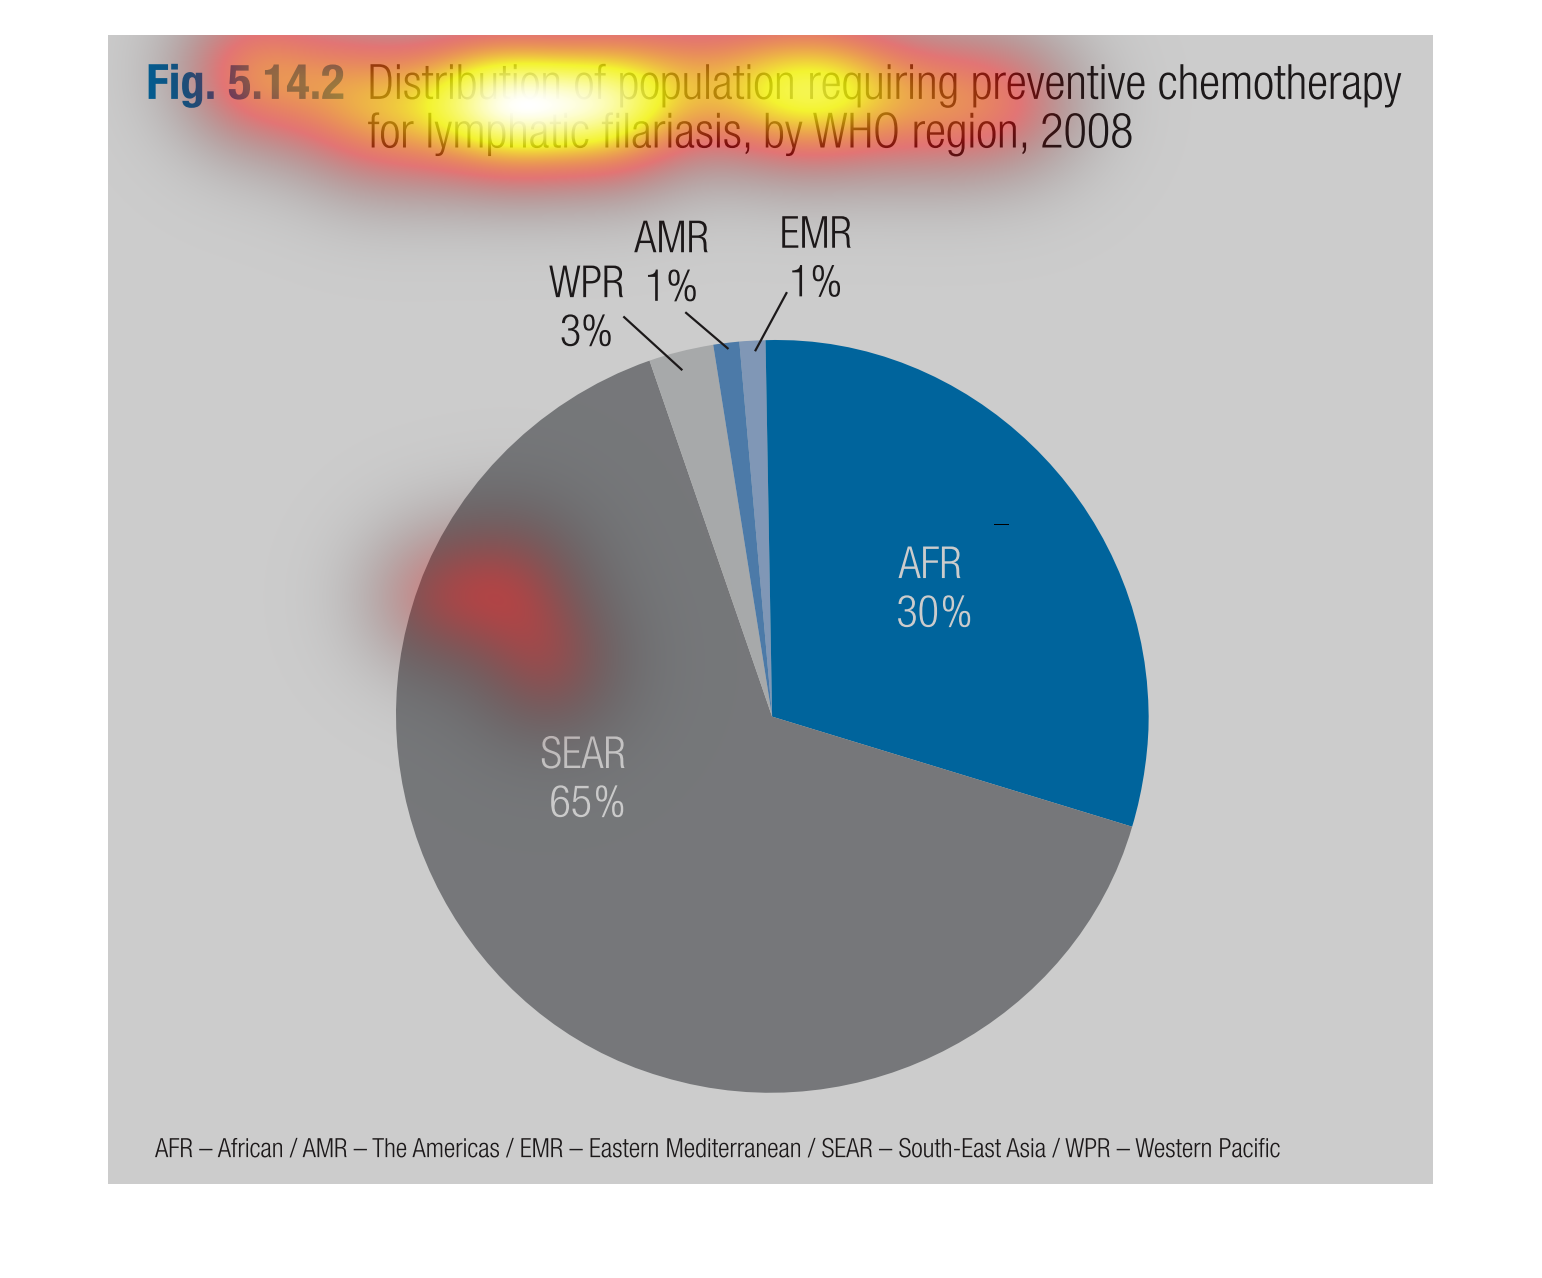
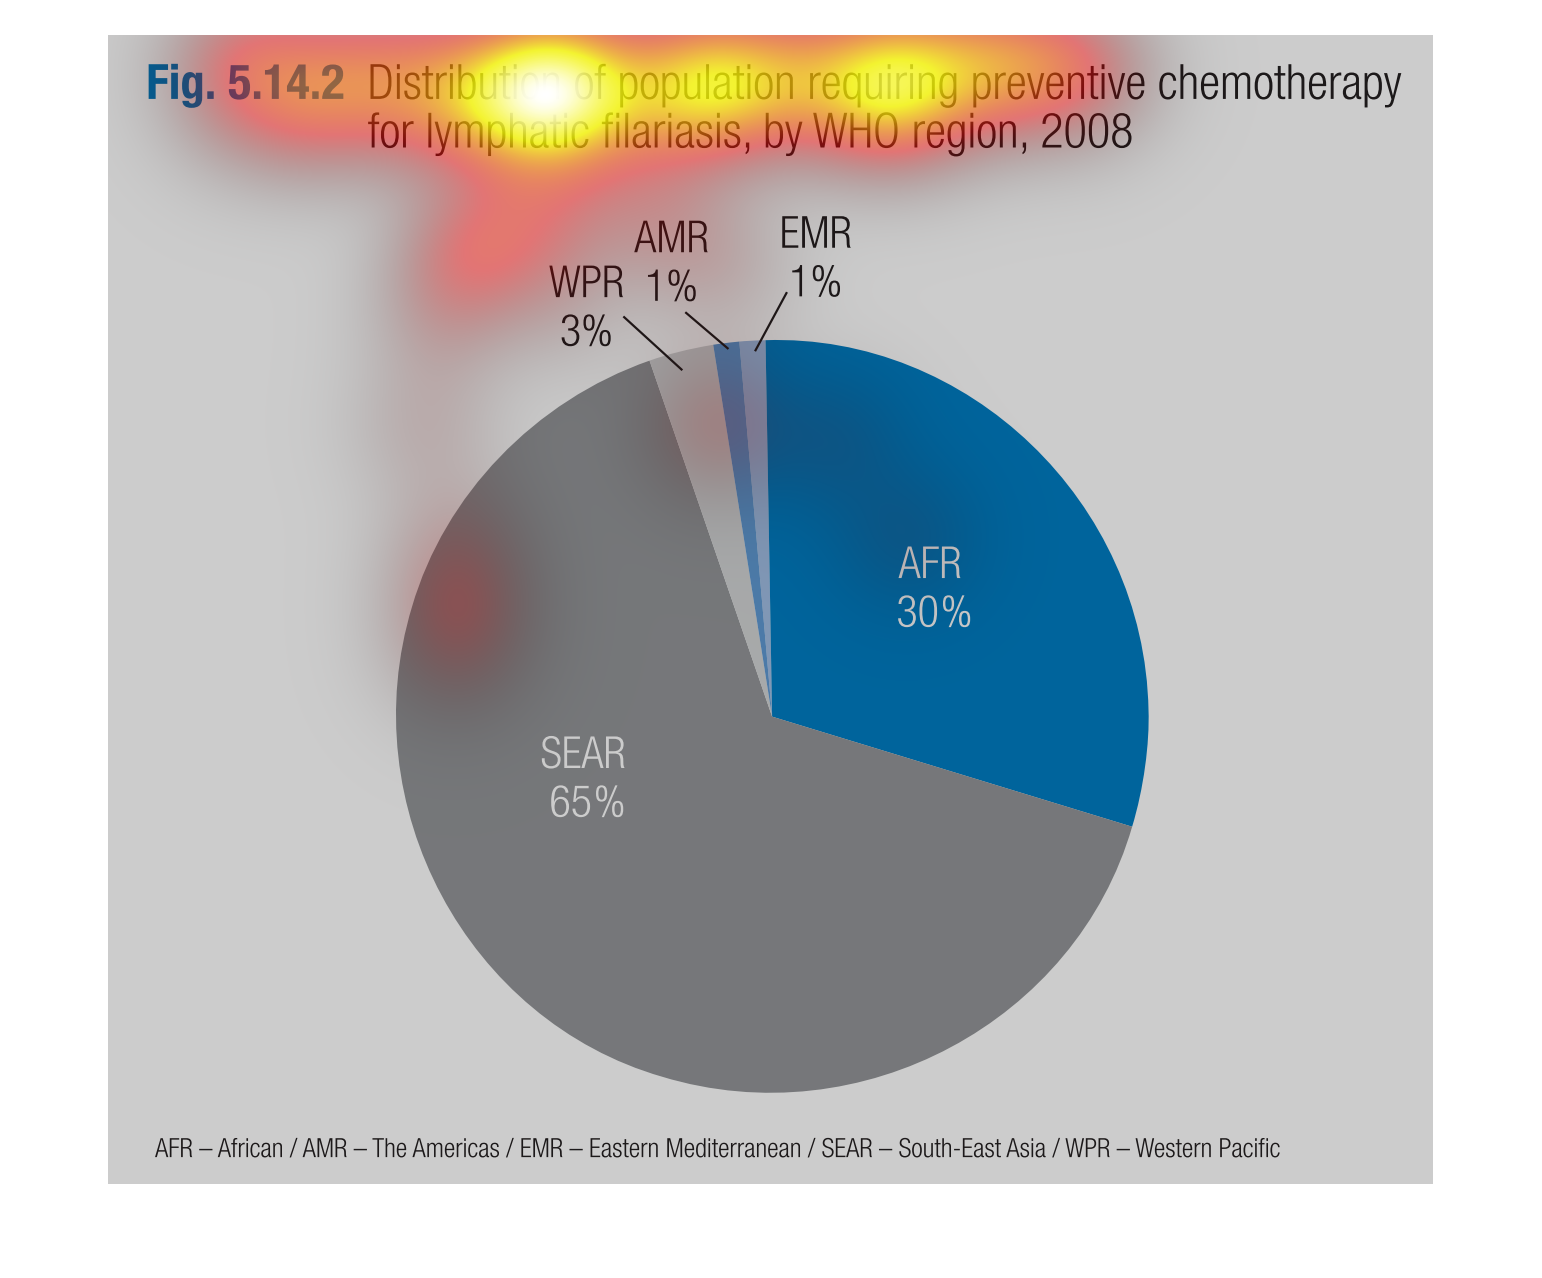
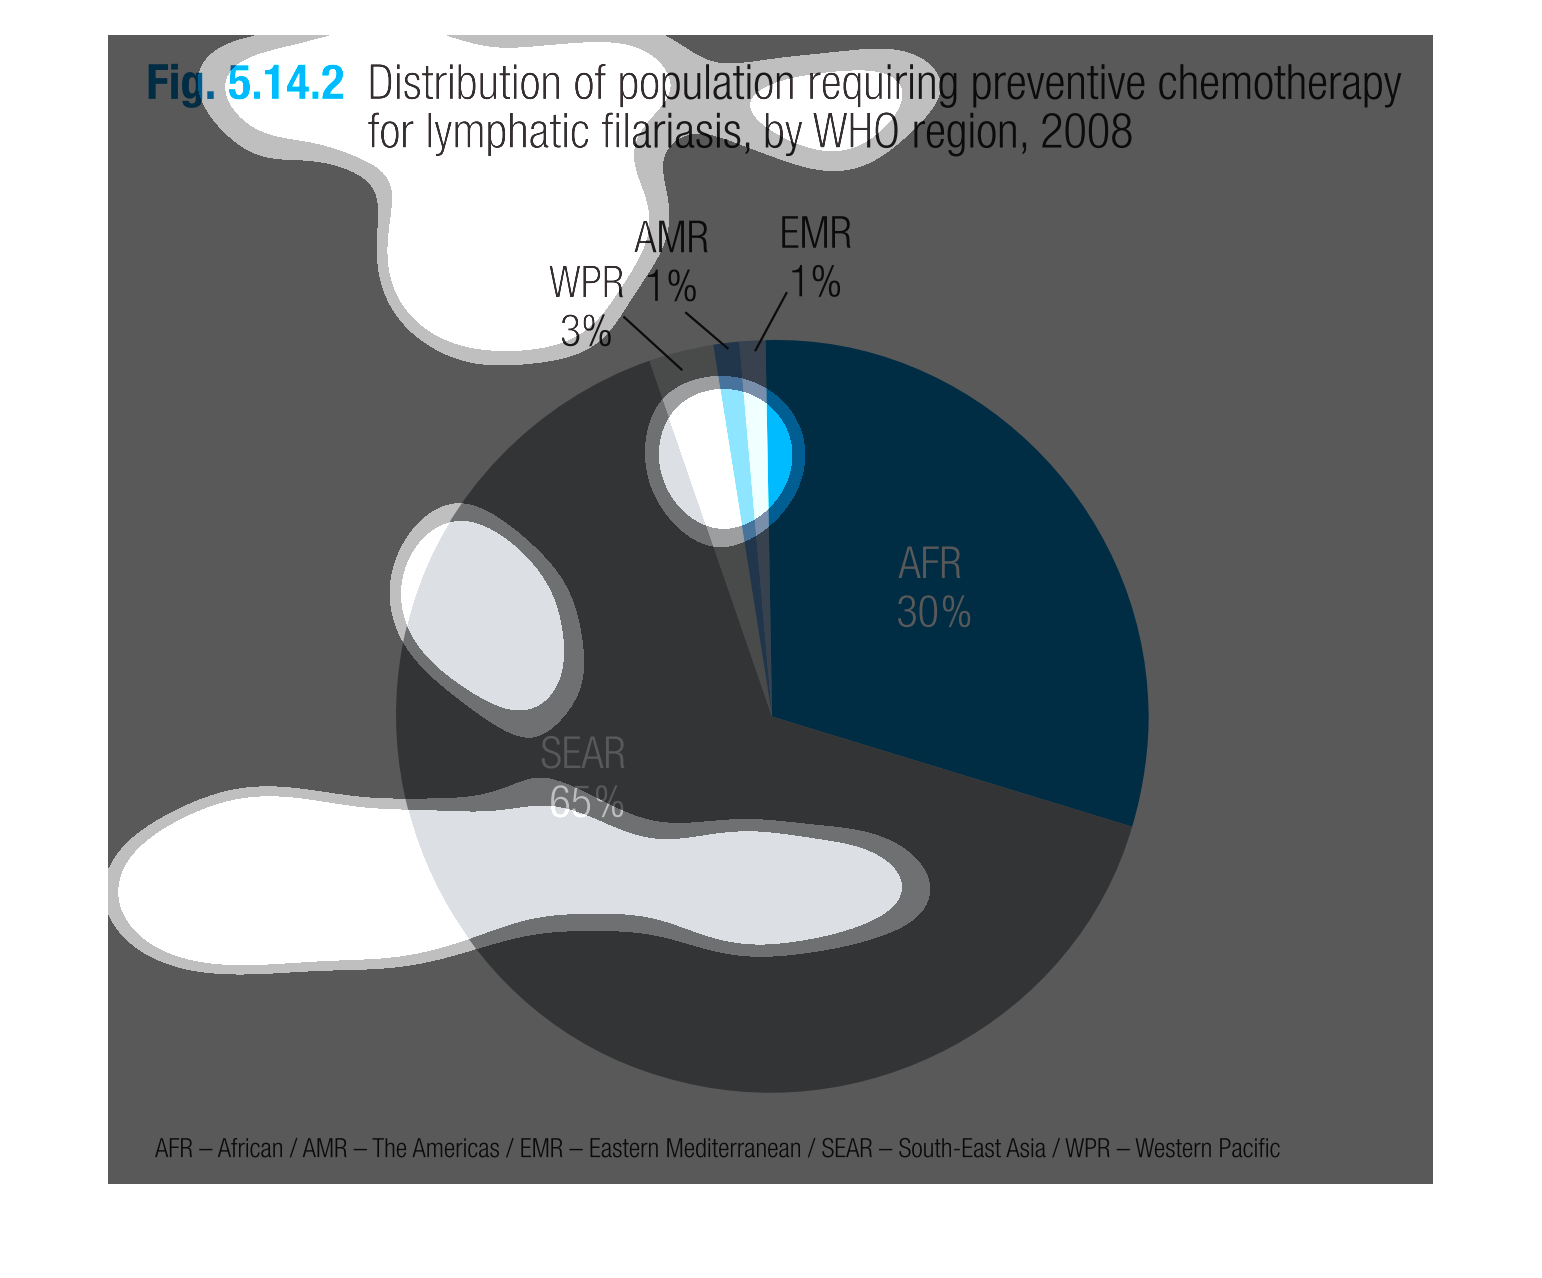
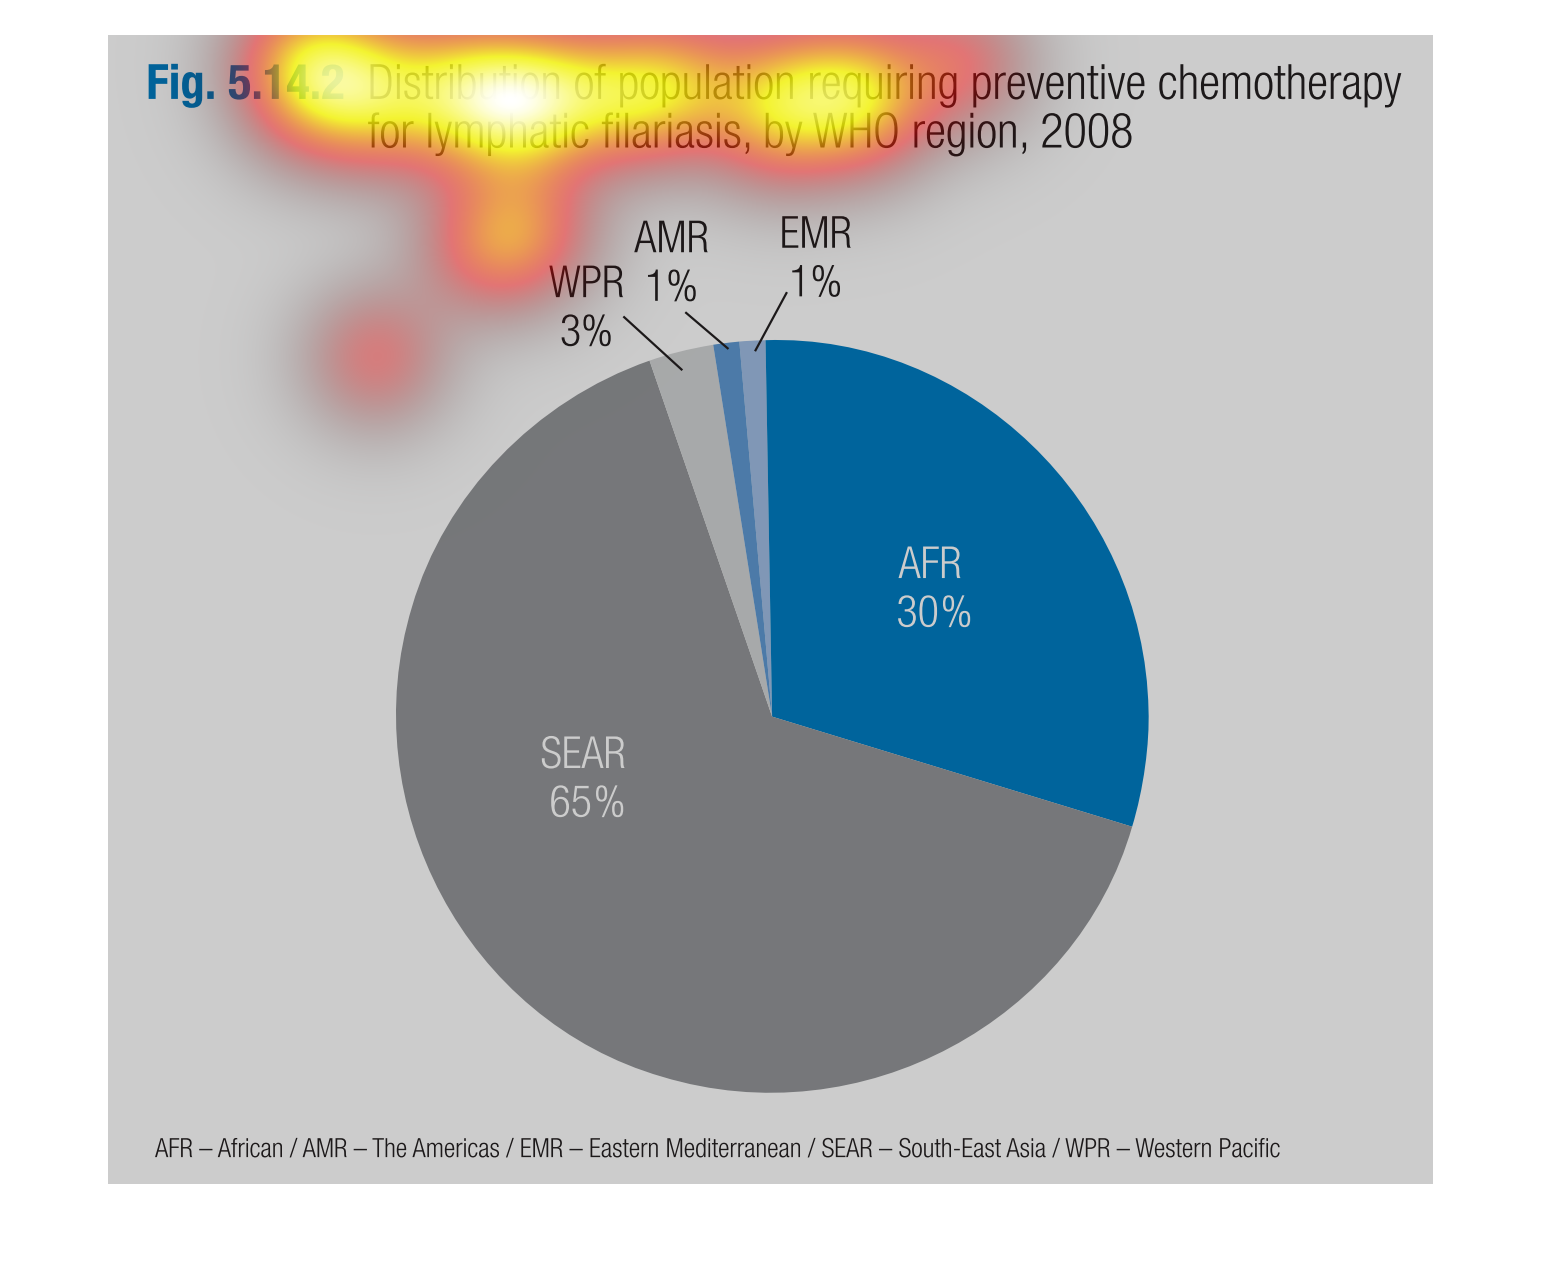
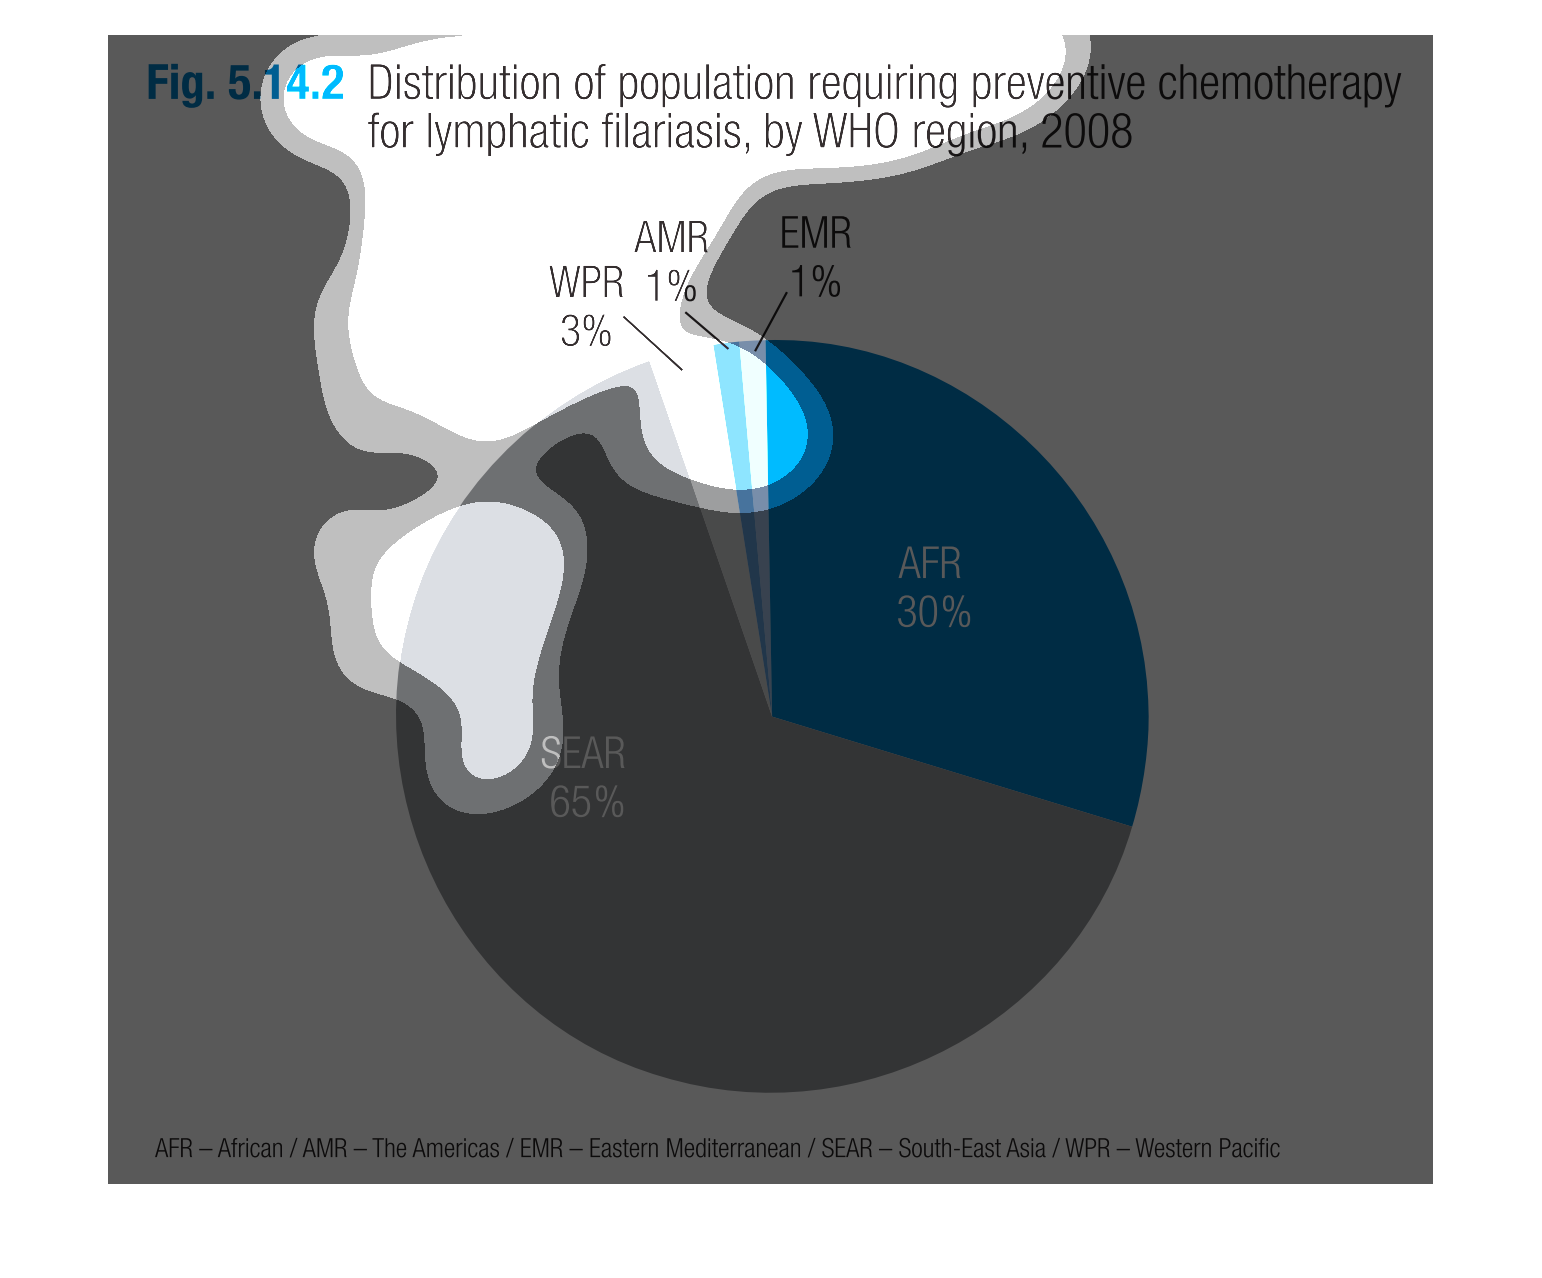
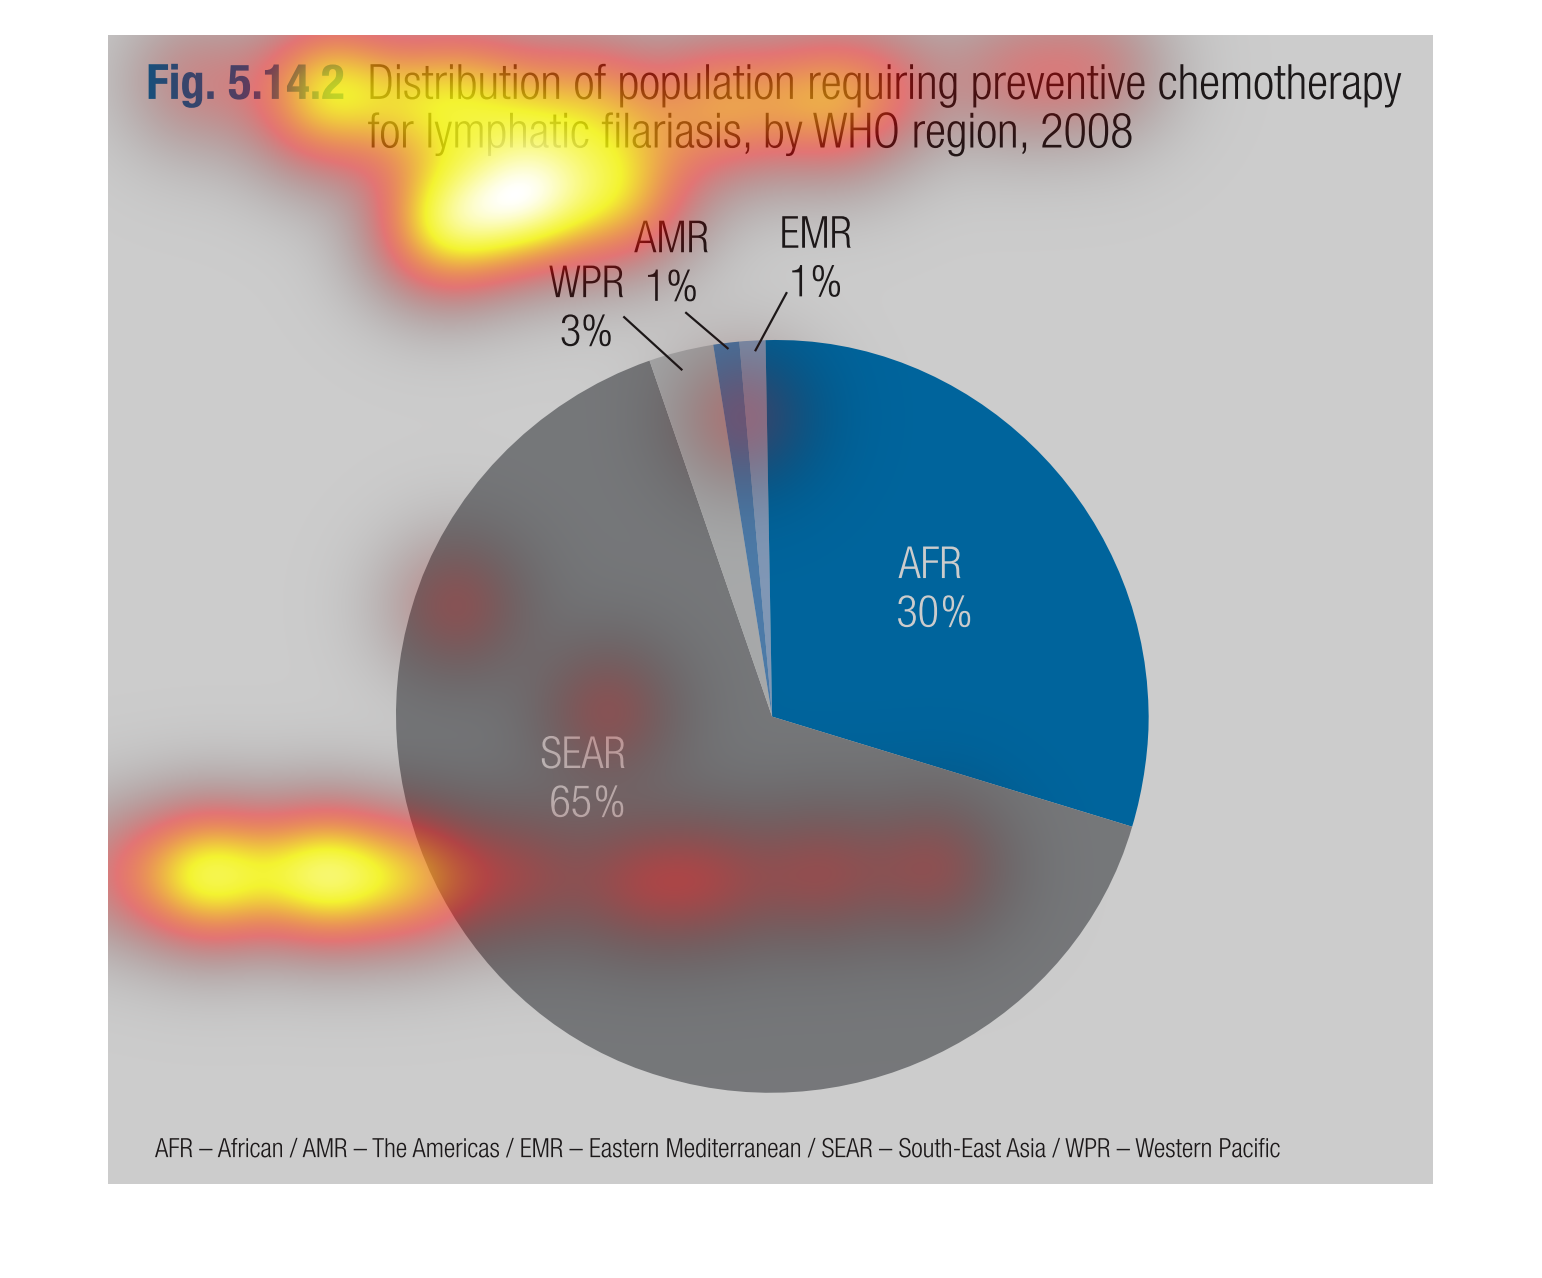
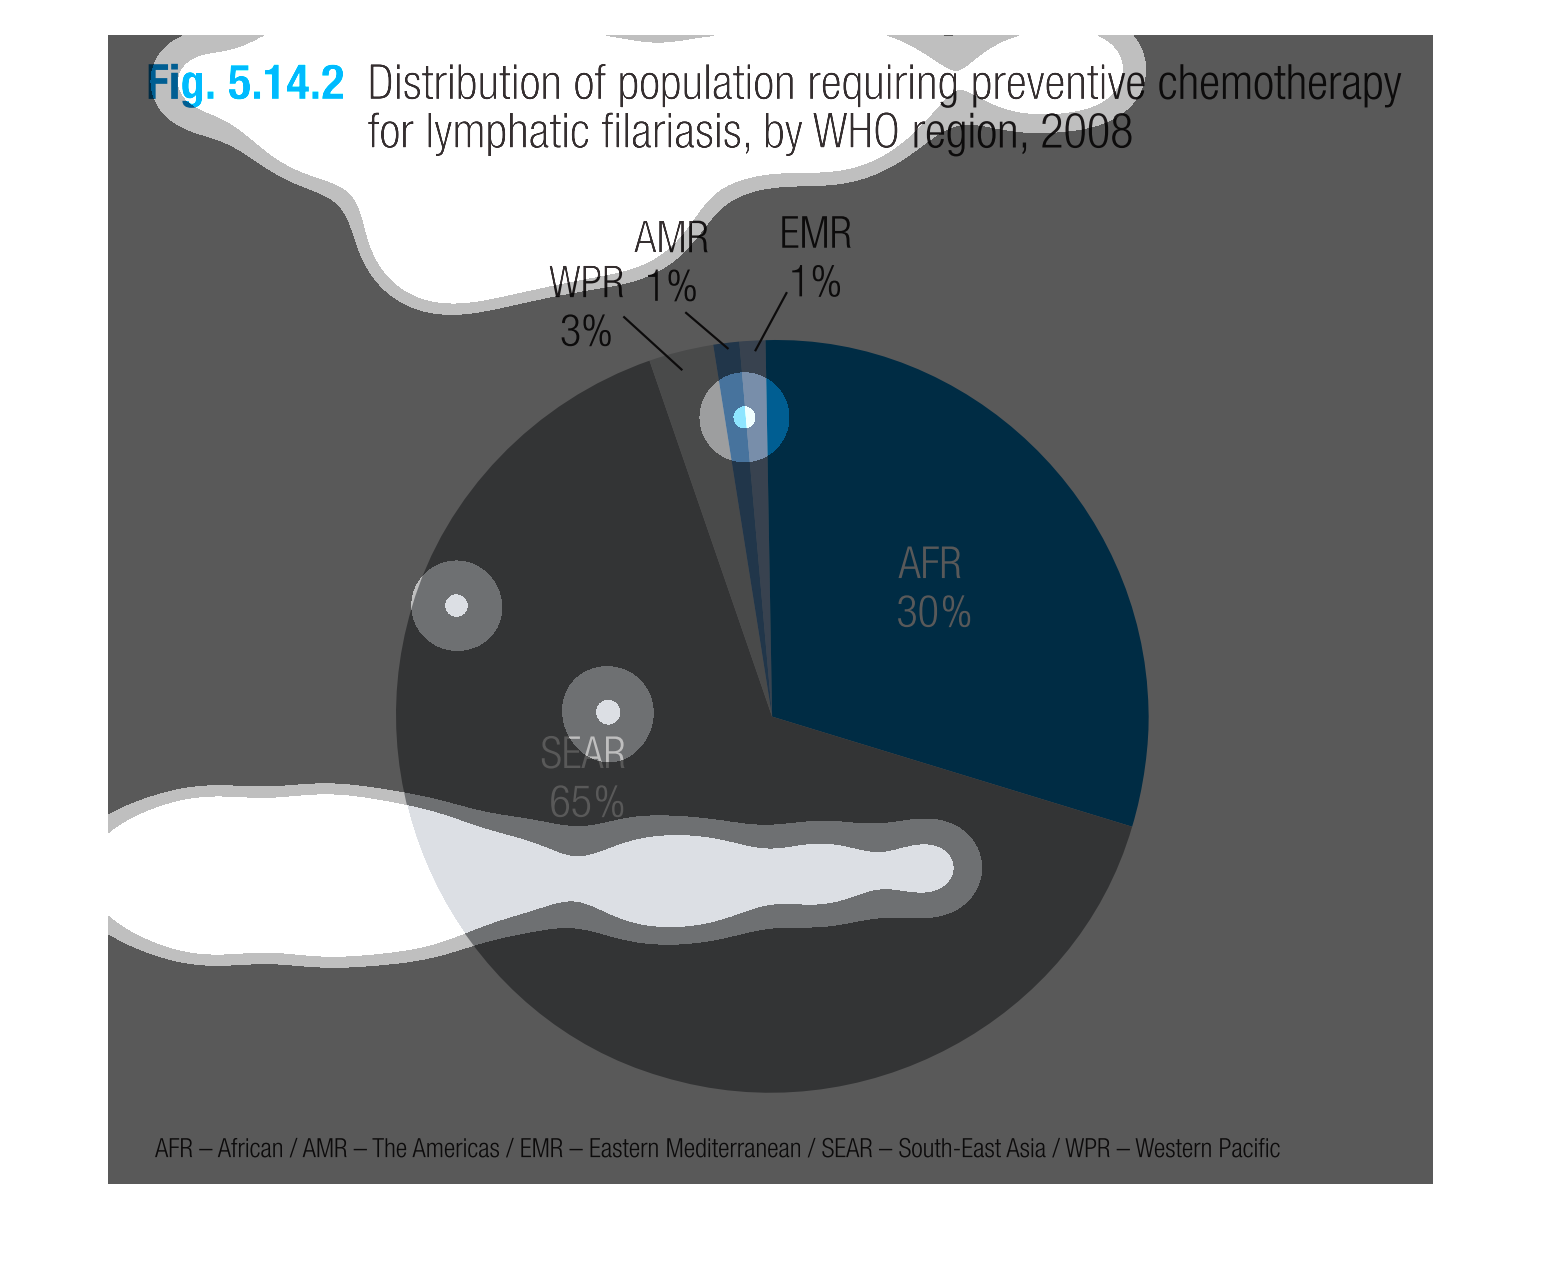
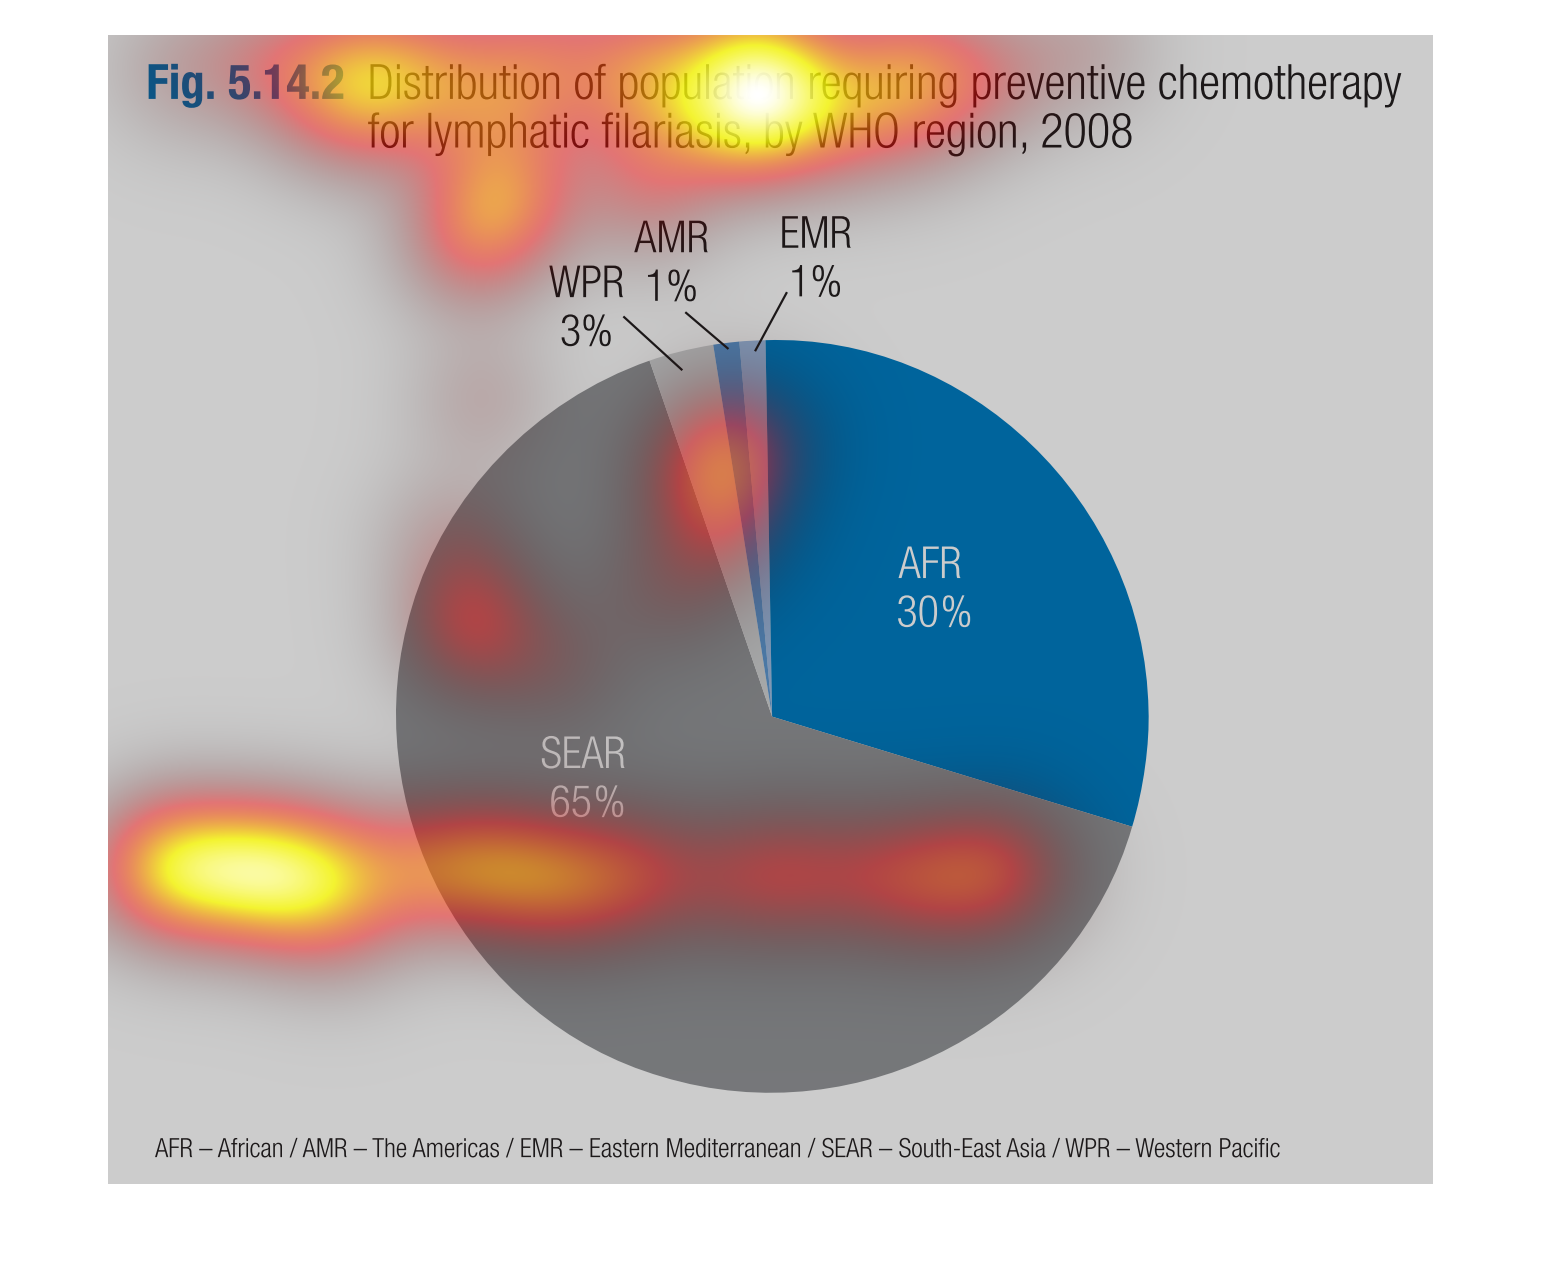
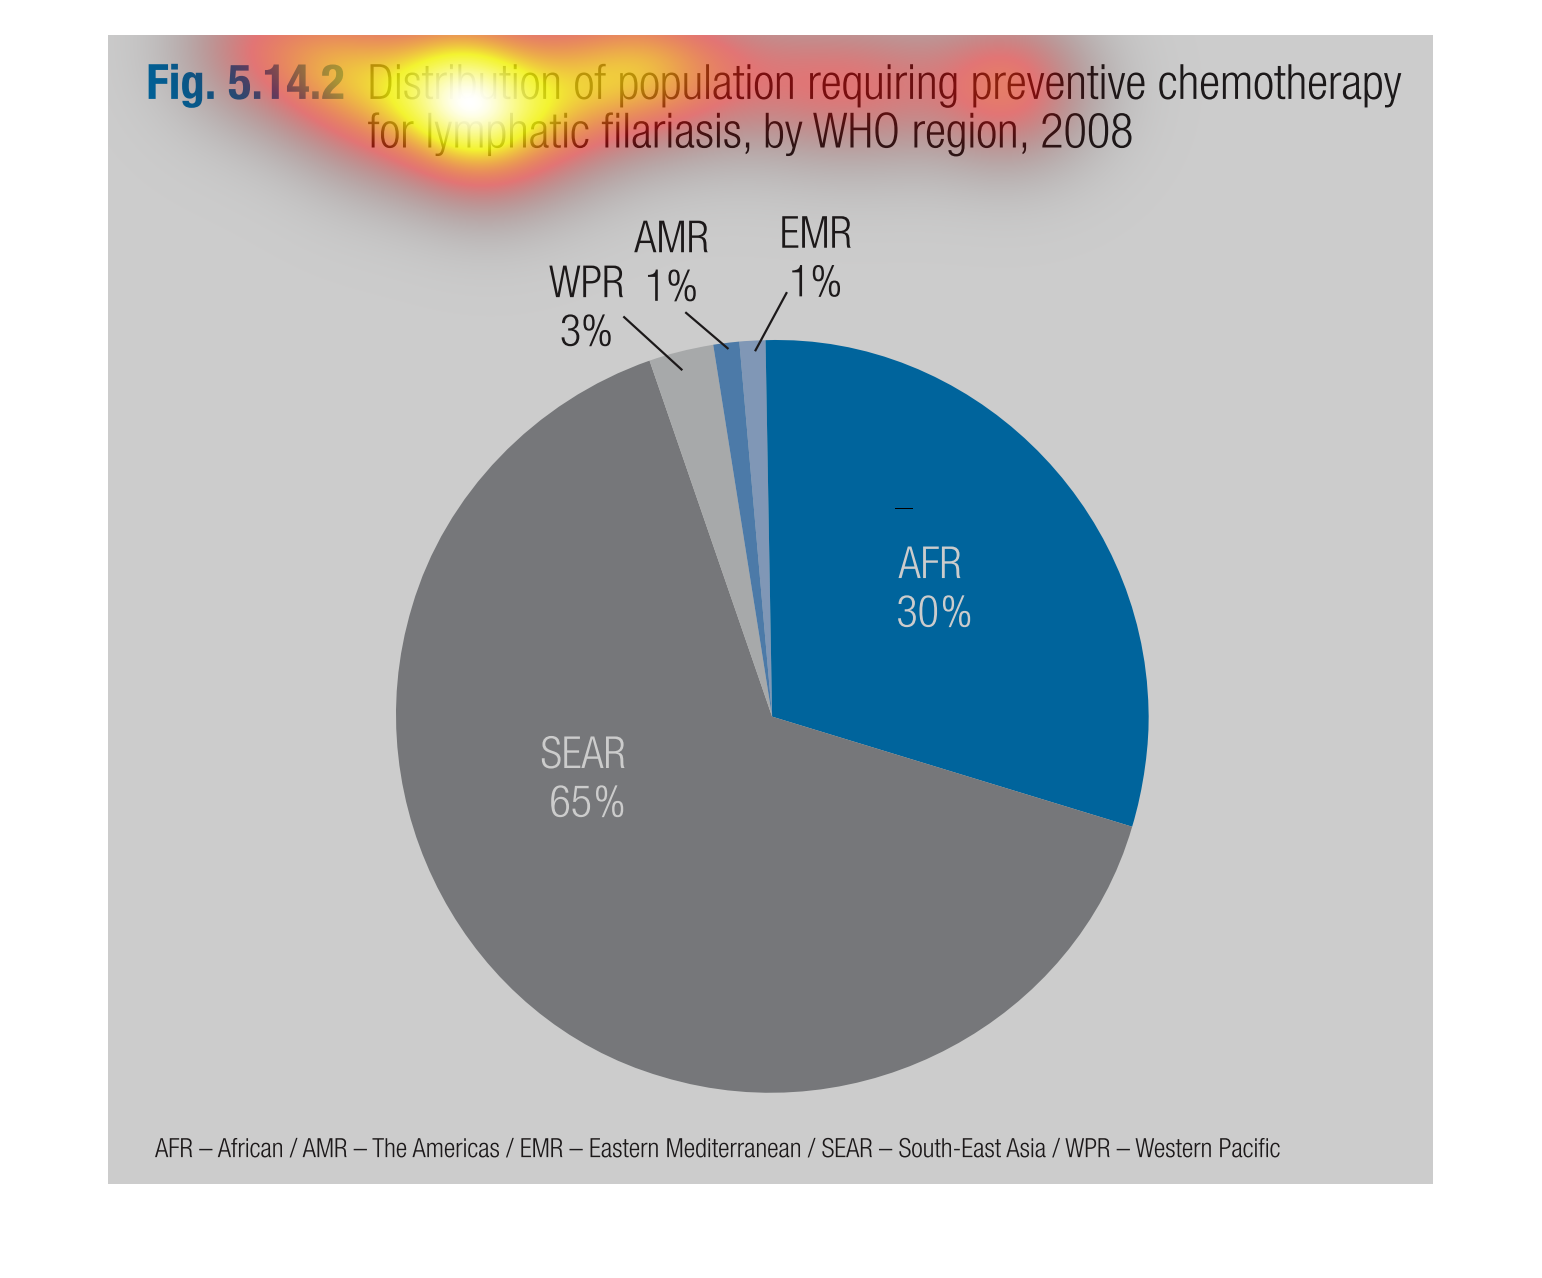
This pie chart shows the Distribution of the population requiring preventative chemotherapy
for lymphatic filarias by WHO region in 2008.  The region titled SEAR has the highest percentage
at 65%.  AFR is the second highest, at 30%.
This pie chart shows the distribution of the population needing chemotherapy treatment for
lymphatic filariasis by WHO region in 2008.  The SEAR region is number one followed by AFR.
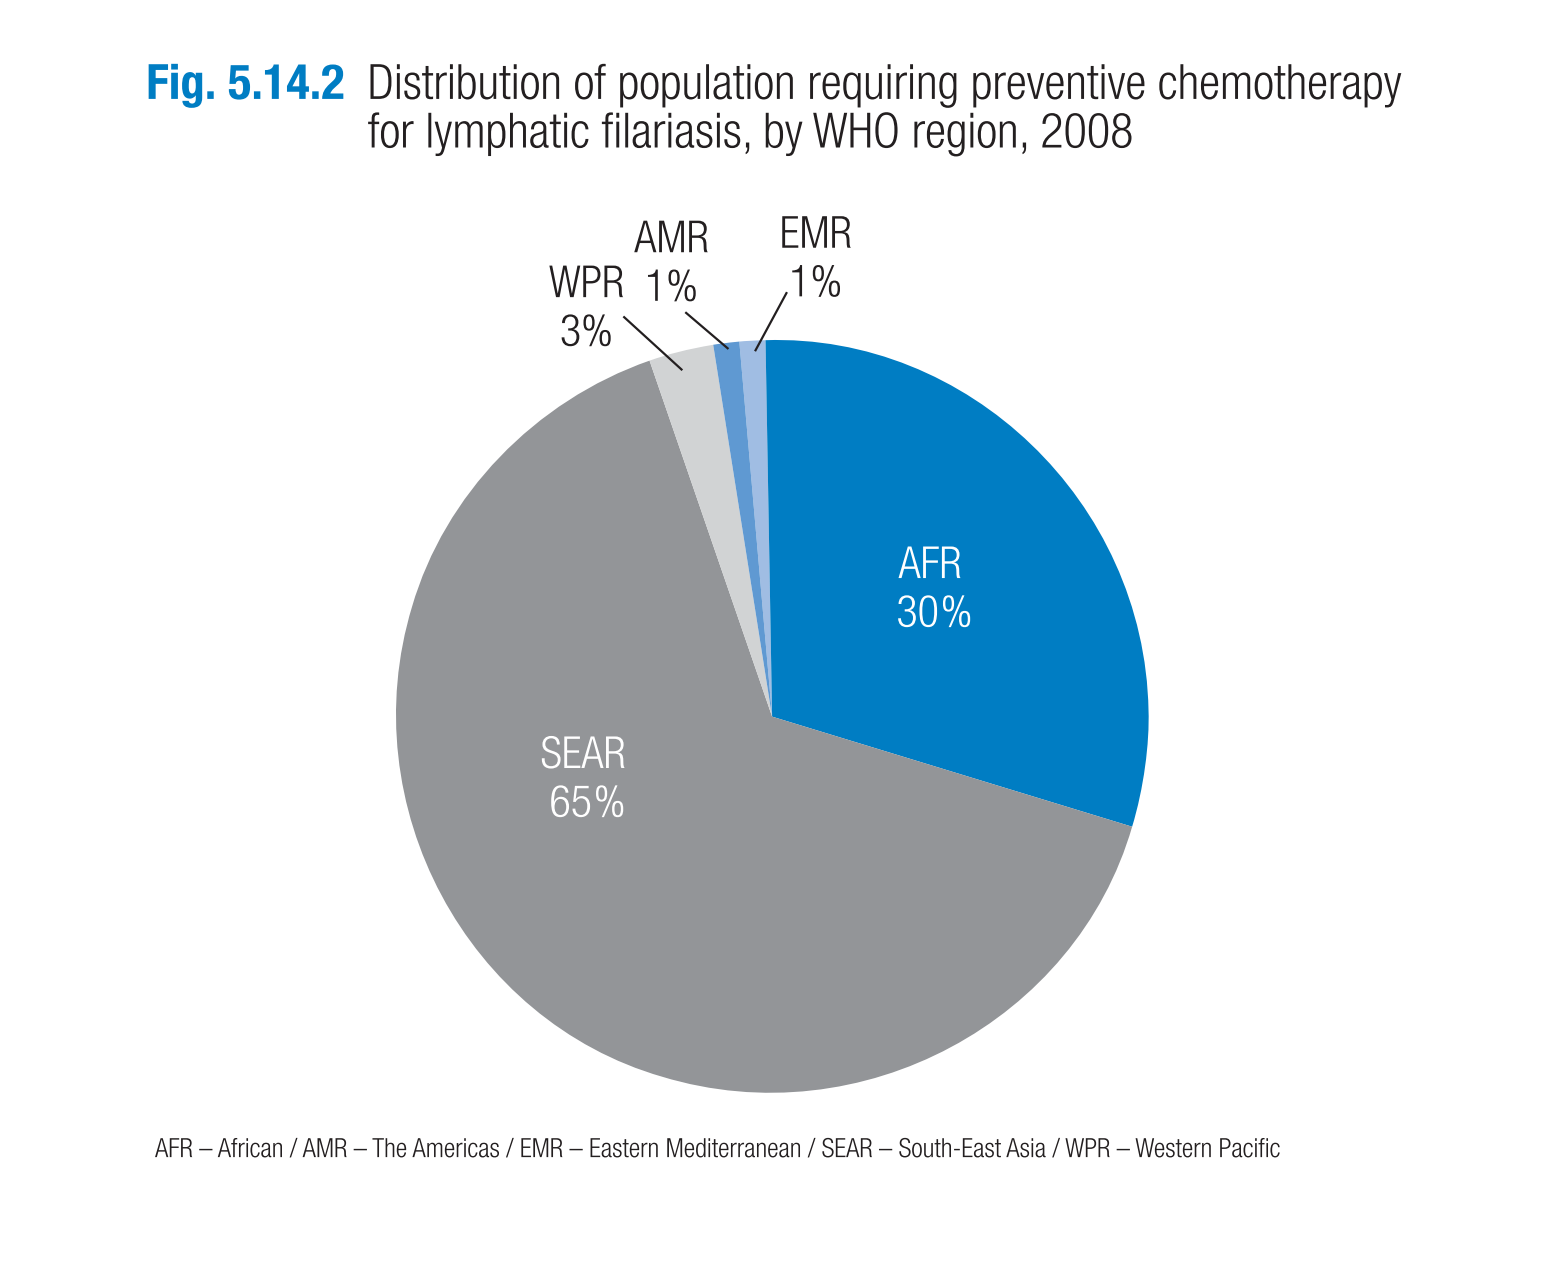
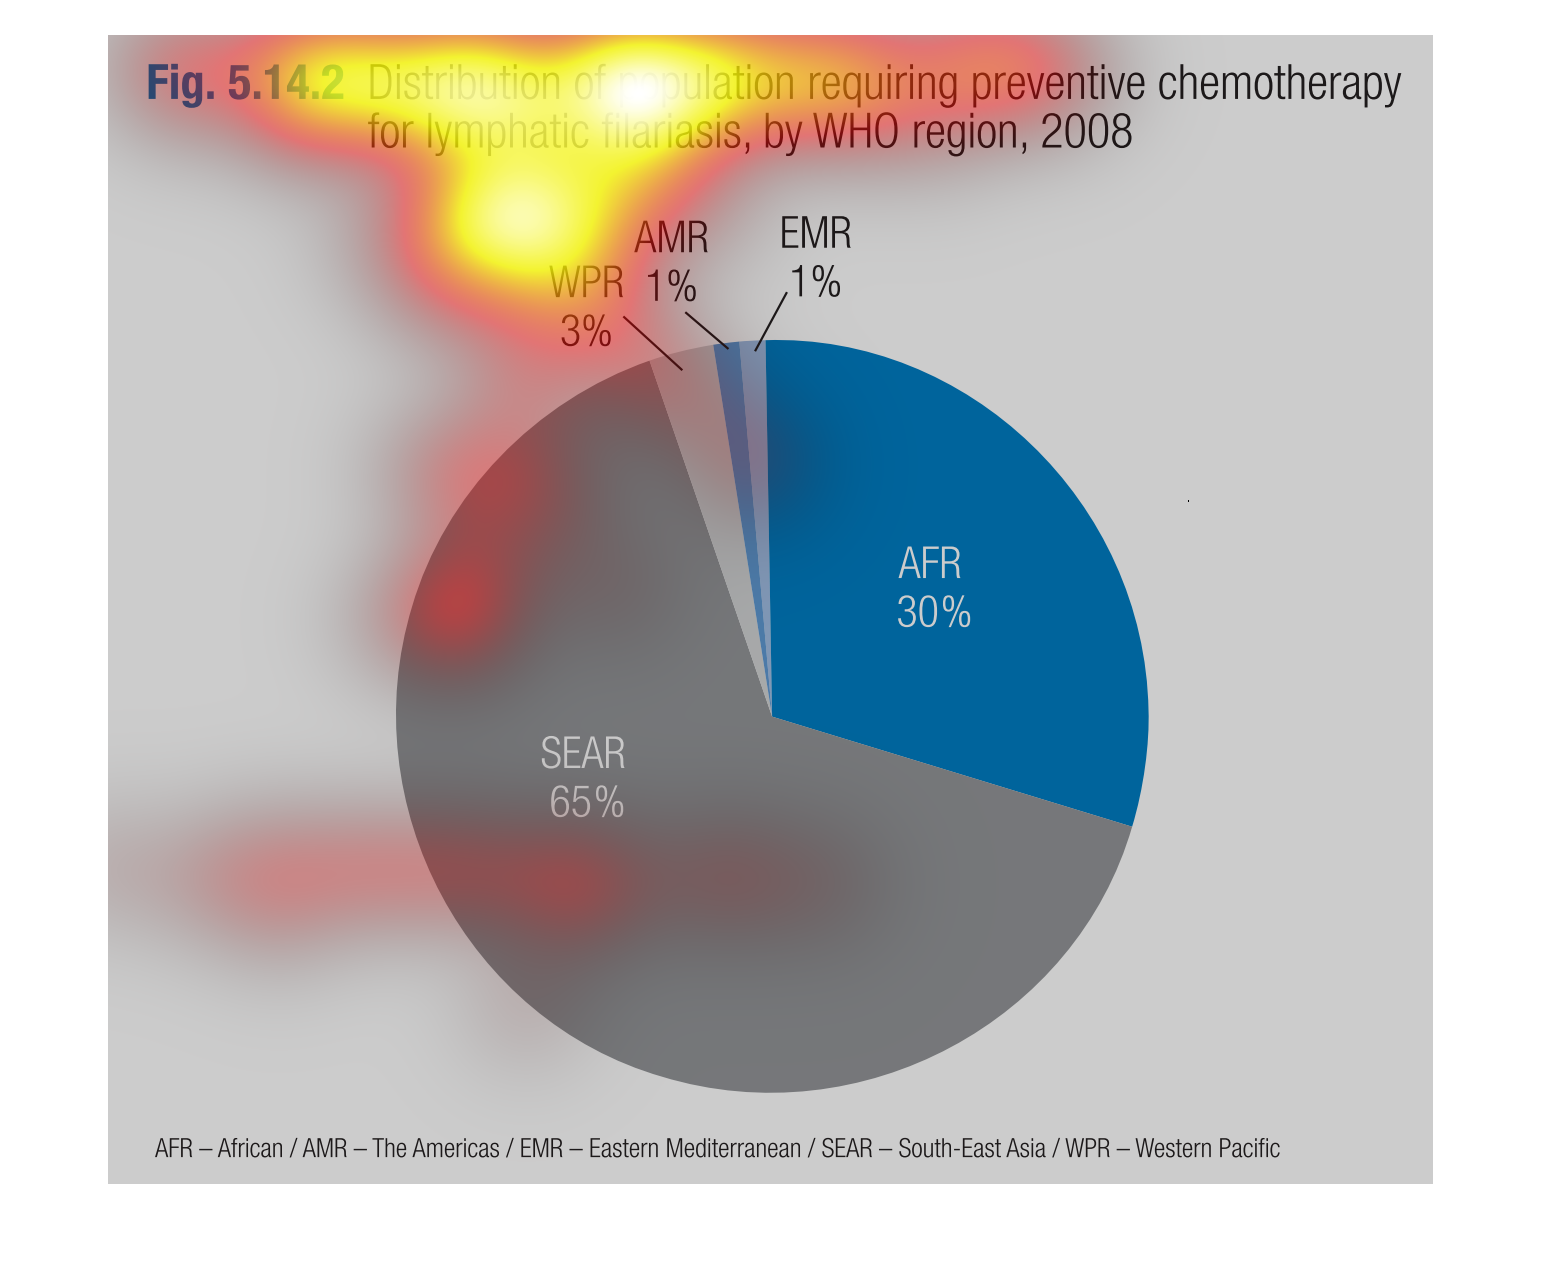
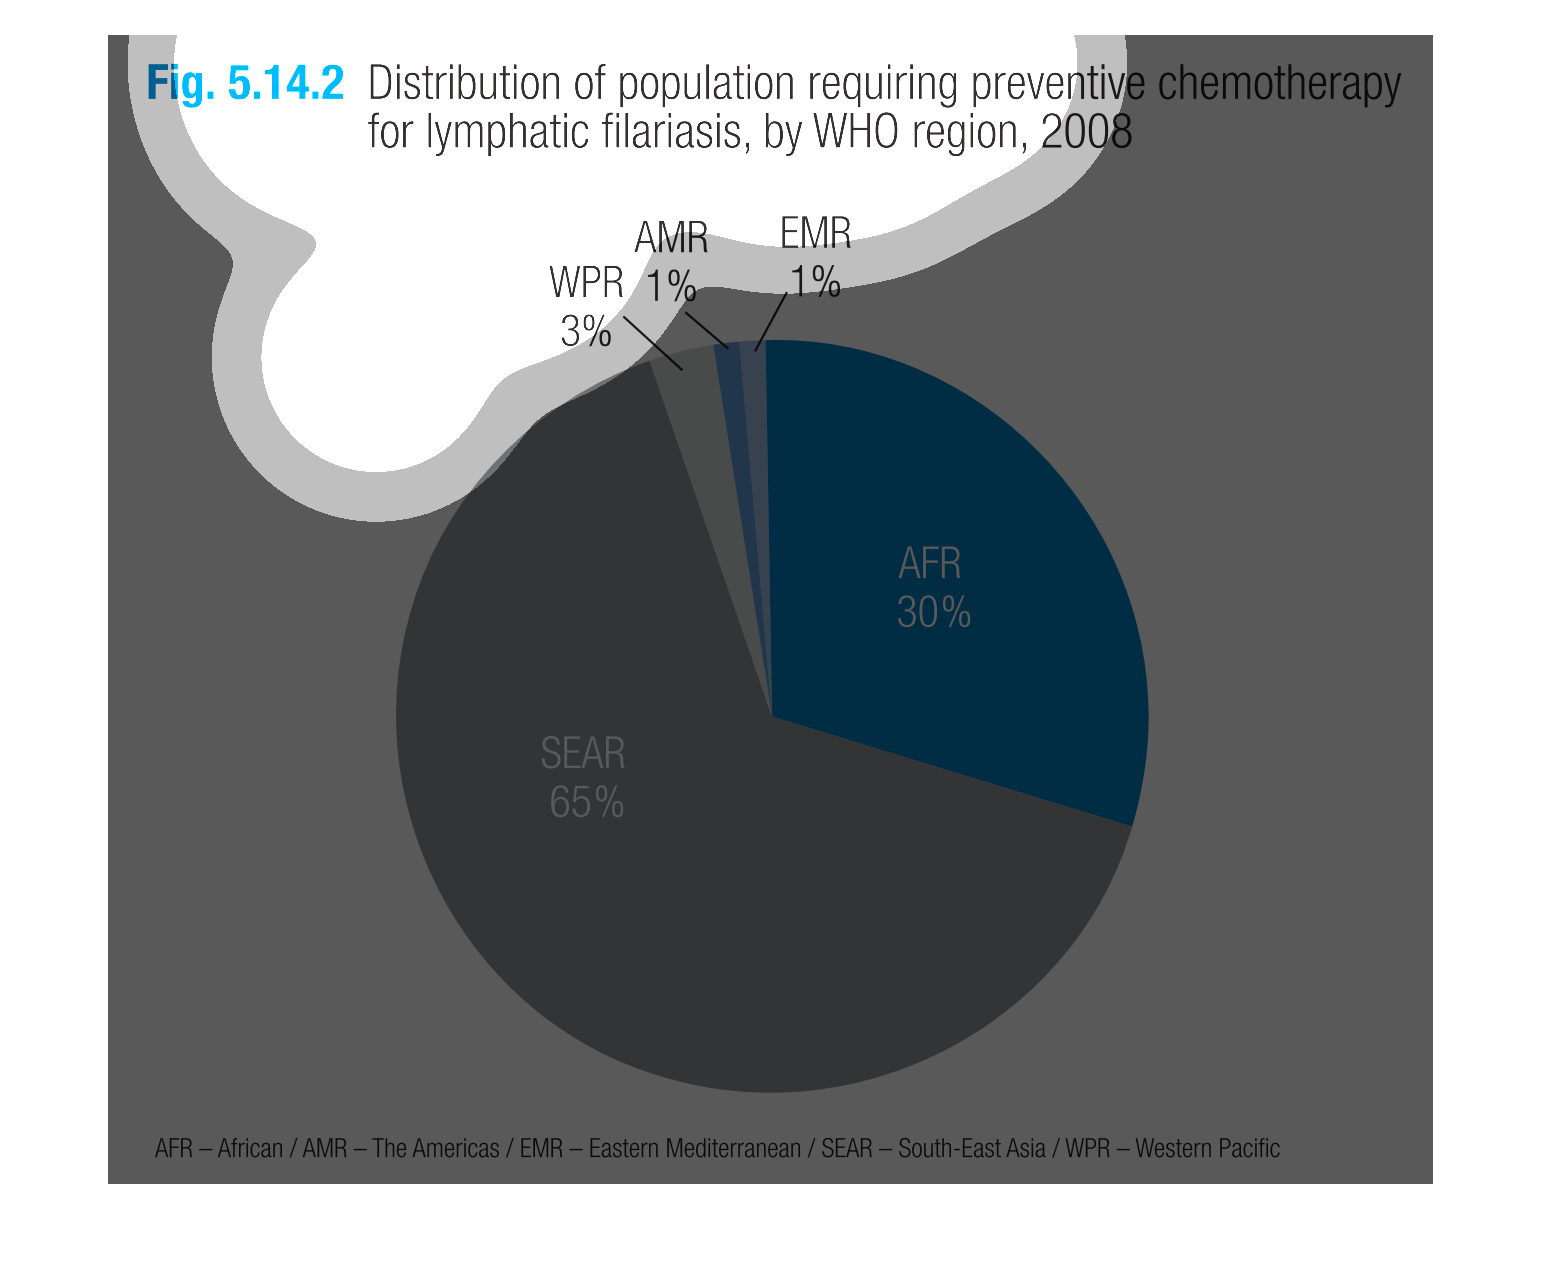
This graph shows distribution of population requiring preventative chemotherapy for lymphatic
filariasis, by WHO region, 2008. South-East Asia holds the highest population with 65% and
 Africans behind them with 30%. Western Pacific has 3%, Americans and Eastern Mediterranean
hold the population of 1%.
This pie chart is describing the population that requires preventative chemotherapy for lymphomic
filariasis from the World Health Organization in 2008.  It appears that South East Asia has
the largest percentage of the population that requires preventative chemotherapy, followed
by Africa.
This chart describes distribution of the population requiring preventive chemotherapy for
lymphatic filariasis, by WHO region, for the year 2008. Categories include AMR.
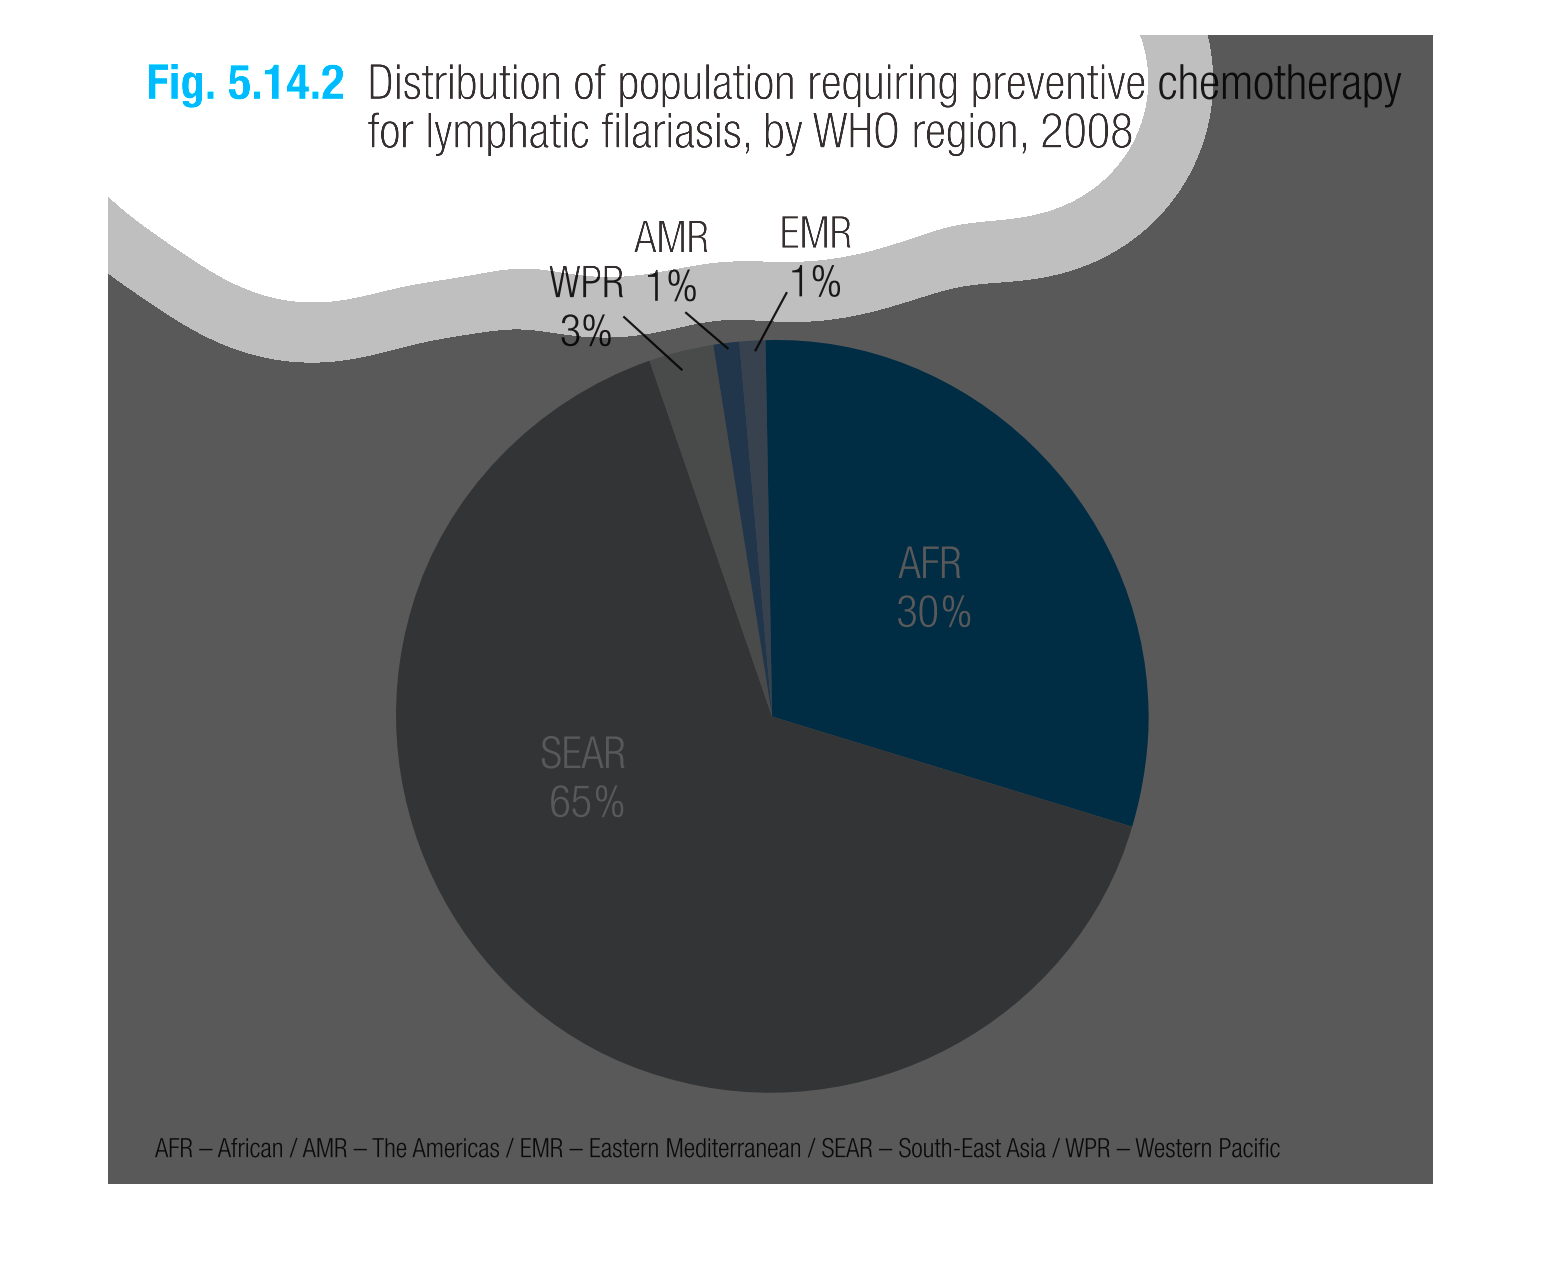
Distribution of population requiring preventative chemotherapy for lymphatic filariasis by
WHO for these regions in 2008 with Africa at 30%, EMR at 1%, AMR at 1%, WPR at 3%, and SEAR
at 65%
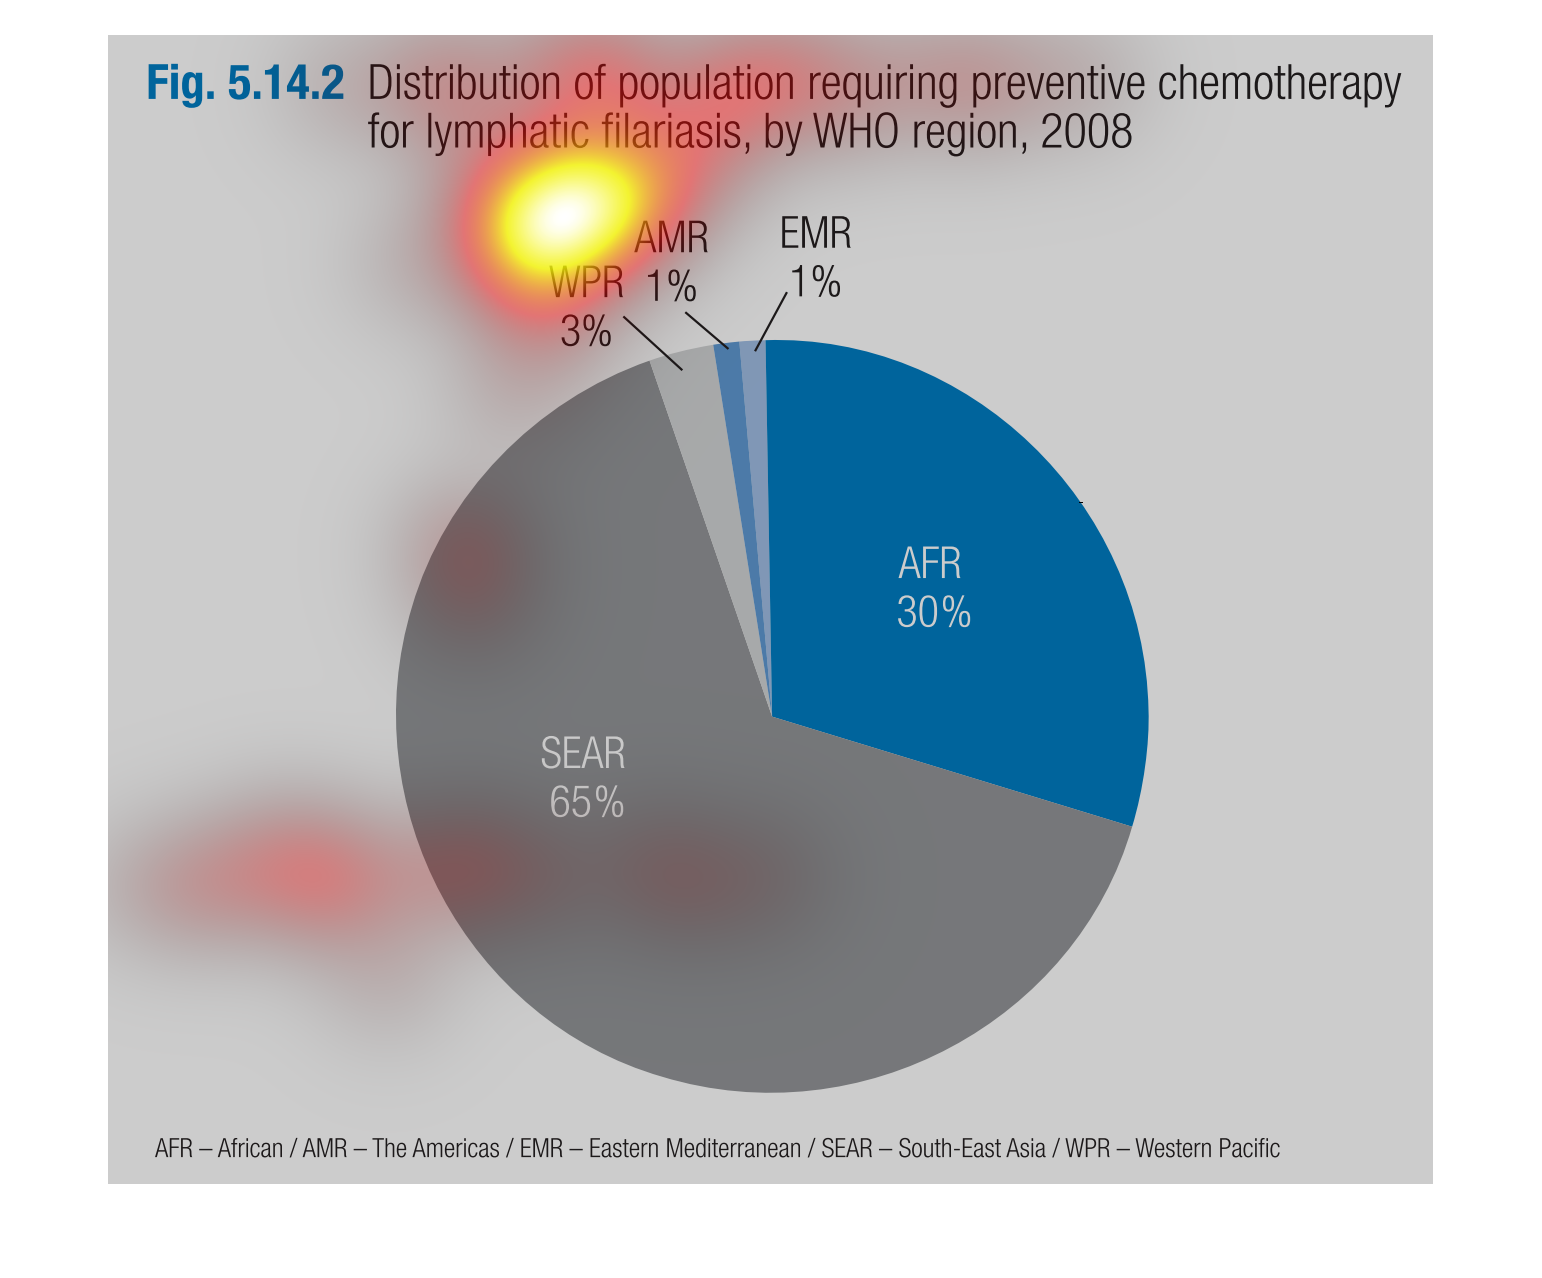
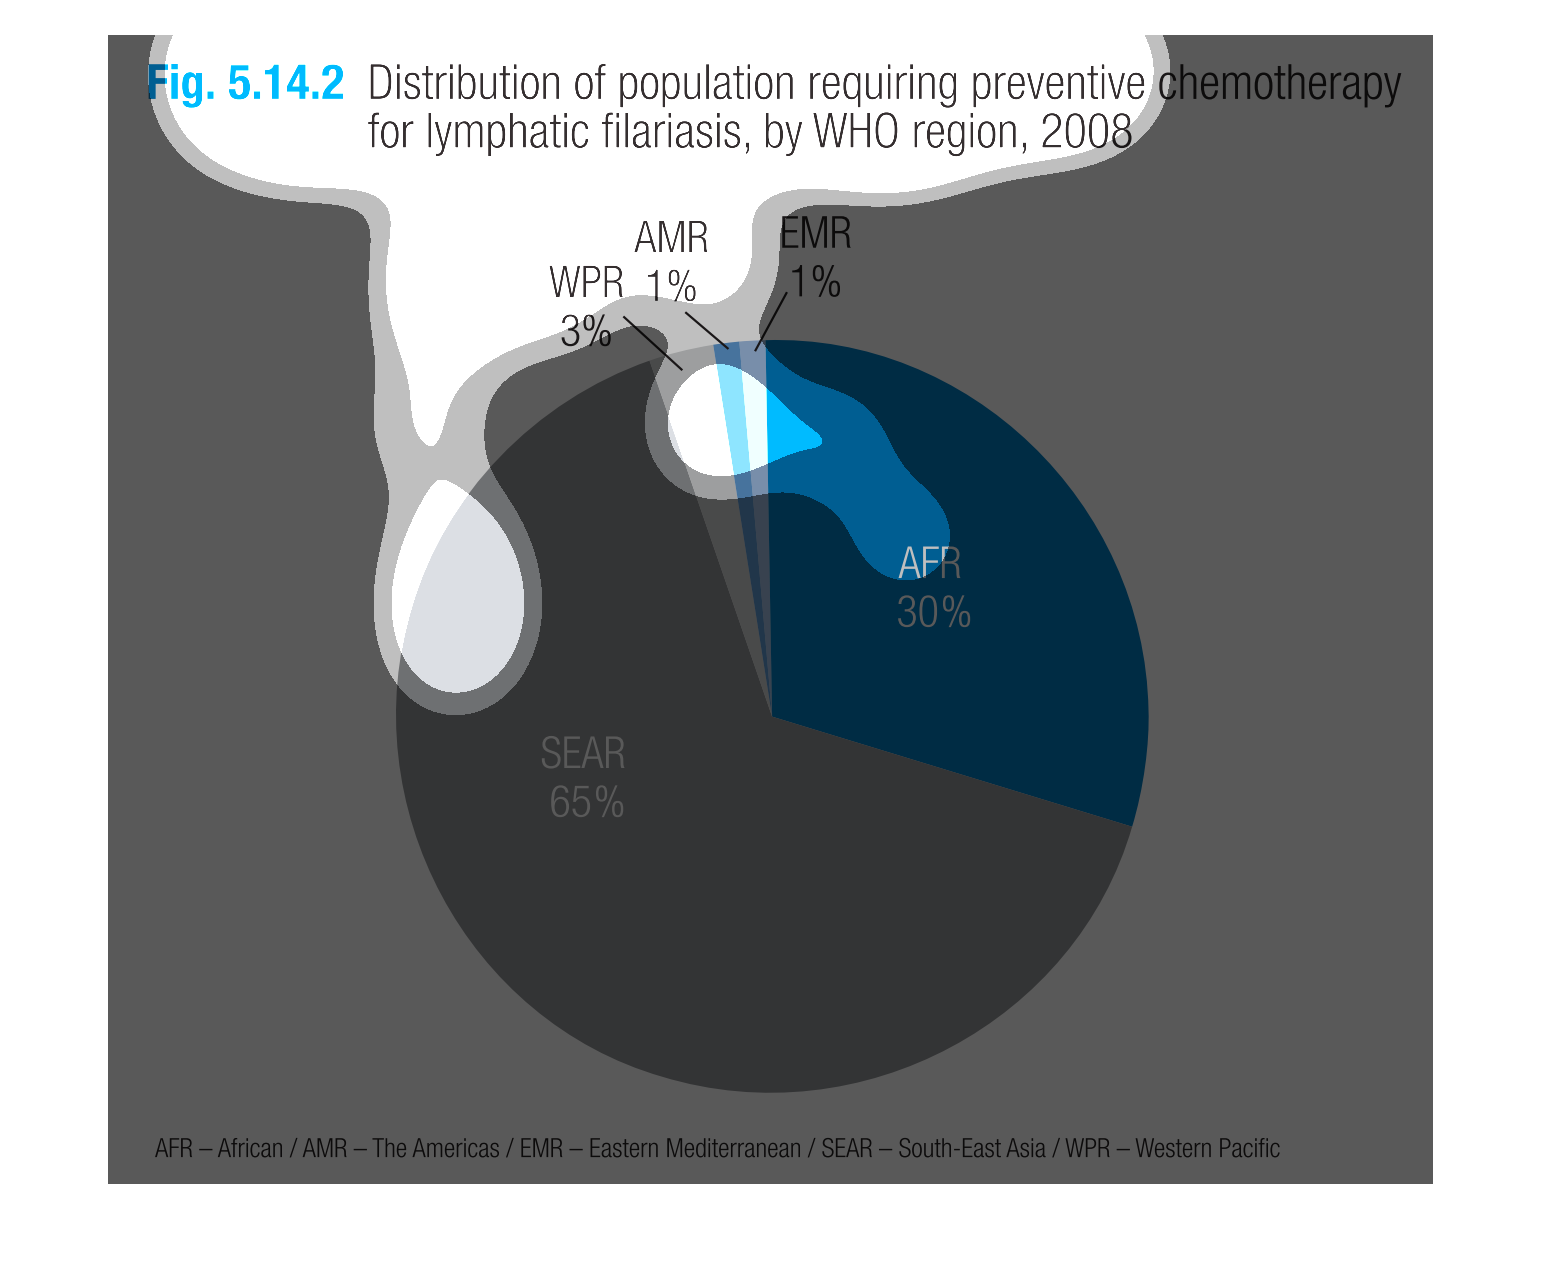
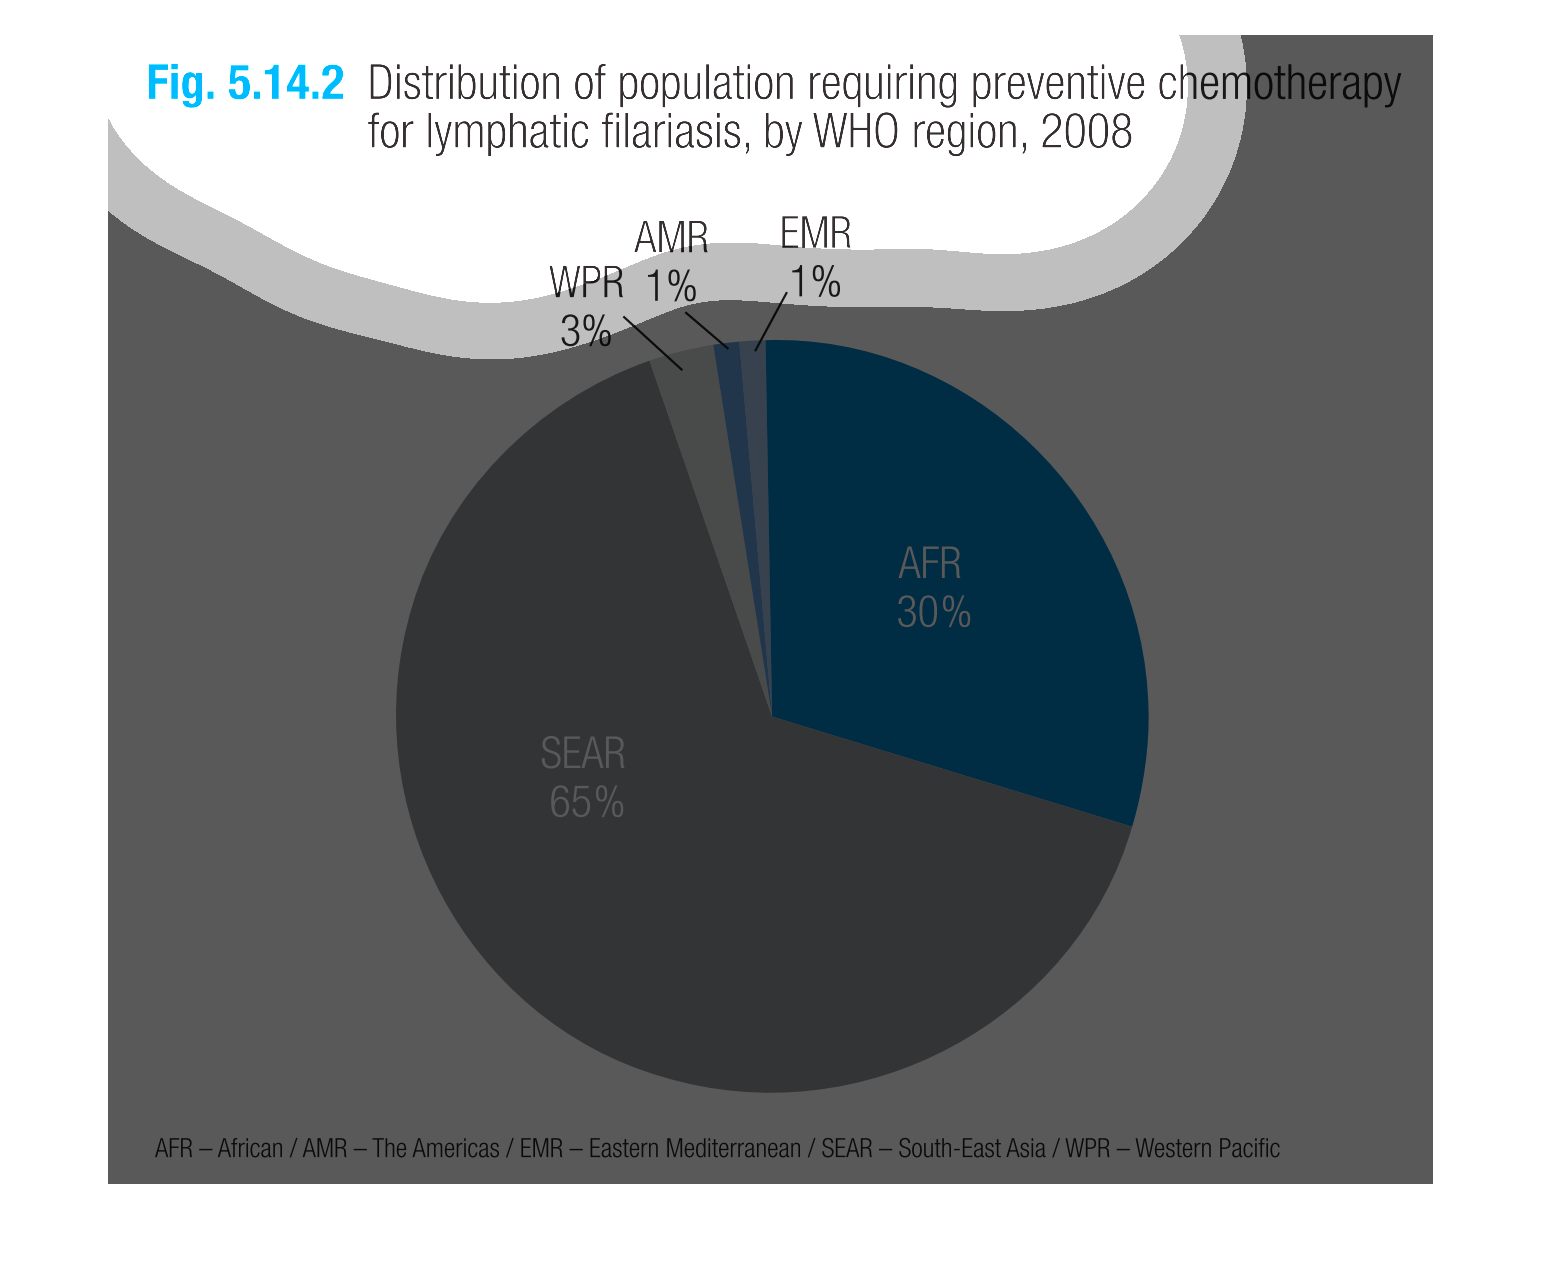
This pie chart shows the distribution of population requiring preventive chemotherapy for
lymphatic filariasis by WHO region, 2008. 65% of Southeast Asians require this preventive
chemo, 30% of African americans require it, 3% of Western Pacific require it,  1% of Eastern
Mediterraneans require it, and 1% of people in the Americas require it.
The pie chart describes the distribution of population requiring preventative chemotherapy
for lymphatic filariasis, circa 2008. The study was conducted by the WHO region. About 2/3
of the graph is for the population of Southeast Asians, 30% for Africans, 3%  for Western
Pacific peoples, and the remaining 2% split evenly between those in the Americas and Africans.
This handmade chart shows the population of lympohatic filamariasis around the world and the
need for chemotherapy. Other than that it is hard to remember
The figure presented is titled Figure 5.14.2 distribution of population requiring preventive
chemotherapy for lymphatic filariasis, by WHO region, 2008.
This is a graph of the distribution of the population requiring preventive chemotherapy for
lymphatic filariasis by WHO region. SEAR has the largest percent, at 65.