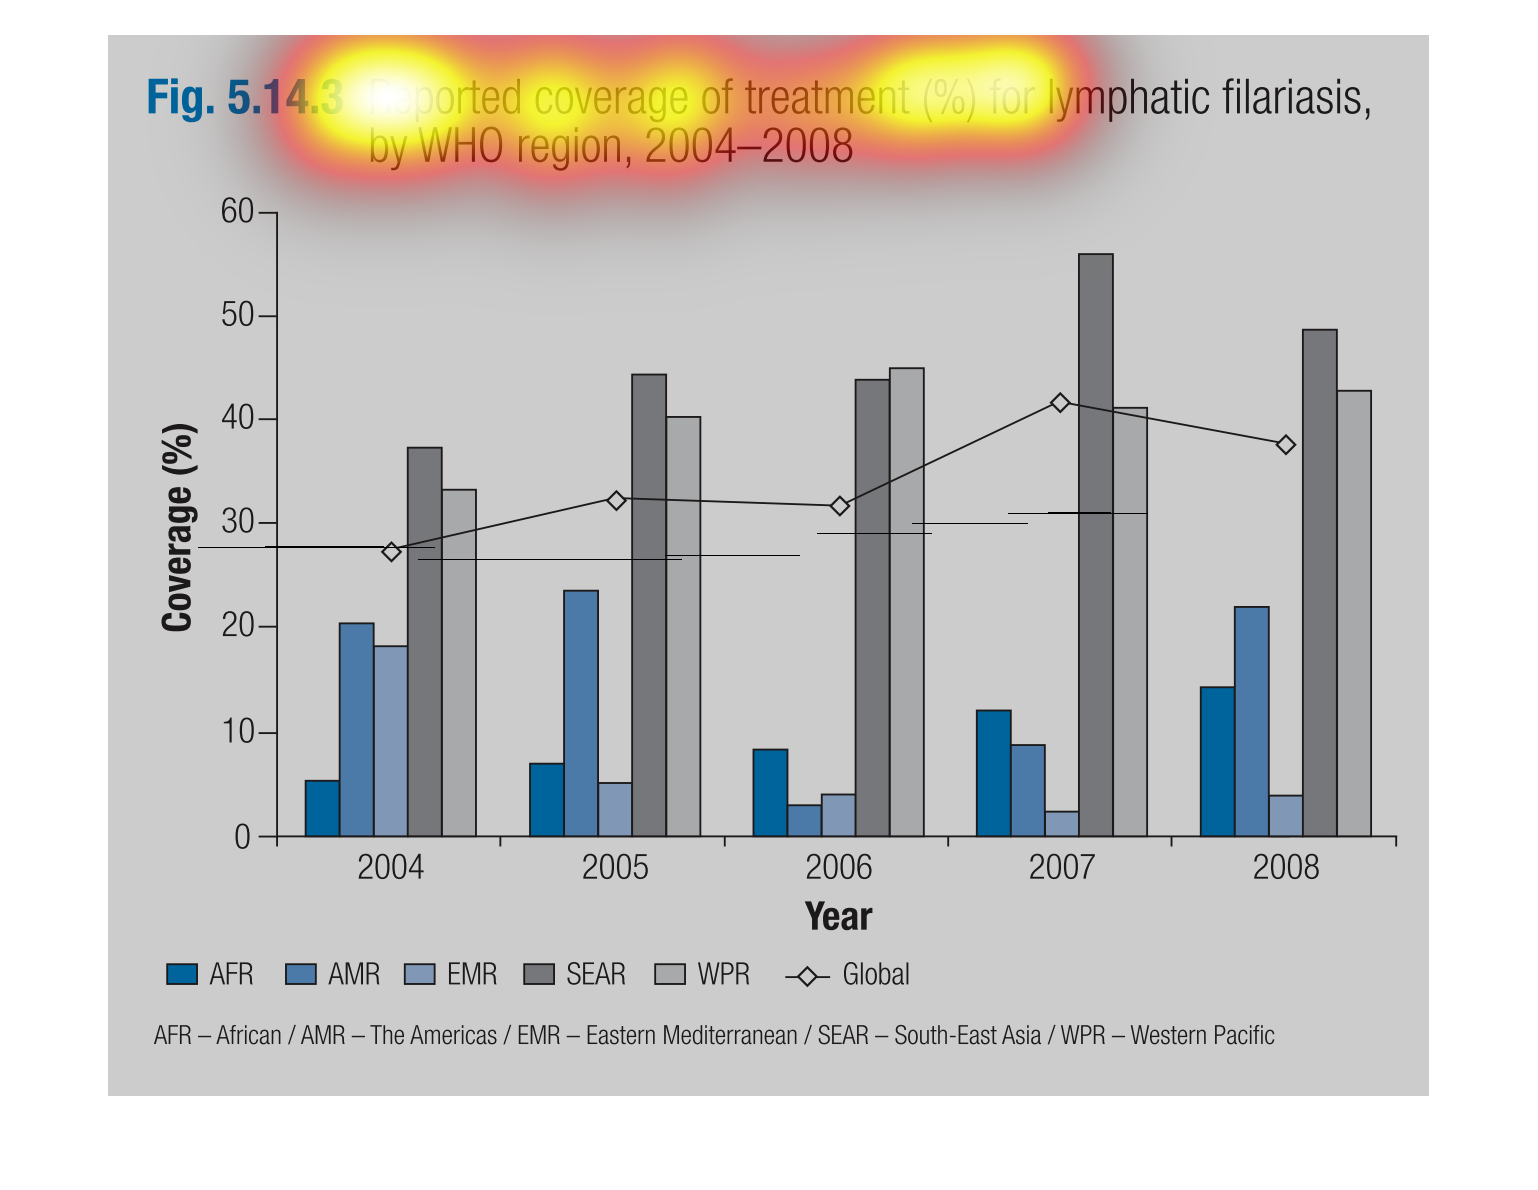
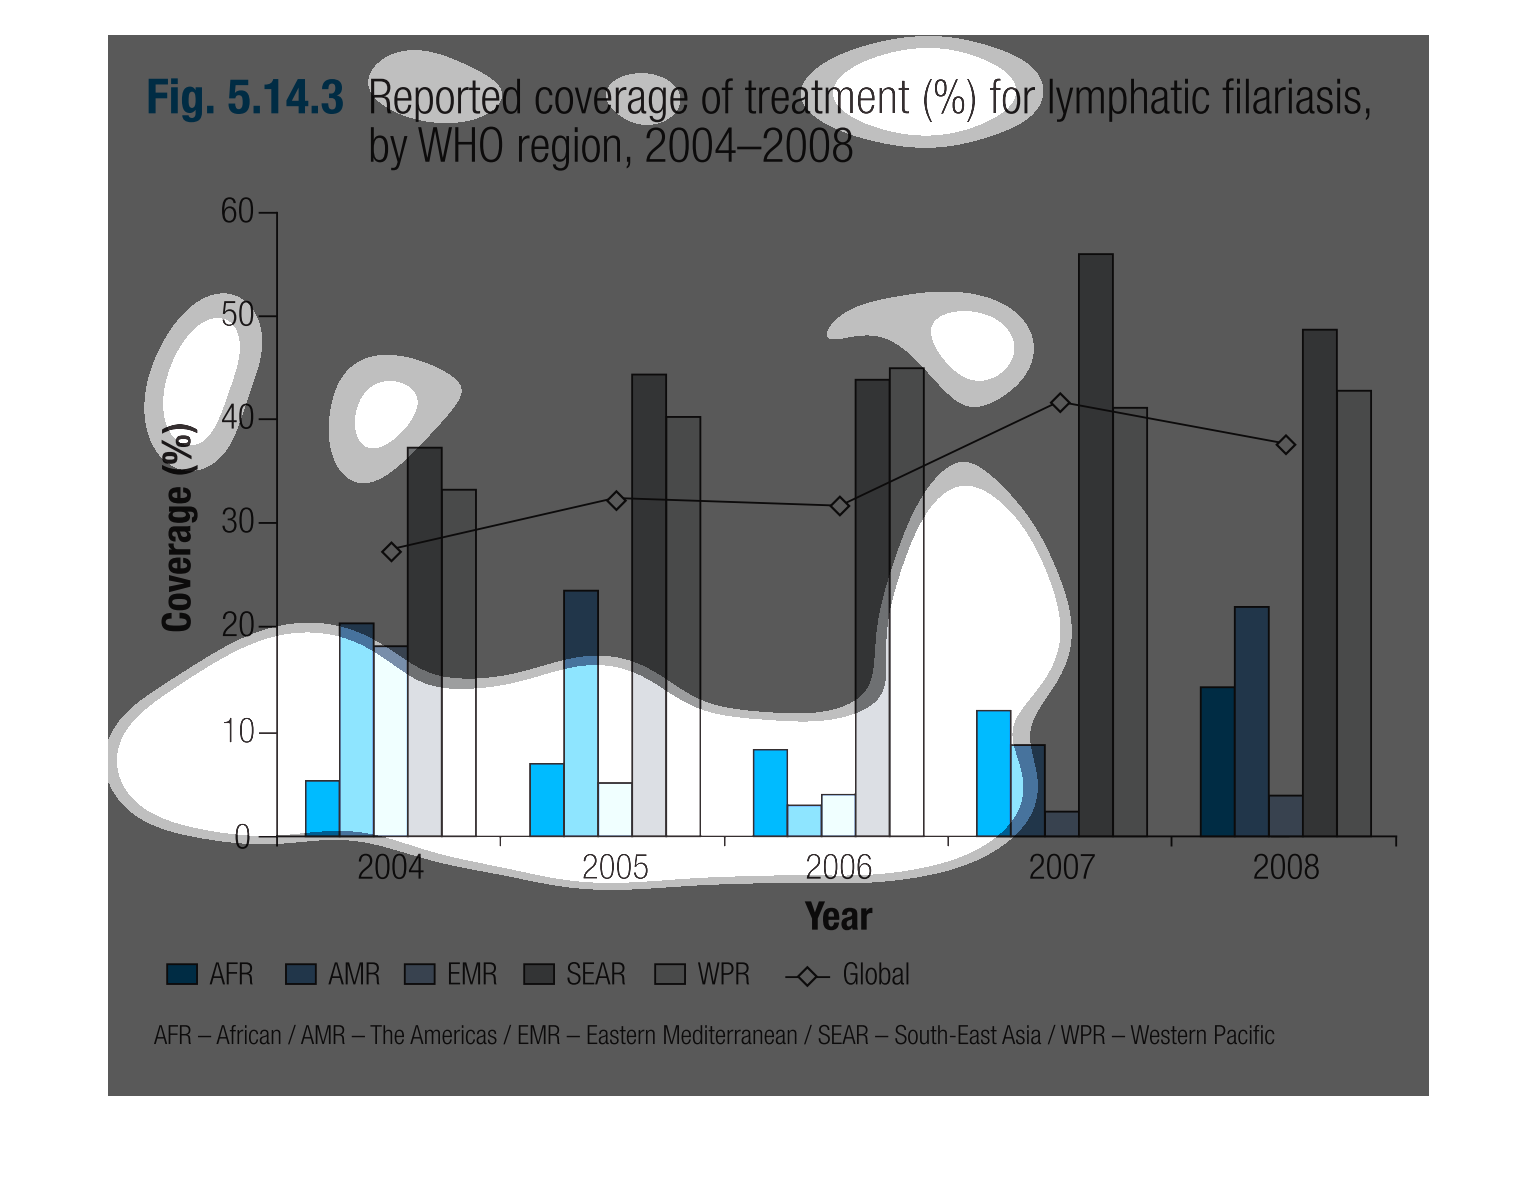
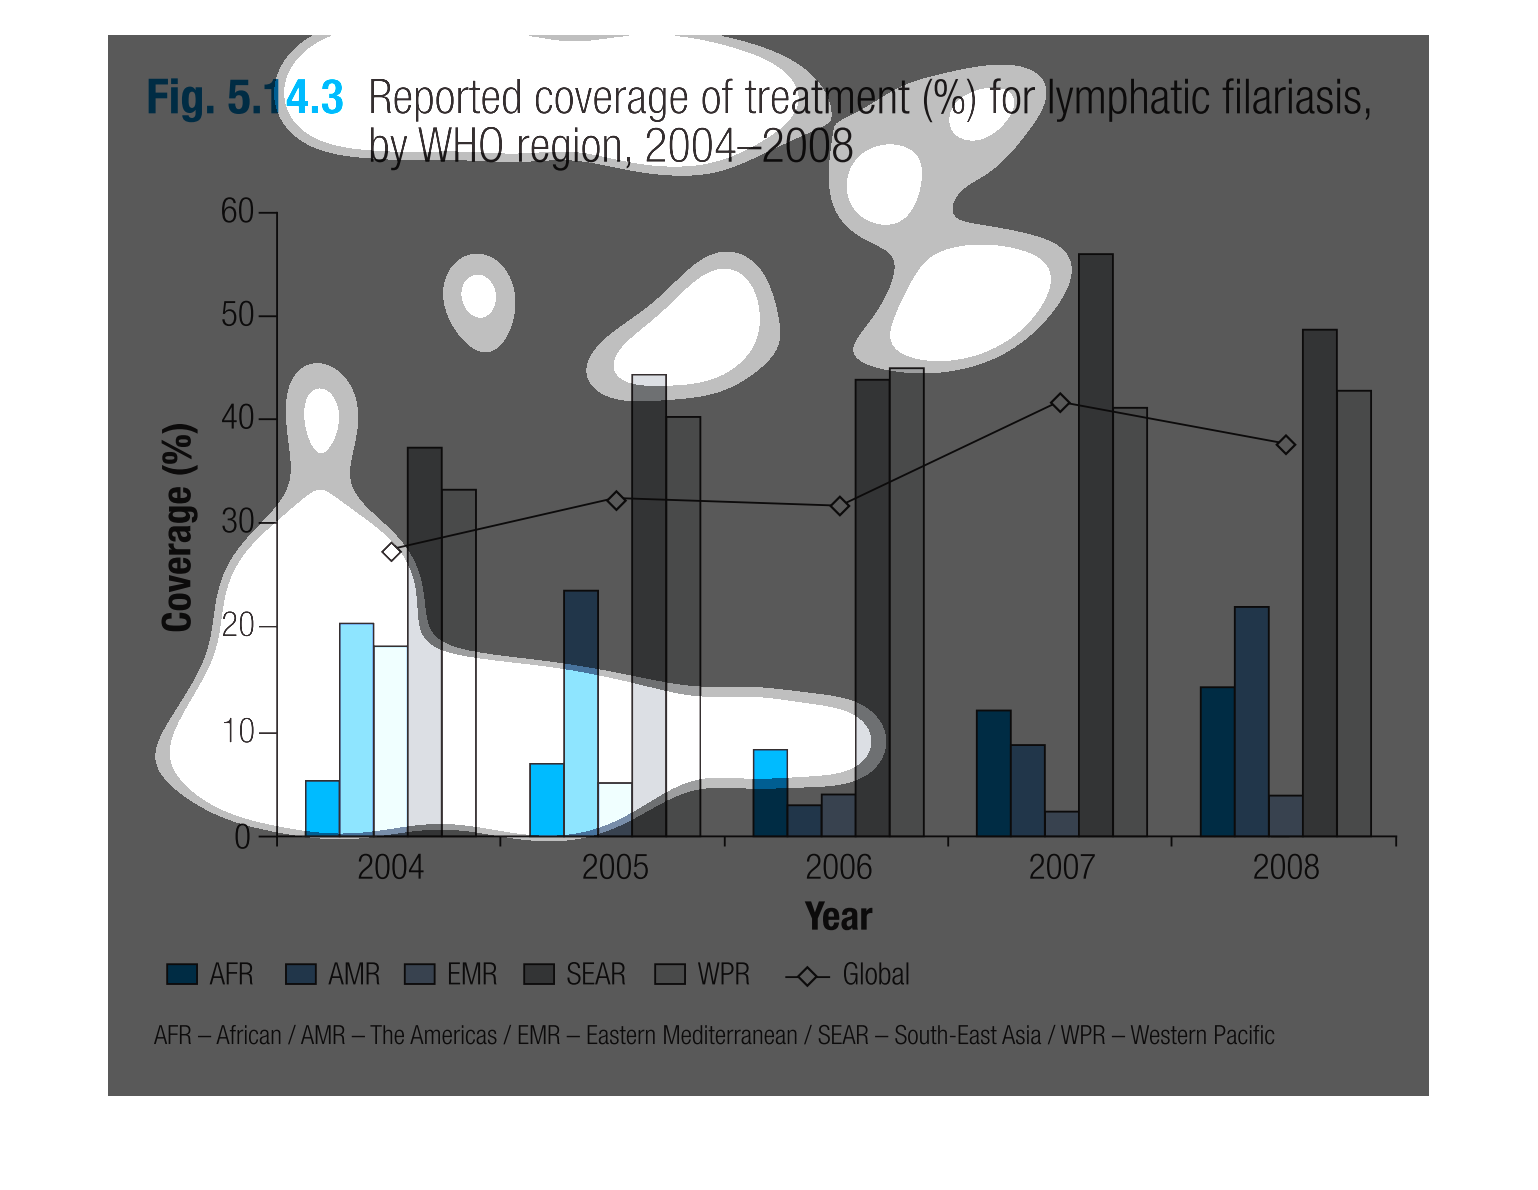
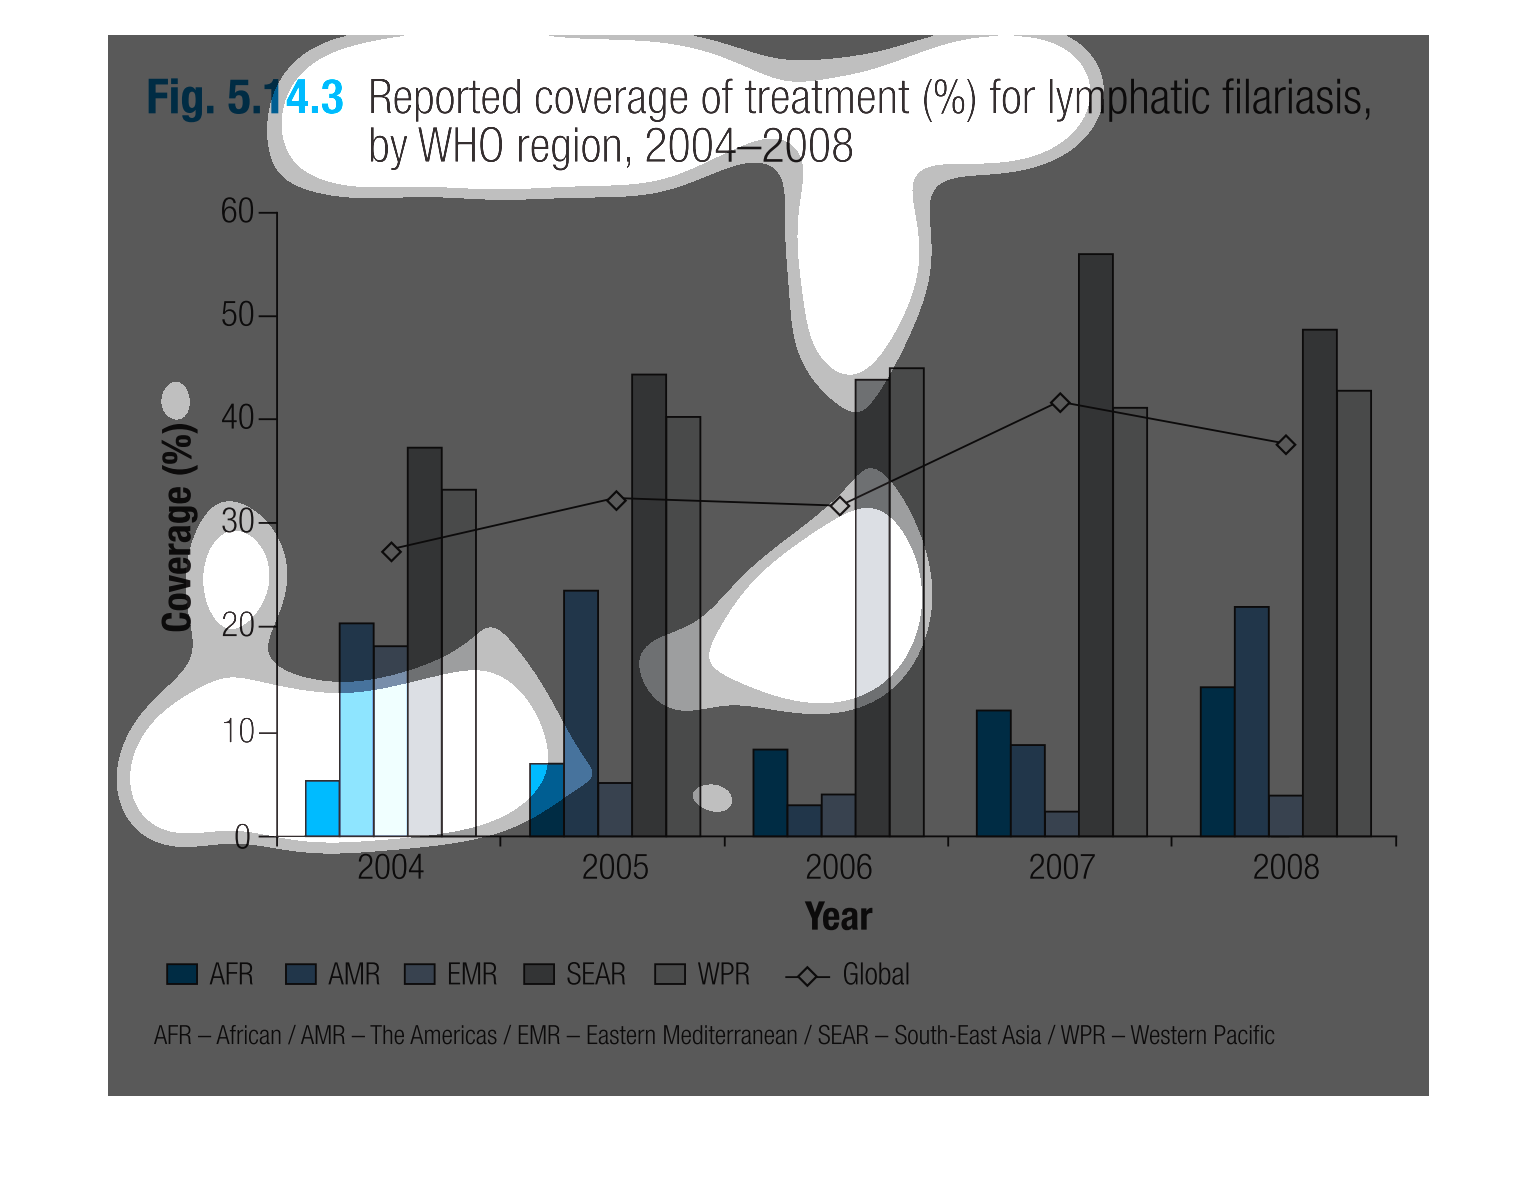
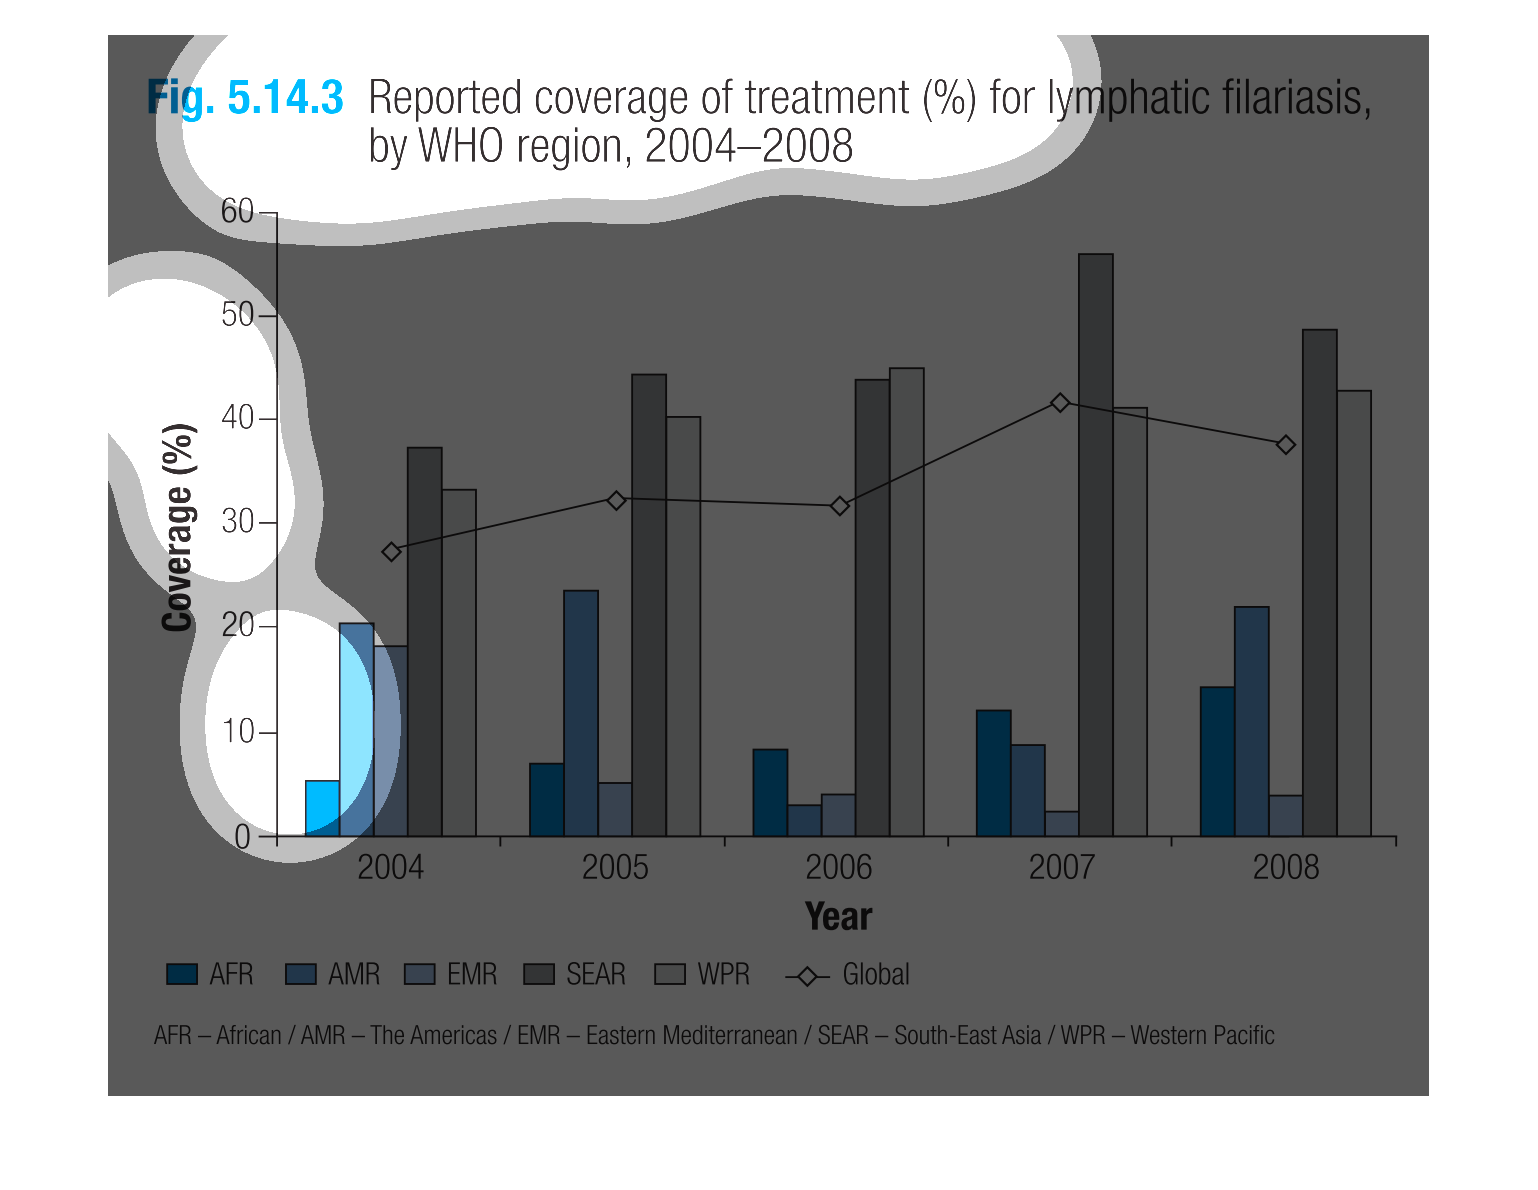
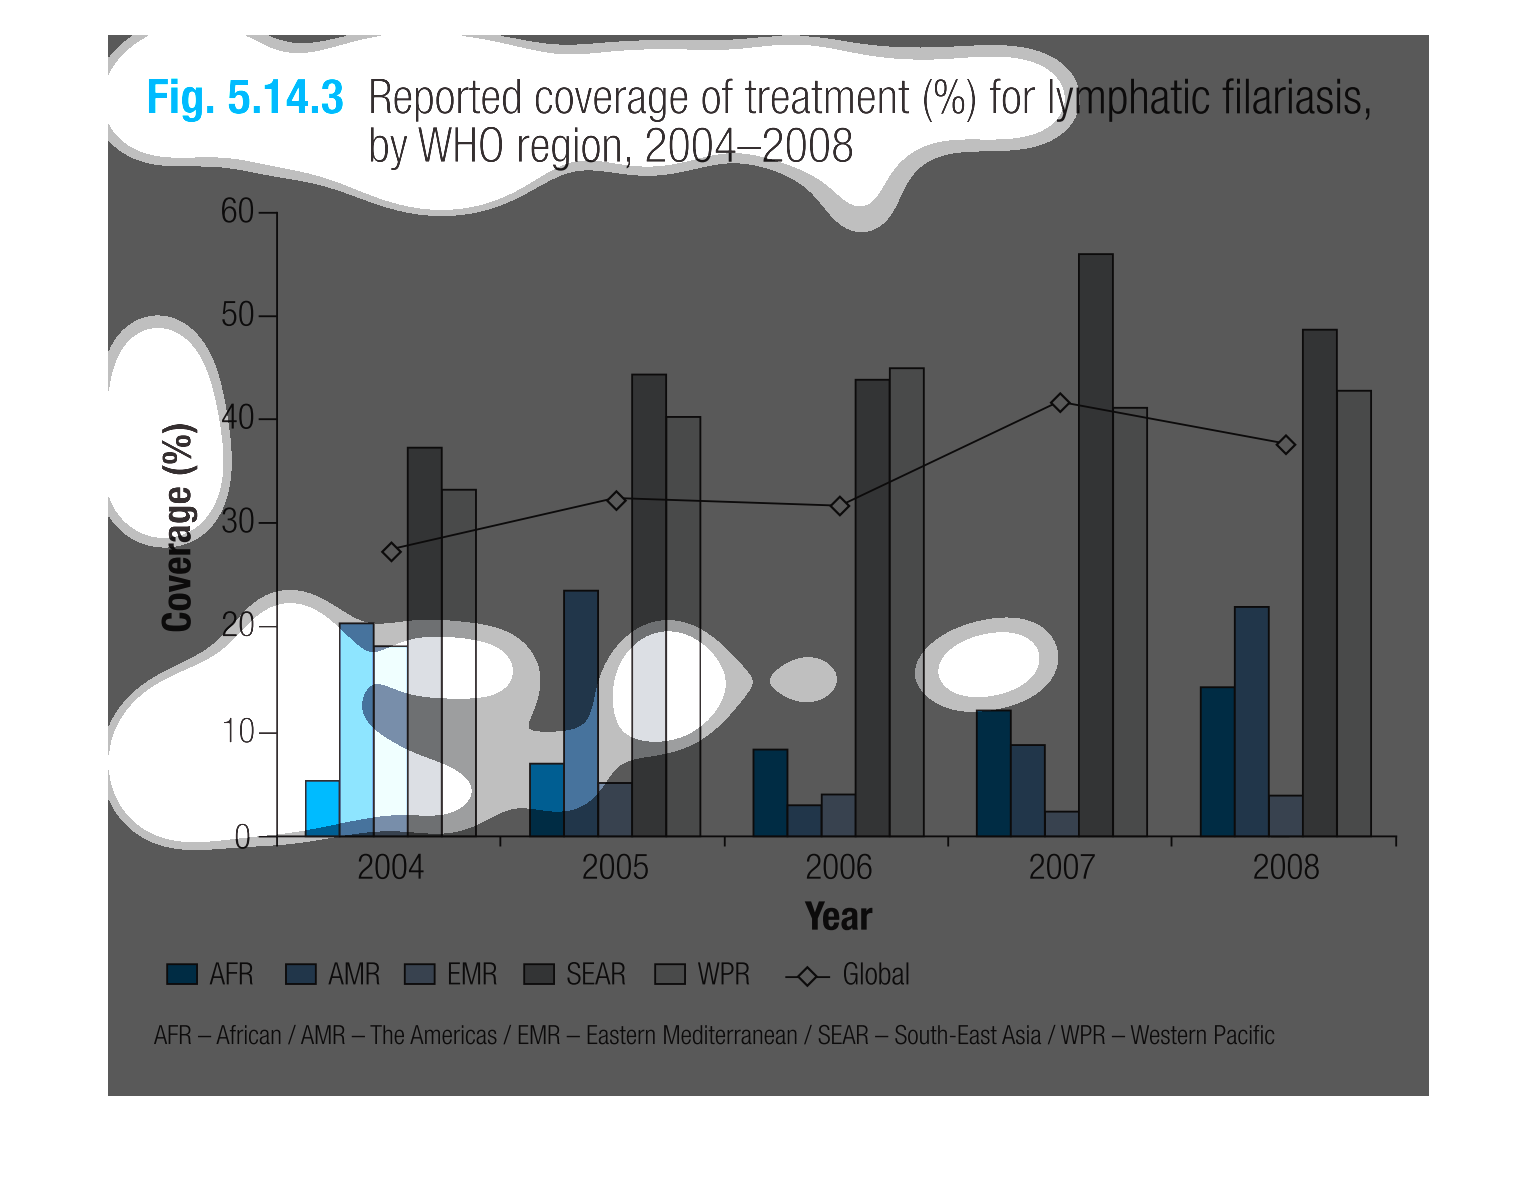
The image depicts a graph of reported coverage of treatment in percentages for lymphatic filariasis
by WHO region, years 2004-2008. Regions include: African, The Americas, Eastern Mediterranean,
South East Asia, and Western Pacific. Treatment is less present in Africa and The Americas,
with global treatment being much higher .
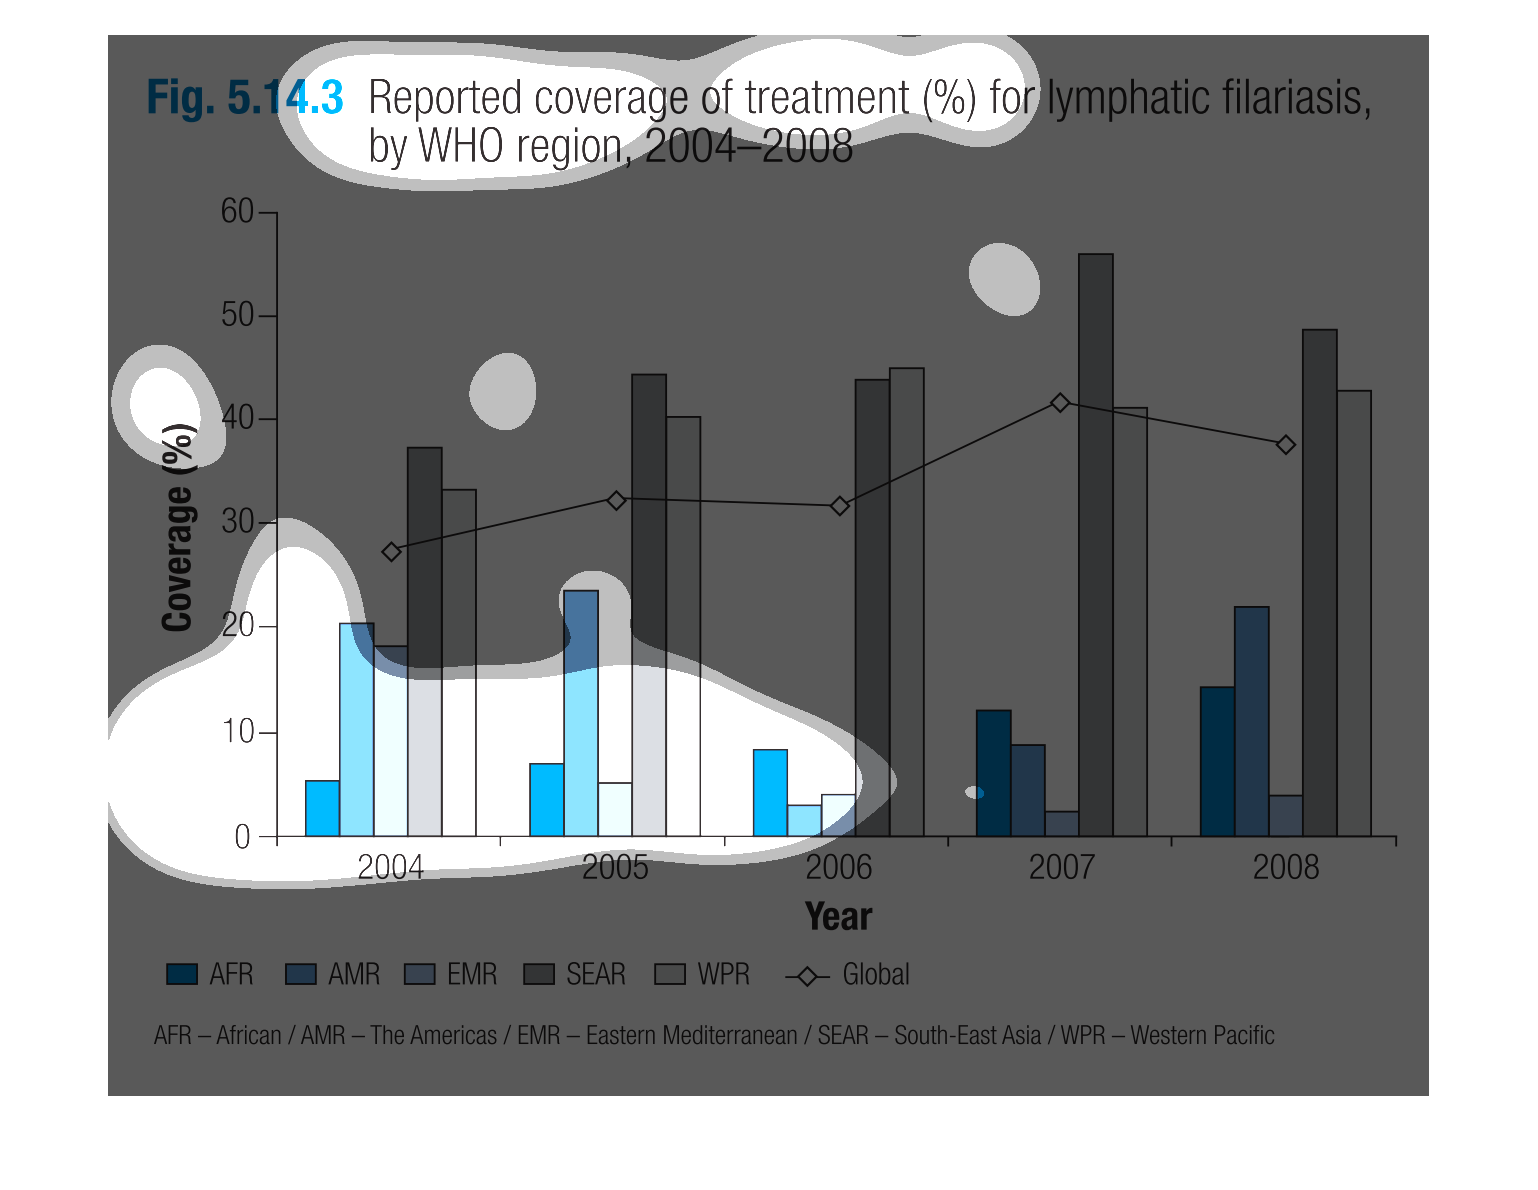
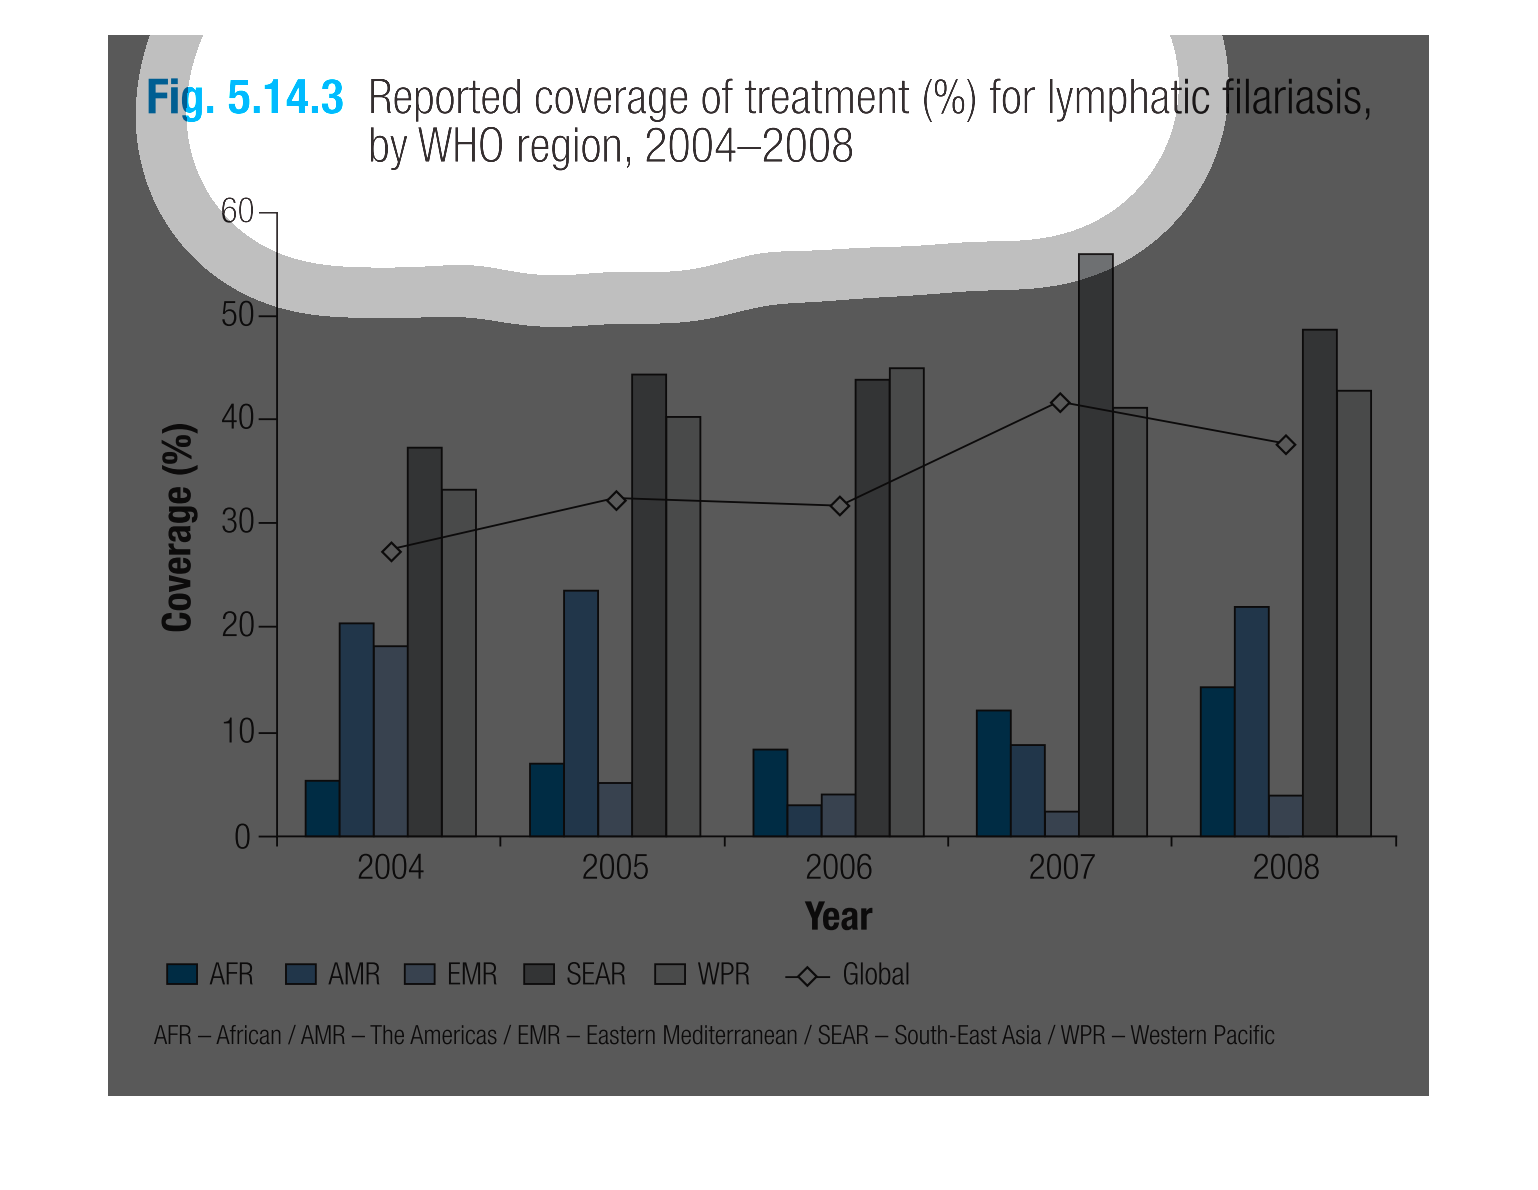
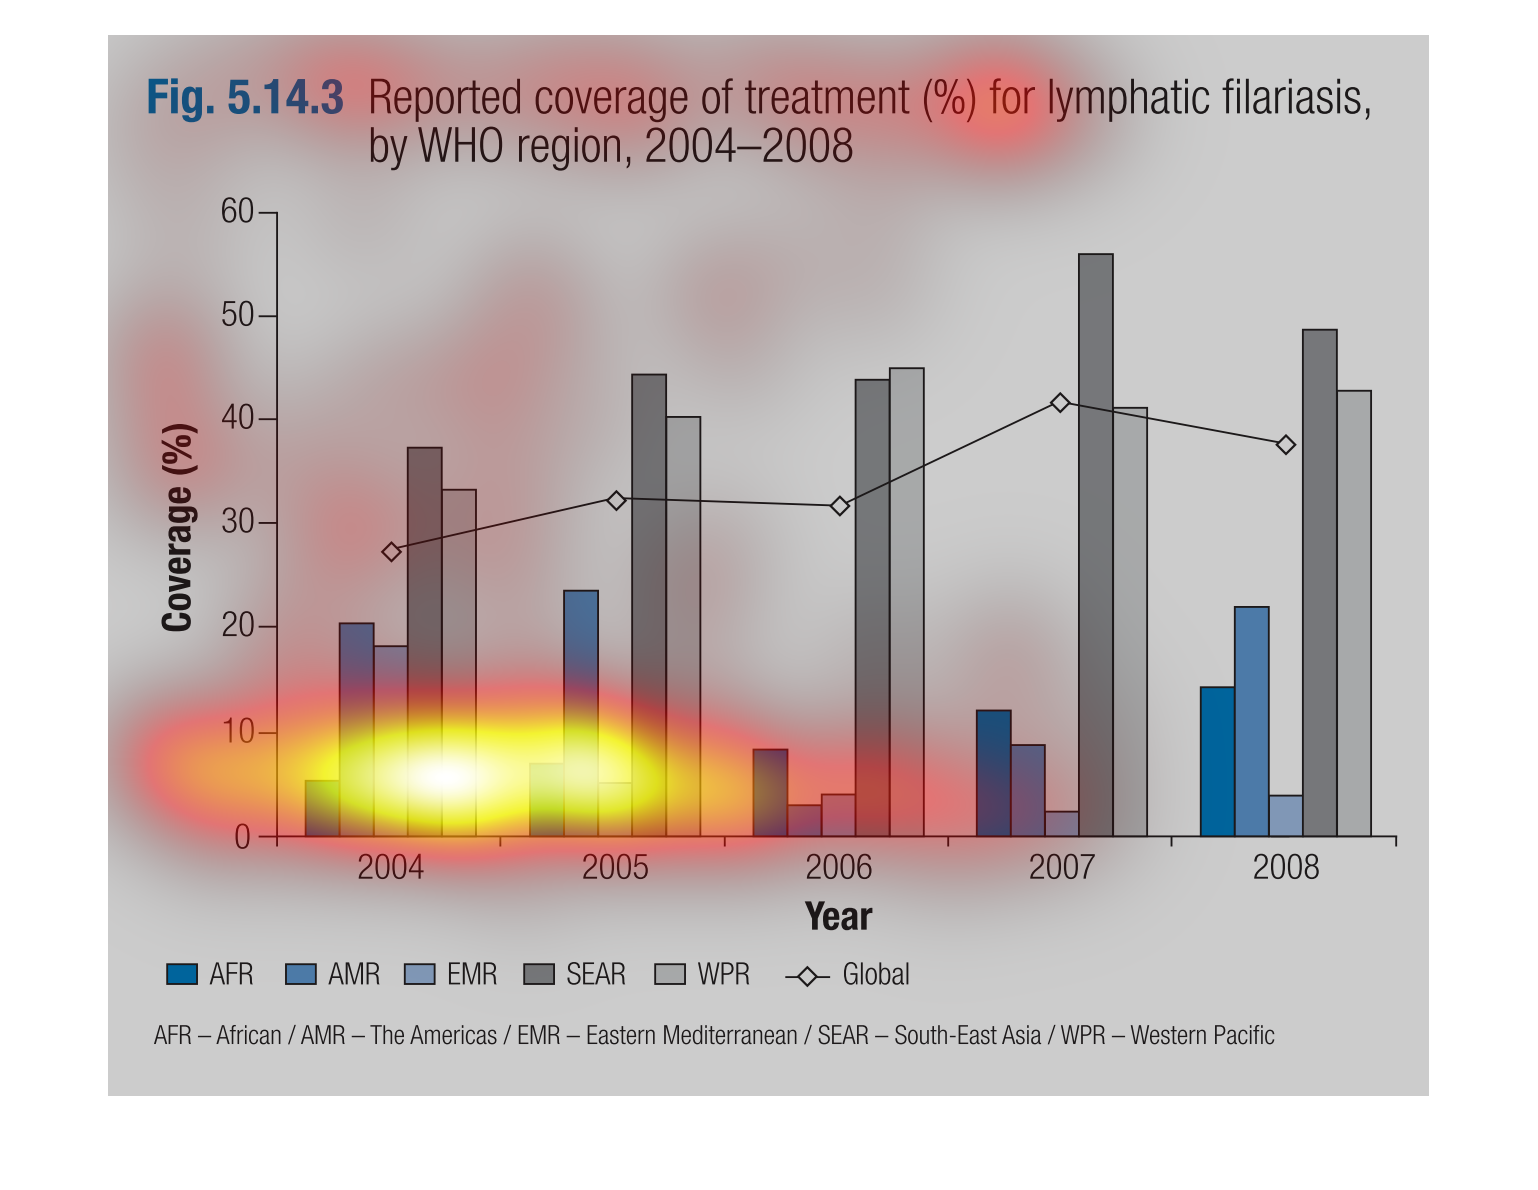
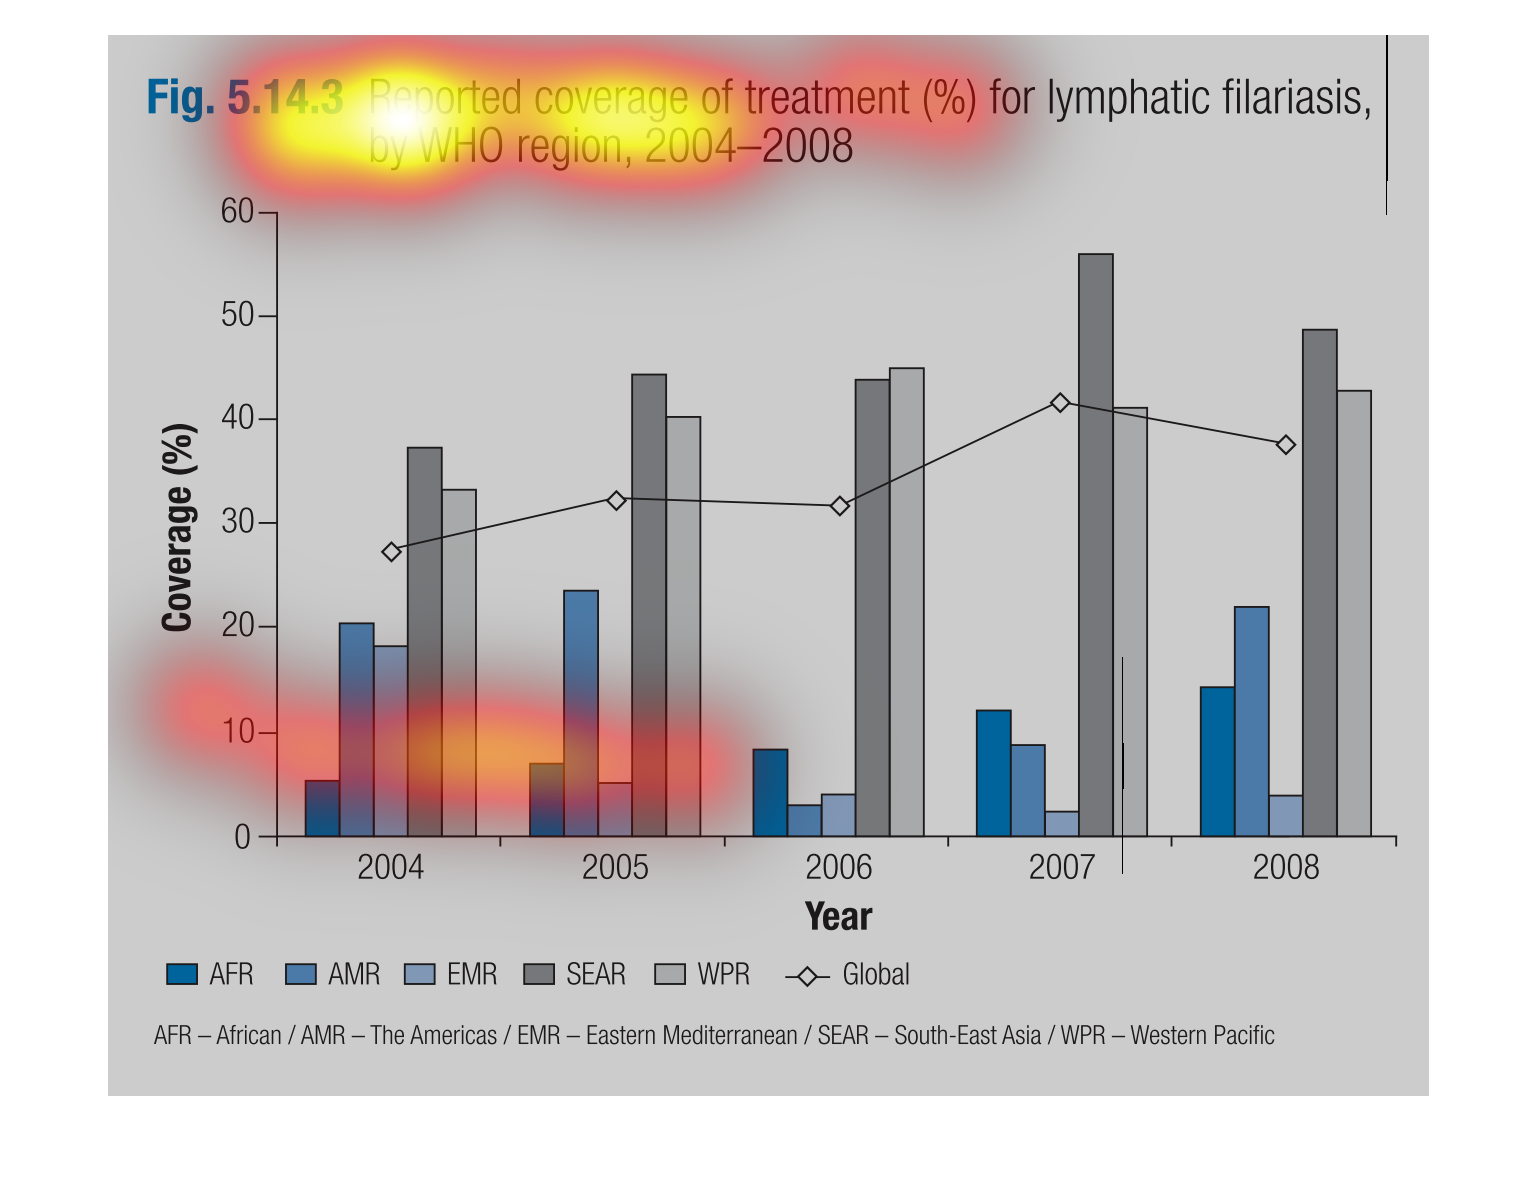
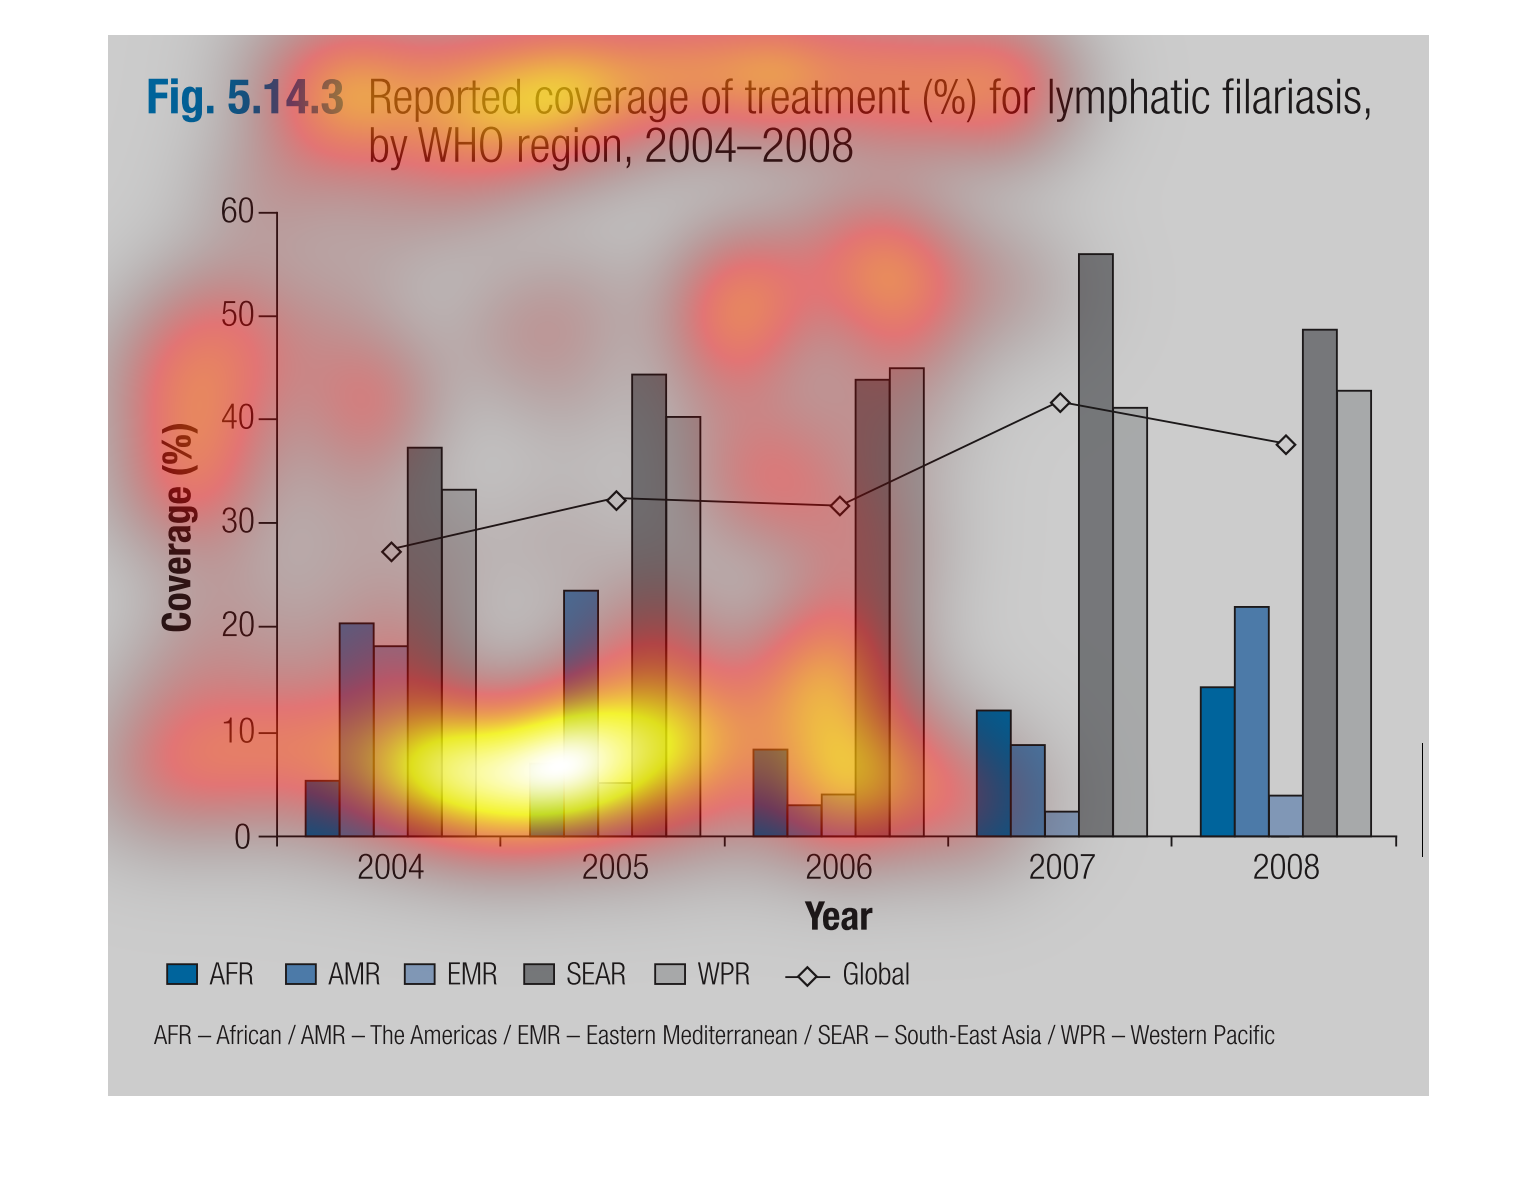
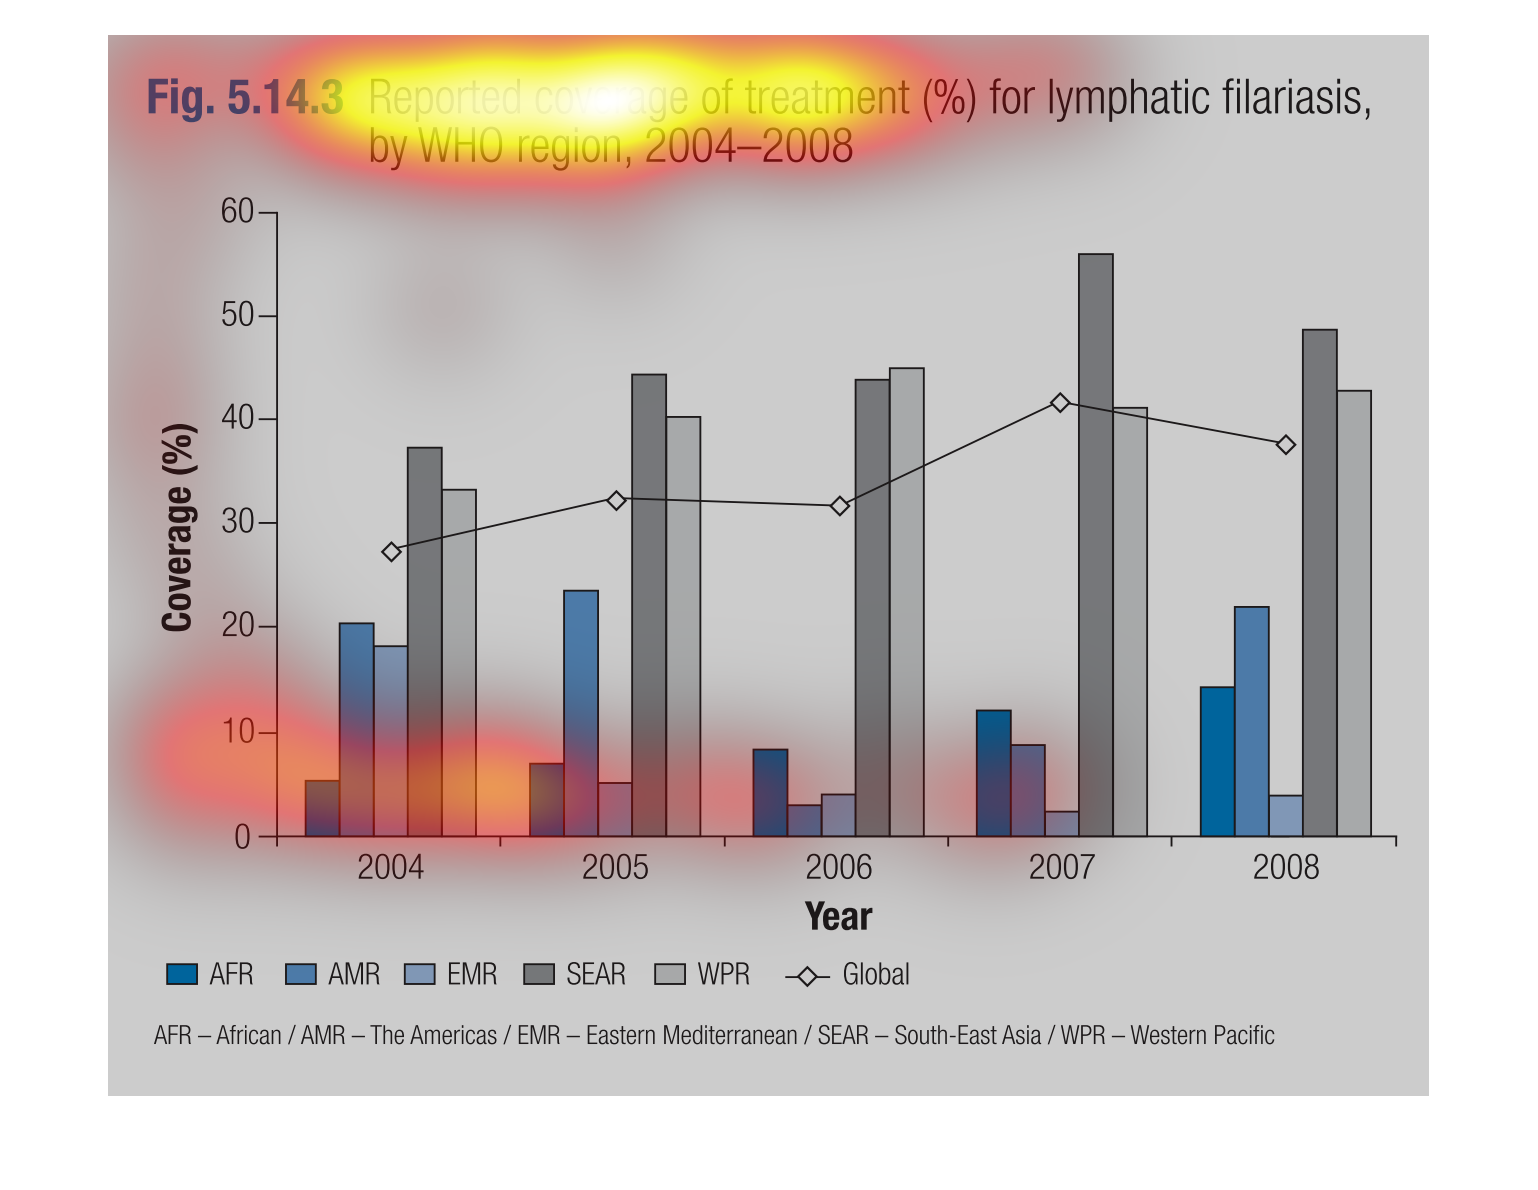
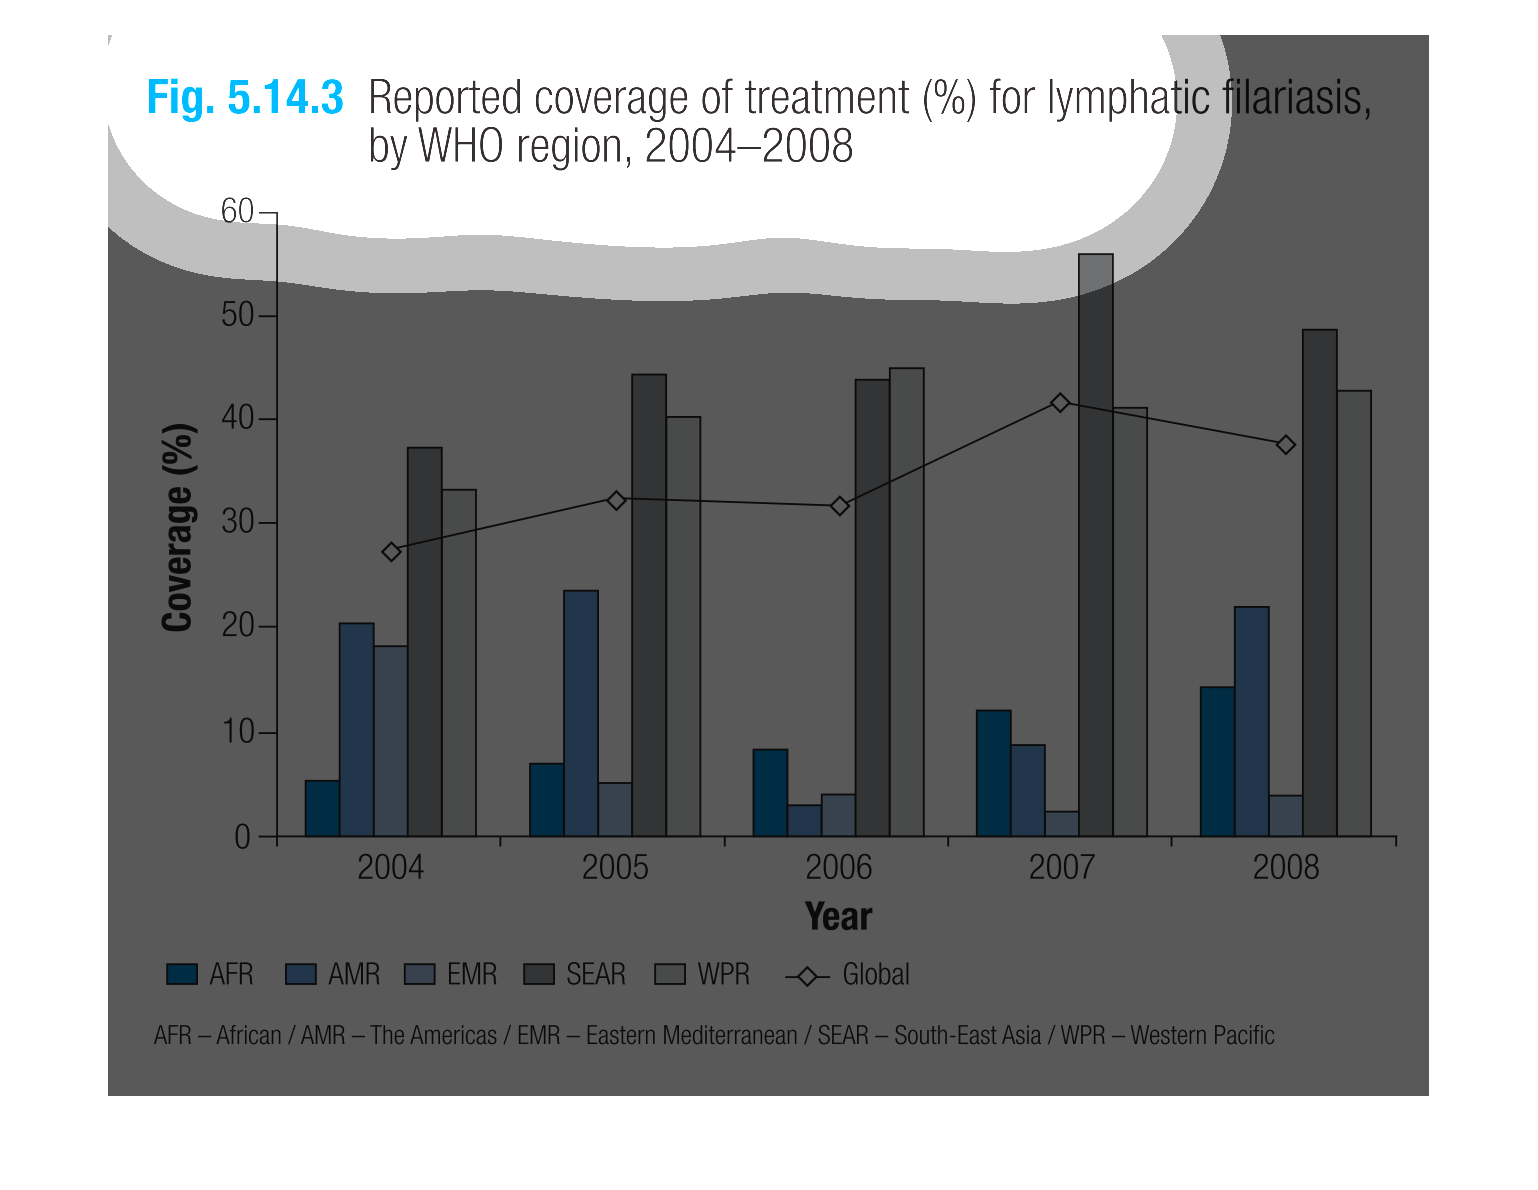
The graph shows coverage of treatment for lymphatic filariasis by World Health Organization
region betwee 2004 and 2008. SEAR and WPR have the highest percentange of coverage throughout
the date range.  The coverage spikes for EMR and AMR  in 2004 and 2005, and 2008, while the
AFR region steadily increases coverage percentage over the time frame.
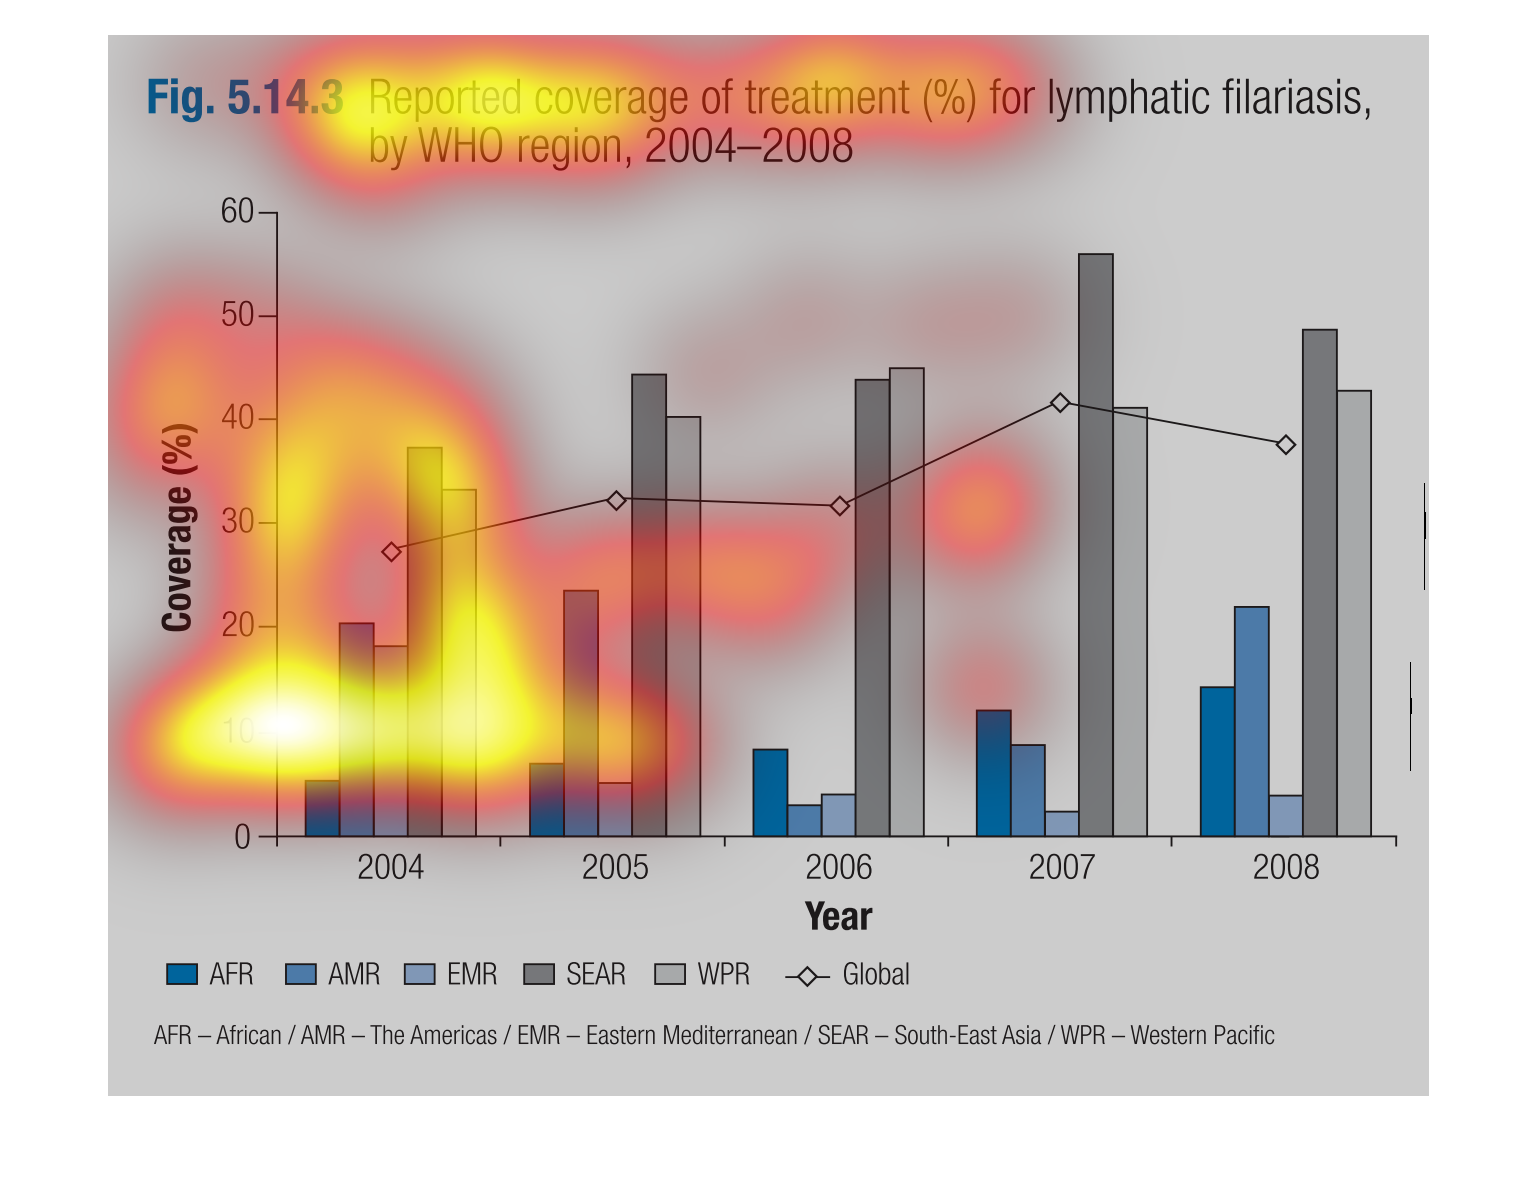
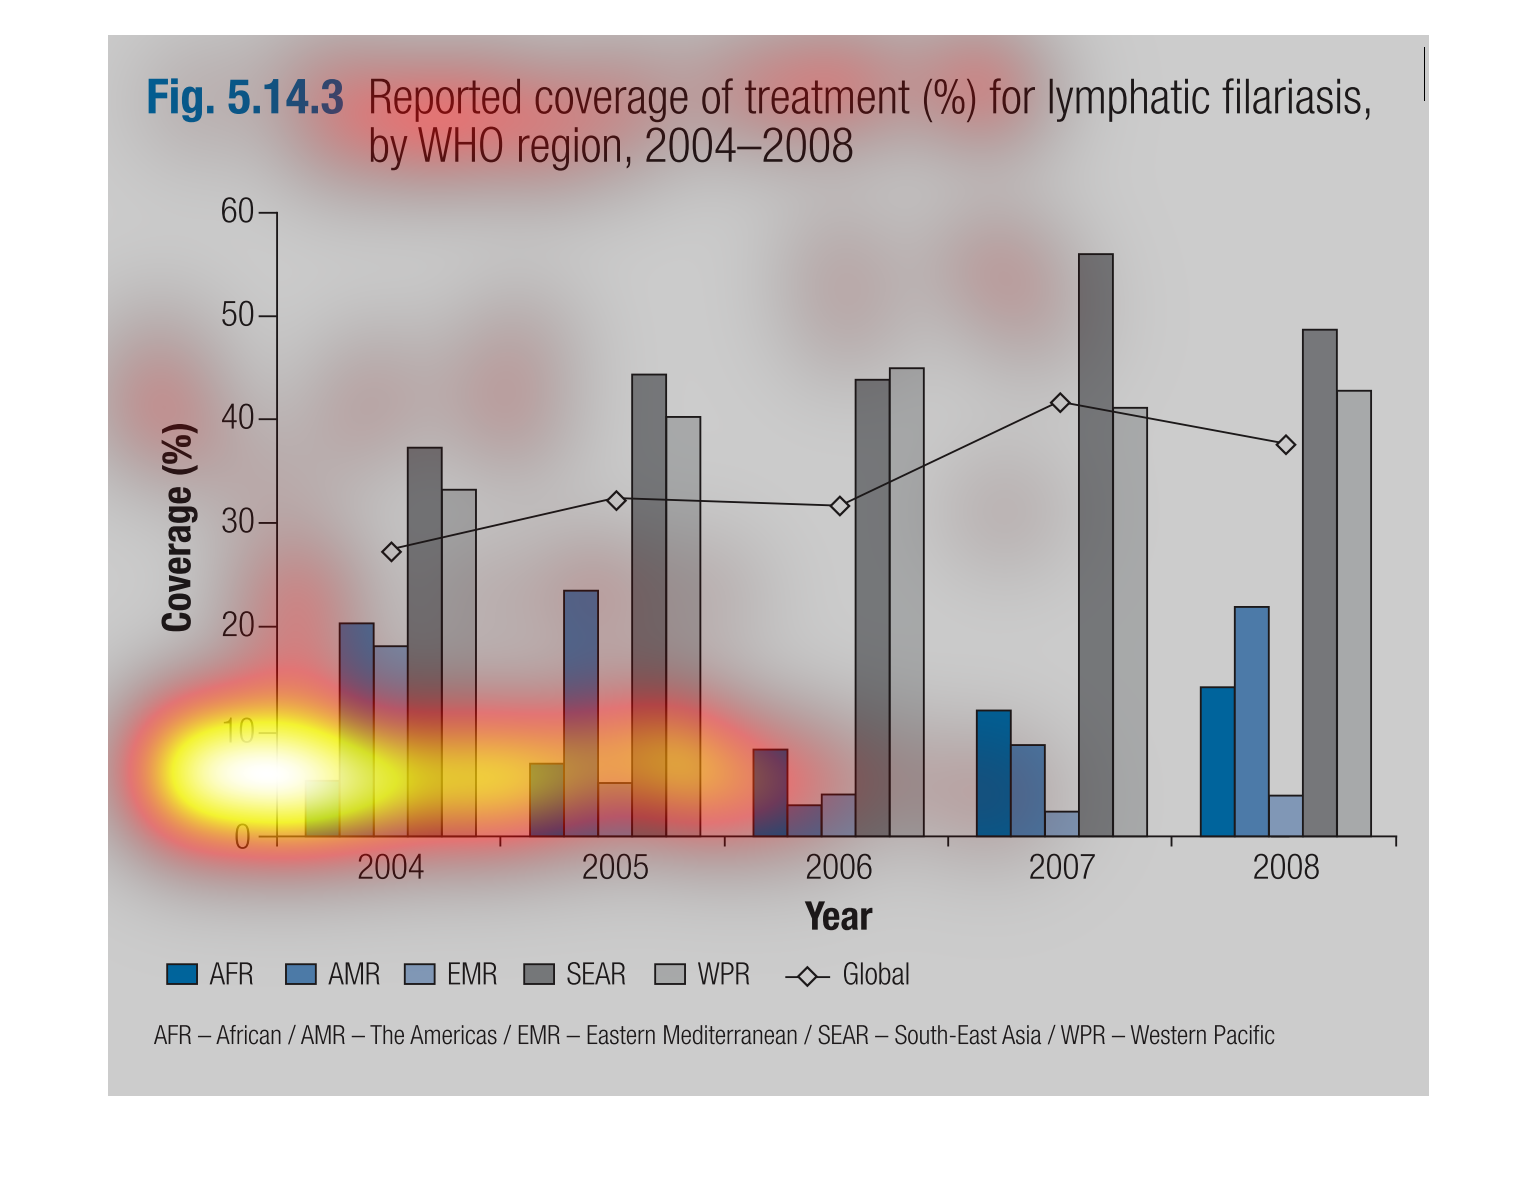
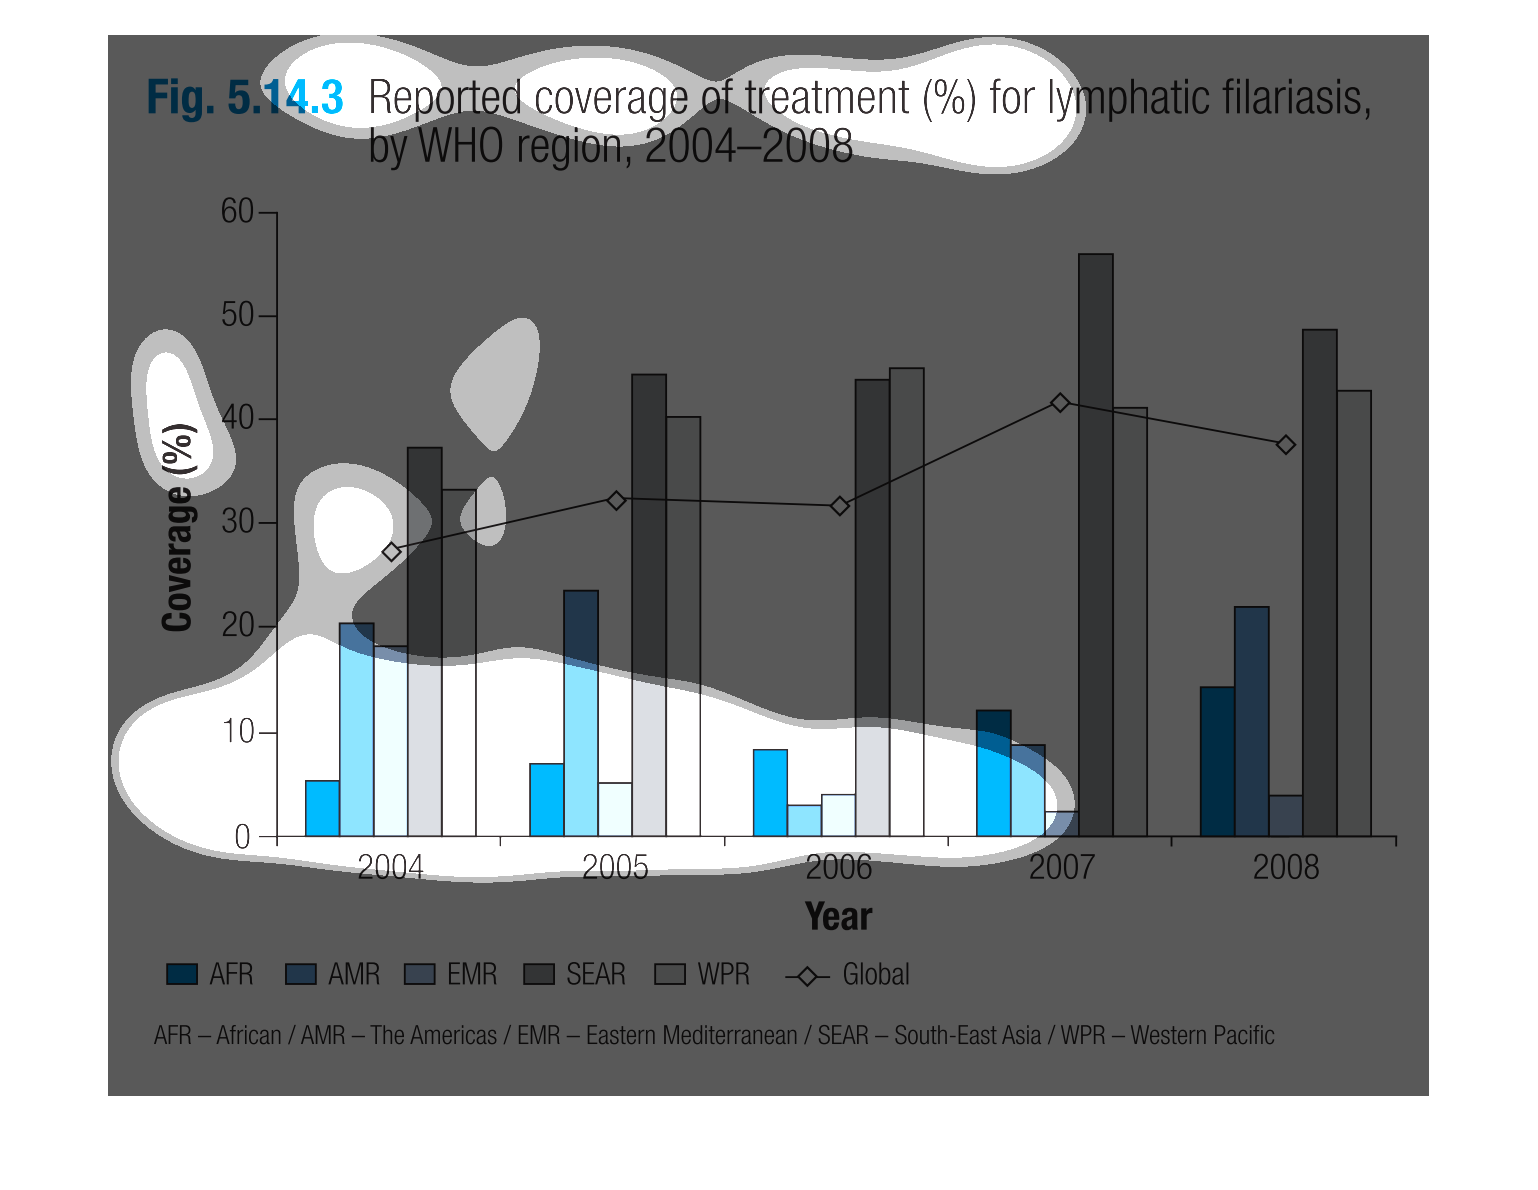
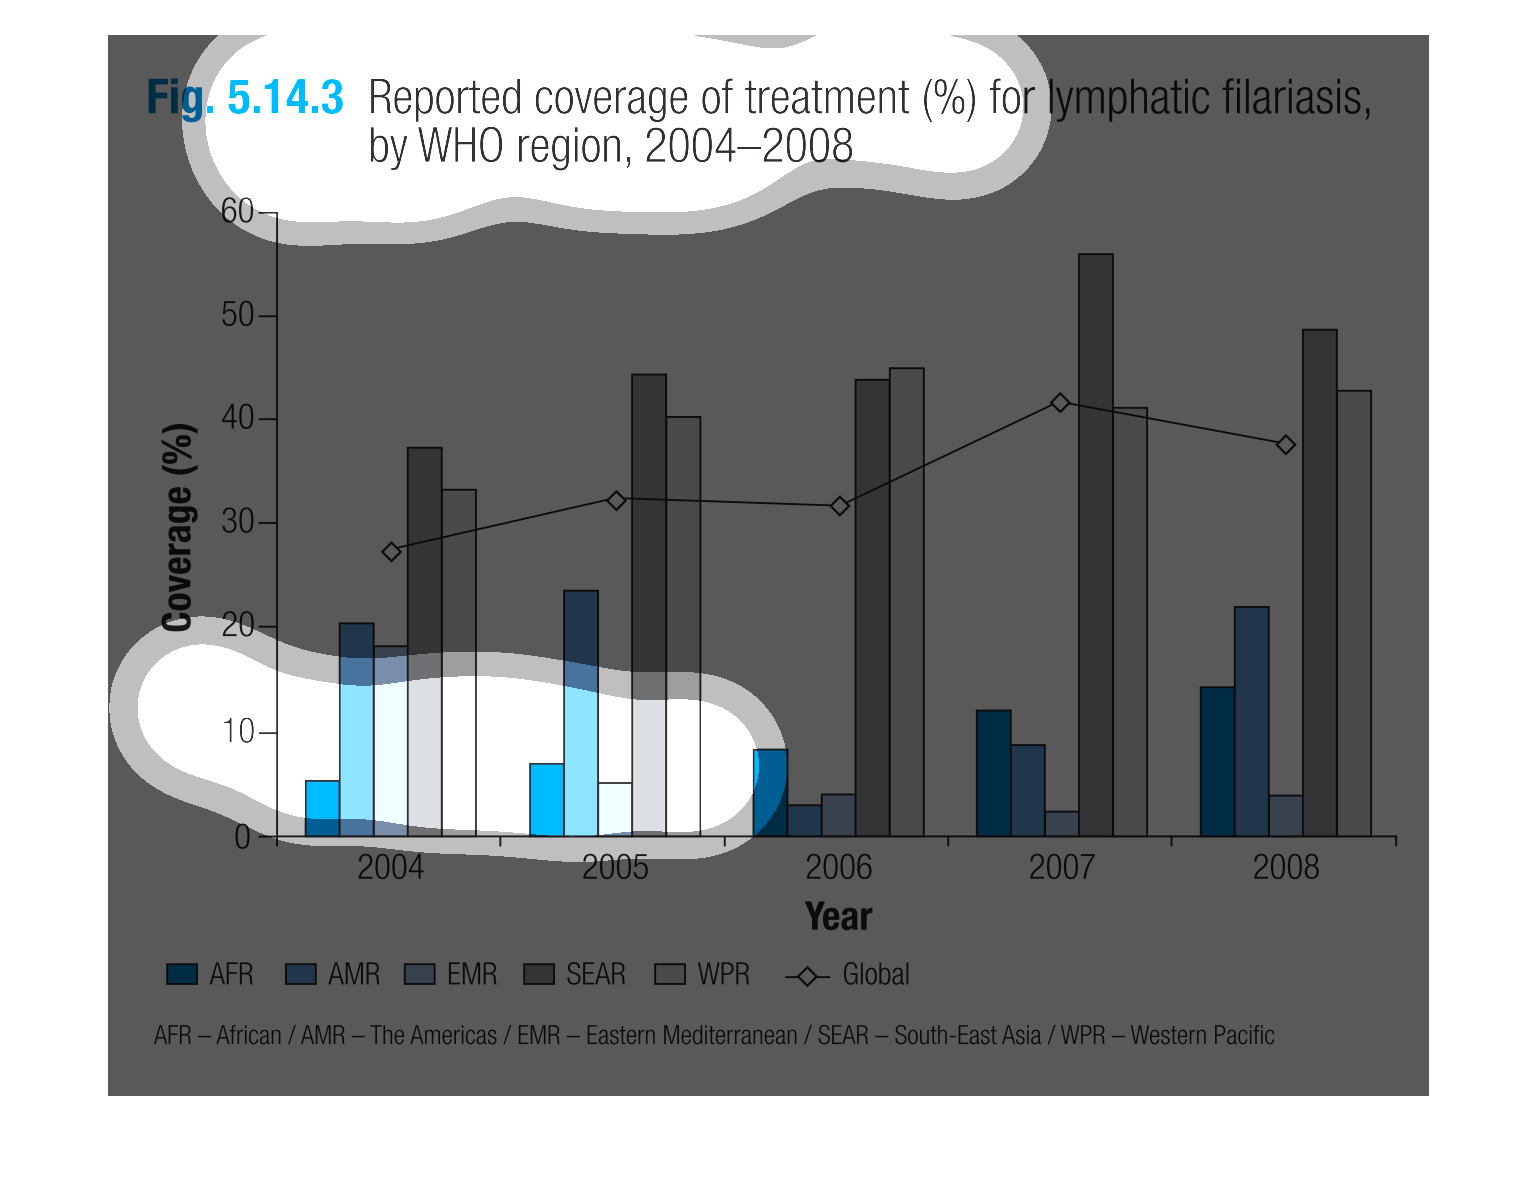
This graph shows the % of treatment for lymphatic filariasis in the world from 2004 to 2008.
According to the graph the % of treatment is slowly trending upwards. The lowest rate of treatment
is in the Eastern Mediterranean.
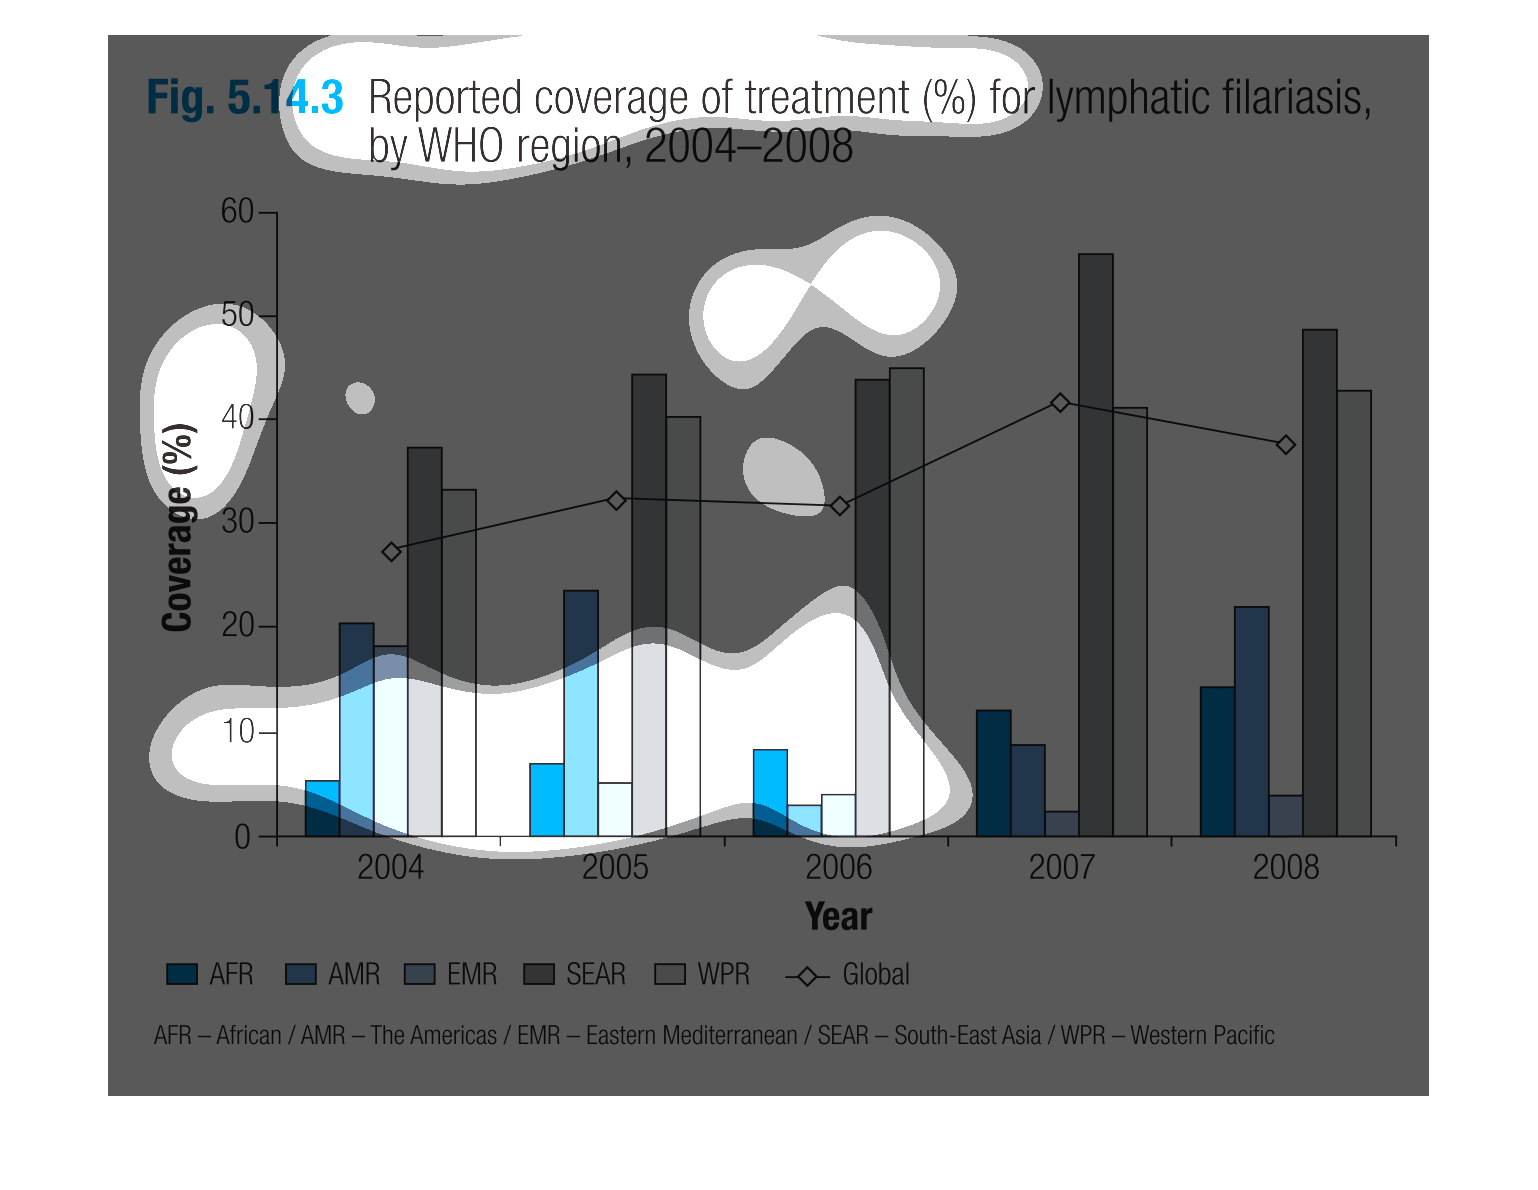
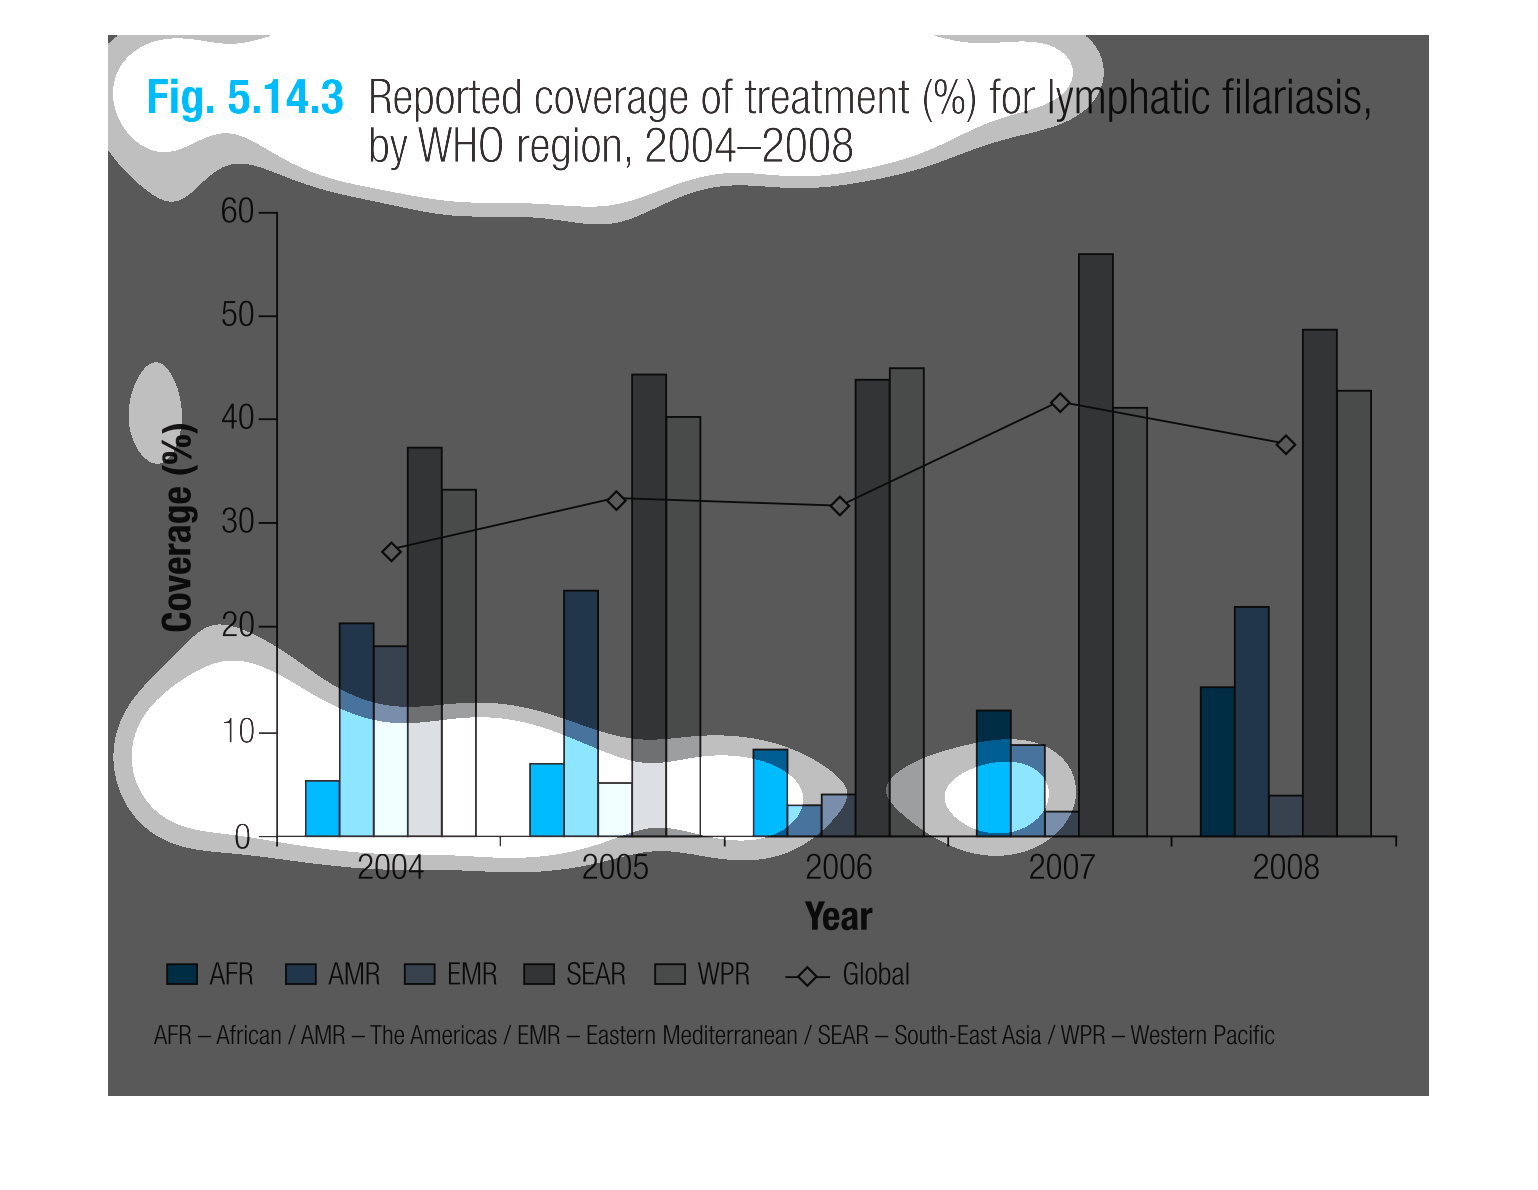
This chart is measuring the coverage for treatment of lymphatic filariasis from 2004 to 2008
globally. People in the Western Pacific area have the highest rates of coverage.
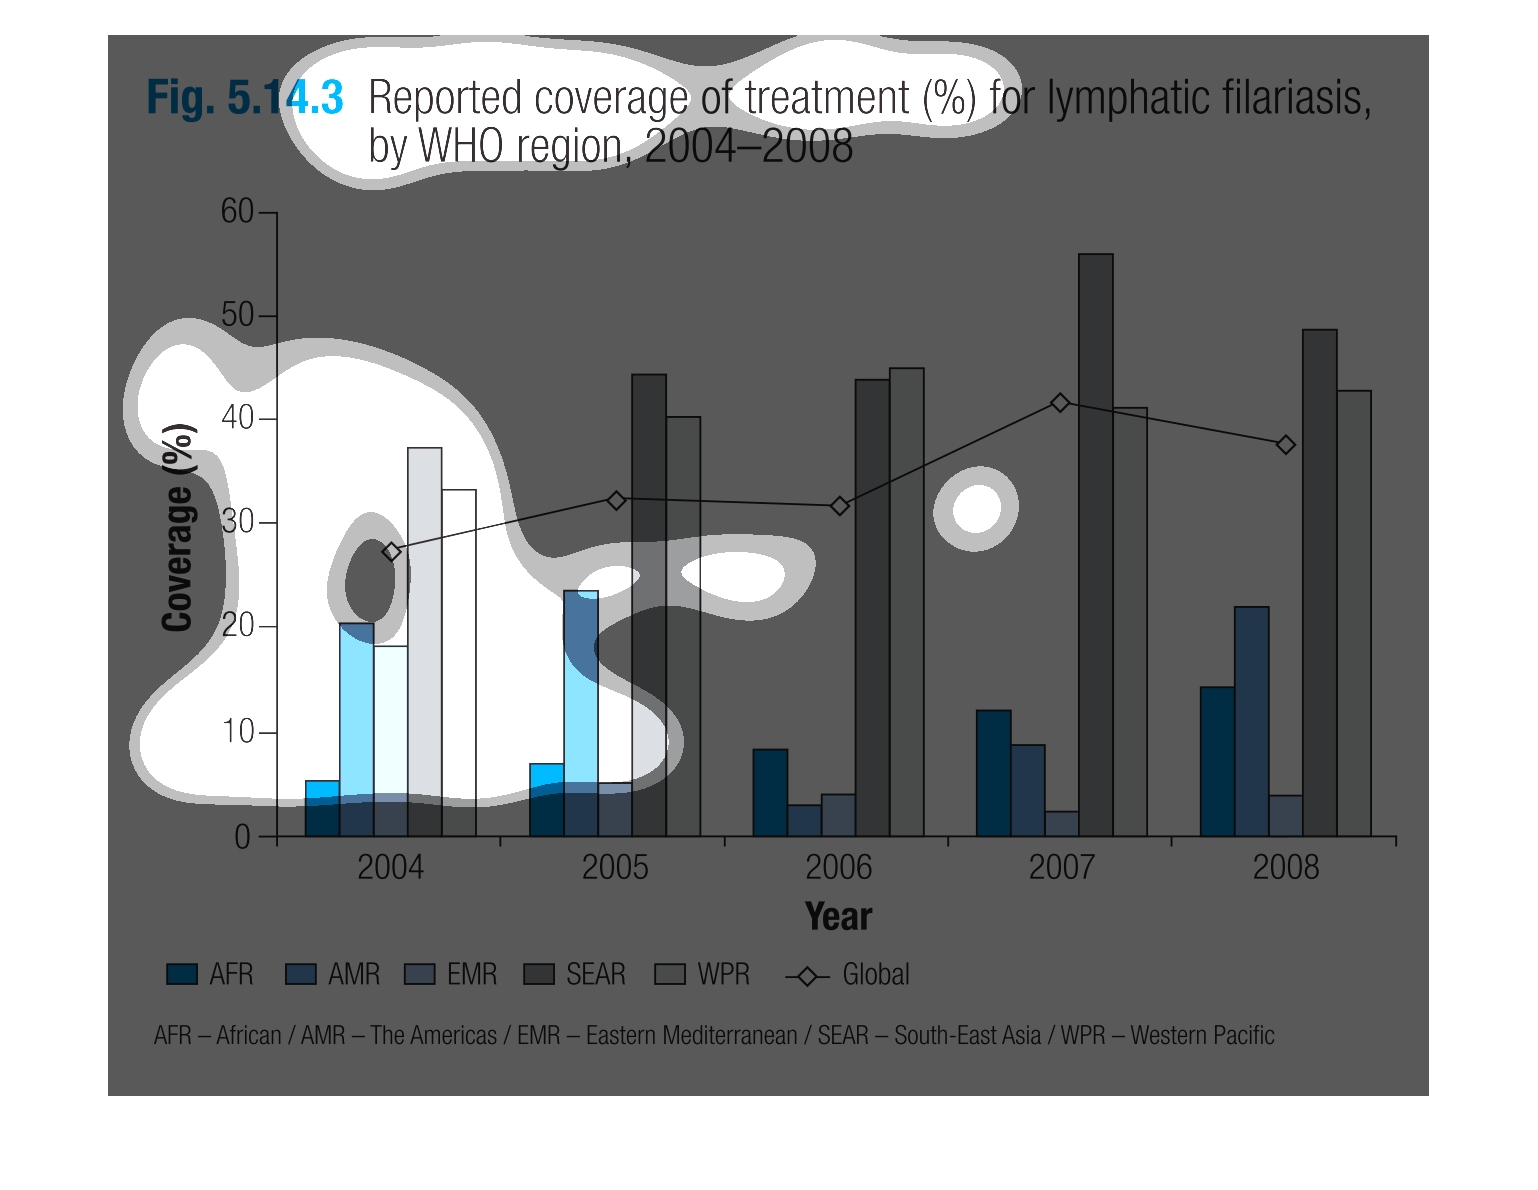
The graph shows the reported coverage of treatment for lymphatic filariasis between 2004 -
2008 by WHO region.  Each year the regions SEAR and WPR are the highest.
This graph reports the coverage of treatment for lymphatic filarial by WHO regions in 2004
to 2008.  Categories are AFR, AMR, EMR, SEAR, WPR, and global.
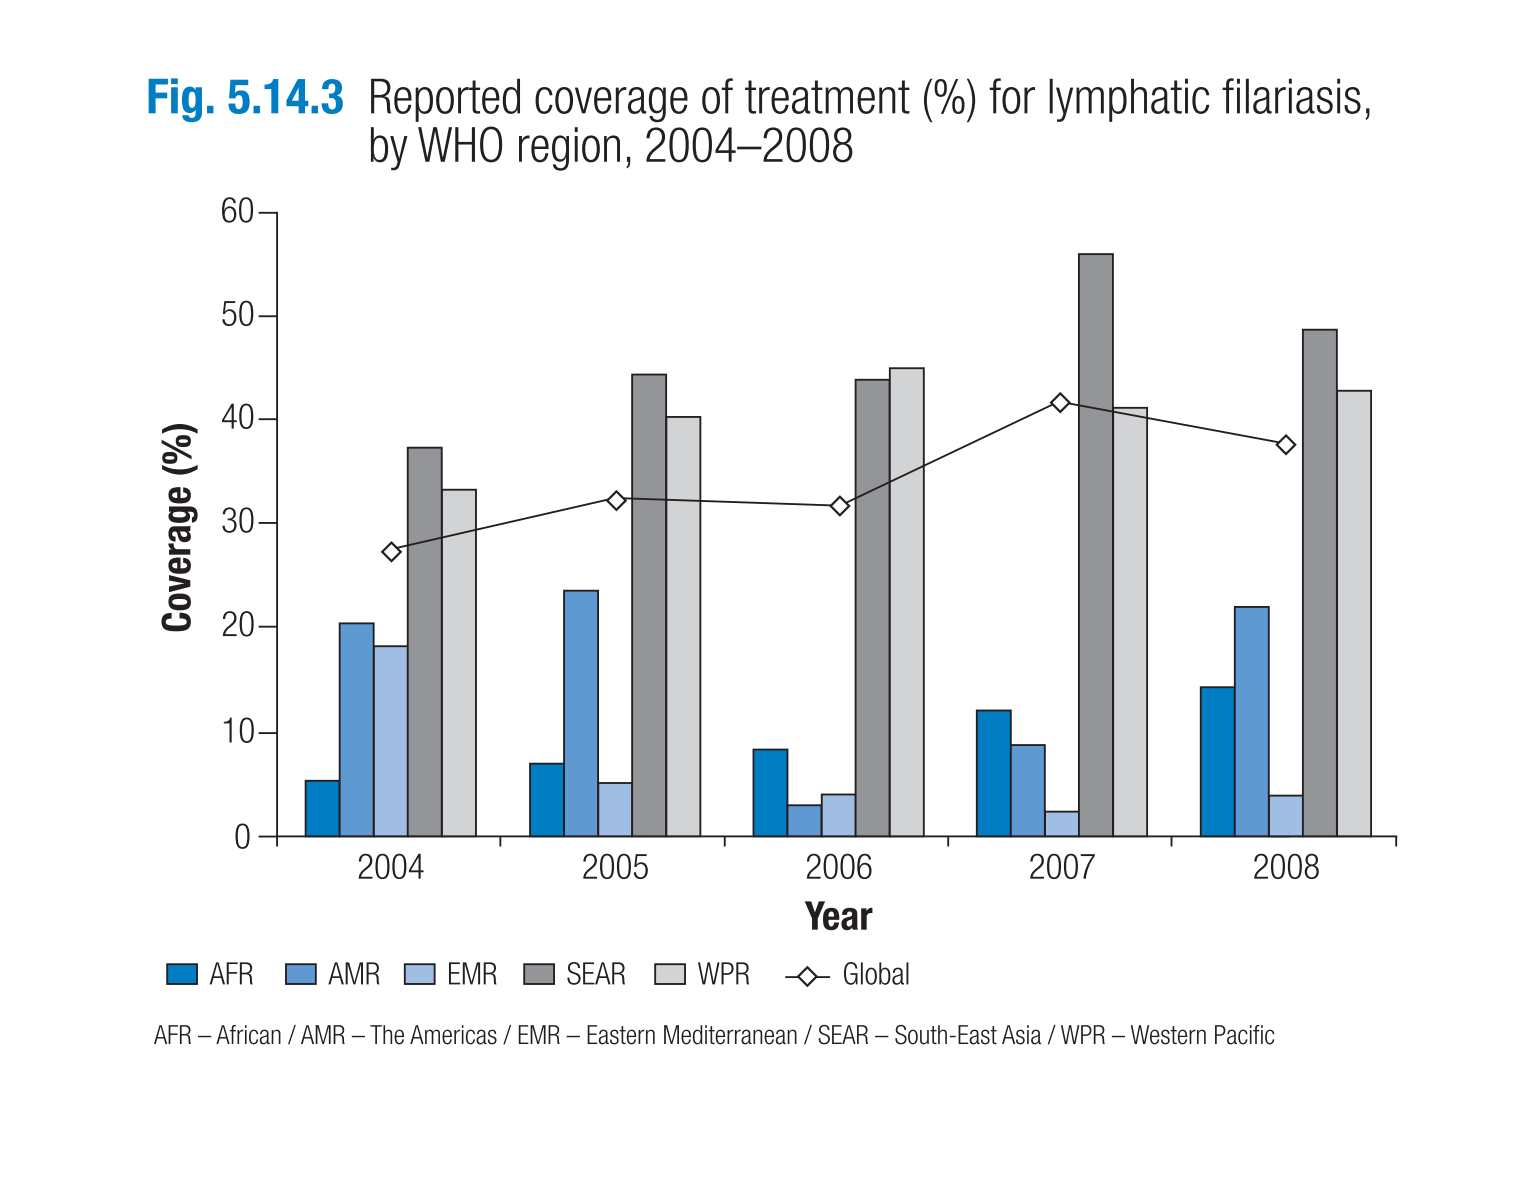
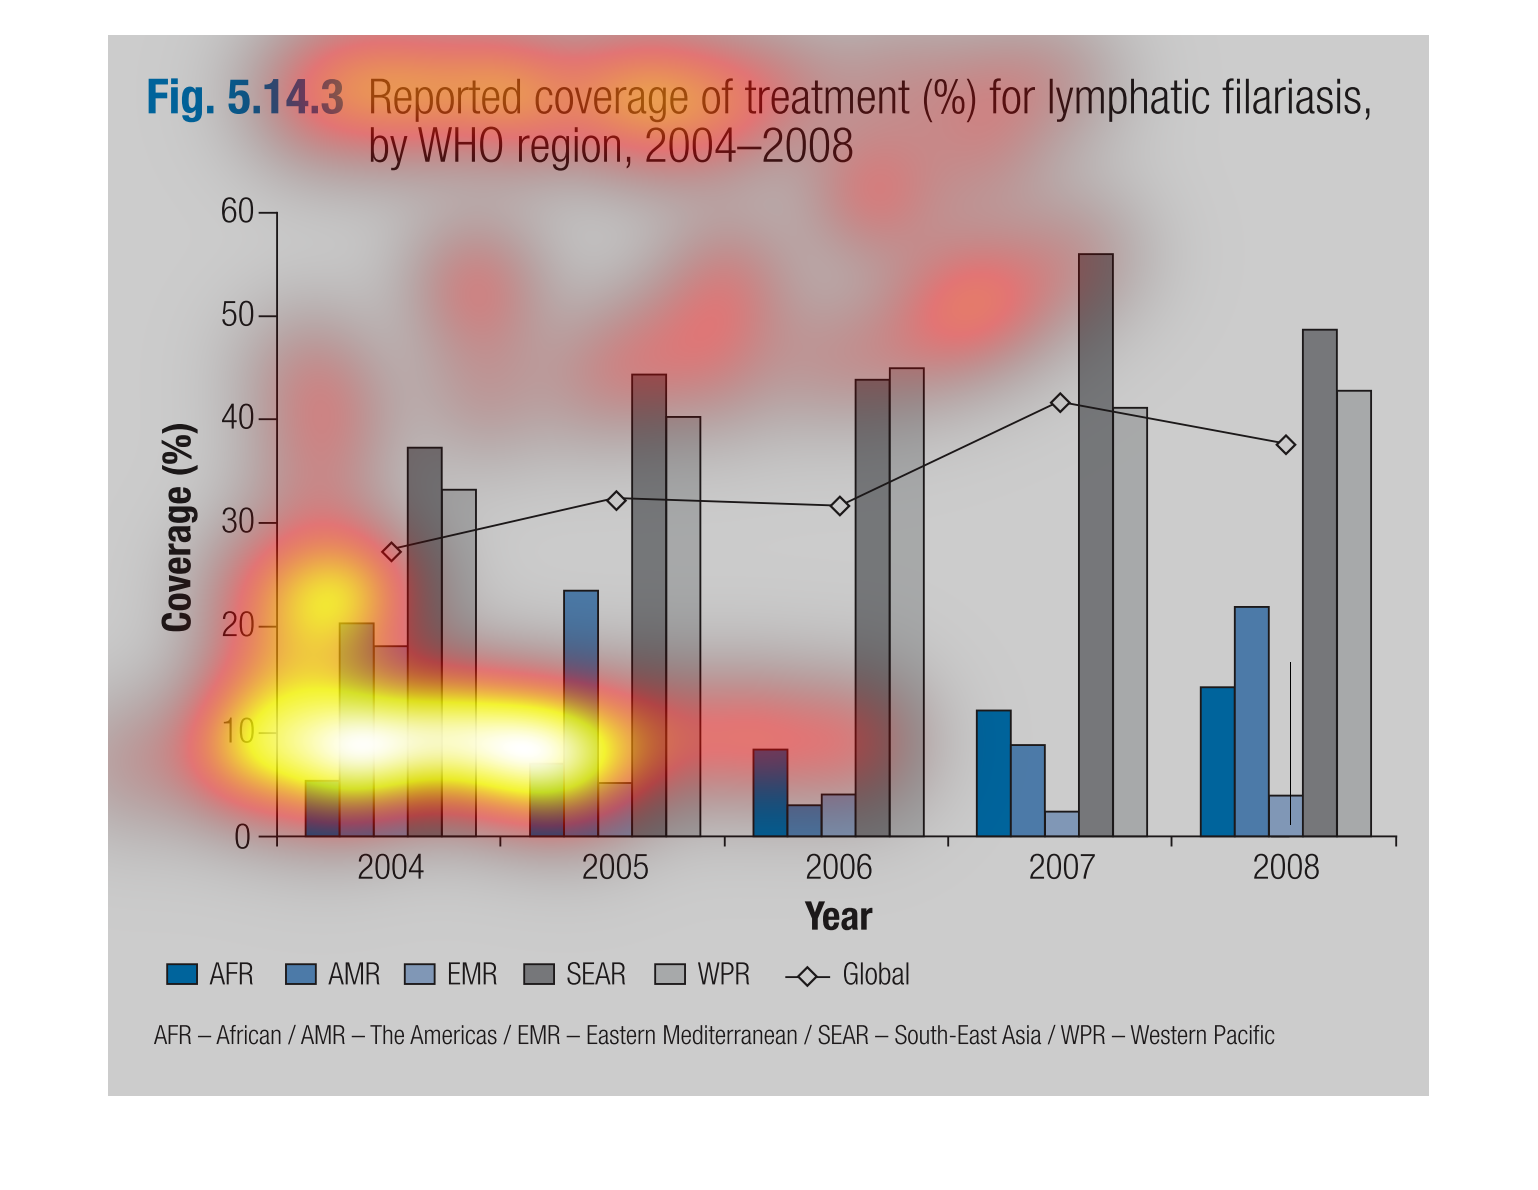
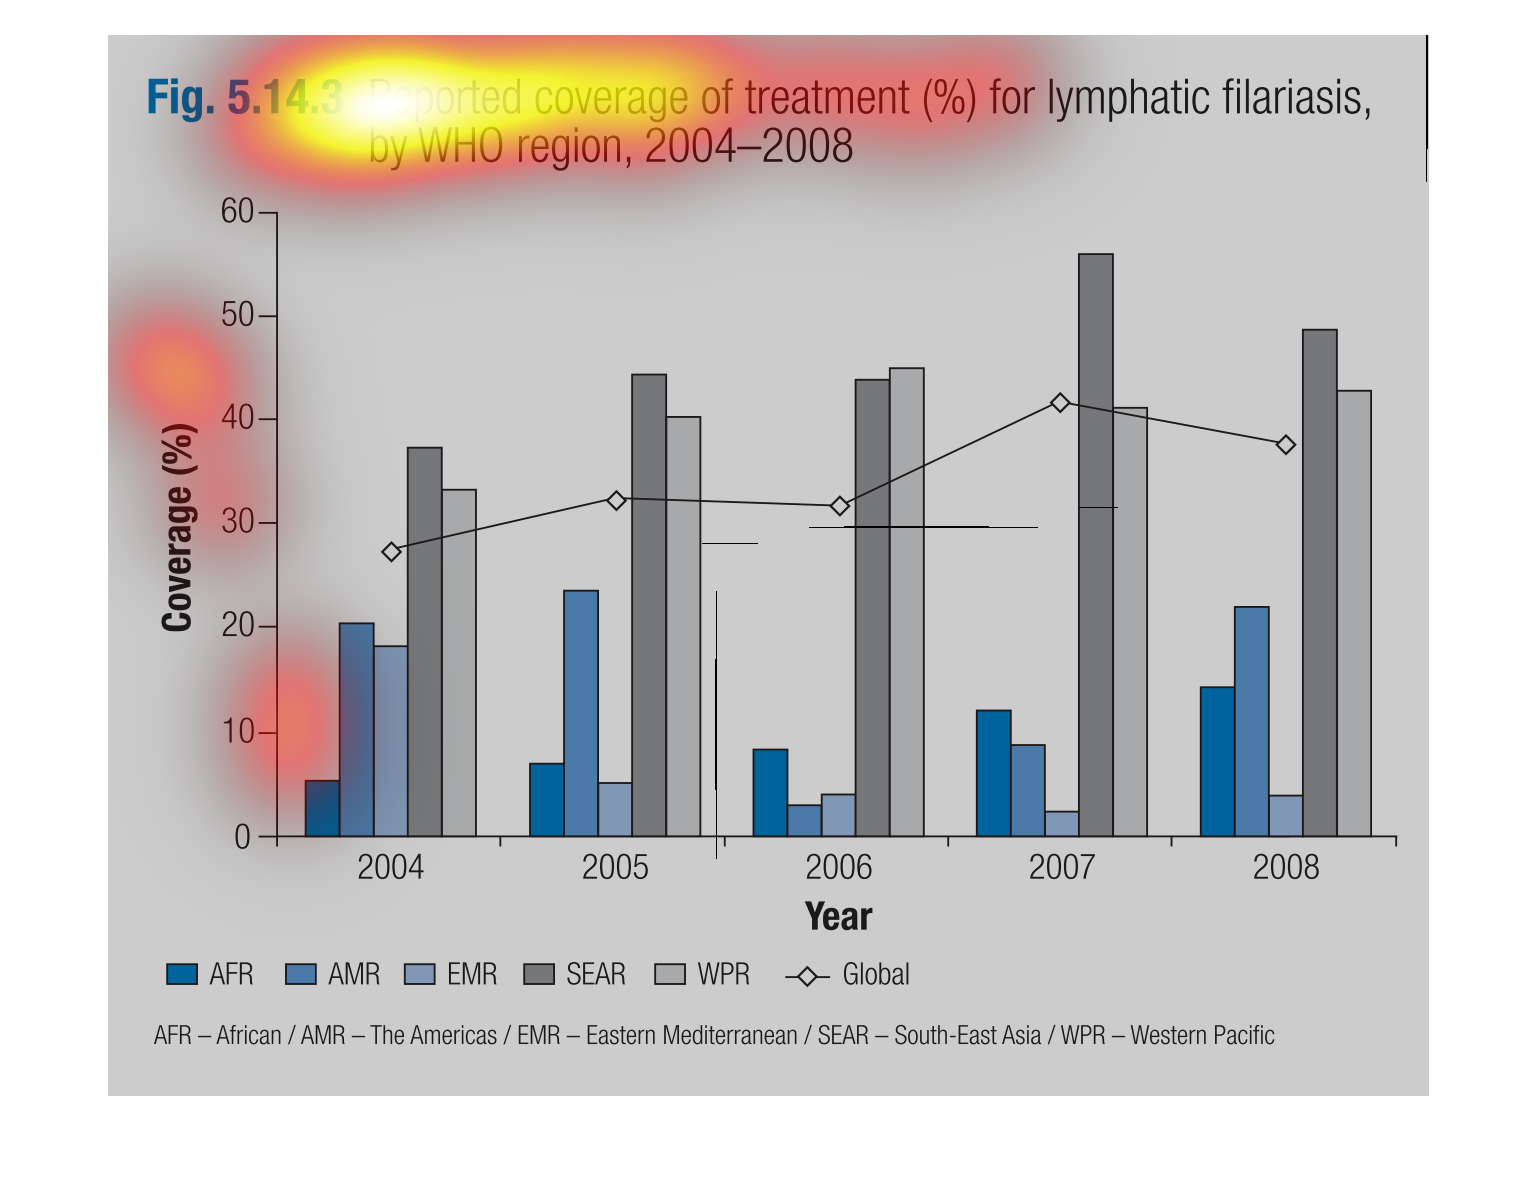
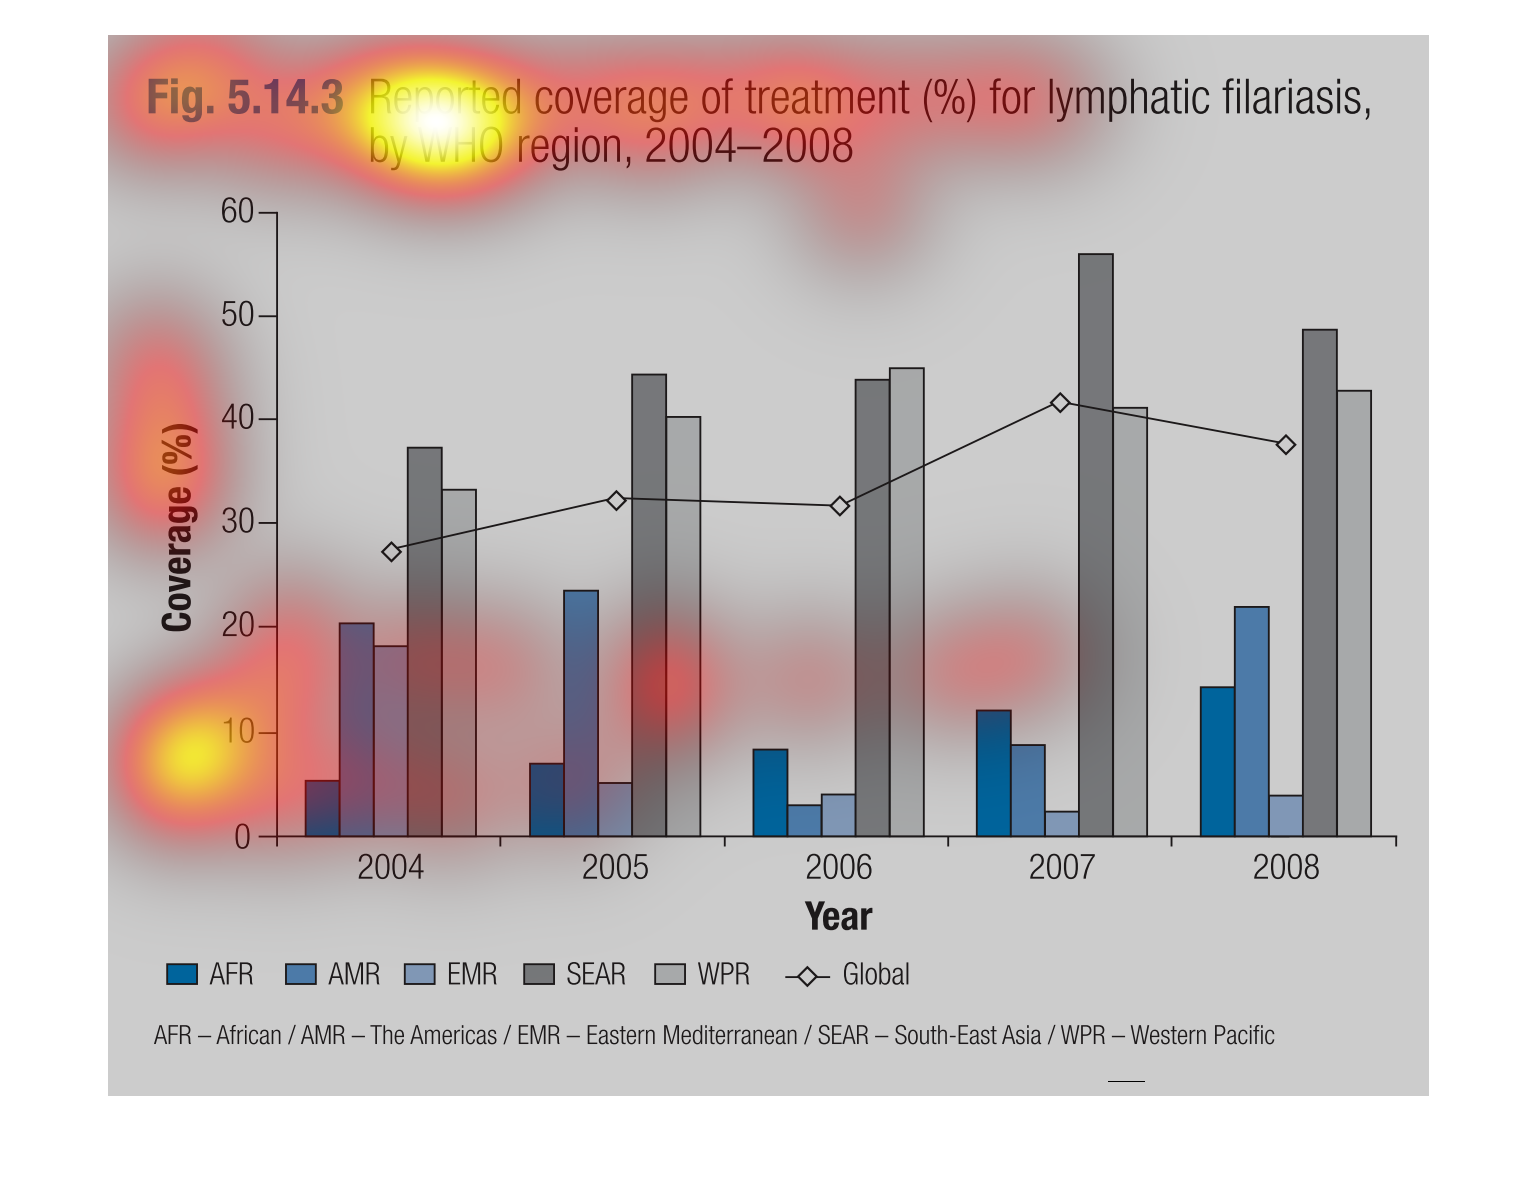
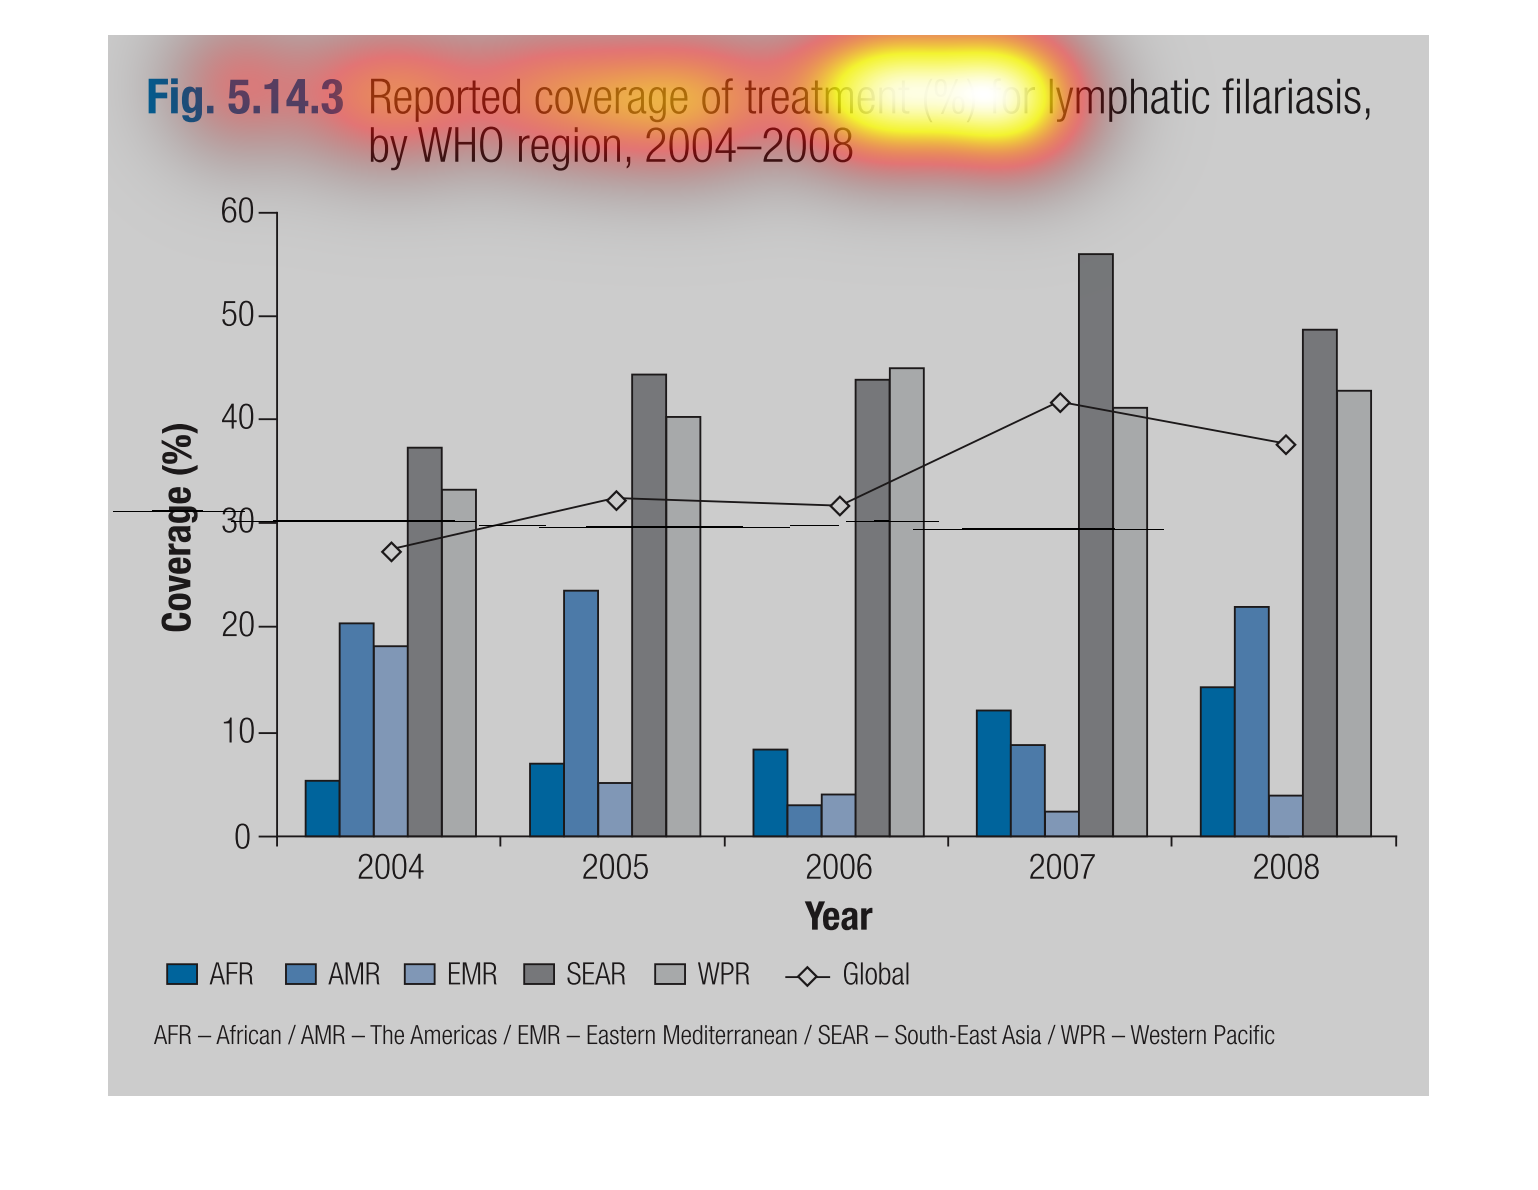
This graph is showing you the reported coverage of treatment (%) for lymphatic filariasis,
by WHO region, 2004-2008. In 2007 South-East Asia had the highest percent of treatment which
was 55% with whereas Eastern Mediterranean had the lowest percent in treatment in 2007 with
less than 10%.
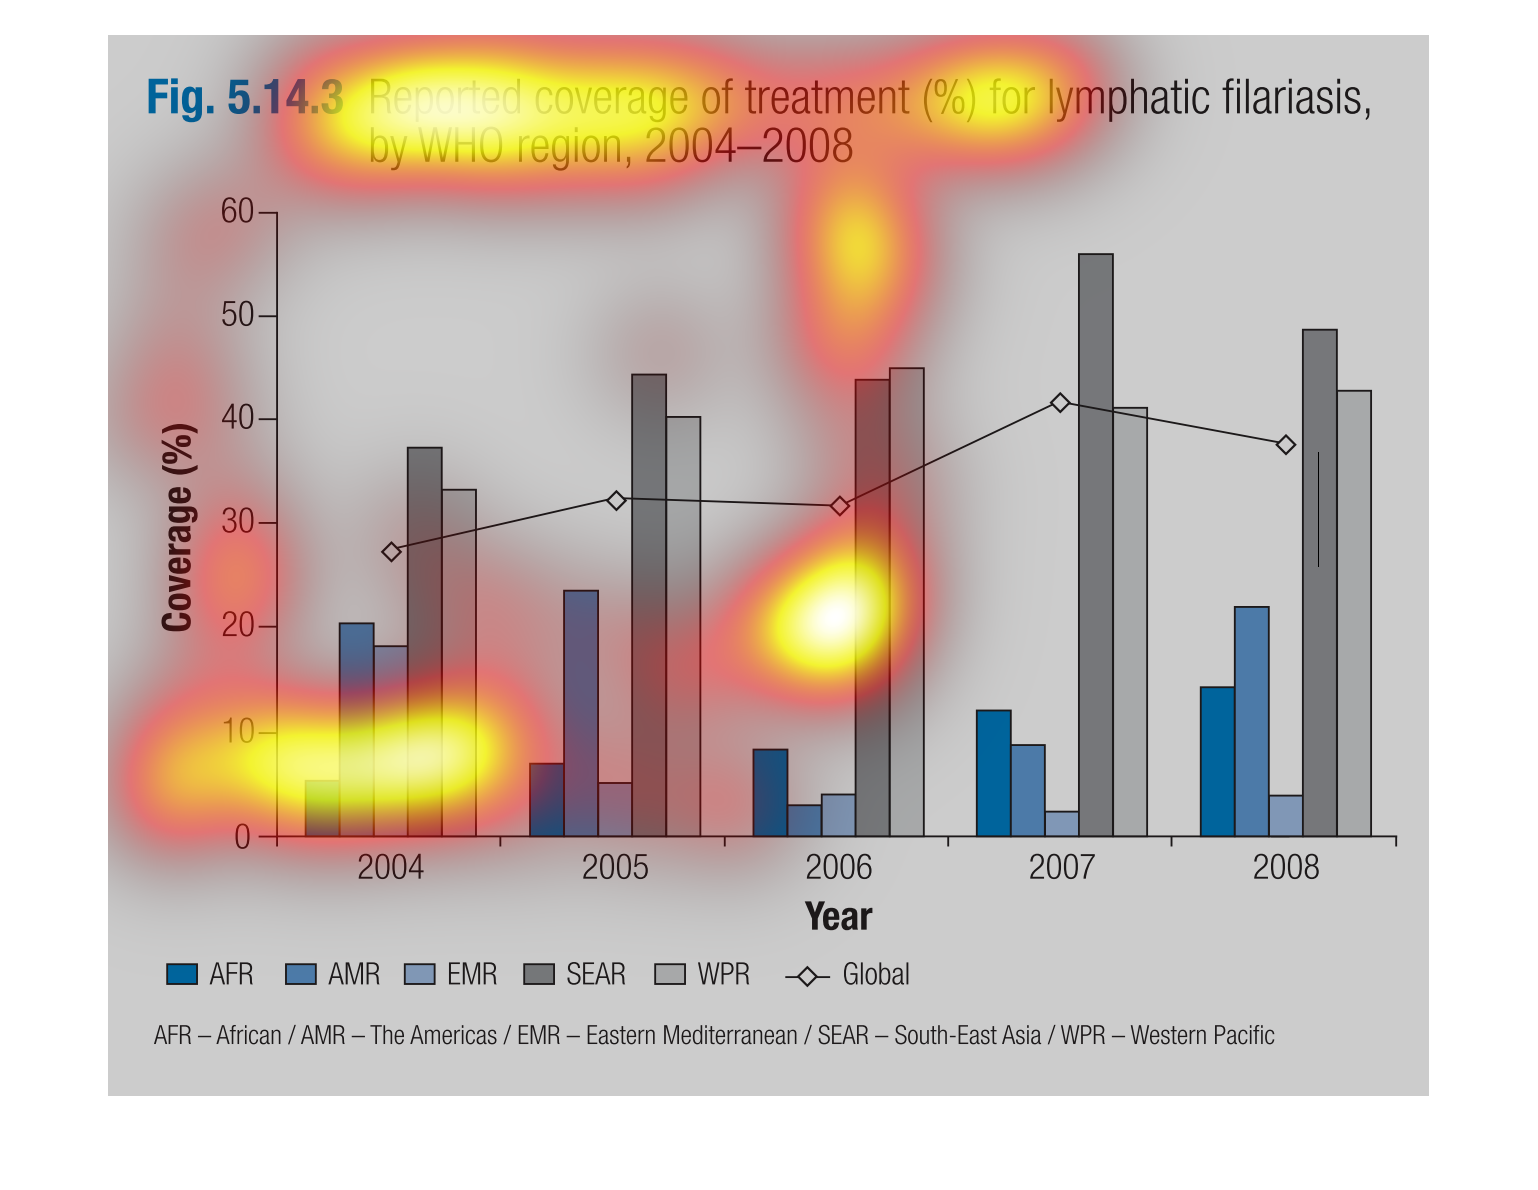
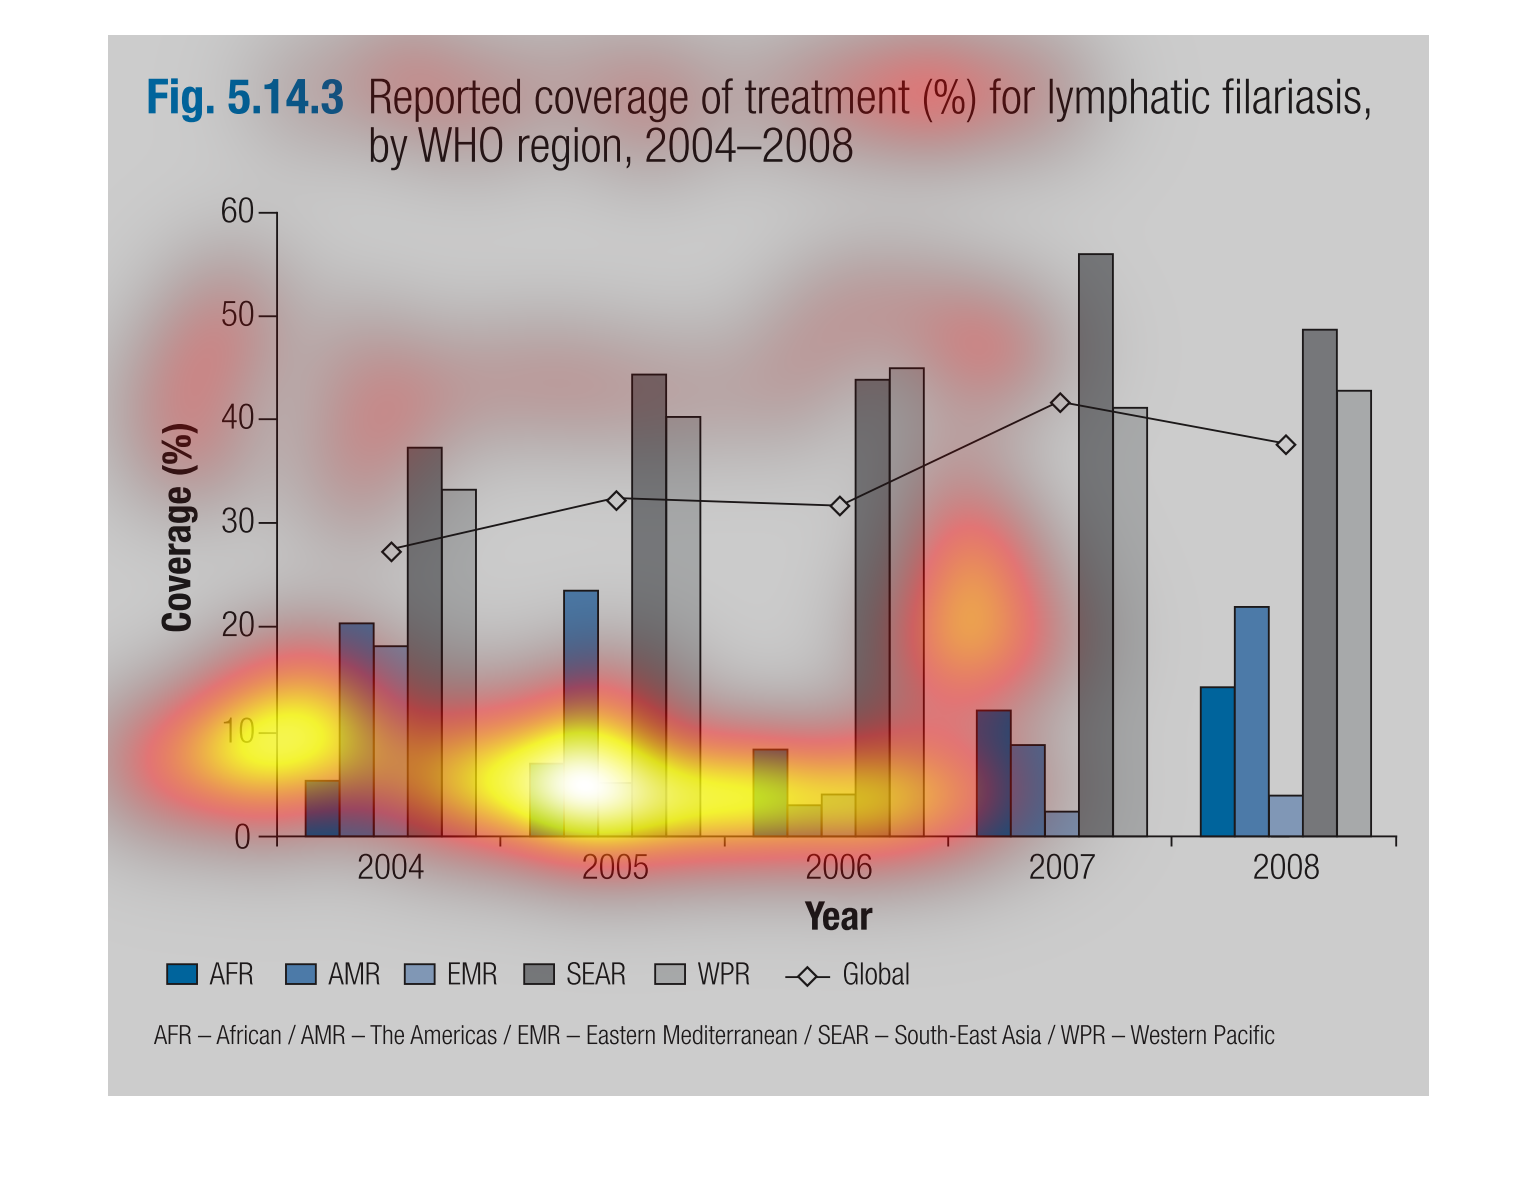
This bar graph describes the reported coverage of treatment for lymphatic filariasis across
the different continents per year.  South East Asia received the most coverage every year
except for in 2006 when they received slightly less than the Western Pacific.
This chart describes reported coverage of treatment (%) for lymphatic filariasis, by WHO region,
for the years 2004 through 2008. Categories include AMR.
Reported coverage of treatment for lymphatic filariasis why WHO 2004-2008 in Africa, the Americas,
Eastern Mediterrenean, Southeast Asia, and the Western pacific
The image shows the average amount of coverage for a certain type of illness based on region
and how the average coverage for those regions has changed over the years
This handmade chart shows the number of reported cases of lymphatic filiariasis around the
world as reported to the World Health Organization.
This is a series of bar graphs depicting reported coverage of treatment in percentage for
lymphatic filariasis by WHO region from the years 2004 to 2008.