This handmade chart shows the treatment for the disease onchoceriasis as reported to the World
Health Organization. It shows it is highest in poor regions
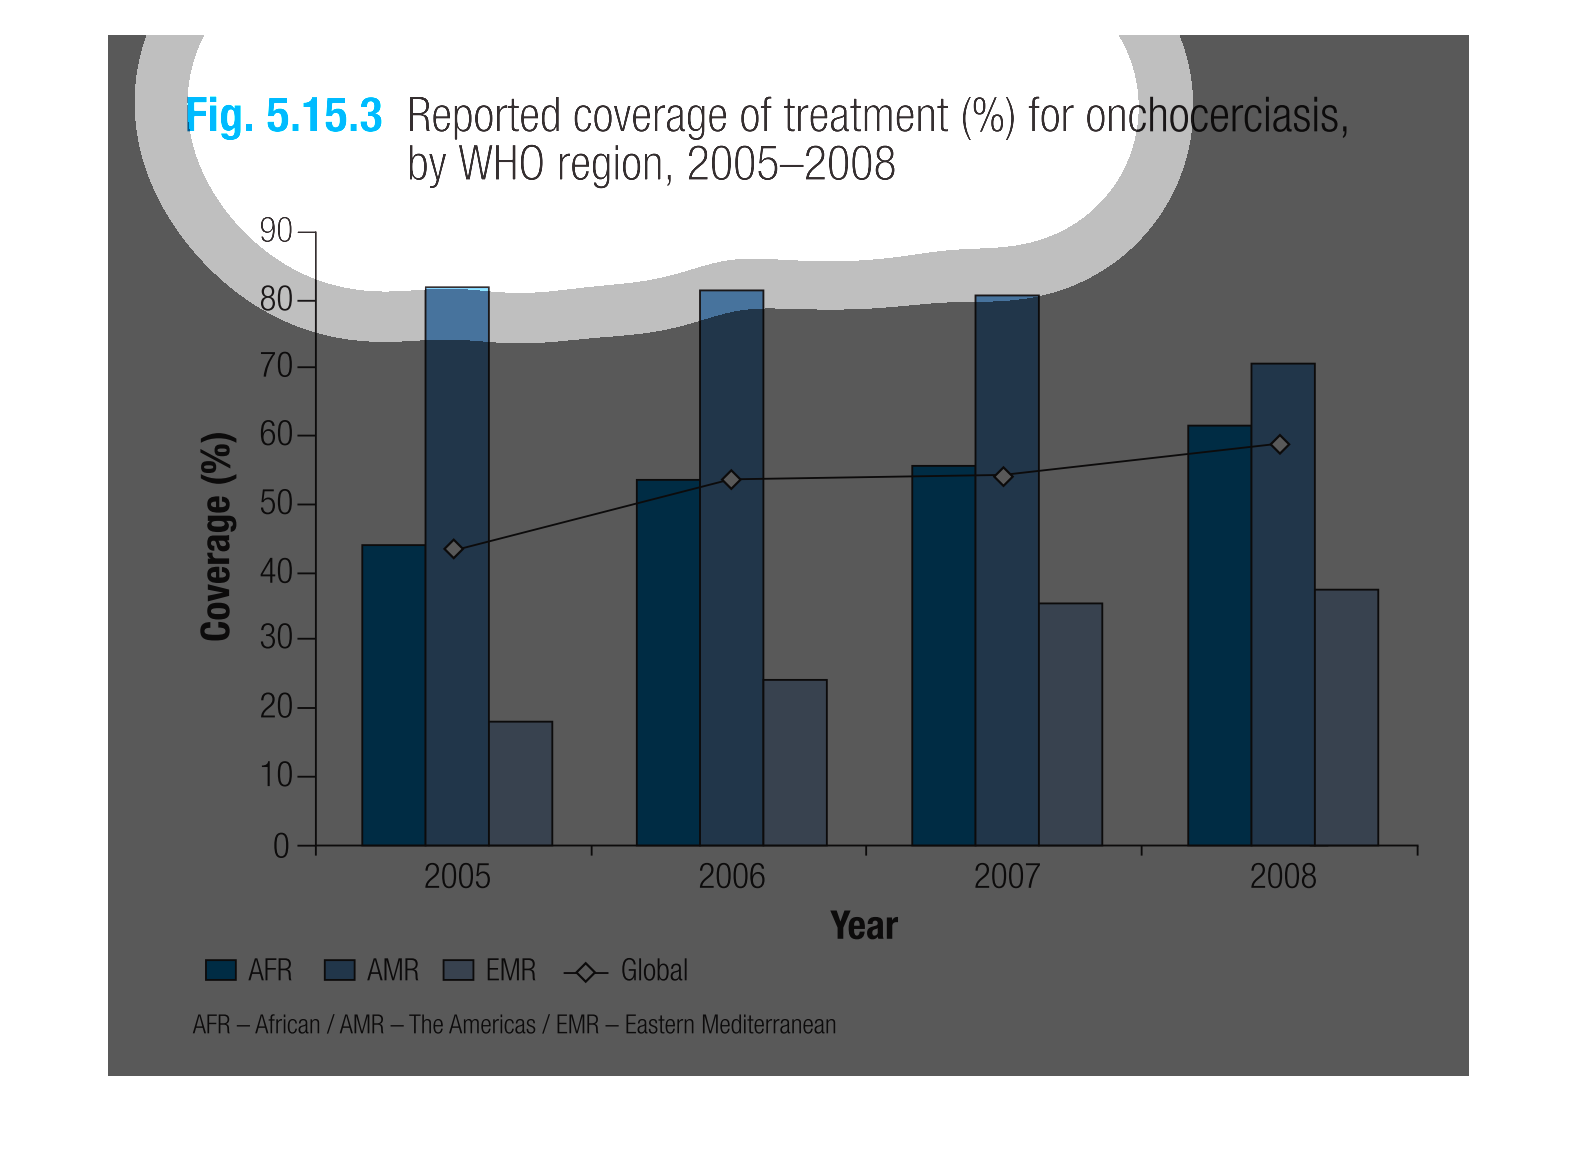
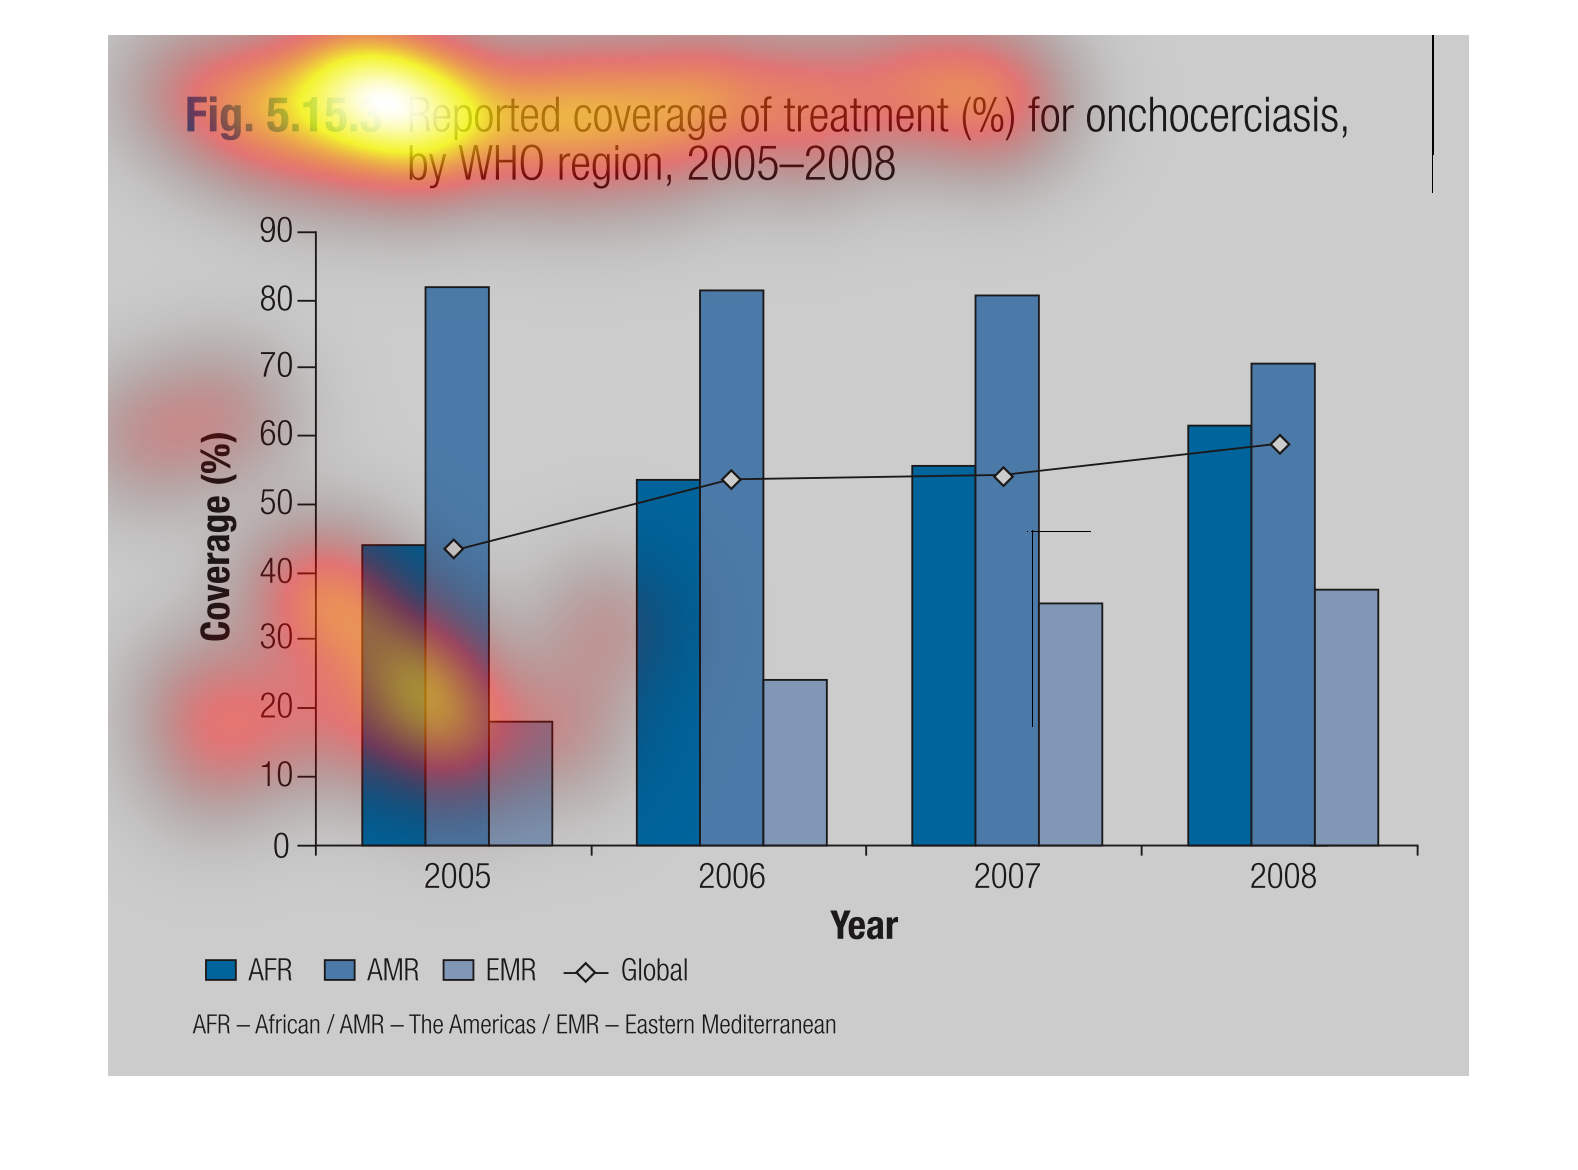
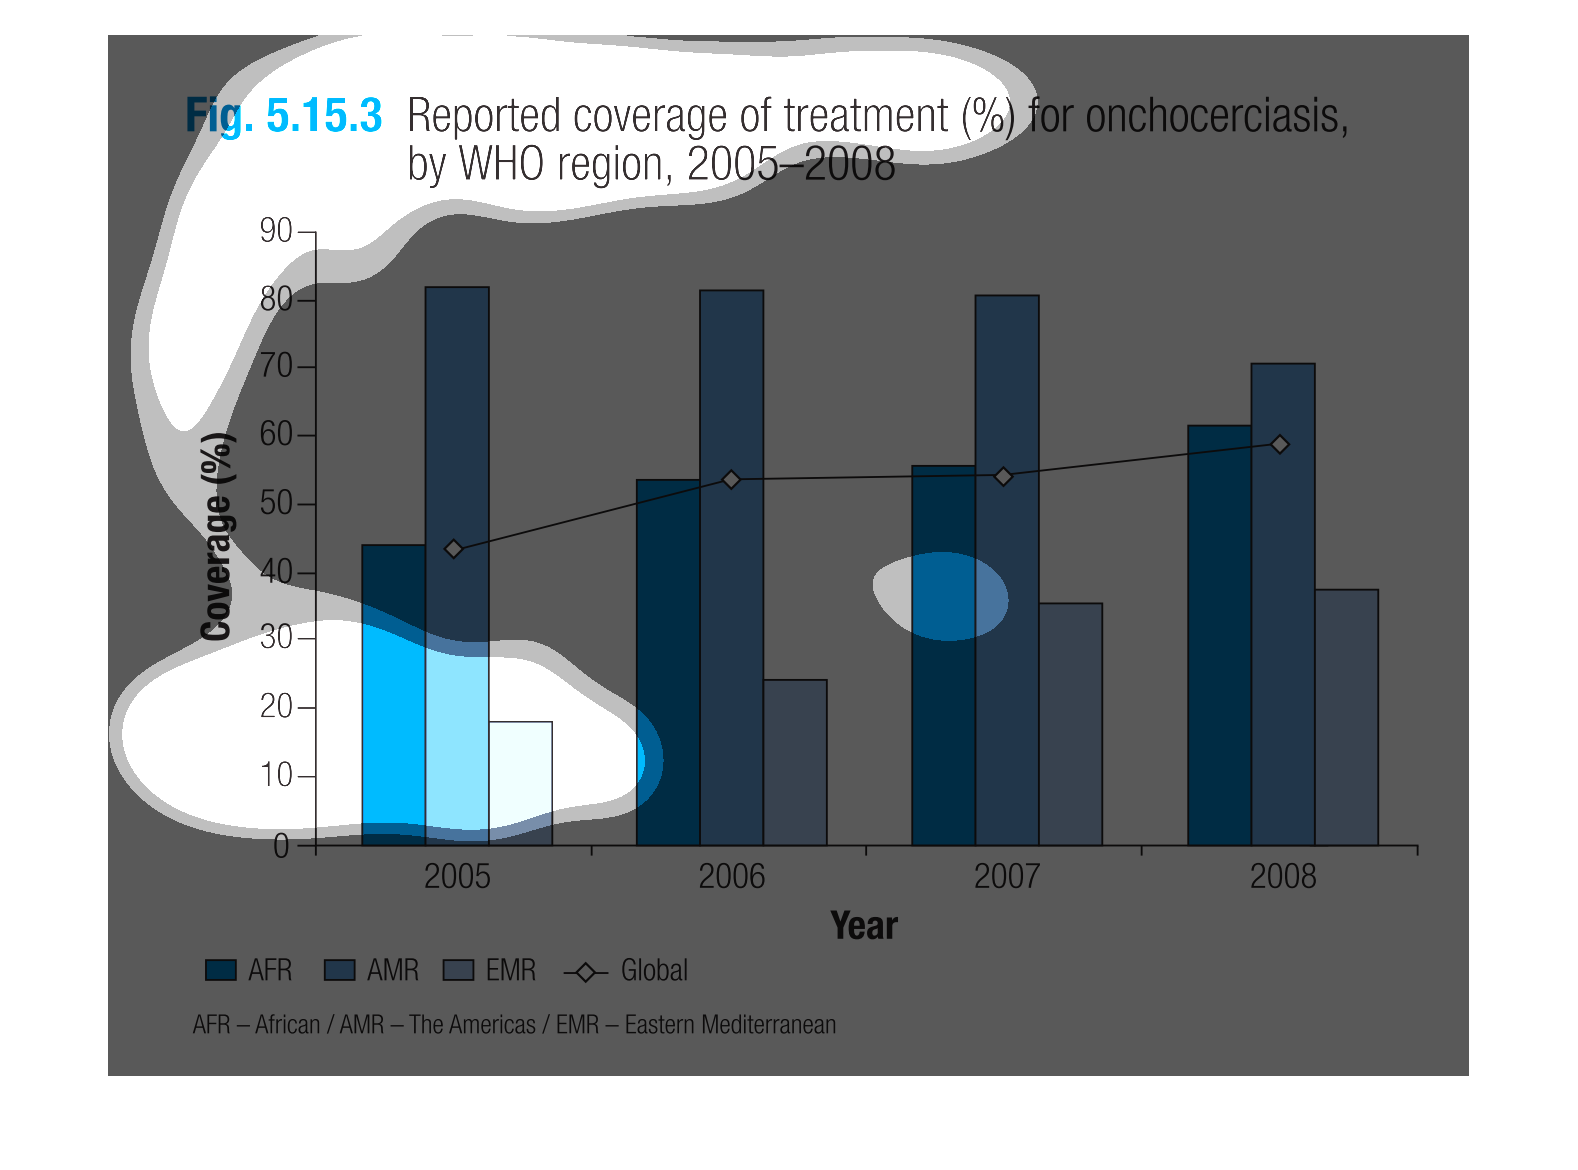
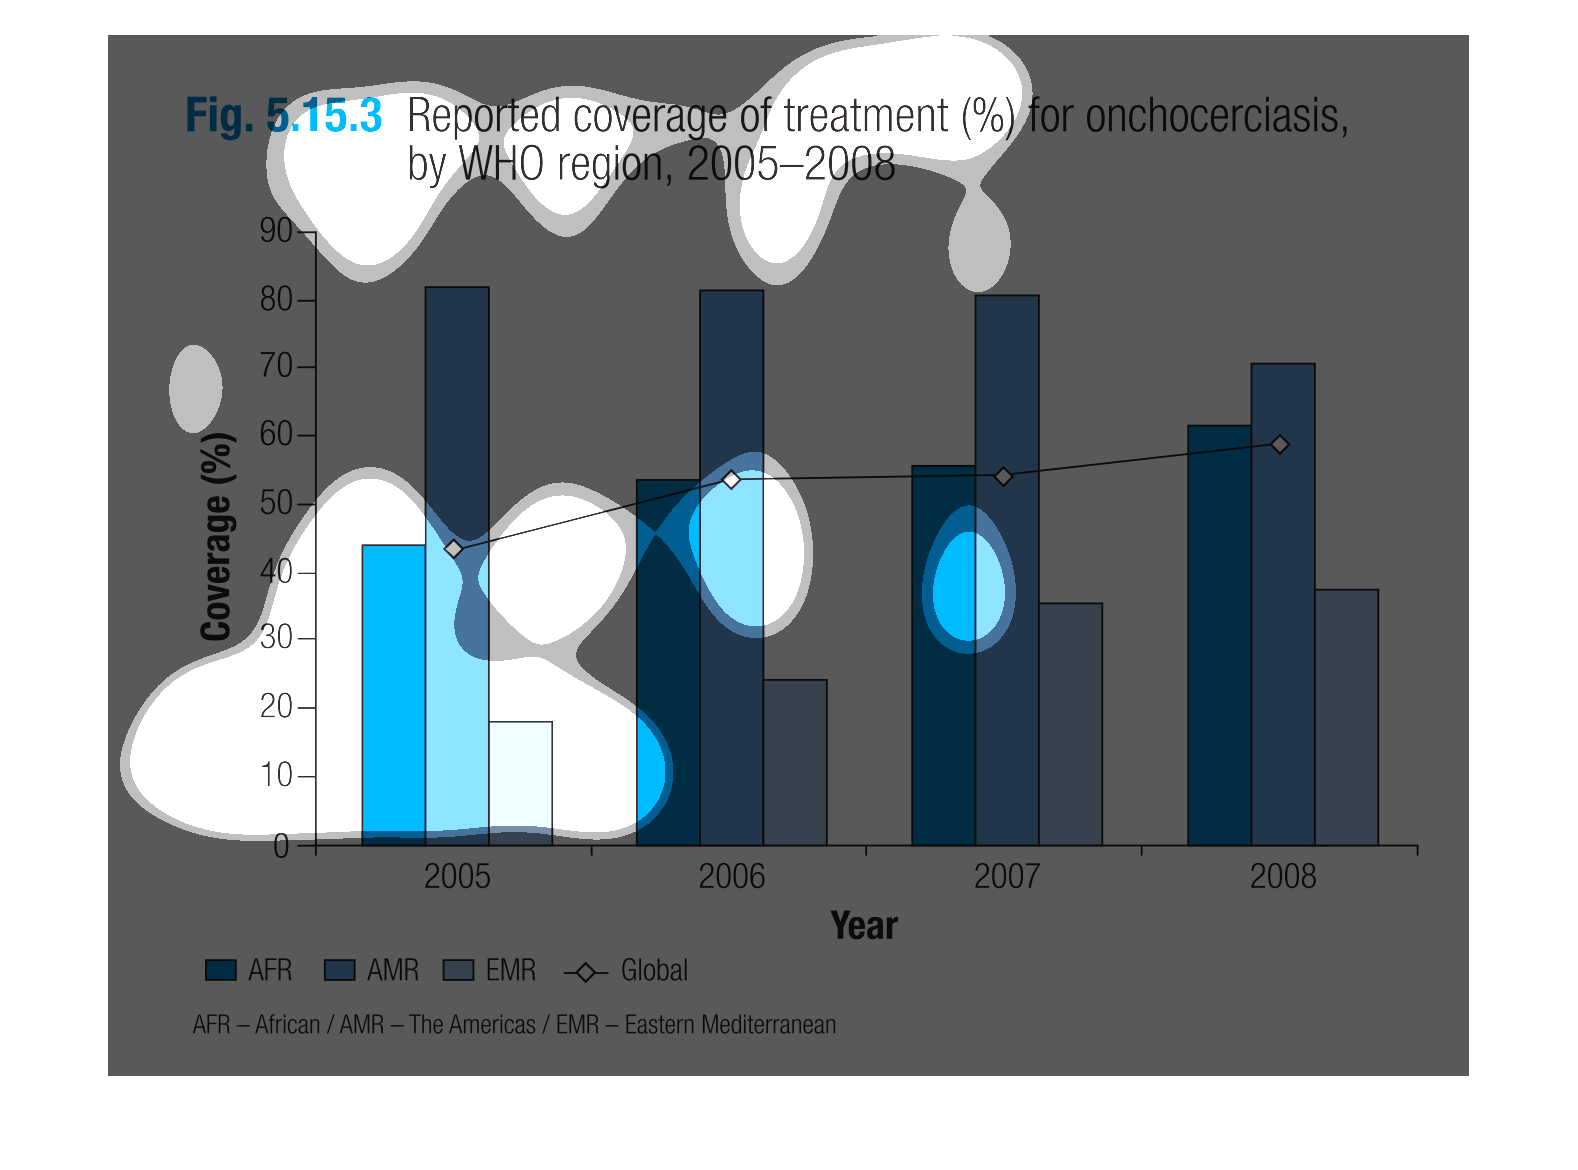
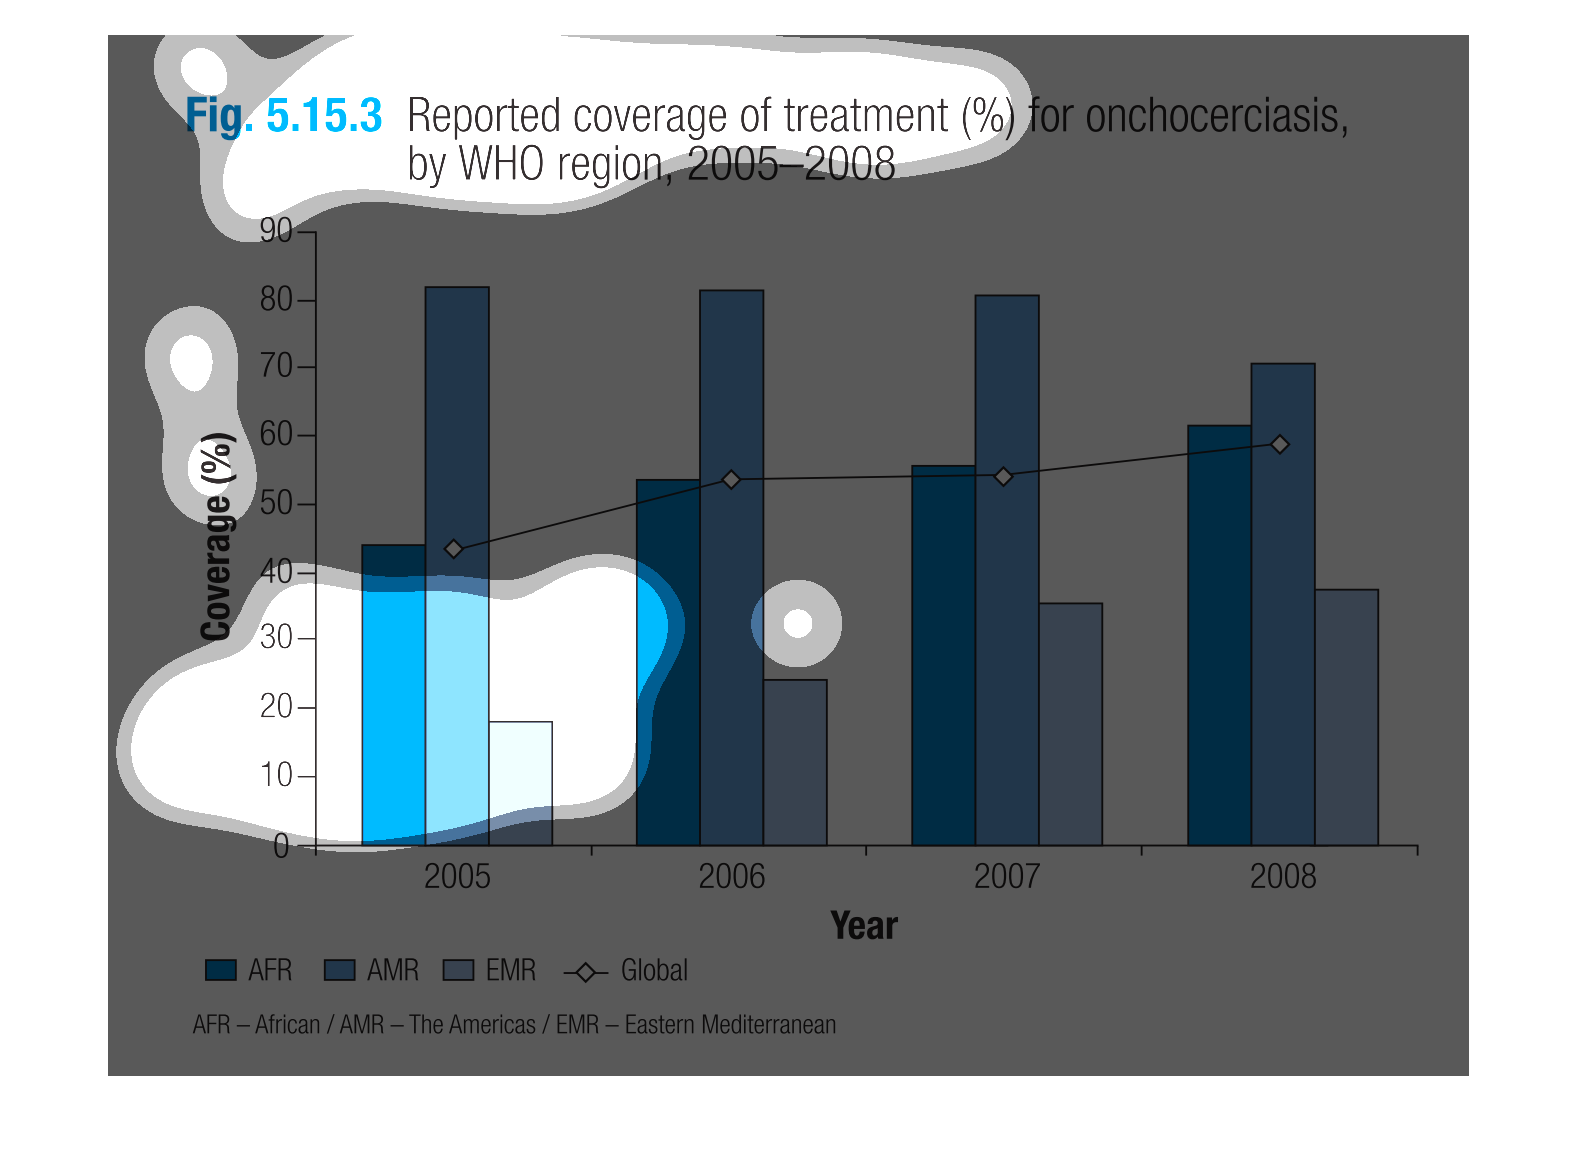
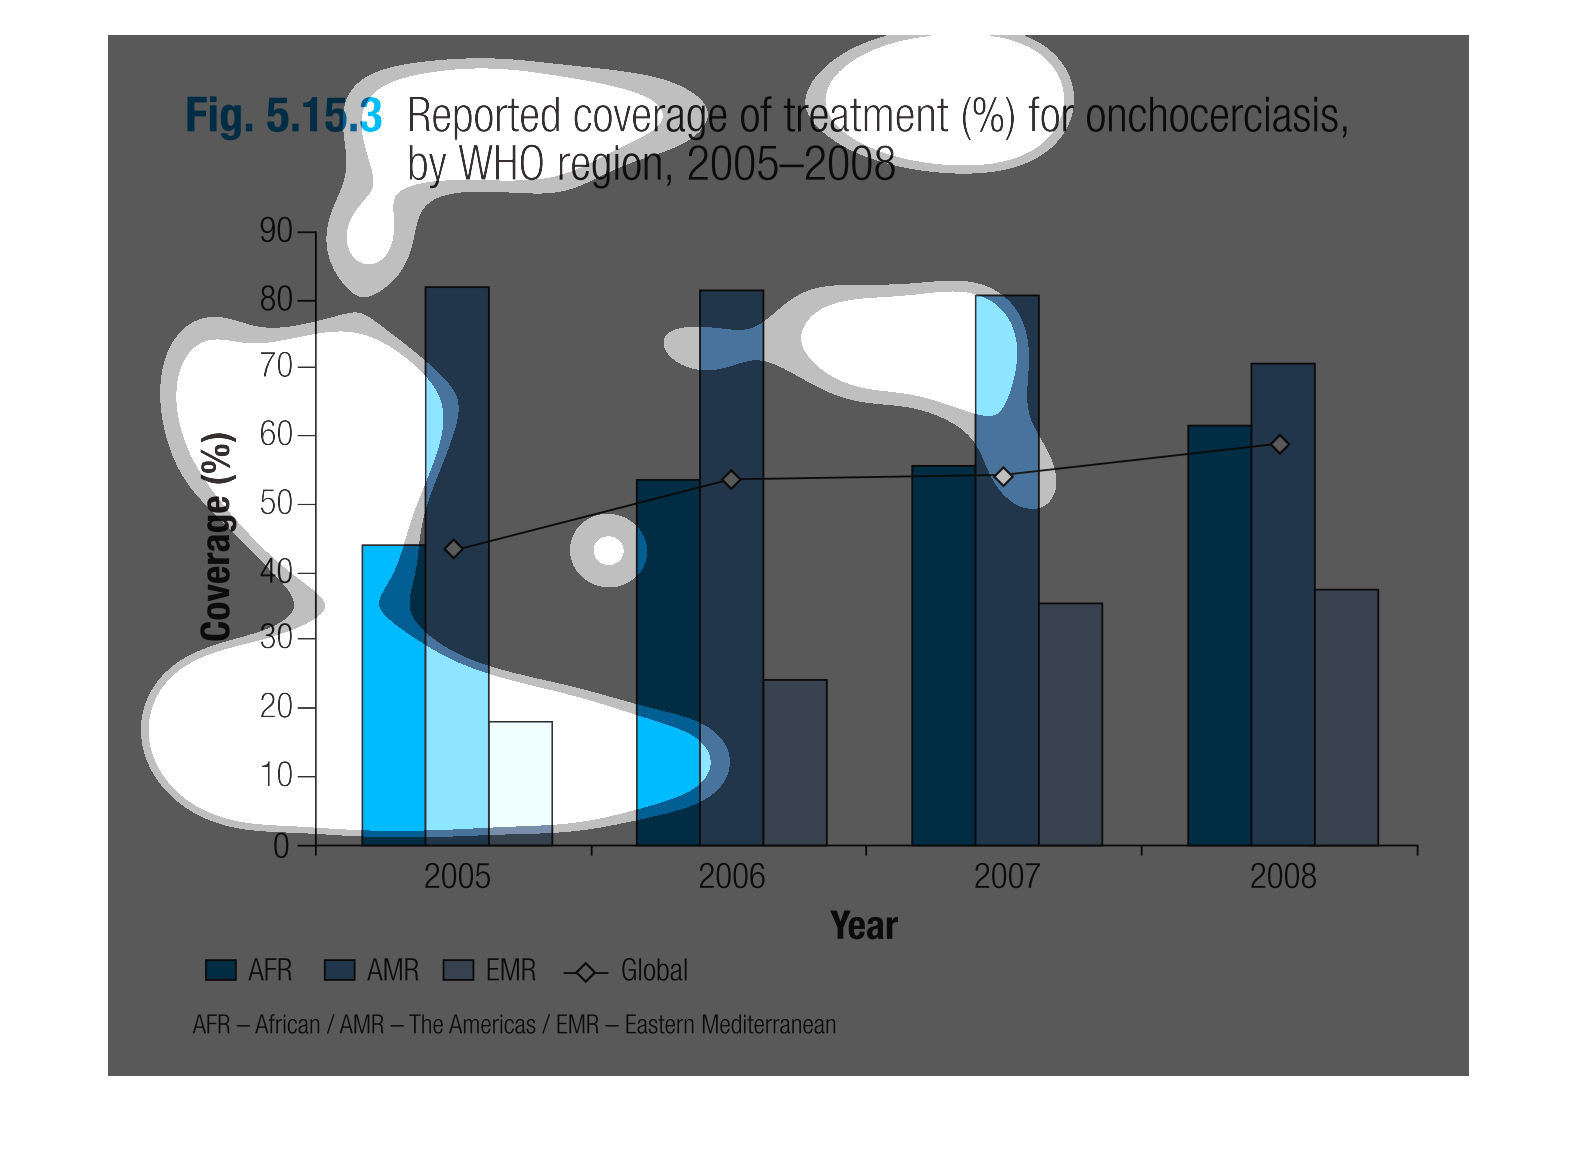
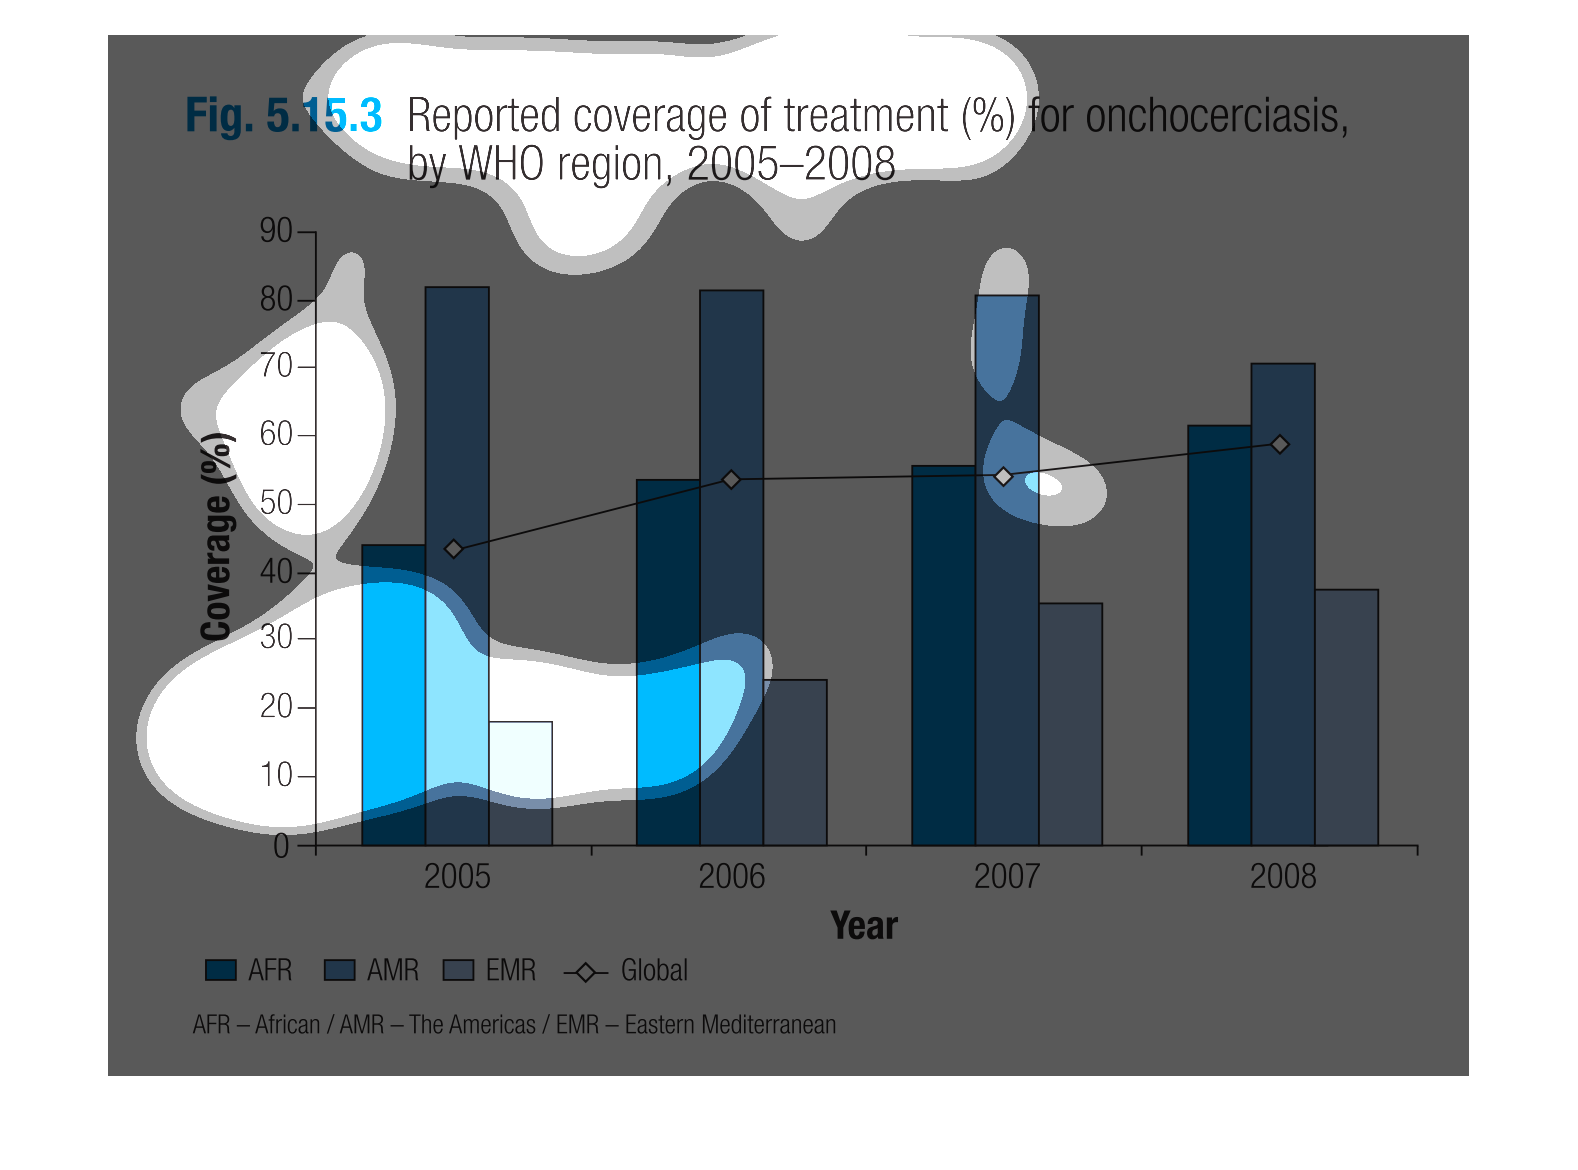
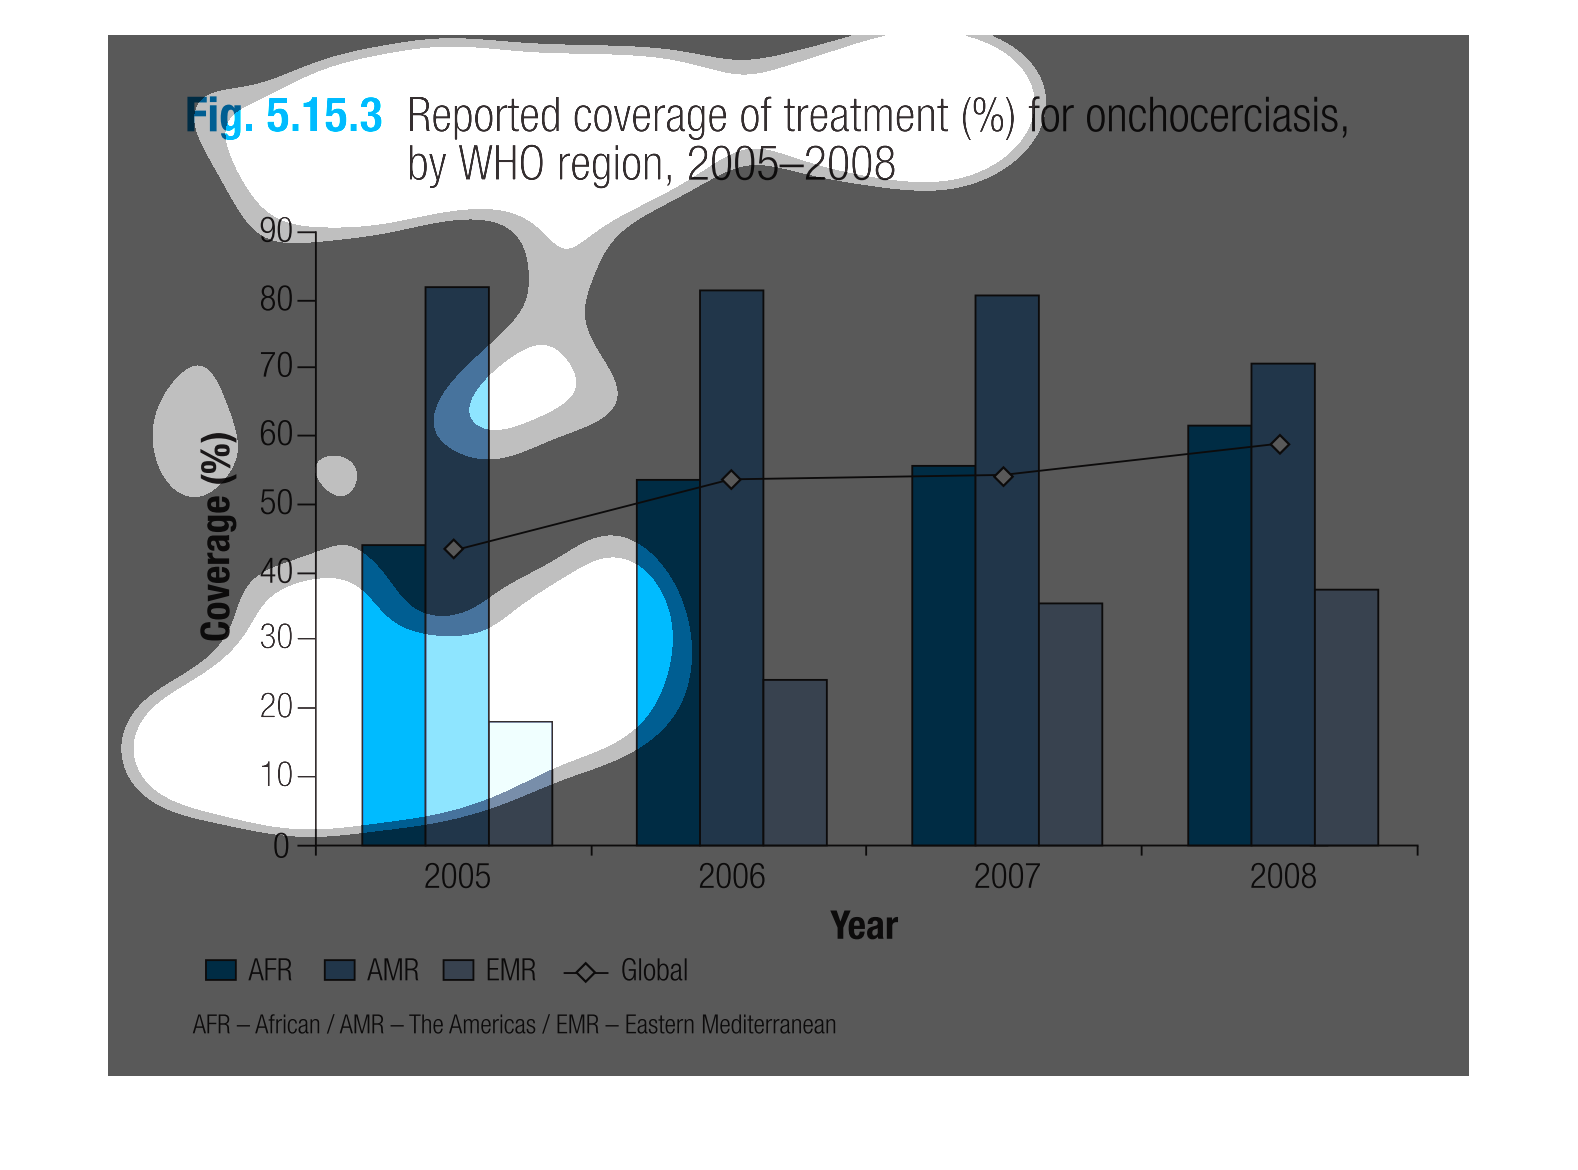
This graph shows the reported coverage of treatment for onchocerciasis by WHO region during
the years 2005-2008. Data is reported in percentages. The AMR region received the most coverage
throughout the three years covered, and the EMR region received the least coverage. THE AMR
region received 60-80%% of coverage while the EMR region received 15-40%.
The research study was done to determine the coverage of treatment for onchocerciasis by WHO
region during the period of 2005 to 2008, a 4 years study. The regions studied include African,
the Americas, Eastern Mediterranean, and globally.
the graph depicts reported coveage during breakouts of onchocerciasis from 2005-2008. The
graph is broken down by coverage percentage and regions, as defined by the WHO.
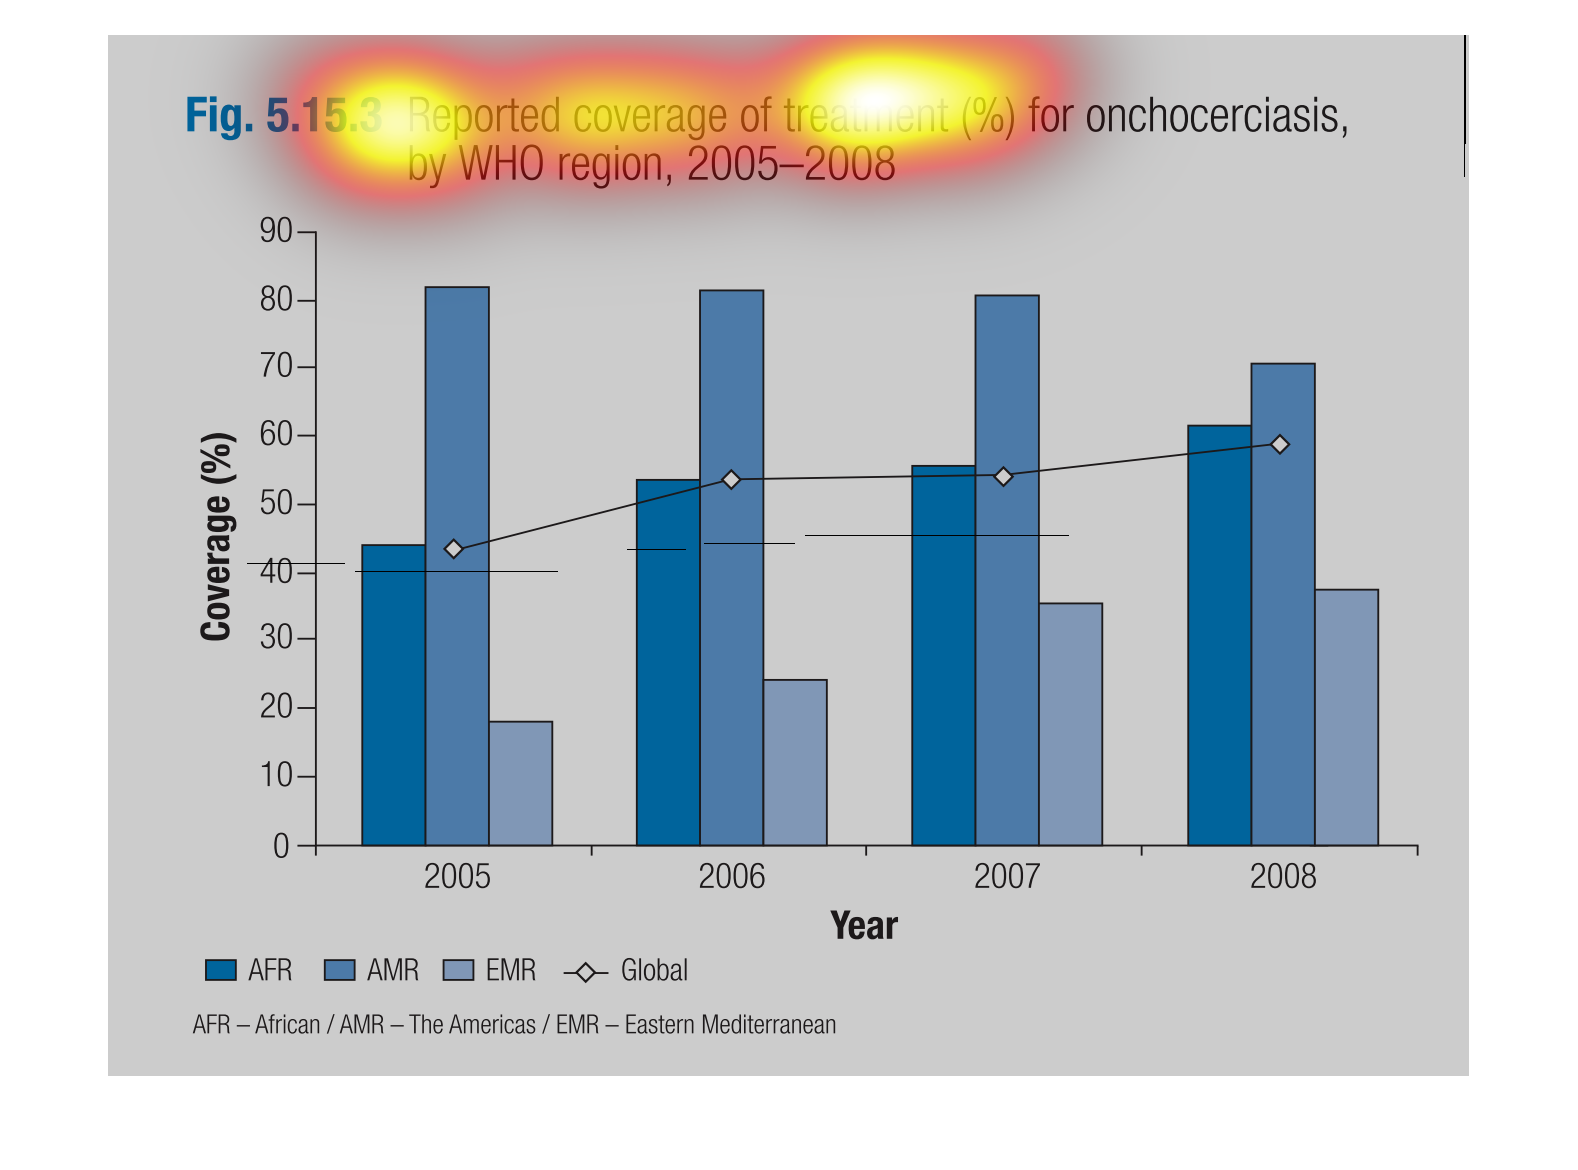
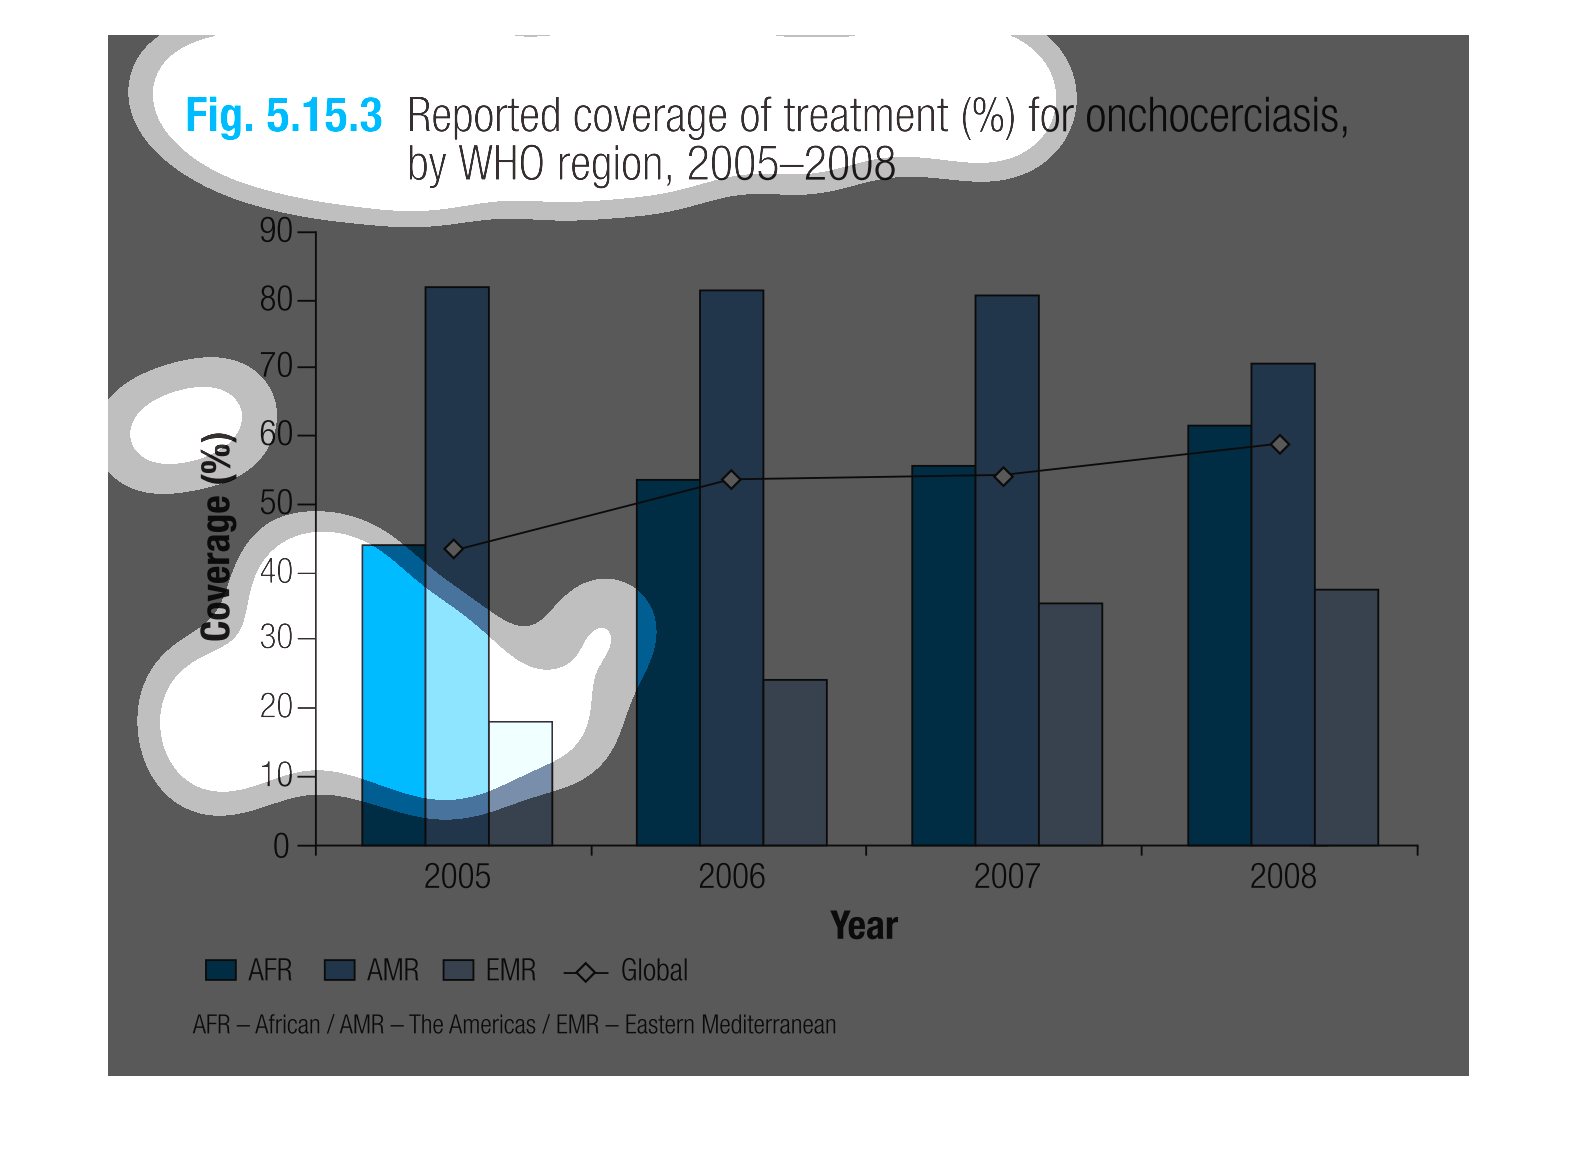
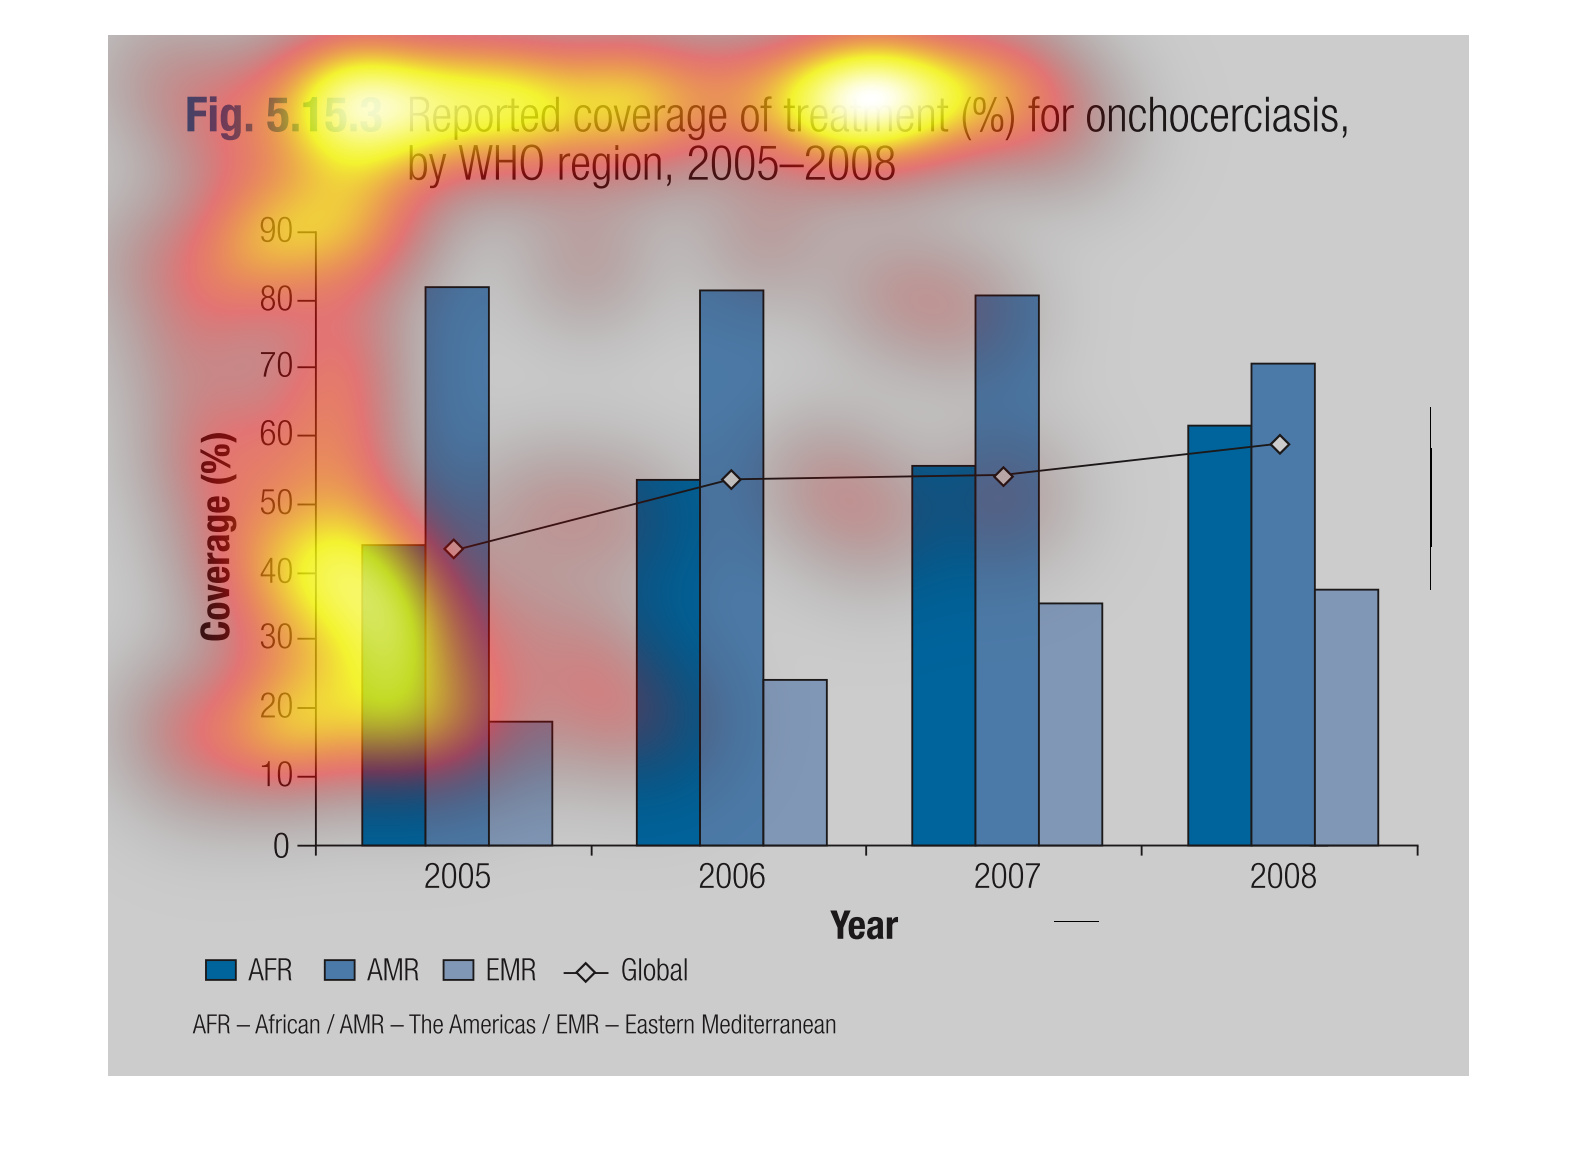
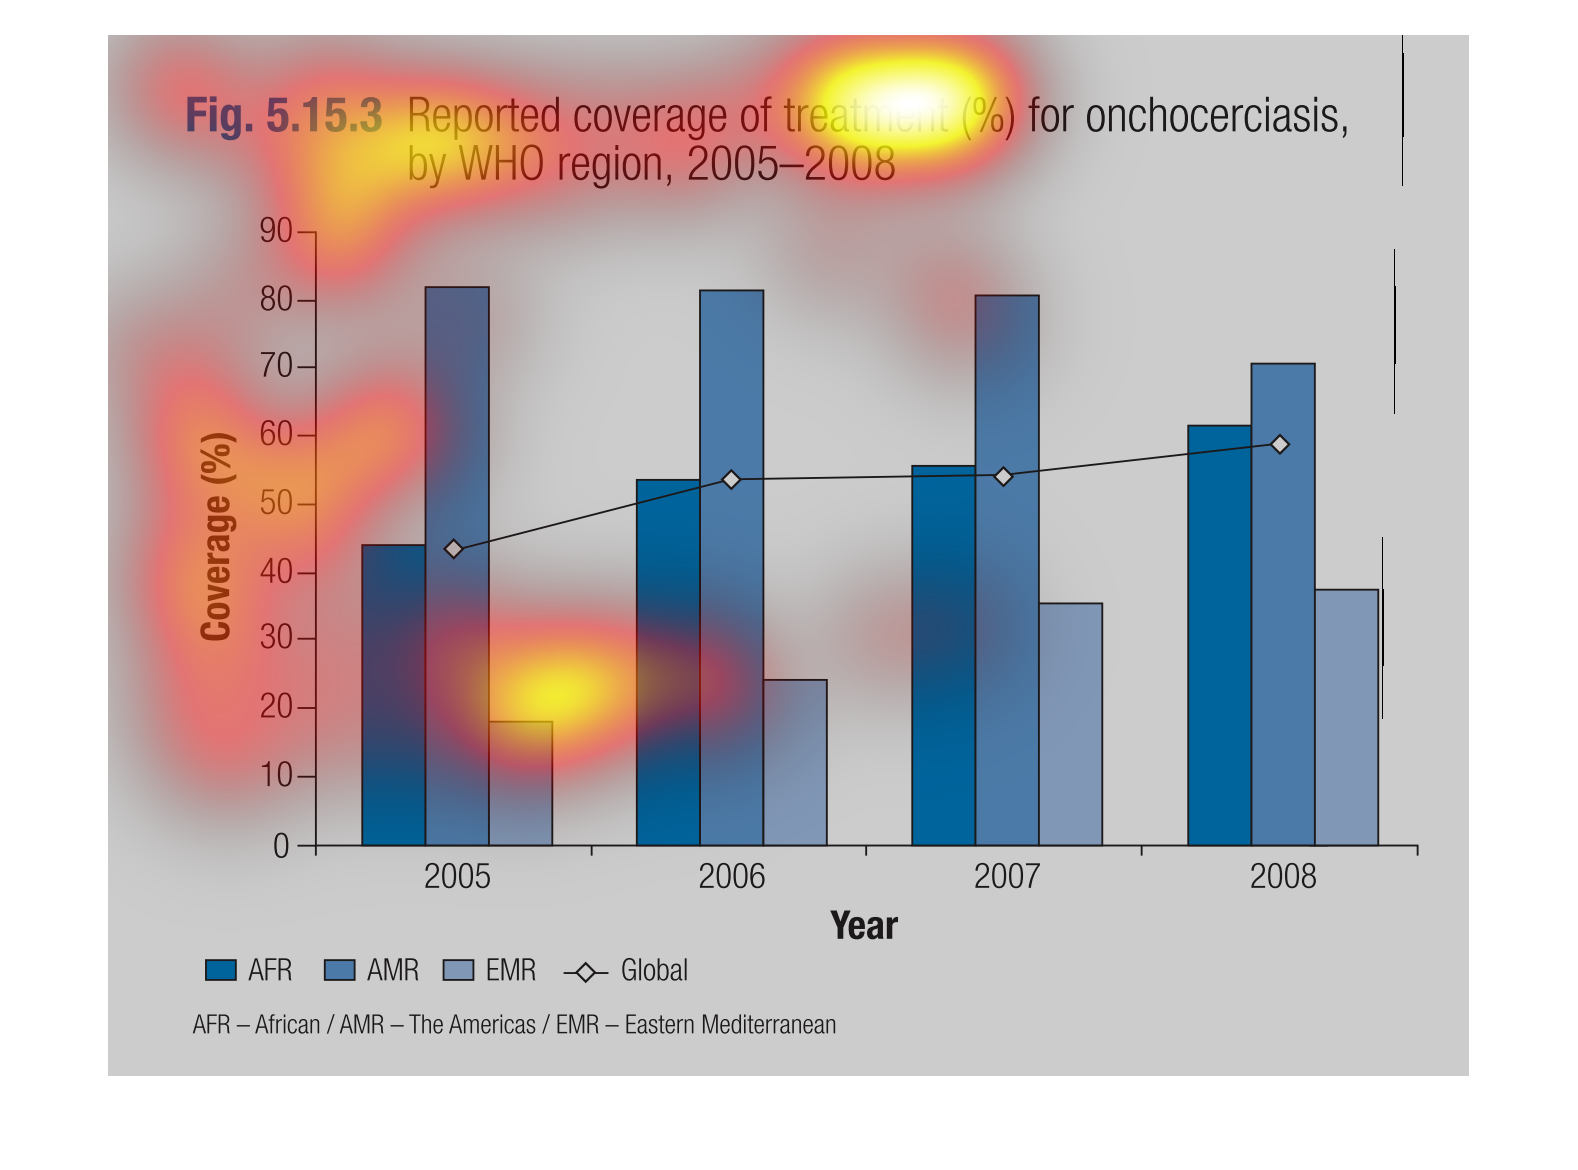
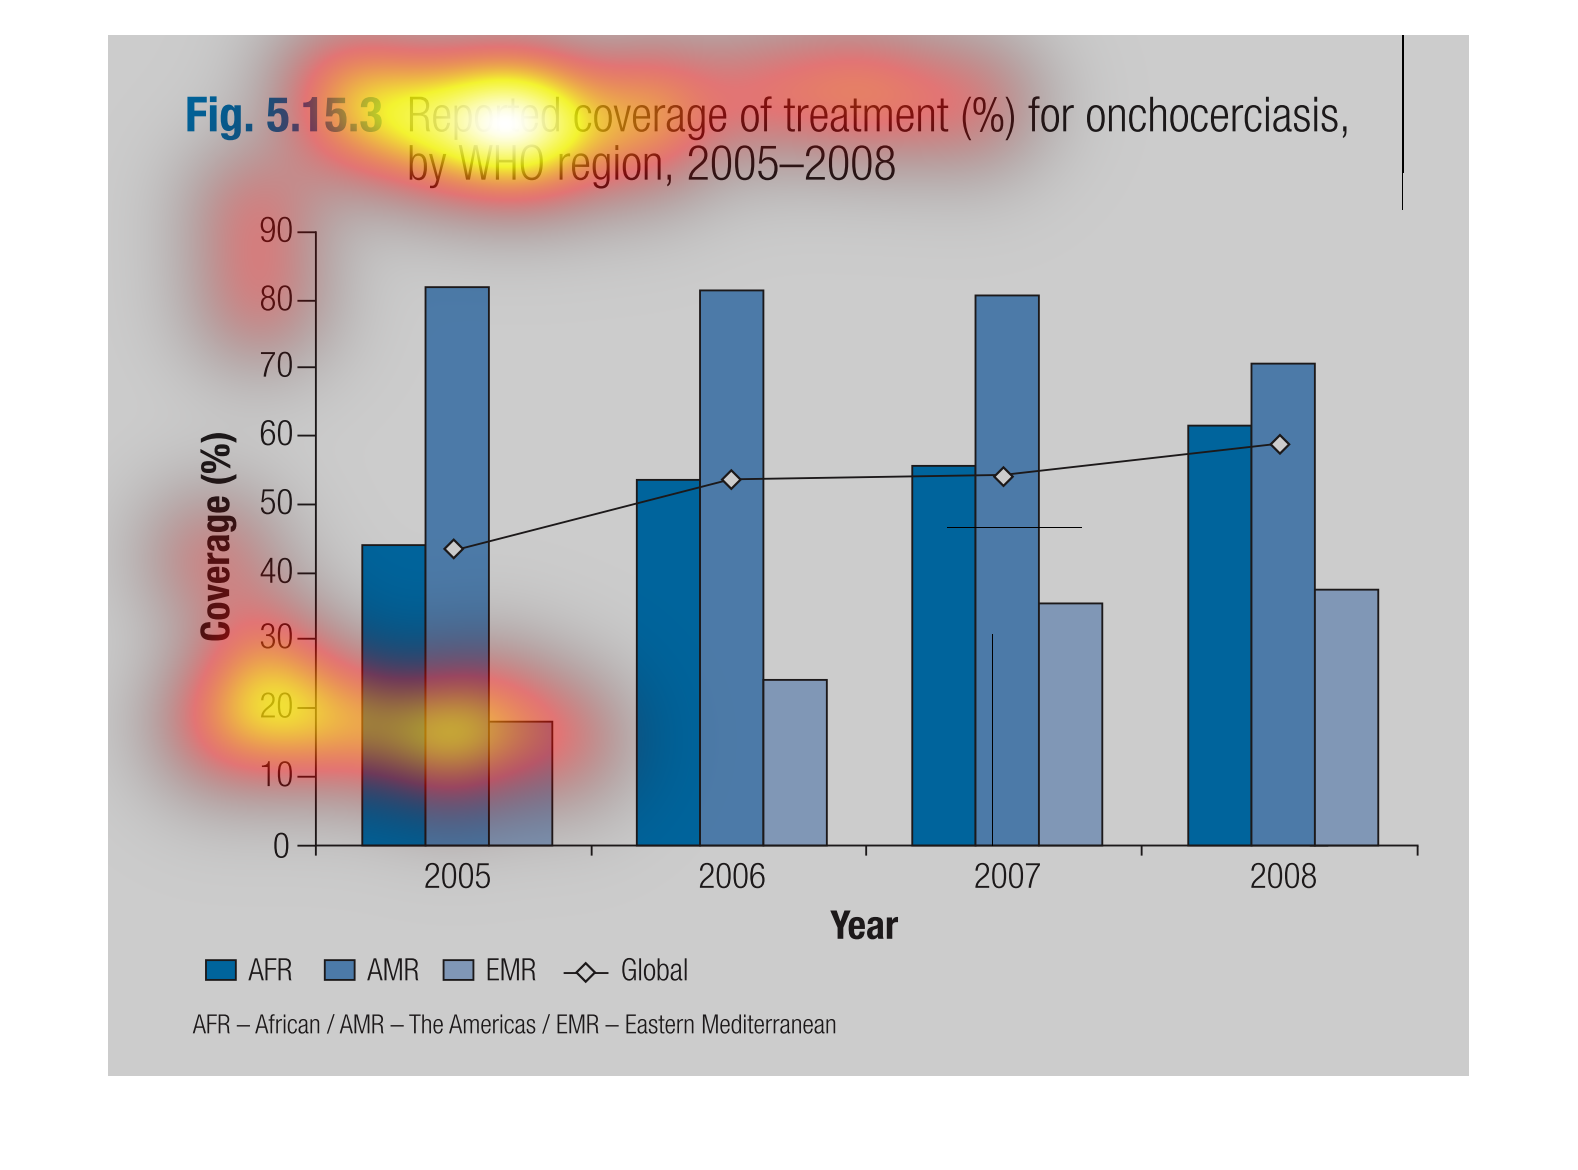
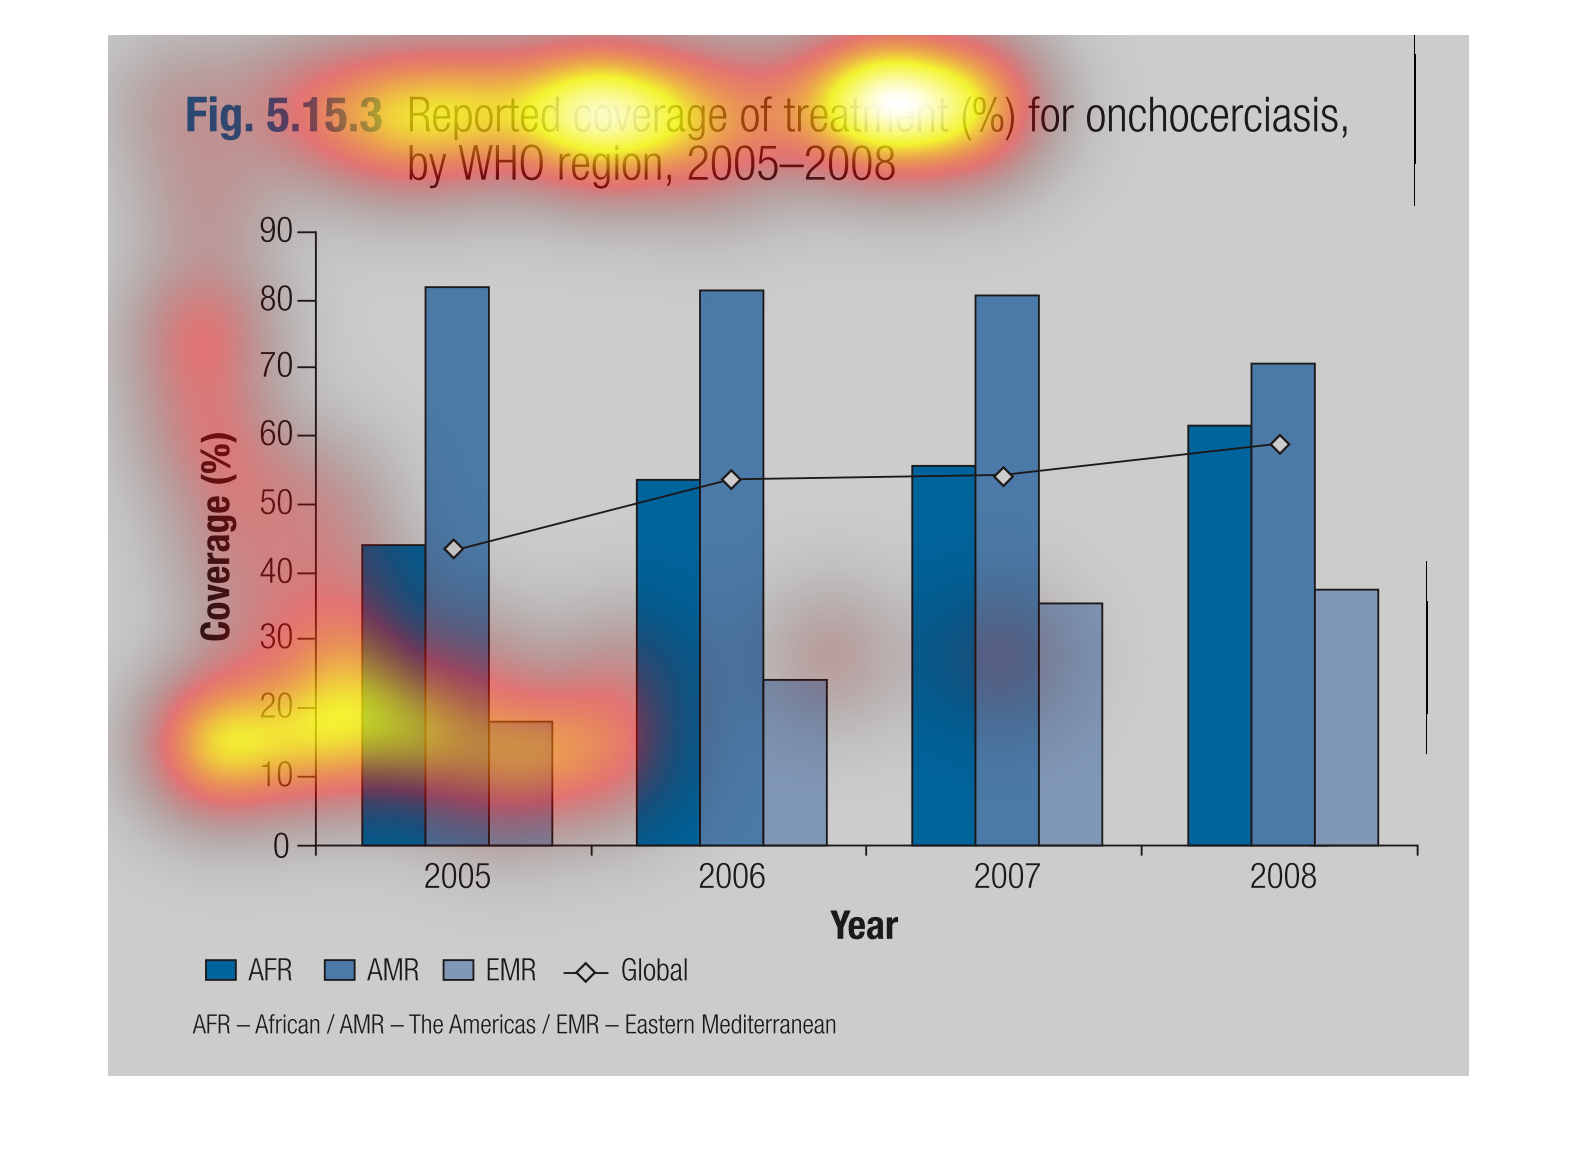
Reported coverage of treatment (%) for onchocerciasis, by WHO region, 2005-2008. African always
in the middle amount of treatment ever year, The Americas were always the highest treated,
Eastern Mediterranean always being the lowest treated.
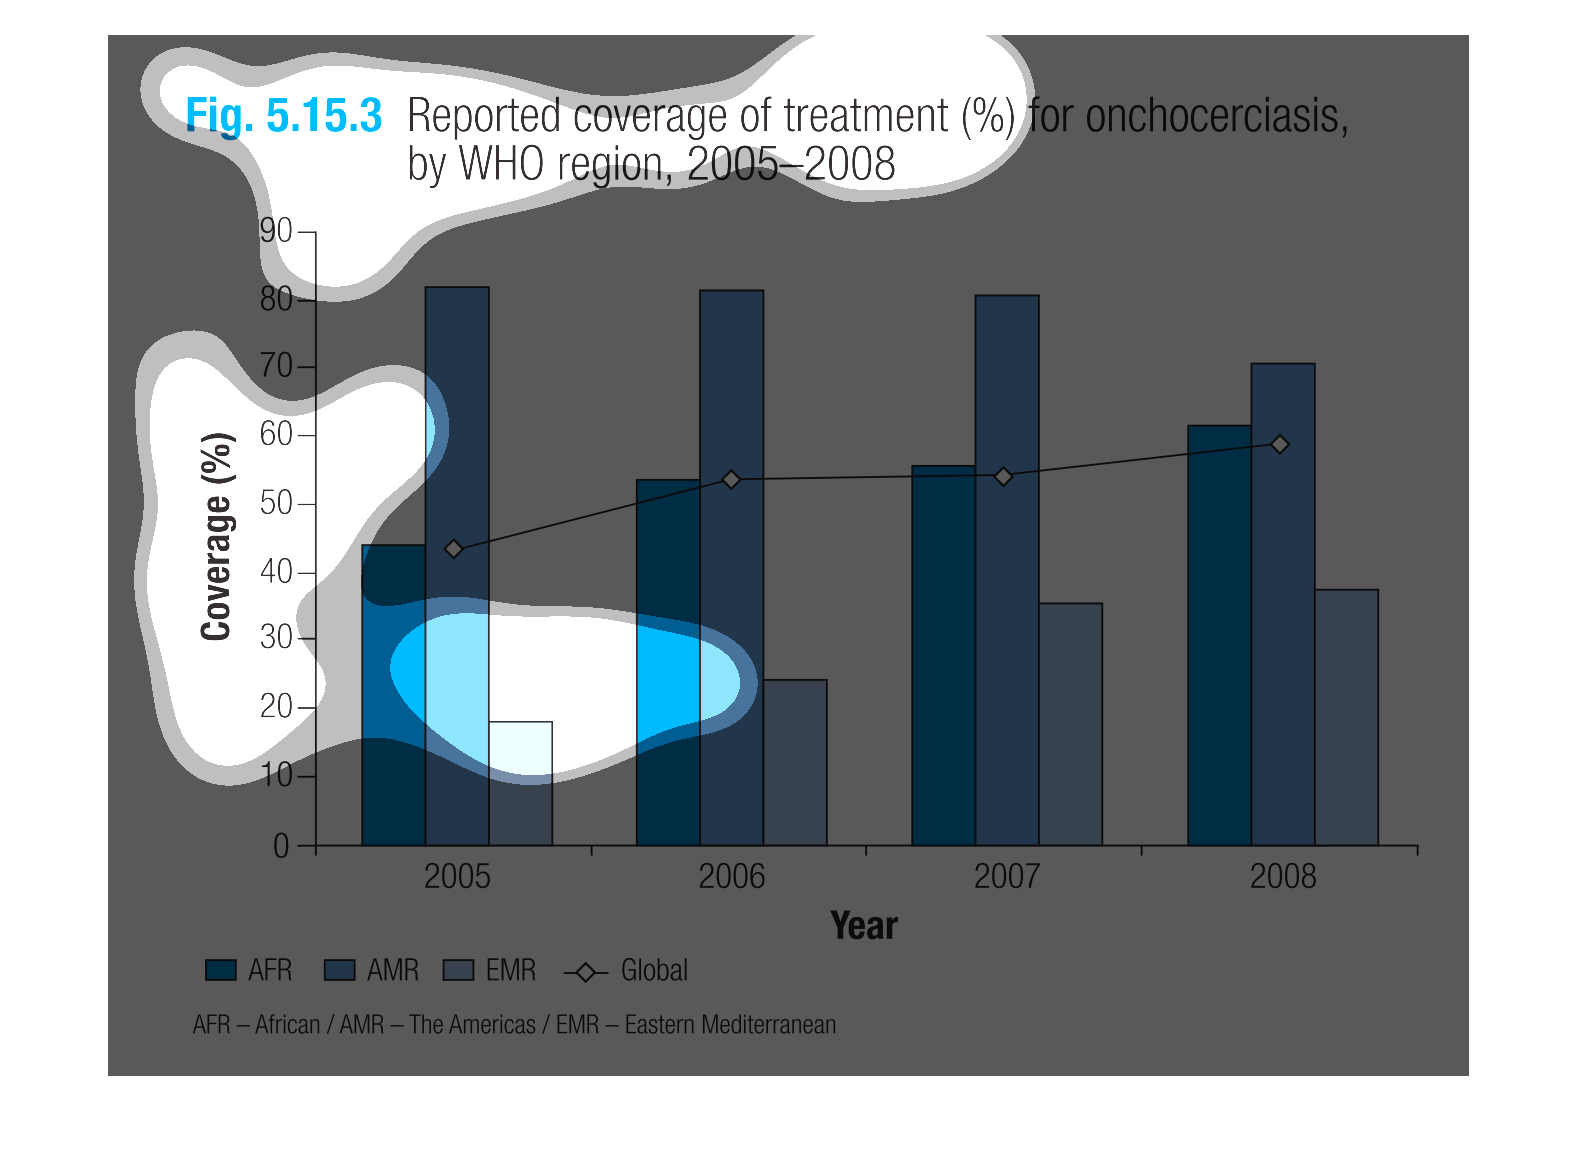
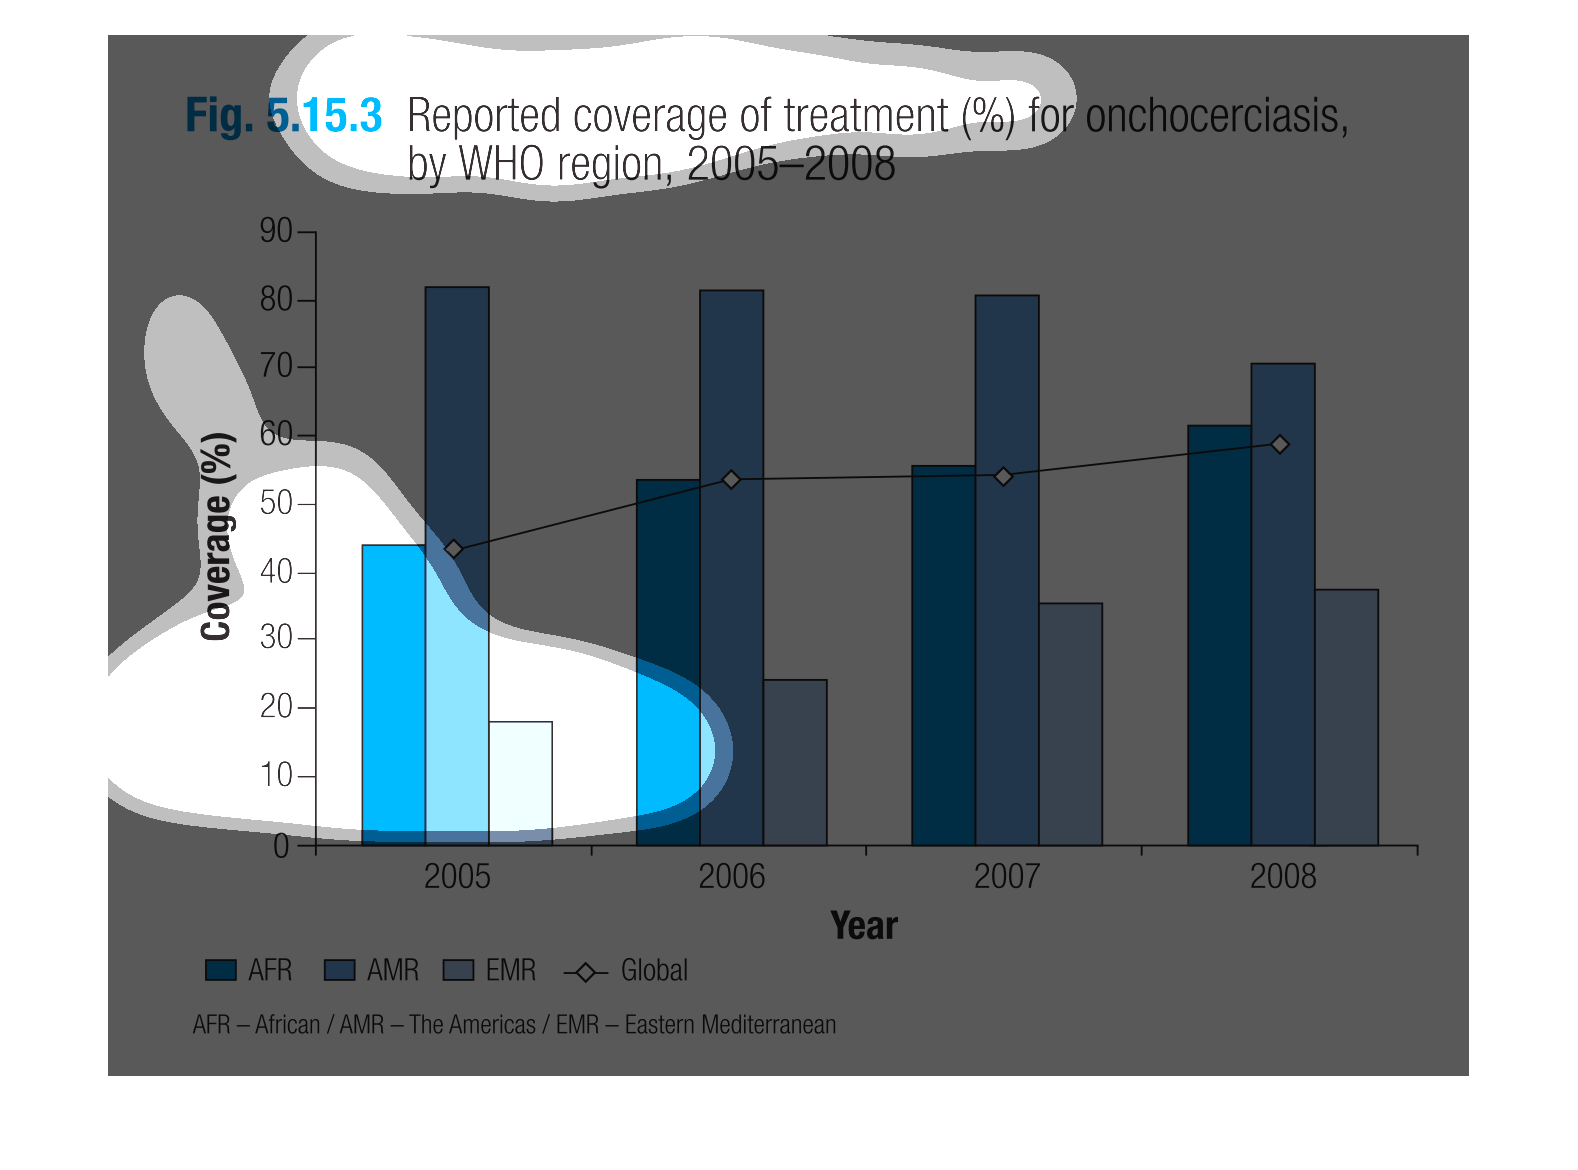
This graph is tracking the coverage of treatment for onchocerciasis, Coverage is on the Y-Axis
and the year is on the X-Axis. There are three bars for each studied year.
This graph shows the total amounts of a certain disease among the population. The results
are reports by year and also by the various regions in the world.
This chart shows reported coverage of treatment of onchocercias by the World Health Organization.
 The Americas have a much higher reported coverage than  Africa.
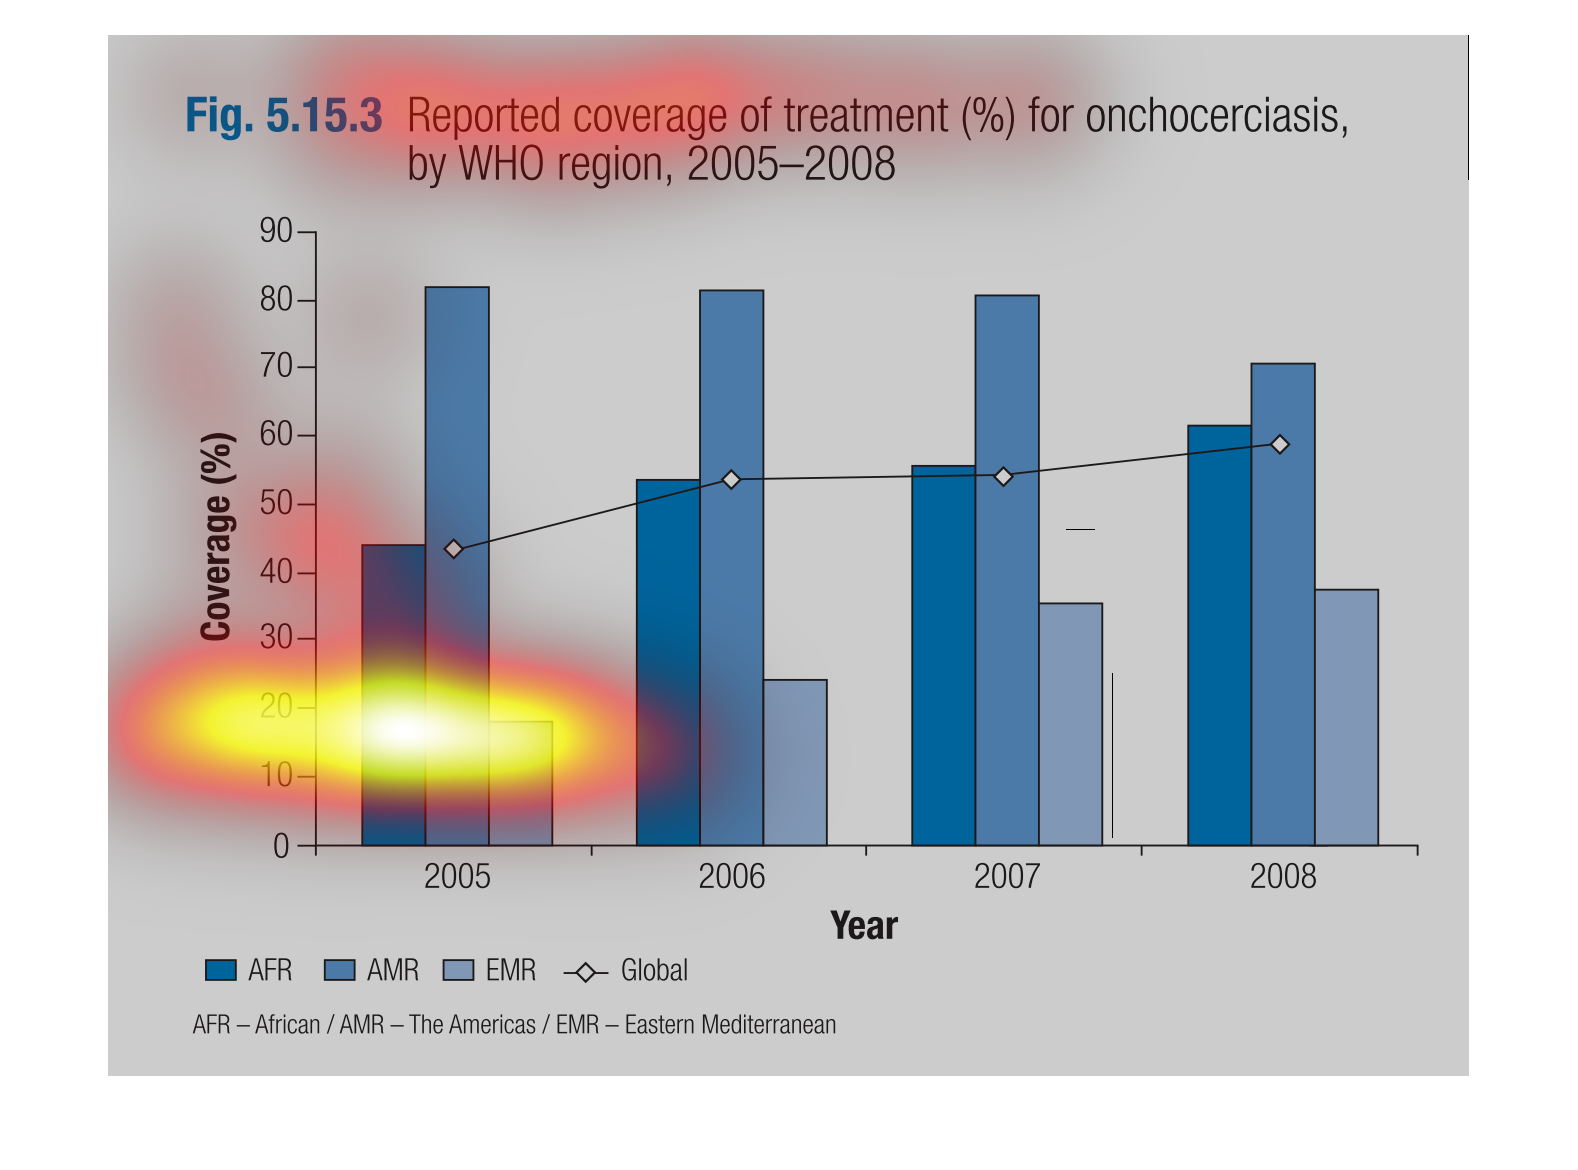
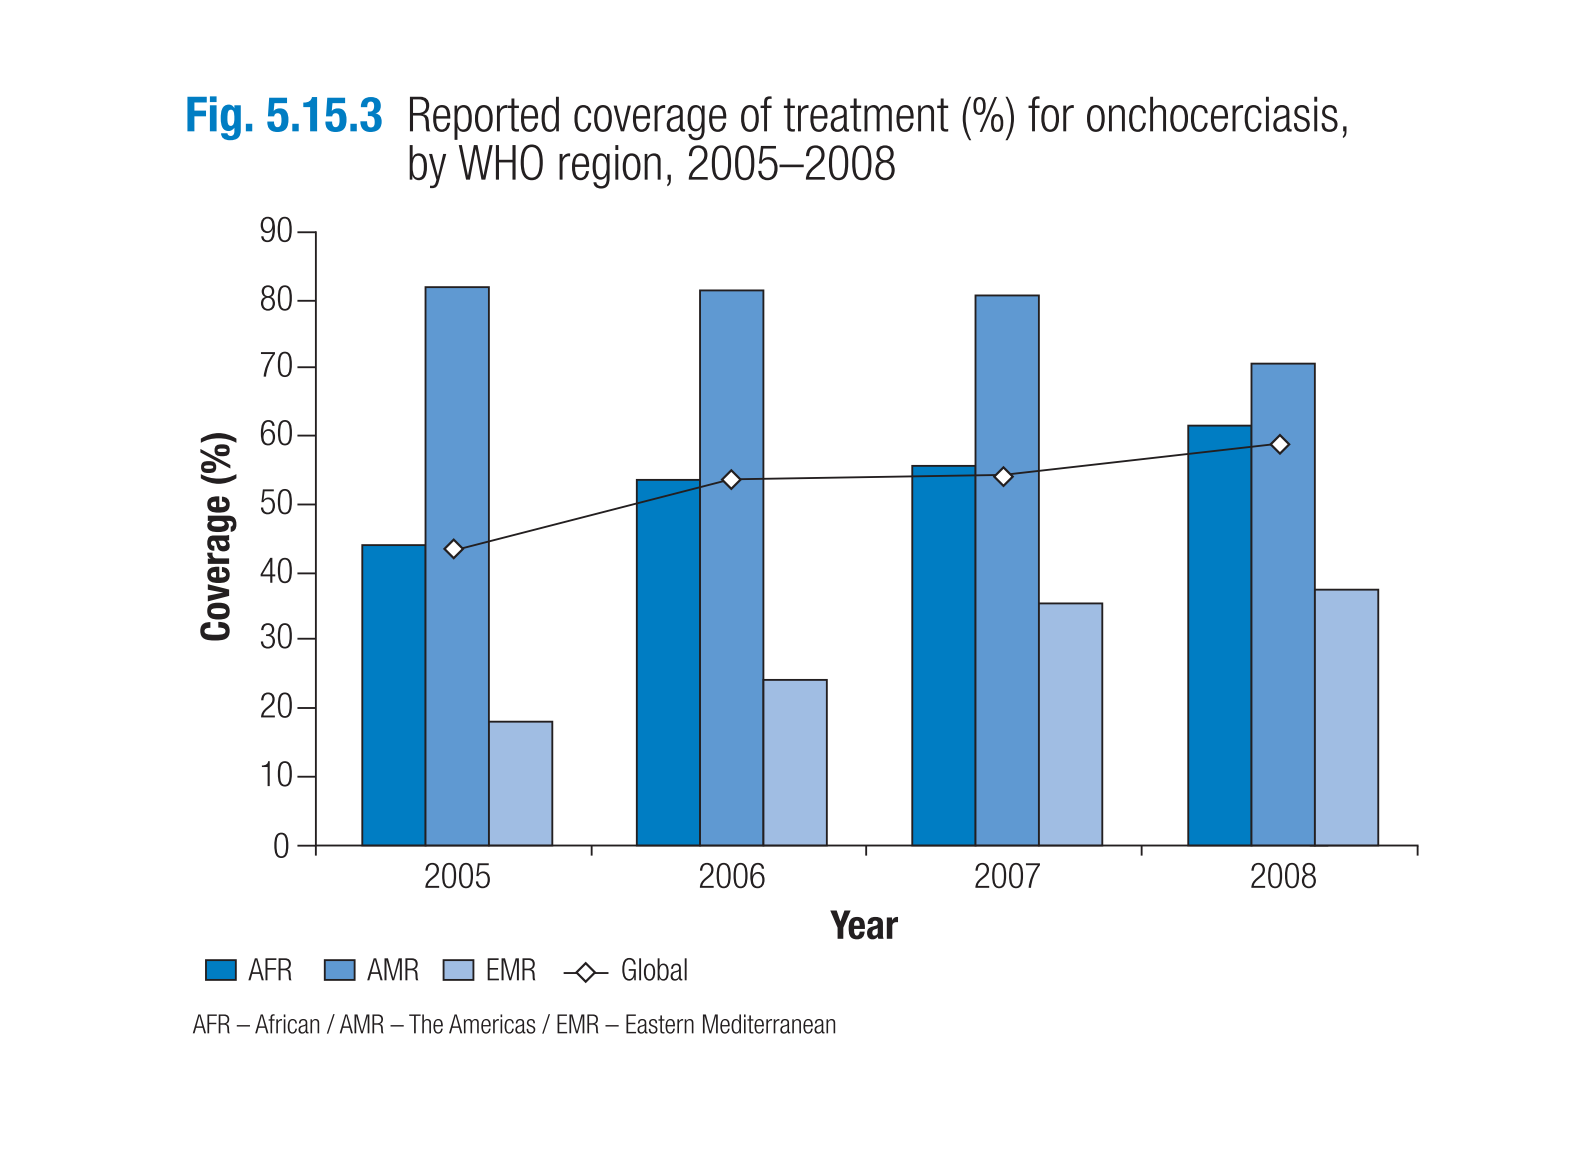
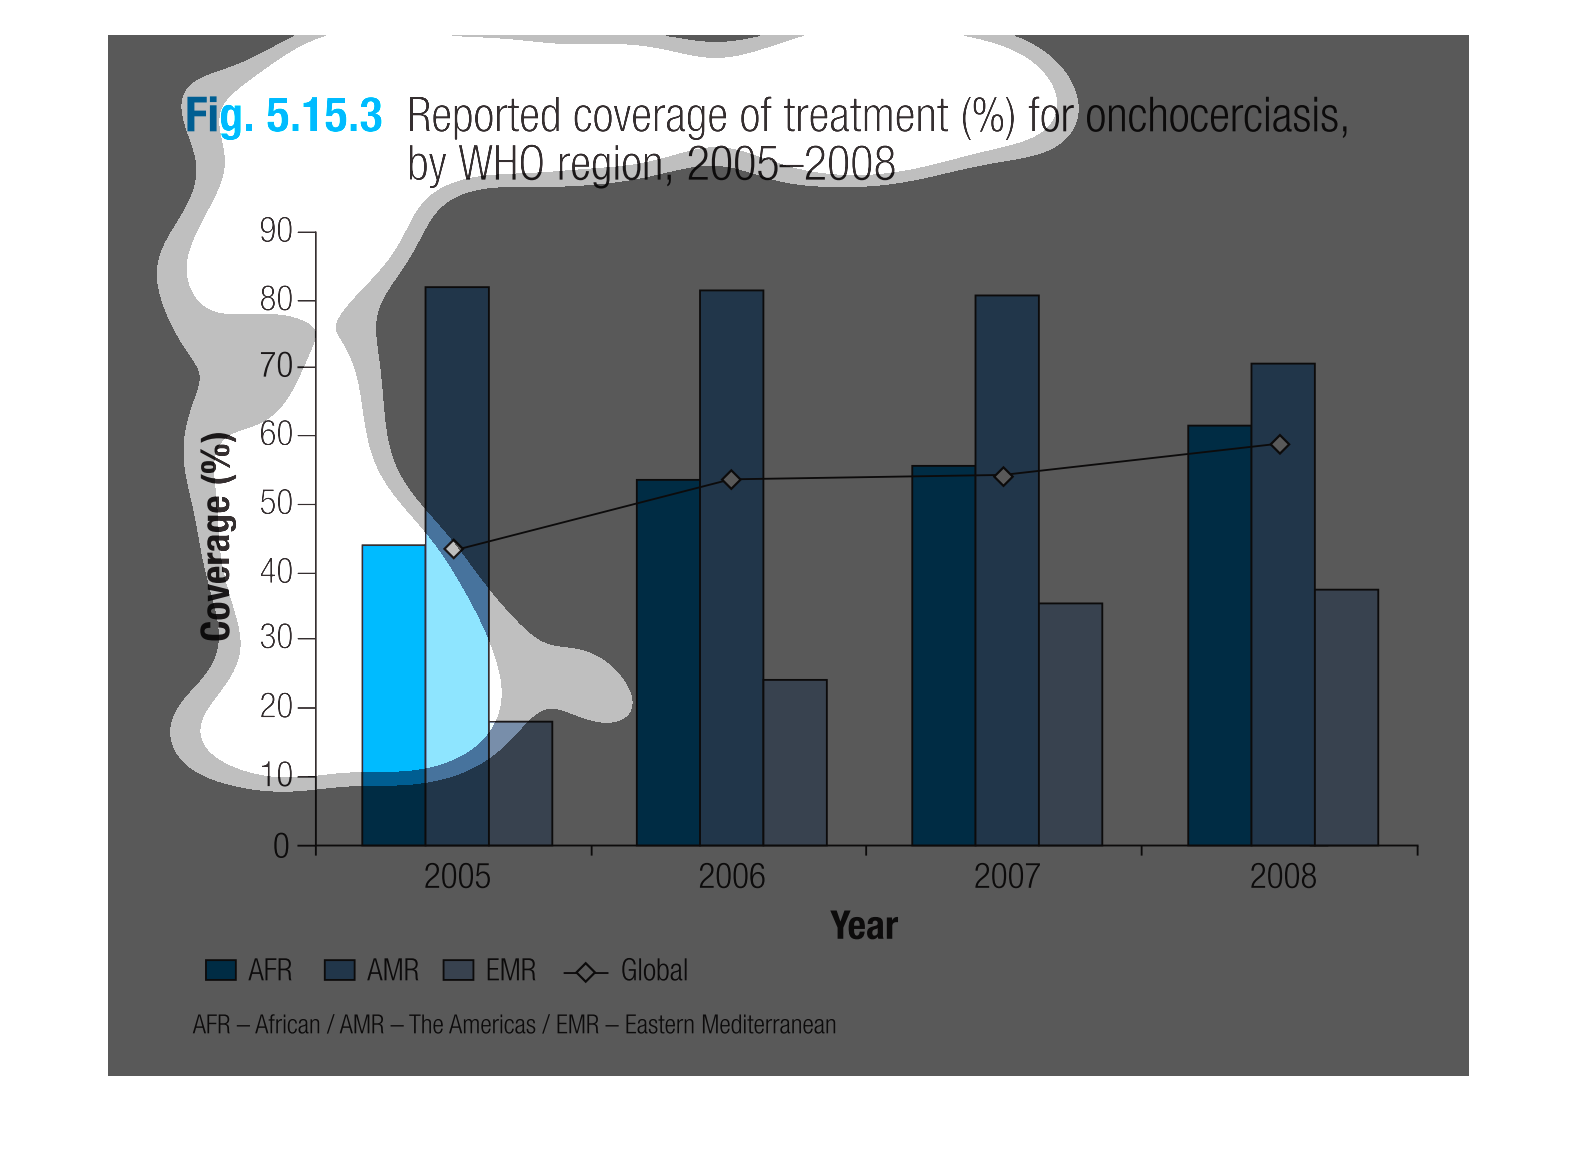
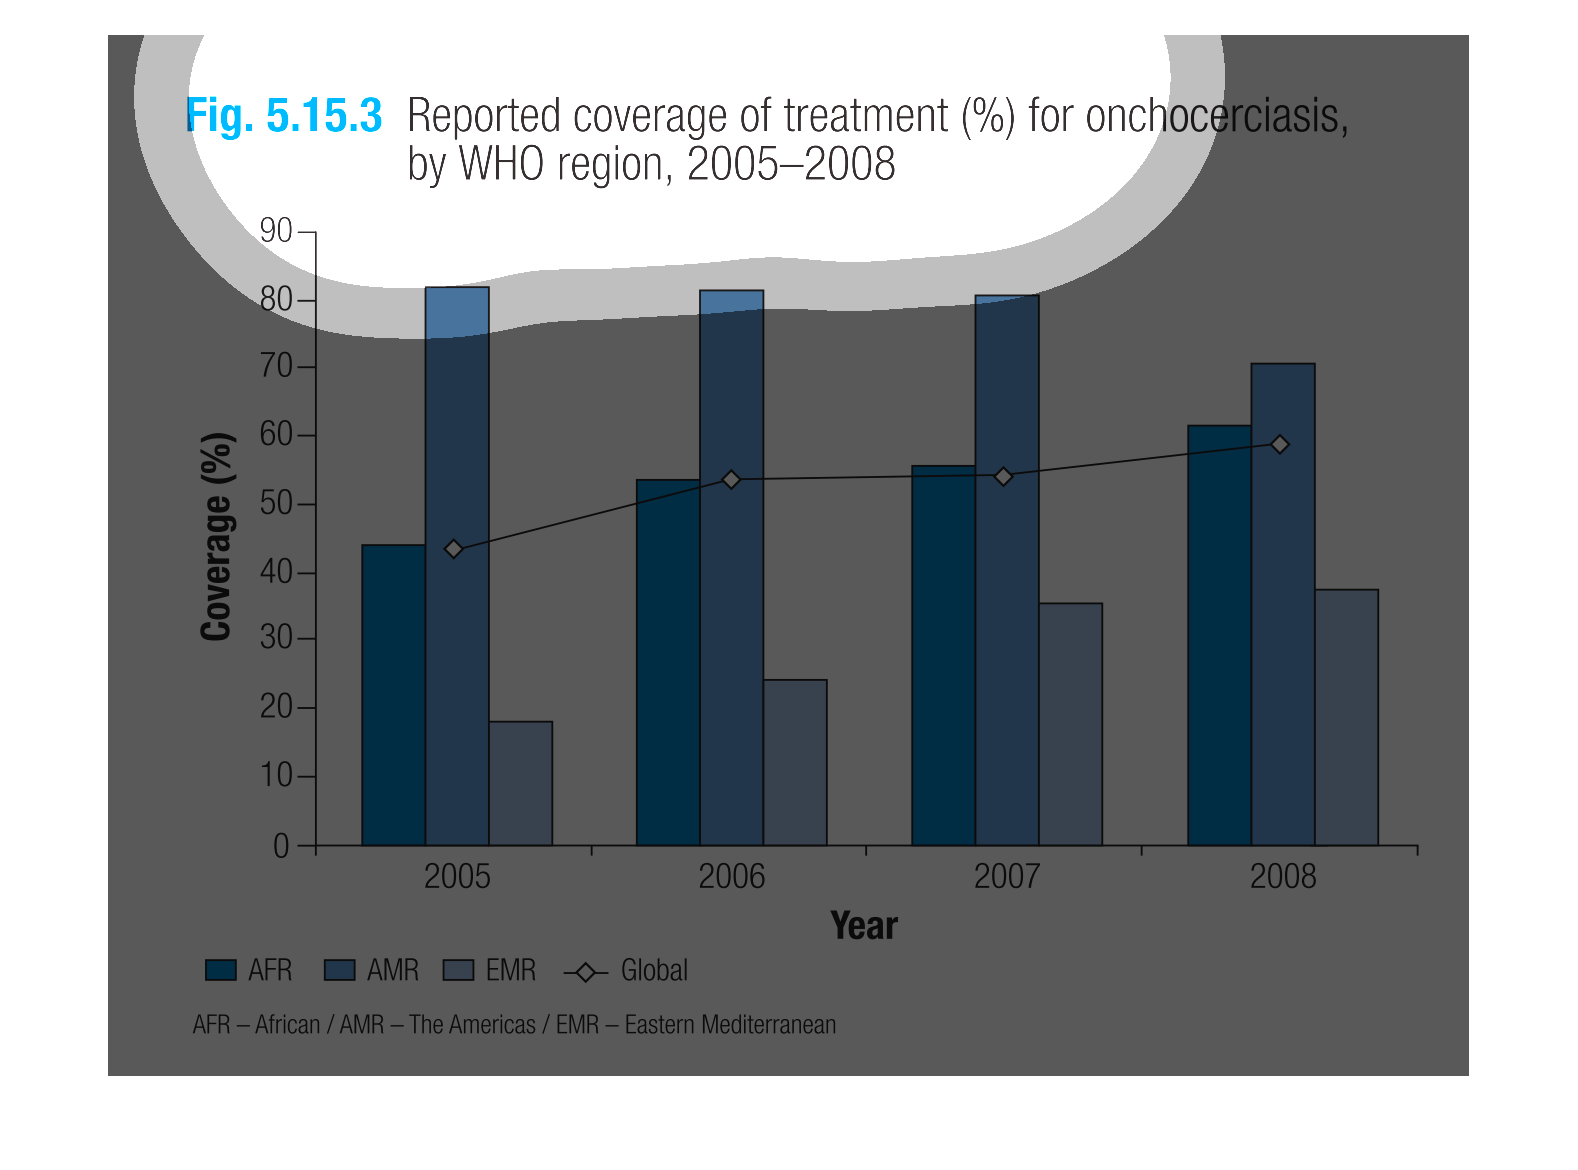
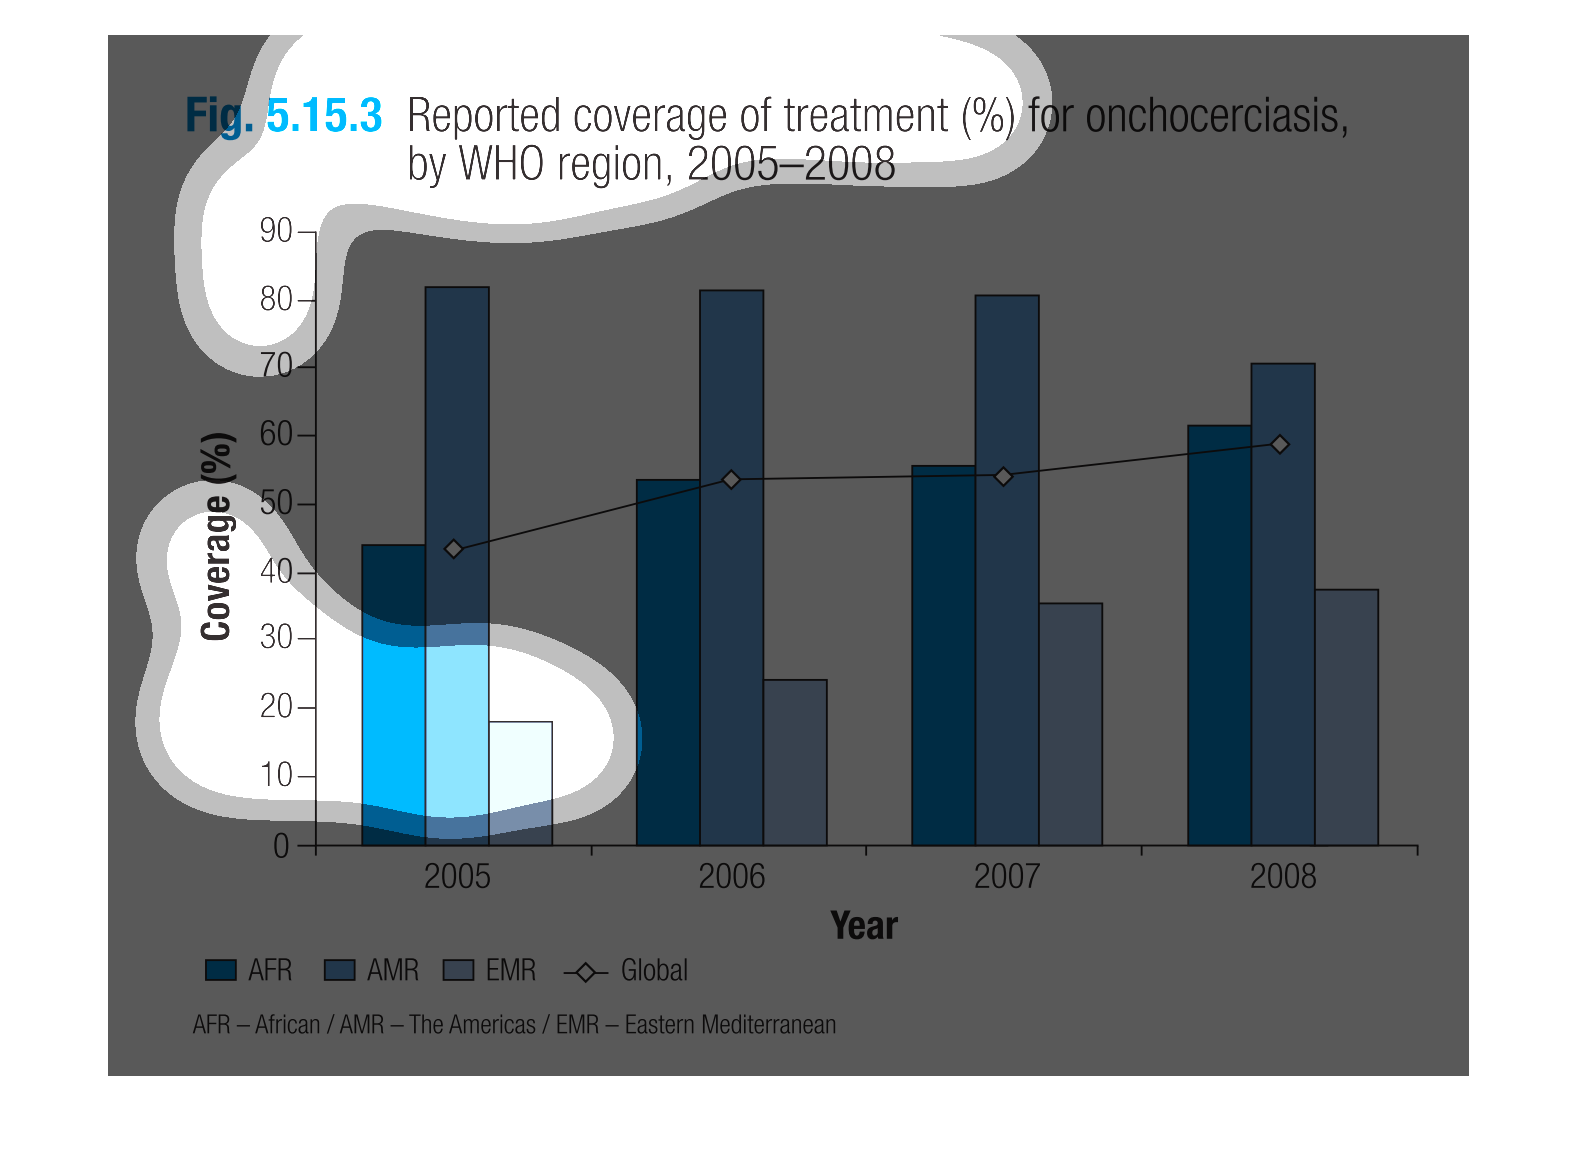
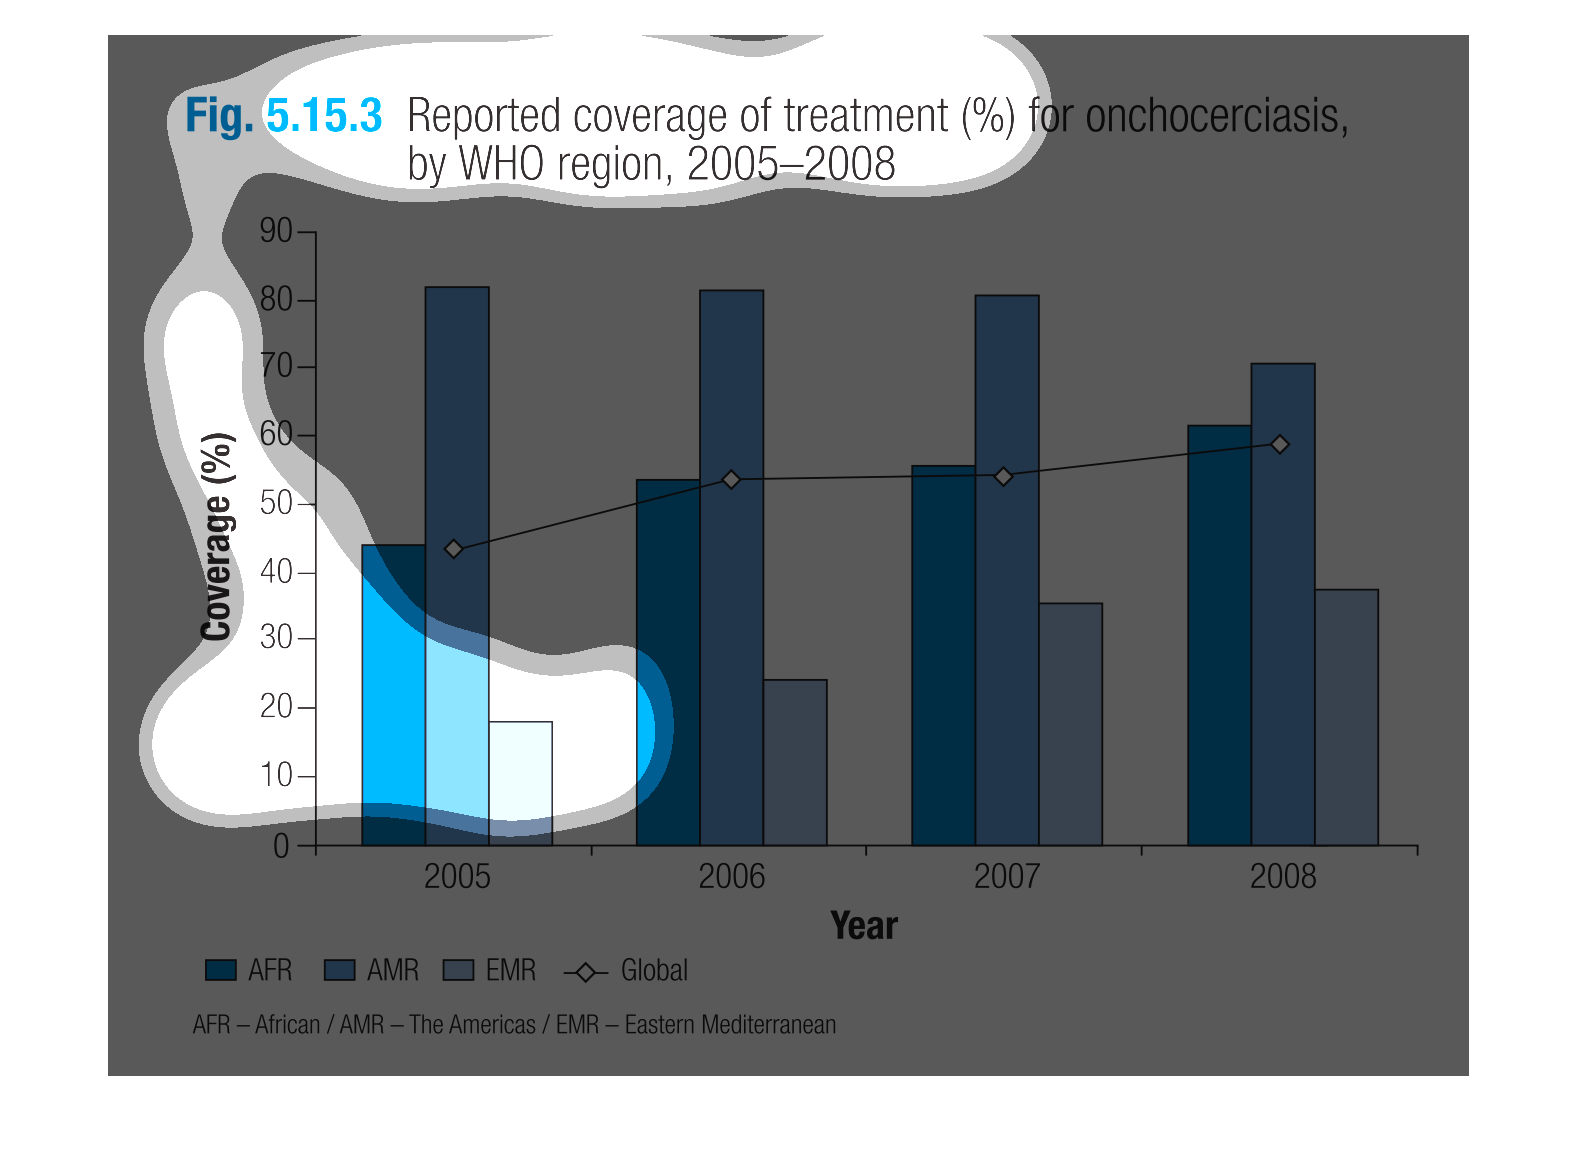
The image depicts a bar graph of reported coverage of treatment (in percentages) for onchocerciasis,
by the World Health Organization region, years 2005-2008. Regions include: African, The Americas,
and Eastern Mediterranean.  Easter Mediterranean seems to be far lower than the global average,
with the Americas above global average, and Africa hovering at around global average.
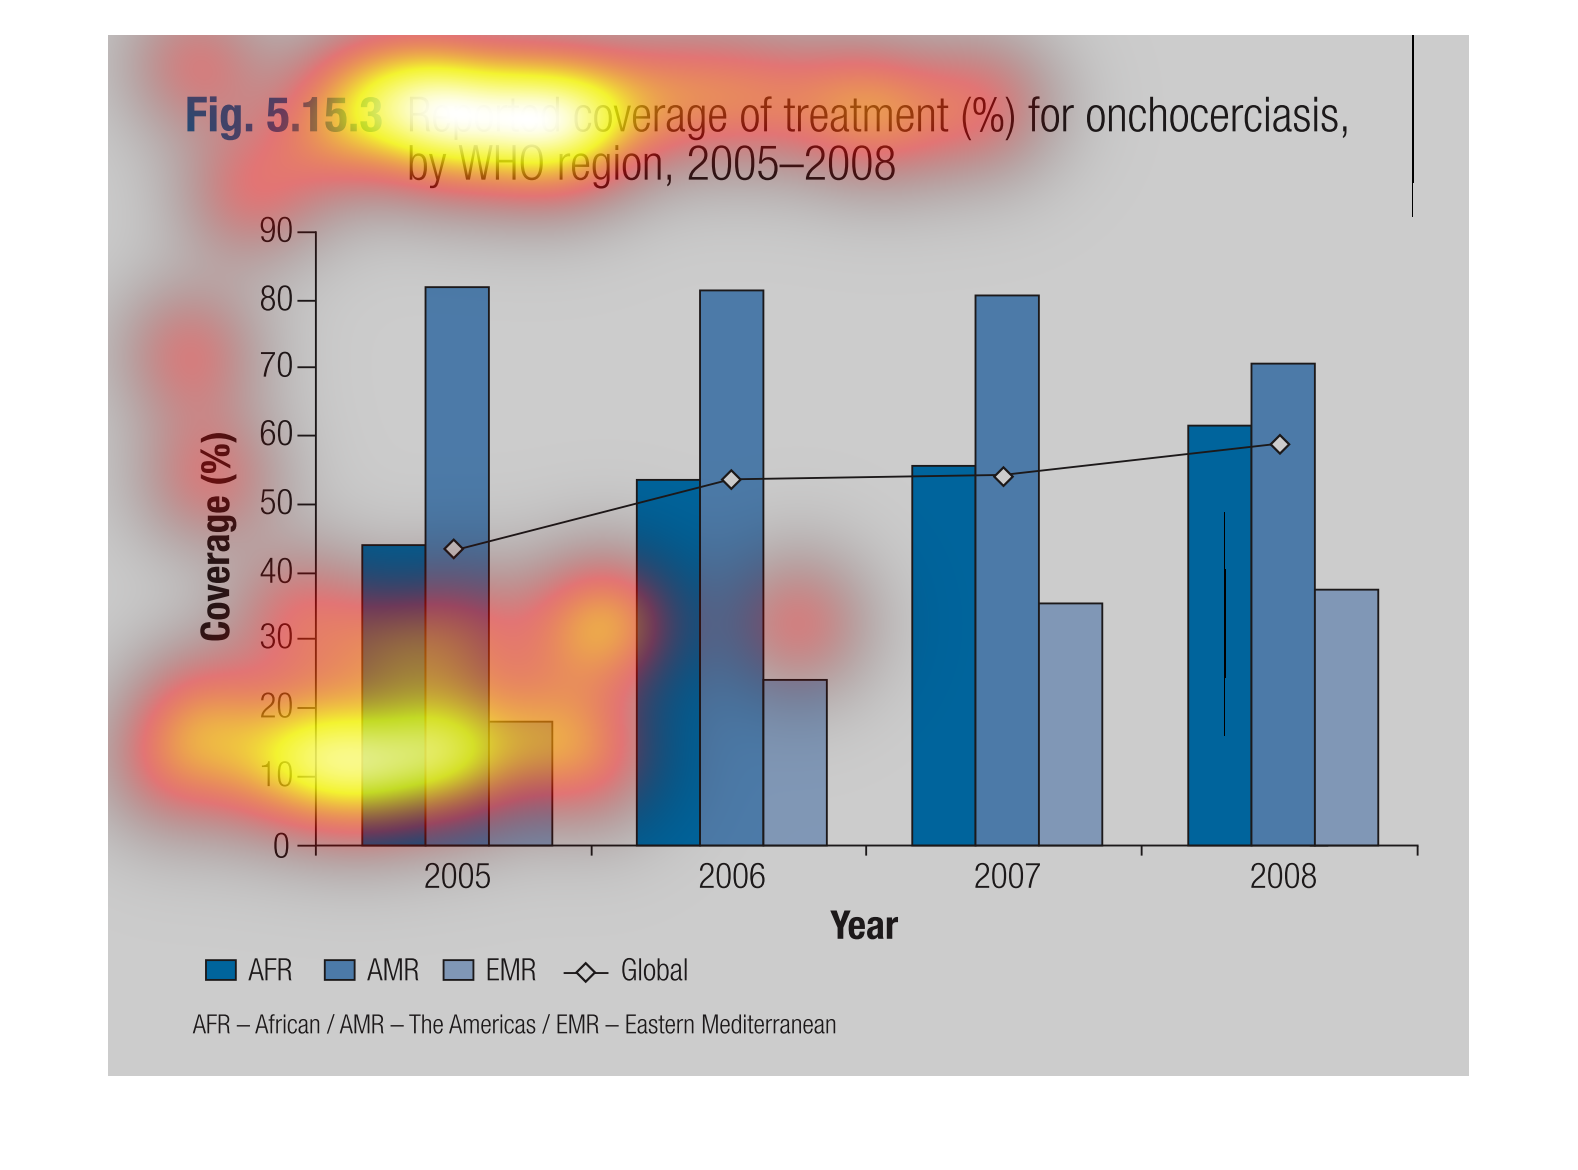
This chart describes reported coverage of treatment (%) for onchocerciasis, by WHO region,
for 2005 through to 2008. Categories on the list include AFR, and global.
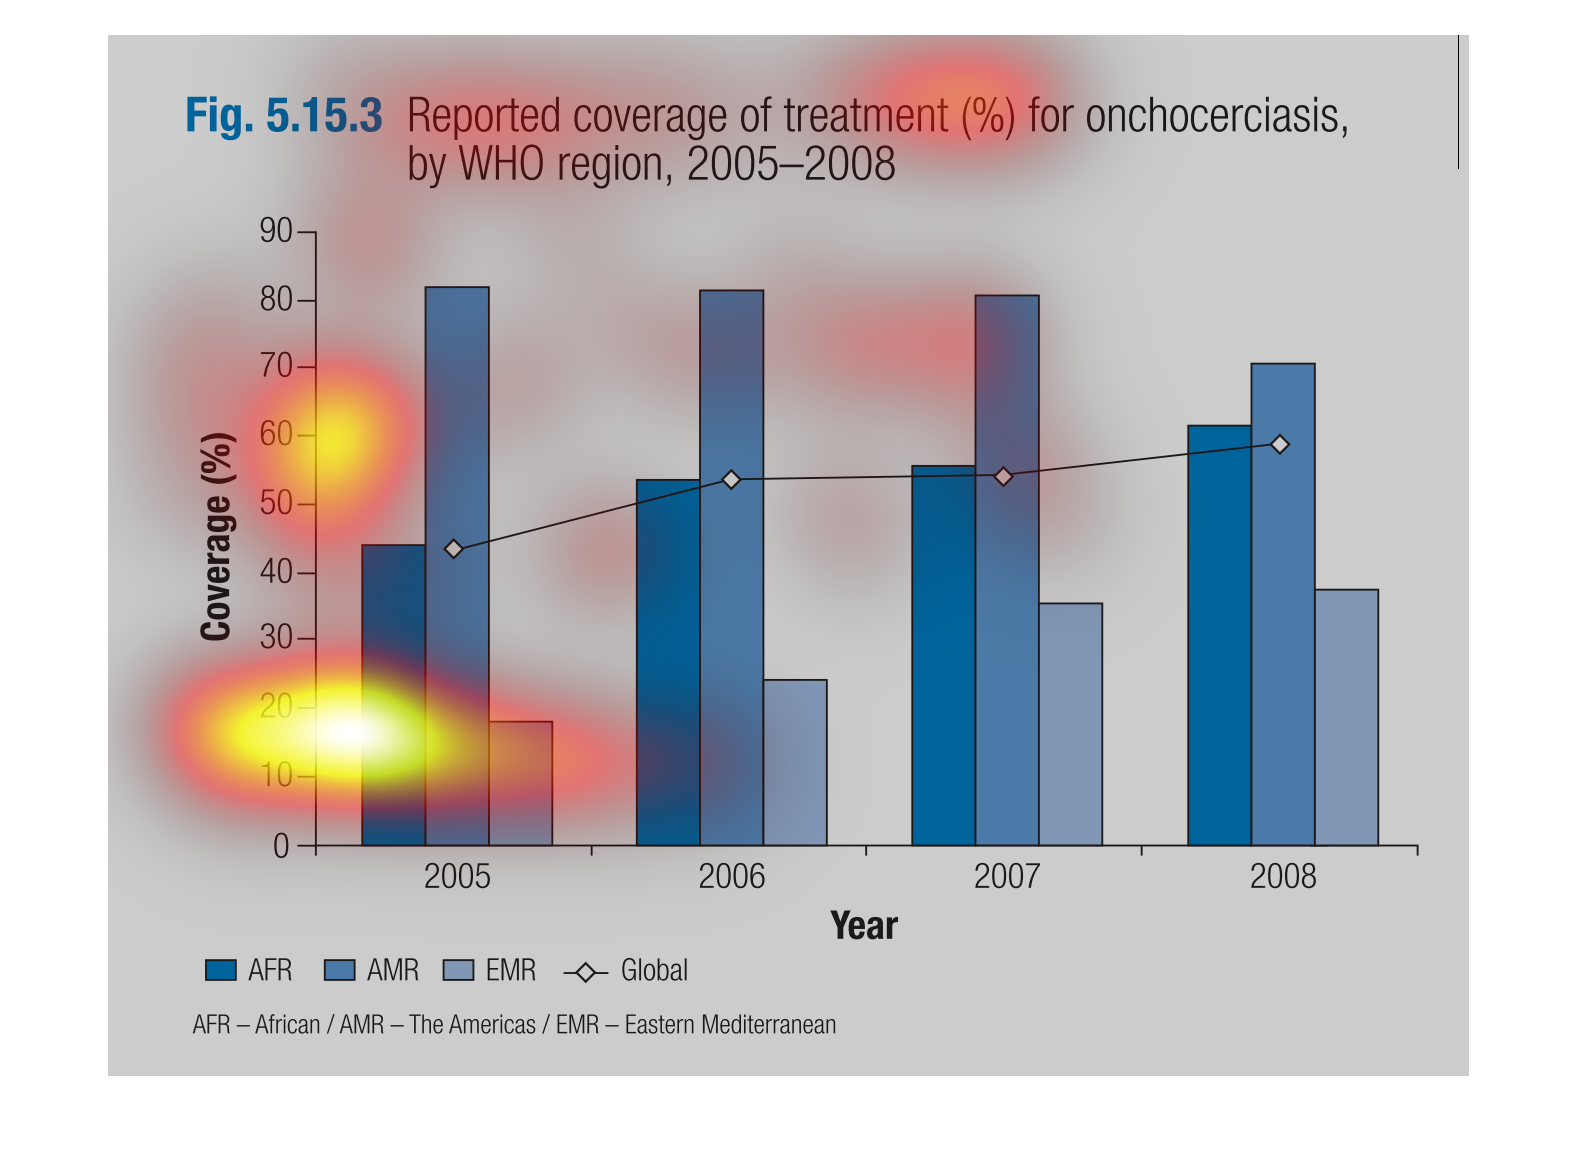
This bar graph show reported coverage of treatment % for onchocerciasis by WHO region in 2005-2008.
The regions include AFR or Africa, AMR the Americas, and EMR eastern Mediterranean. The Americas
consistently have a higher percentage.
This graph shows reported coverage of treatment for onchocerciasis from the years 2005 to
2008 in Africa, the Americas, and the Eastern Mediterranean regions. The data shows that year
on year, treatment has increased steadily across all regions.
This chart shows the reported coverage of treatment for onchocerciasis by WHO region between
2005 and 2008. The Americas had the highest percentage of coverage each year.
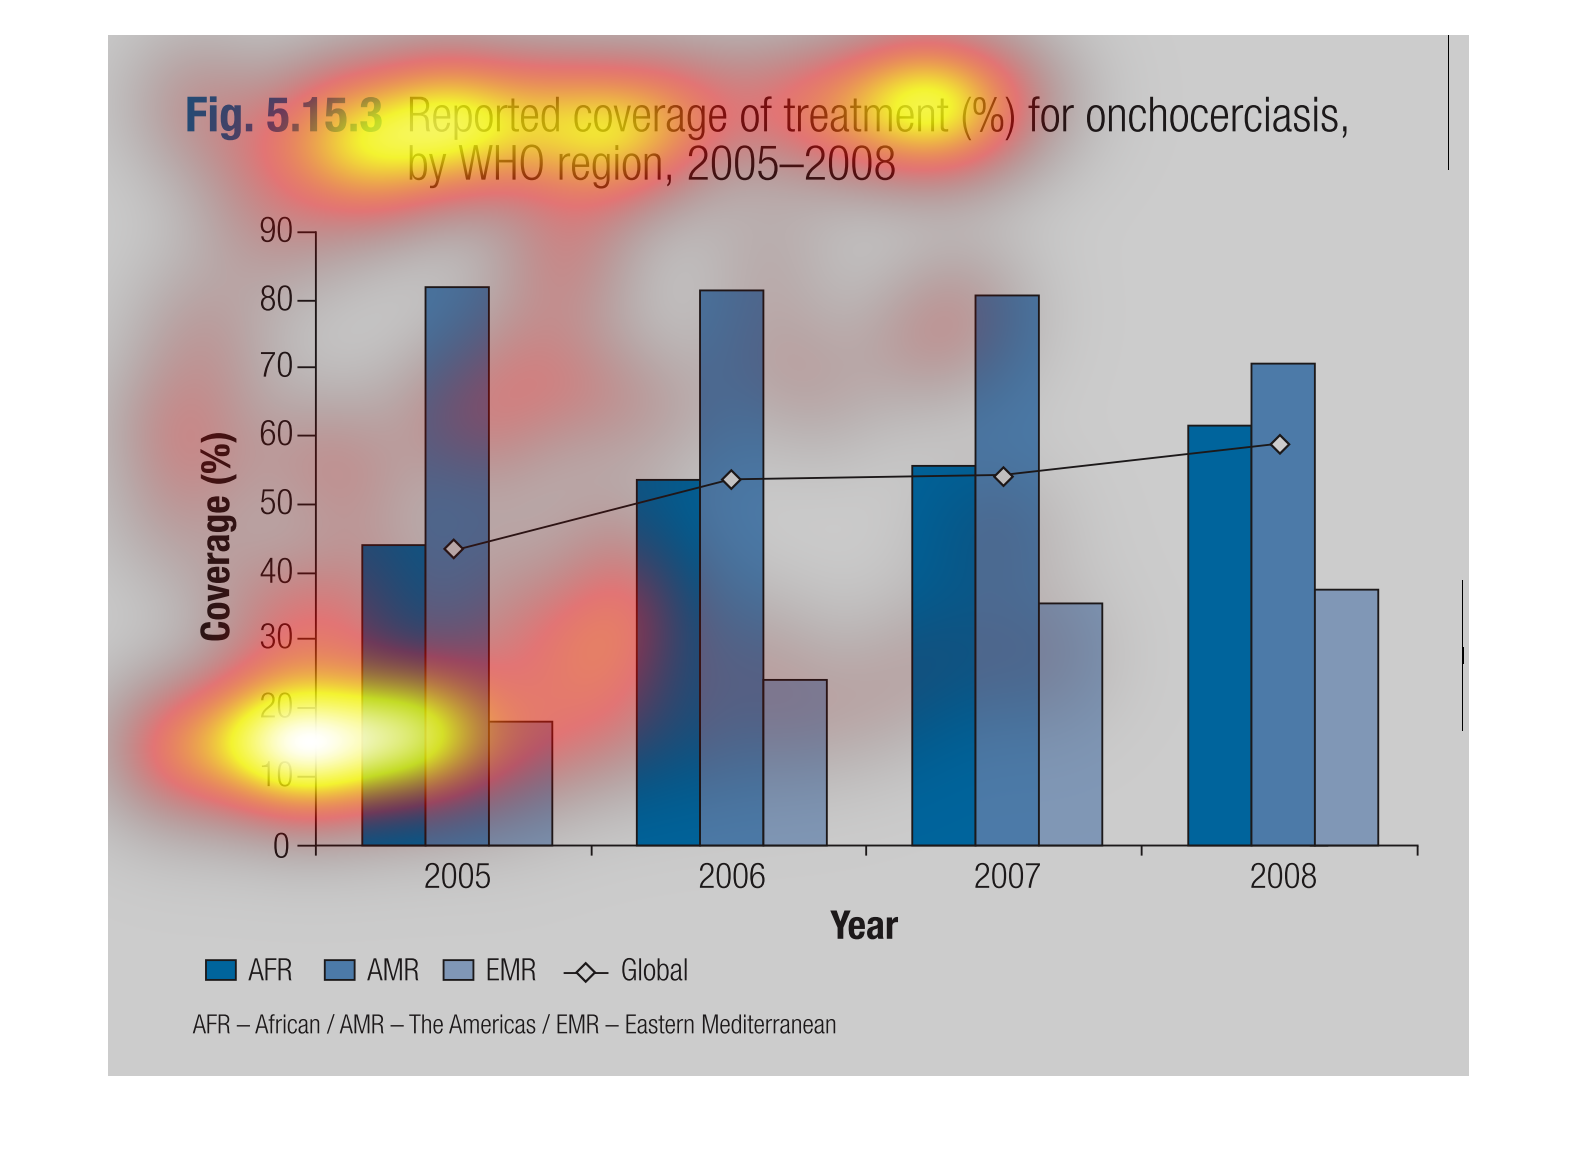
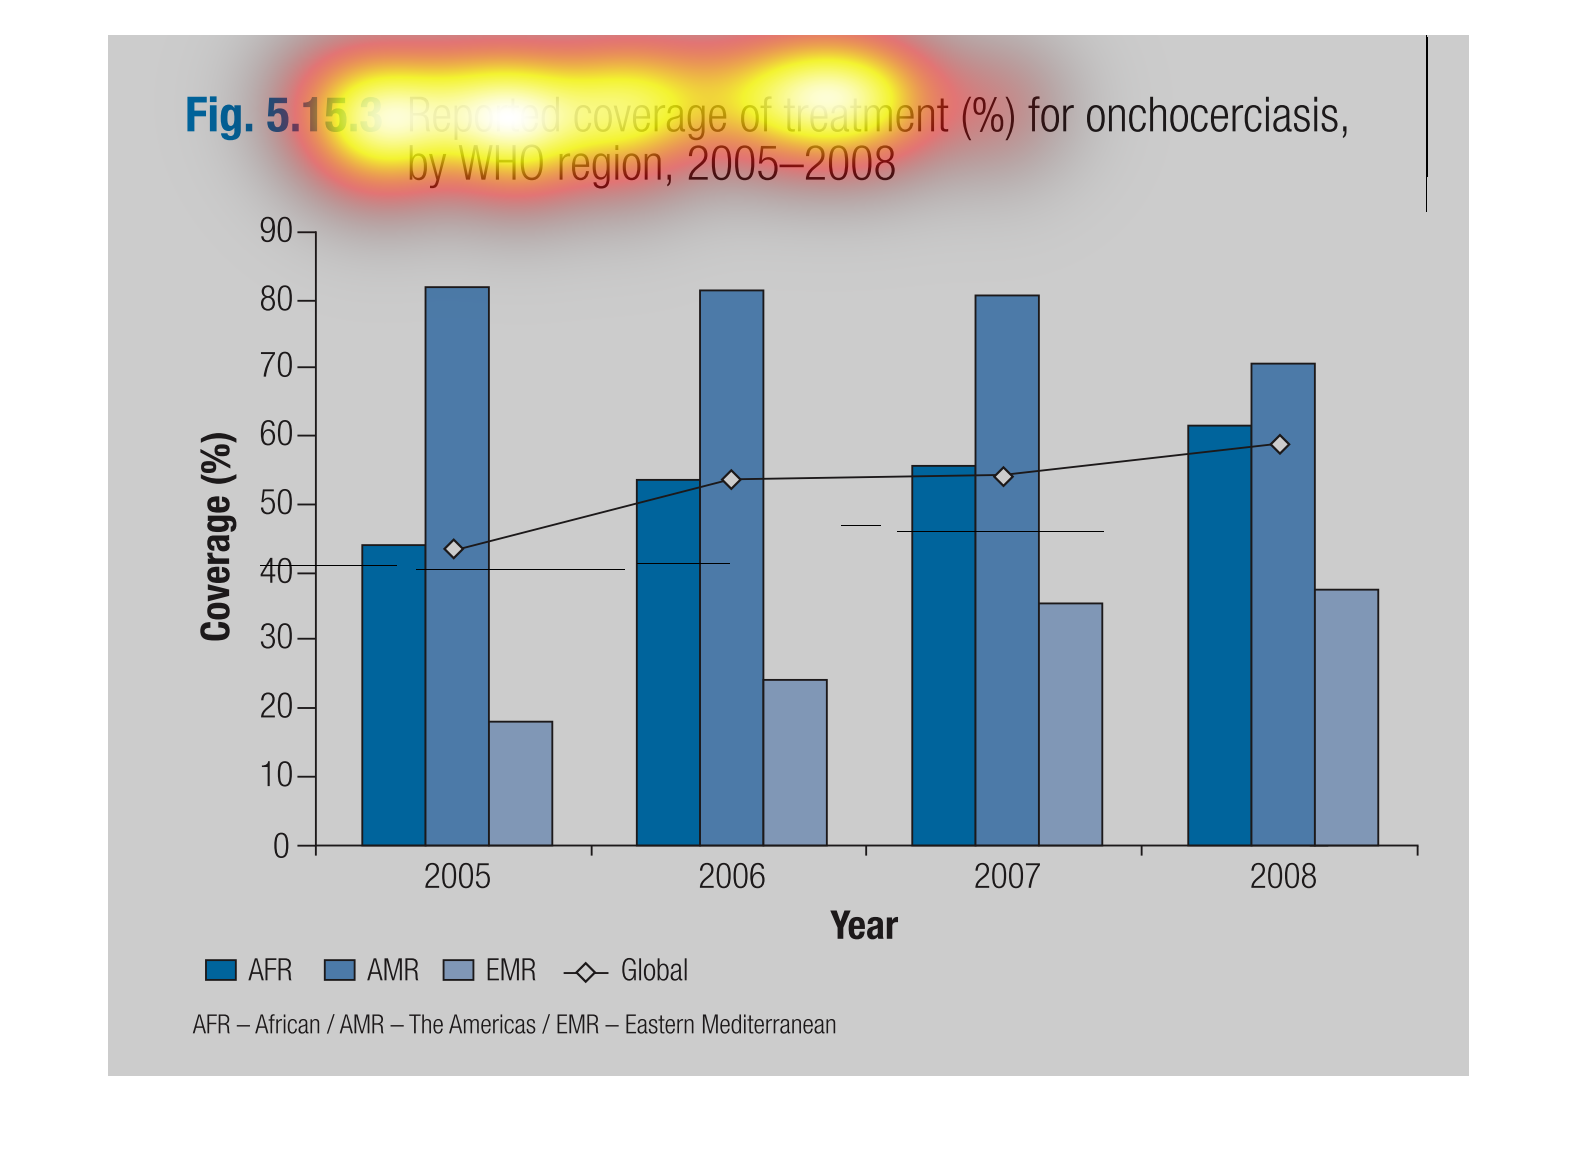
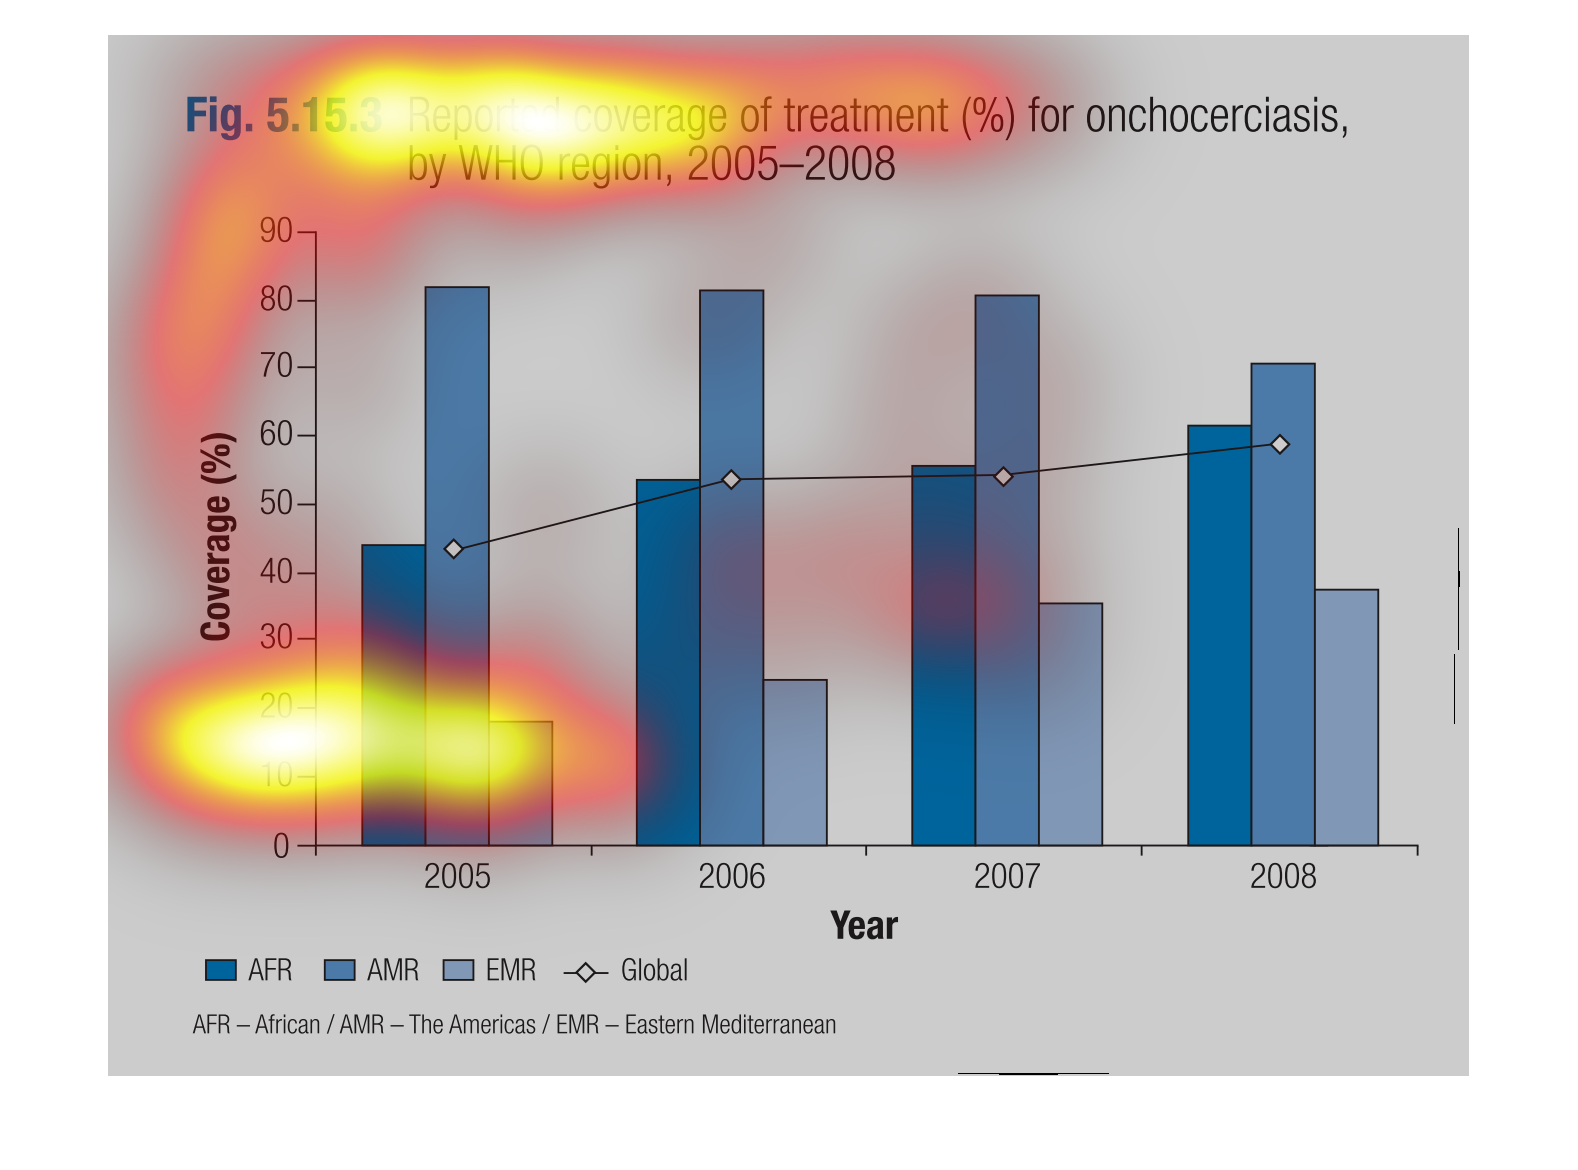
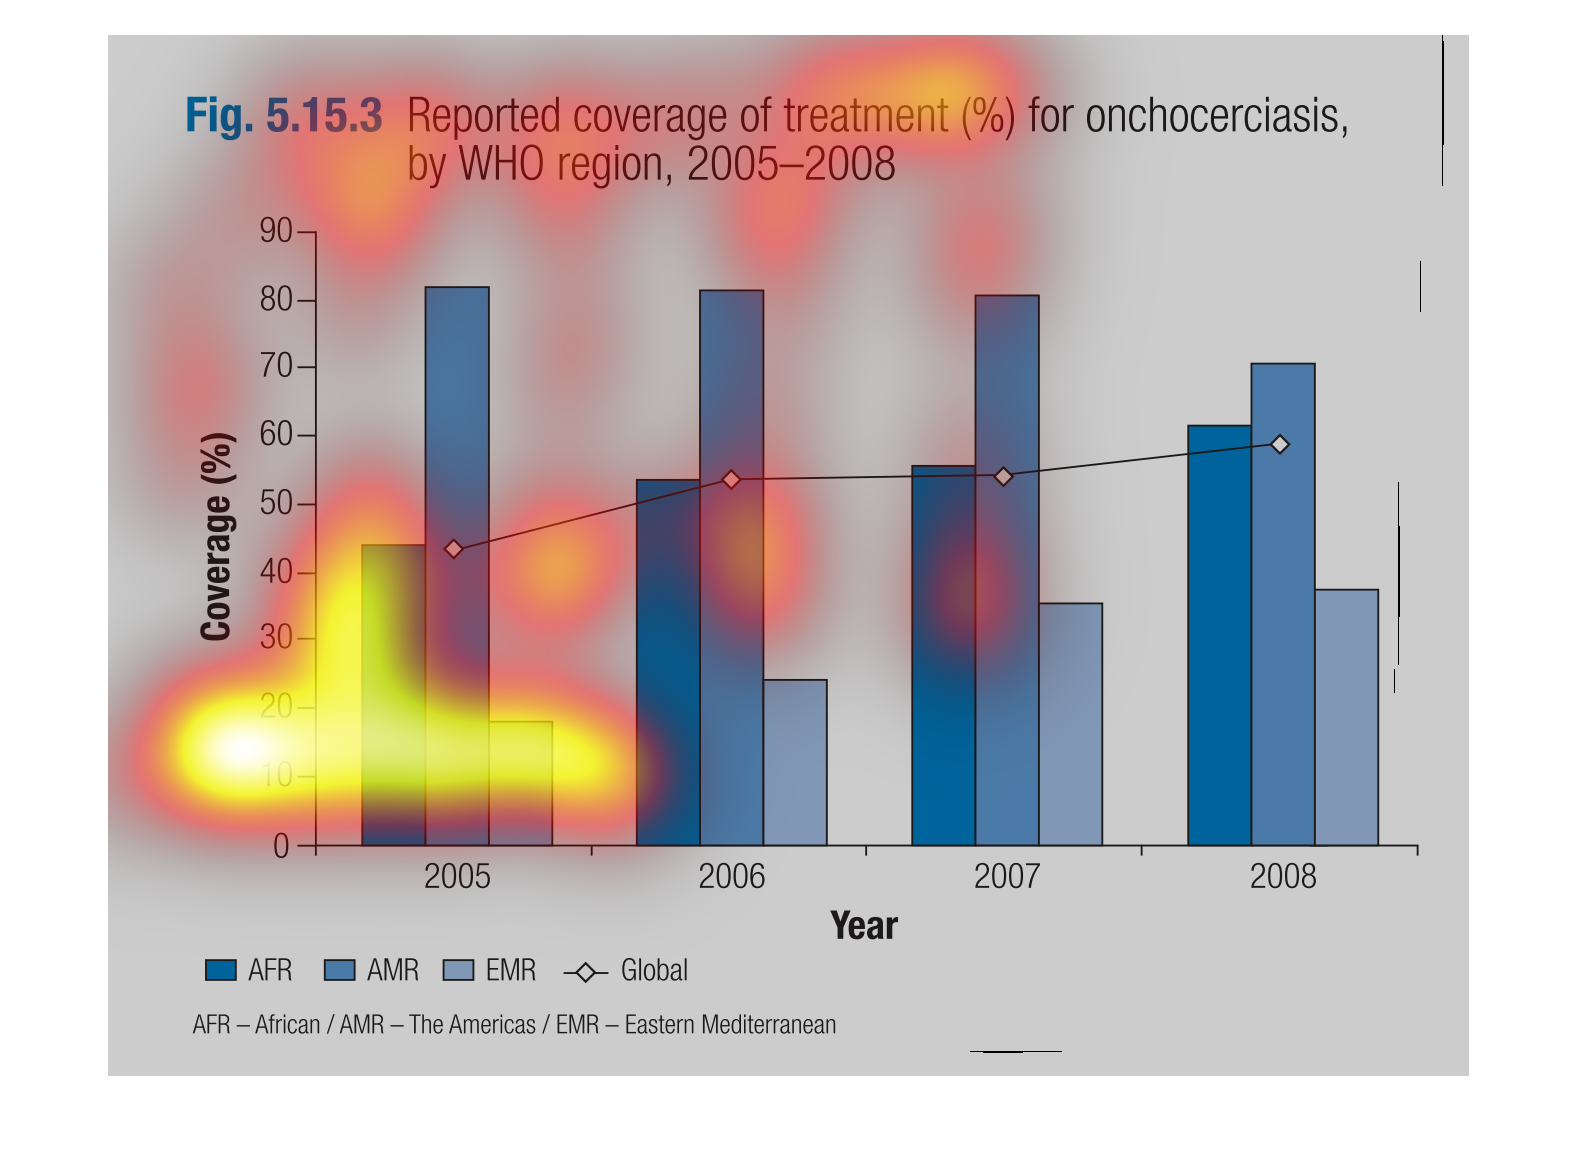
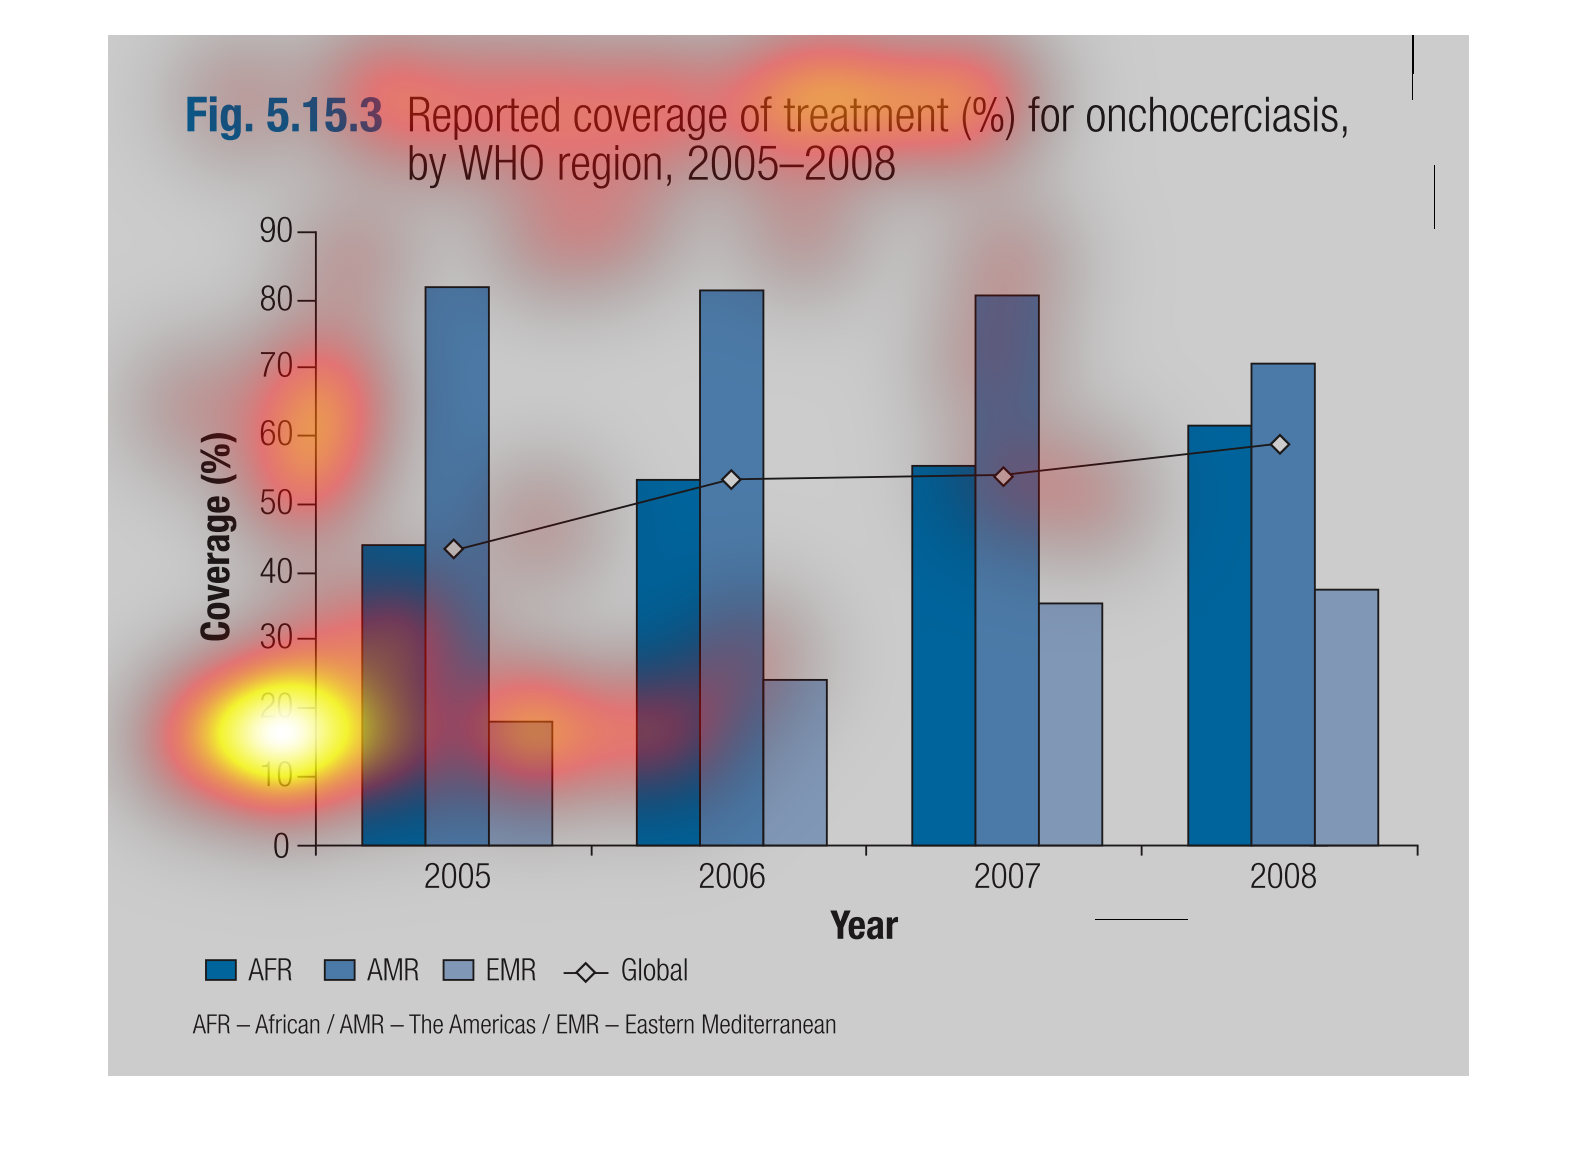
This image shows a bar graph depicting the percentages of reported coverage for treatment
of onchocerclasis by WHO region from 2005-2008.  Each region is given a color.  Along the
left side of the graph, the percentages are listed while on the bottom of the graph the years
are listed.  Three bars are drawn for each year showing the percentage that applies to each
WHO region.