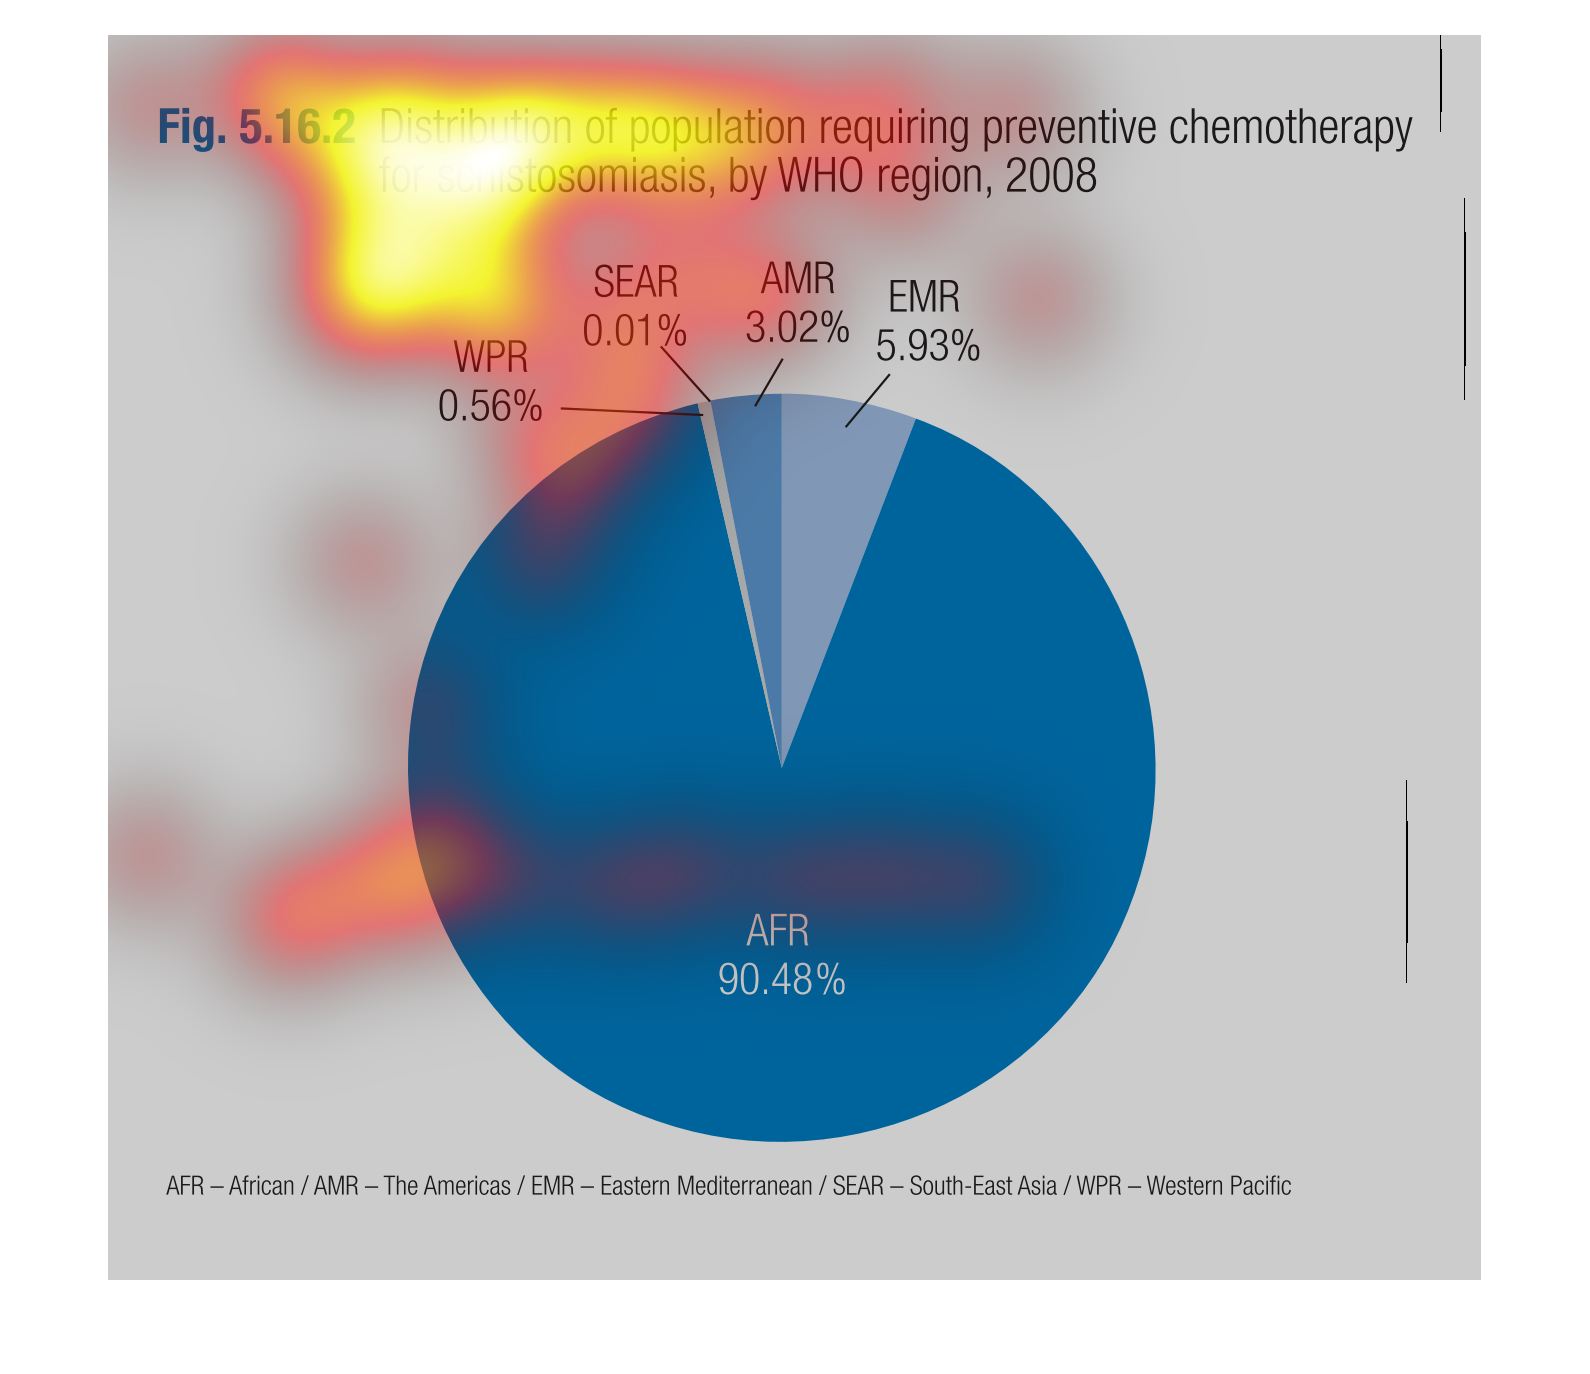
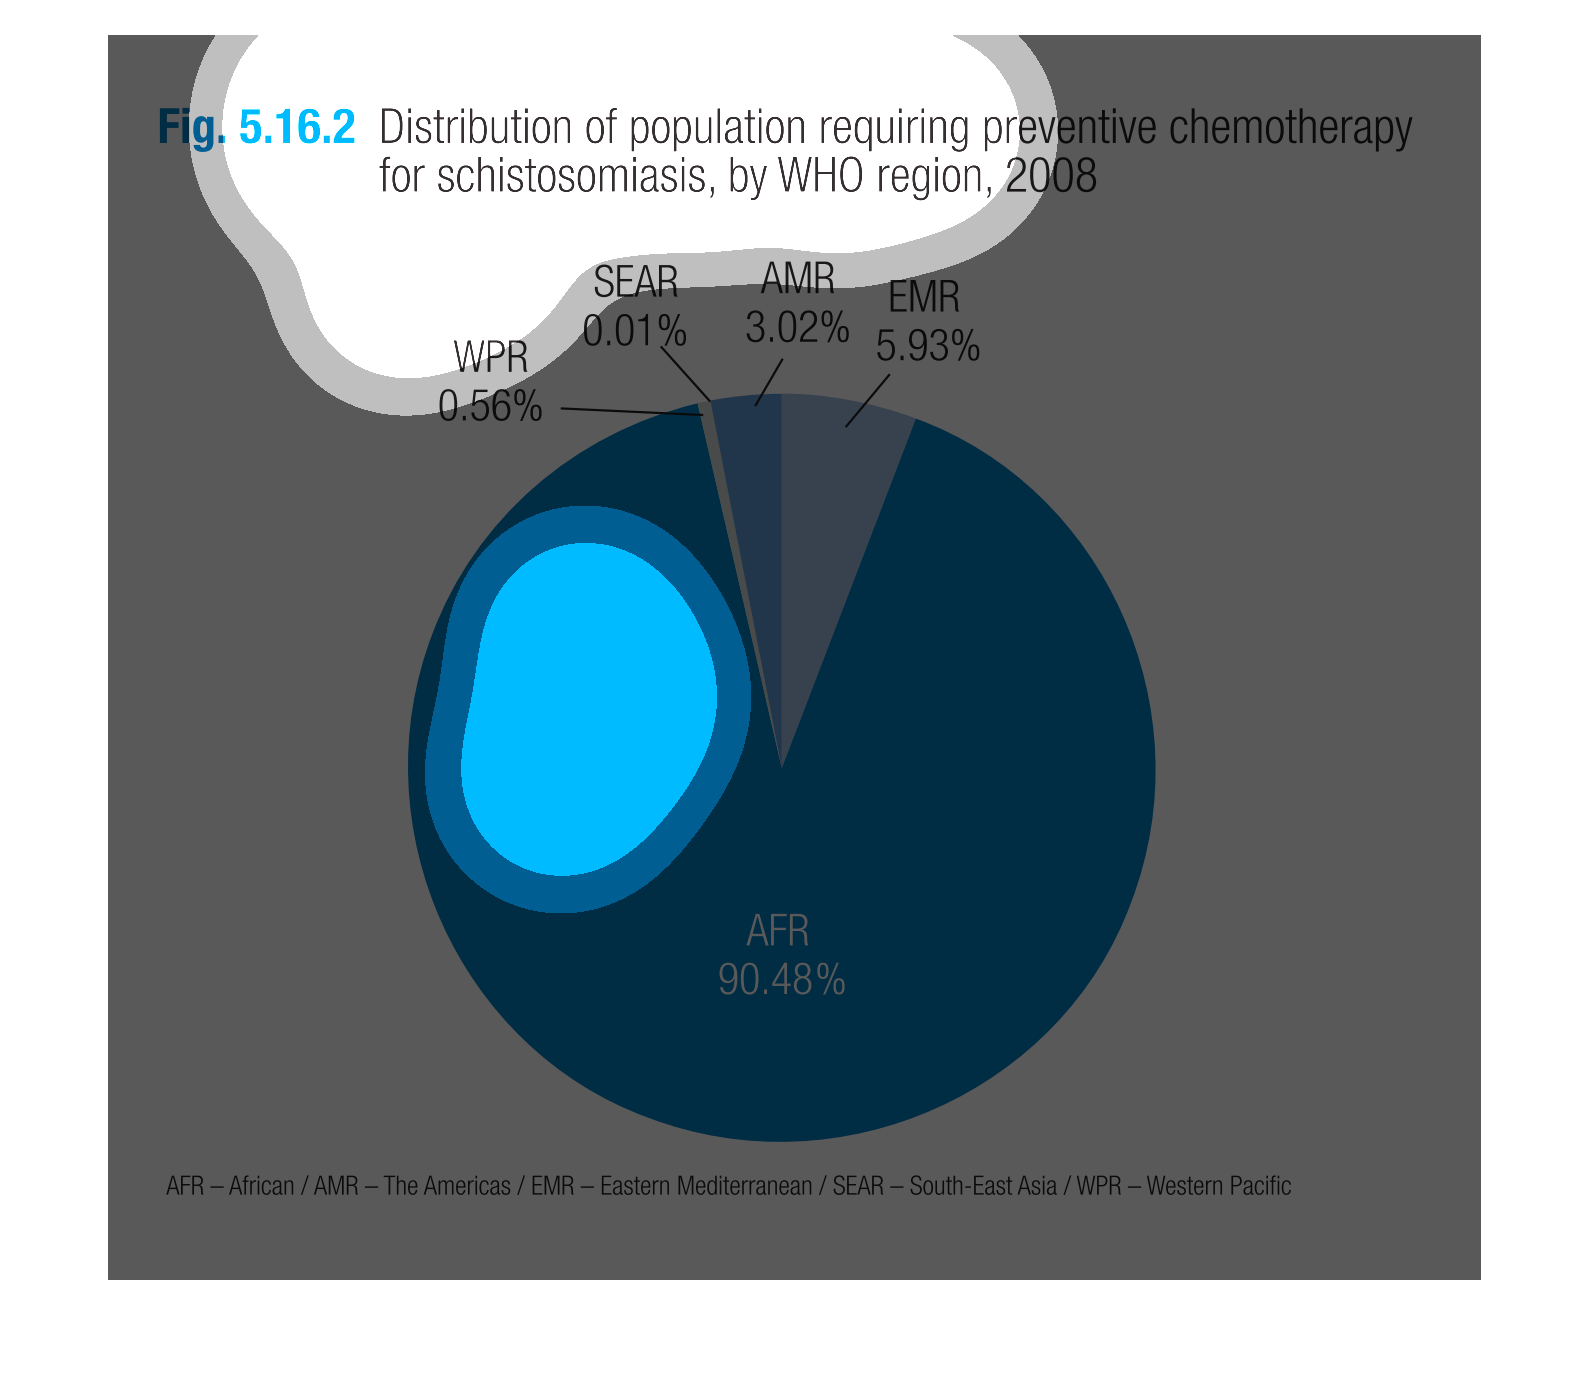
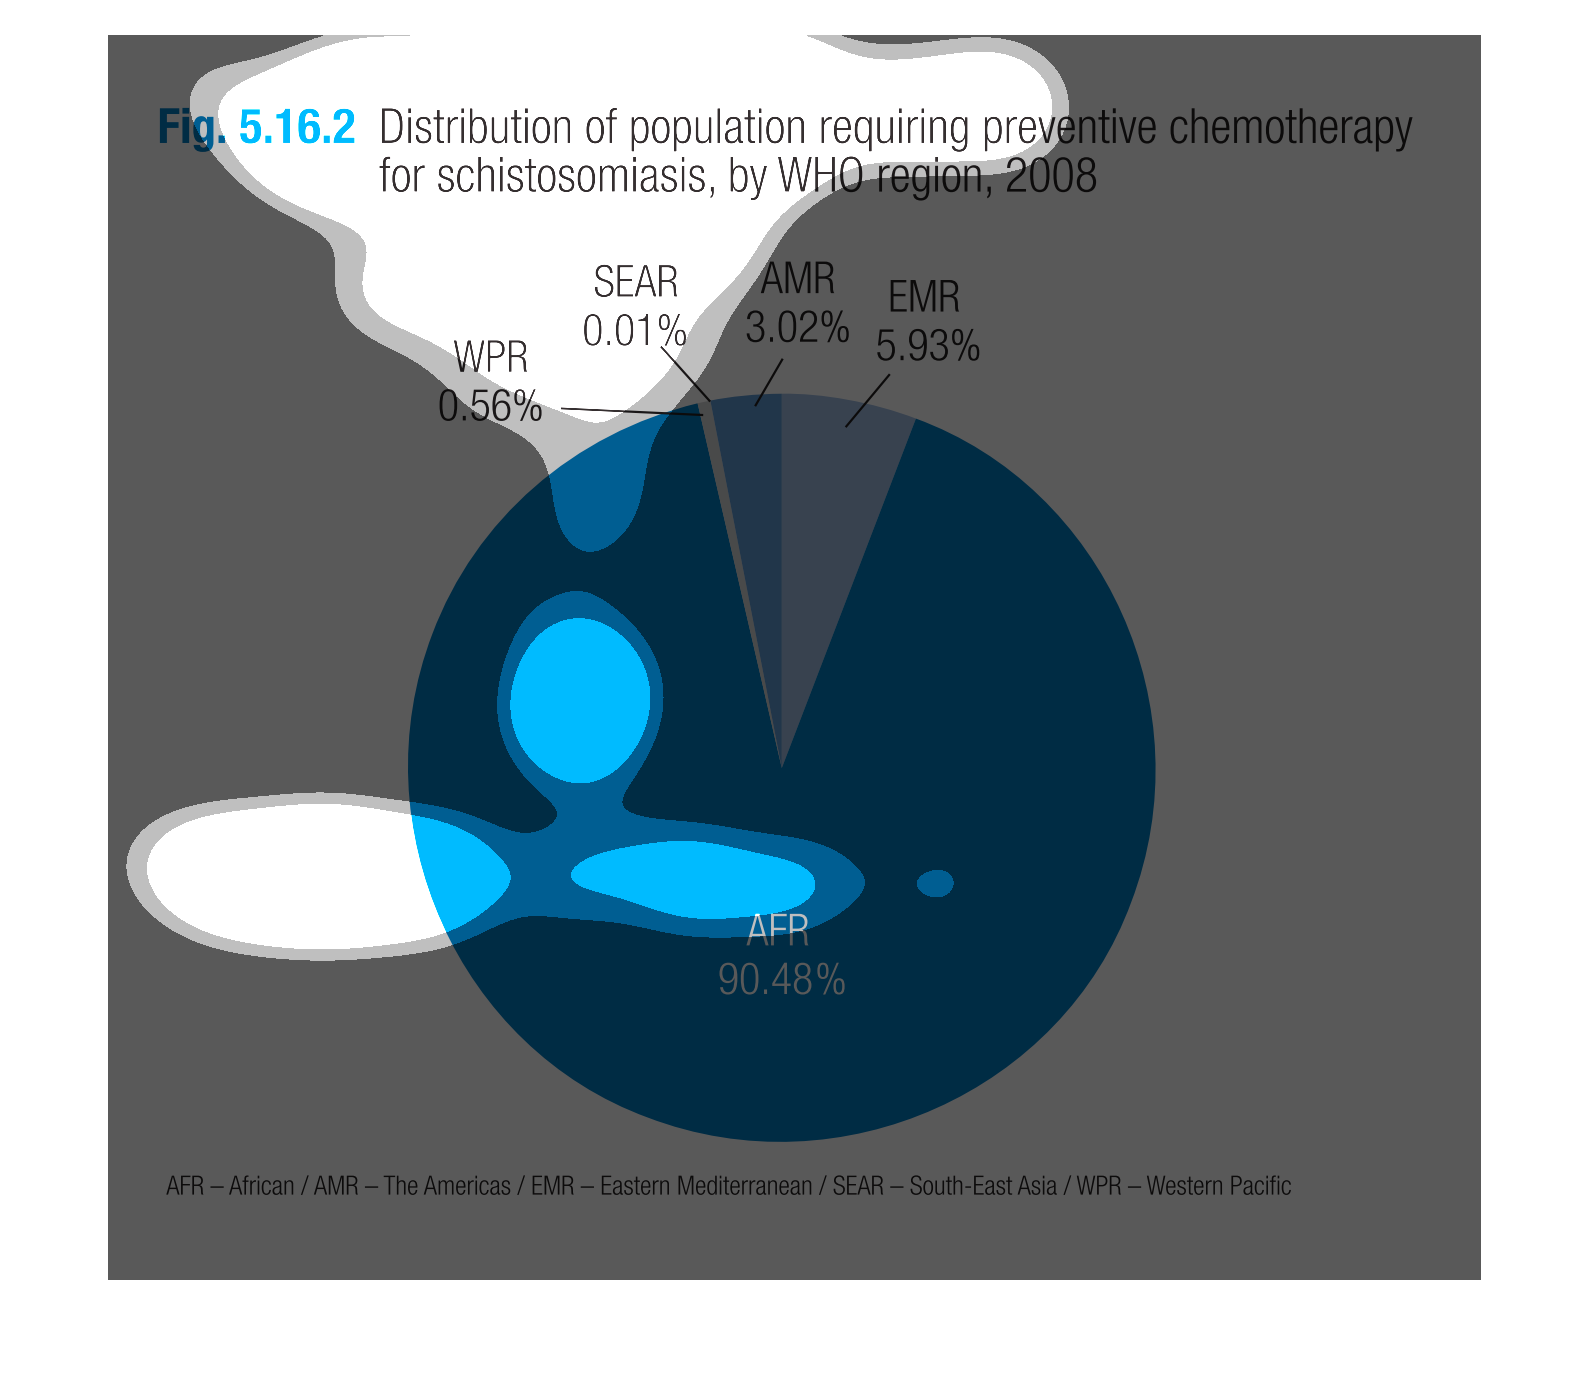
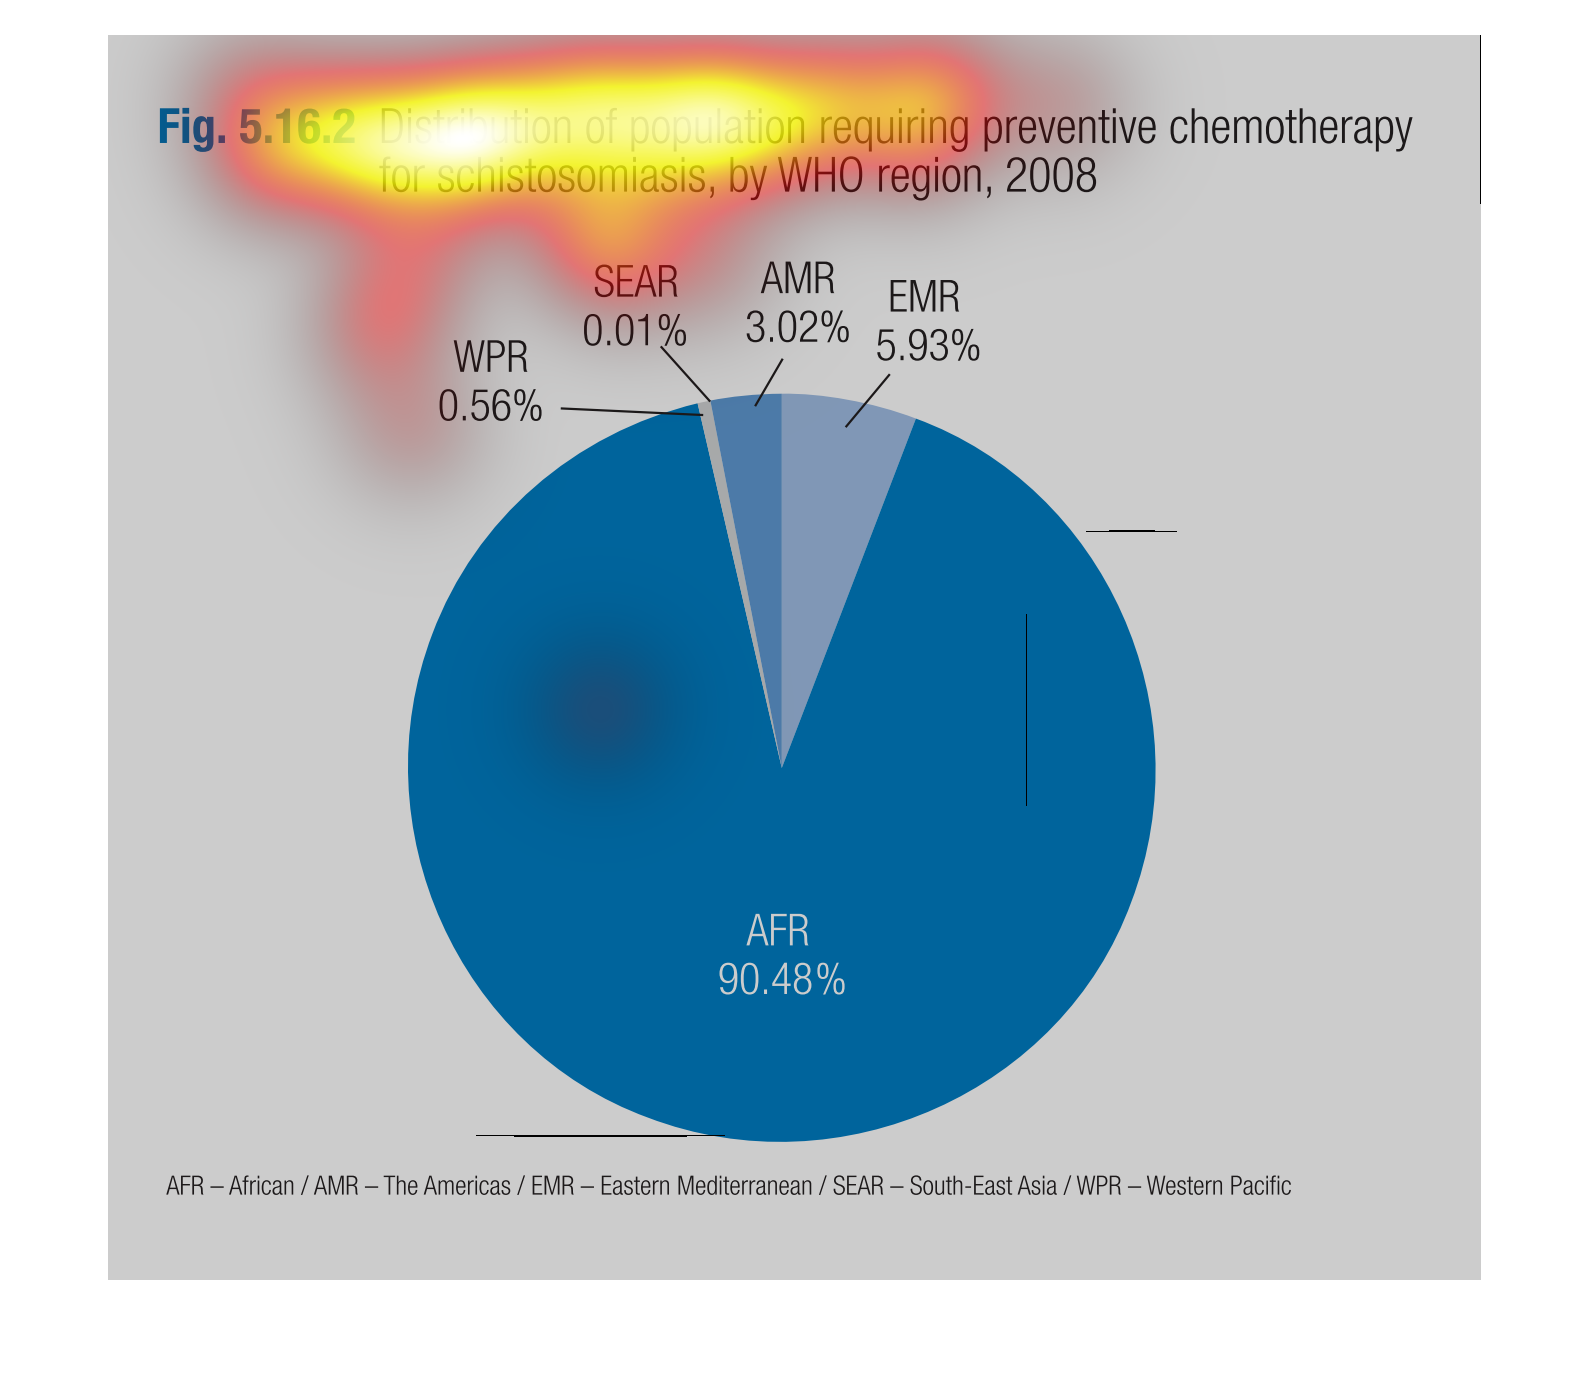
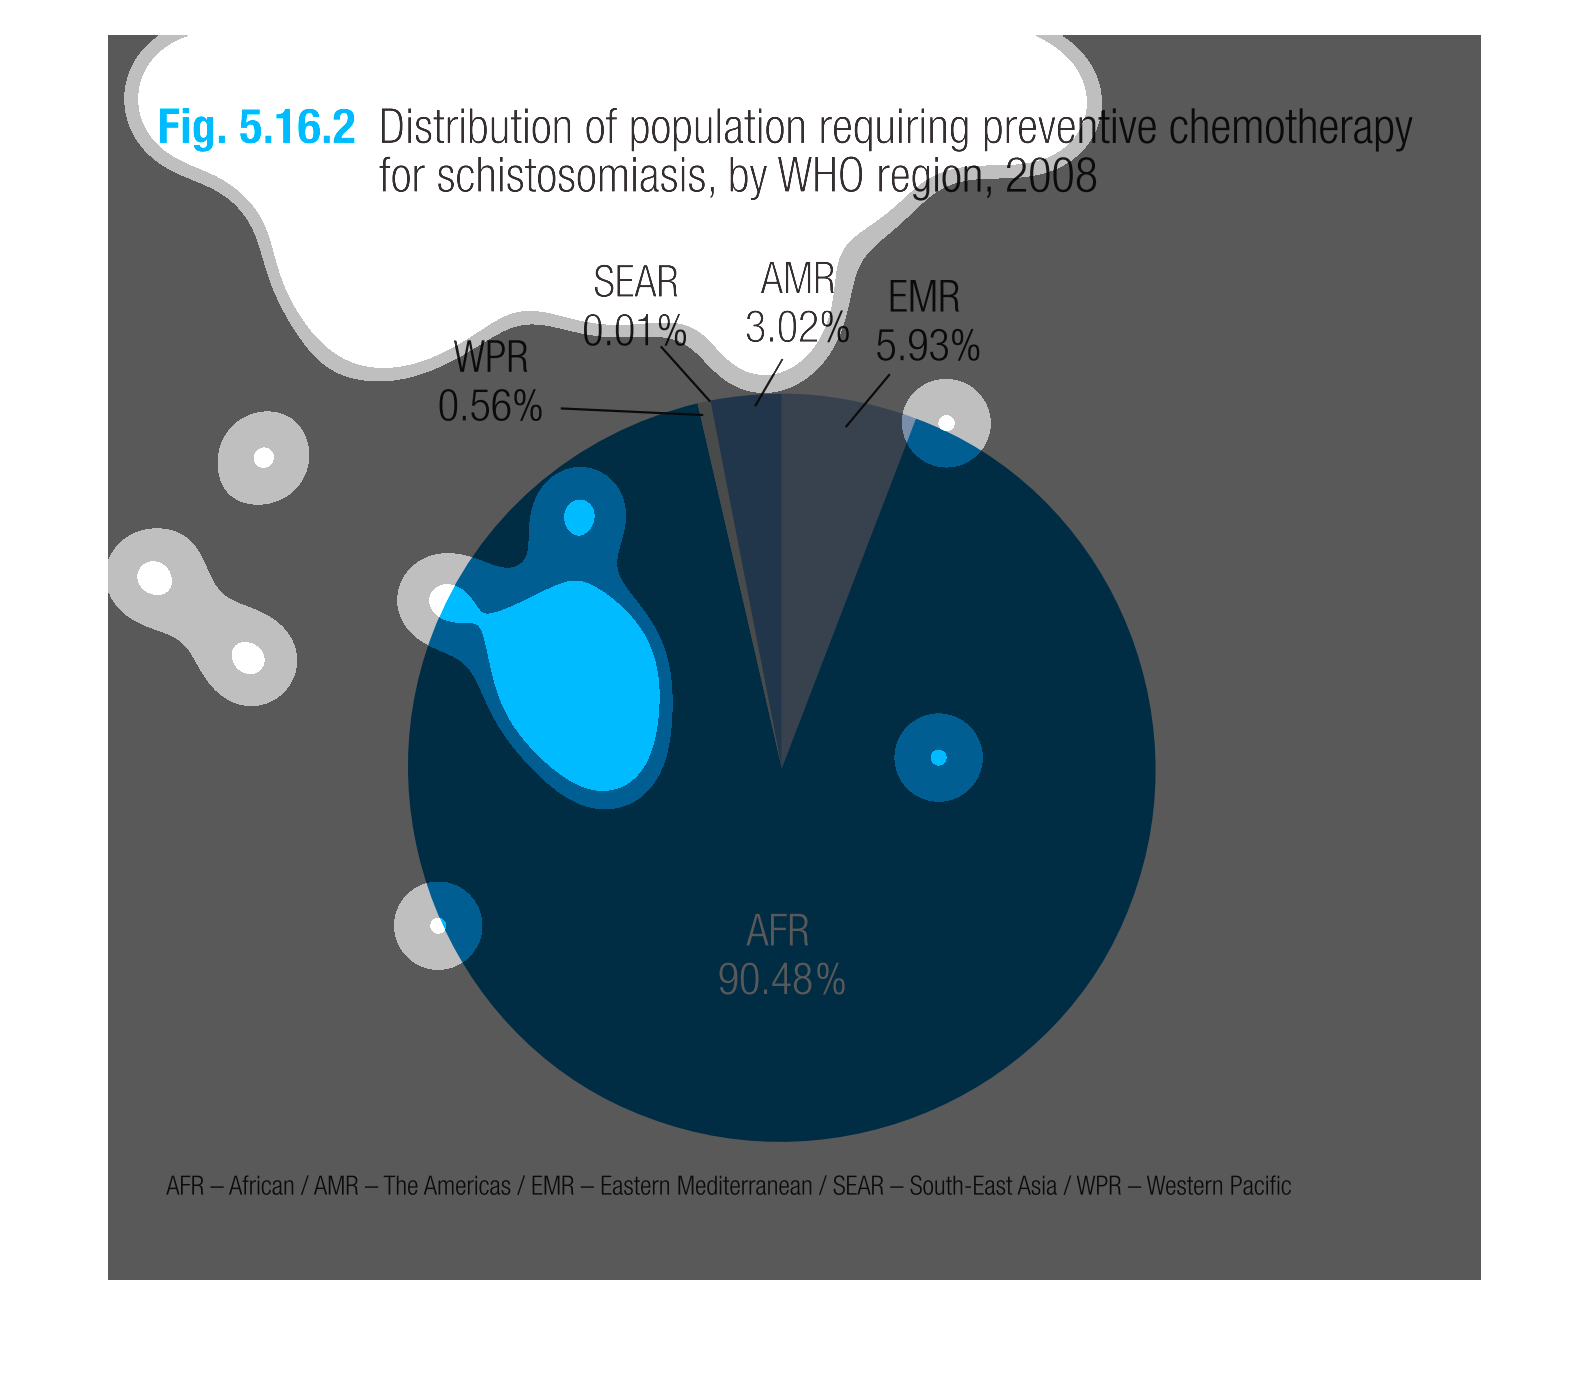
The pie chart shows the distribution of the population requiring preventative chemotherapy
in 2008 for schistosomiasis by WHO region.  AFR experienced the vast majority with 90.8%.
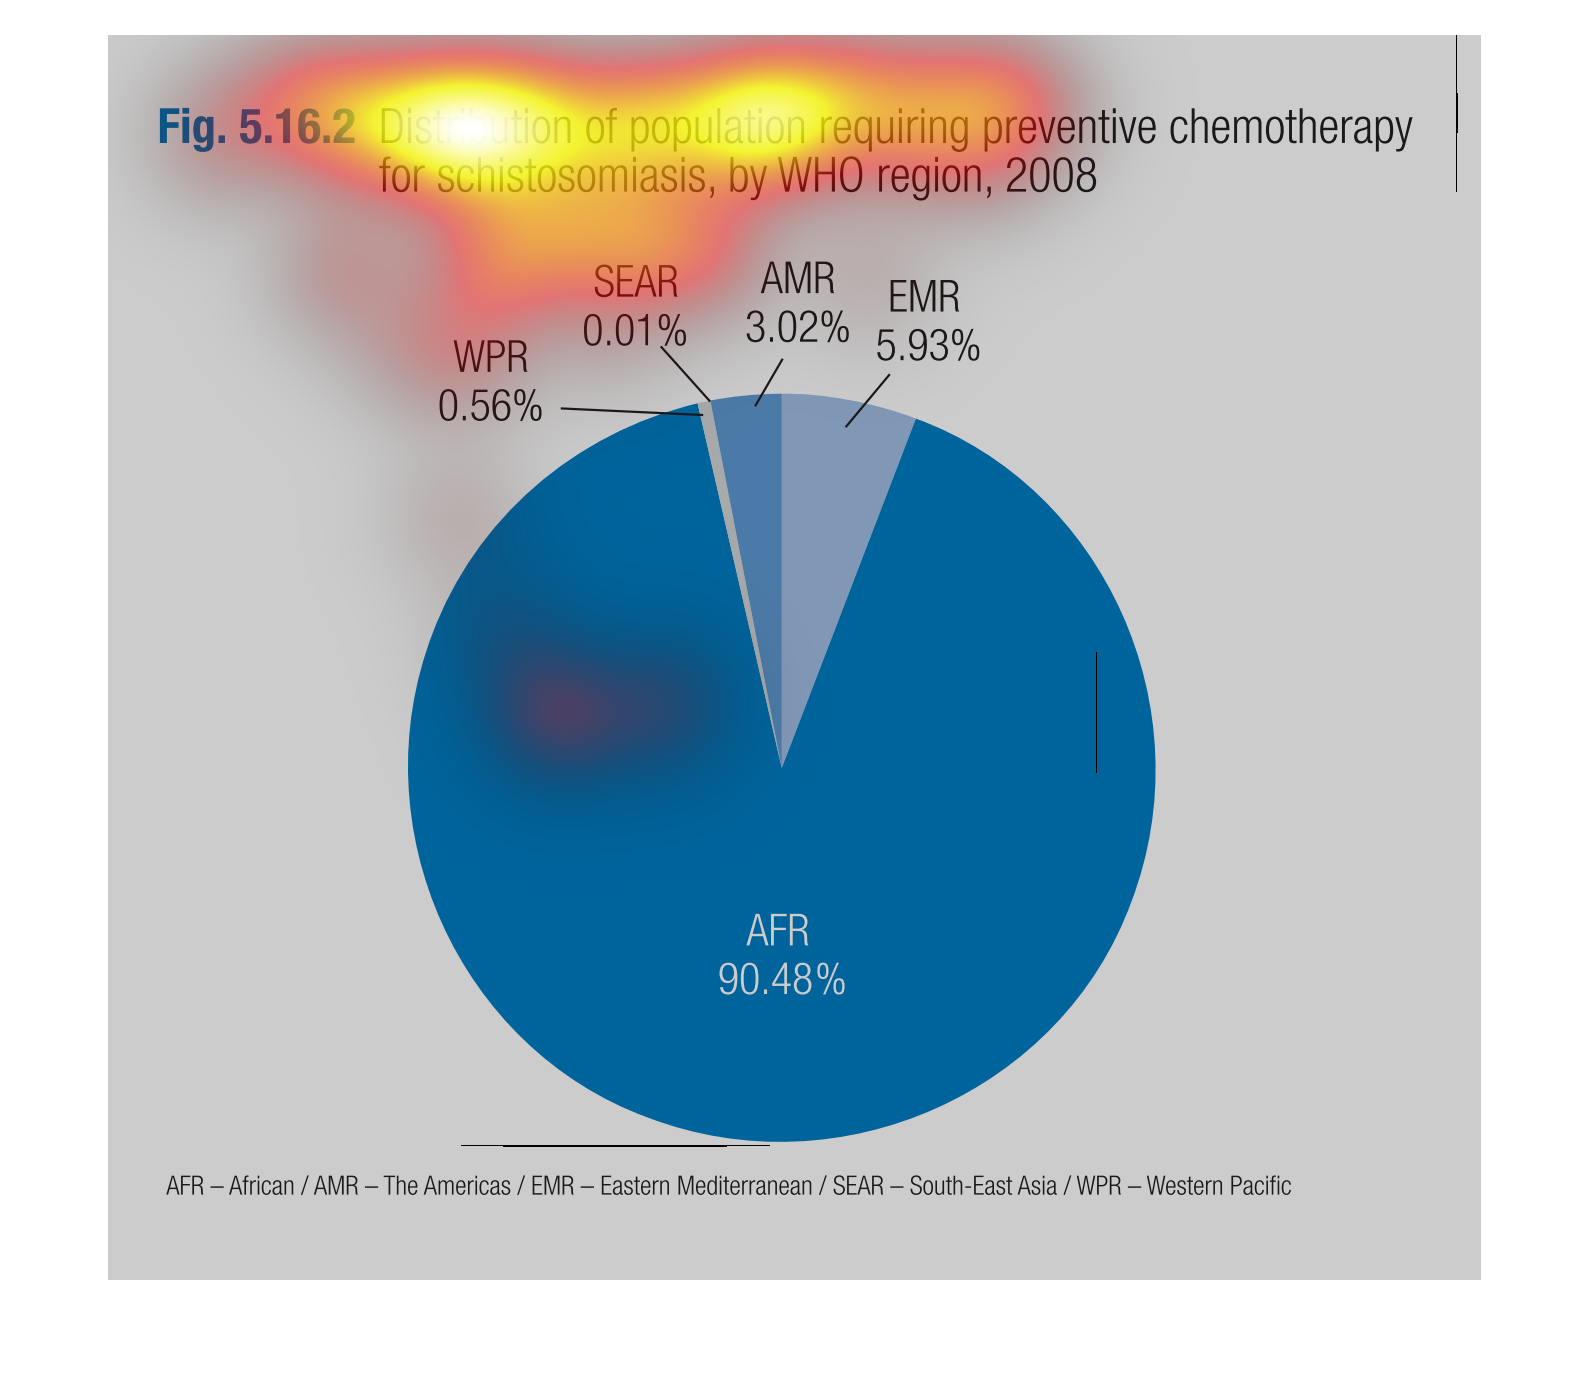
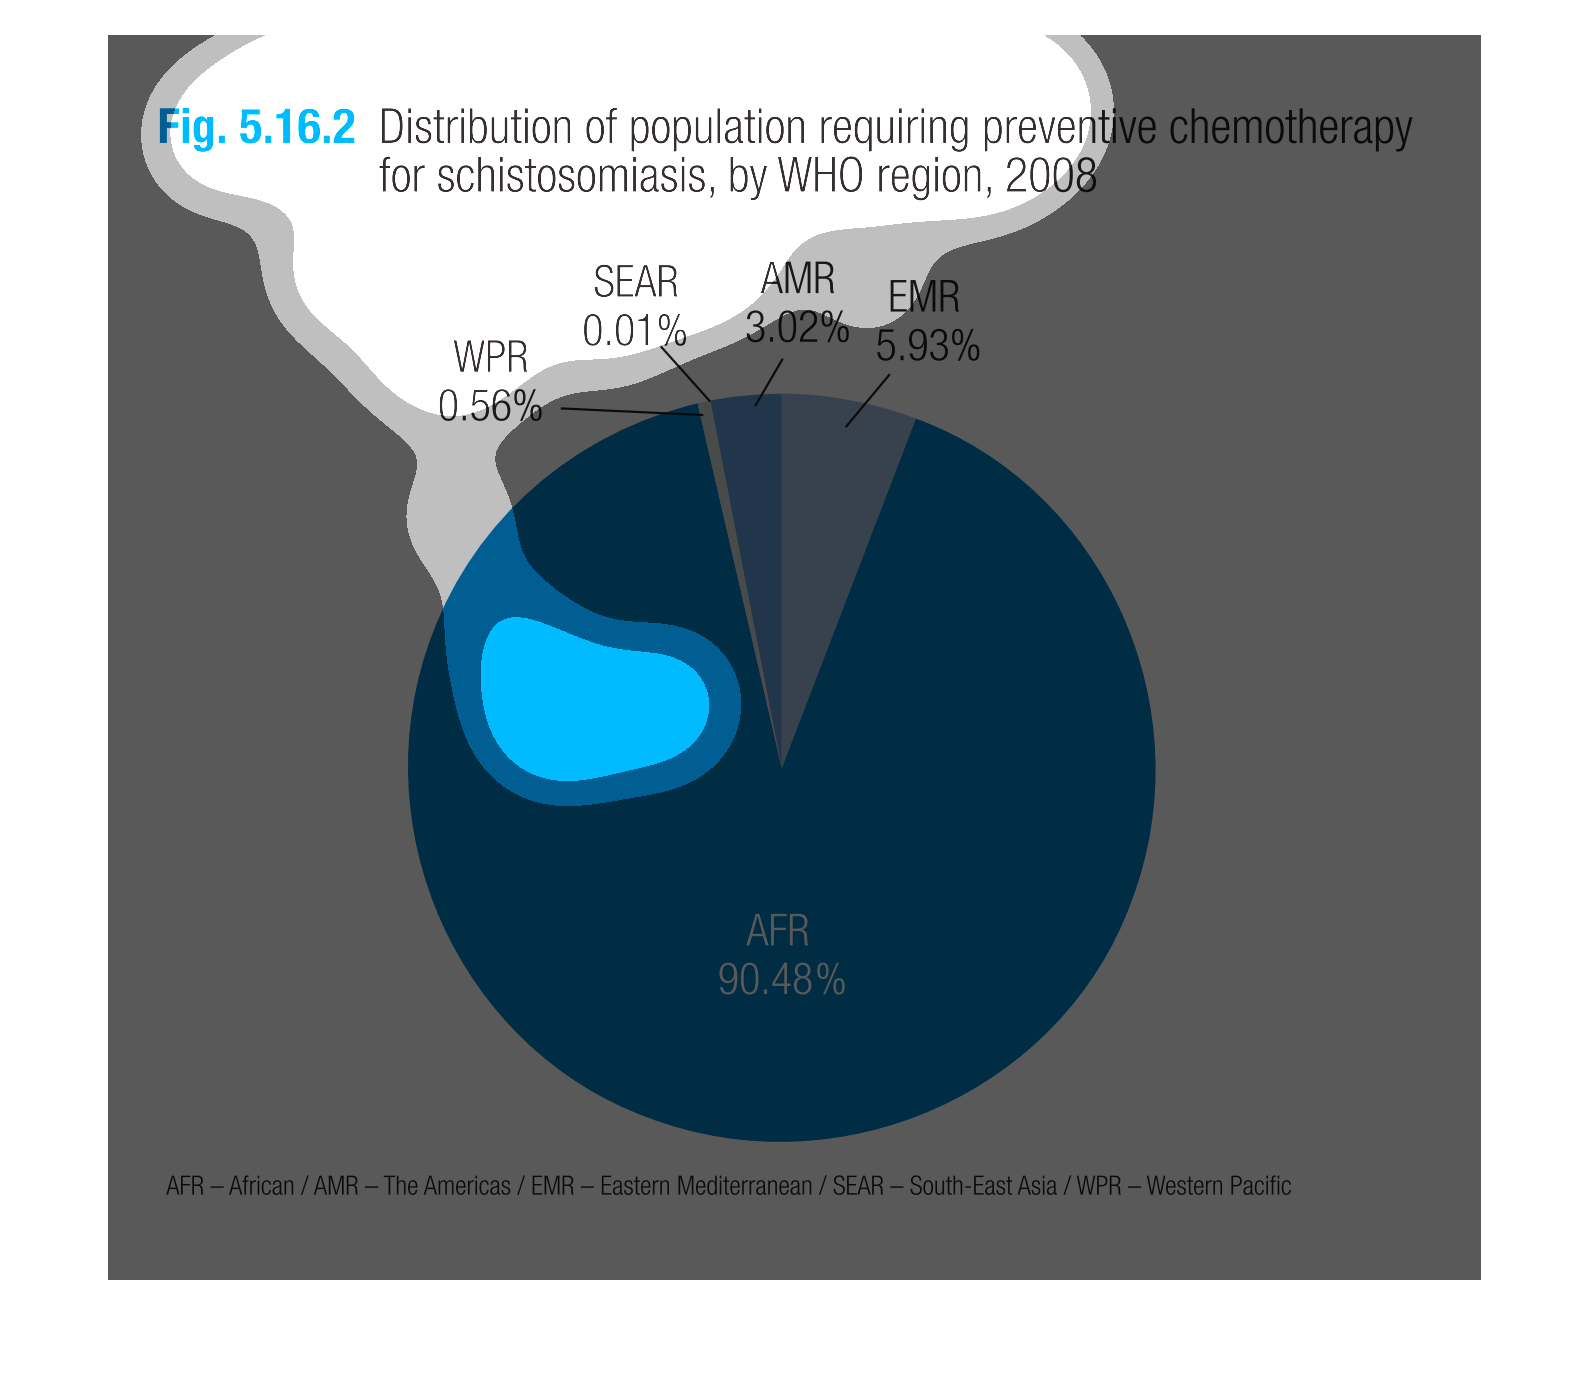
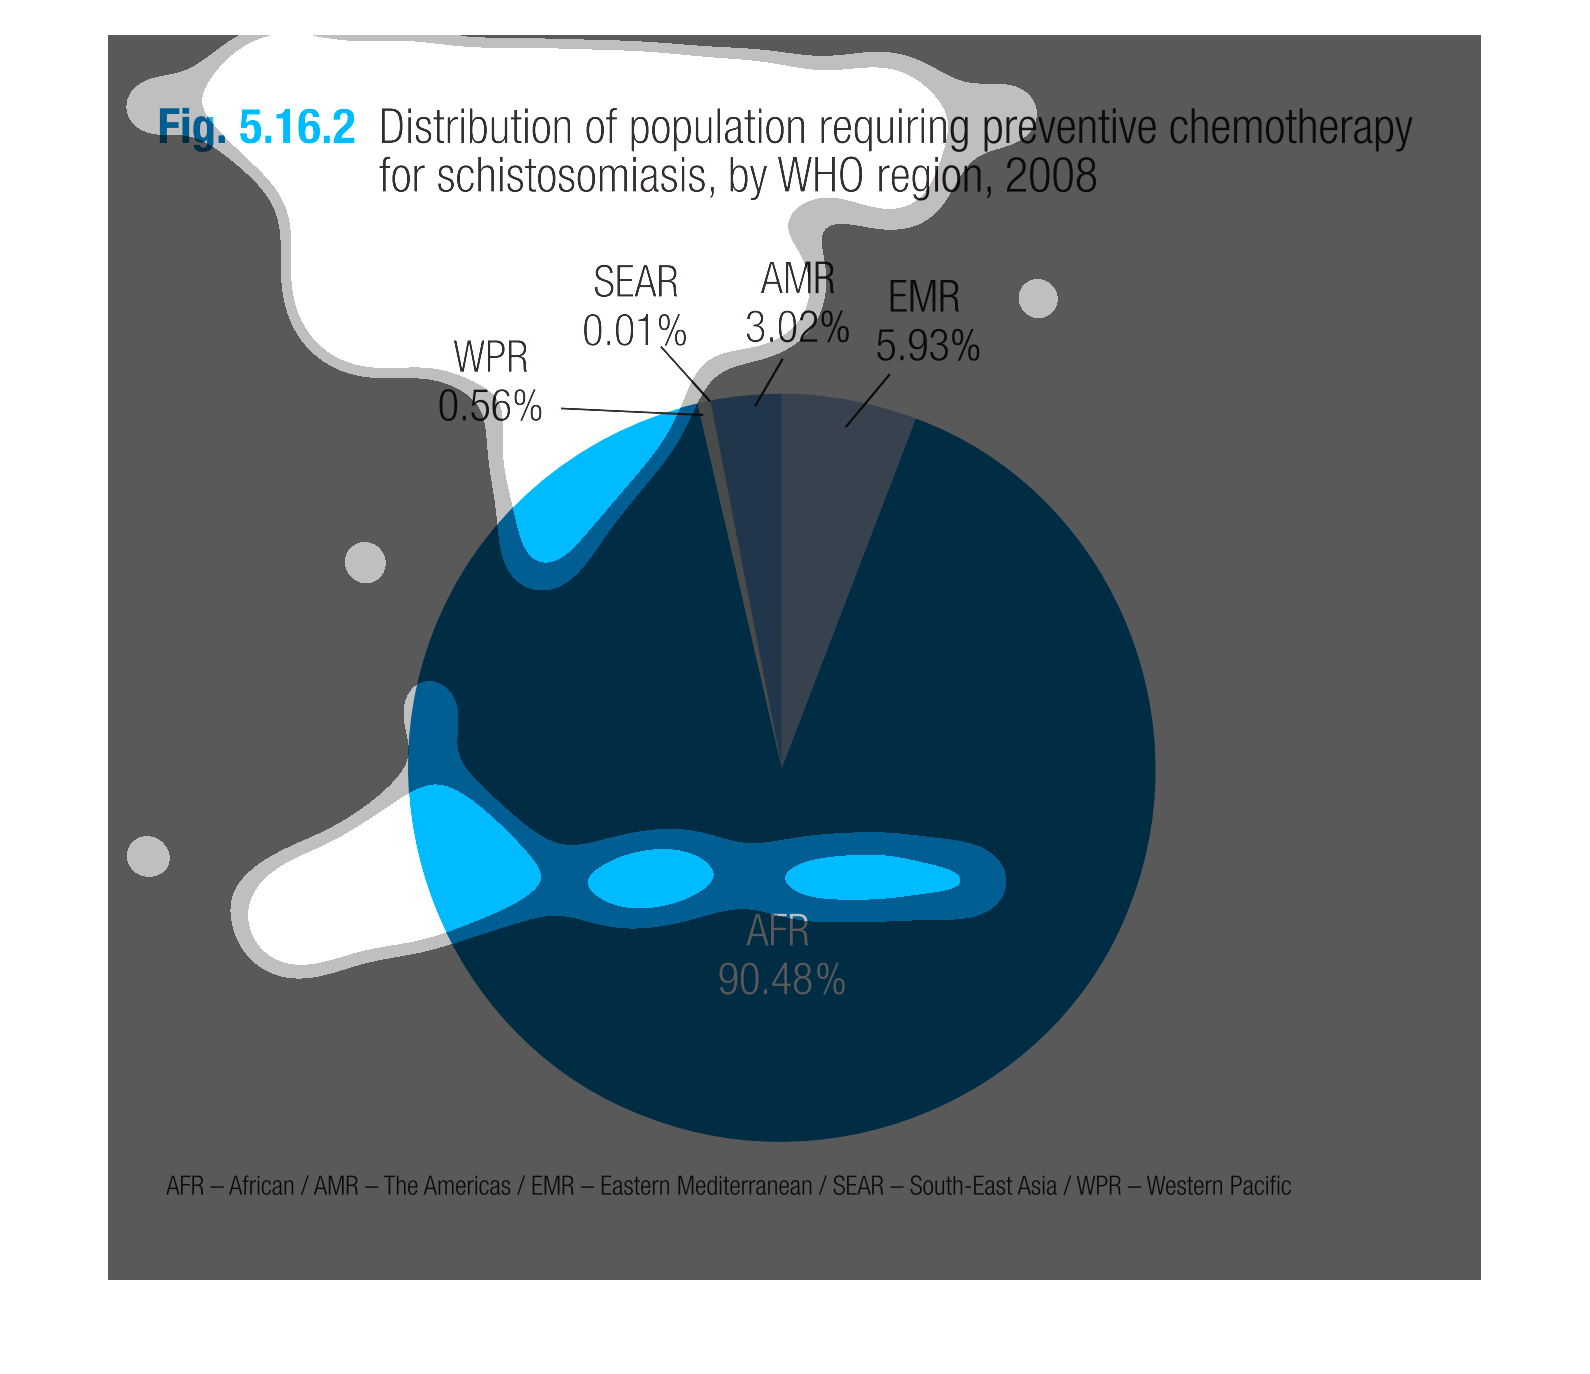
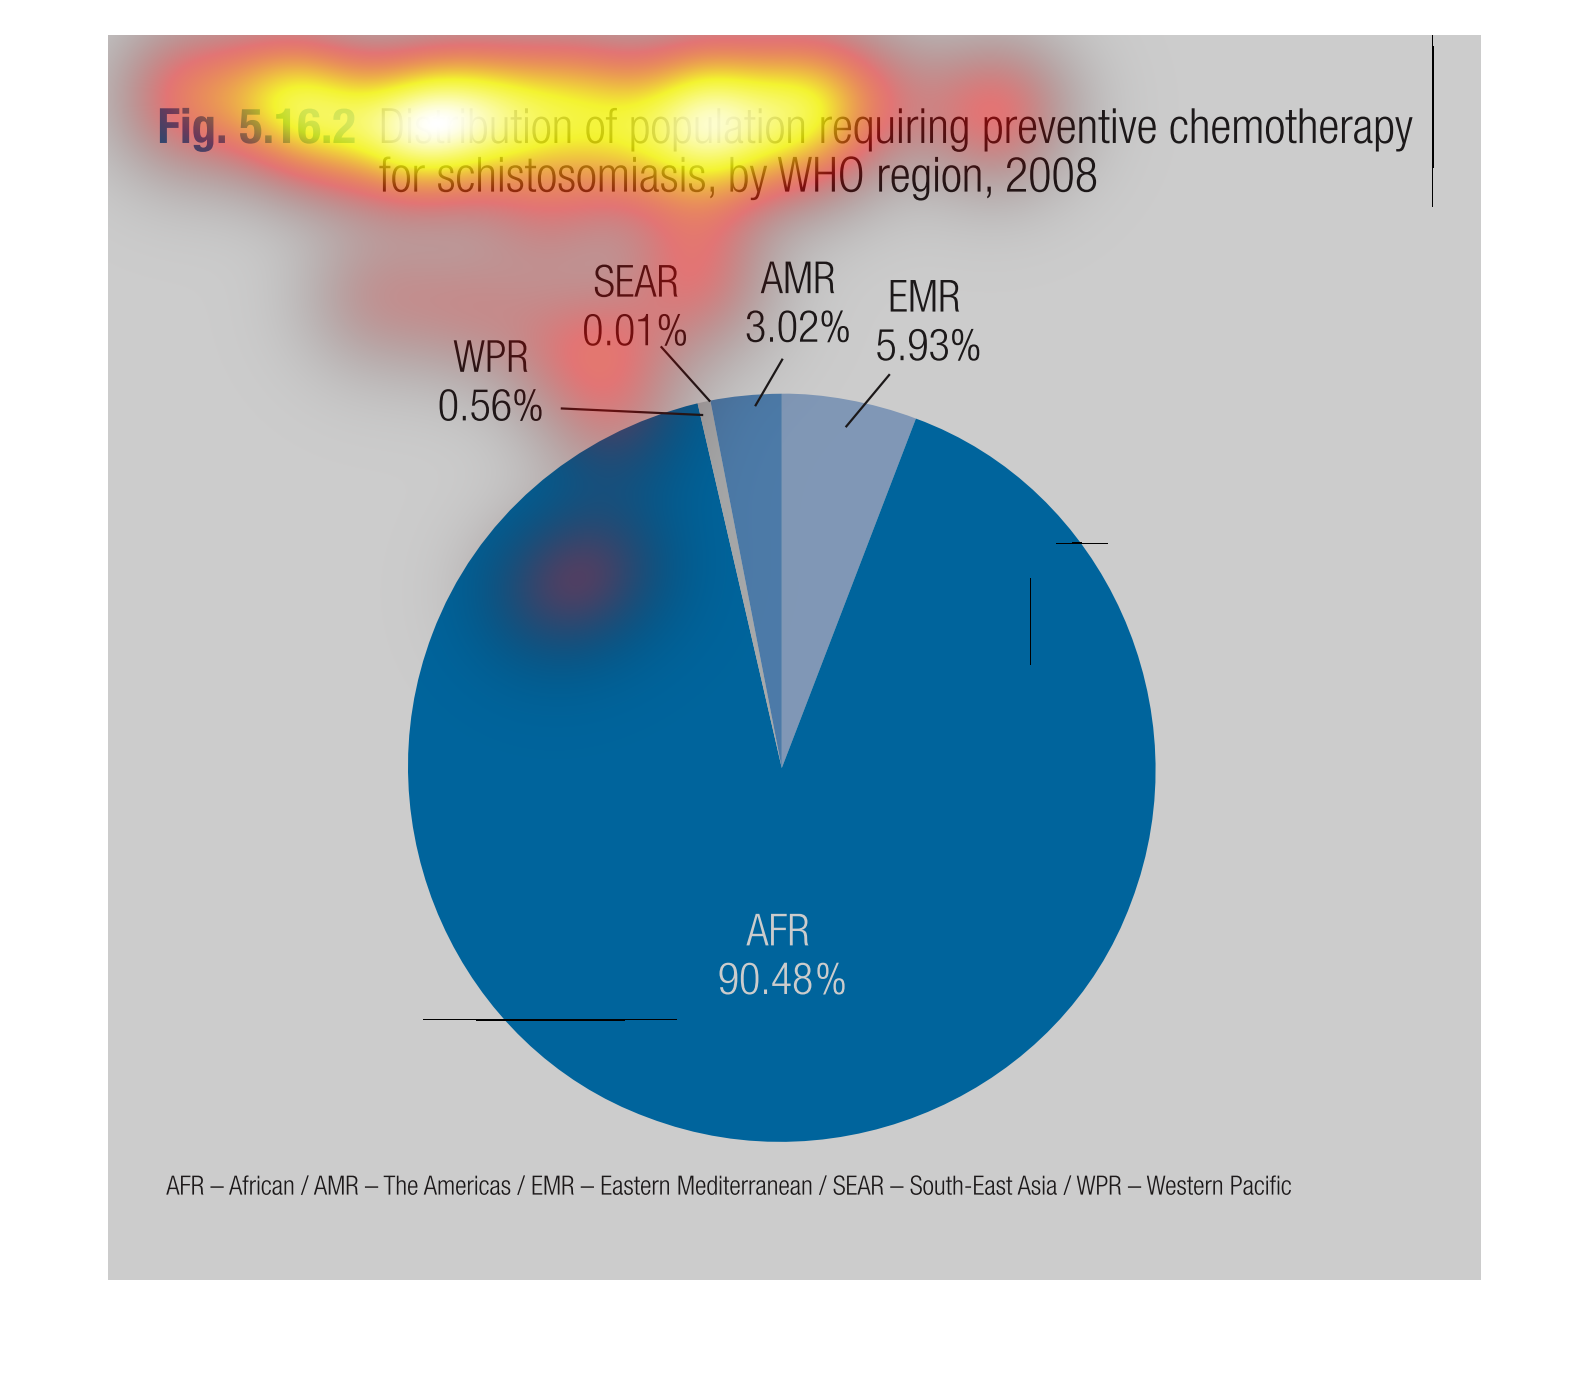
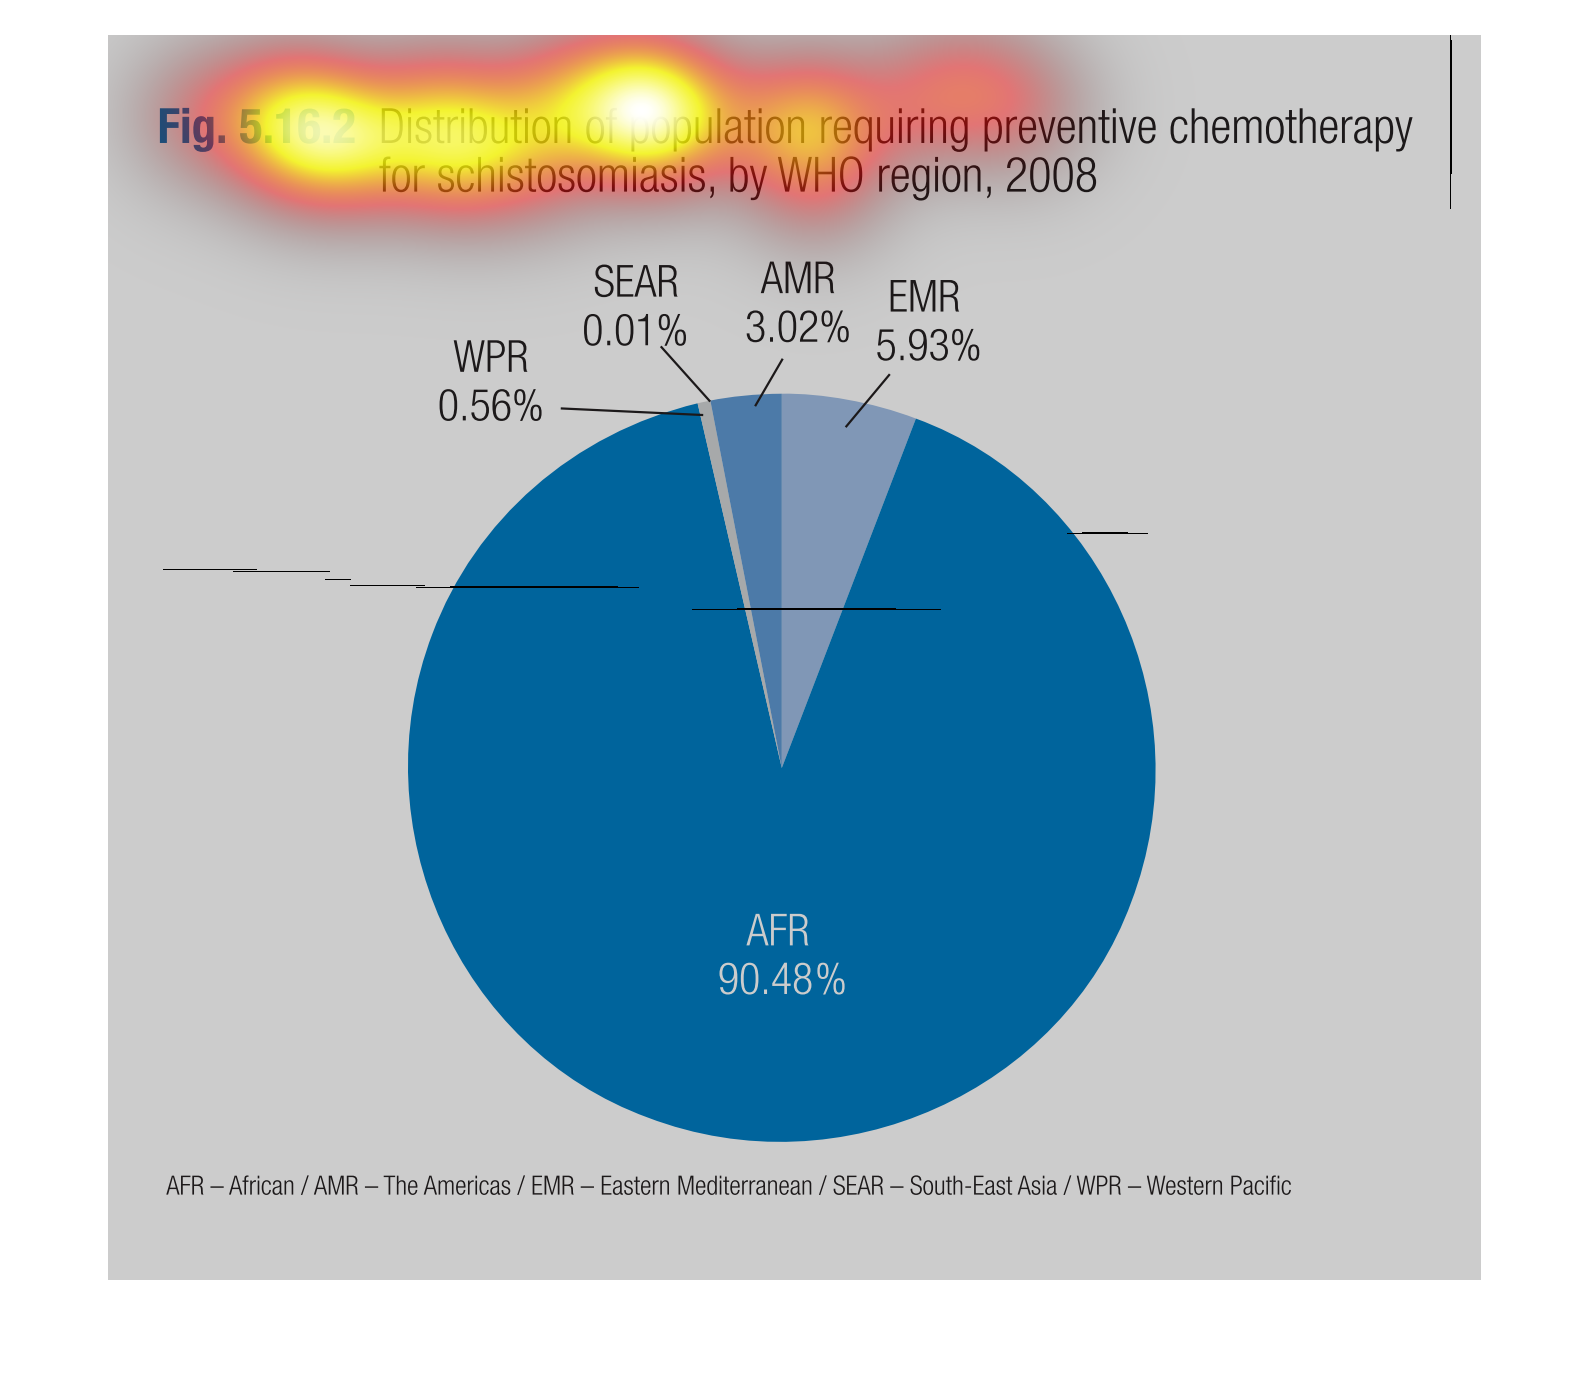
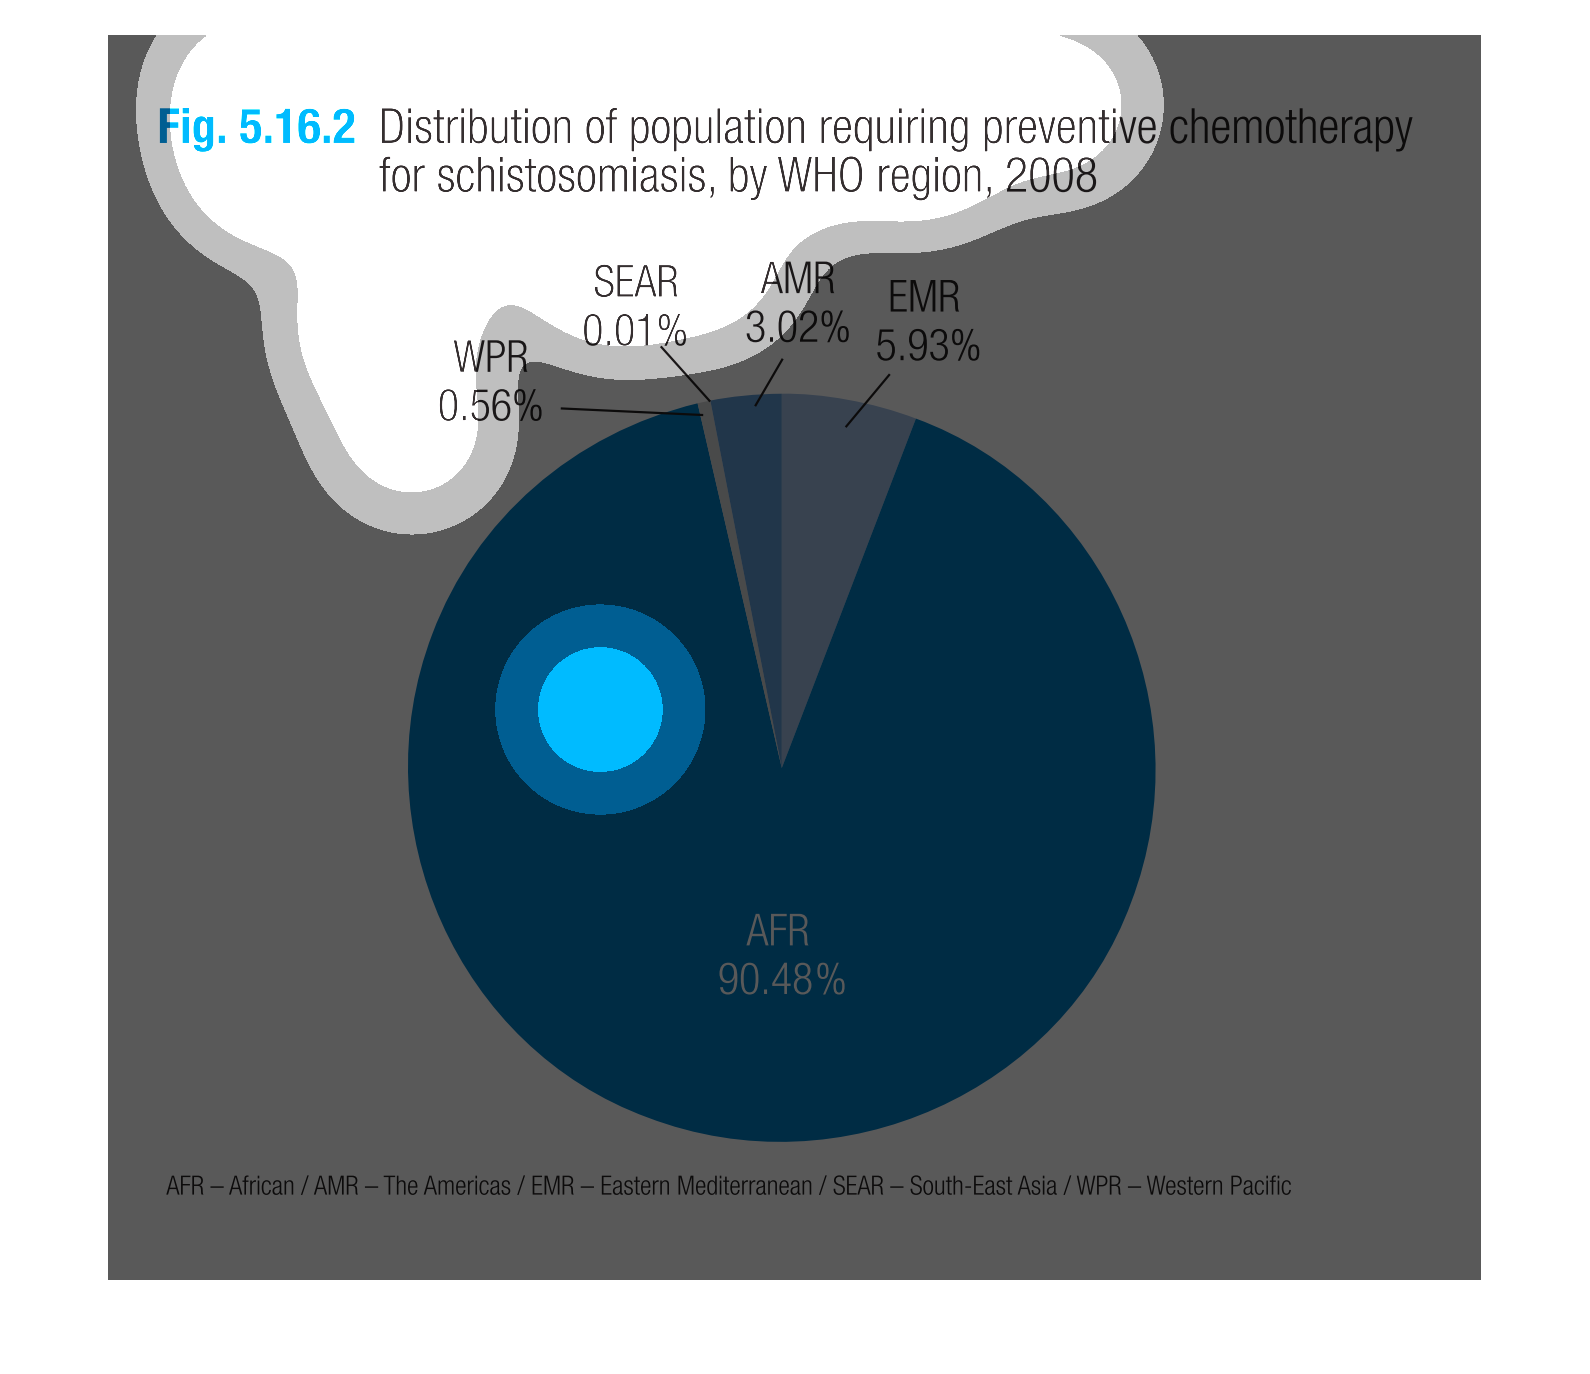
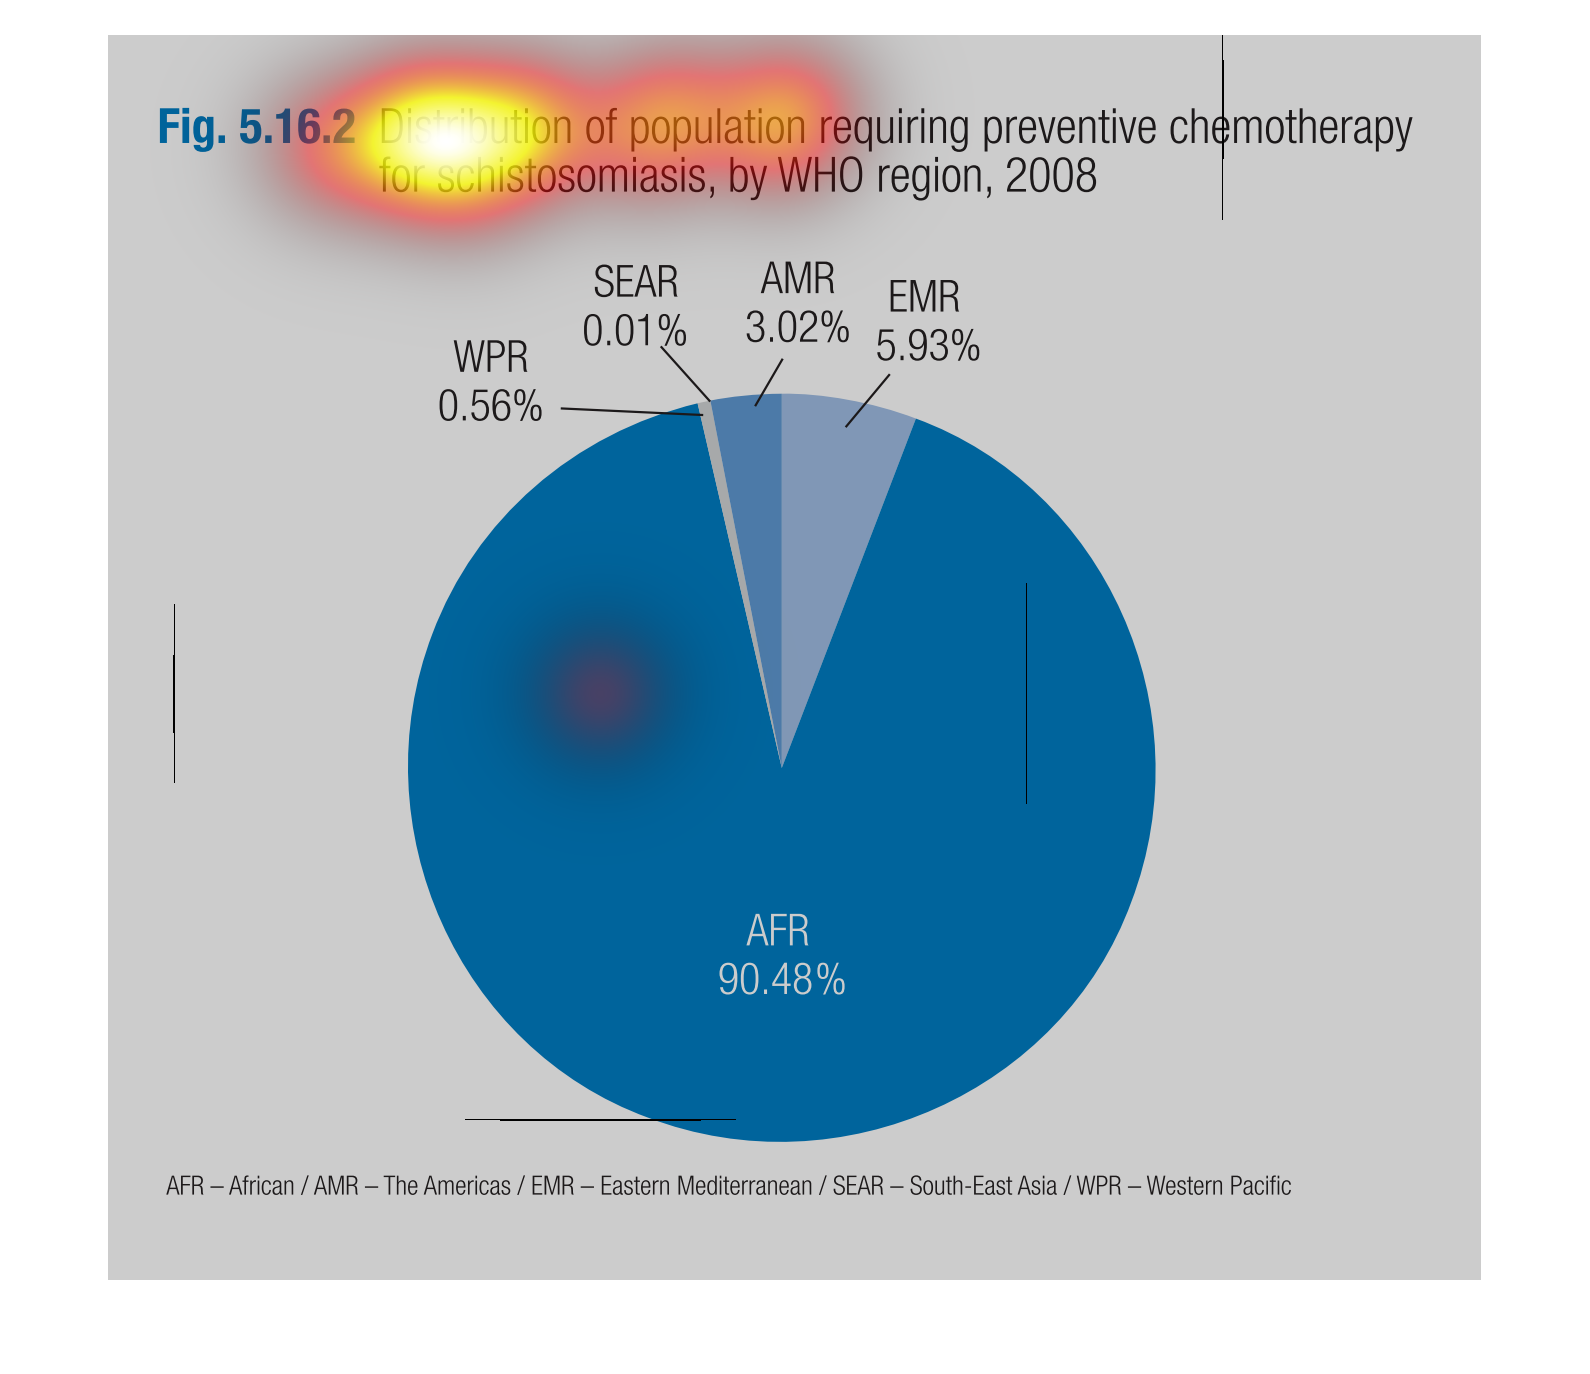
Figure 5.16.2 shows Distribution of population requiring preventative chemotherapy for schistomiasis
by WHO region 2008. This circle graph shows percentages in different shades of blue.
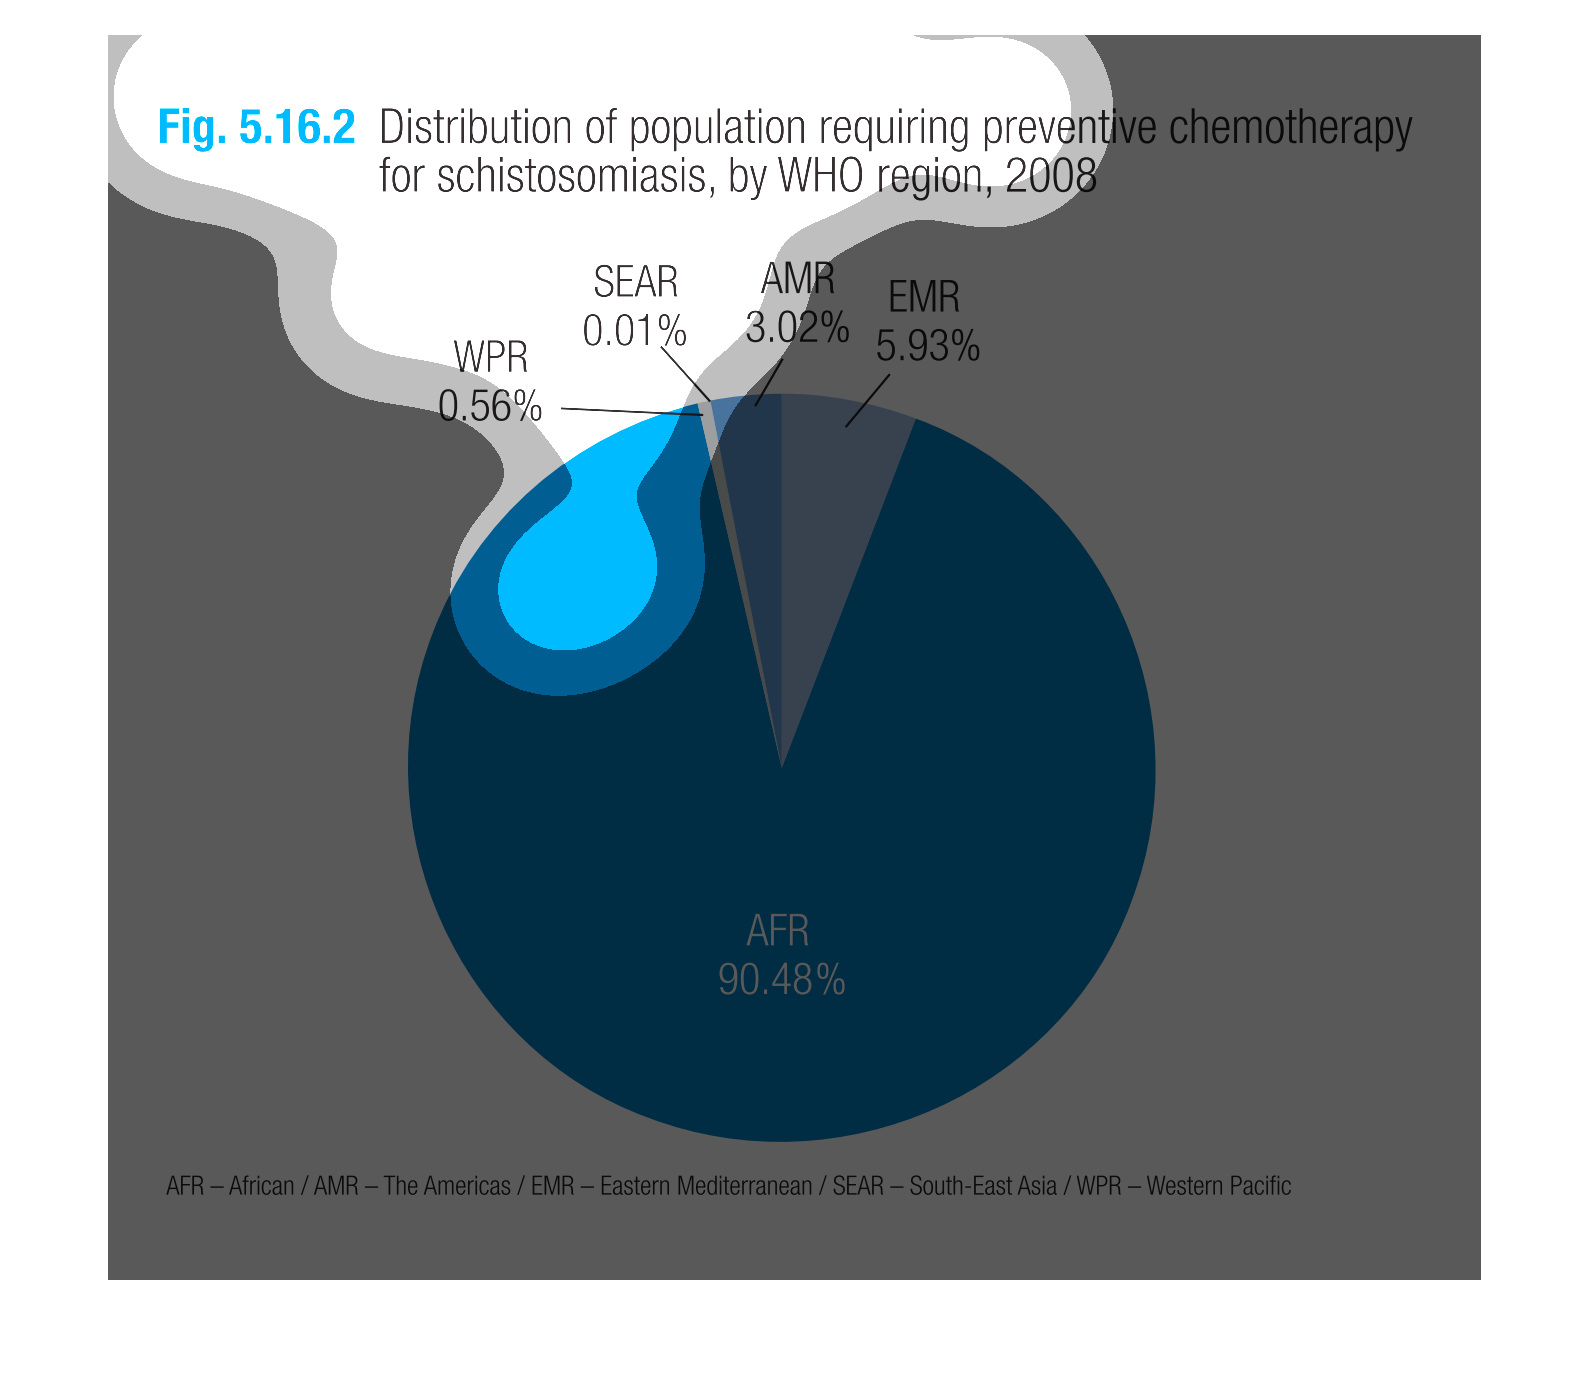
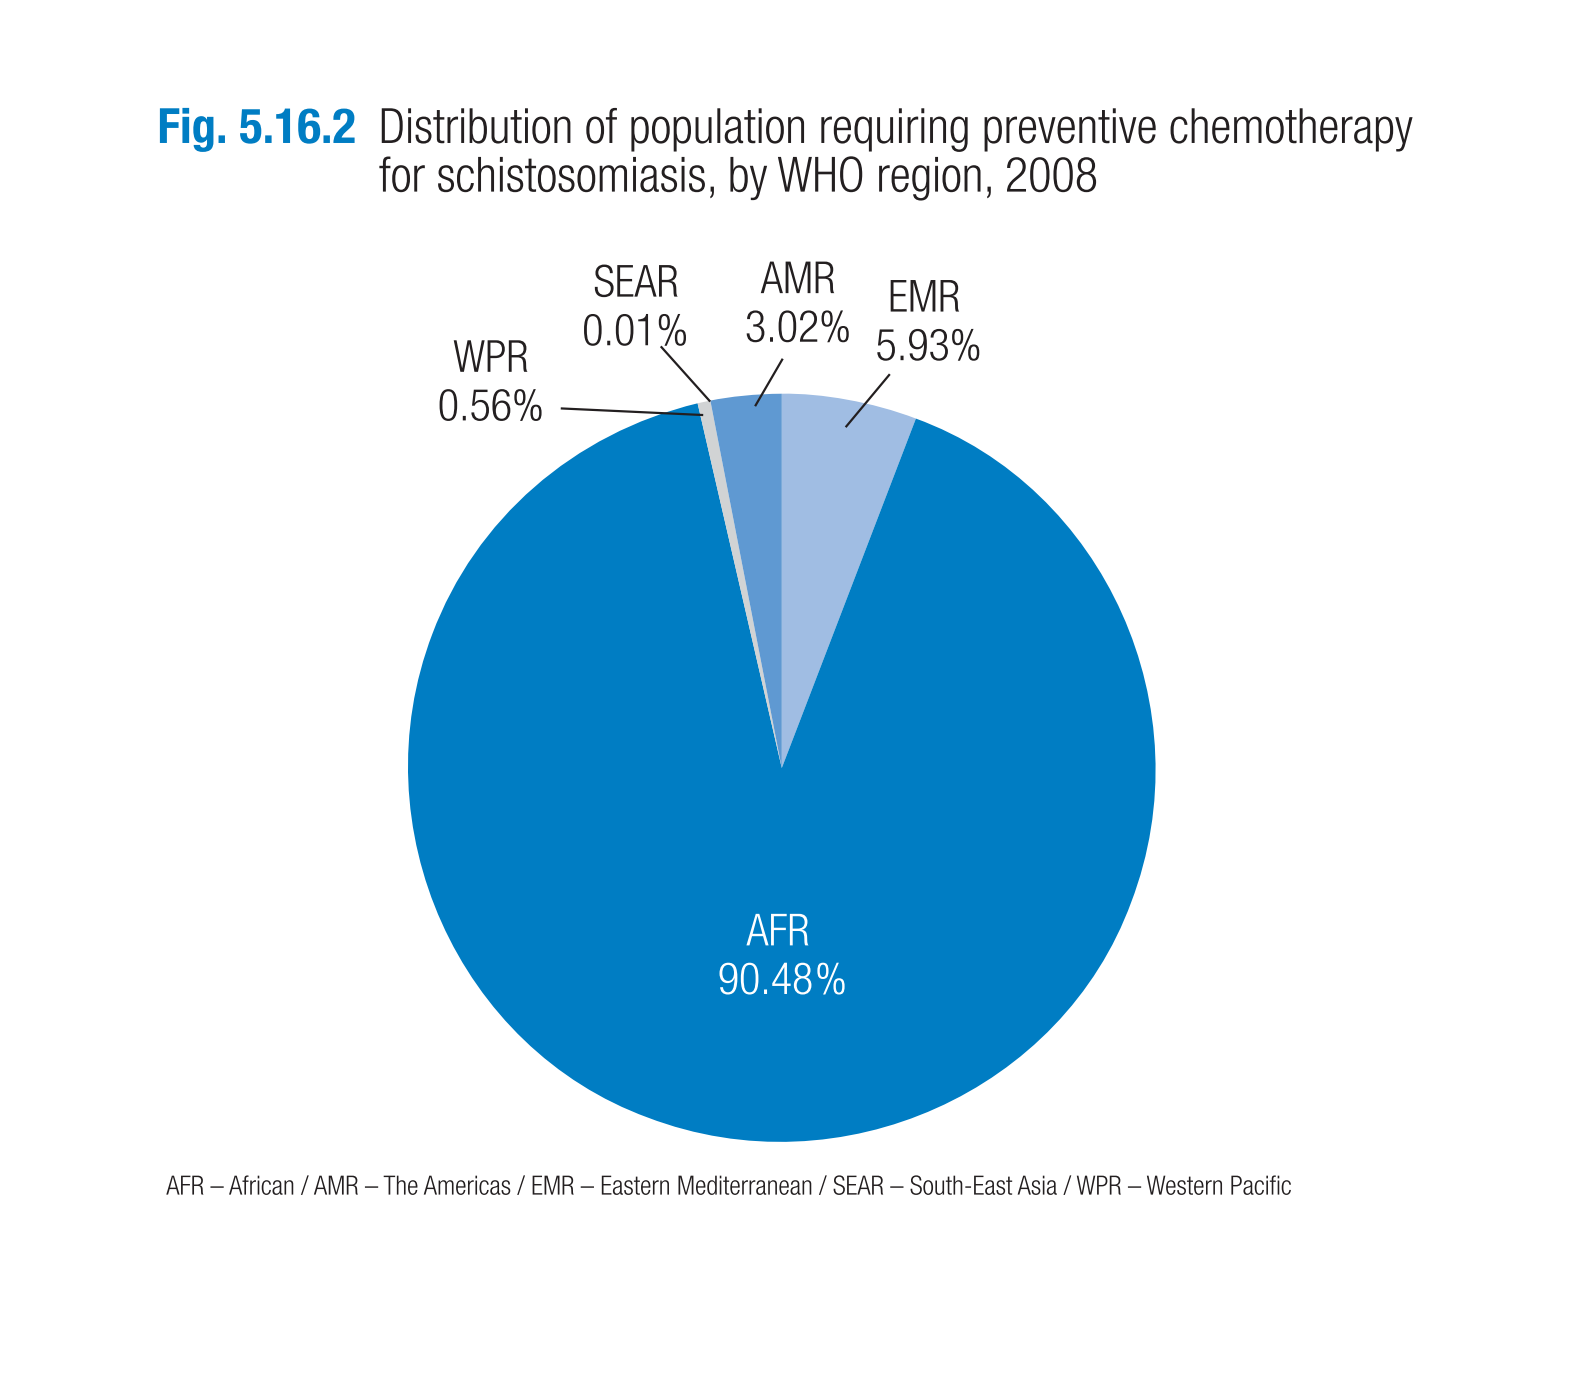
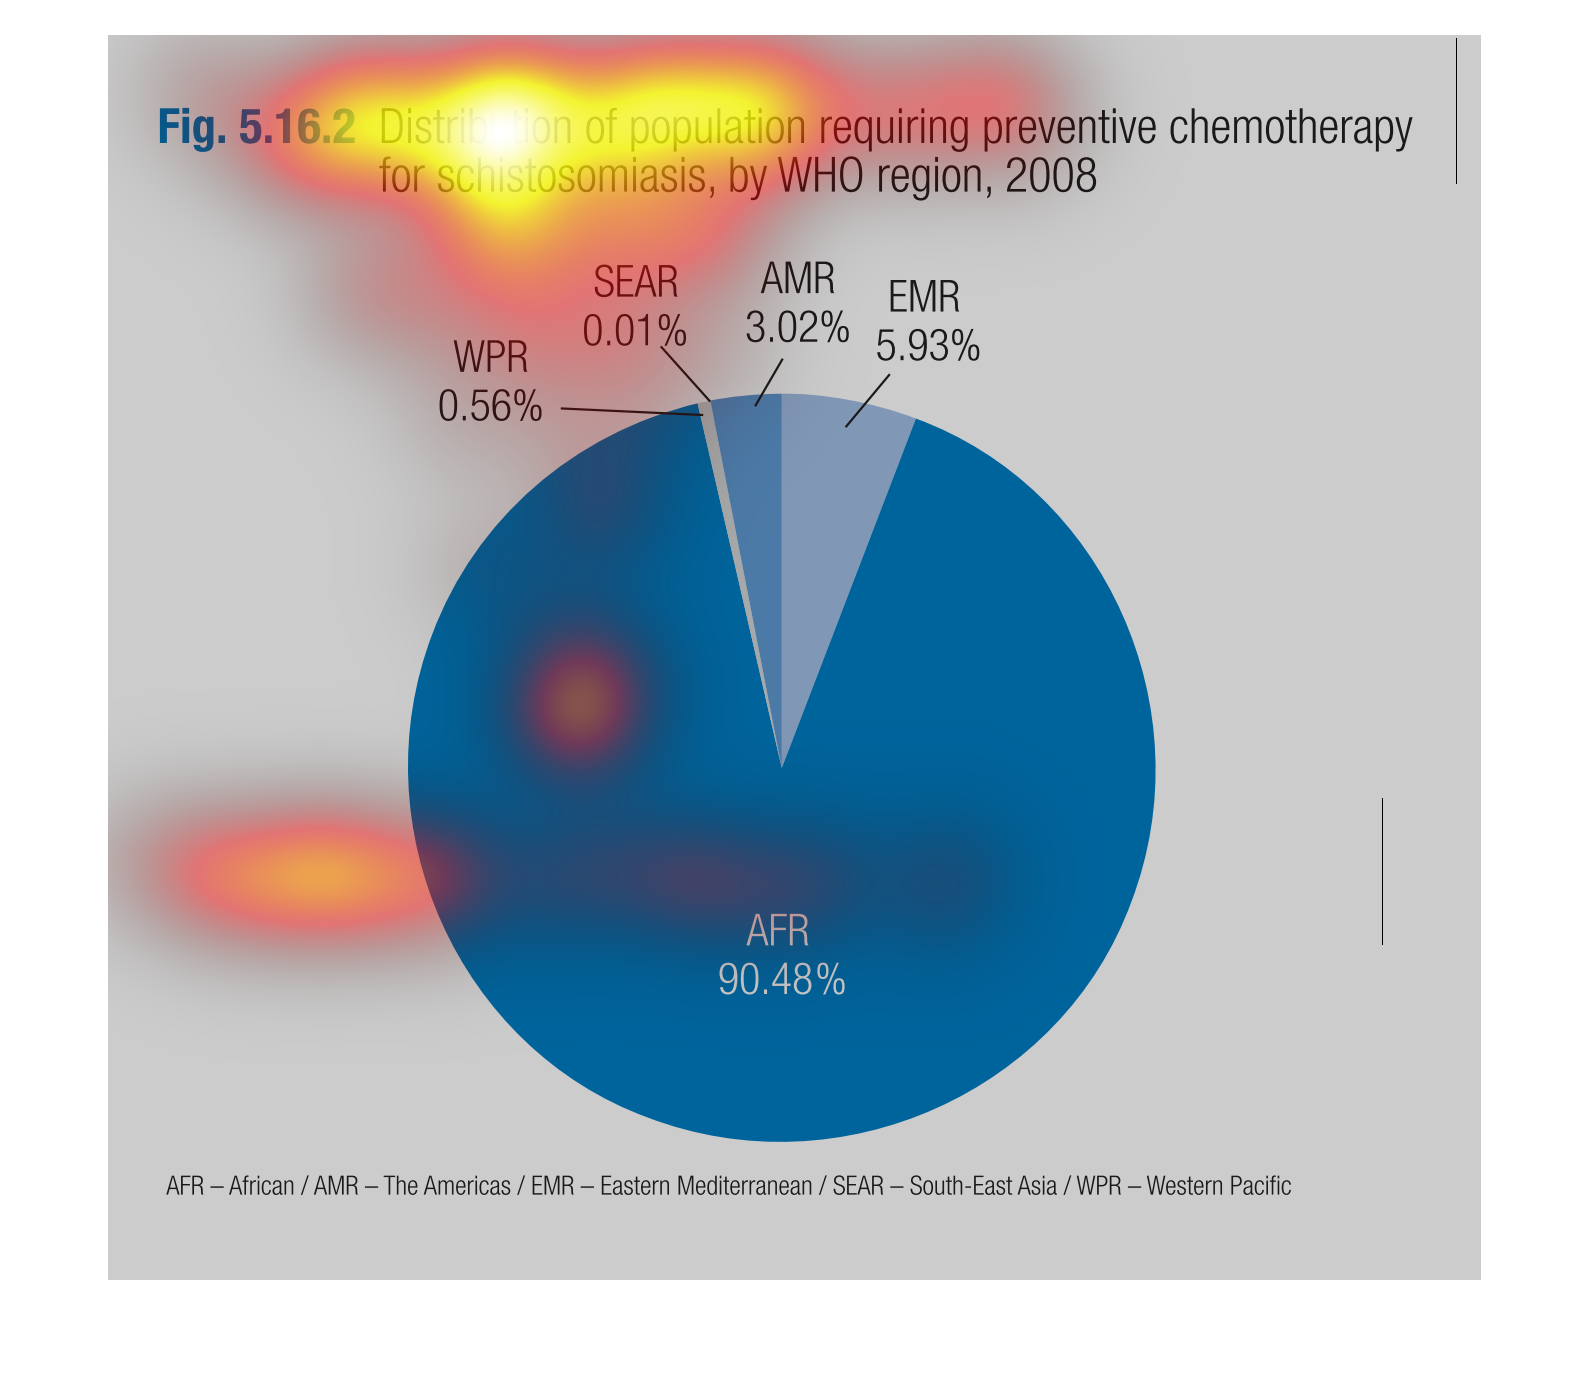
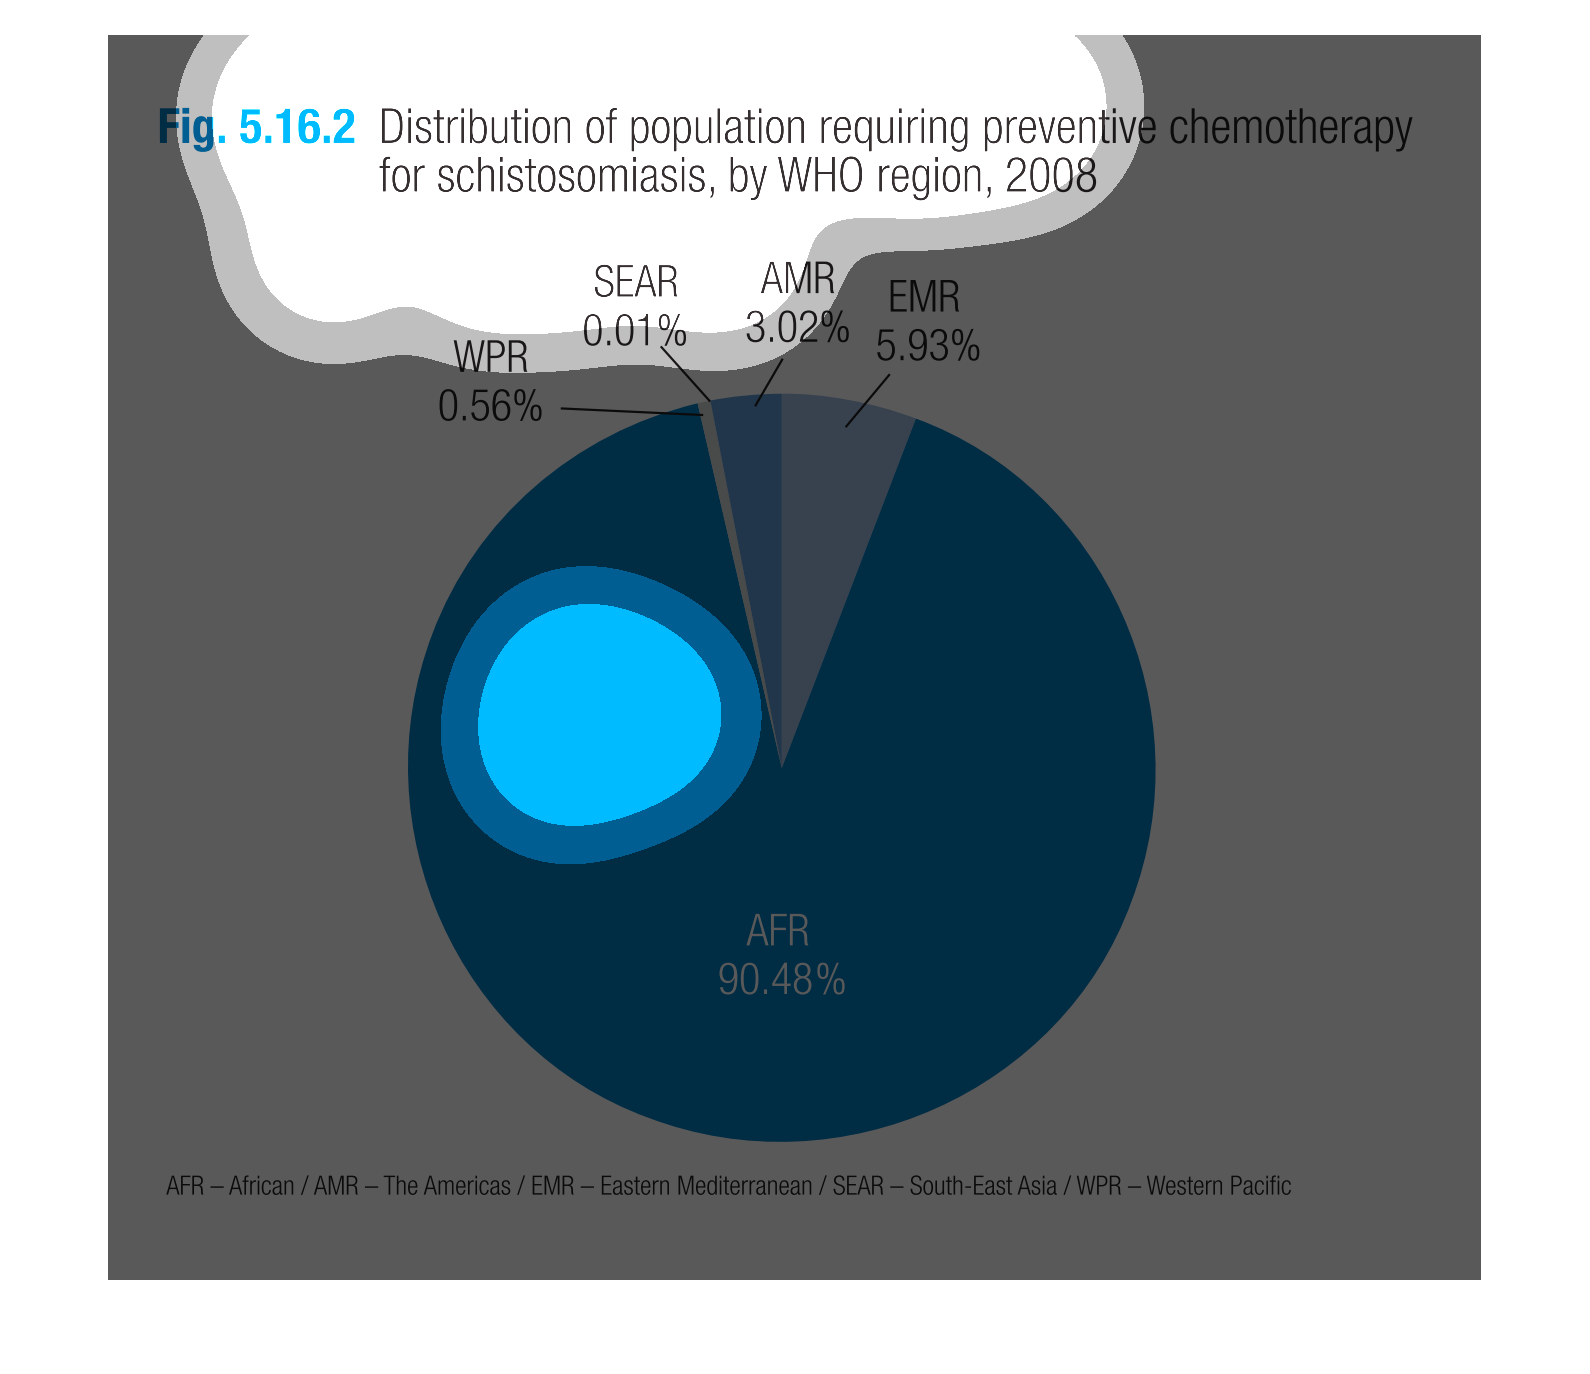
This is a pie chart depicting the distribution of population requiring preventative chemotherapy
for schistosomiasis by WHO in the year 2008. The vast majority is shown to be AFR.
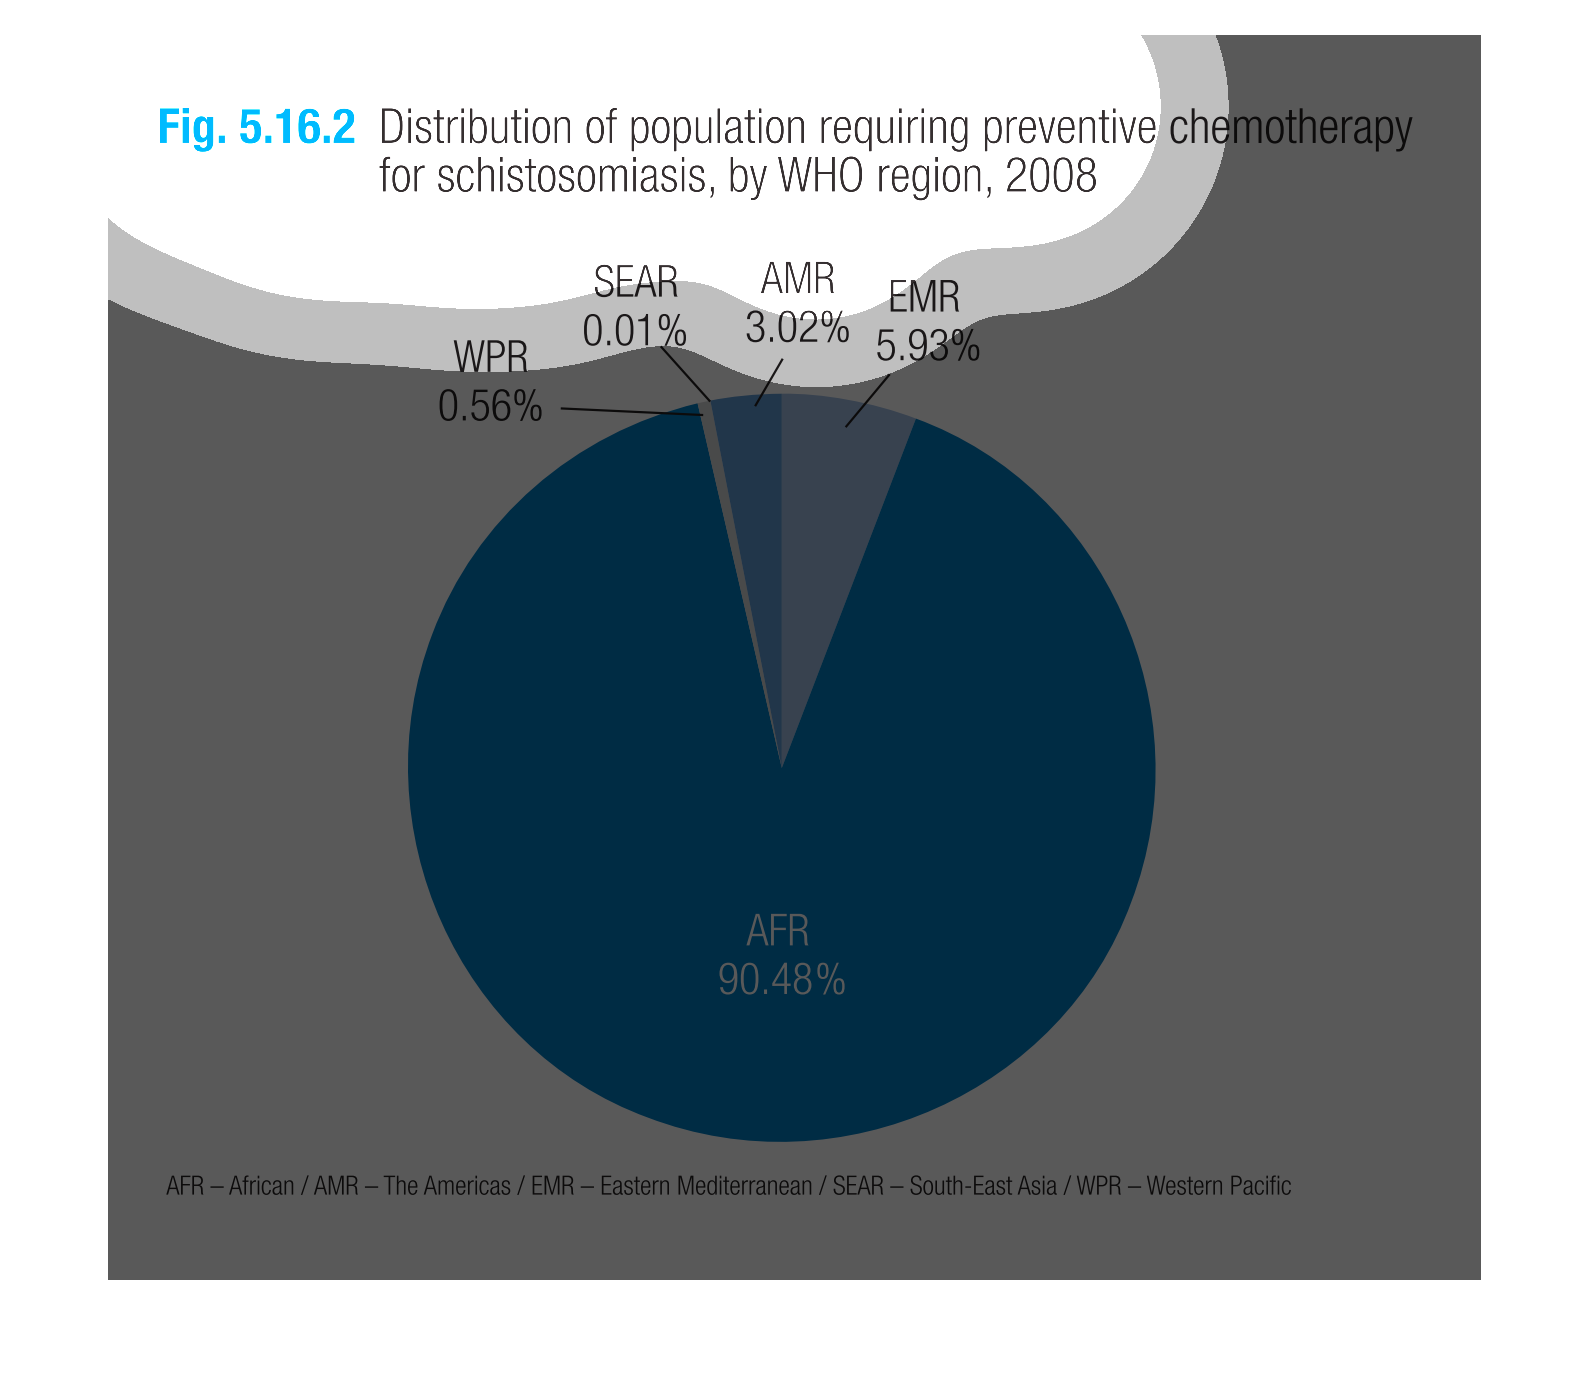
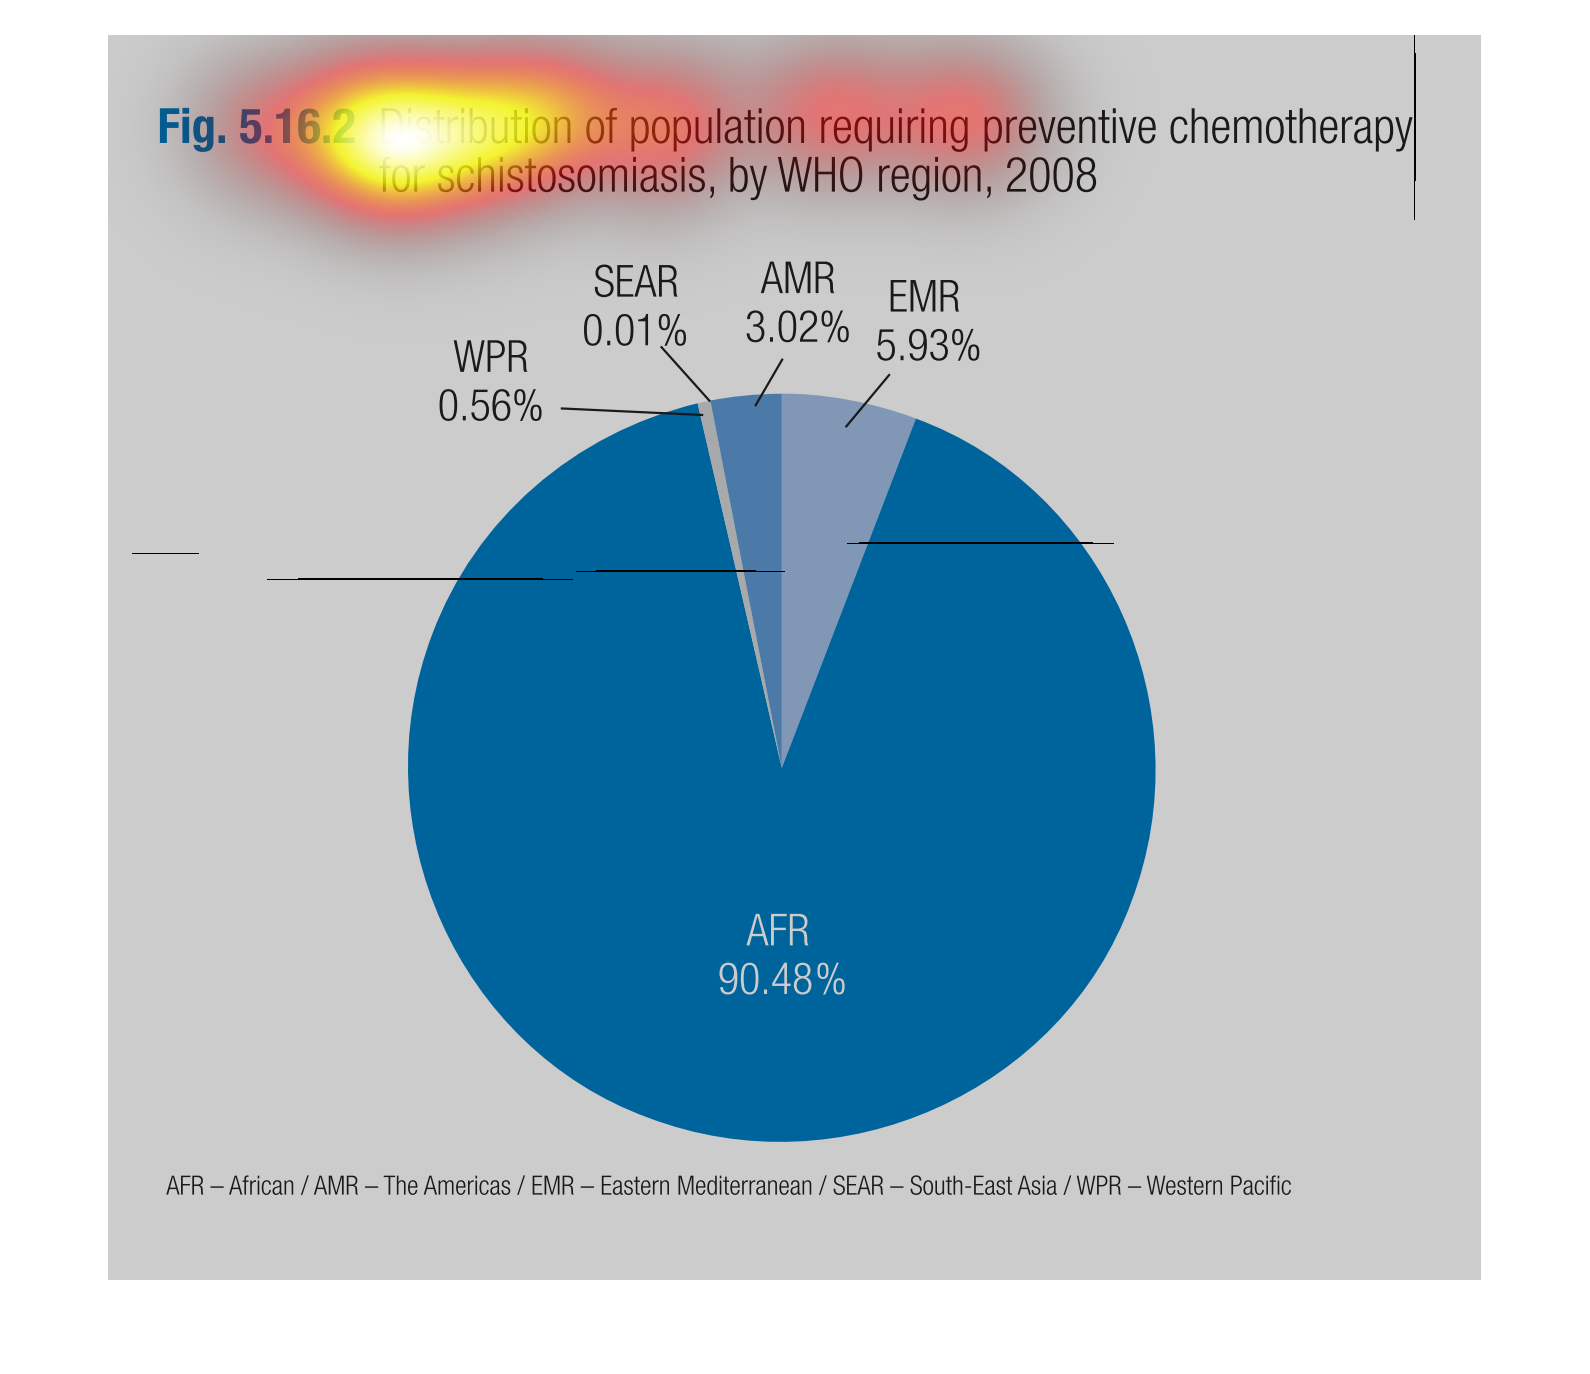
The figure presented is titled figure 5.16.2: distribution of population requiring preventive
chemotherapy for schistomiasis, by WHO region, 2008.  It represents chemotherapy.
This pie chart shows the percentage of various population that requires preventative chemotherapy
for schistosomiasis.  Africans require the most by far at 90.58%.  South-east Asia requires
the least at only 0.01%.
This chart describes distribution of population requiring preventive chemotherapy for schistosomiasis,
by WHO region for the year 2008. Categories include SEAR and AMR.
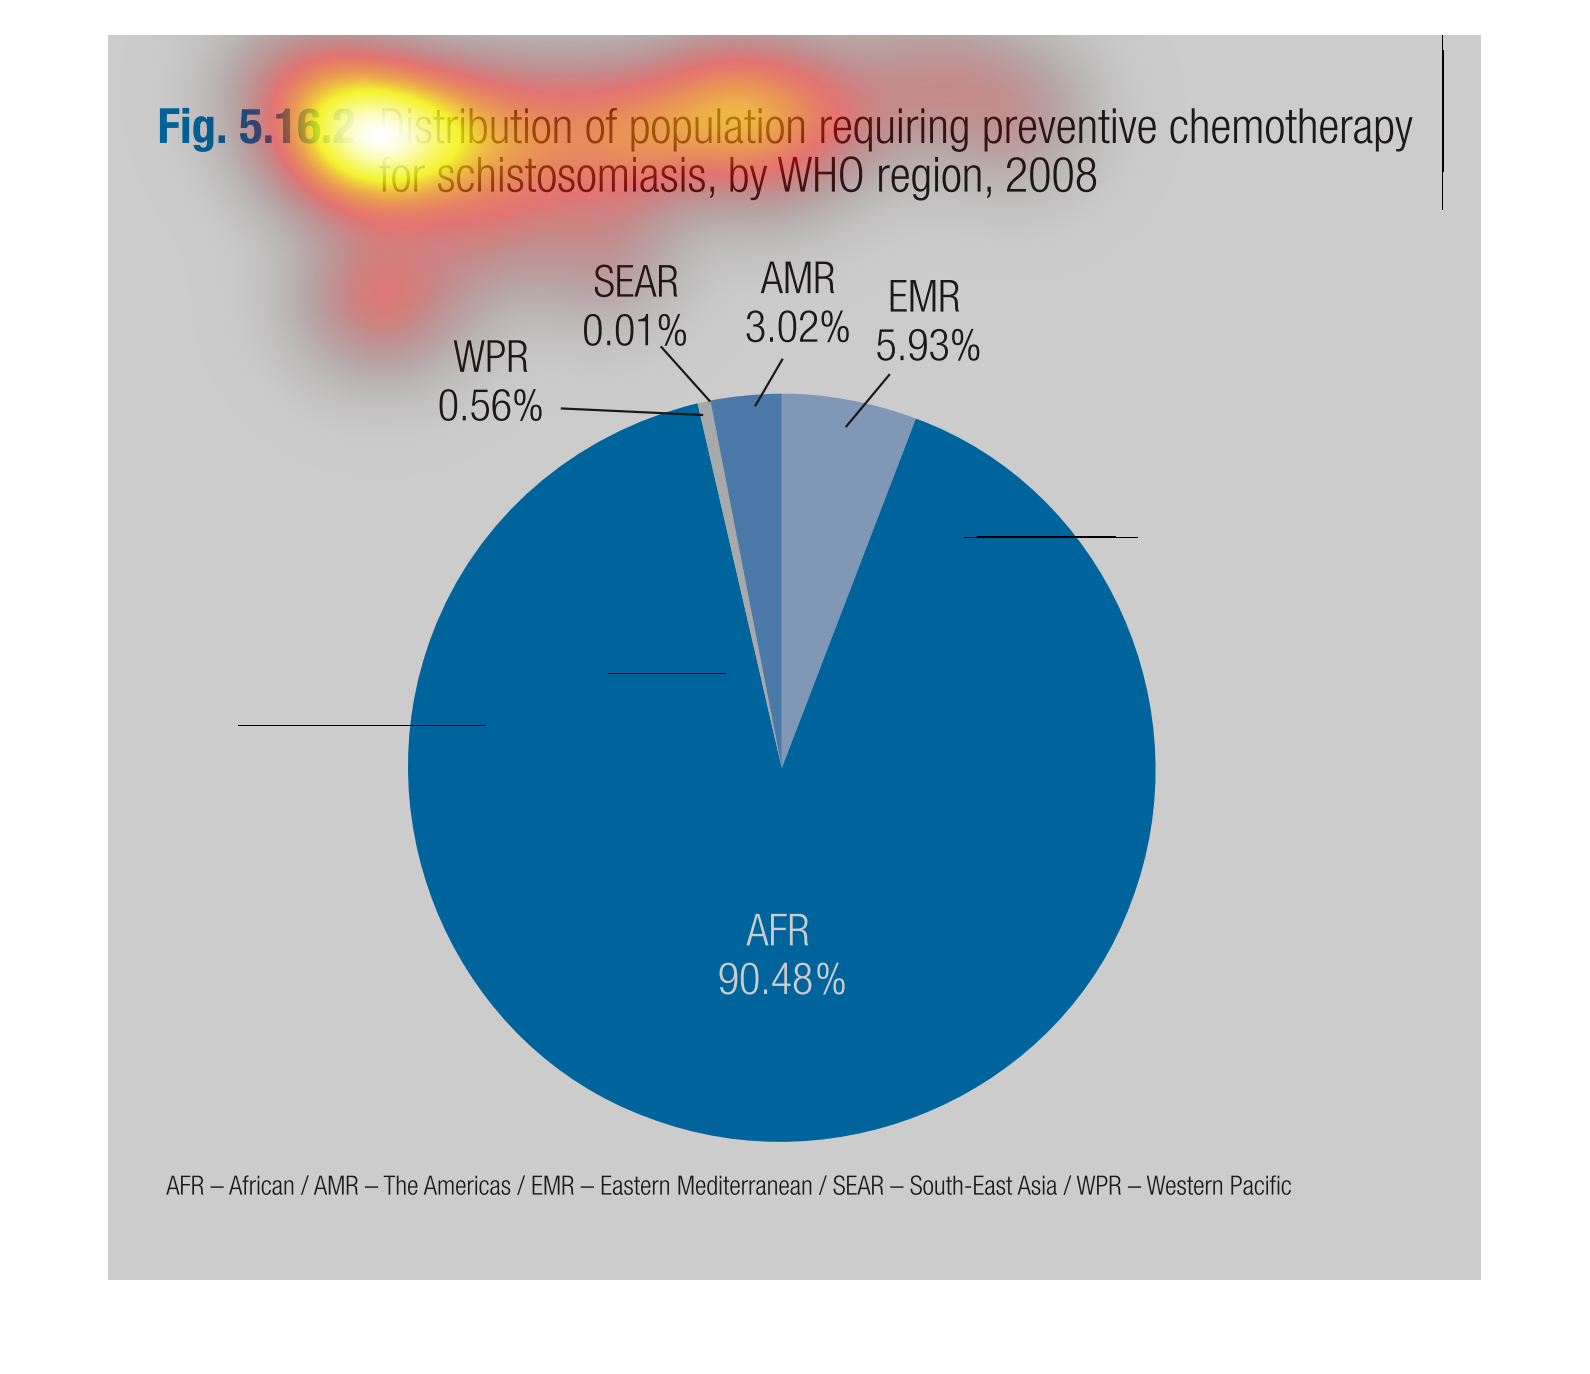

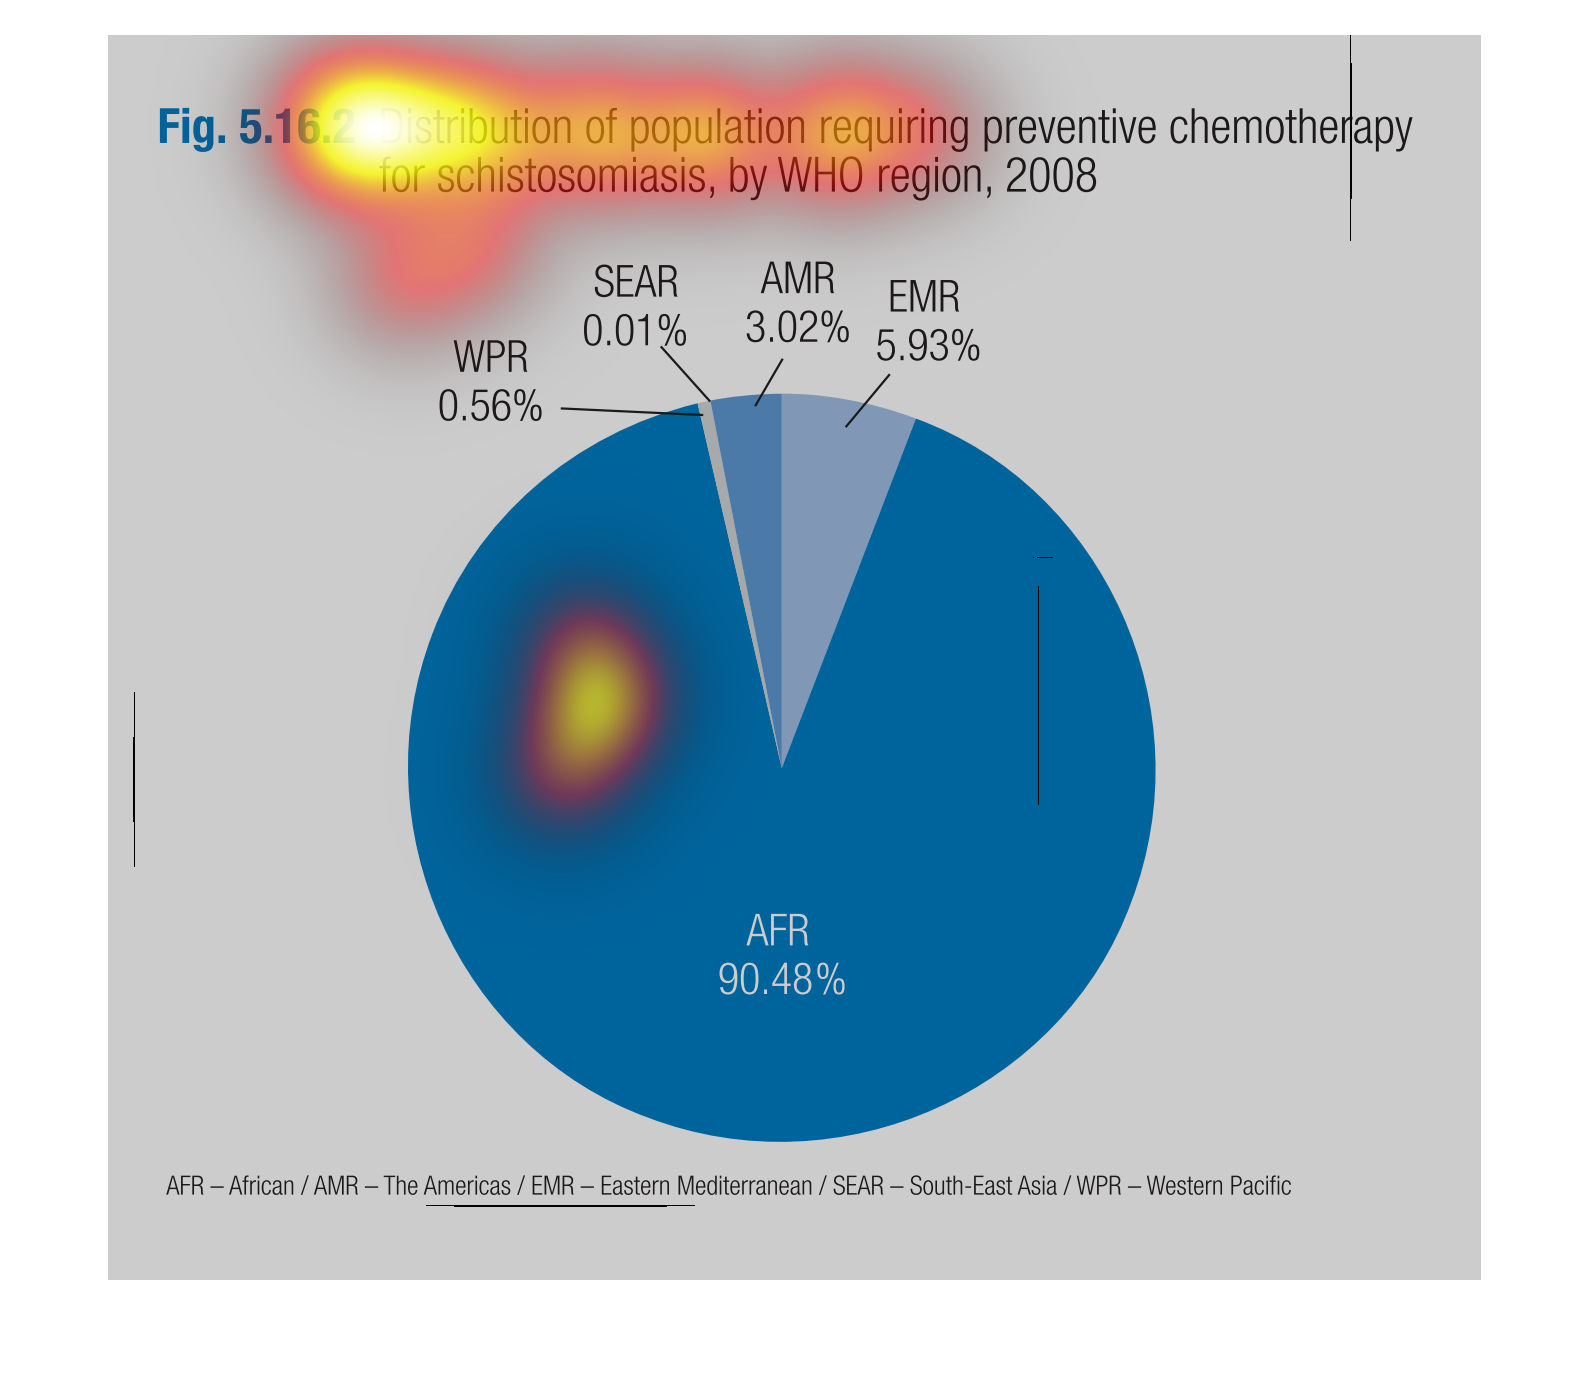
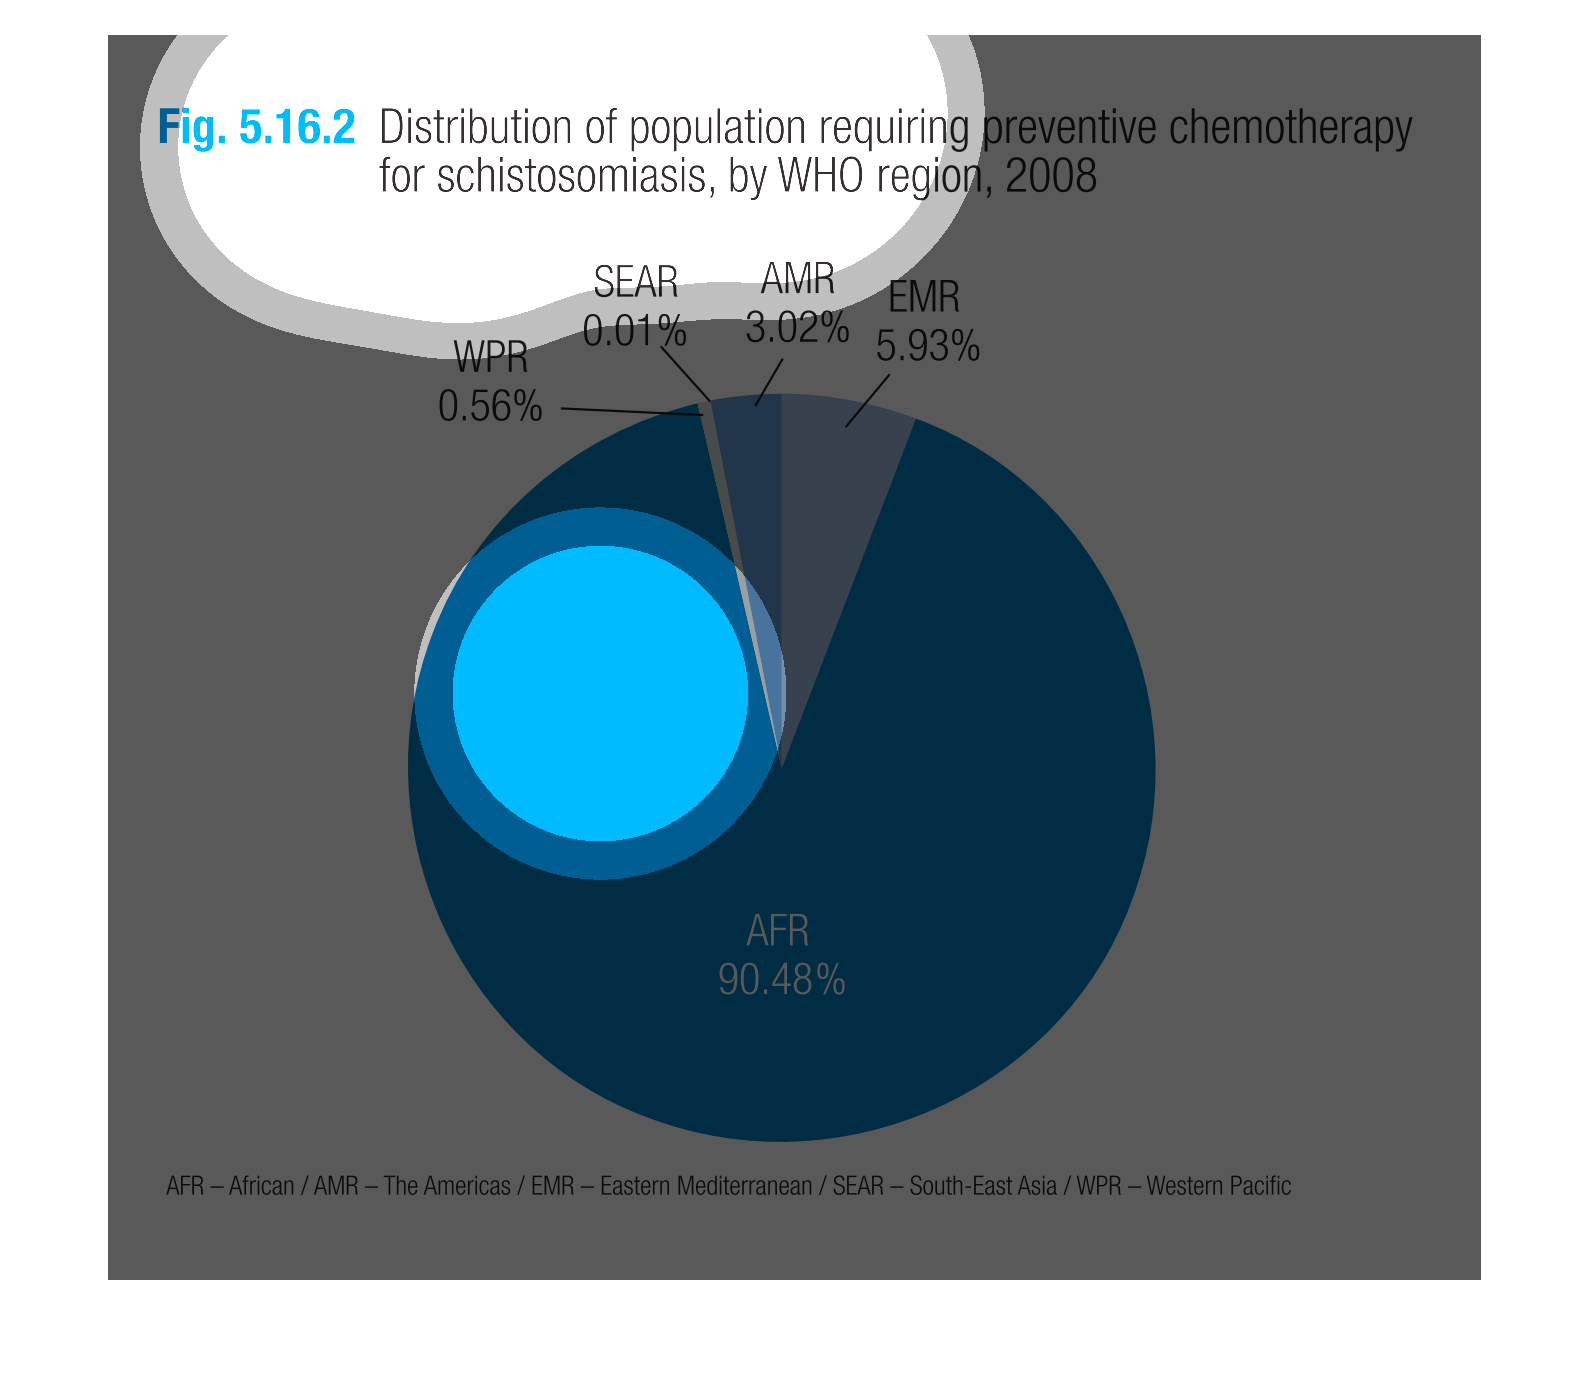
The image on the left hand side is a pie chart showing the distribution in a percentage form
of a population requiring preventative chemotherapy for schistosomiasis.  From the data collected
in the 2004 survey it shows that 90.48% of the worlds required treatments come from the African
region.
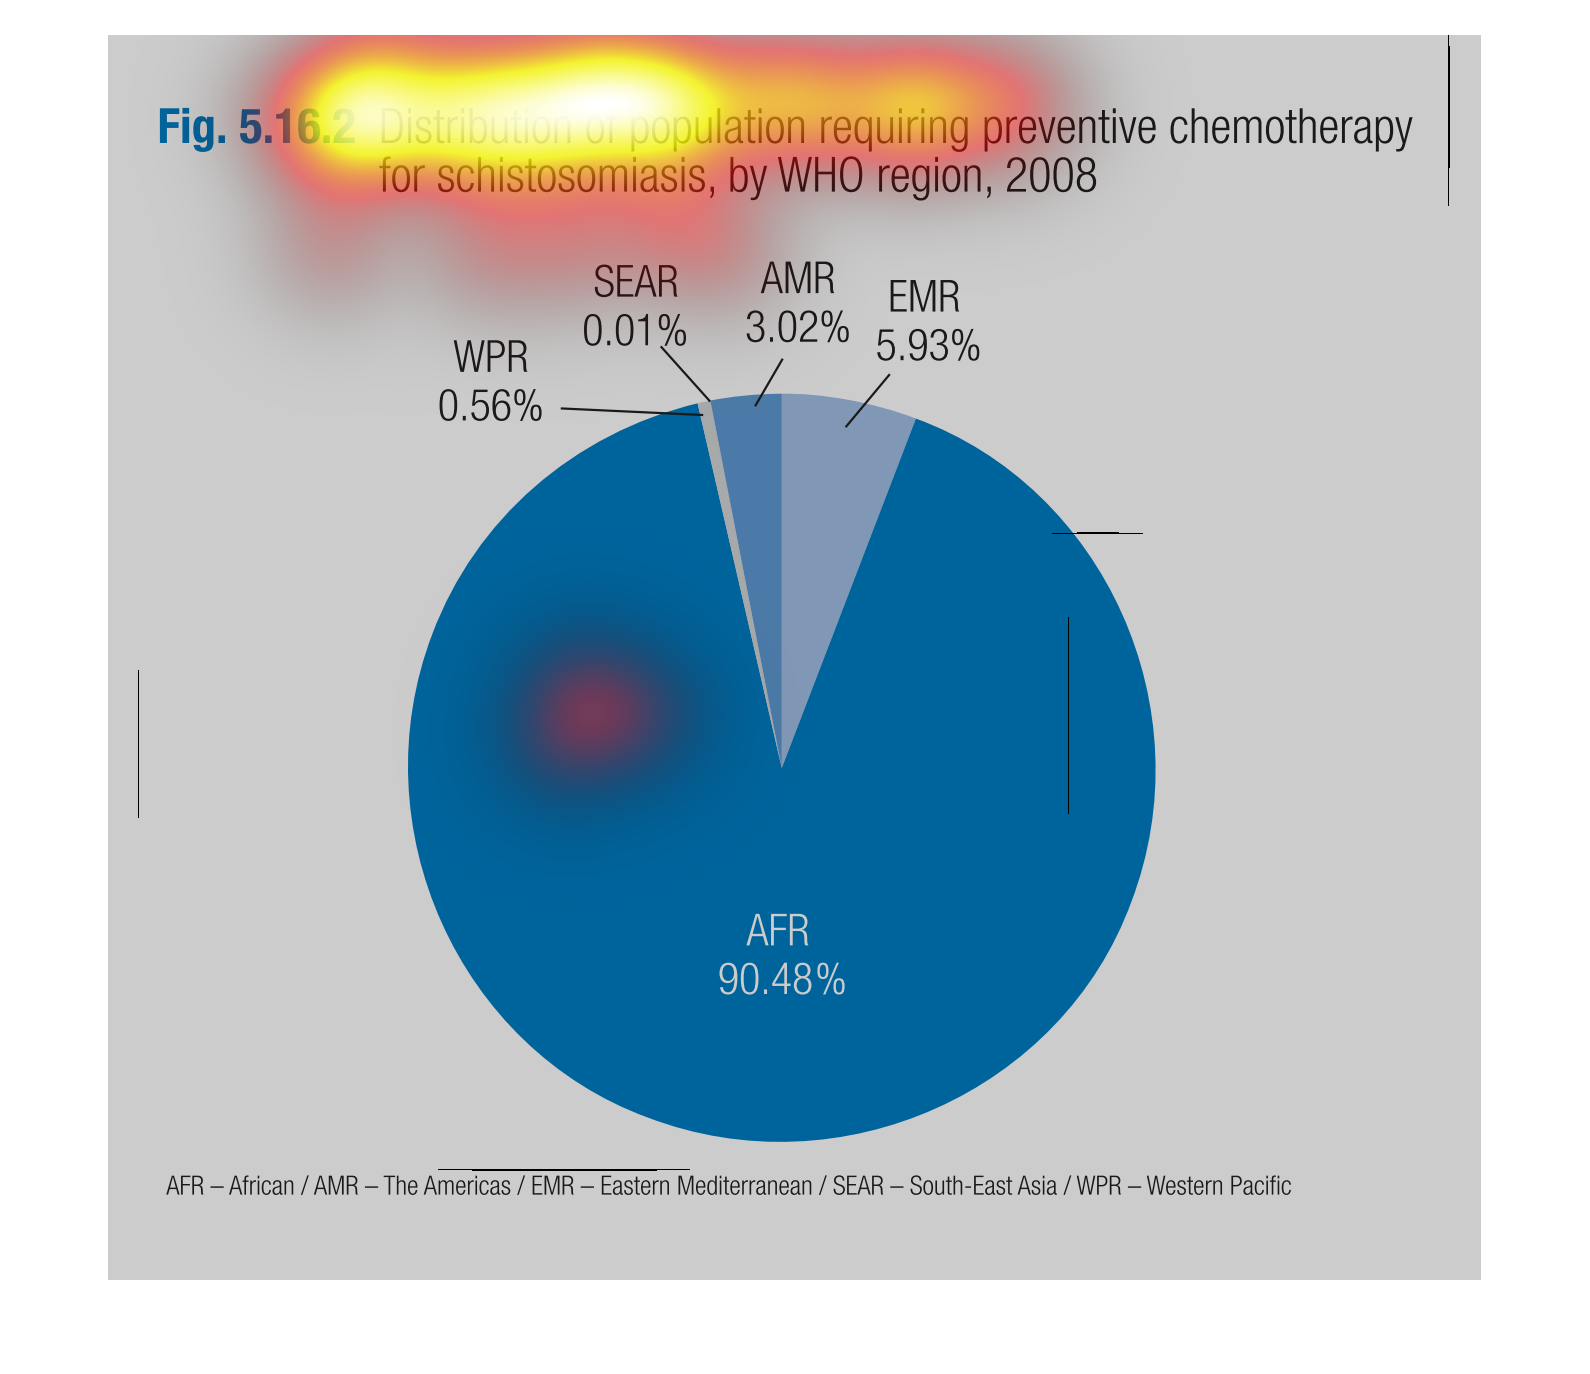
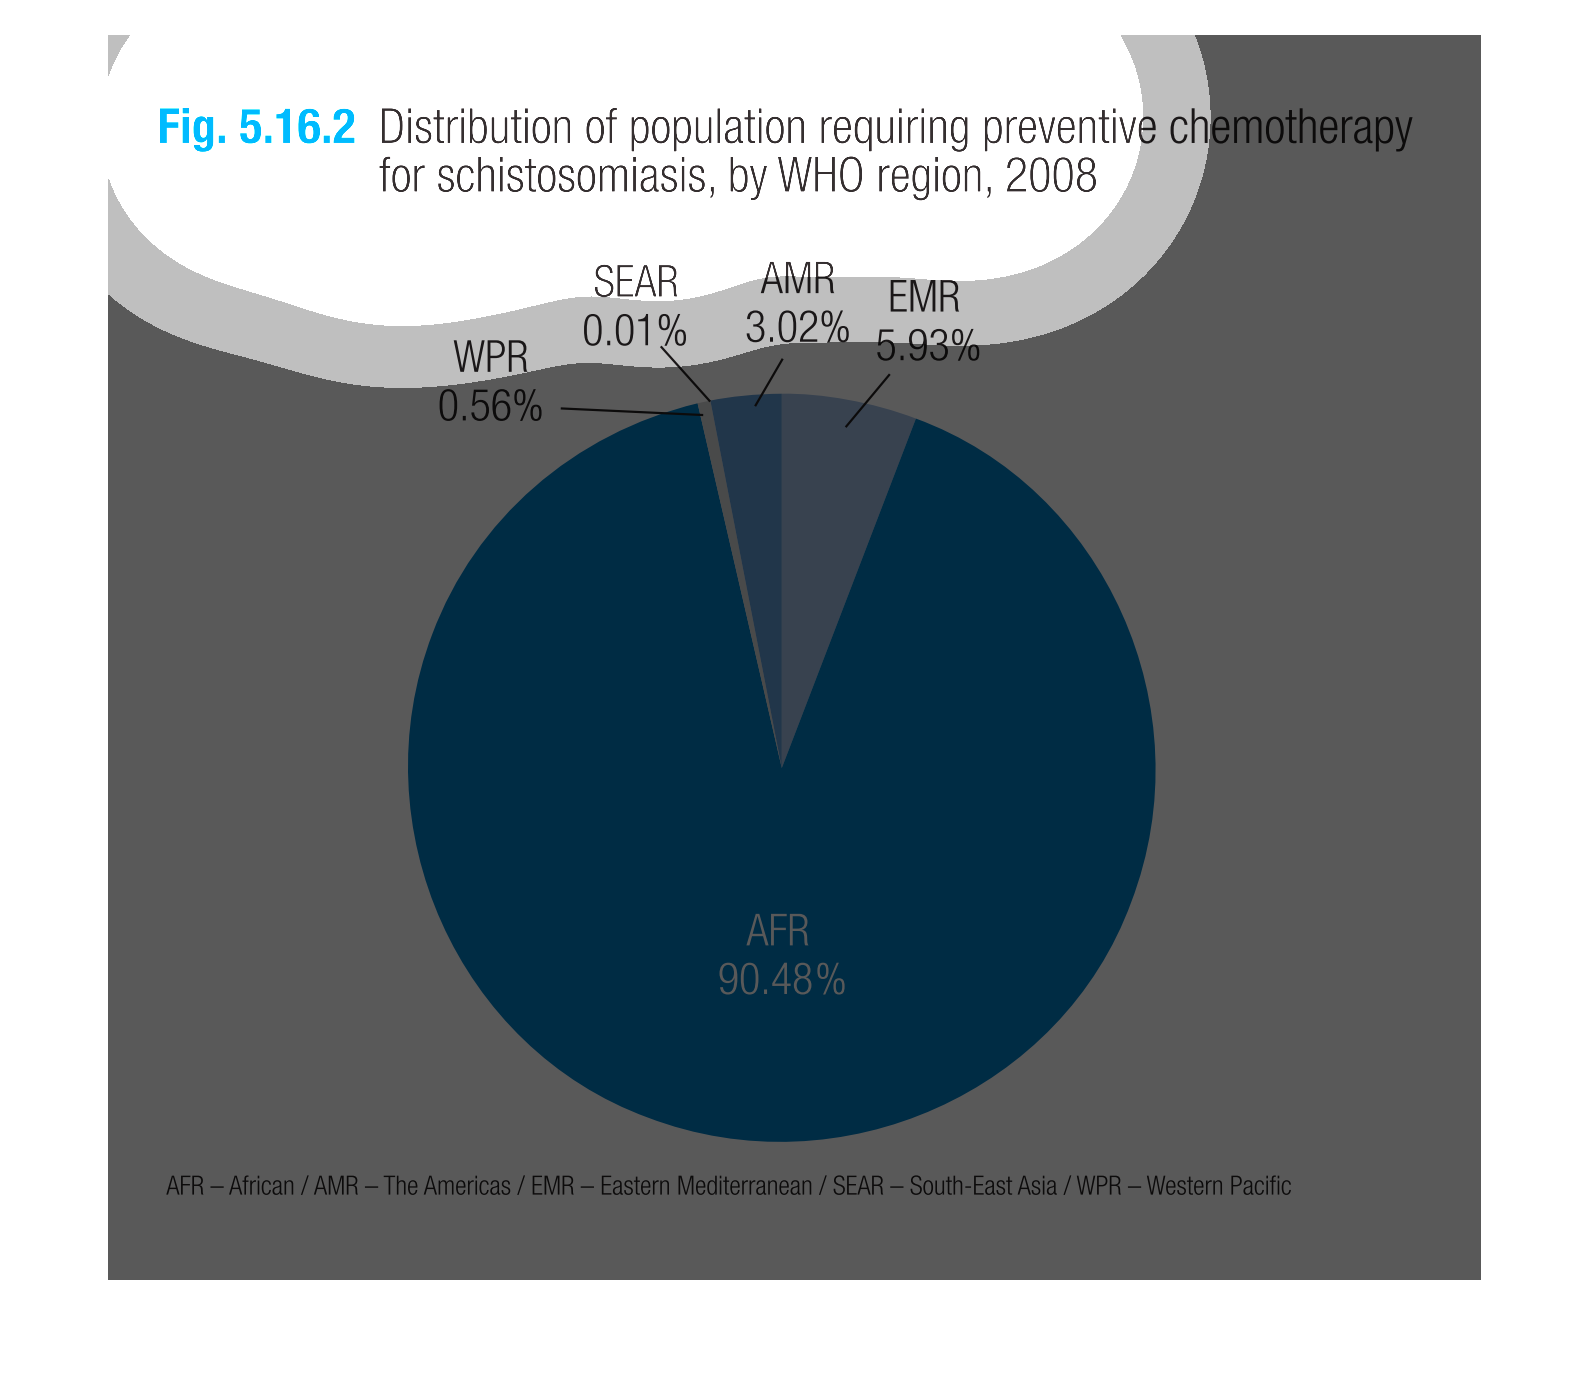
This pie chart shows the distribution of the population requiring preventative chemo for schistomiasis,
by WHO region, in 2008. Each world region is denoted on the pie chart with africa making up
90.48%.
This handmade chart shows those who need preventative chemotherapy for the disease schistocomiasis
but does not specify region or state or country.
This chart shows the distribution of the population requiring preventative chemotherapy for
schistosomiasis, as shown by the World Health Organization in 2008.

This pie chart illustrates the distribution of population requiring treatment for schistosomiasis
by WHO region in 2008.  The largest region with over 90% is AFR.
This image is a circle graph depicting the distribution of the population requiring chemotherapy
for schistosomiasis by WHO region in 2008.  Parts of the globe are listed showing the percentage
of cases applicable to that area.  They are then arranged accordingly in the graph.