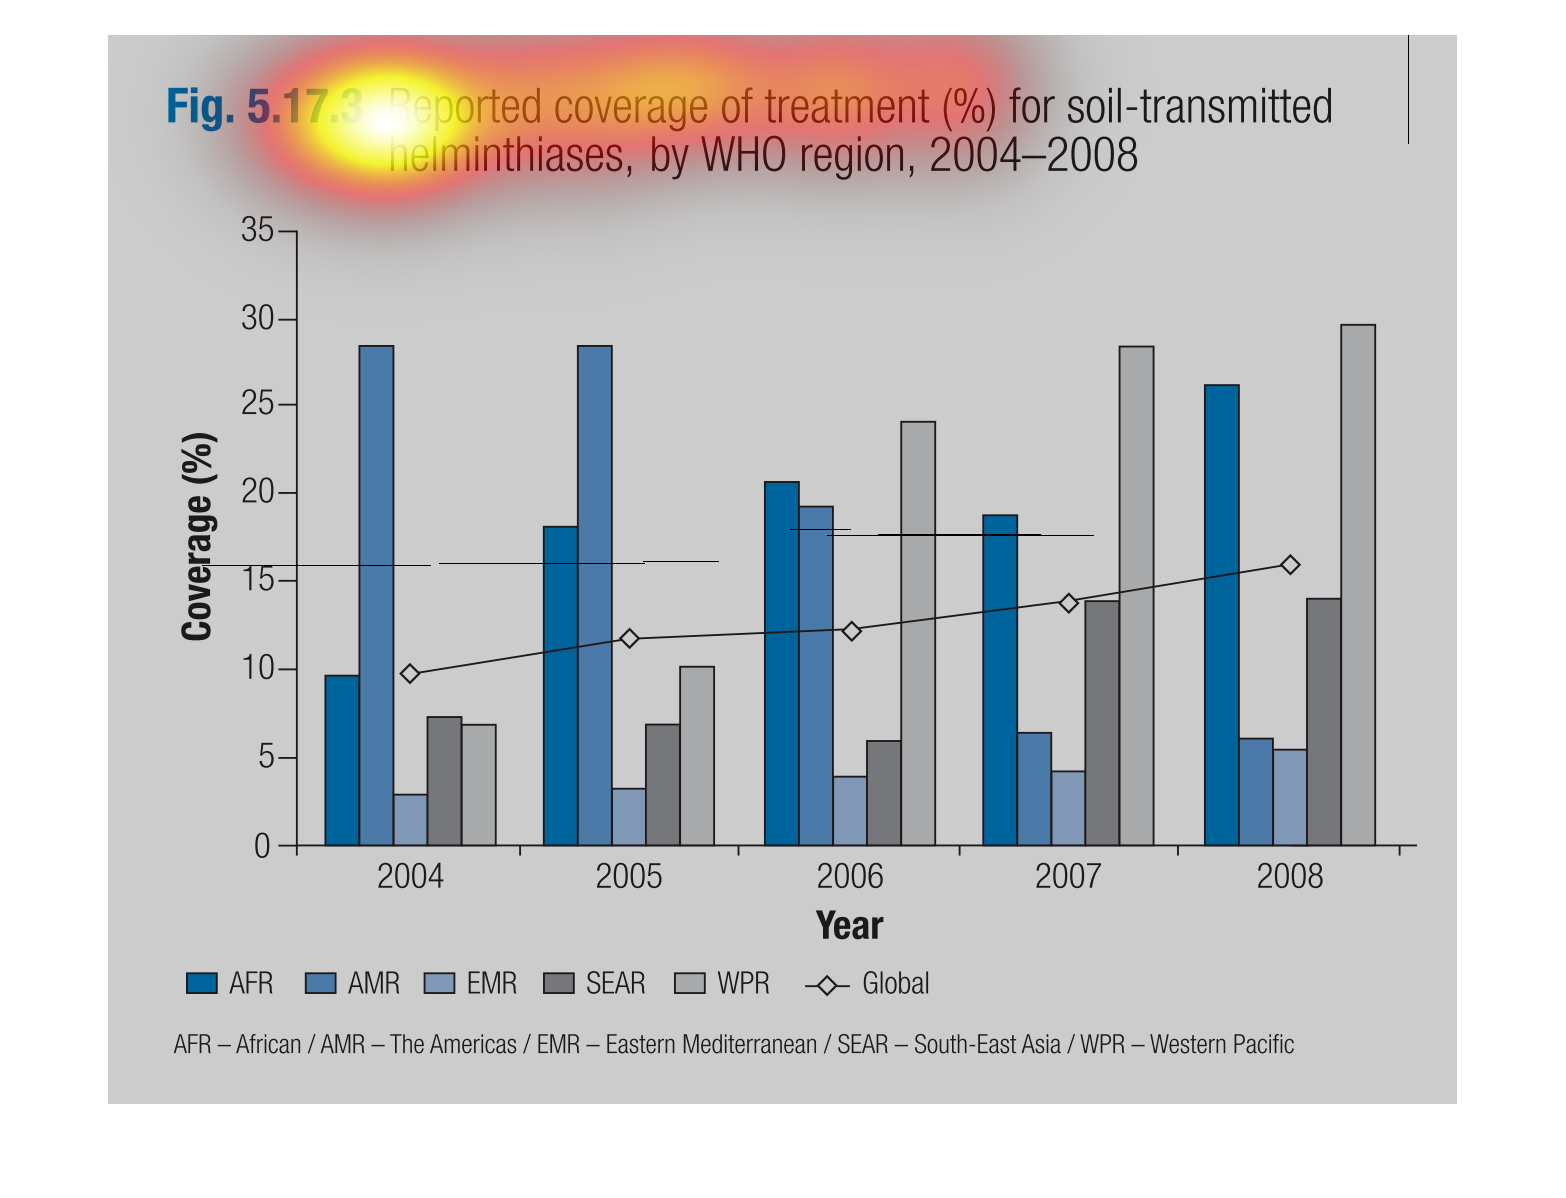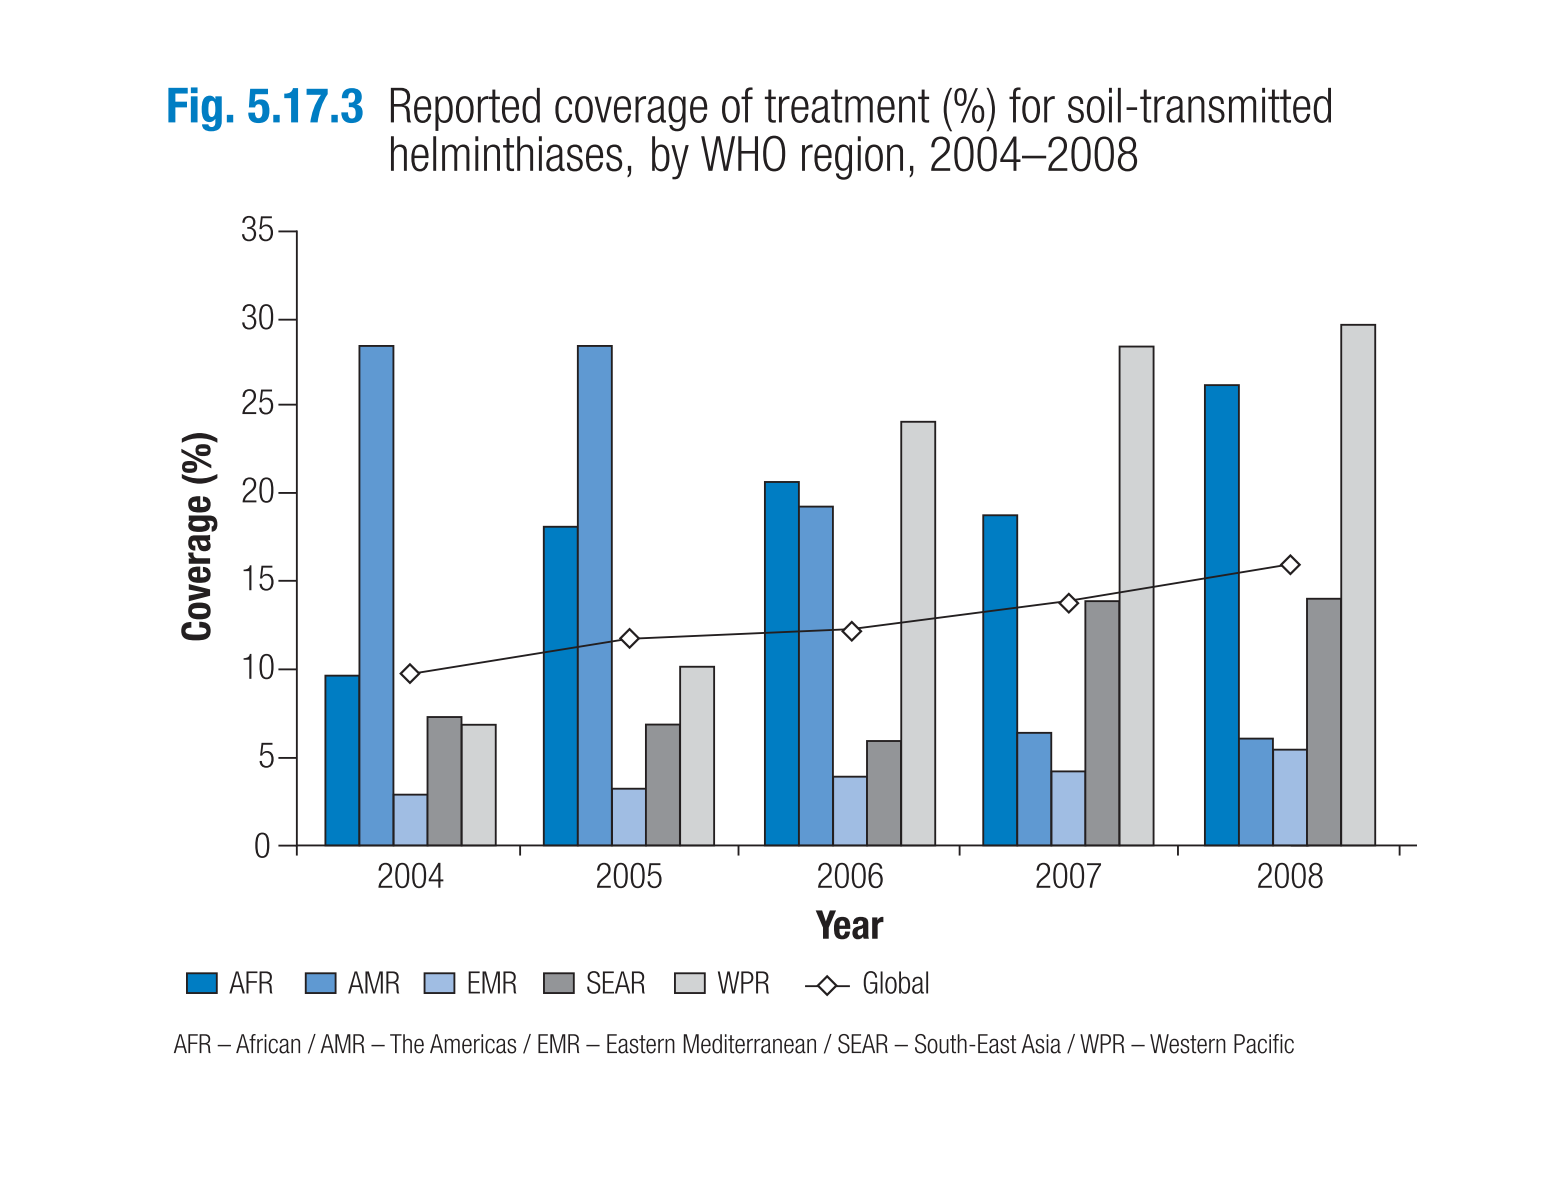
 This chart represents the reported coverage of the treatment% for the soil-transmitted helminthiases
by WHO region from 2004-2008. Height of the bars represent the %, while each chart is color
coded by regions.

This graph shows the treatment rates for a soil transmitted disease. Across the years, the
rates increased for Africa and the Western Pacific and decreased for the Americas.
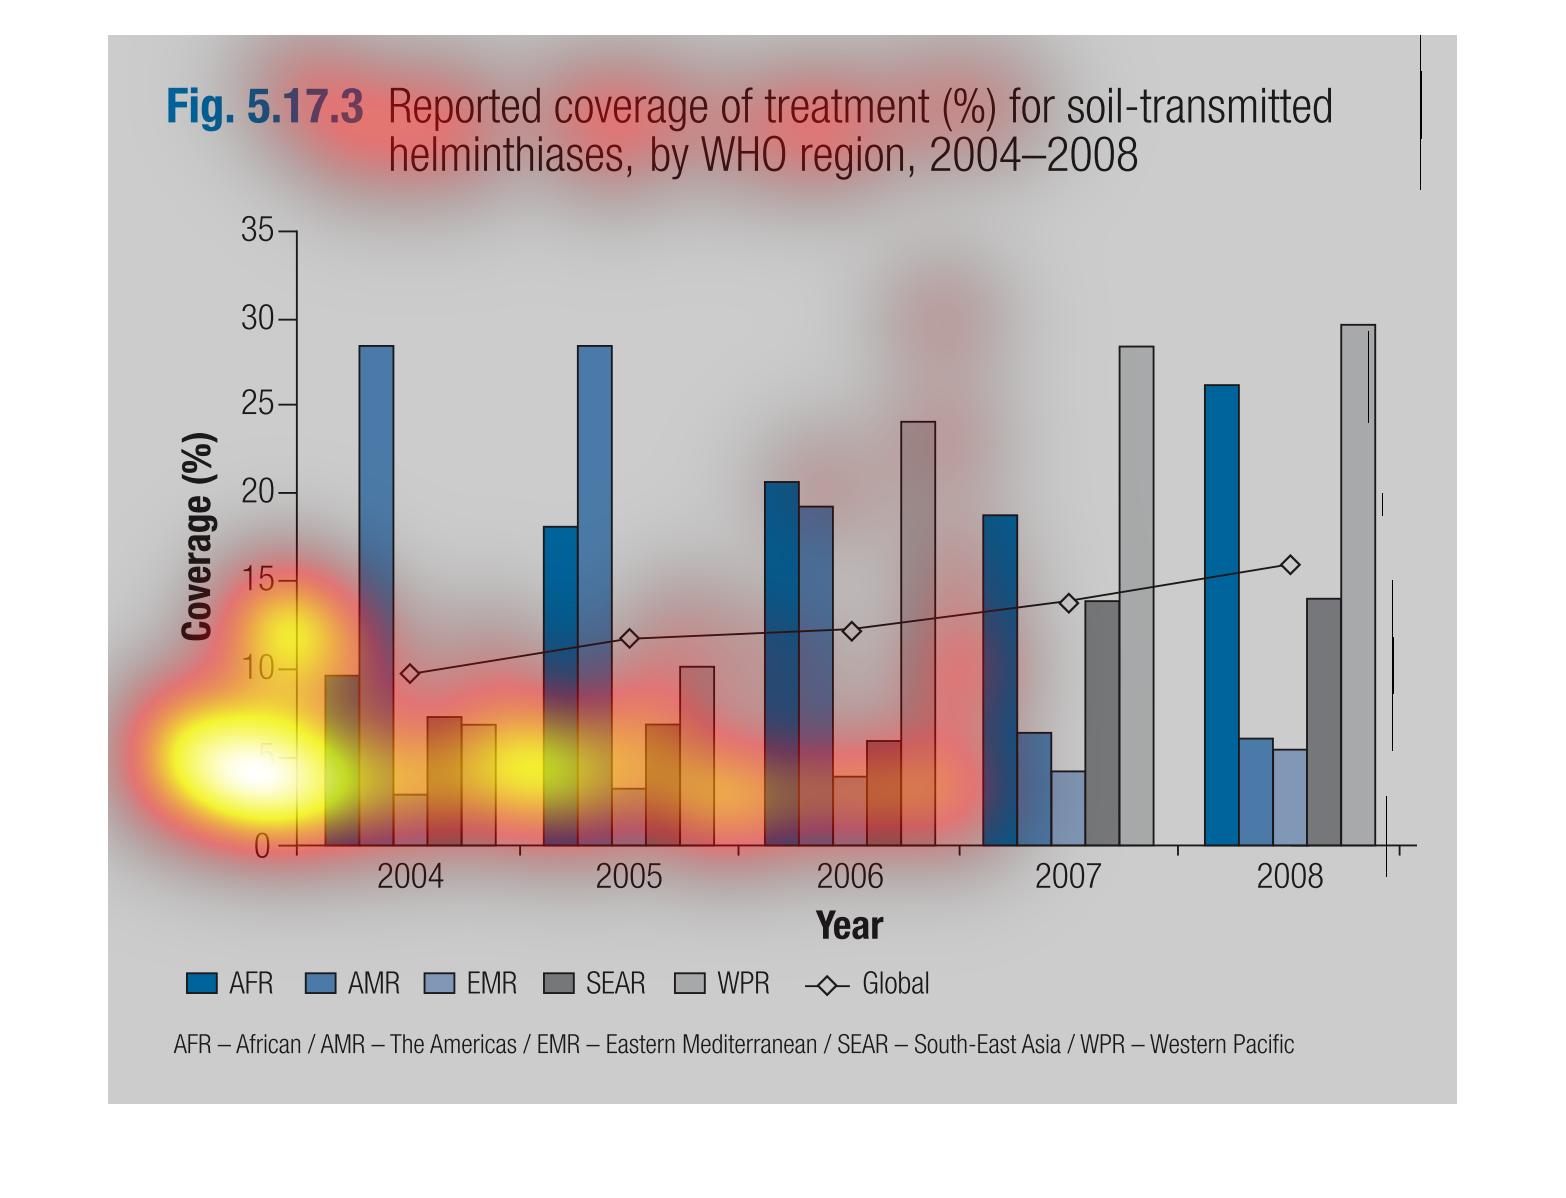
This is a graph of the reported coverage of treatment for soil transmitted helminthiases by
WHO region. AFR had the most coverage in 2004 and 2005. This switched to  SEAR in 2006 through
2008.
This is a series of bar graphs depicting the reported coverage of treatment percentage for
soil-transmitted helminthiases by WHO region from the years 2004-2008.
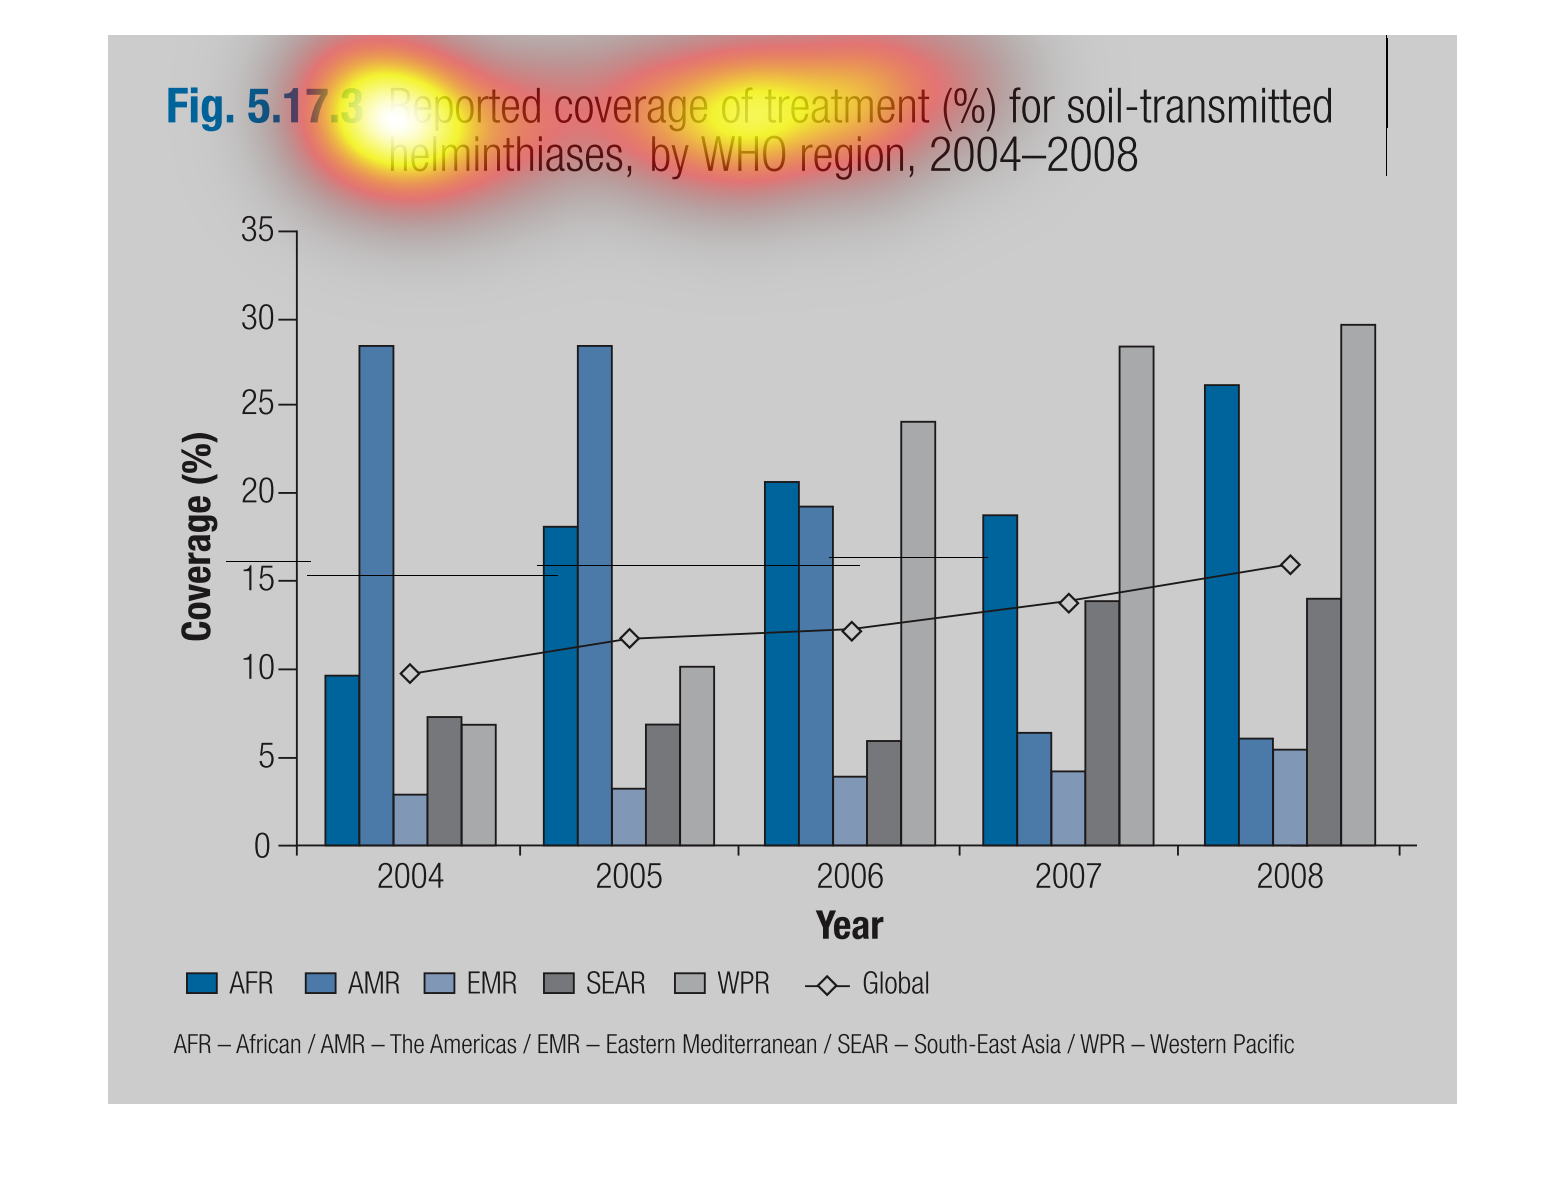
The image on the left hand side is displaying columns charts of each continents percentage
of the reported coverage treatment in percentage terms of soil transmitted helminthiases from
2004 through 2008.  From the data collected, the "best fit line" shows that these percentage
of the soil has been slowly increasing globally across the continents.
This chart shows the percentage of reported coverage of treatment for soil- transmitted helminthiases.
In 2006, Eastern Mediterranean, was high for 2 years.
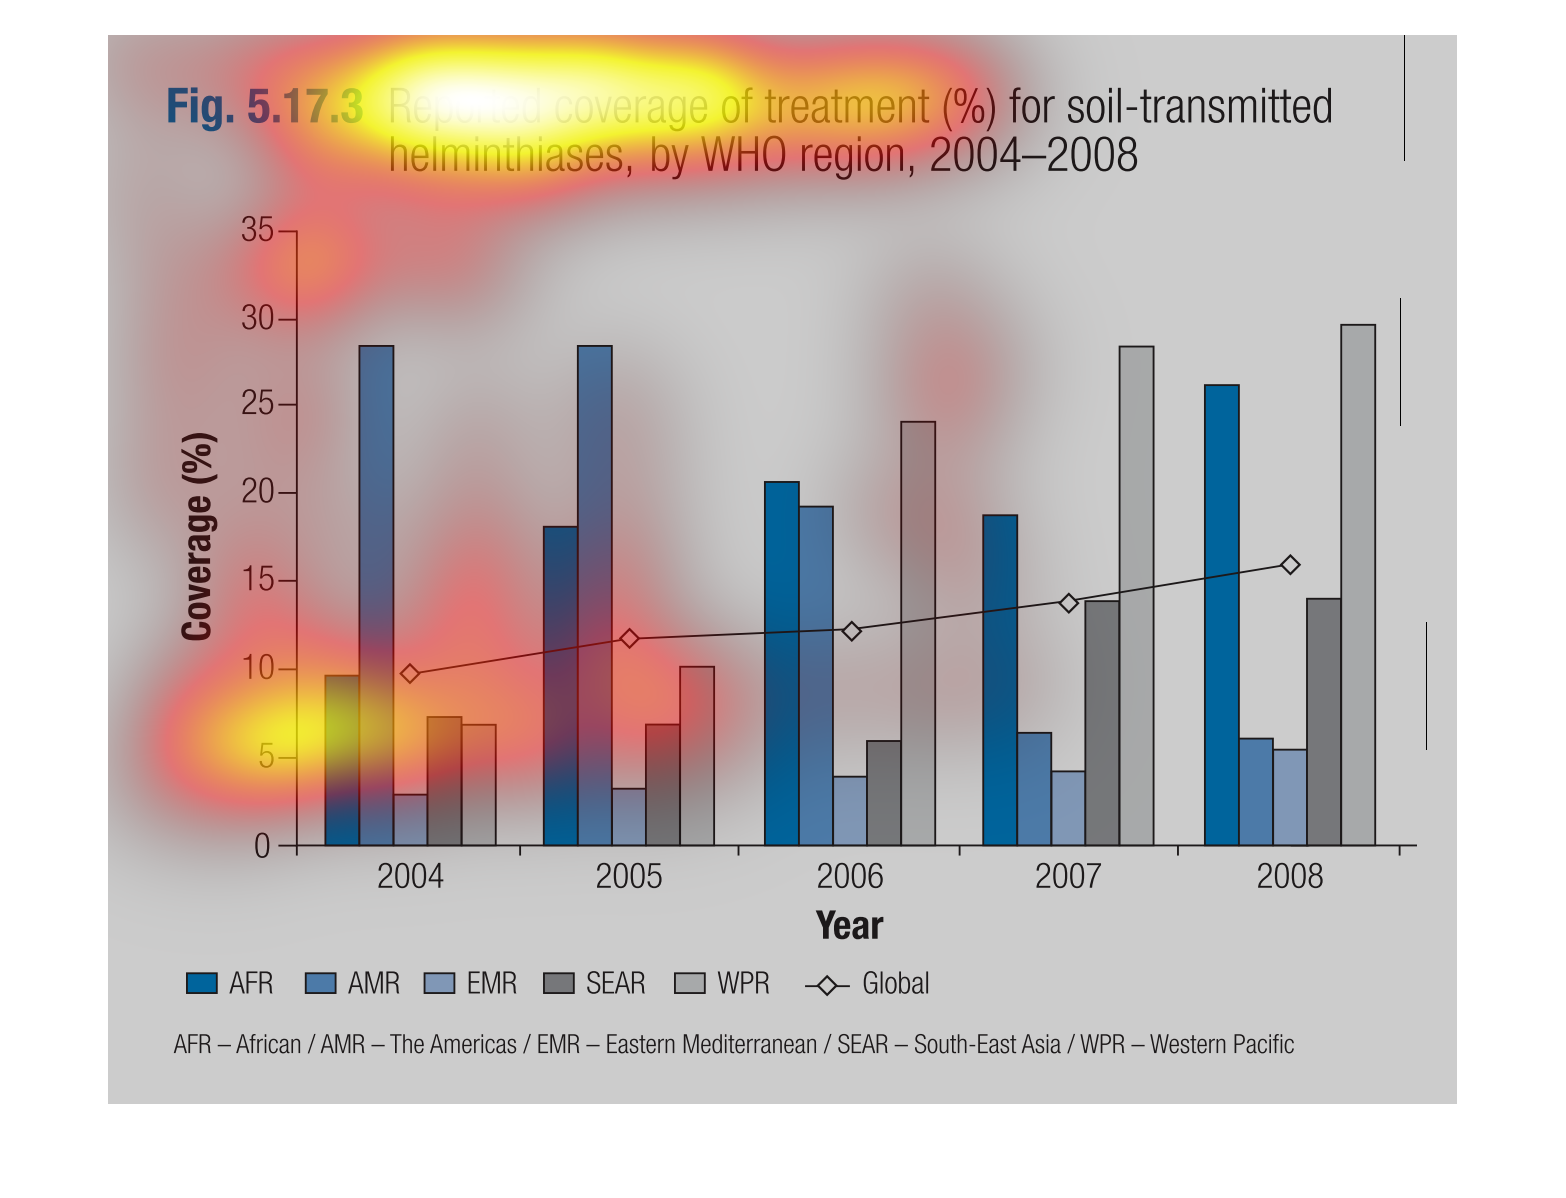
This chart describes reported coverage of treatment (%) for soil-transmitted helminthiases,
by WHO region, for the years 2004 through to the year 2008.
This graph compares the amount of coverage of a soil transmitted helminthiasis over the course
of 5 years. It compares the percent coverage of different regions including Africa and the
Americas. This graph is based on data reported by the WHO.
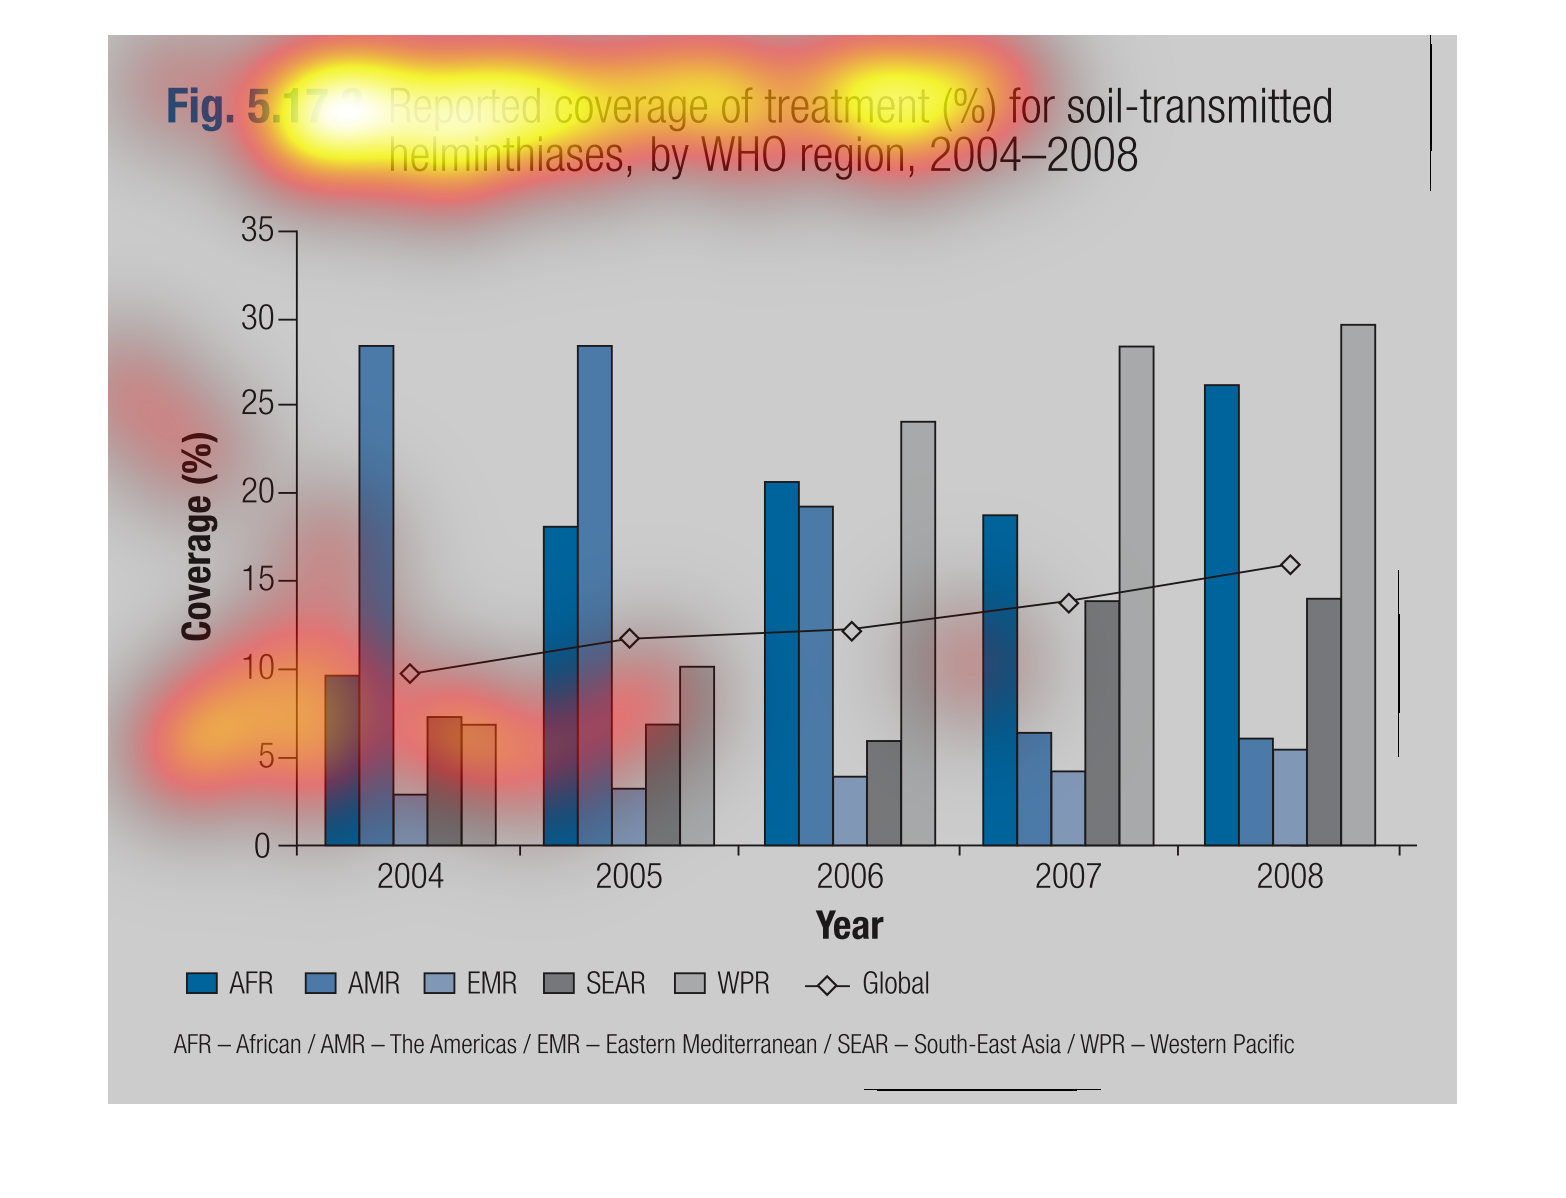
This info graph summarizes the coverage of treatment of a disease that's found in the soil.
It's broken down by year and we can see the fluctuations over time.
Reported coverage of treatment for soil transmitted helminthiasis, by WHO region 2004-2007.
Helminthiasis (plural helminthiases) also known as worm infection, is any macroparasitic disease
of humans and other animals in which a part of the body is infected with parasitic worms,
known as helminths.
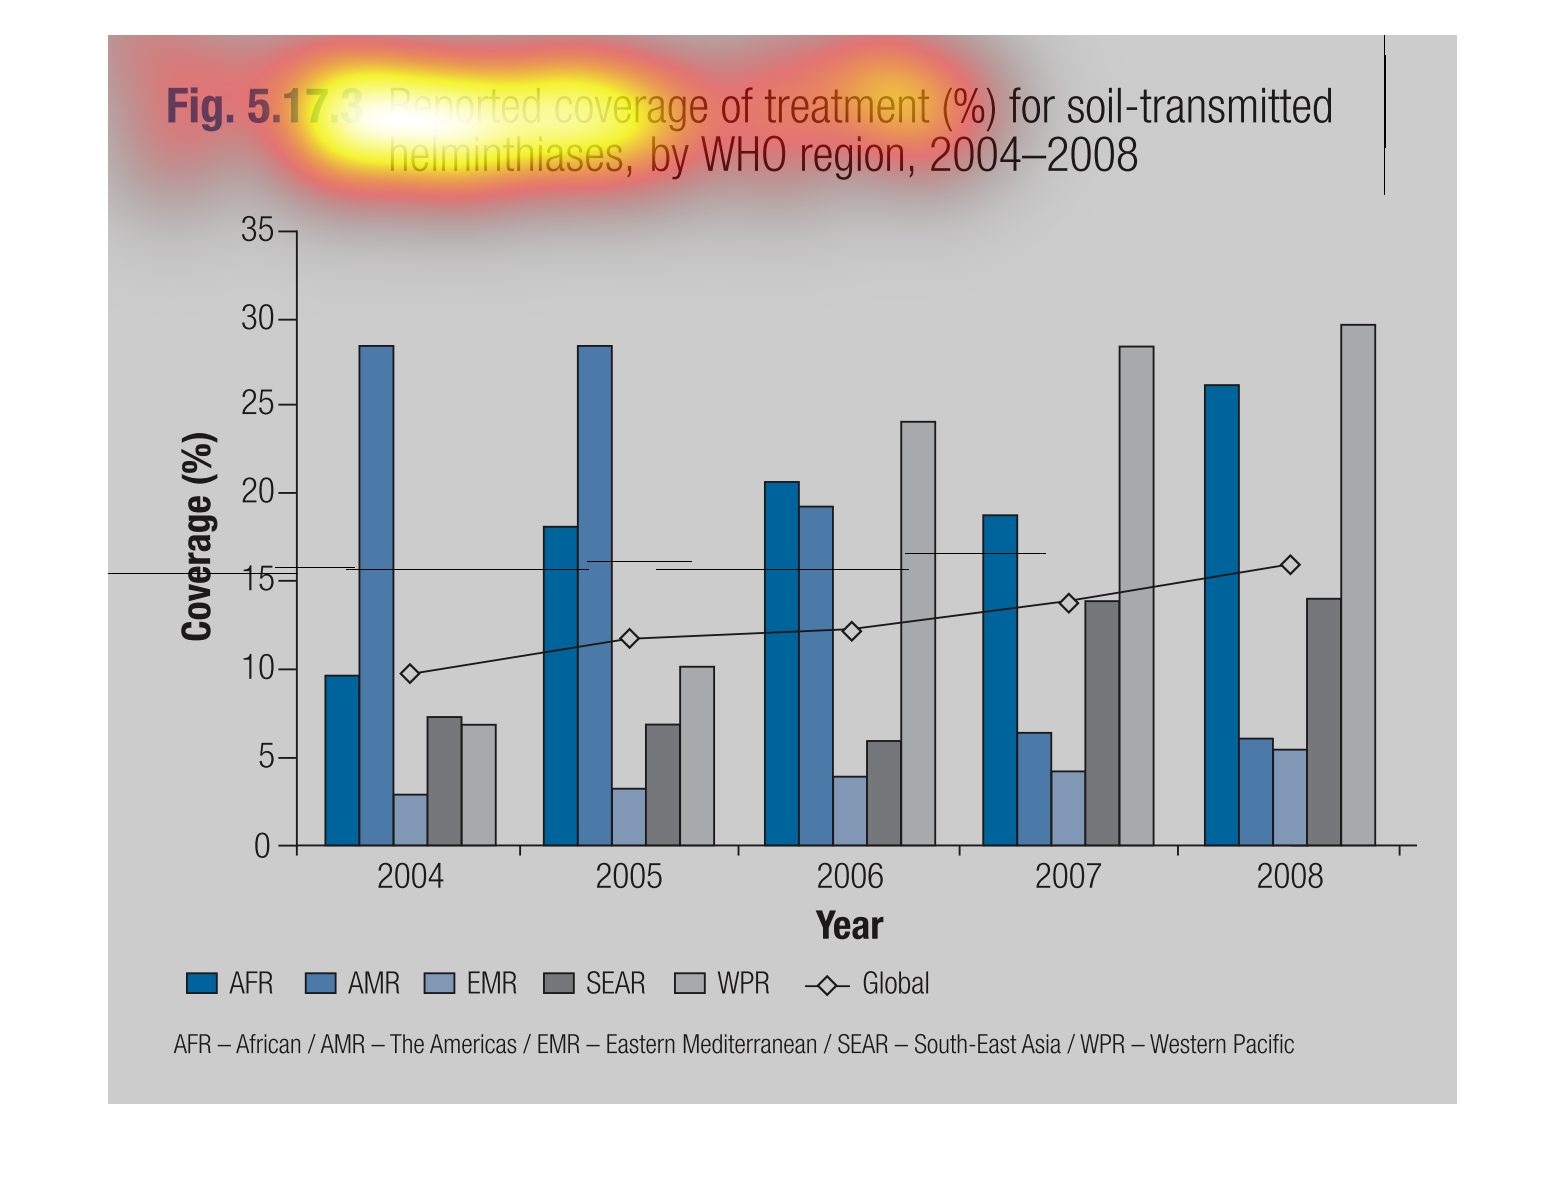
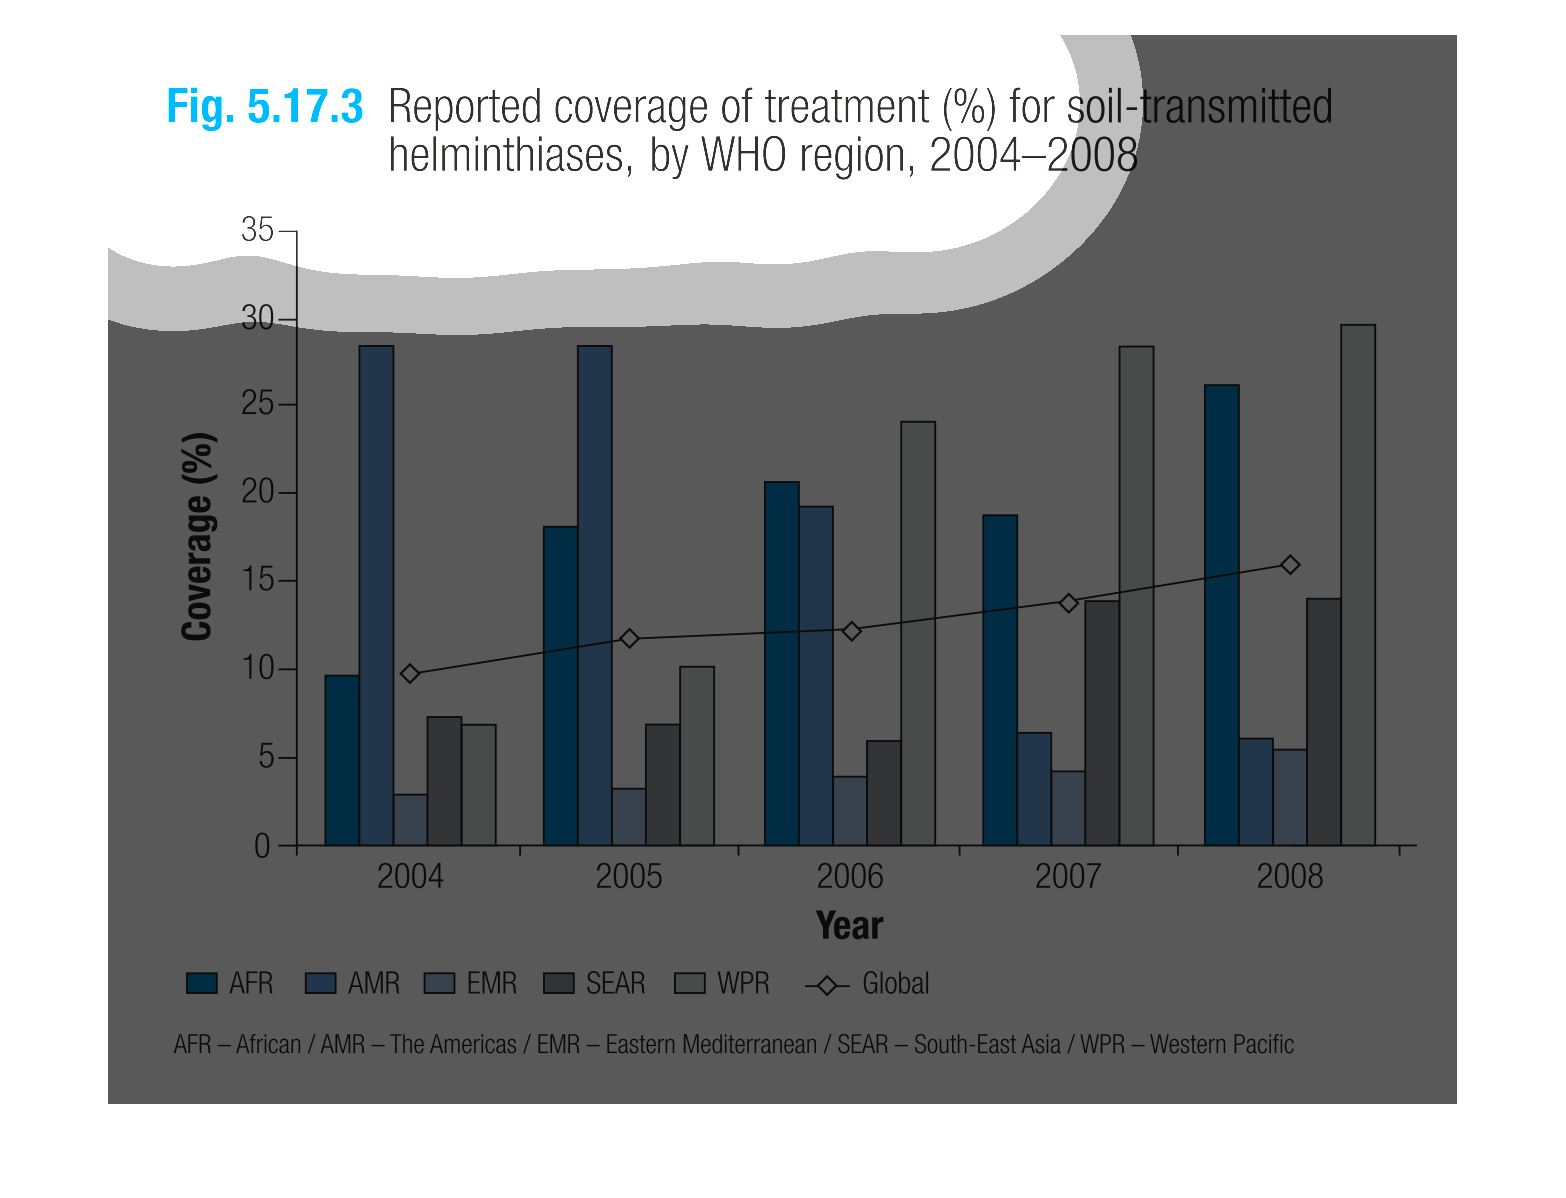
The following bar chart gives the reported coverage of treatment for soil transmitted helminthiases
by the world health organization in the year 2004-2008
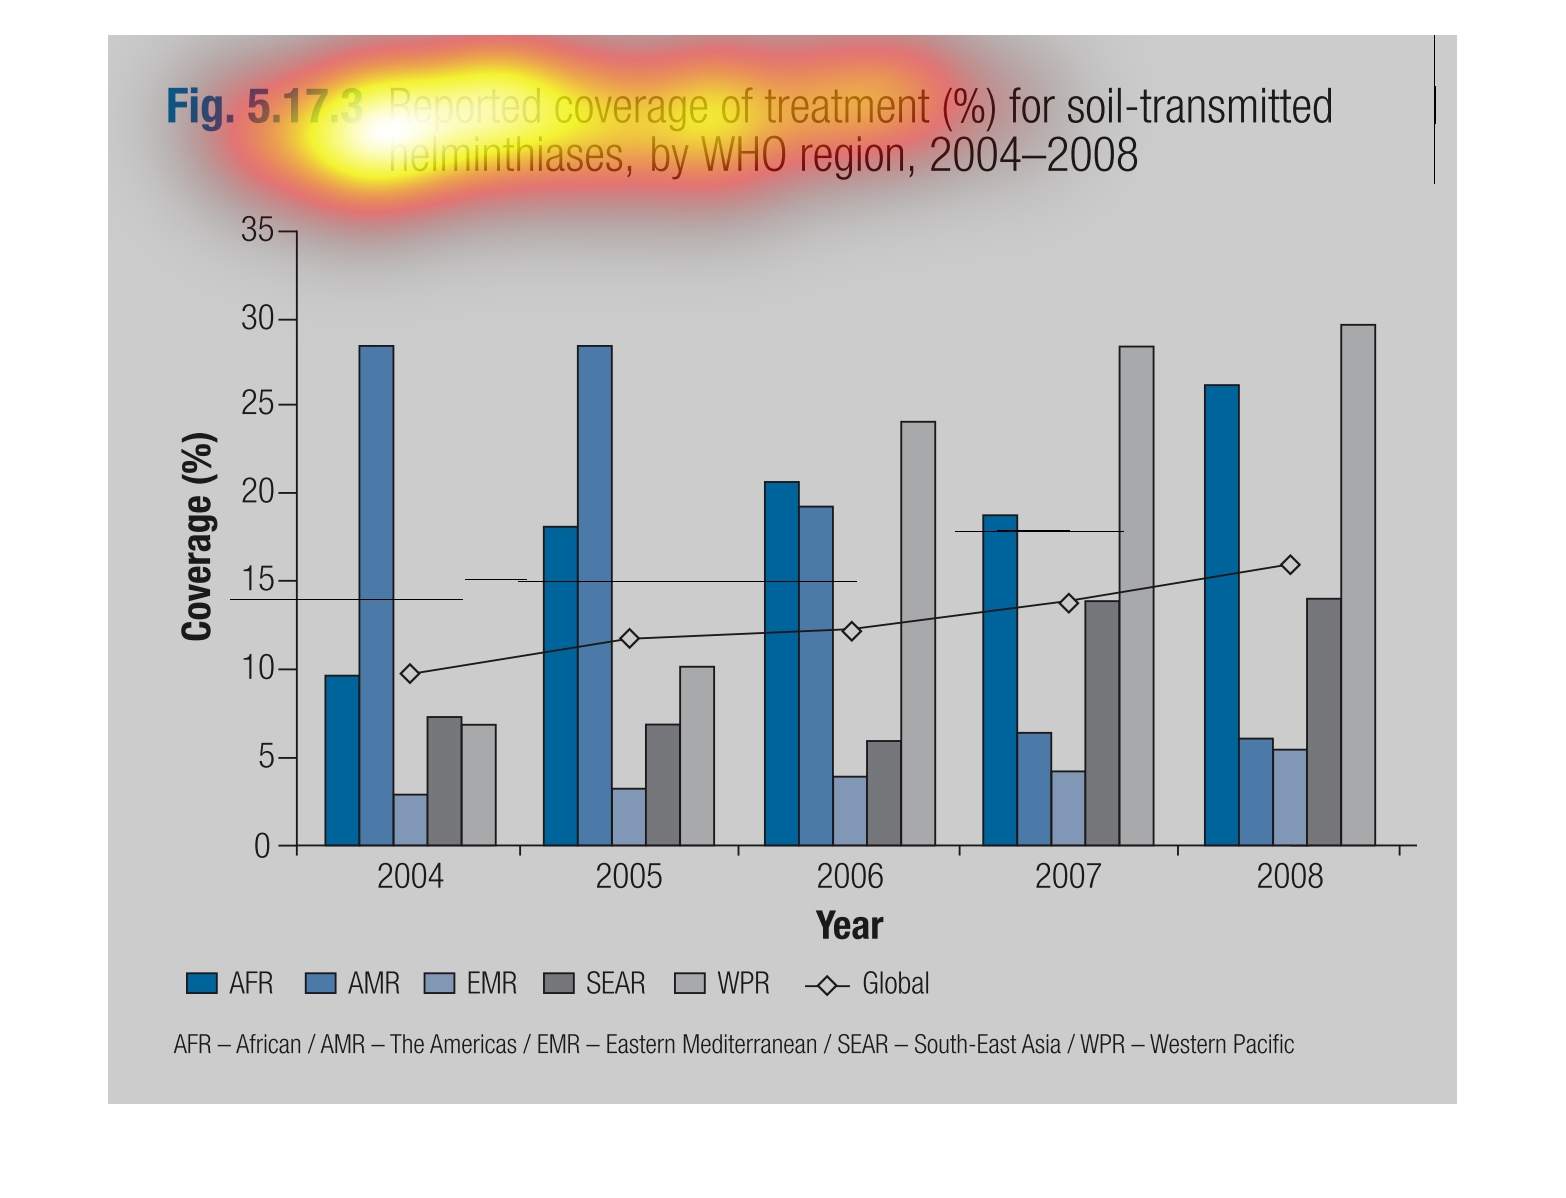
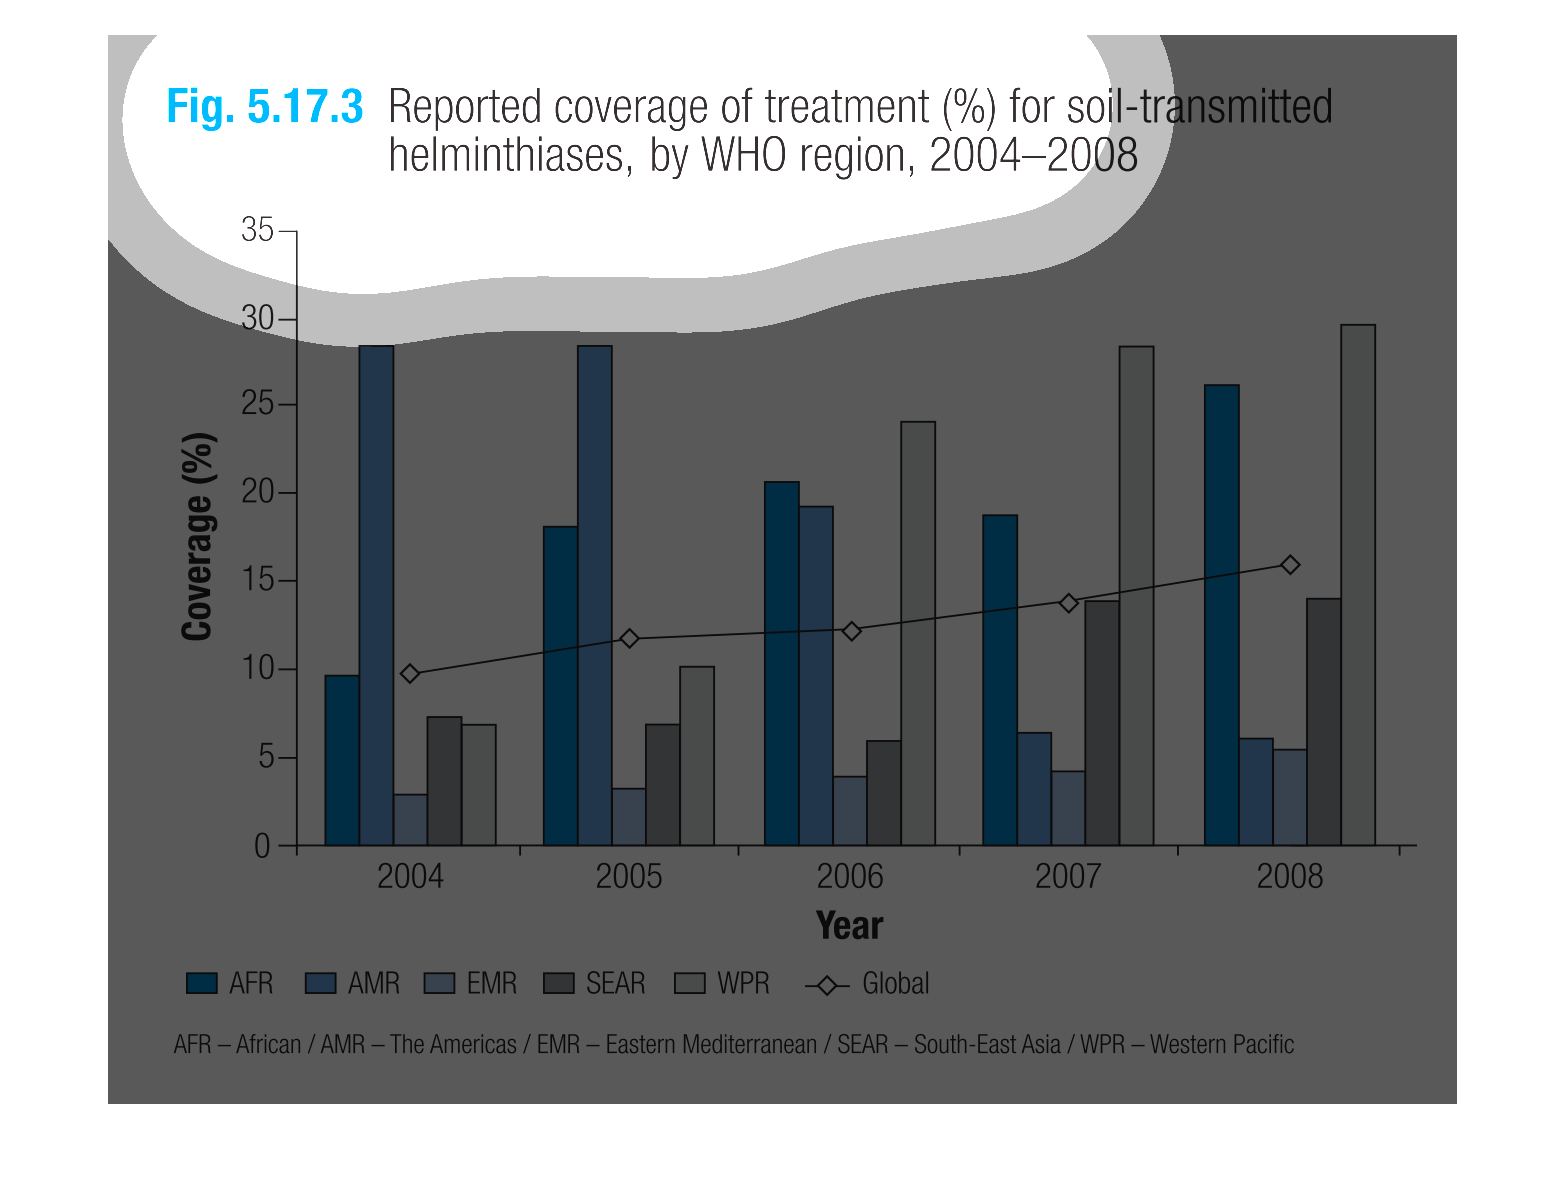
This chart describes reported coverage of treatment (%) for soil-transmitted helminthiases,
by WHO region, for the years 2004 through to the year 2008.
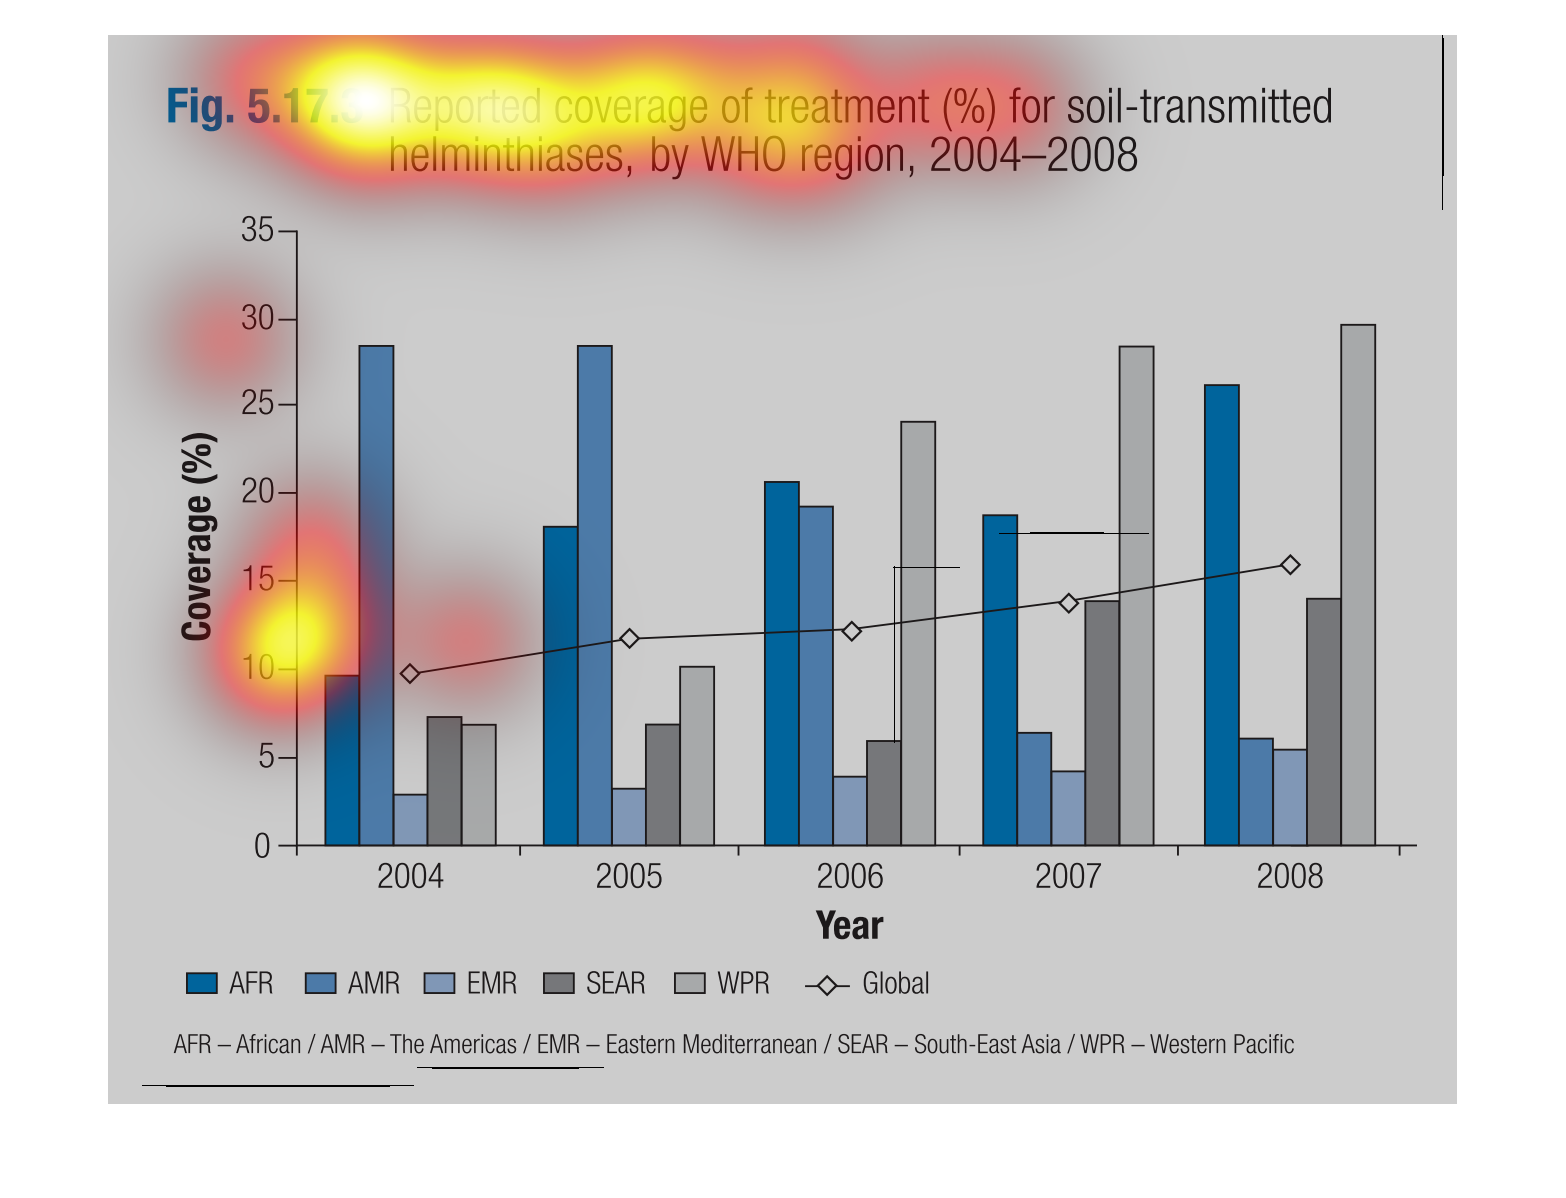
This graph represents the reported coverage of treatment for soil transmitted helminthiasis
by WHO region from 2004 to 2008.  It has the percentage of coverage in bar graphs for year
clusters.
This handmade chart shows the average treatment for soil transmitted helminthiasis. But other
than that I have no idea what this chart is about.