Warning: Image is too big to fit on screen; displaying at 67%
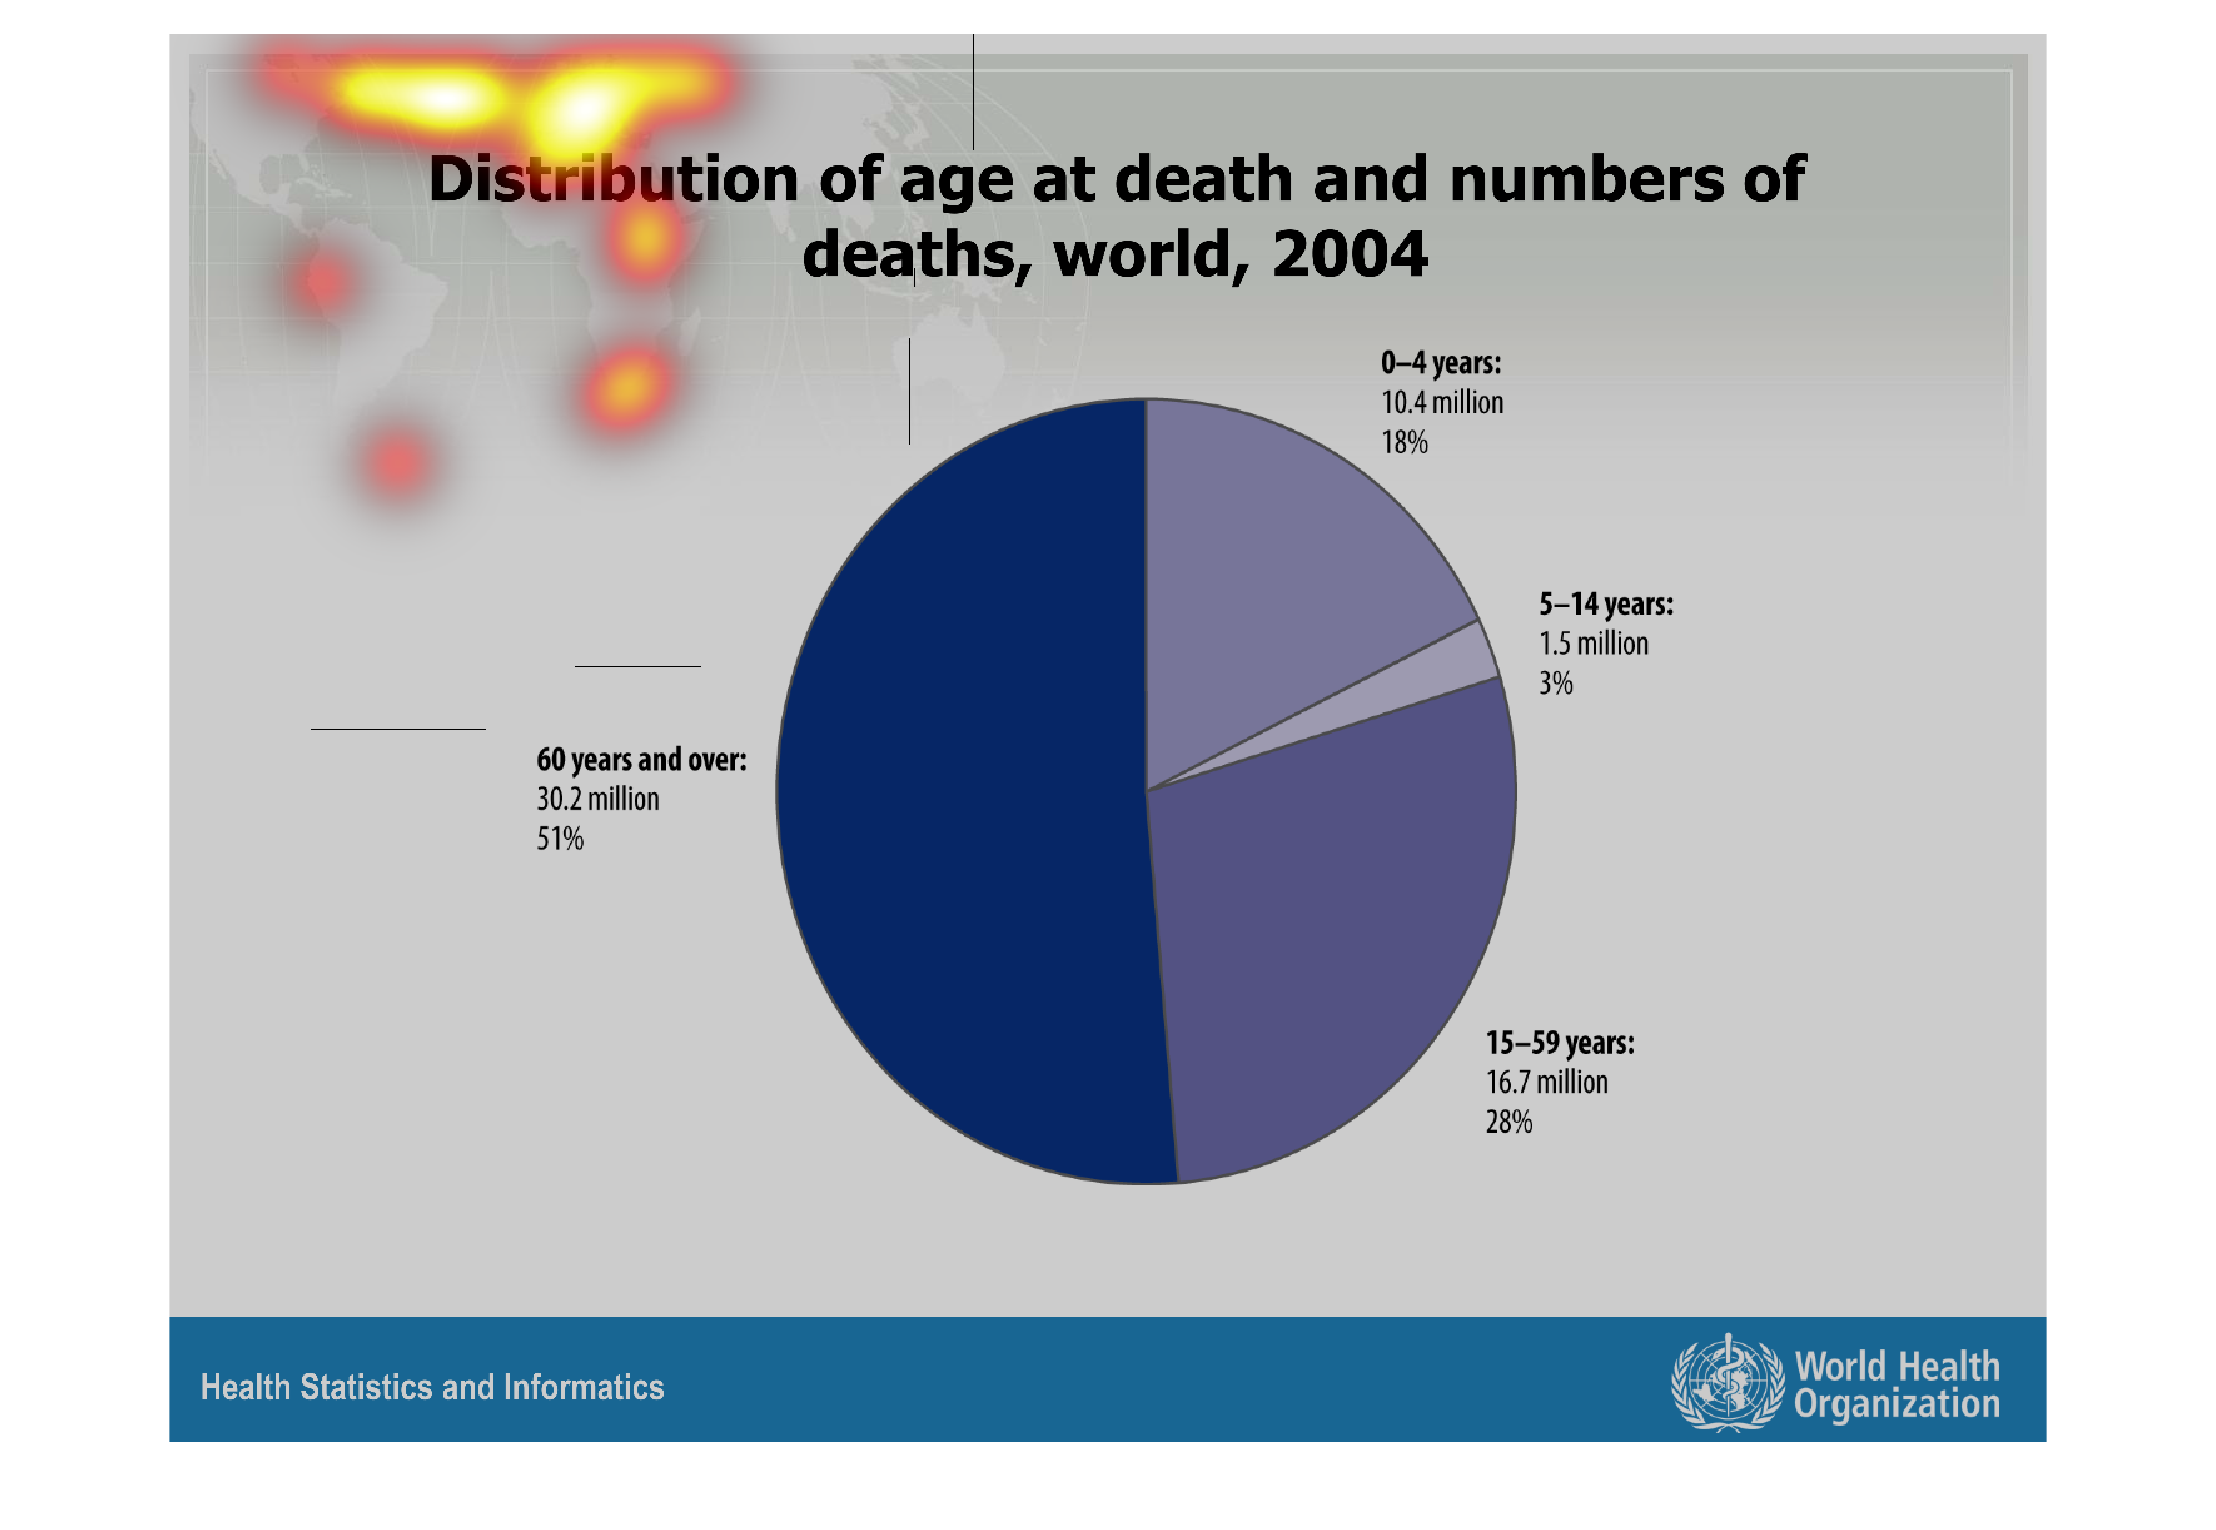
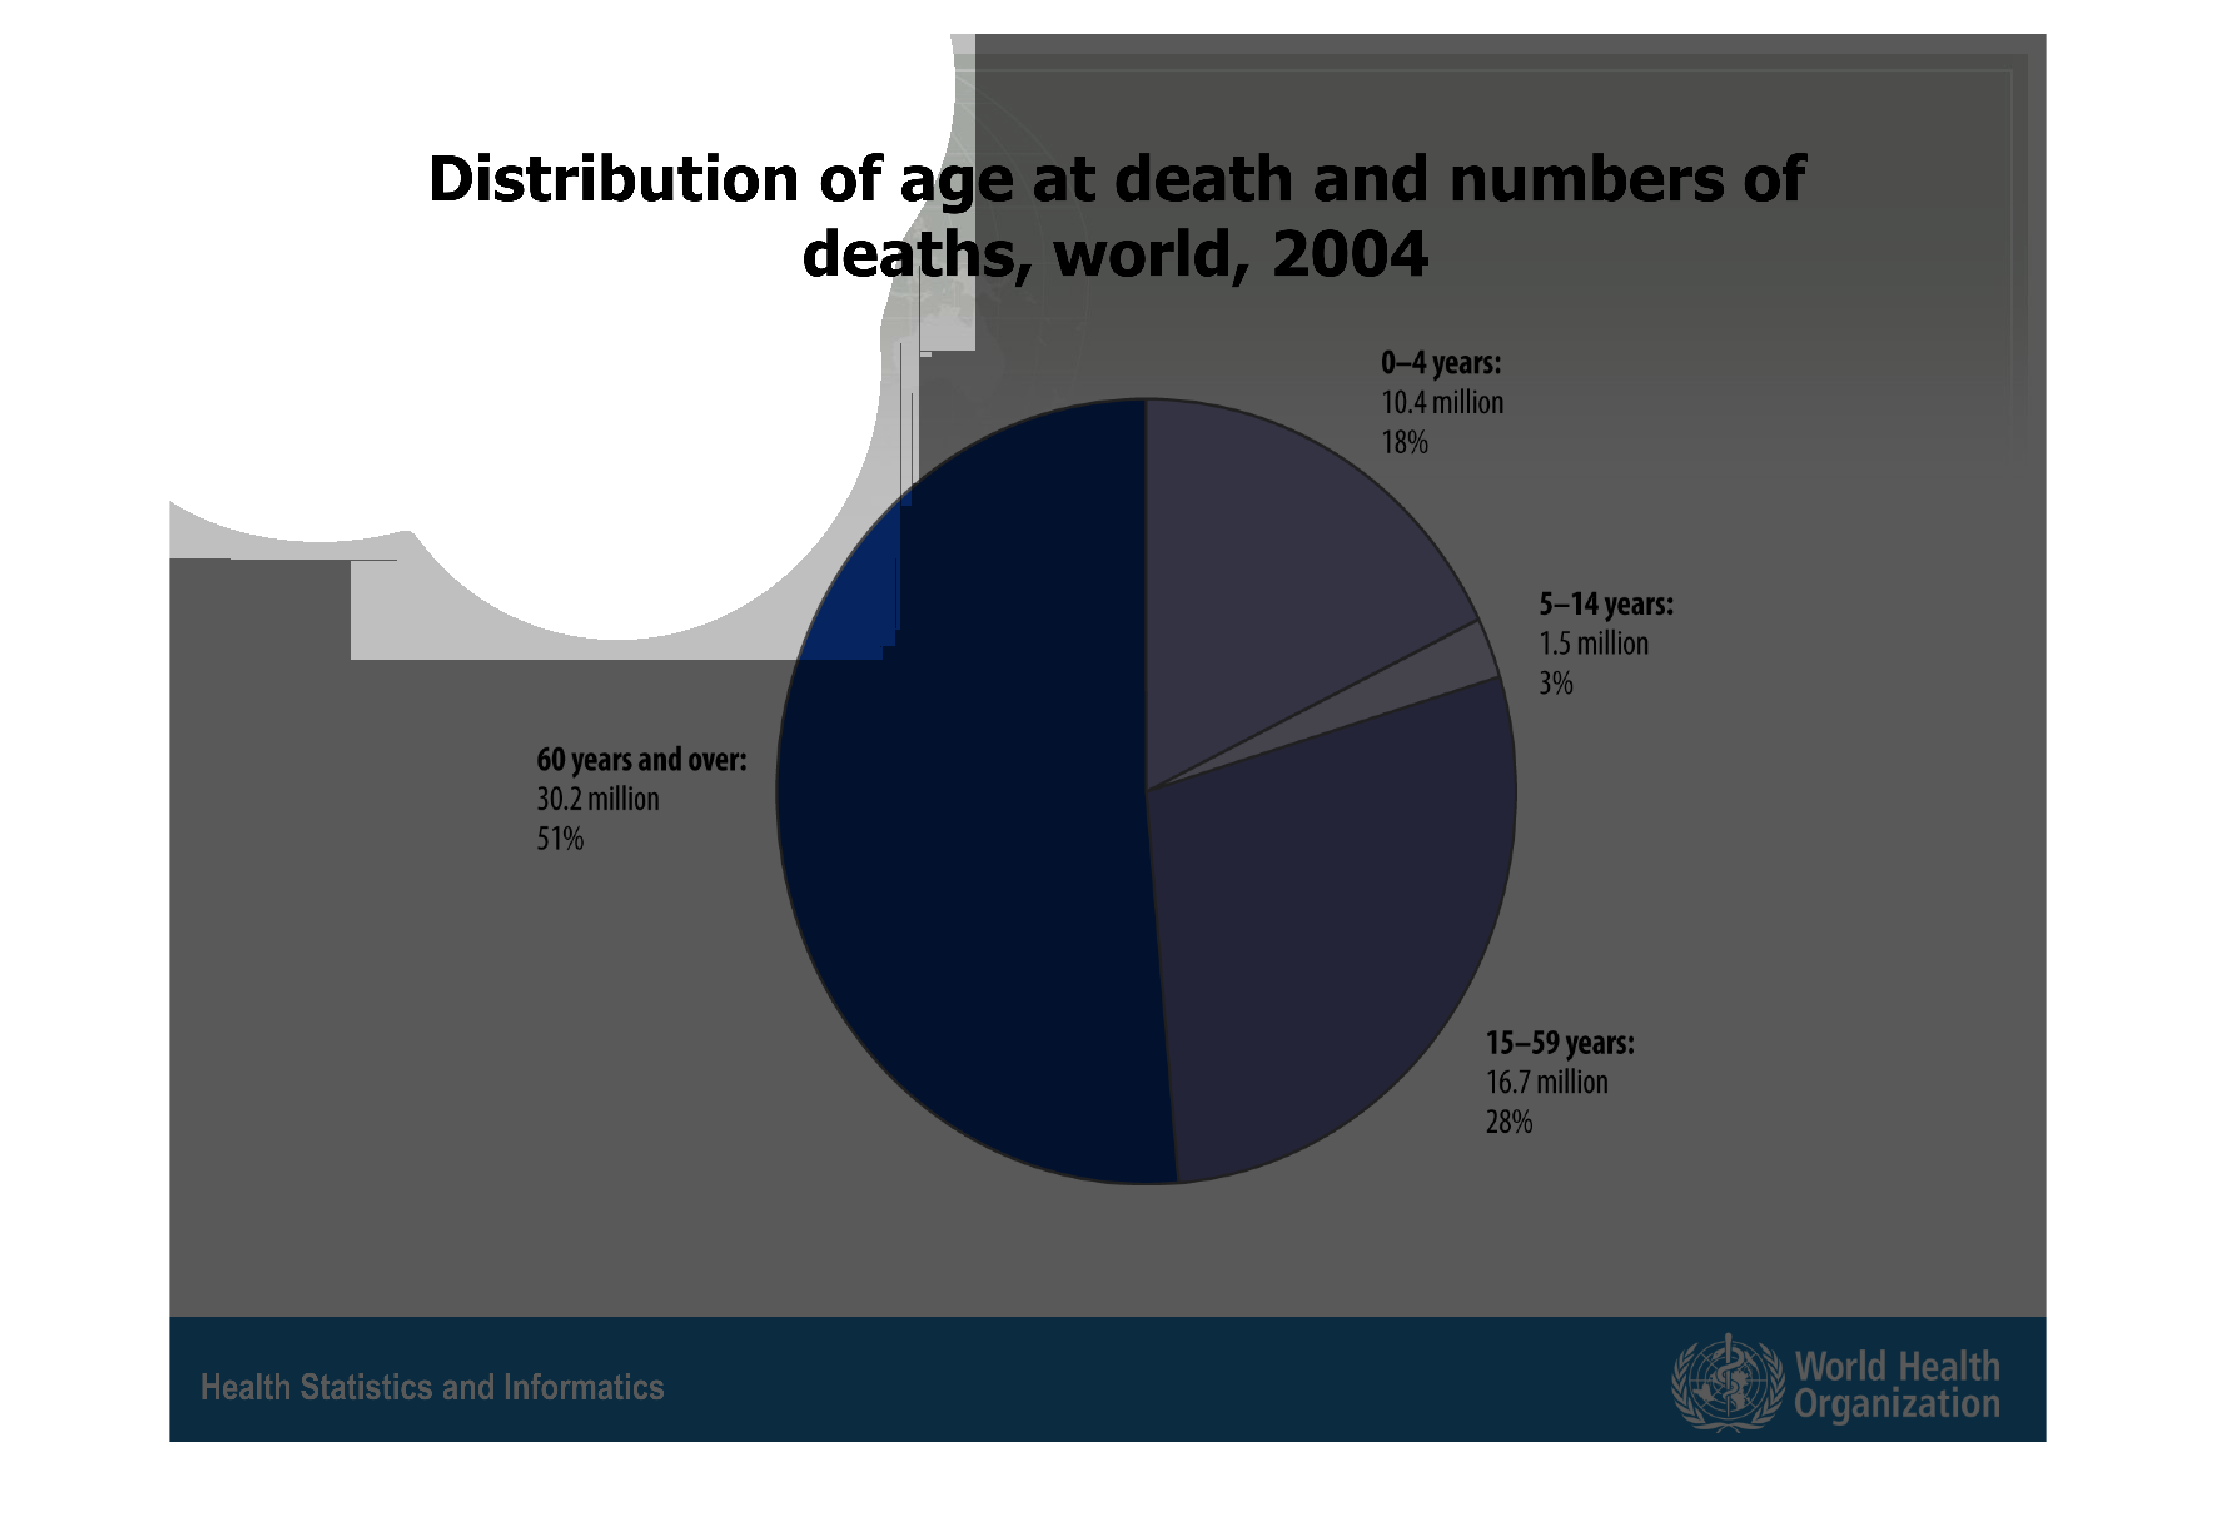
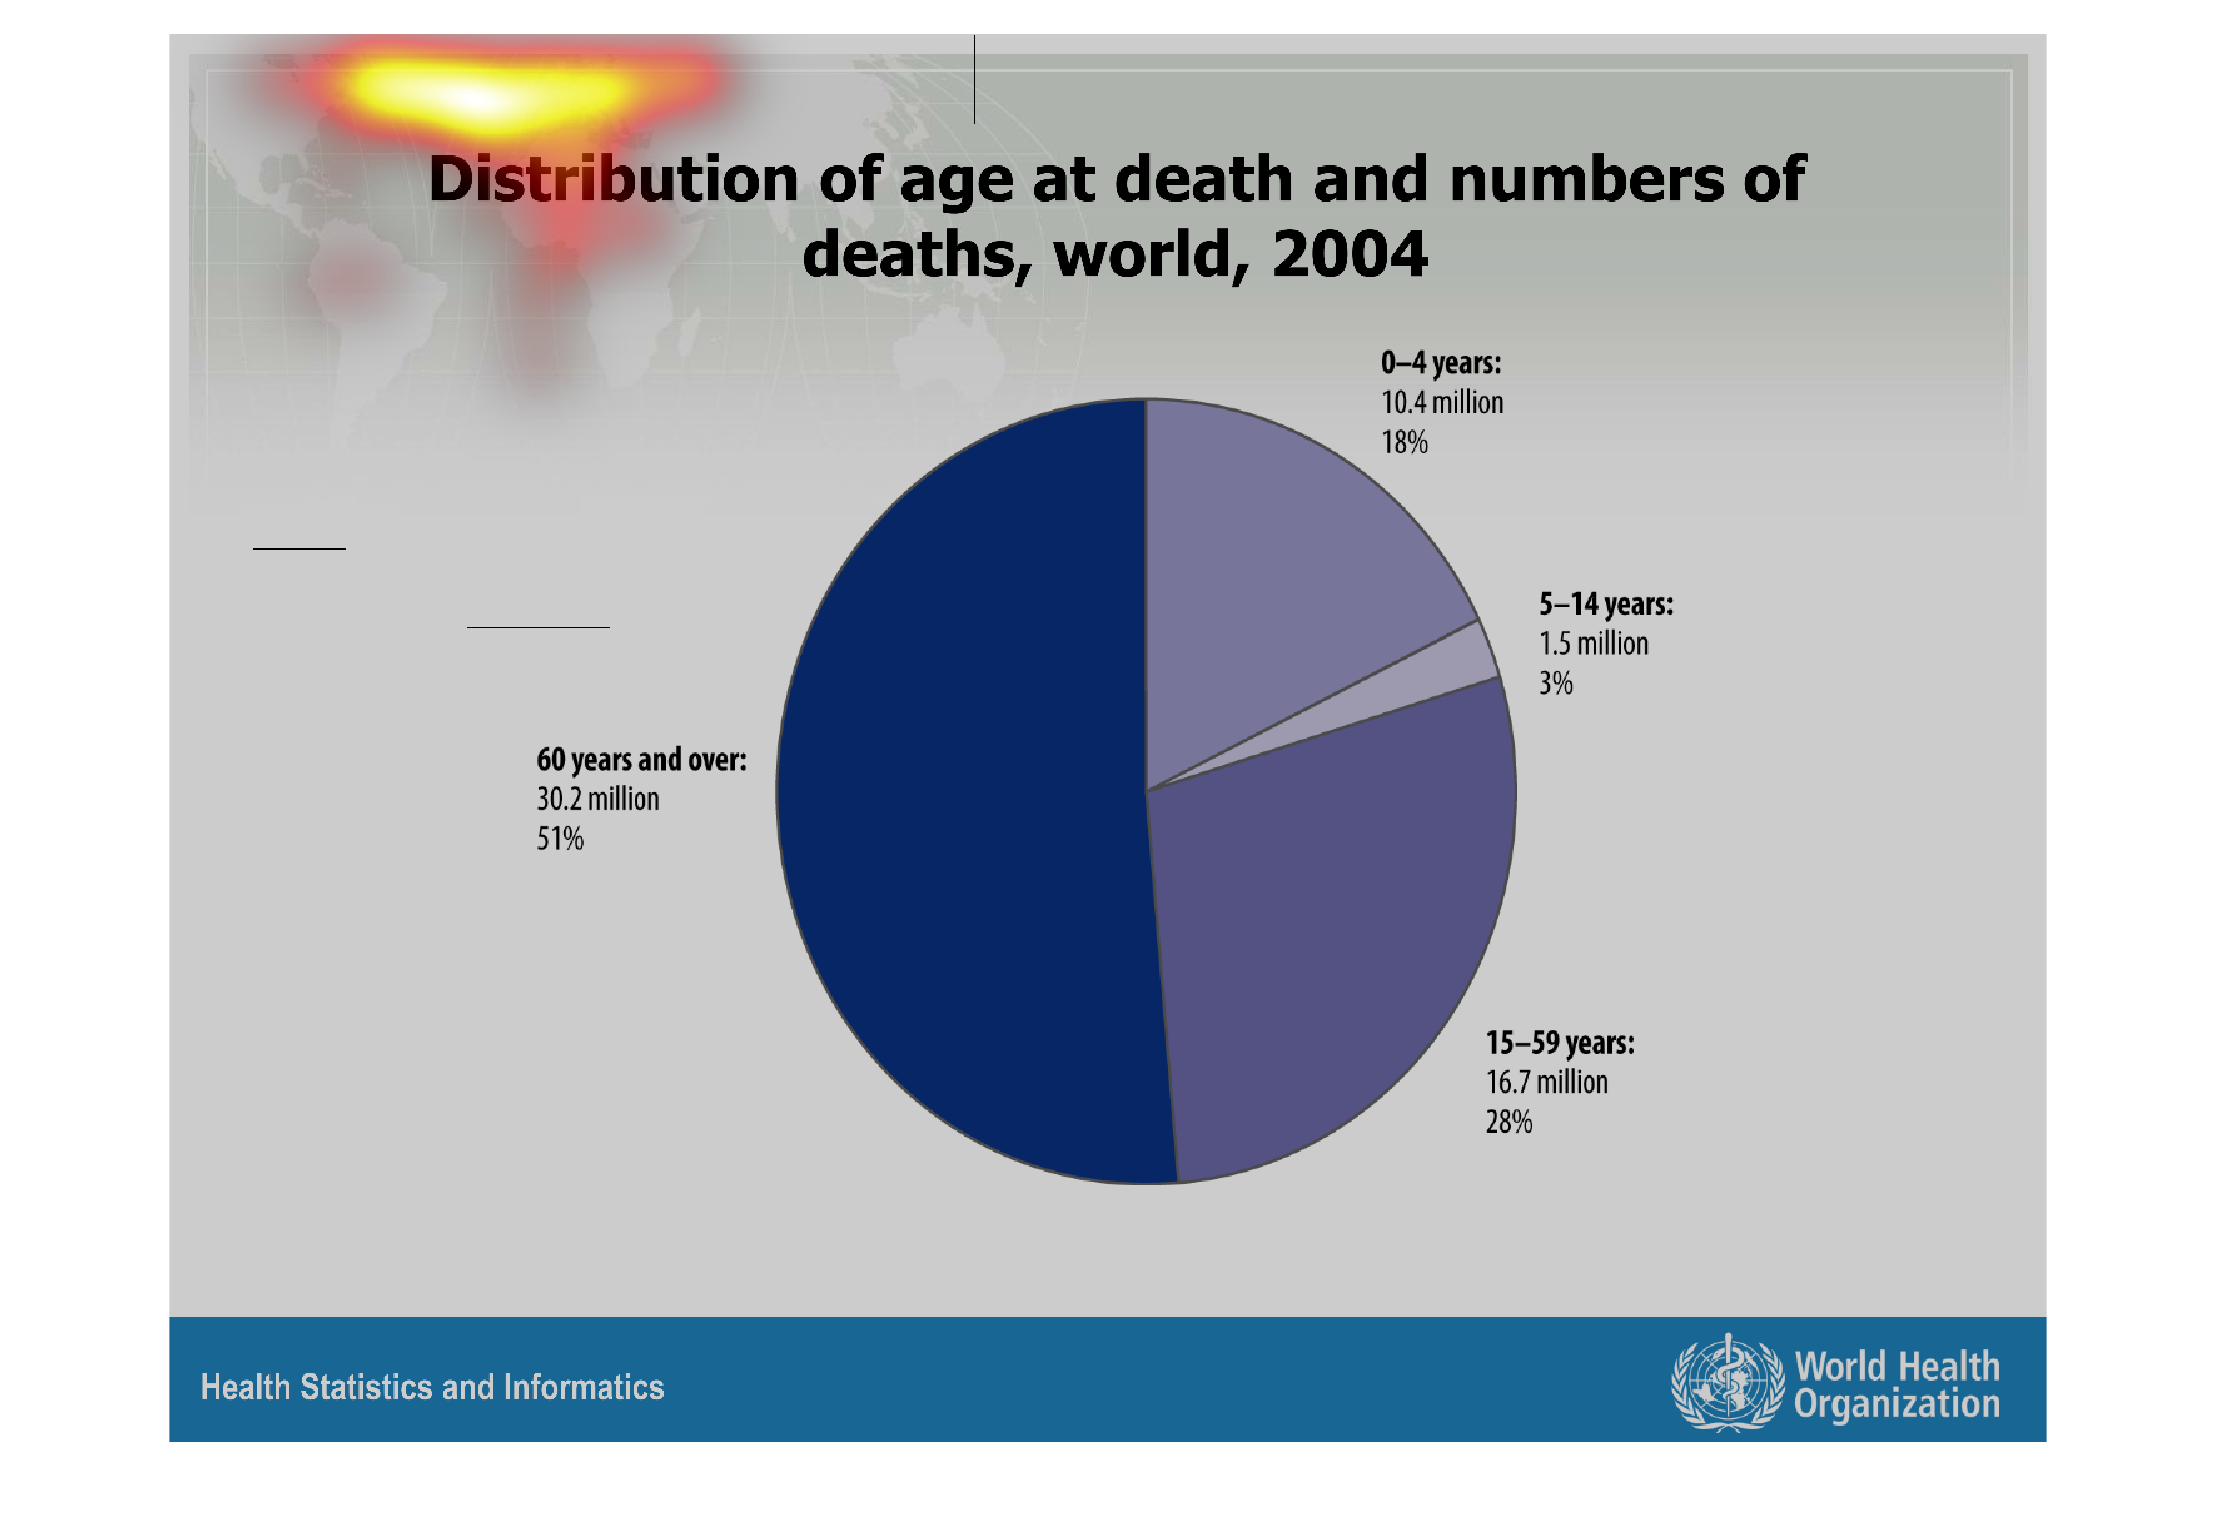
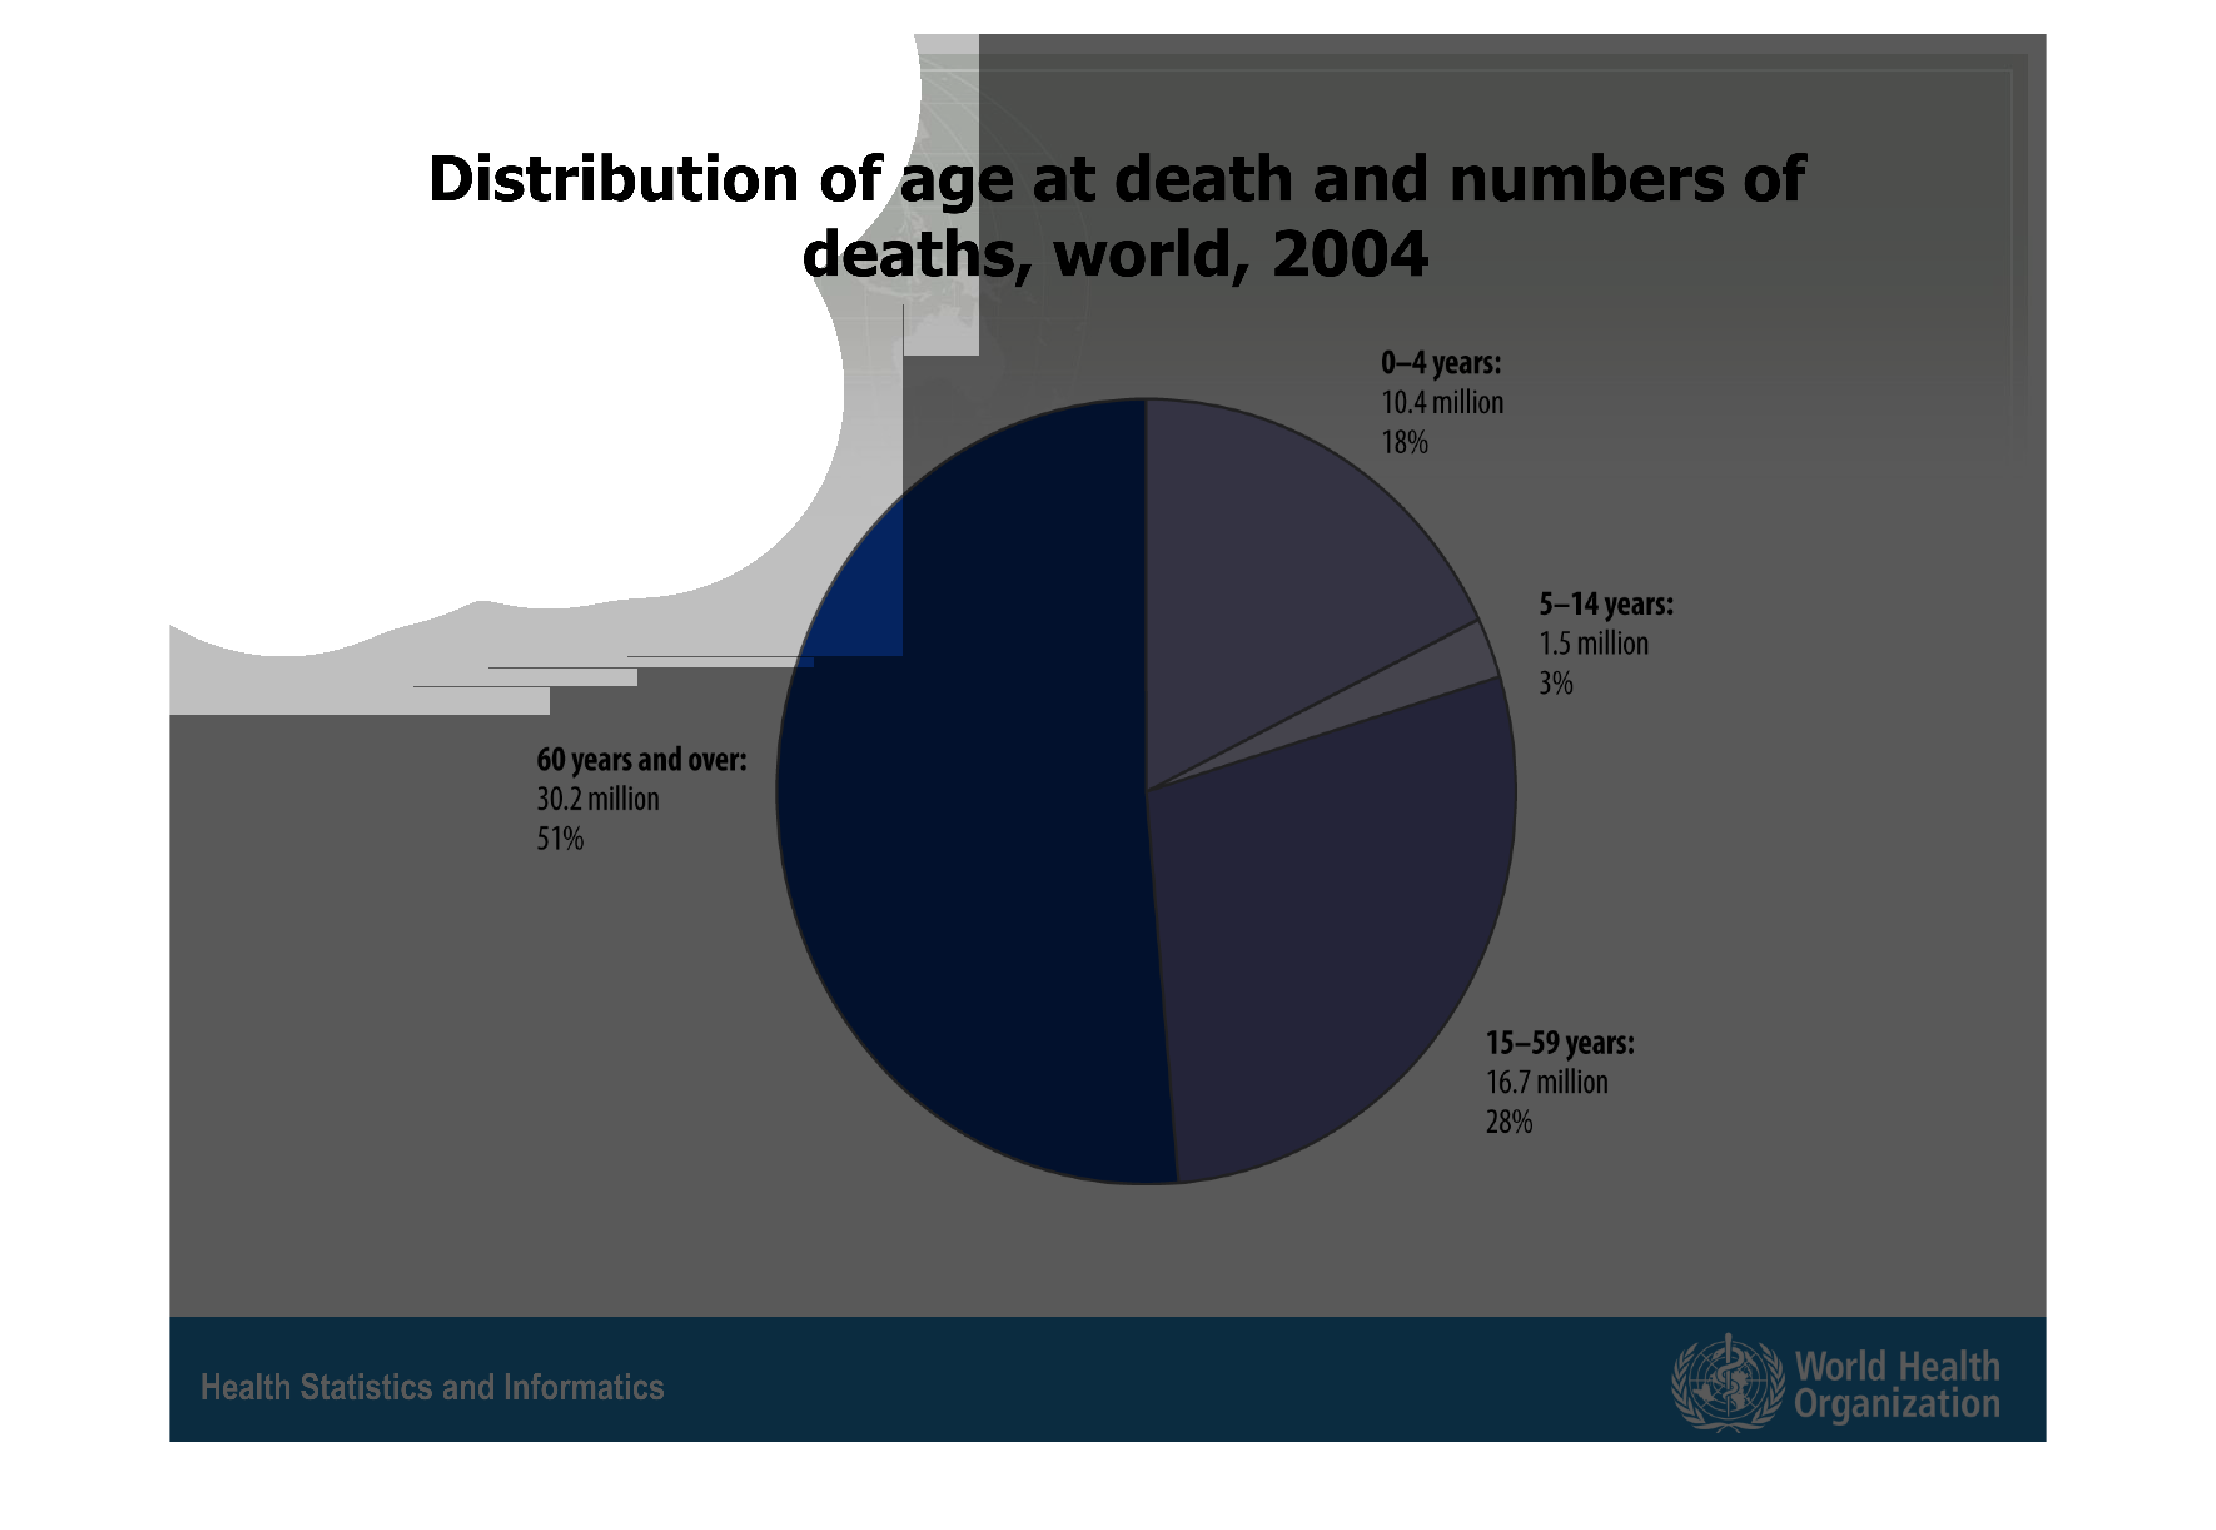
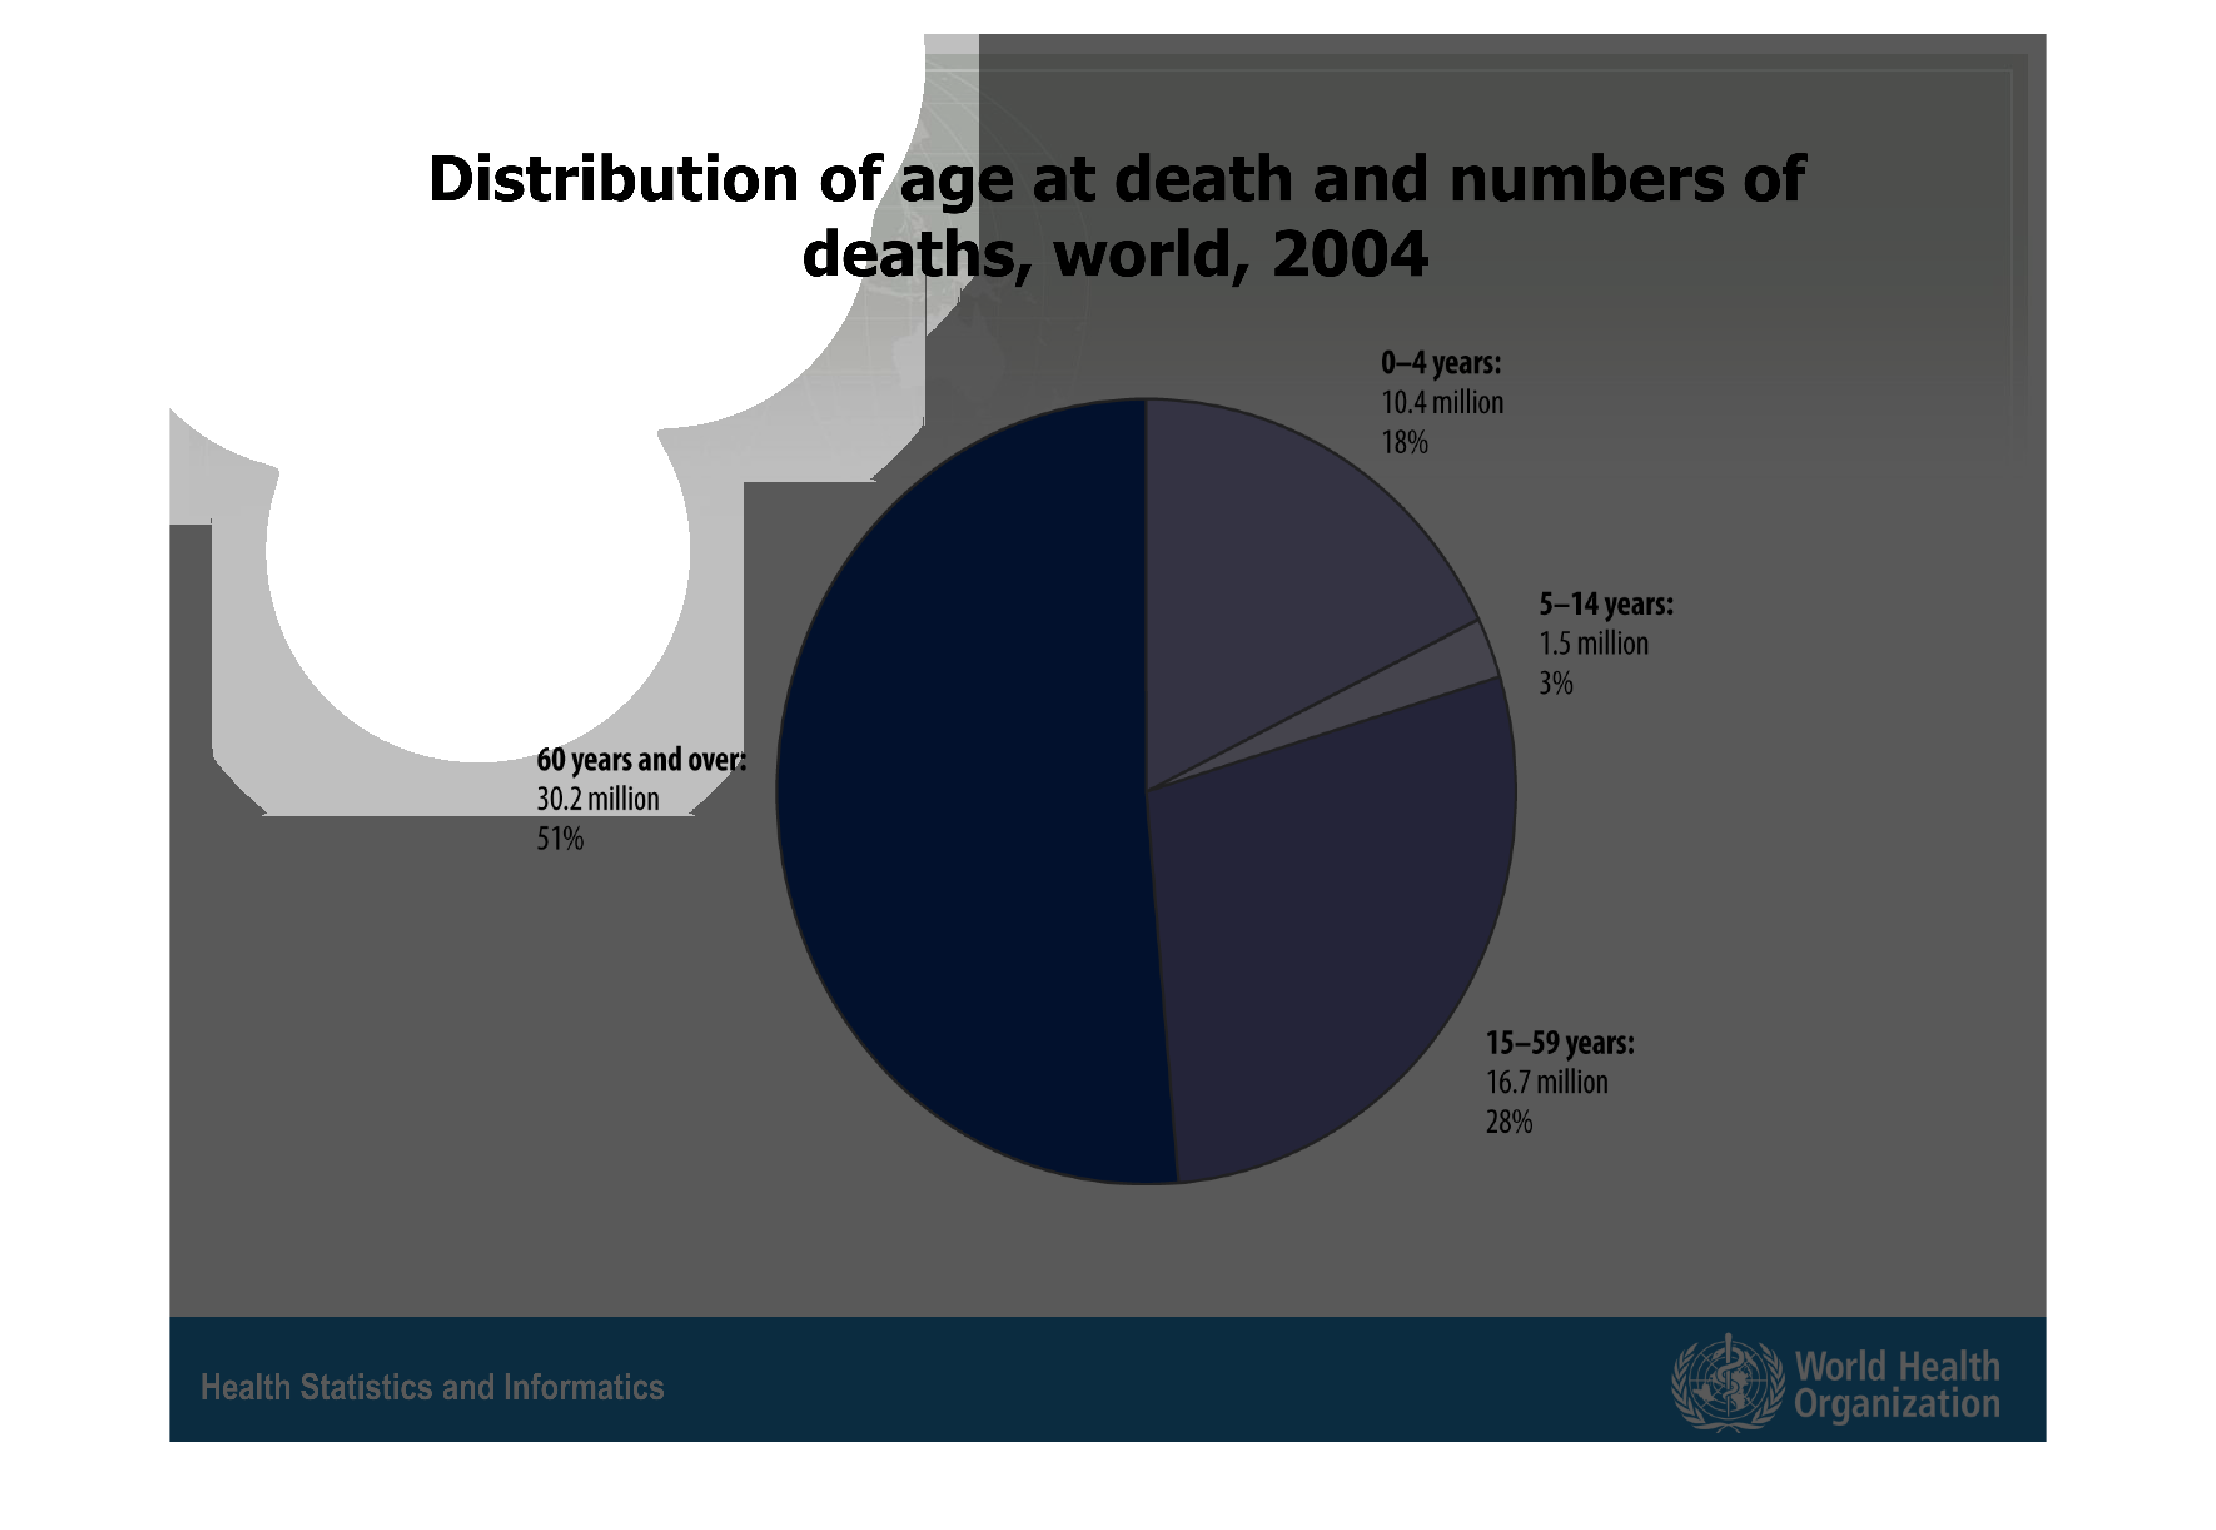
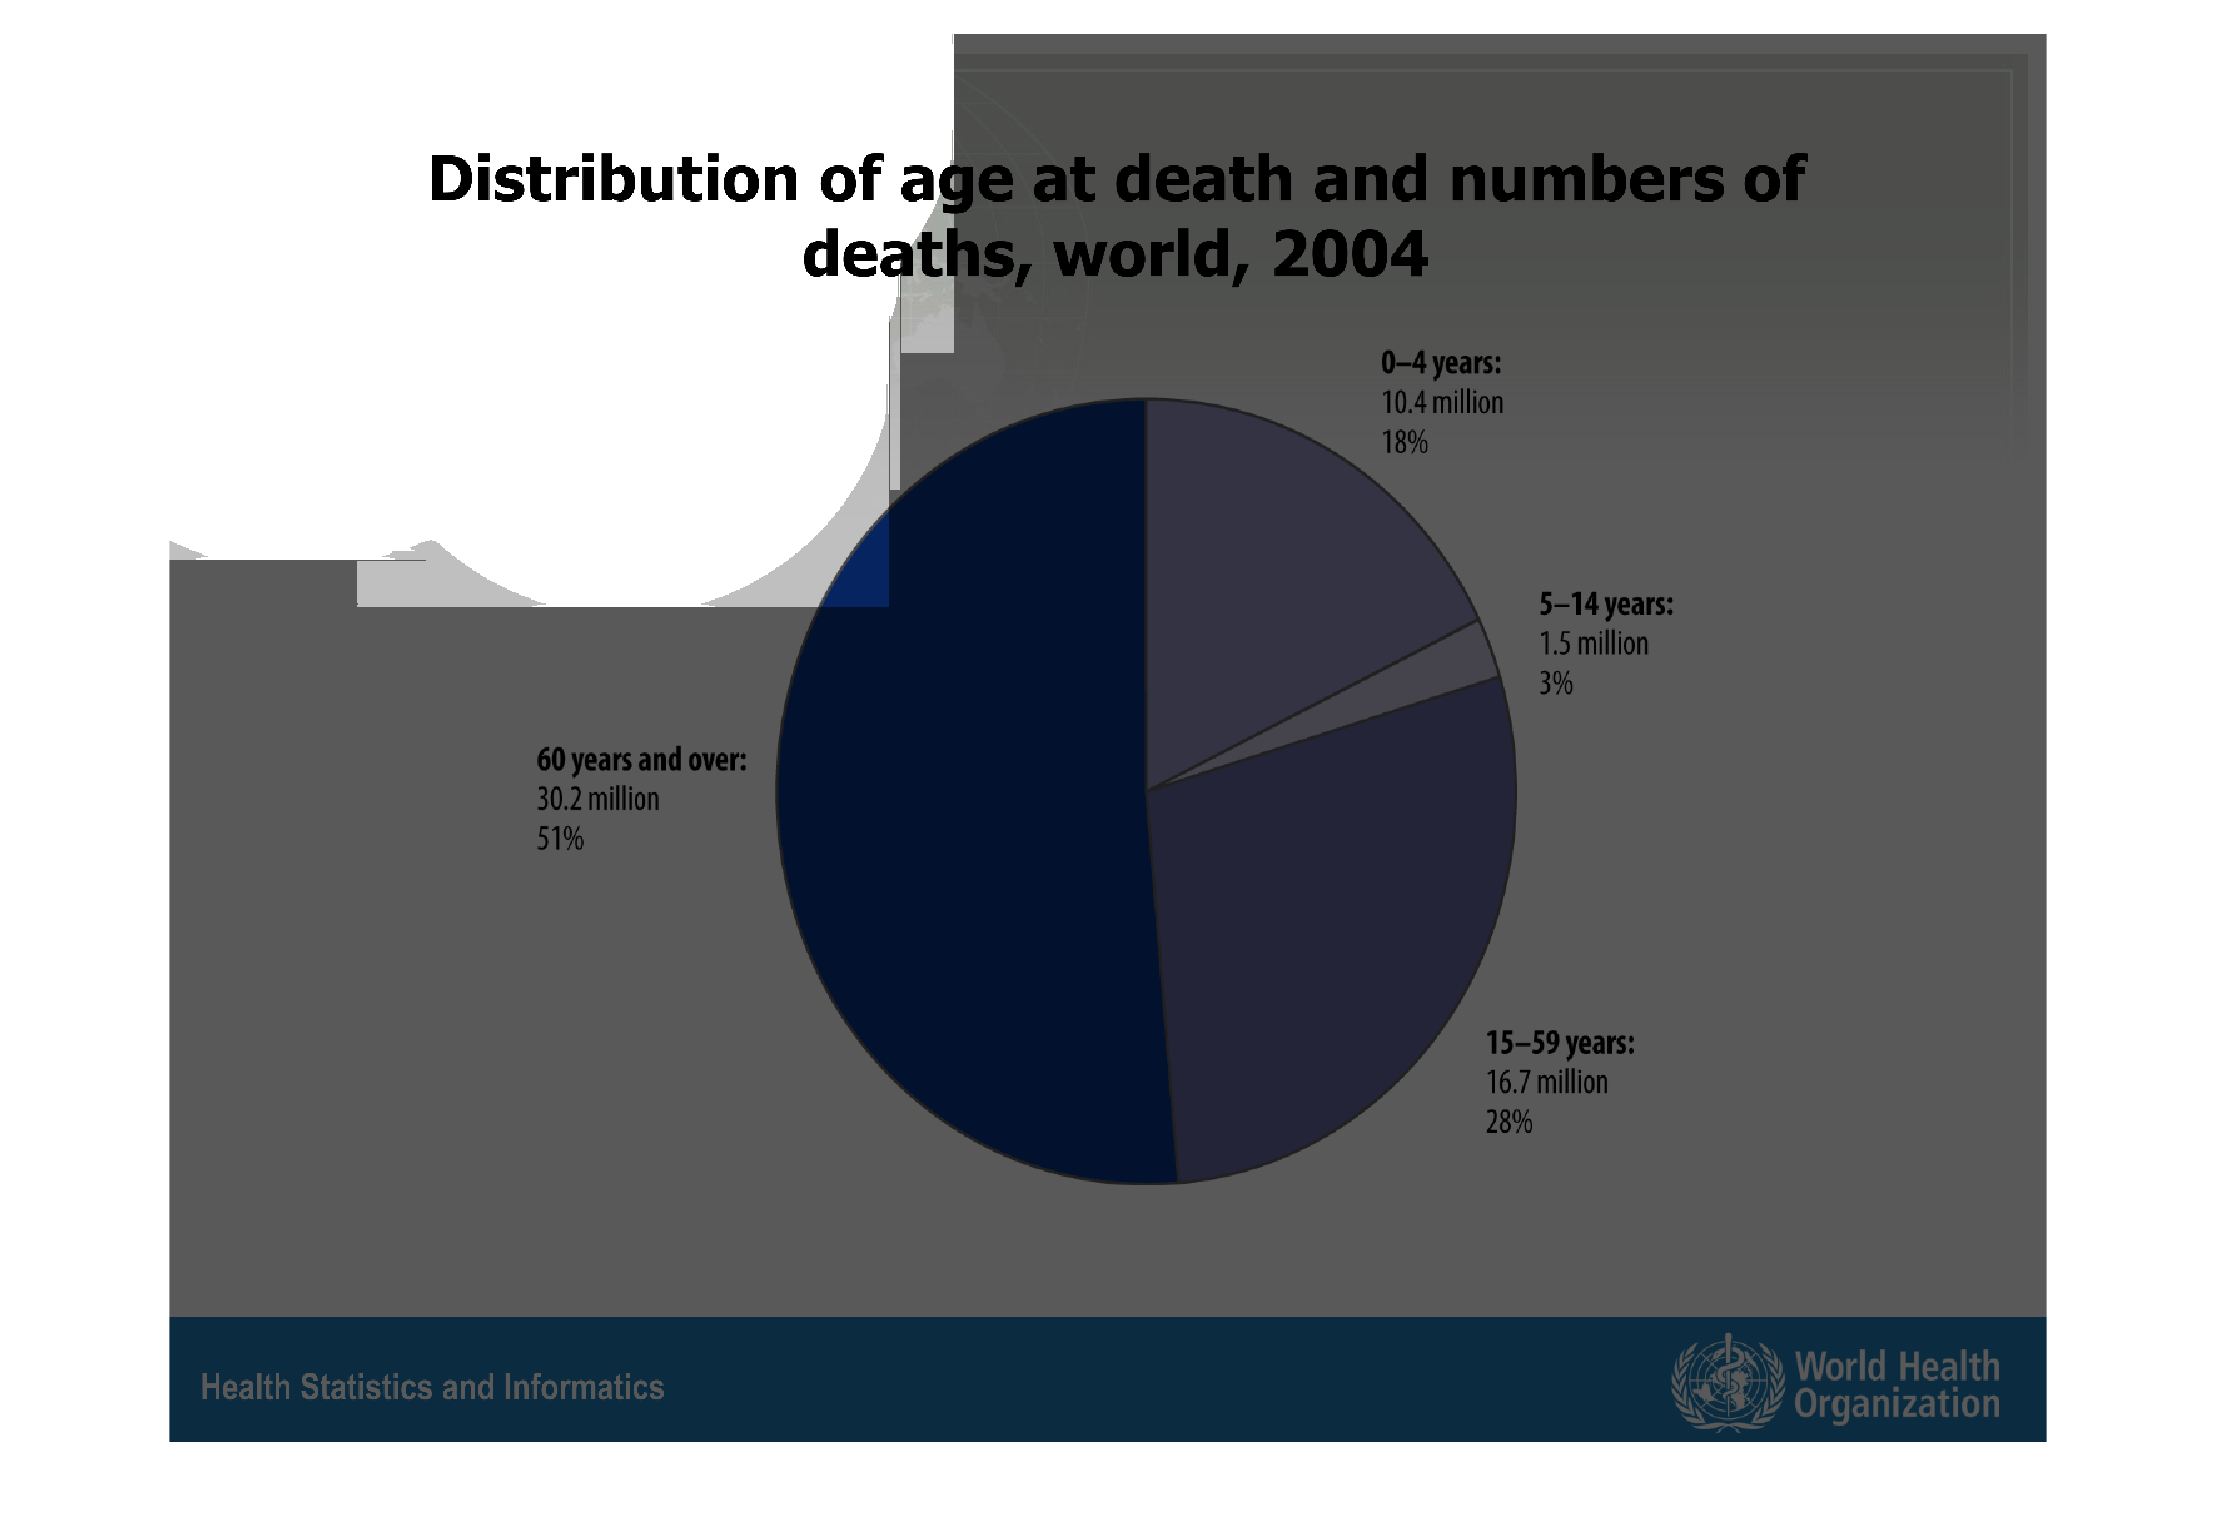
The diagram shows the distribution of age at death and numbers of deaths in world in 2004
year. 51% of people which is 30.2 millions died at the age of 60 years and older, 28% or 16.7
million died at the age rank from 15 to 59, 3% or 1.5 million died at the age rank from 5
to 14 years old, 18% or 10.4 million died at the age rank from 0 to 4 years old.
Warning: Image is too big to fit on screen; displaying at 67%
Warning: Image is too big to fit on screen; displaying at 67%
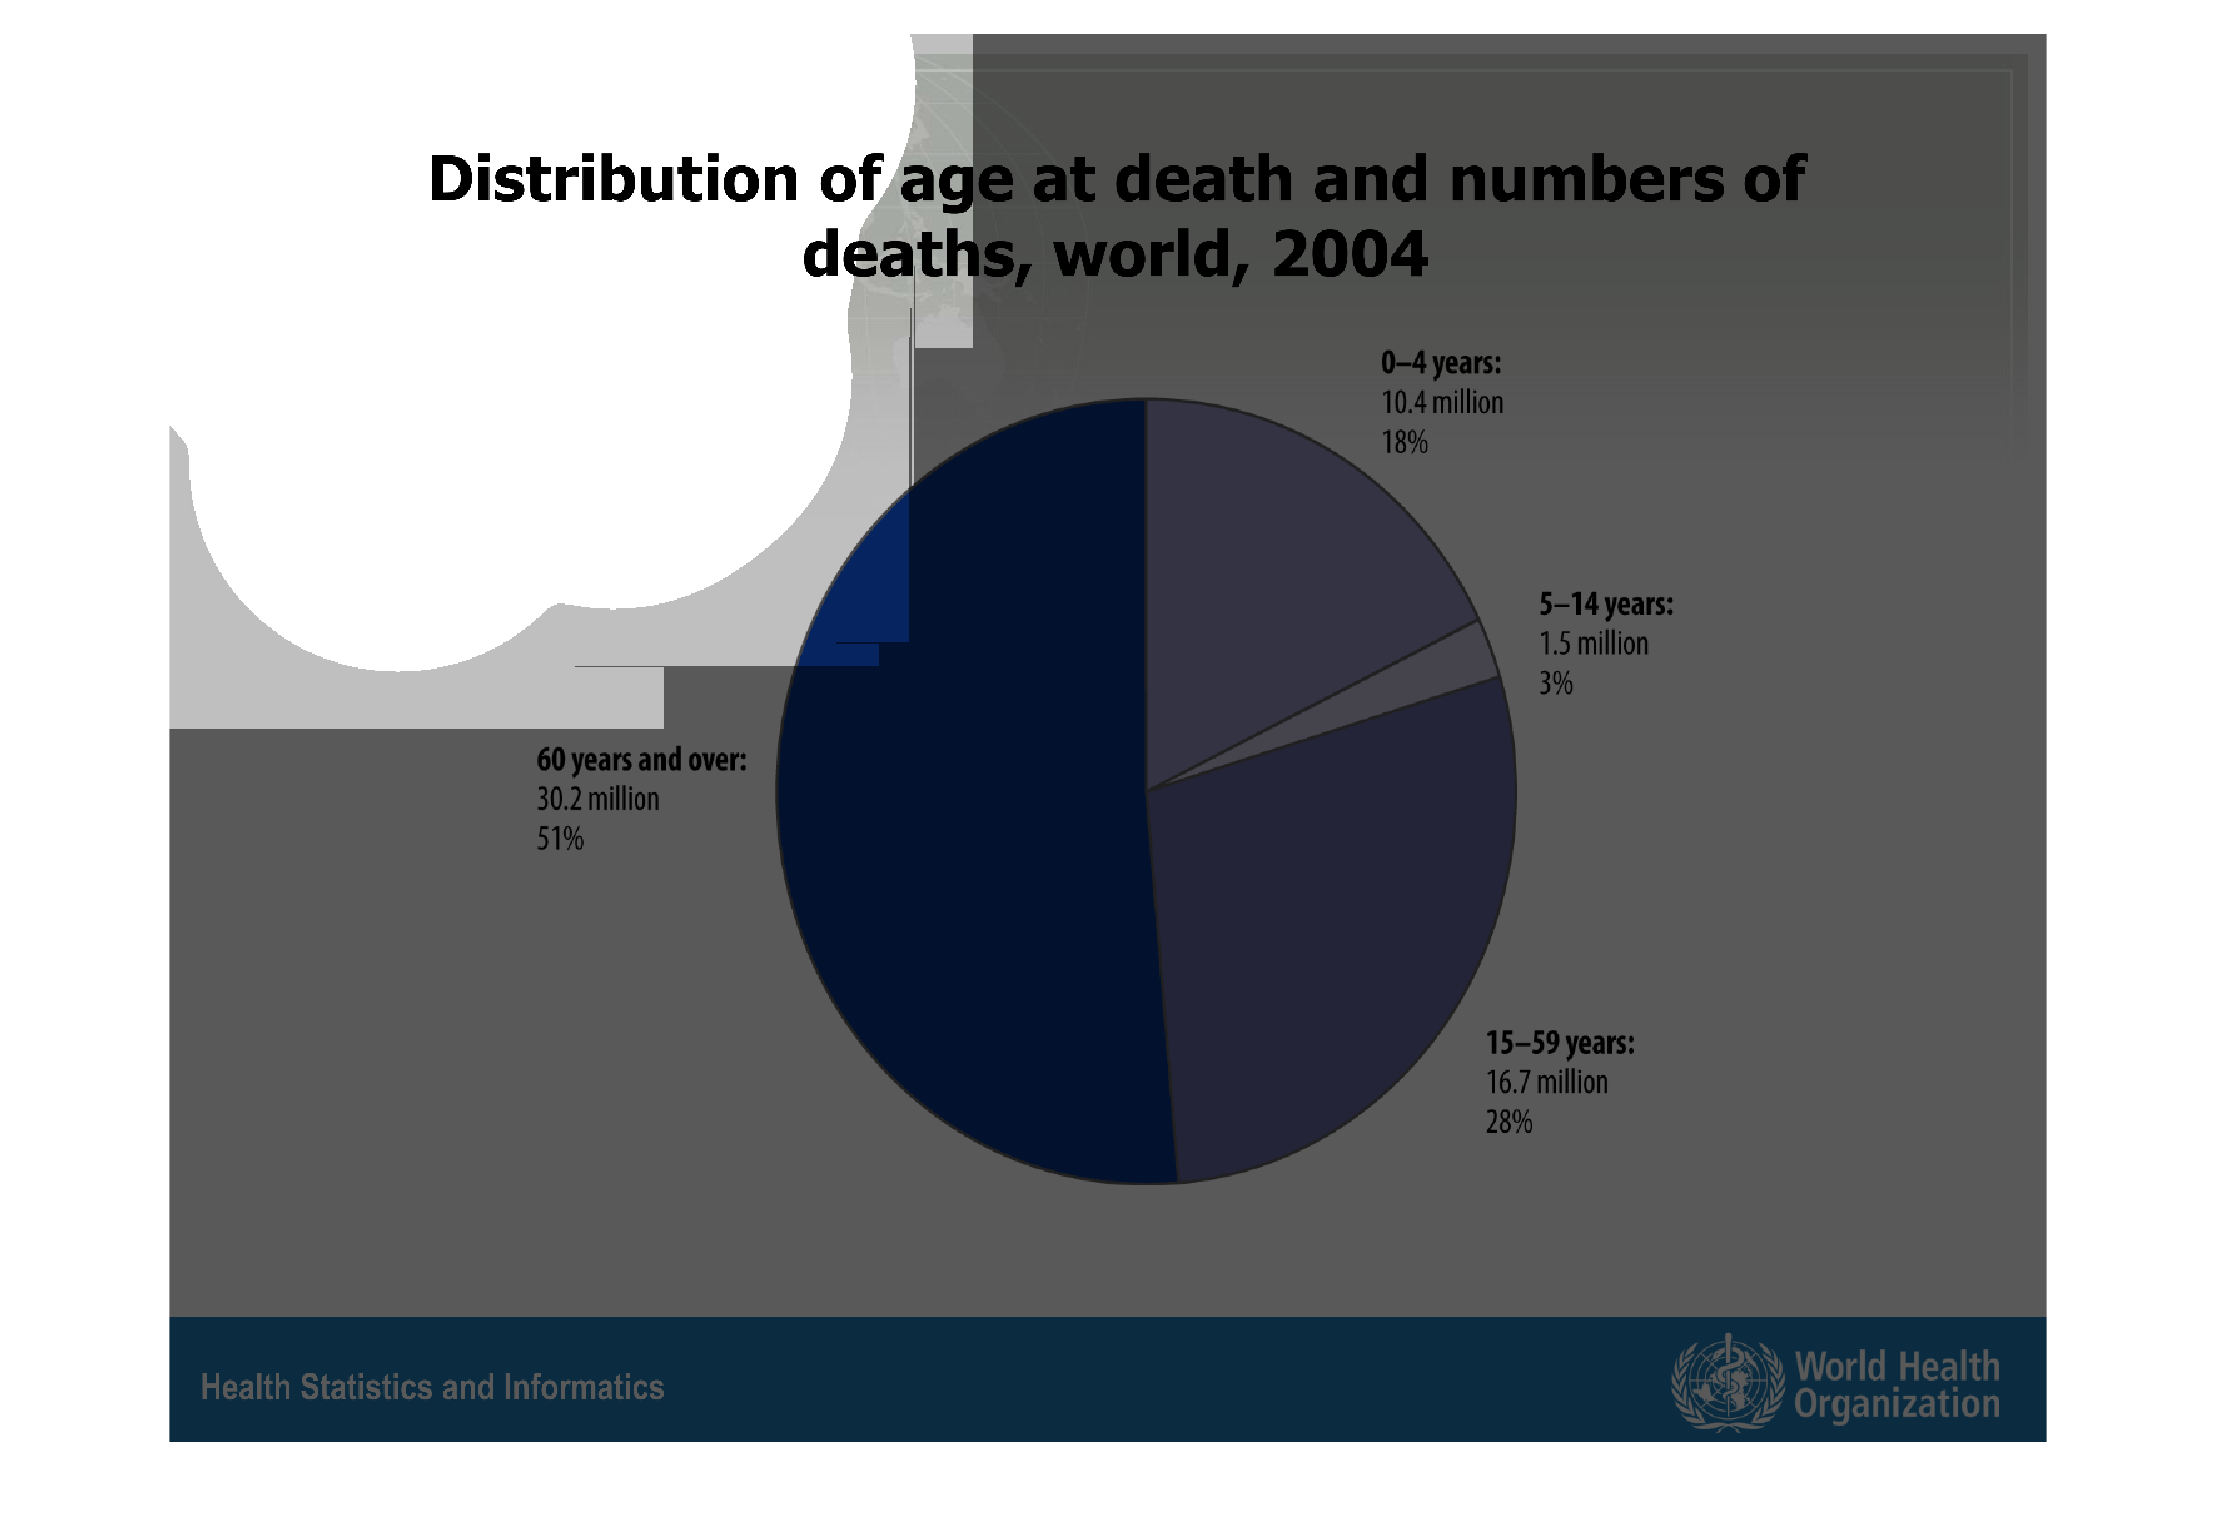
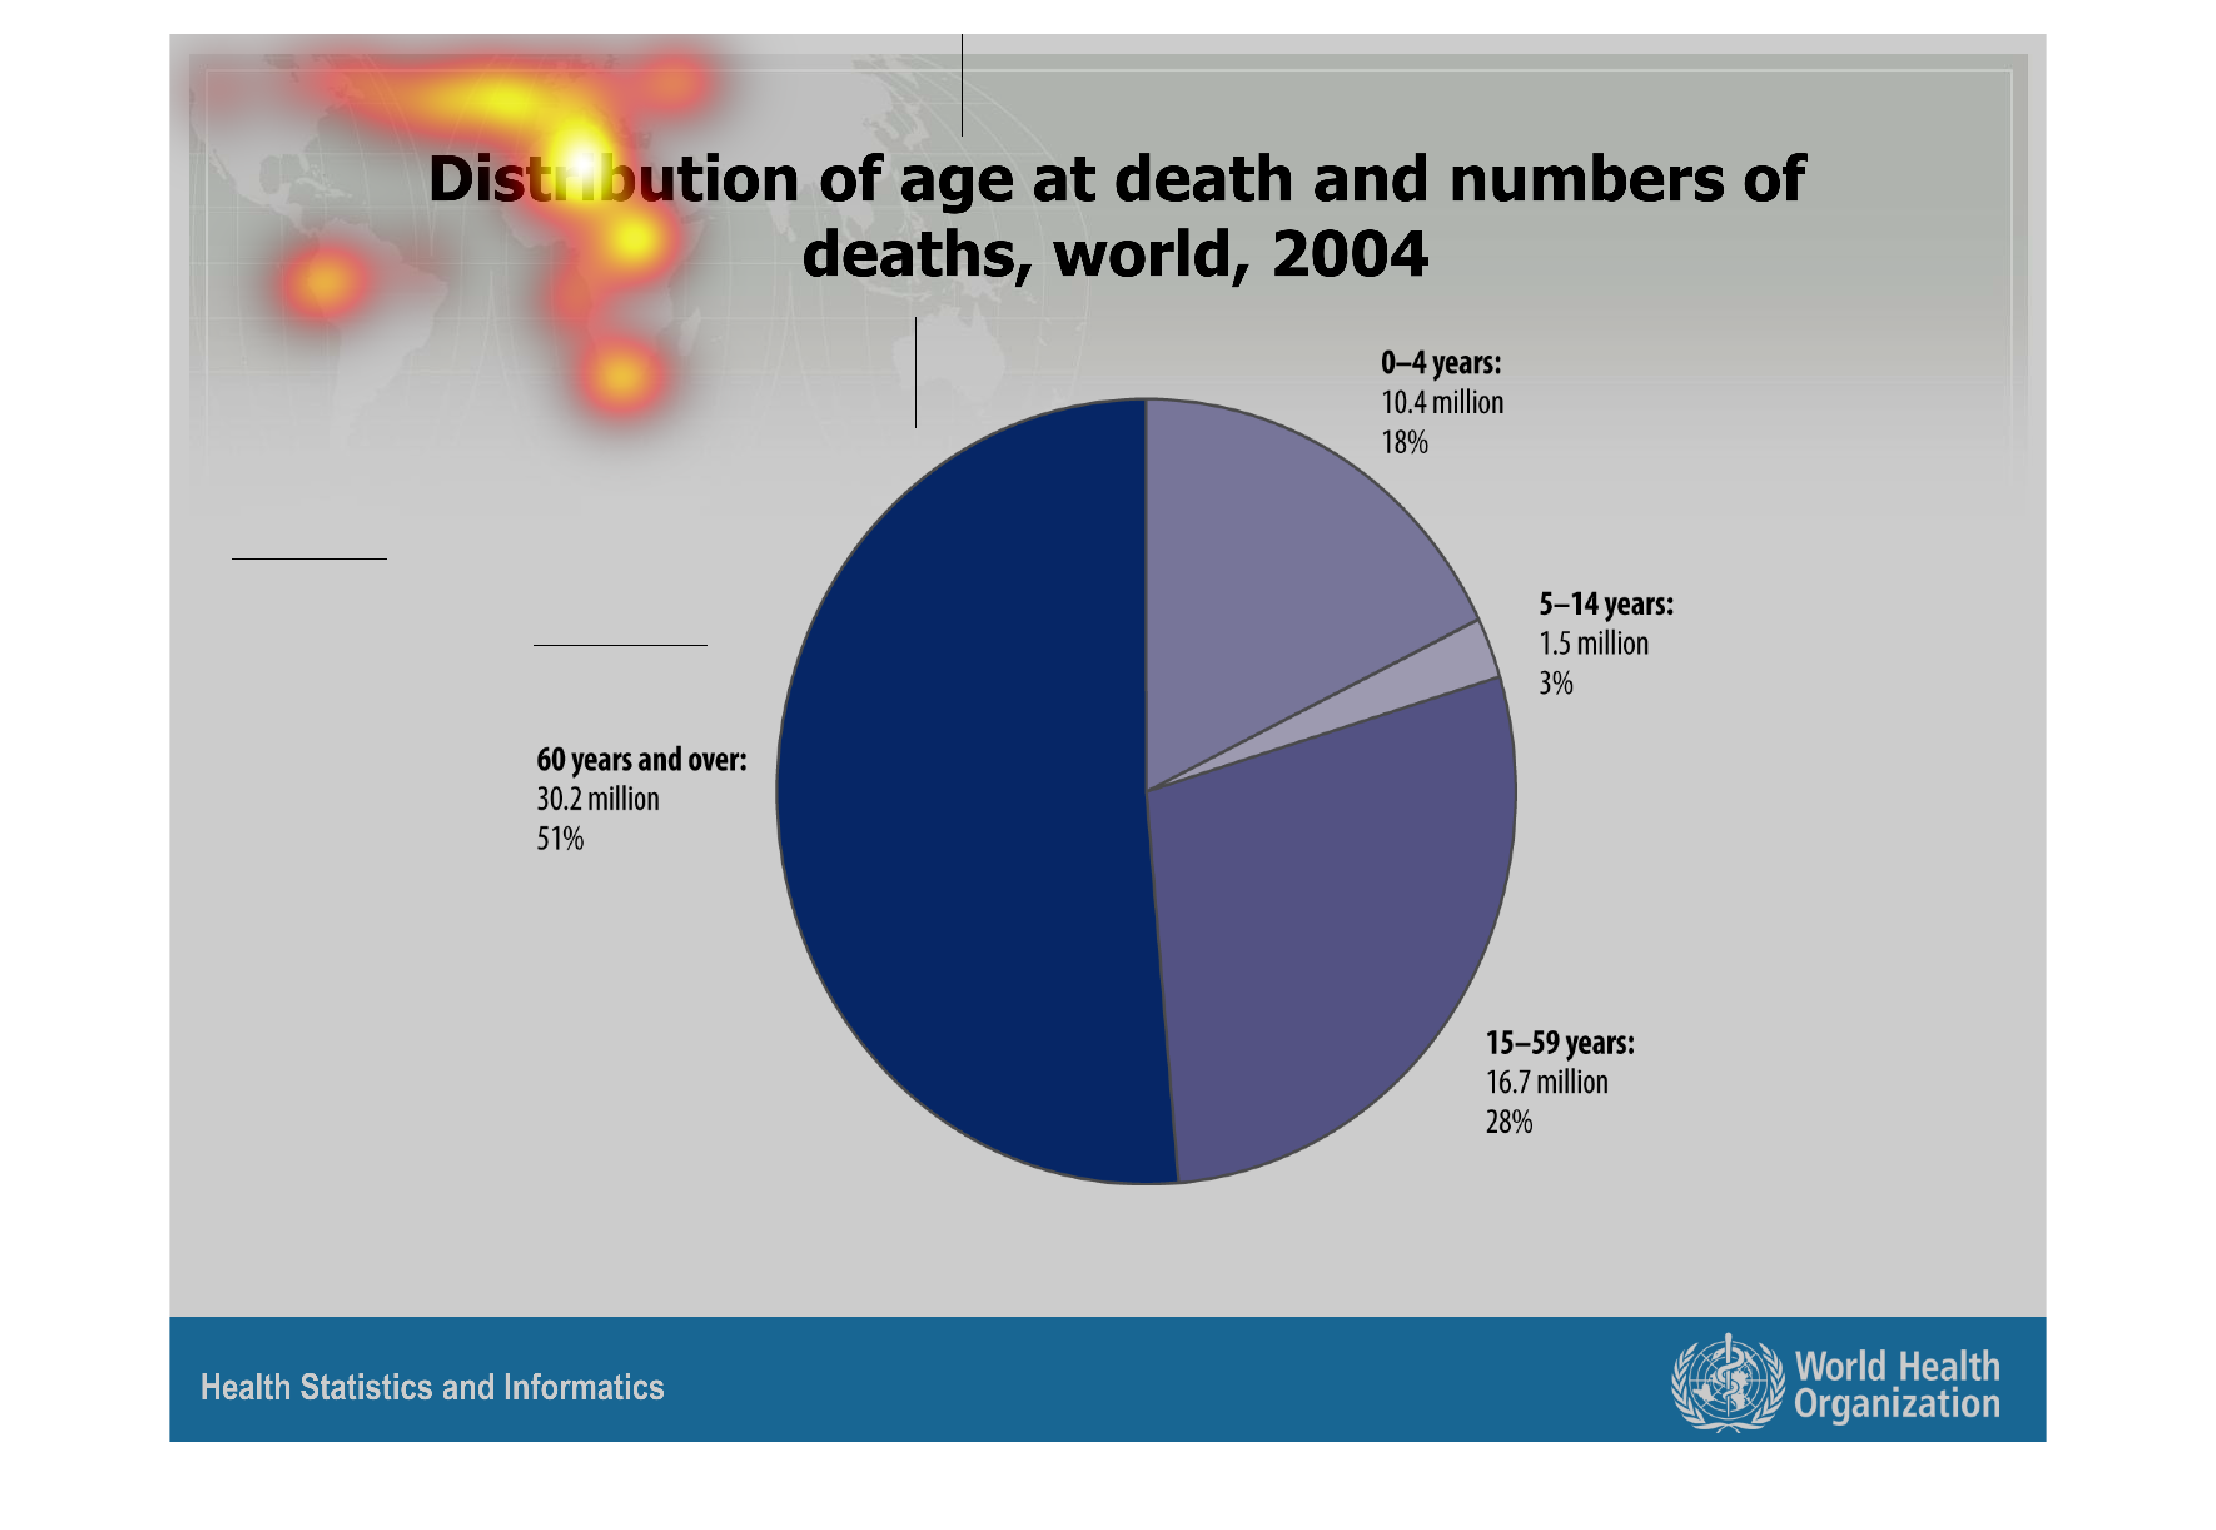
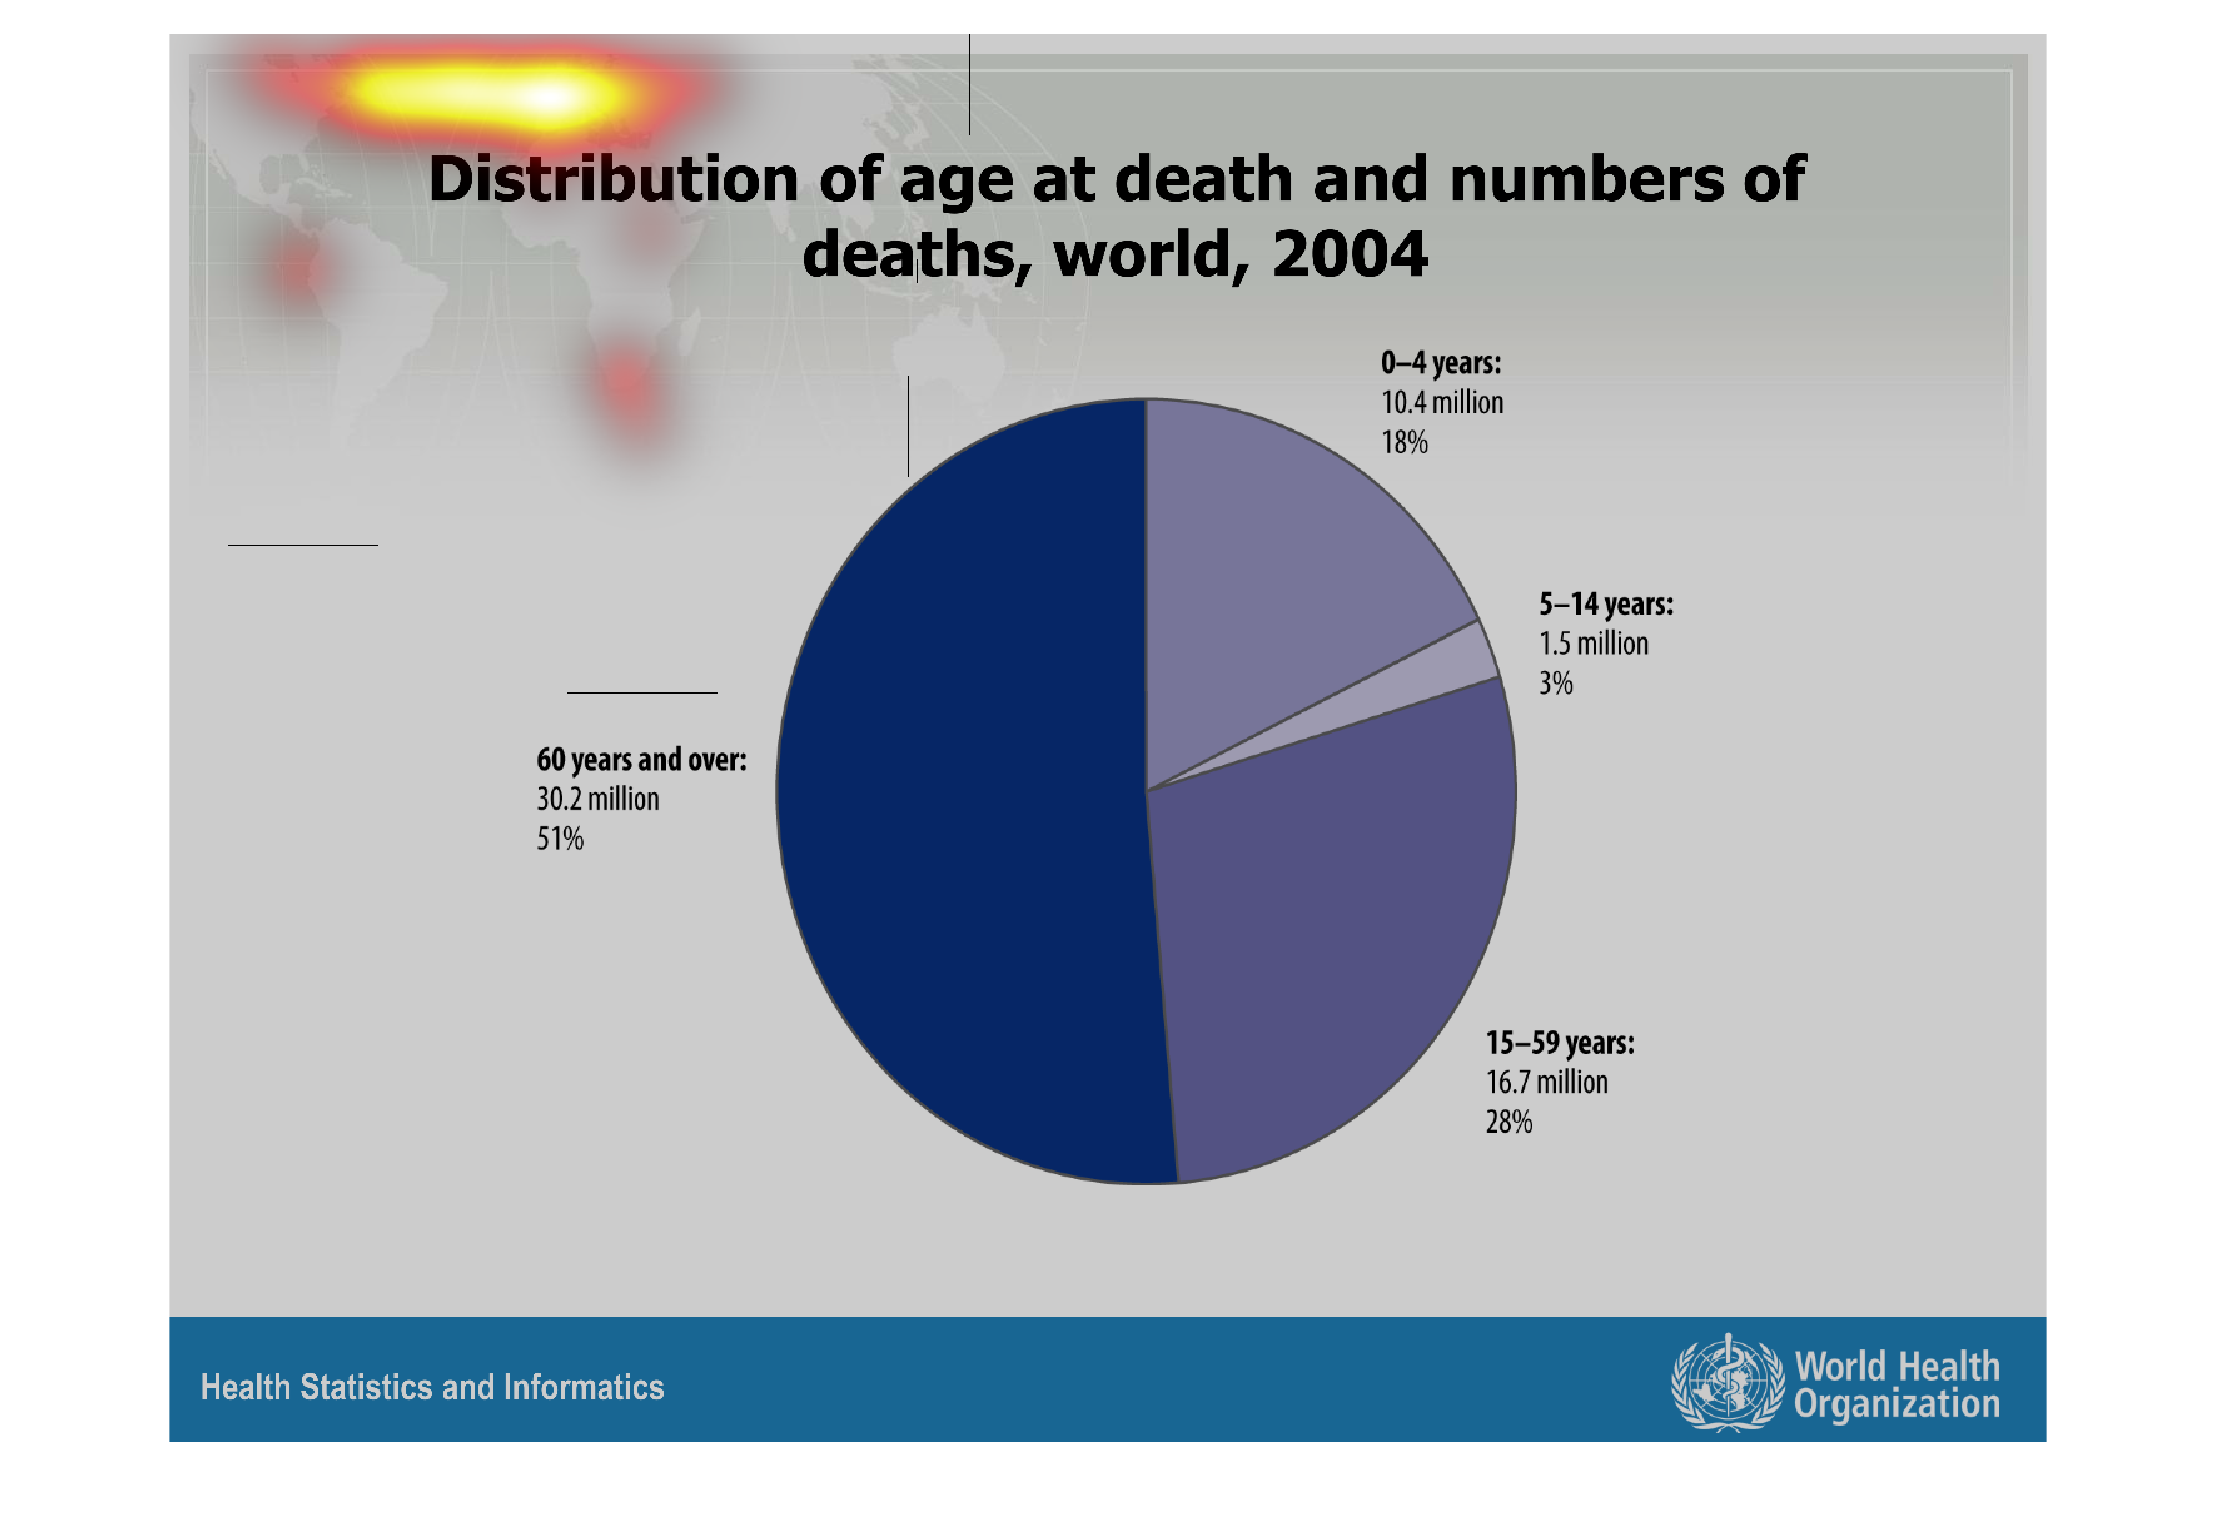
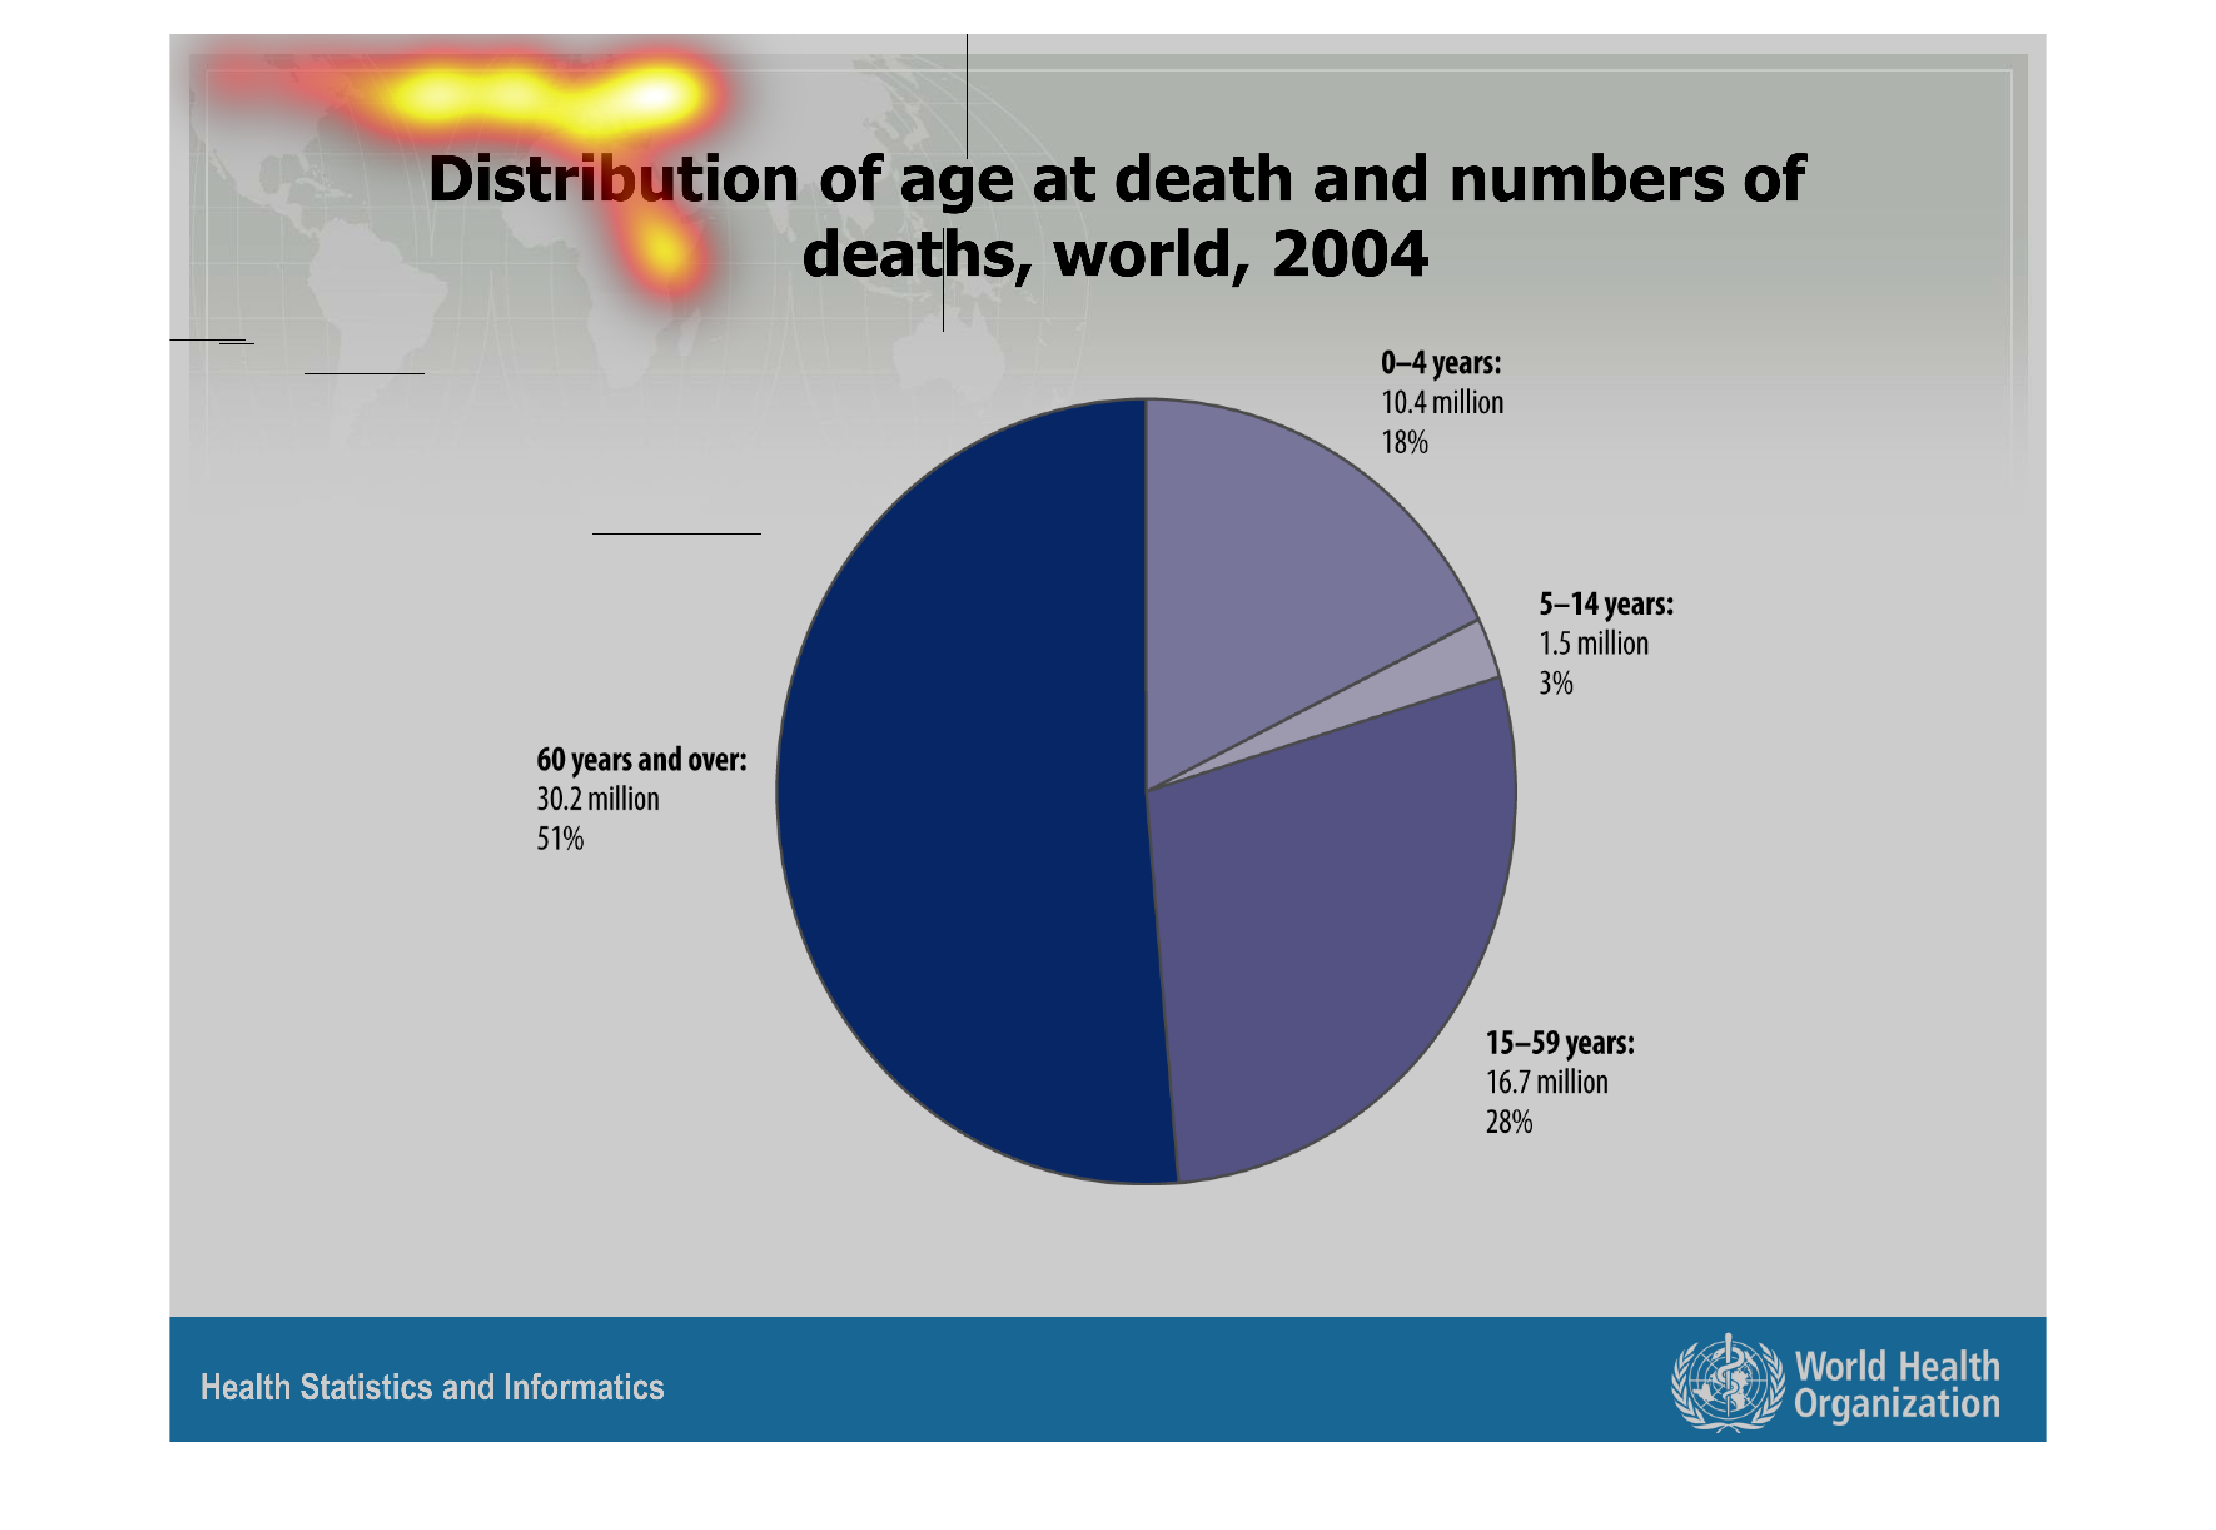
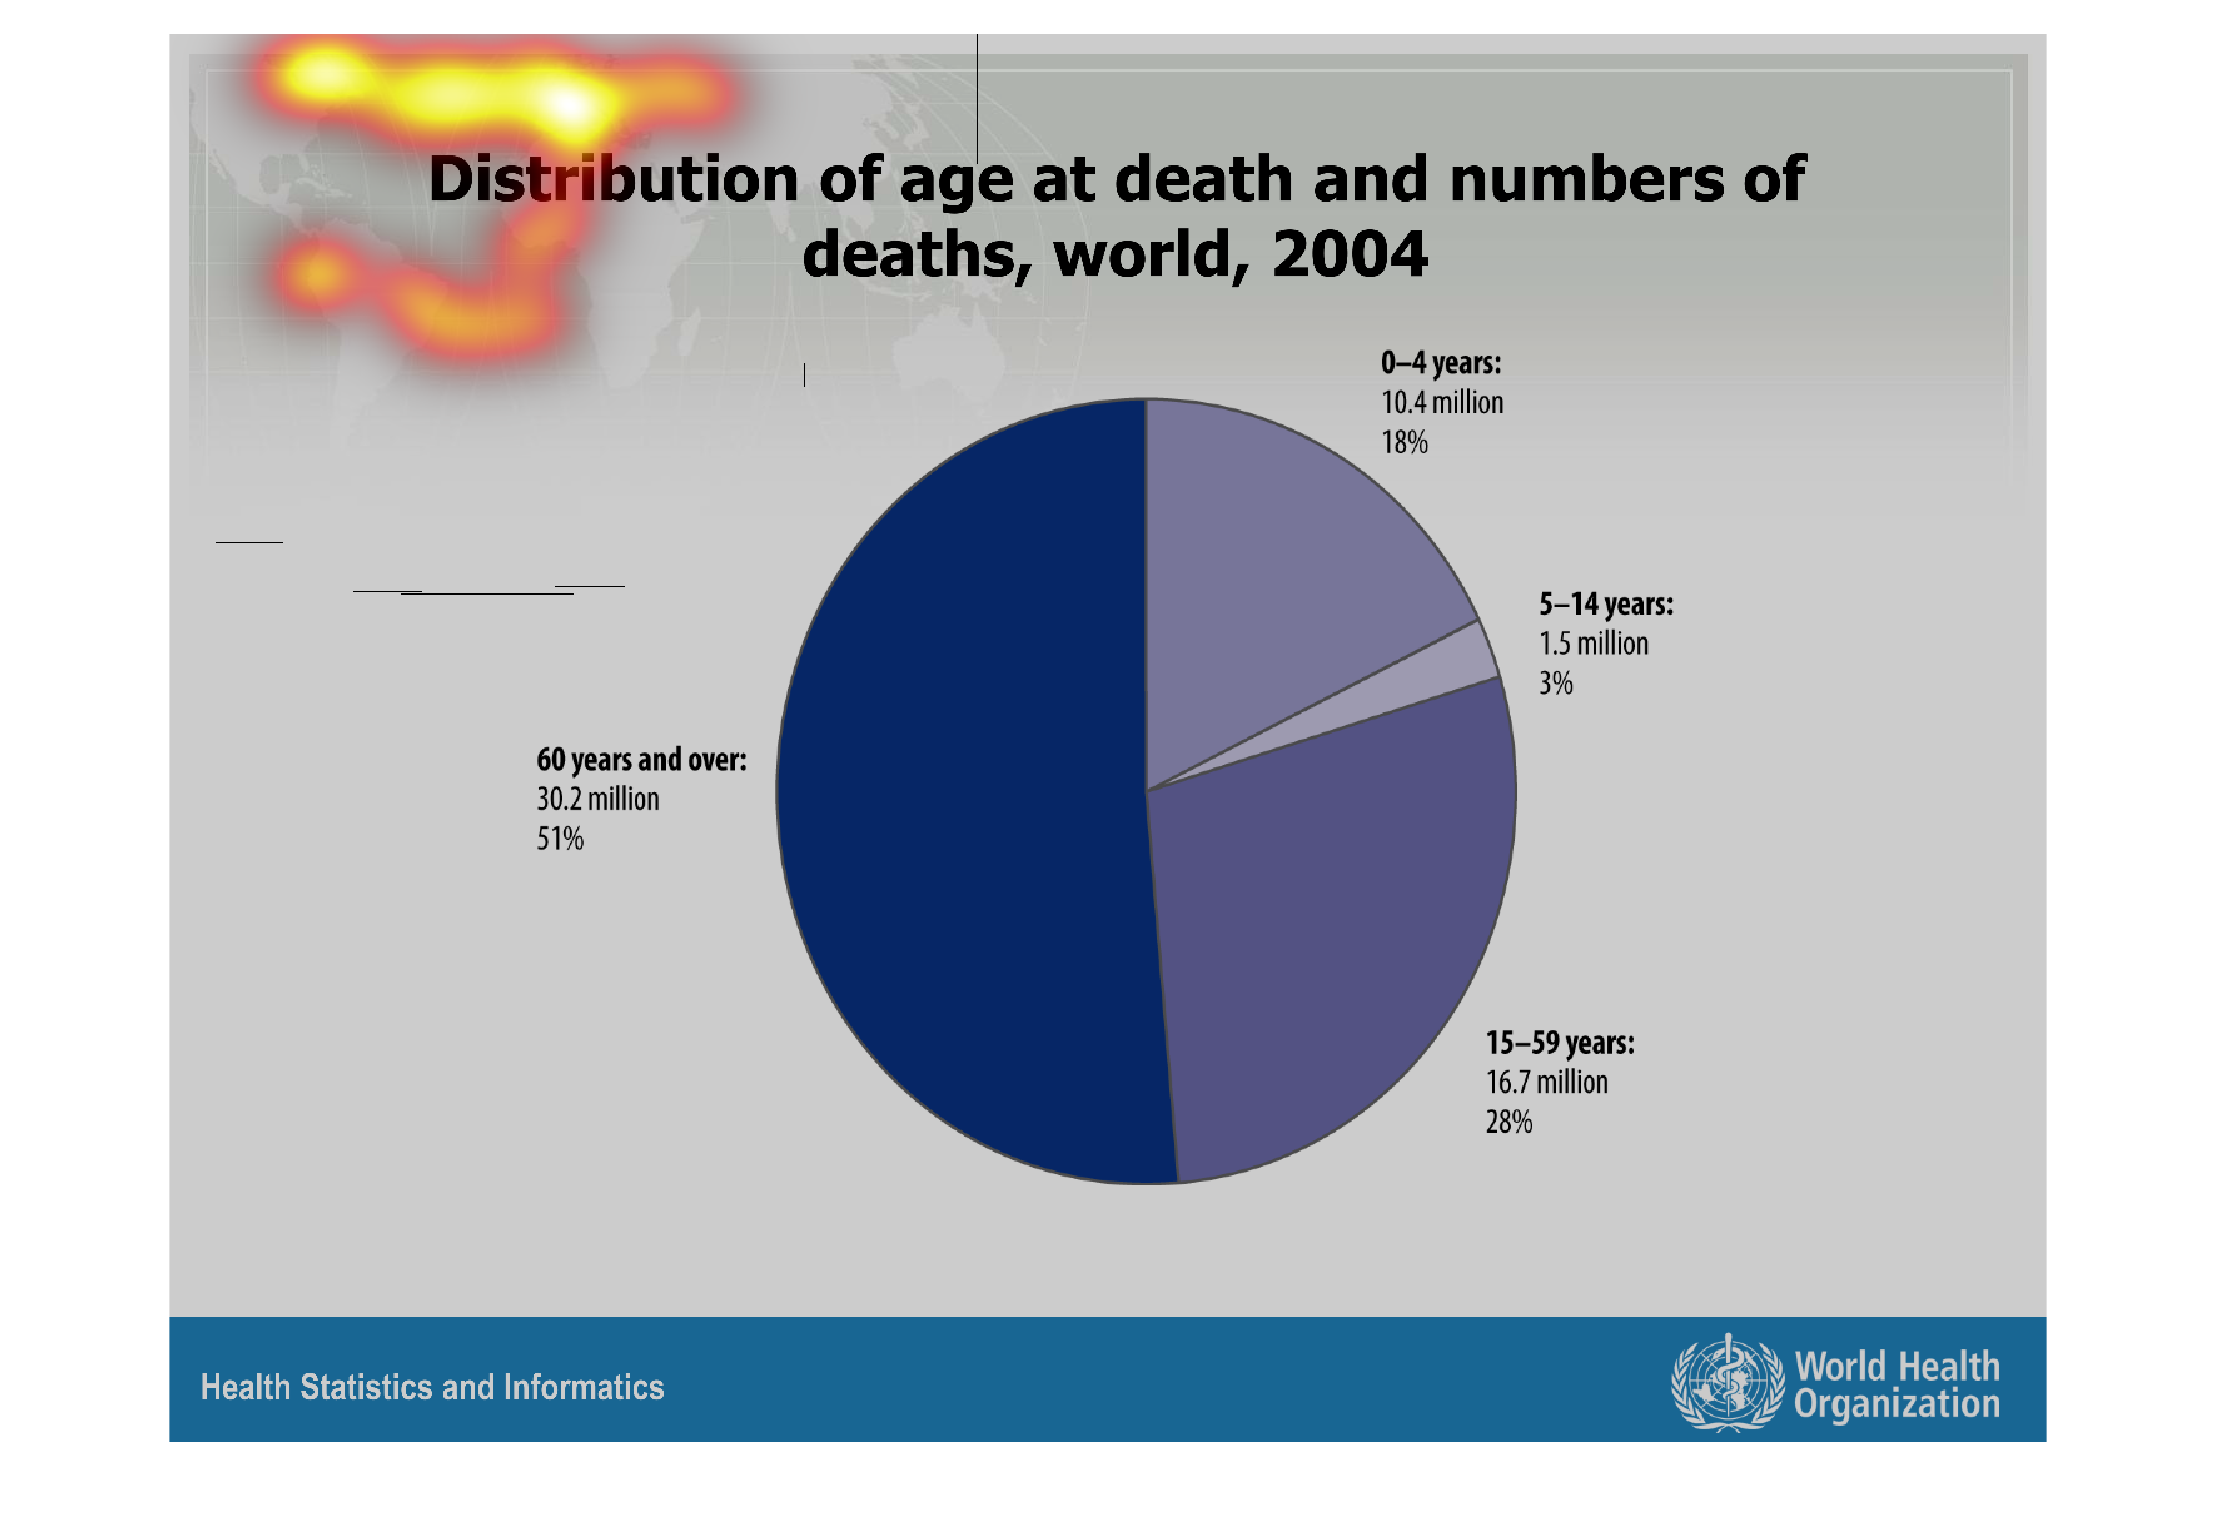
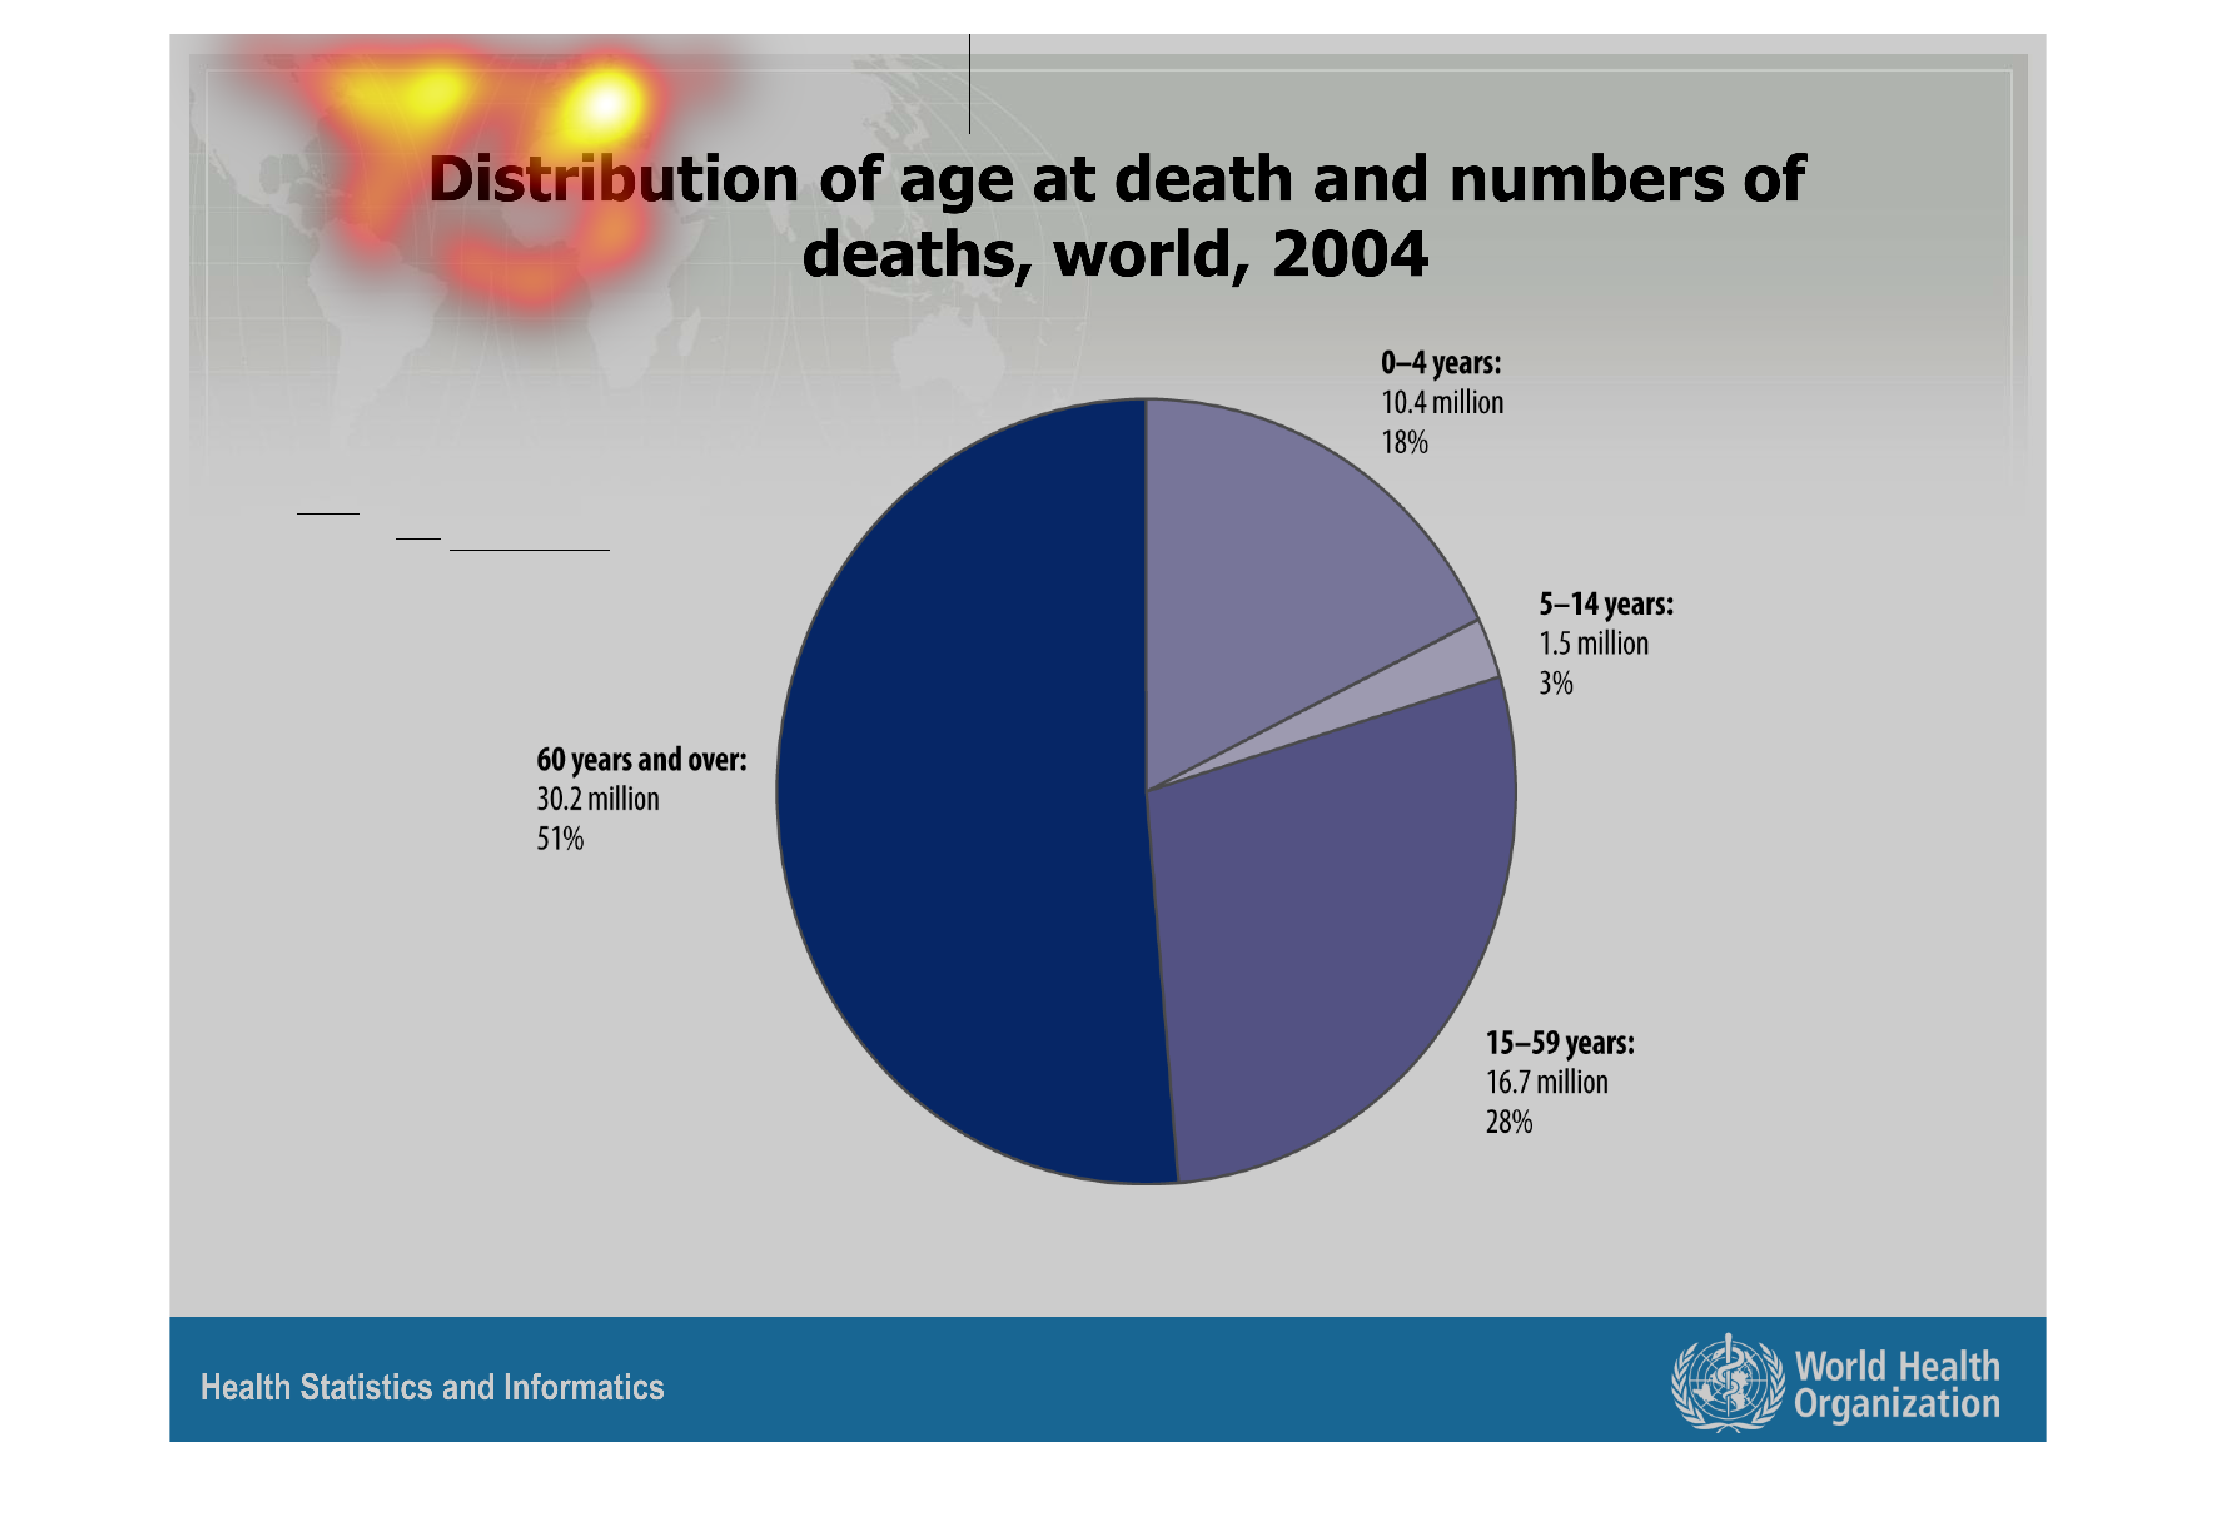
The image depicts a pie chart of distribution of age at death and numbers of deaths in the
world, in 2004. 60 years and older is the predominant age of death, followed by 15-39 years,
followed by 0-4 years, with 5-14 years being the least likely age to die.
Warning: Image is too big to fit on screen; displaying at 67%
Warning: Image is too big to fit on screen; displaying at 67%

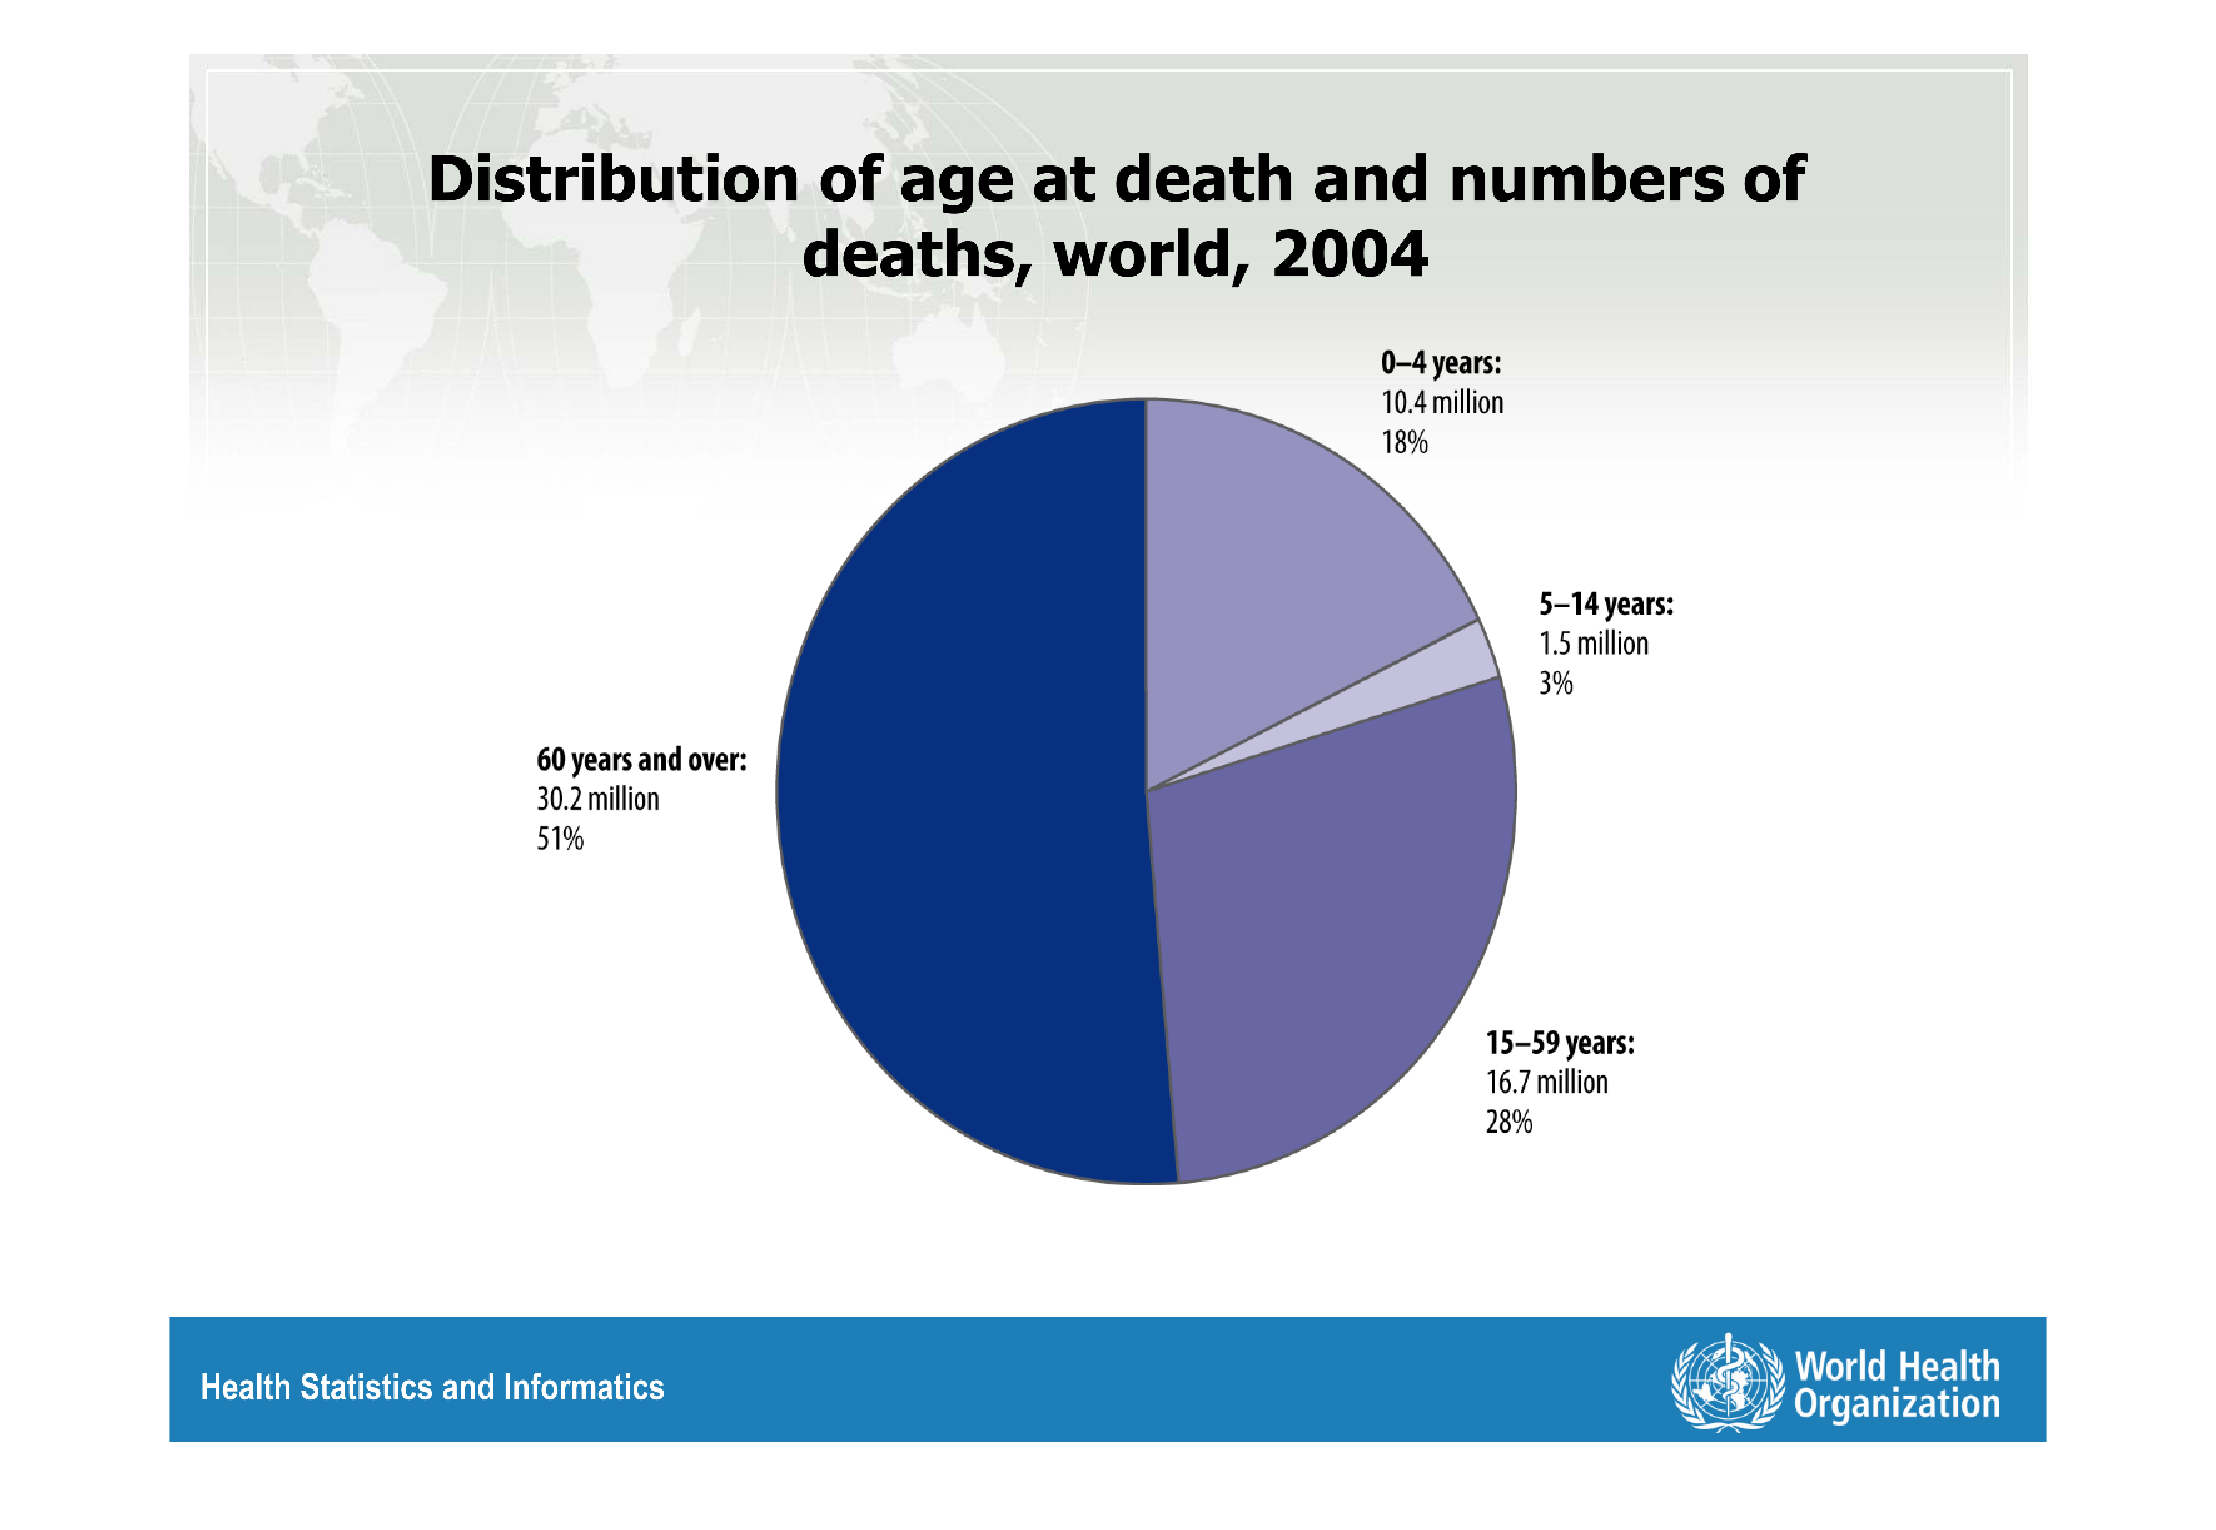
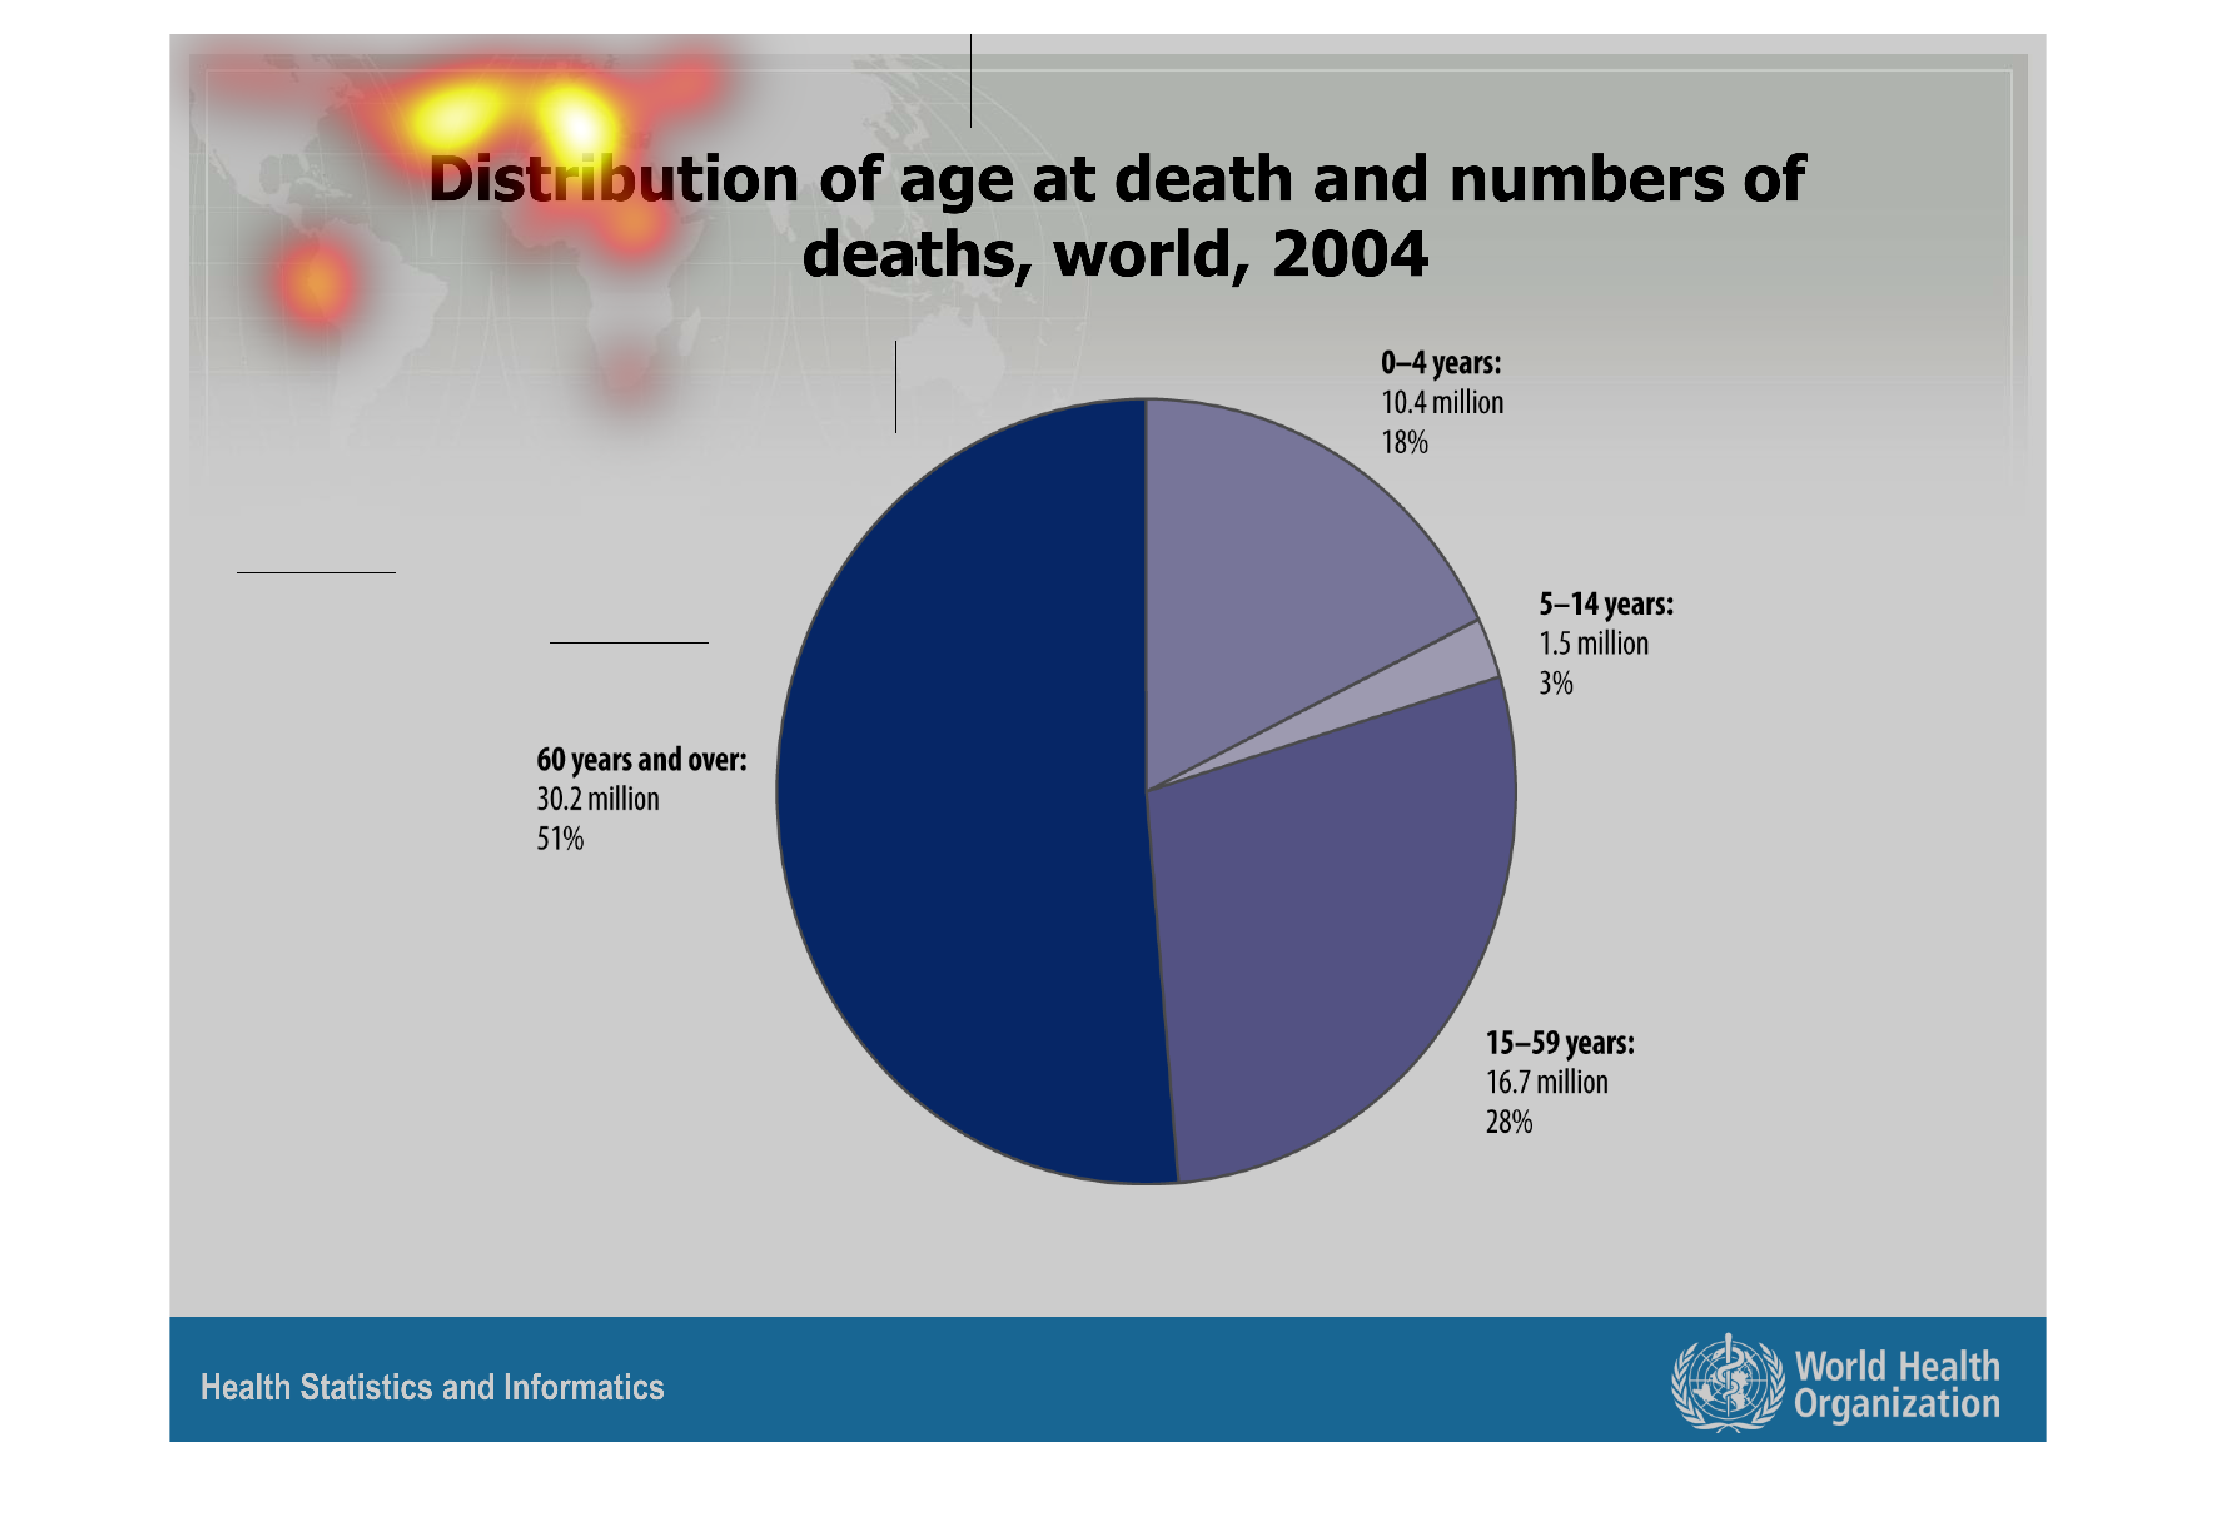
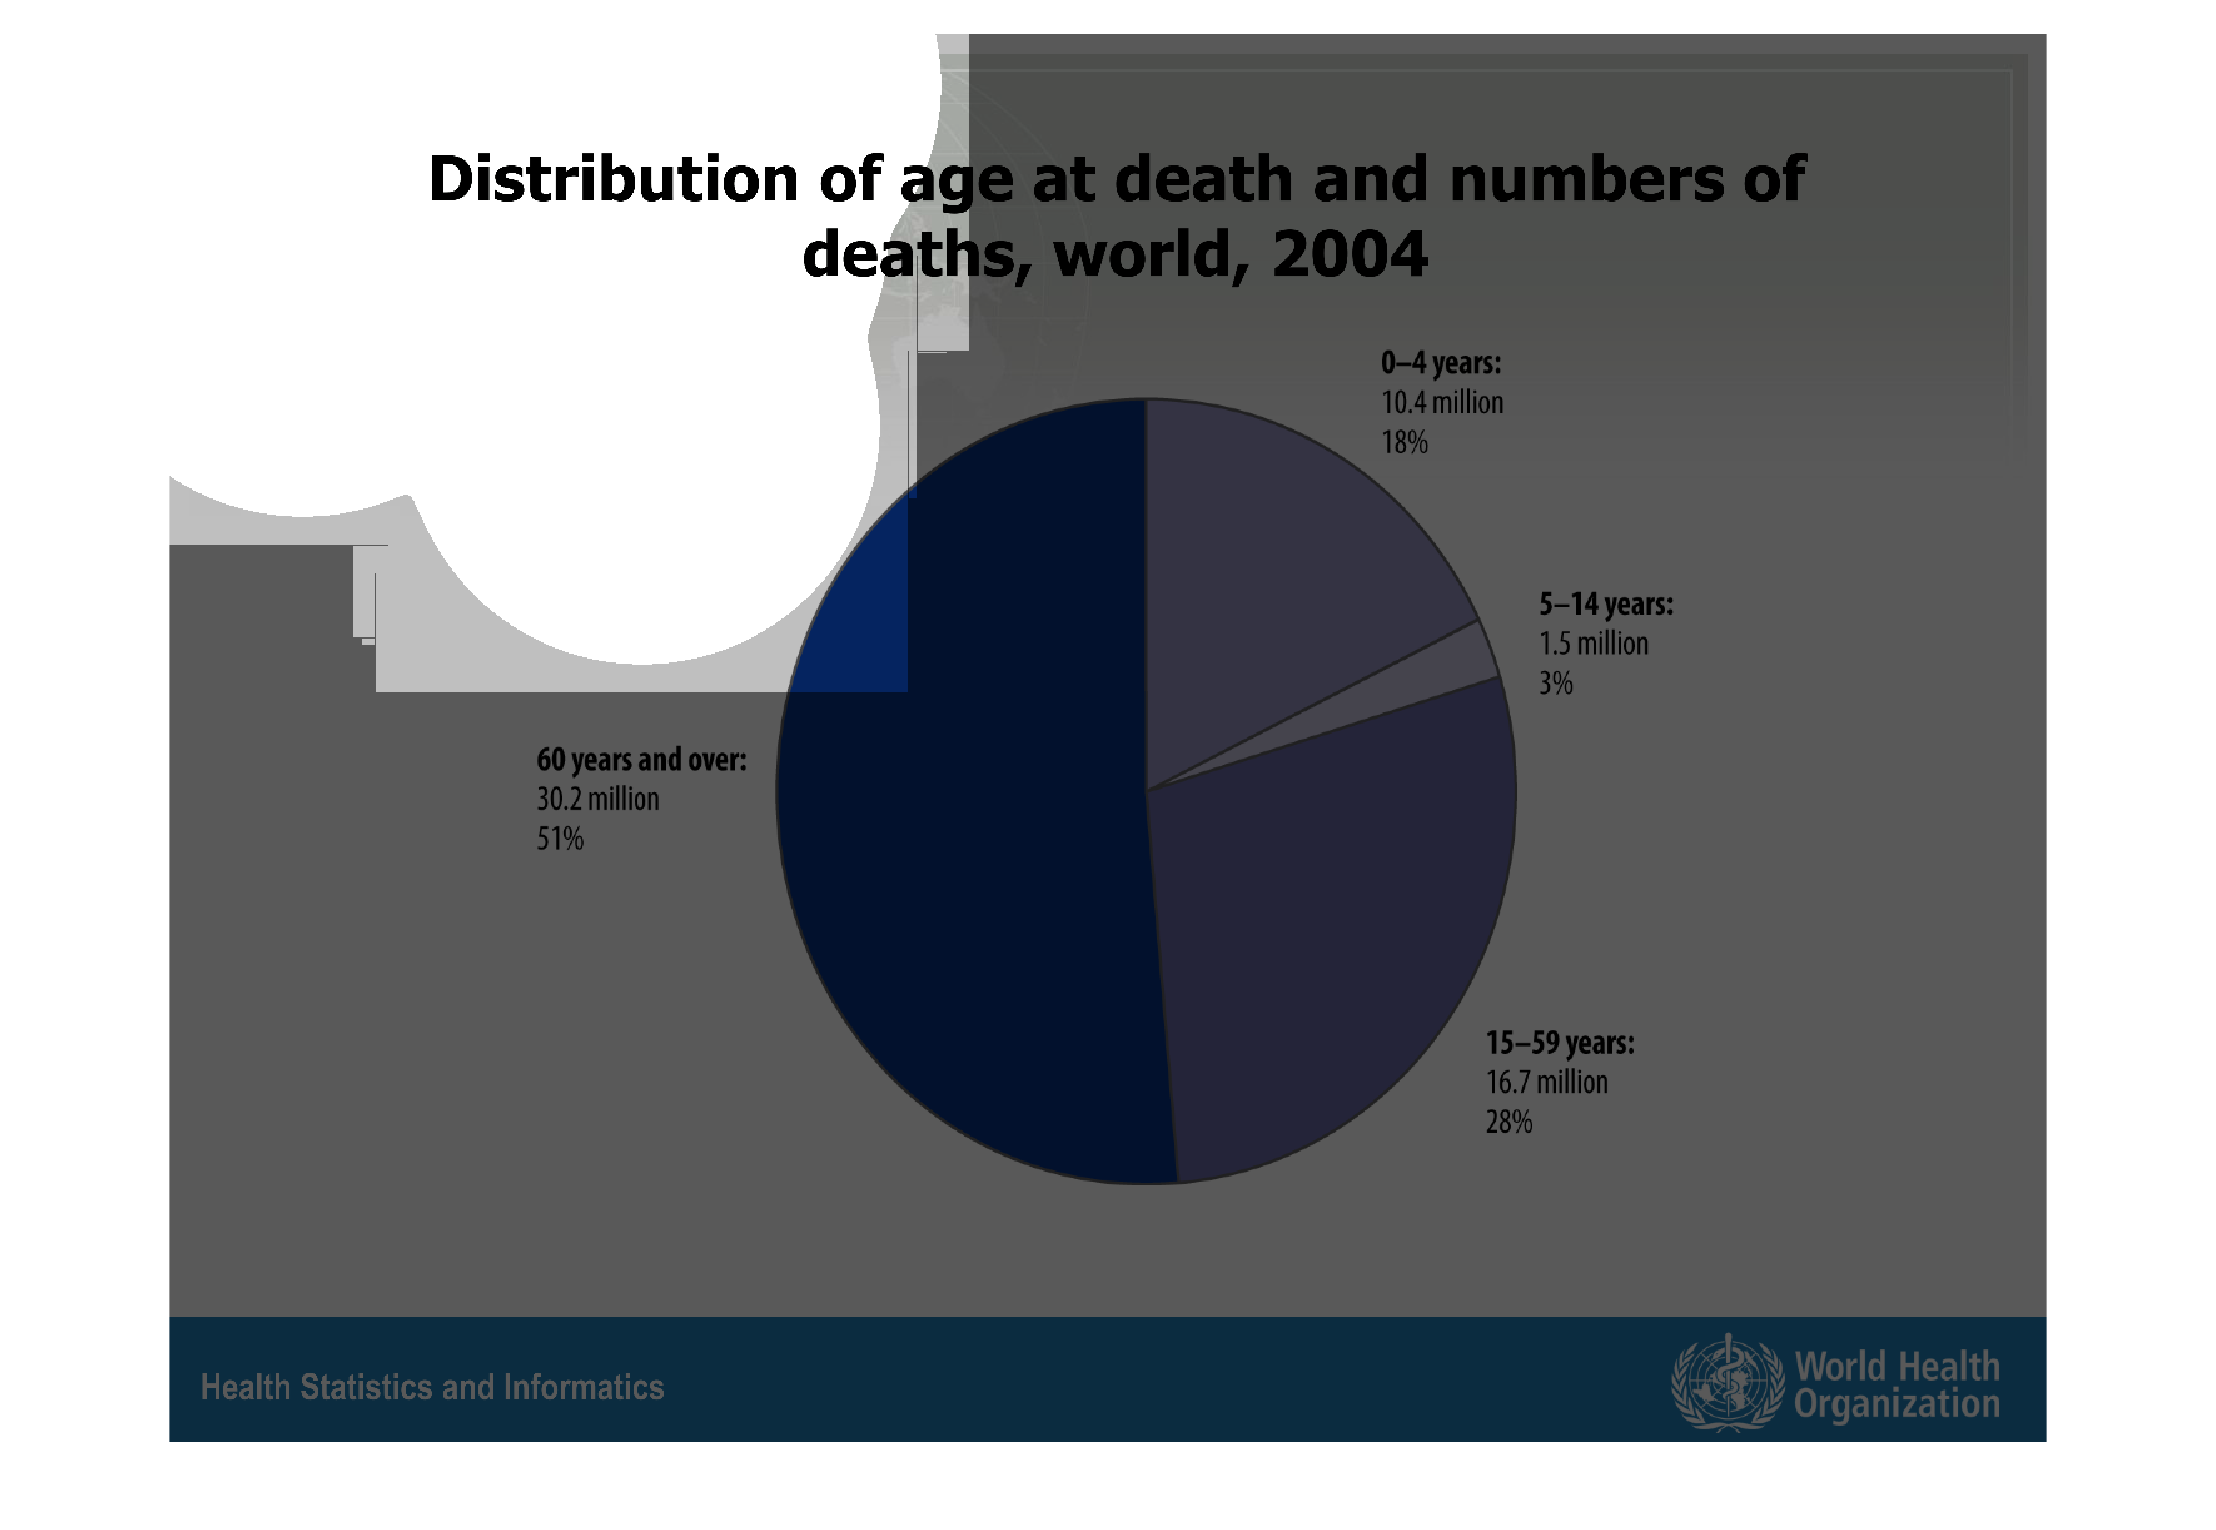
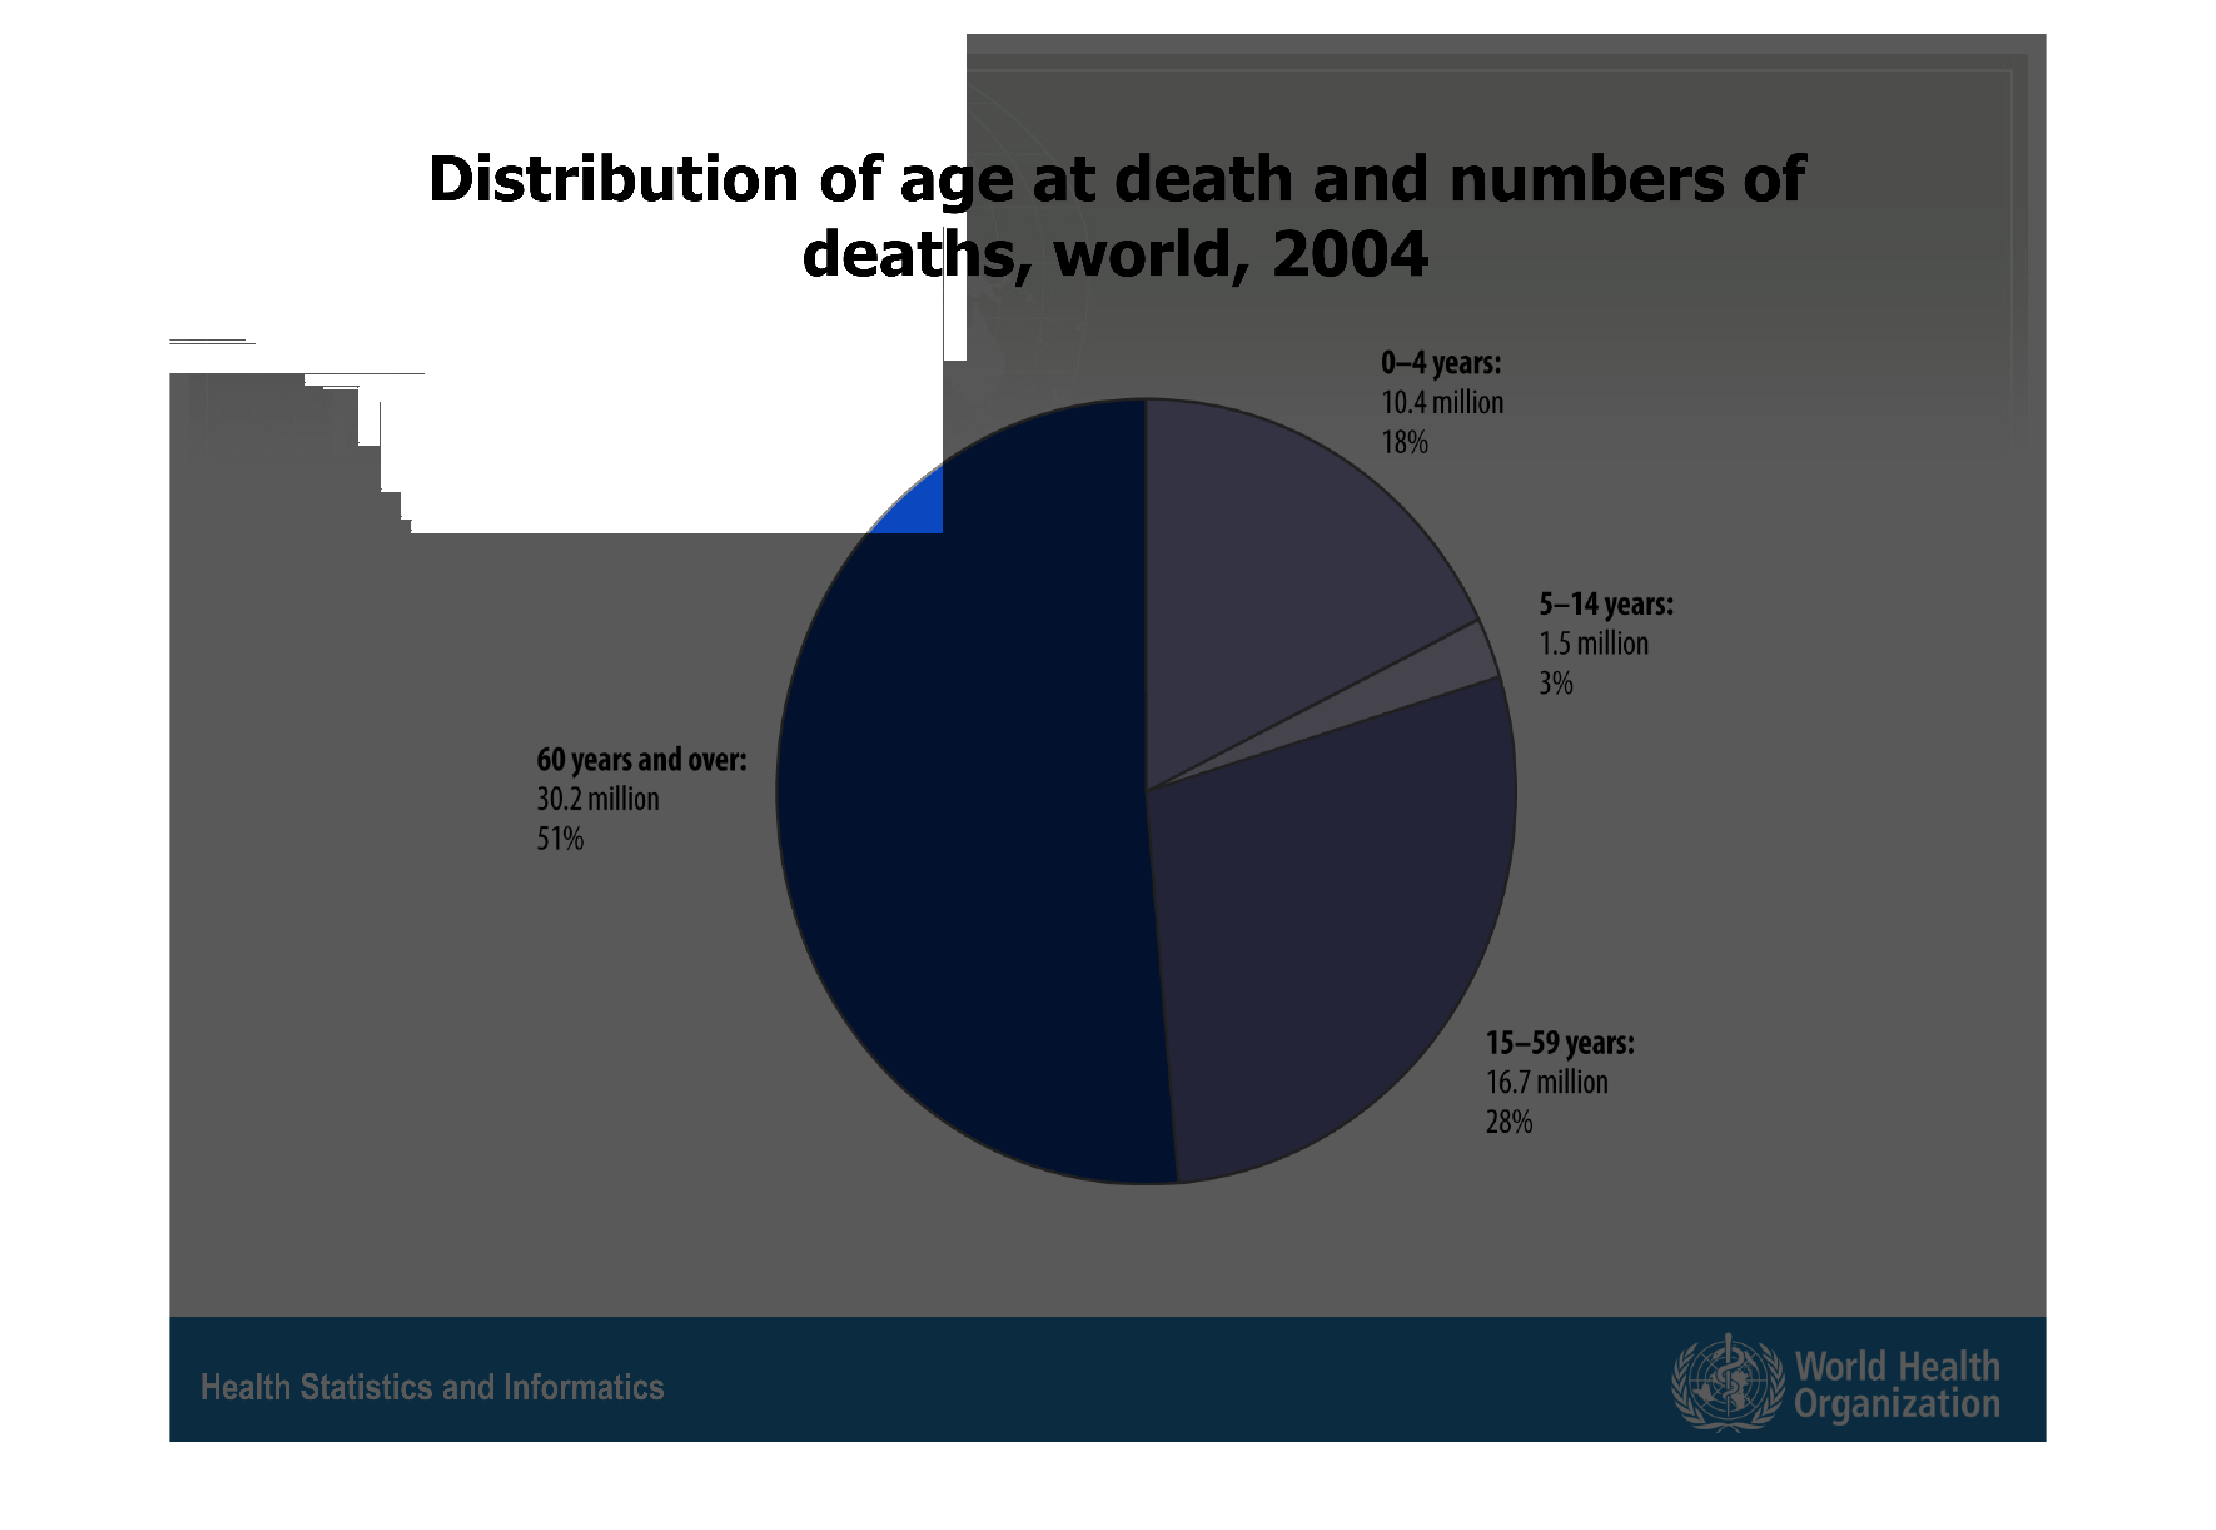
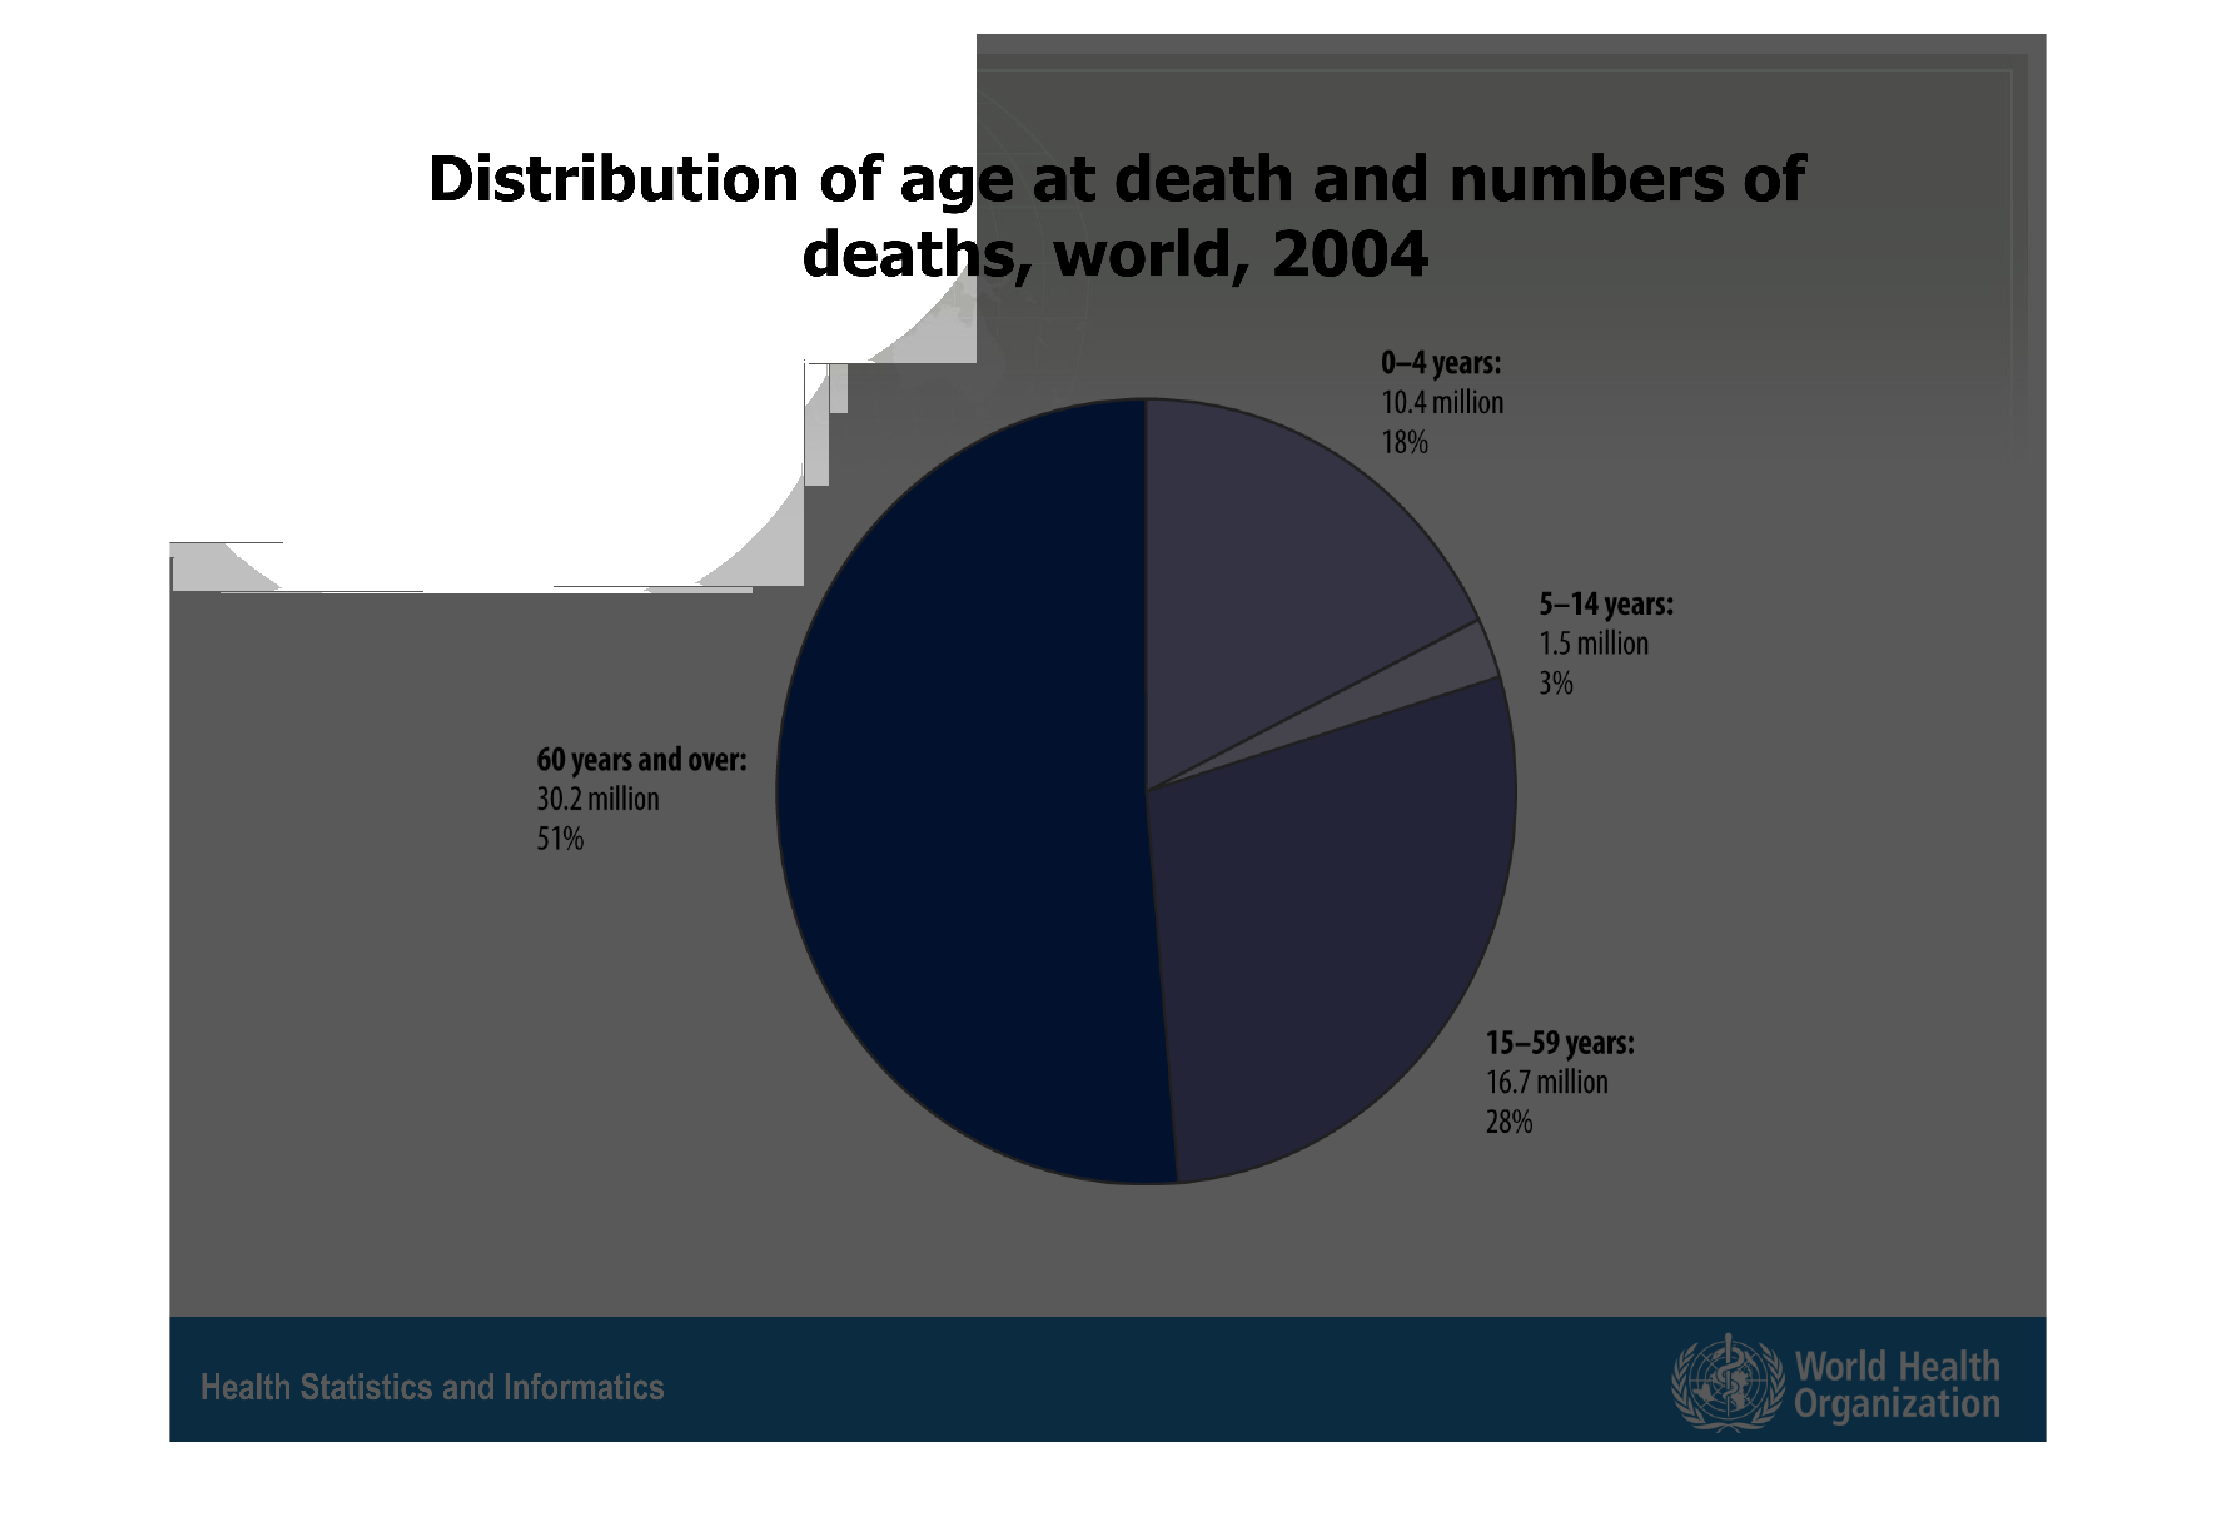
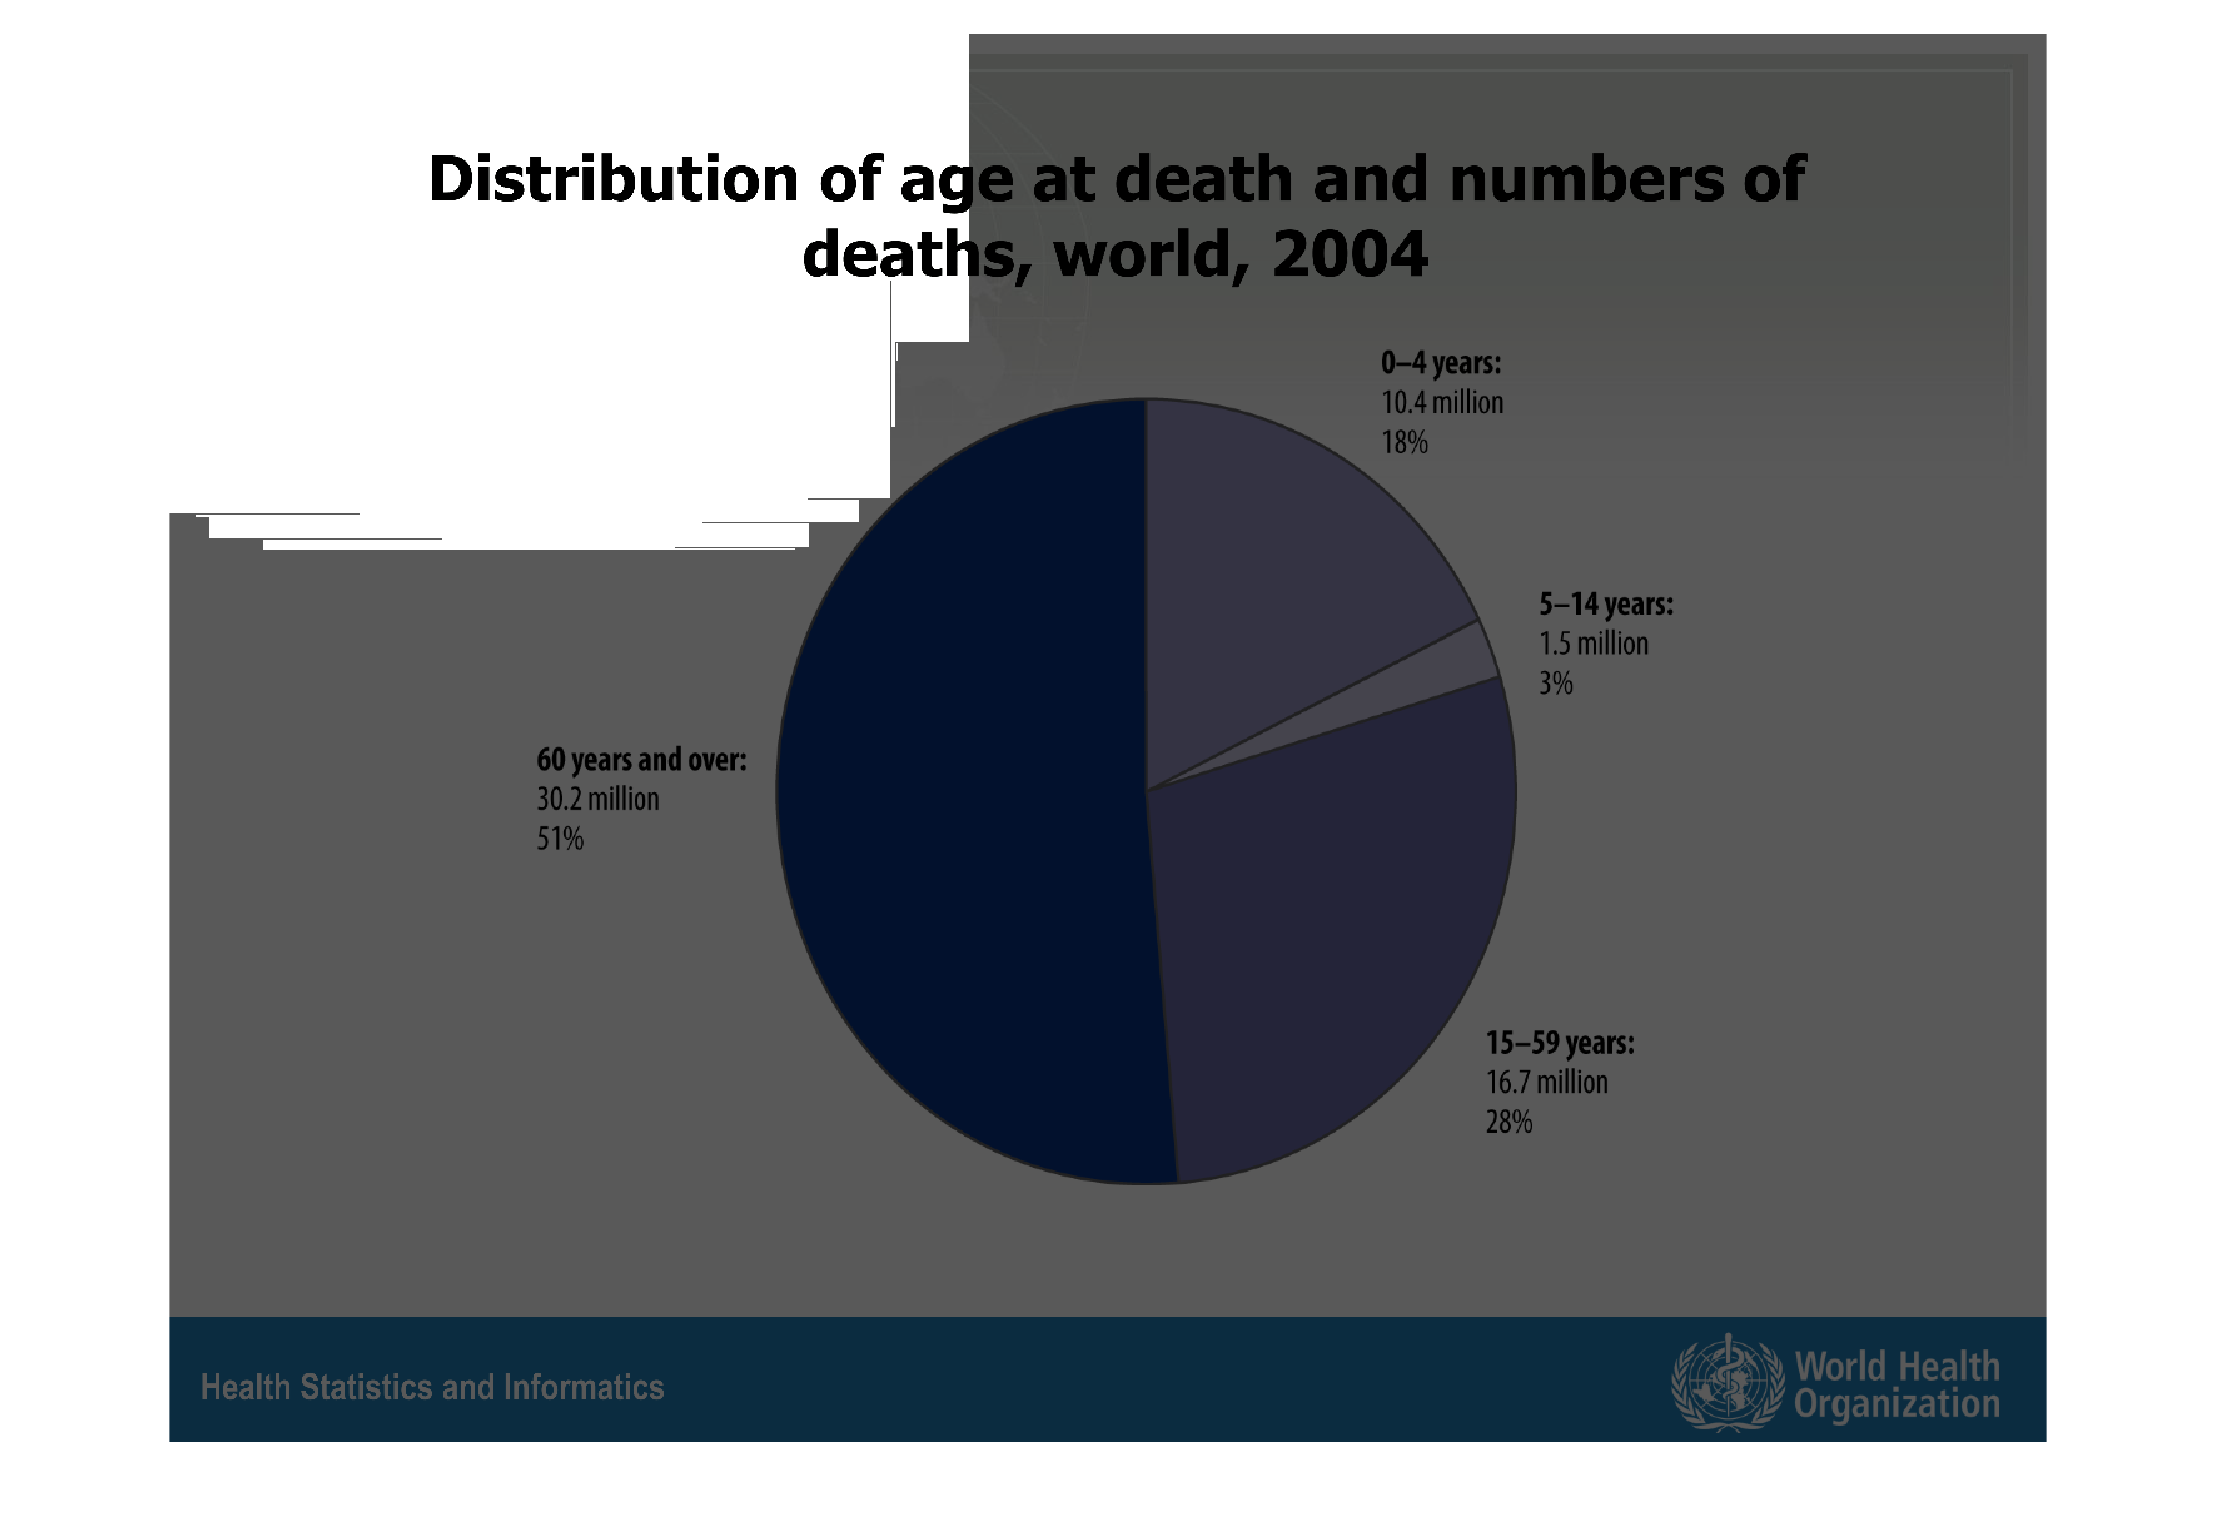
This chart breaks down the reported age at death worldwide in 2004. 0-8 years makes up 18%,
5-14 makes up 3%, 15-59 makes up 28%, and 60+ makes up the remaning 51%.
Warning: Image is too big to fit on screen; displaying at 67%
Warning: Image is too big to fit on screen; displaying at 67%
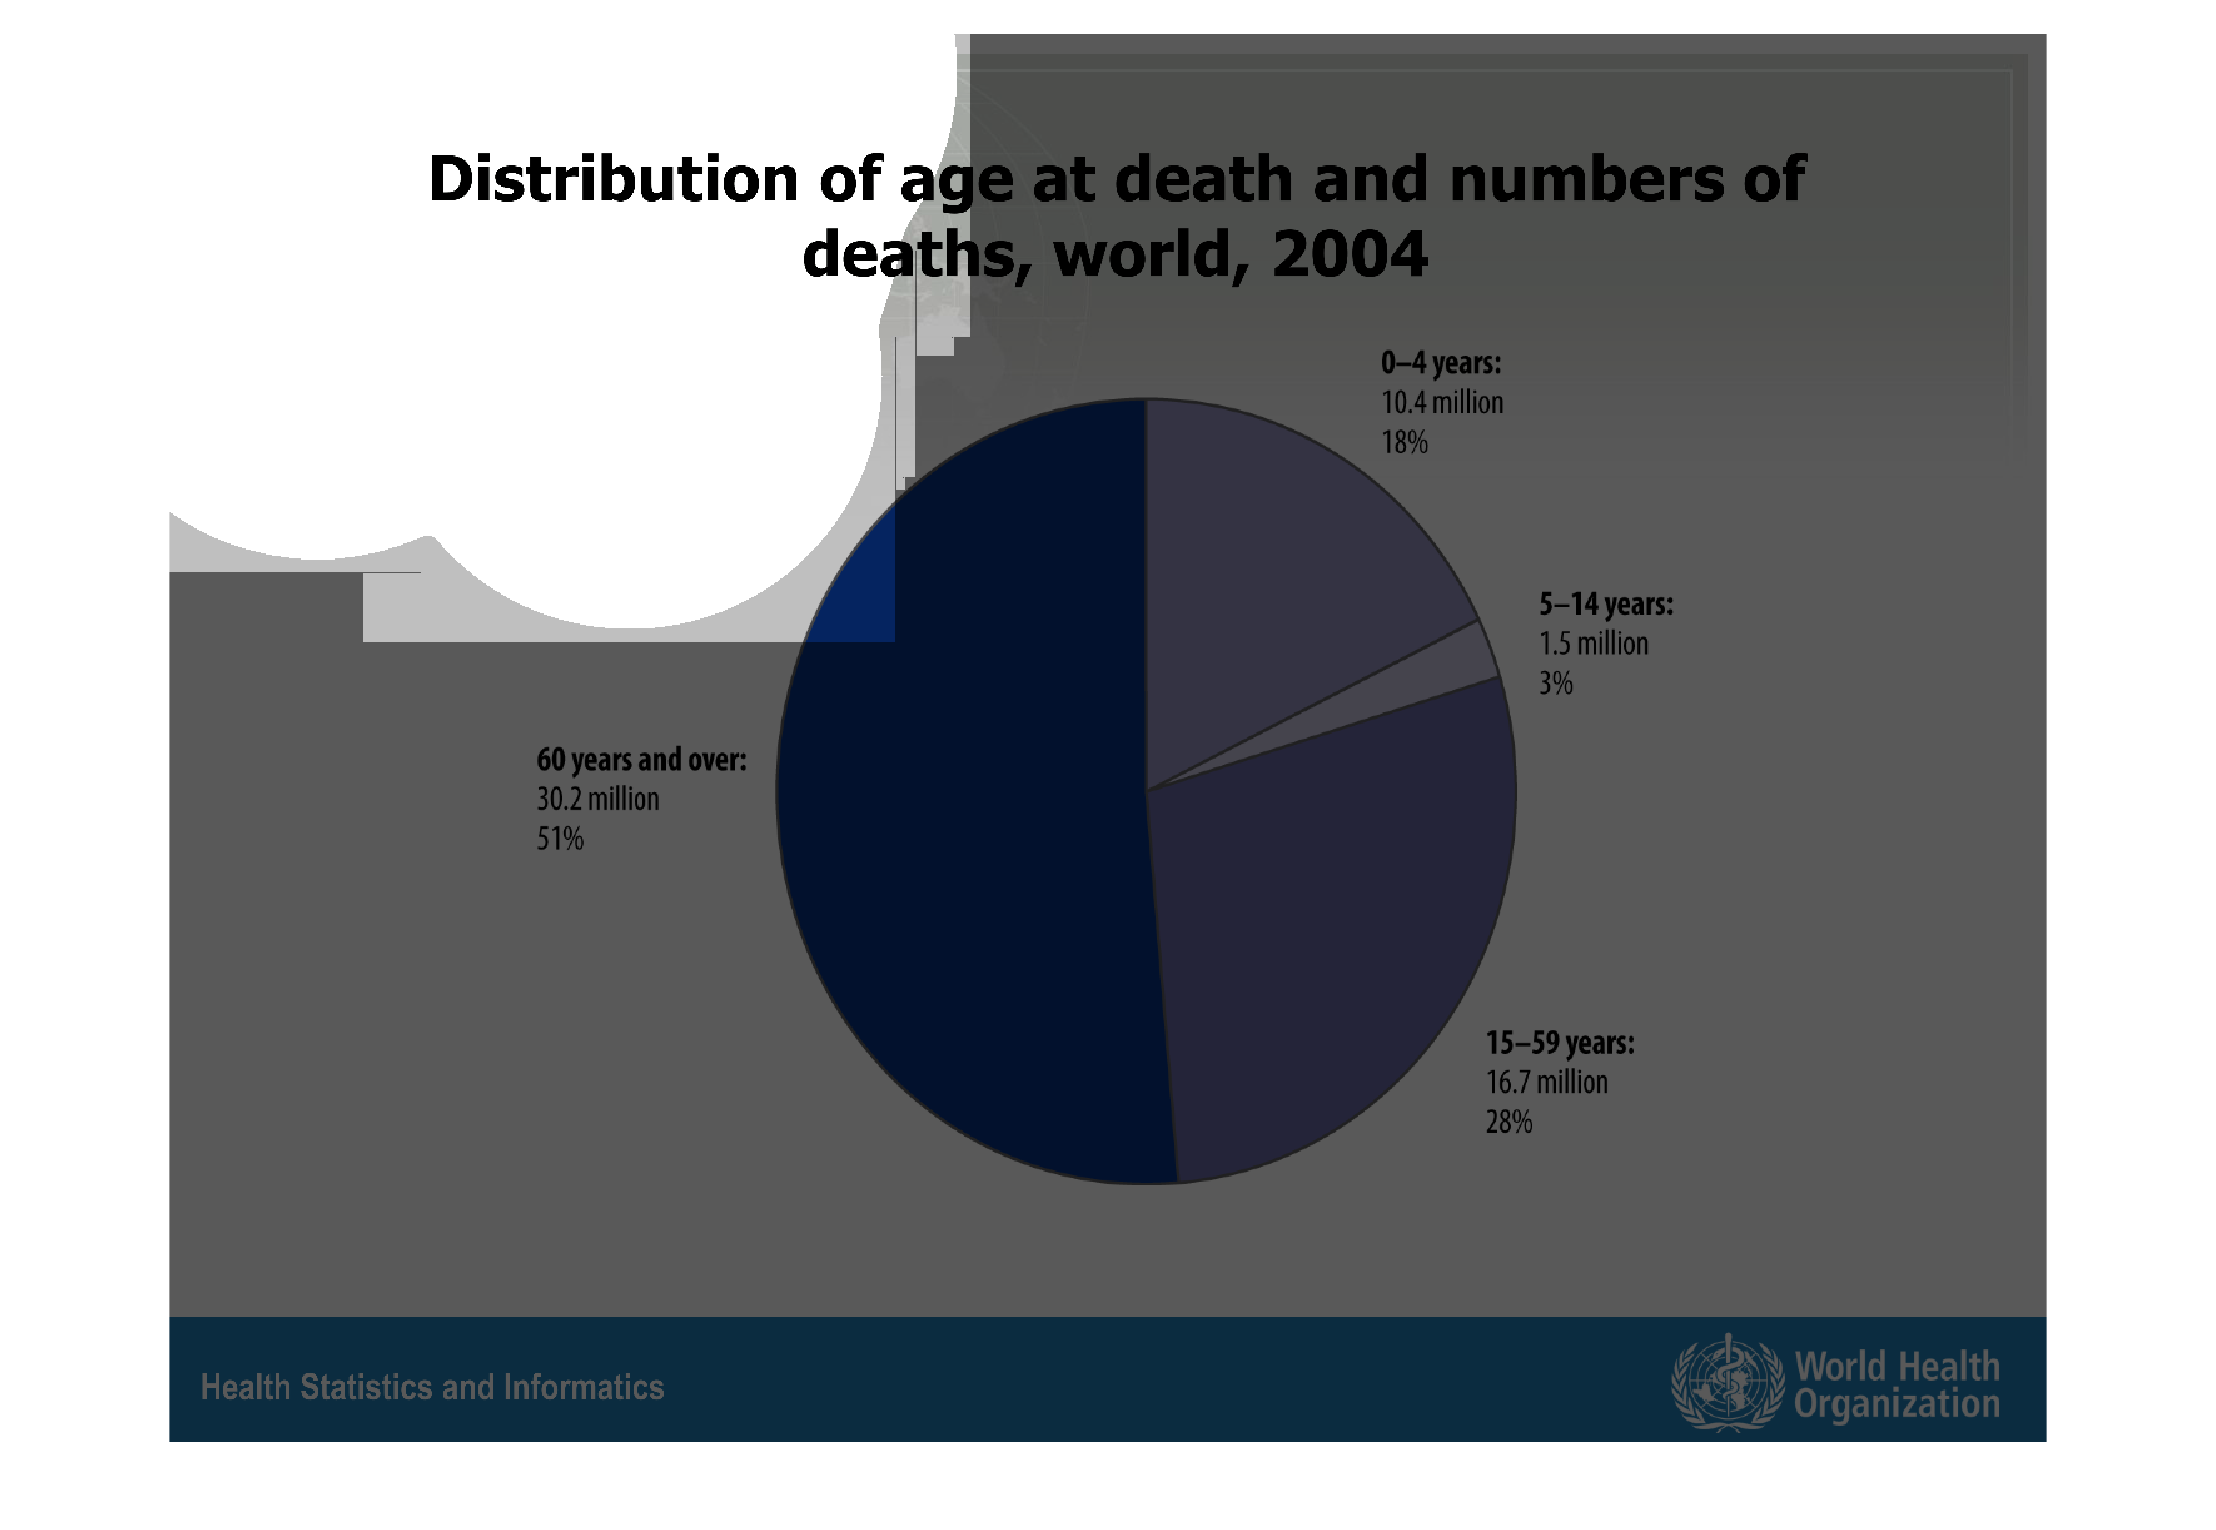
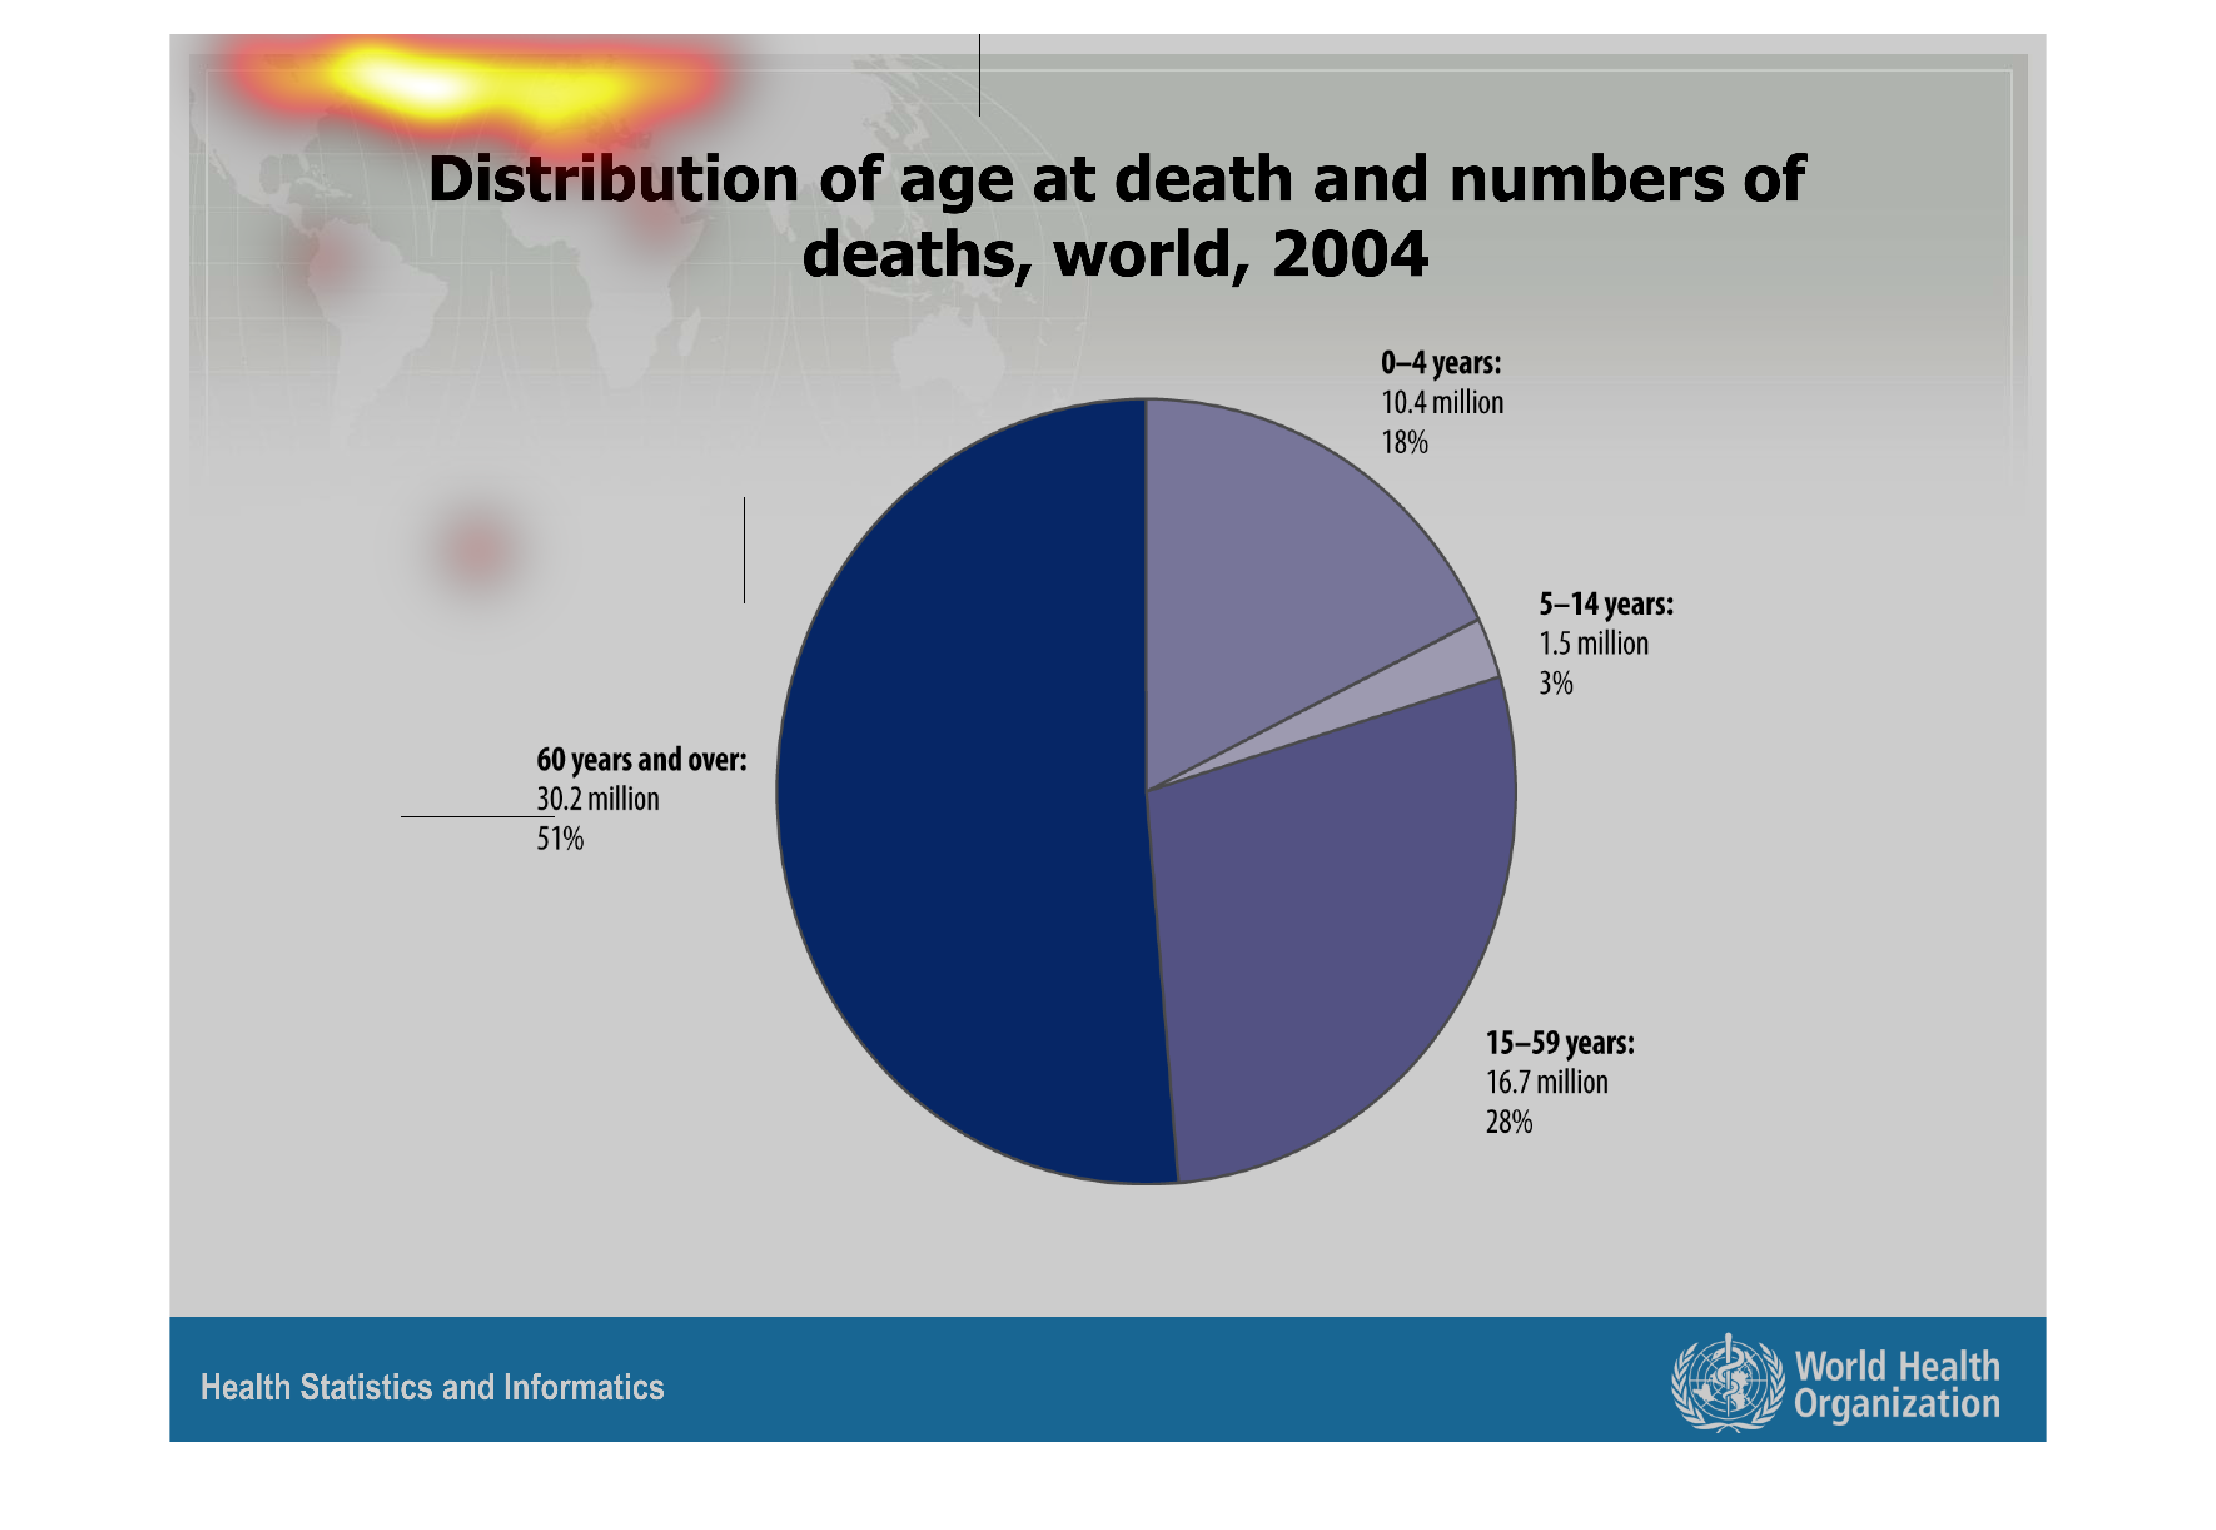
This is a pie chart of all the deaths in the world including the number of people that died
at each age.  lowest deaths accured  at ages 5-14 most deaths accured at ages 60 and older
Warning: Image is too big to fit on screen; displaying at 67%
Warning: Image is too big to fit on screen; displaying at 67%

This is a pie chart of the distribution of age at death, and the number of deaths in 2004.
between 5-14 years old there were 1.5 million deaths covering 3 percent of all deaths. ages
15-59 years old there were 16.7 million deaths consisting of 28 percent of all deaths. age
60 and over there were 30.2 million deaths consiting of 51 percent of all deaths
Warning: Image is too big to fit on screen; displaying at 67%
Warning: Image is too big to fit on screen; displaying at 67%
This pie chart shows the distribution of the age at death and numbers of deaths in the world
in 2004. The pie chart breaks down into age groups, with numbers of deaths in each group.
Warning: Image is too big to fit on screen; displaying at 67%
Warning: Image is too big to fit on screen; displaying at 67%
This handmade chart shows the distribution of deaths worldwide by age. Obviously old age is
the primary age people die around the world at over 50%
Warning: Image is too big to fit on screen; displaying at 67%
Warning: Image is too big to fit on screen; displaying at 67%
This graph shows for the year 2004. It is the number of deaths and the ages of death. It is
in groups starting at age 0 all the way through 60 years and older.
Warning: Image is too big to fit on screen; displaying at 67%
Warning: Image is too big to fit on screen; displaying at 67%
This chart describes distribution of age at death and numbers of death, world, for the year
2004. The chart is divided into four categories, include 0-4 years.
Warning: Image is too big to fit on screen; displaying at 67%
Warning: Image is too big to fit on screen; displaying at 67%
The graph displays the age at death and the number of deaths that occur at that age. The largest
portion of the graph is 60 years and over which accounts for 51% of the data.
Warning: Image is too big to fit on screen; displaying at 67%
Warning: Image is too big to fit on screen; displaying at 67%
The figure presented is titled Distribution of age at death and numbers of deaths, world,
2004.  The figure is a pie chart containing the data for age at death.
Warning: Image is too big to fit on screen; displaying at 67%
Warning: Image is too big to fit on screen; displaying at 67%
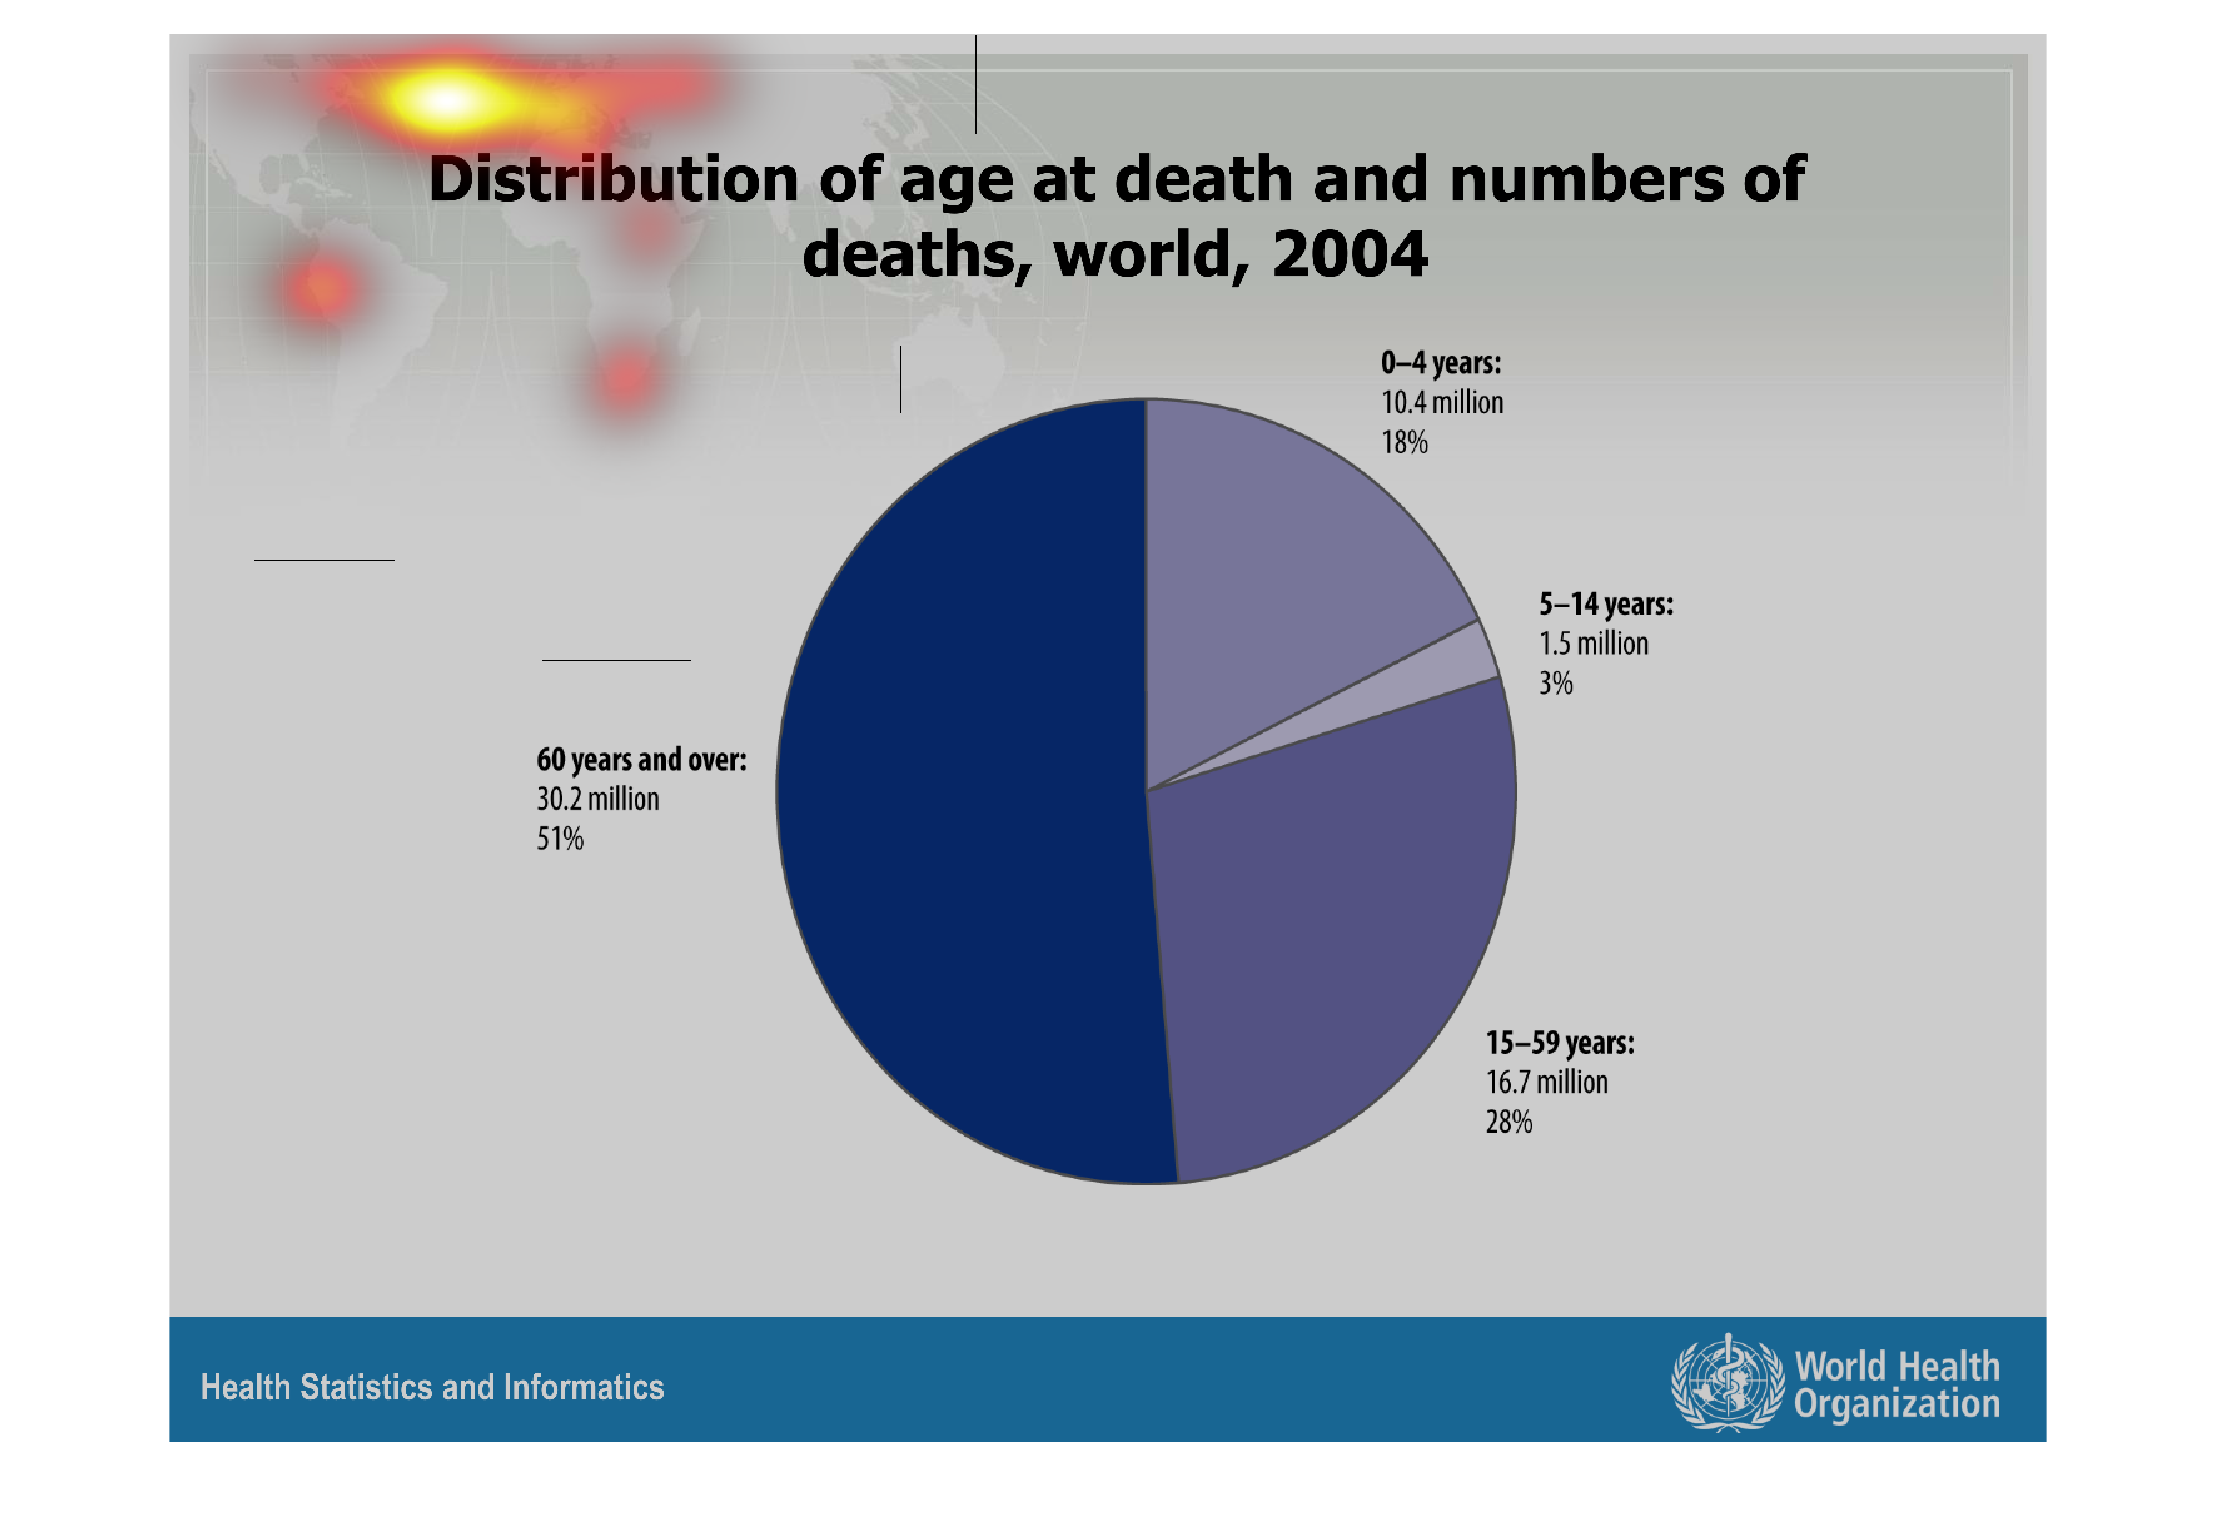
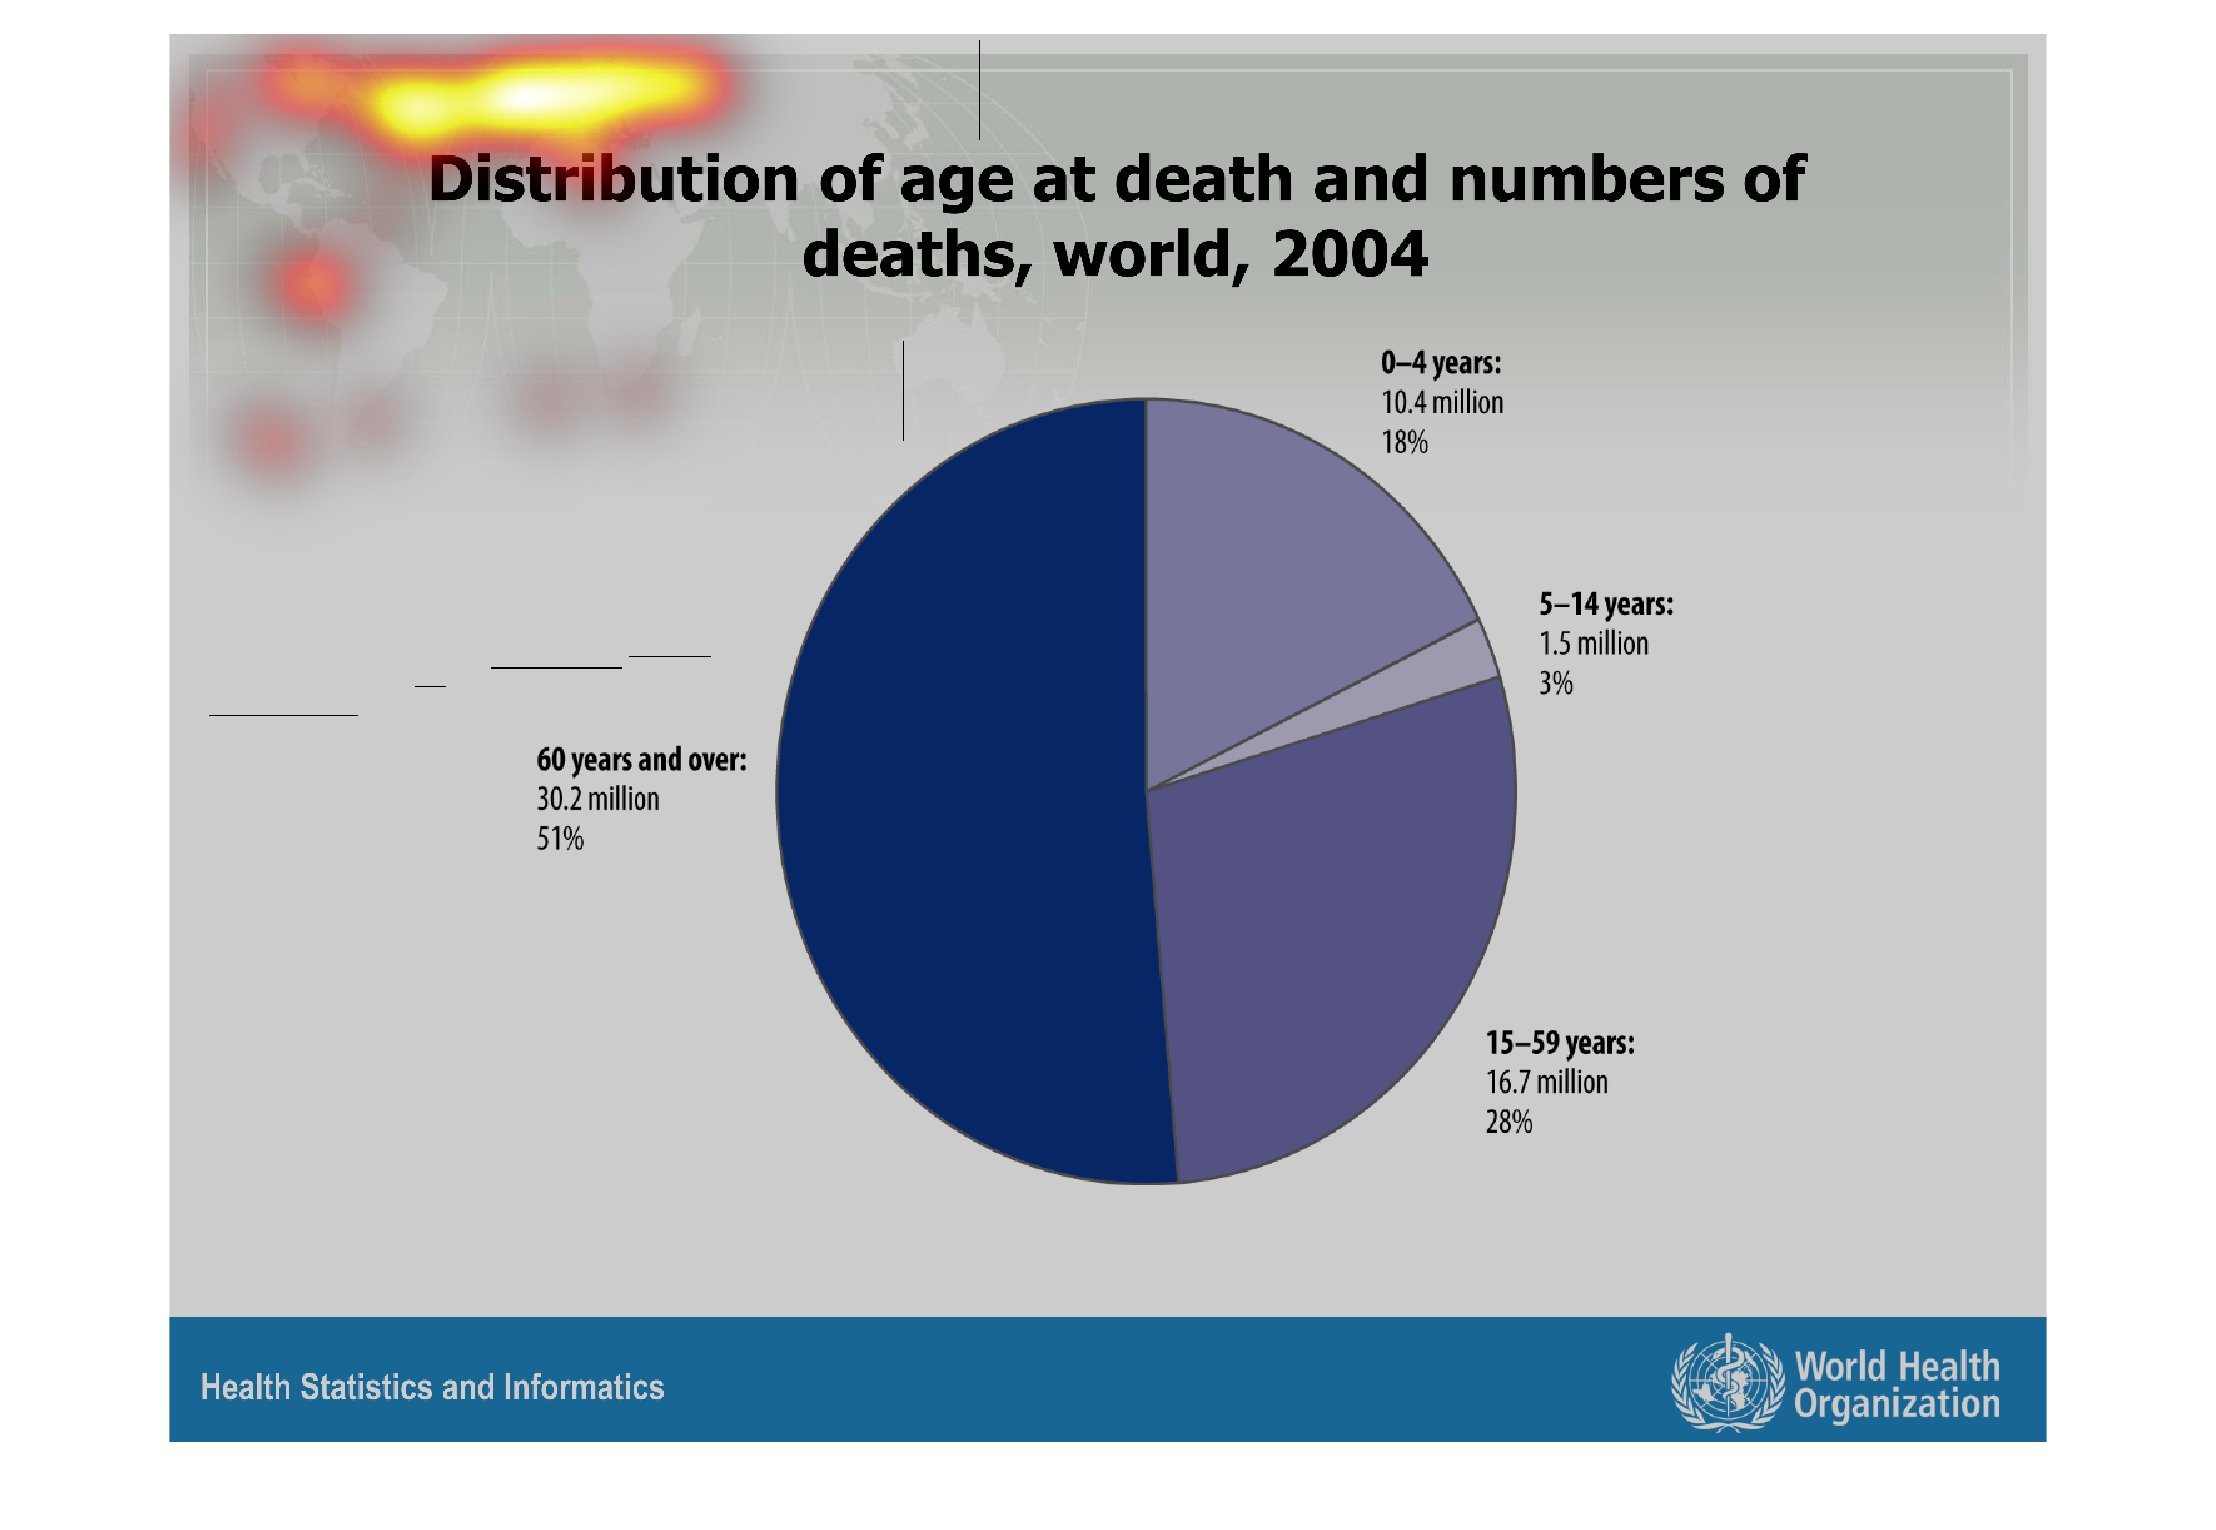
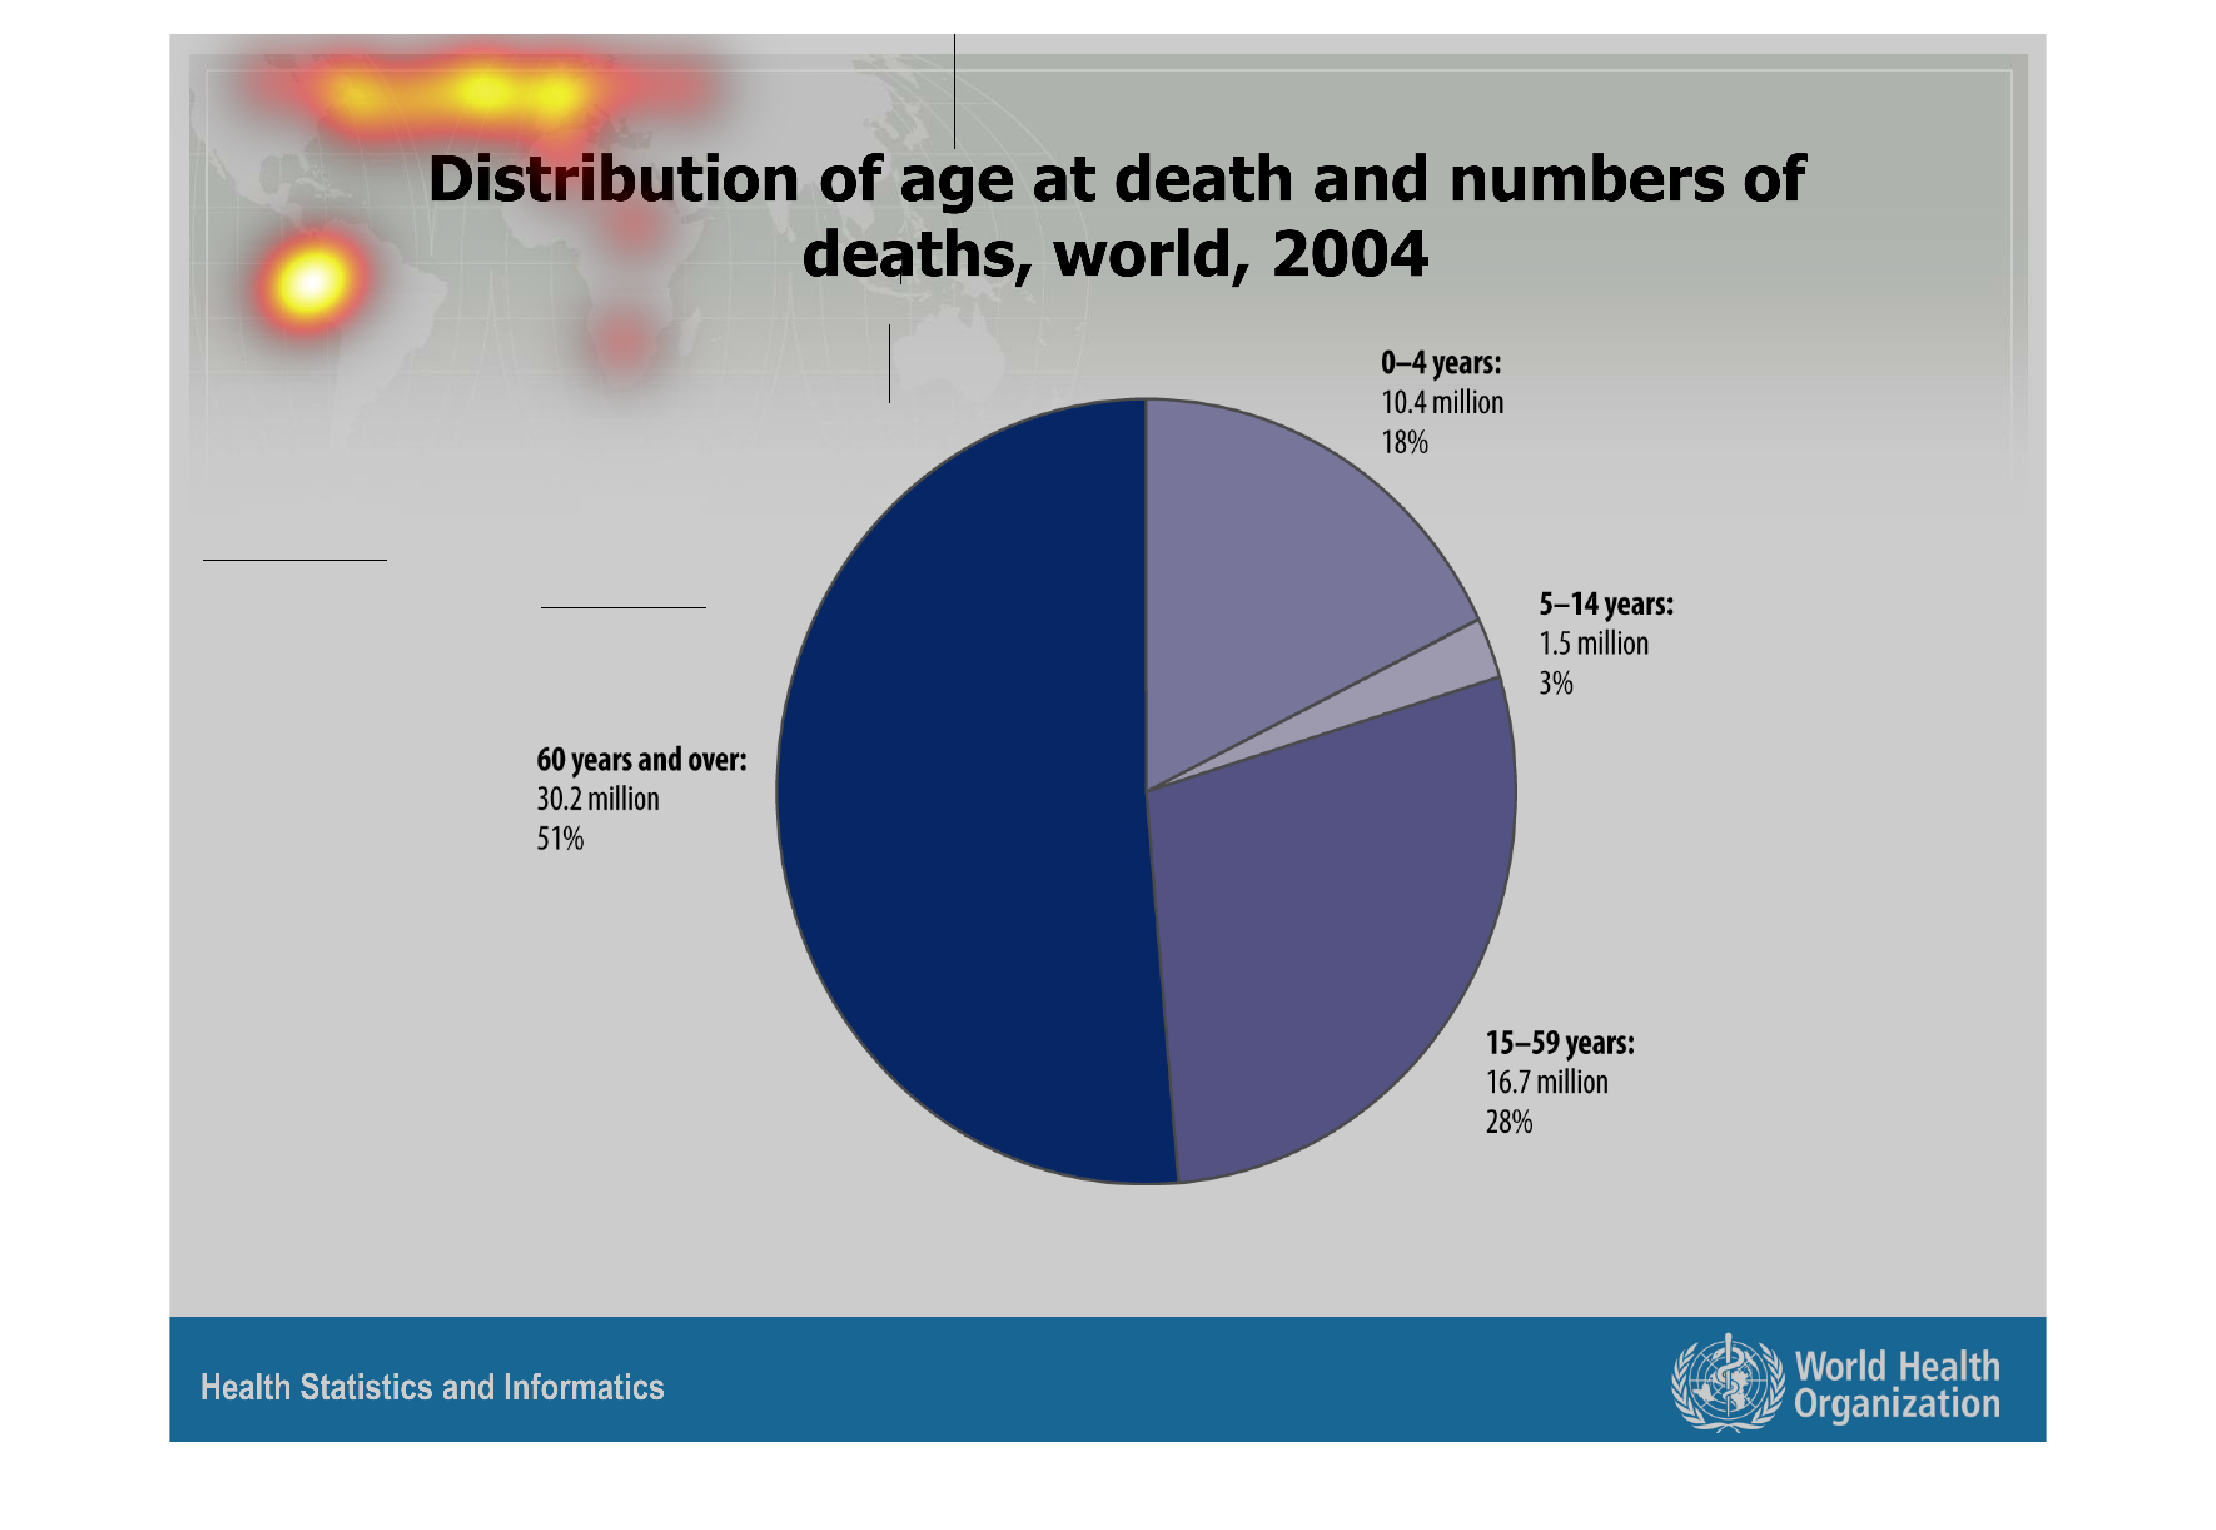
A pie chart showing the age at death and numbers of deaths worldwide as of 2004. Children
from 0-4 accounted for 18% with 10.4 million deaths, 5-14 year olds were 3% with 1.5 million
deaths, 15-59 years were 28% with 16.7 million deaths, and 60+ was 51% with 30.2 million deaths.
Warning: Image is too big to fit on screen; displaying at 67%
Warning: Image is too big to fit on screen; displaying at 67%