Warning: Image is too big to fit on screen; displaying at 67%
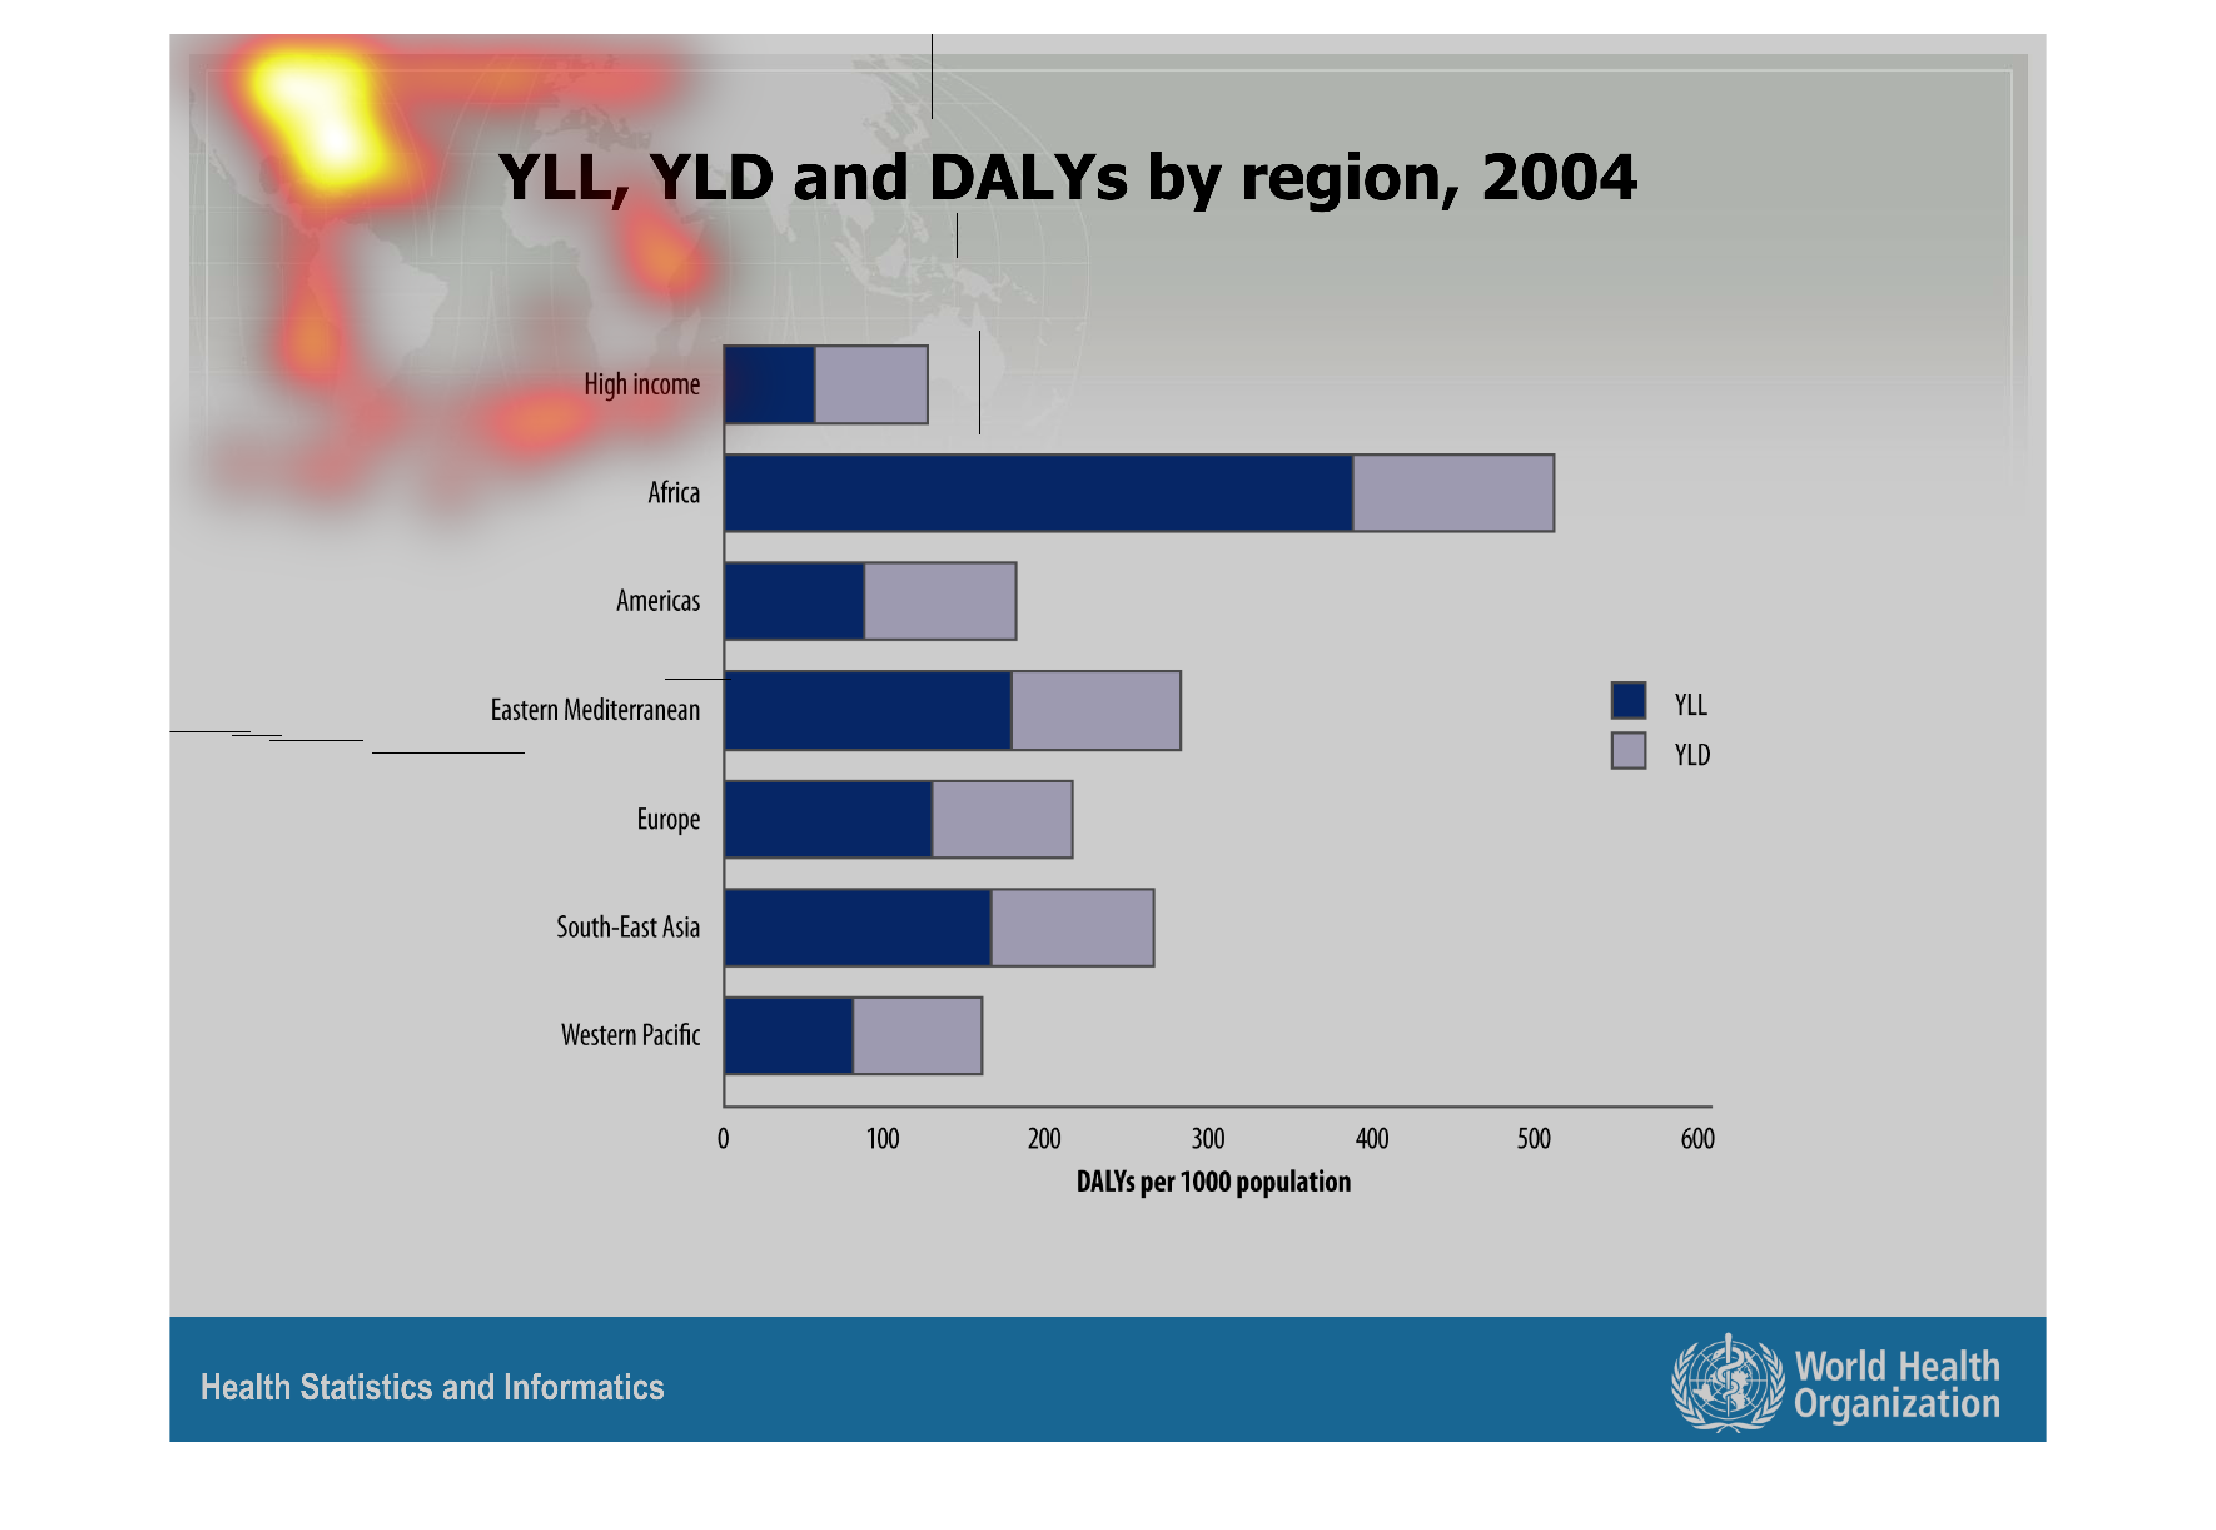
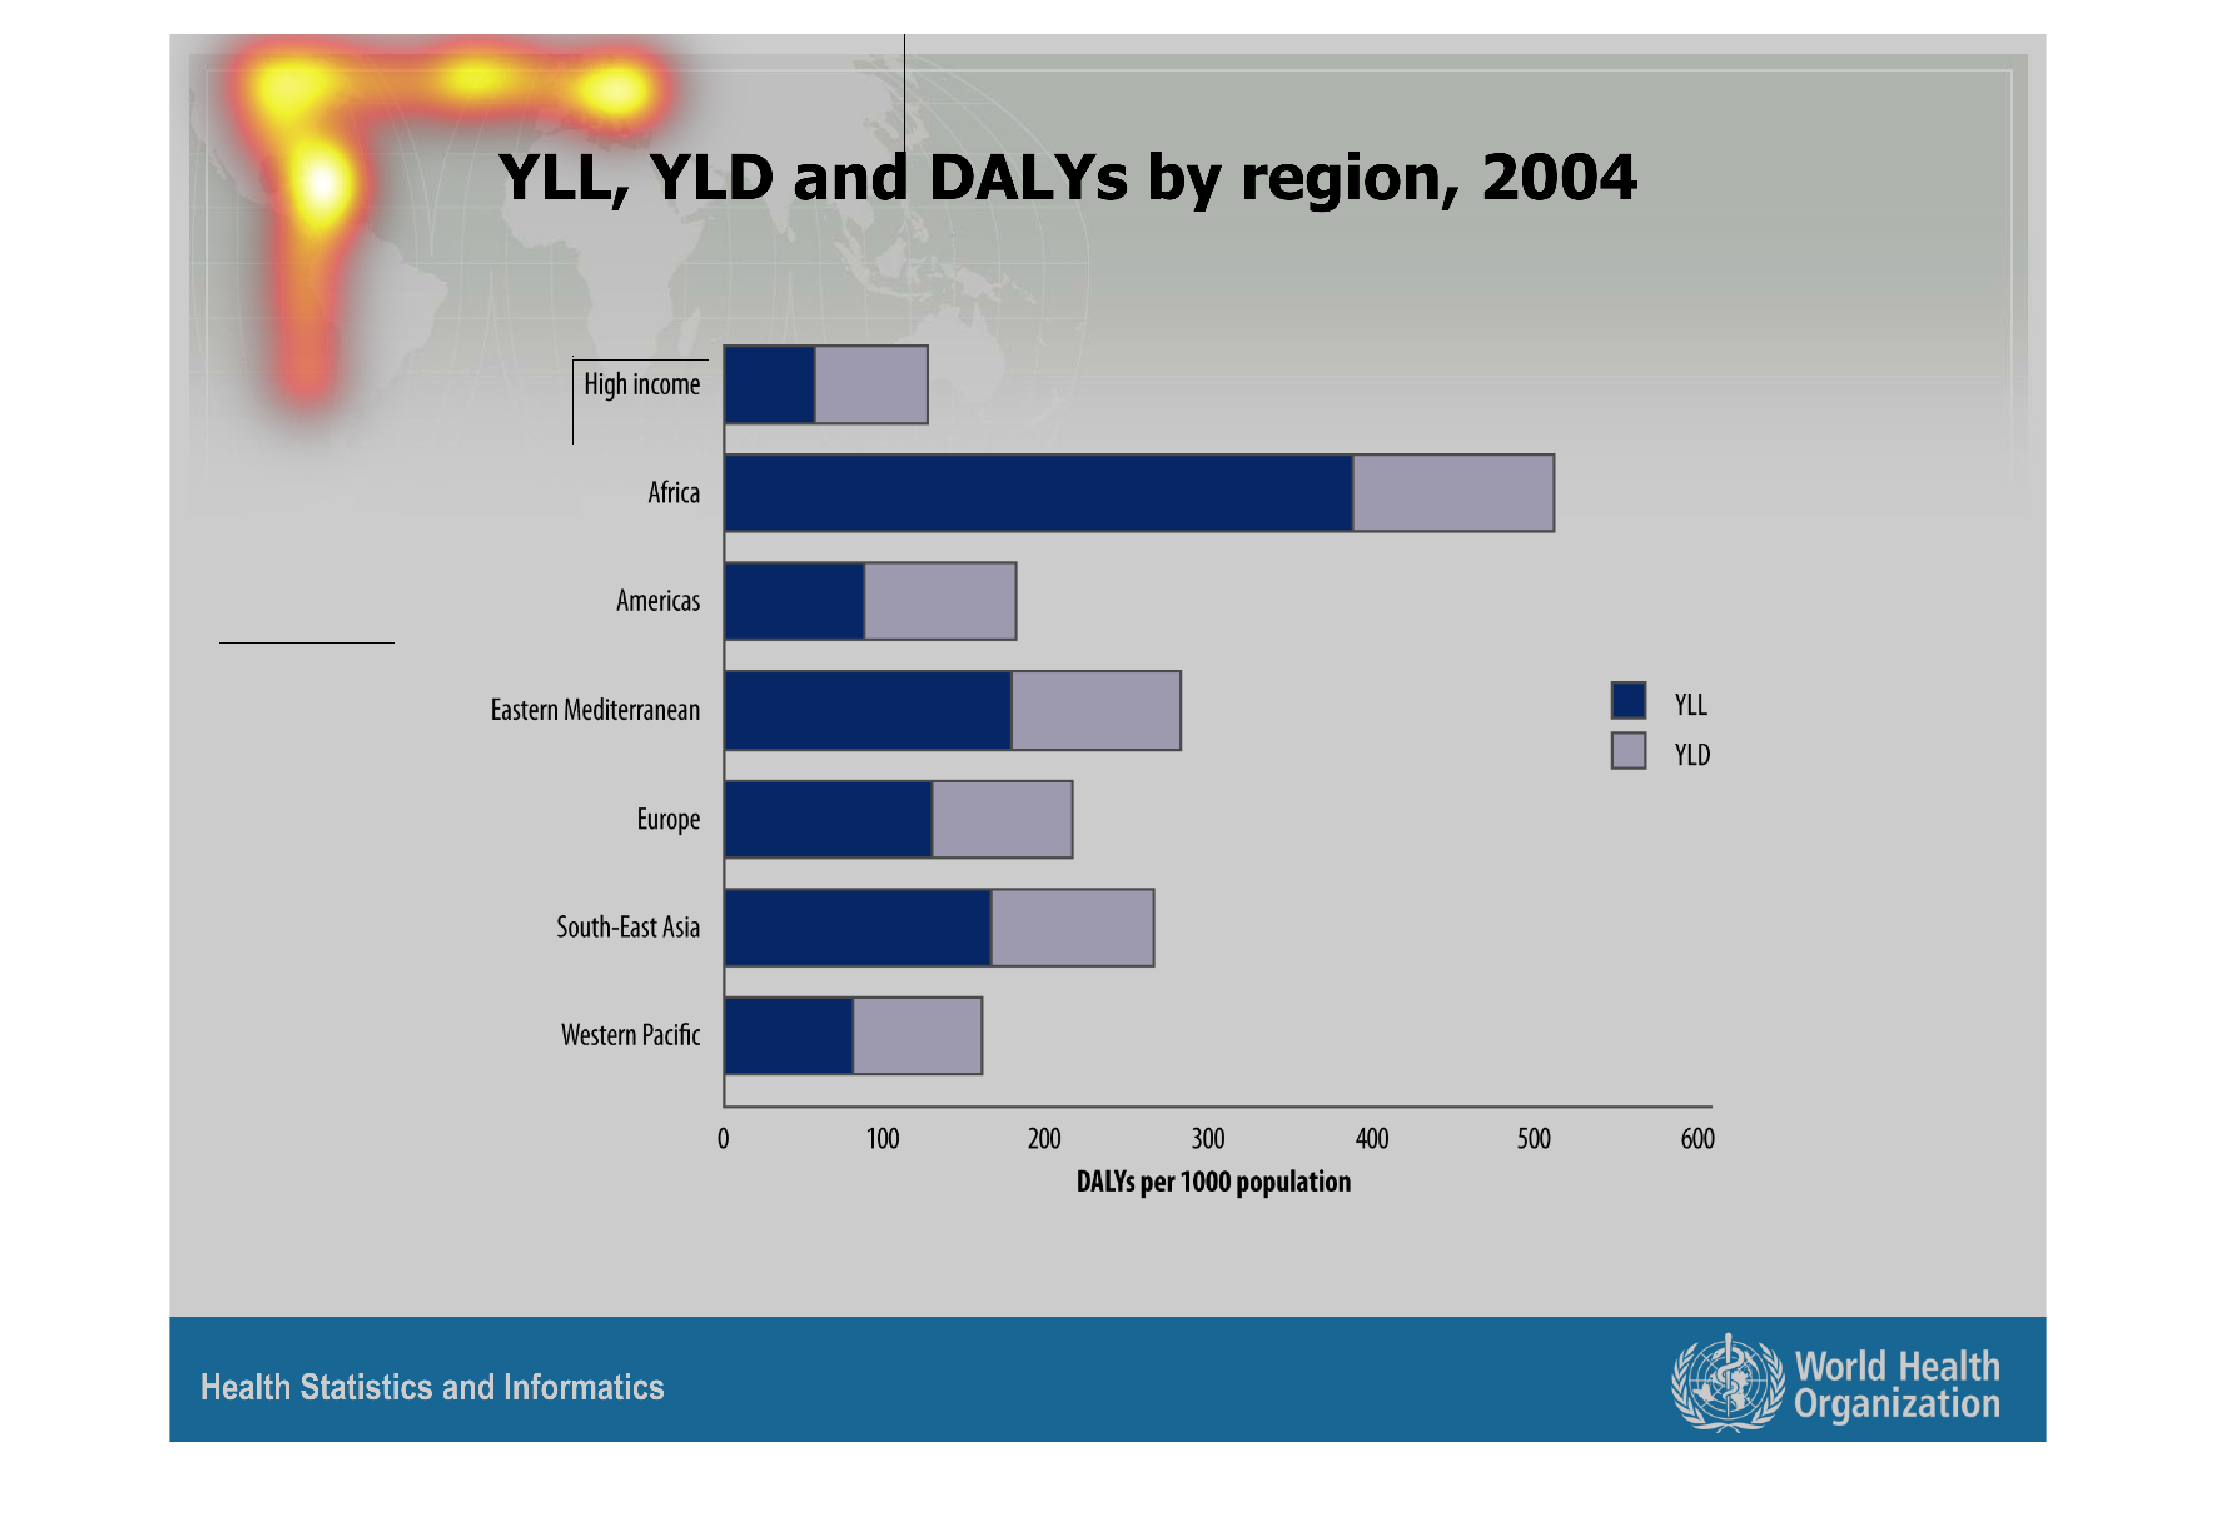
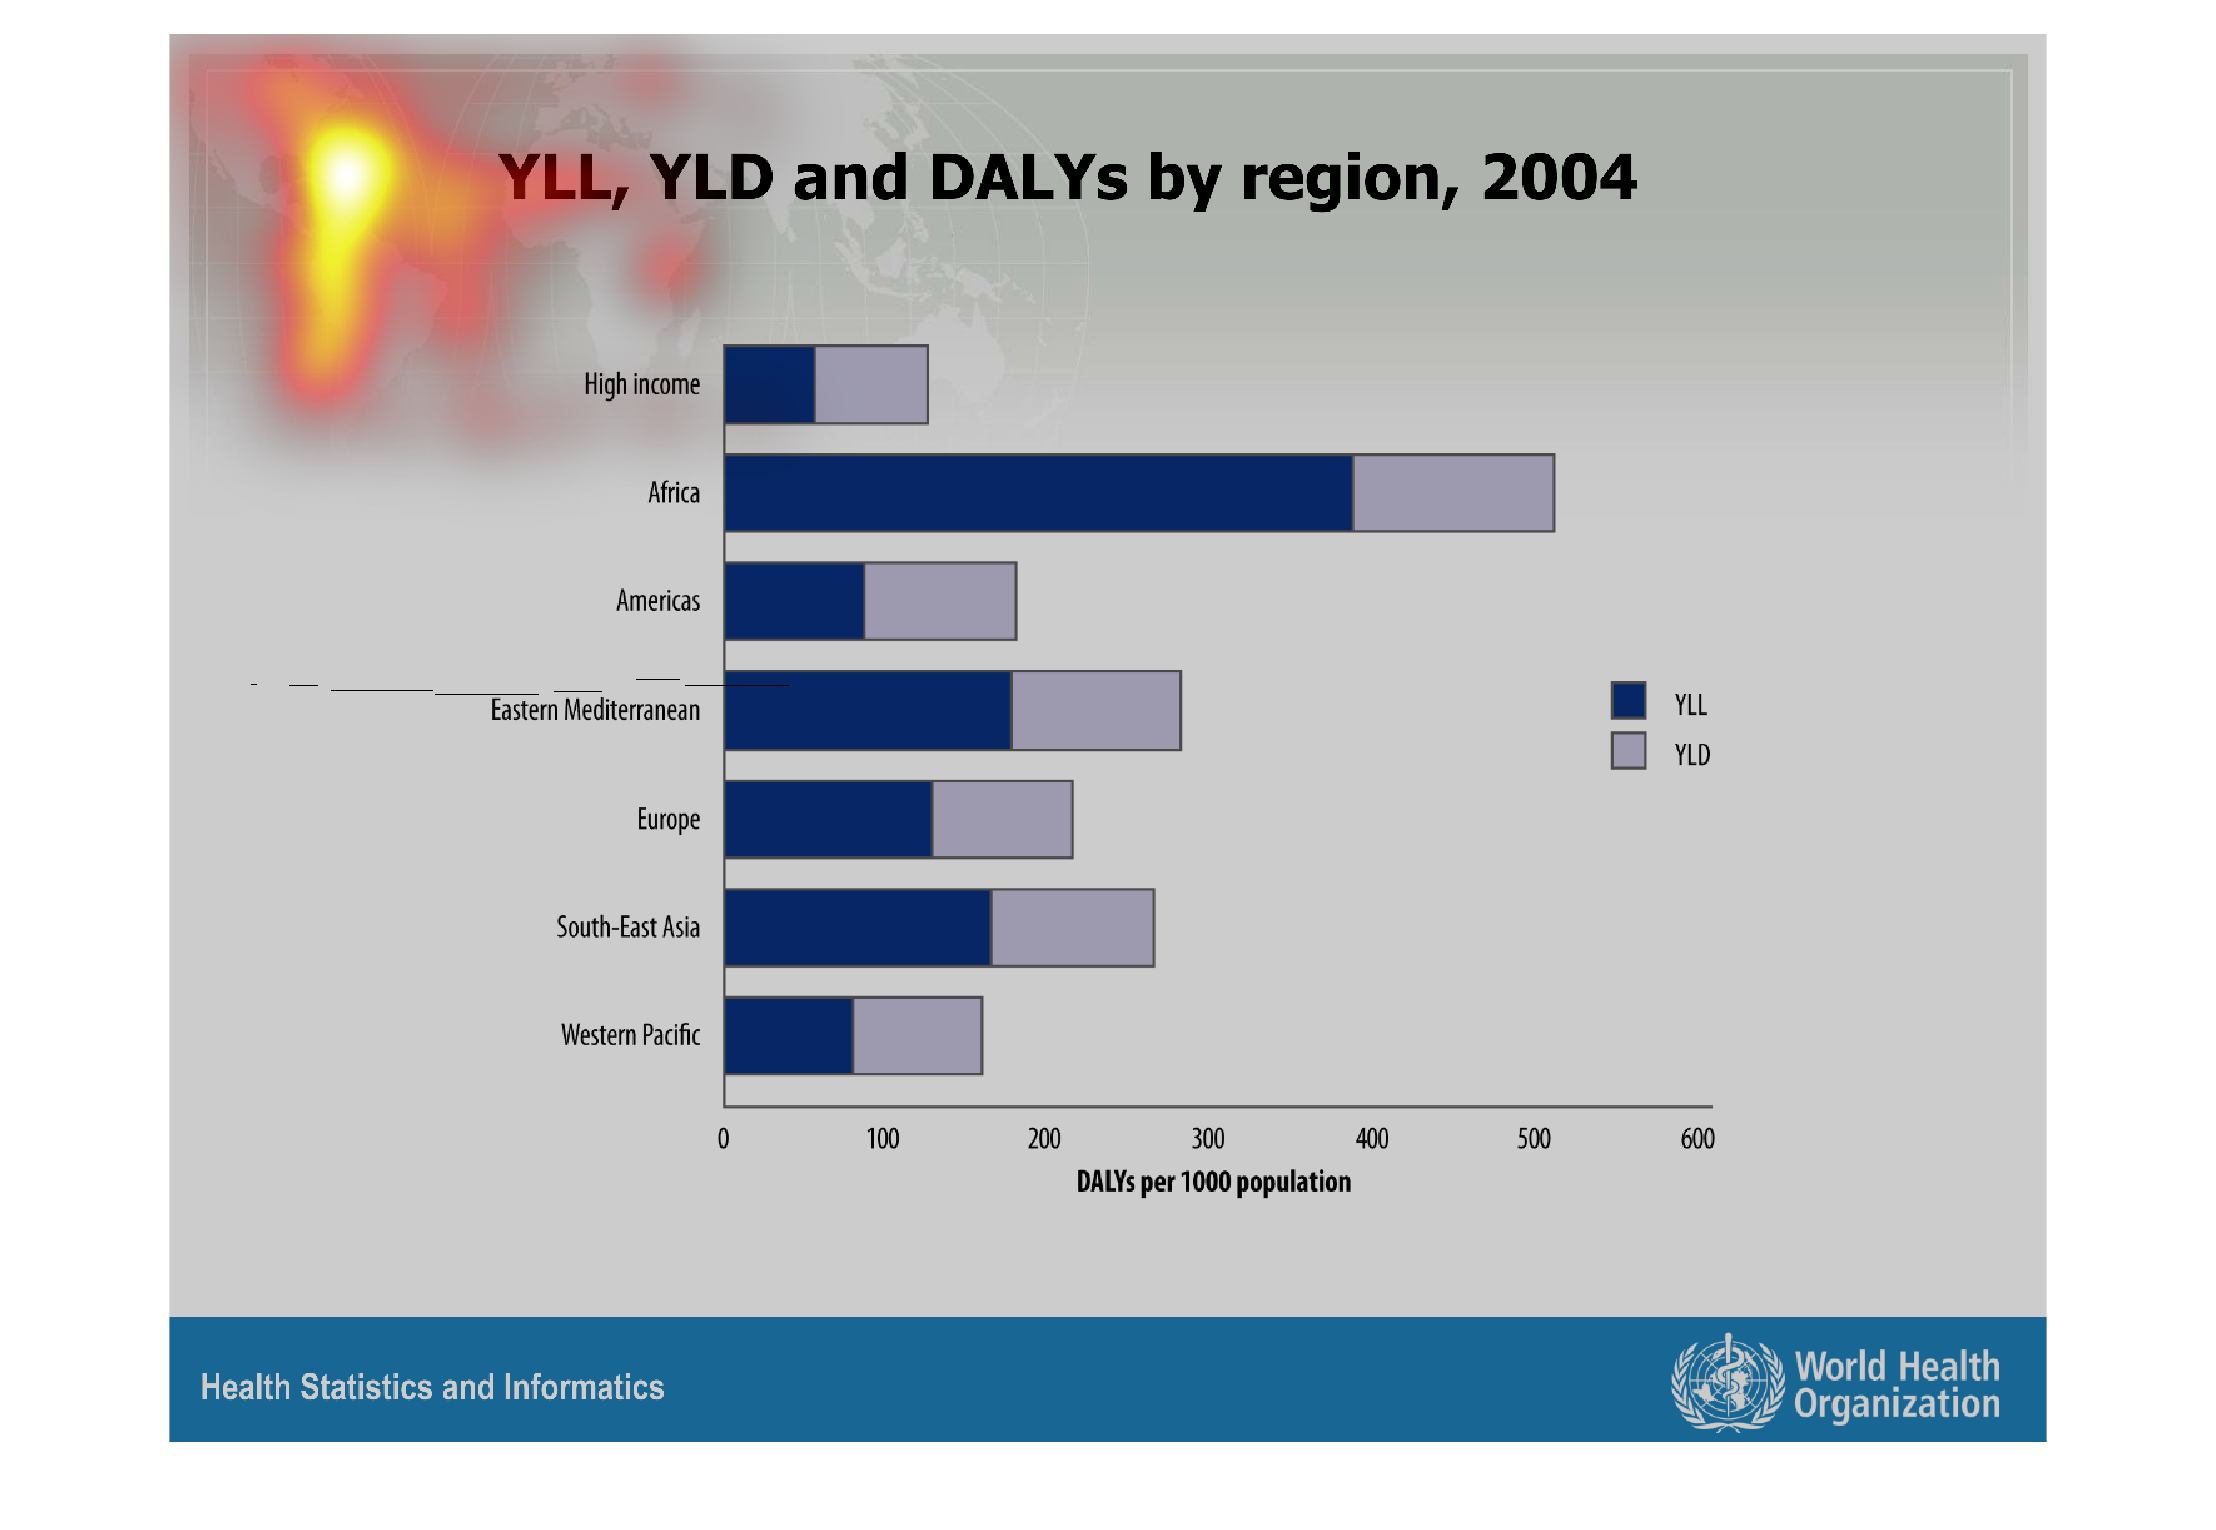
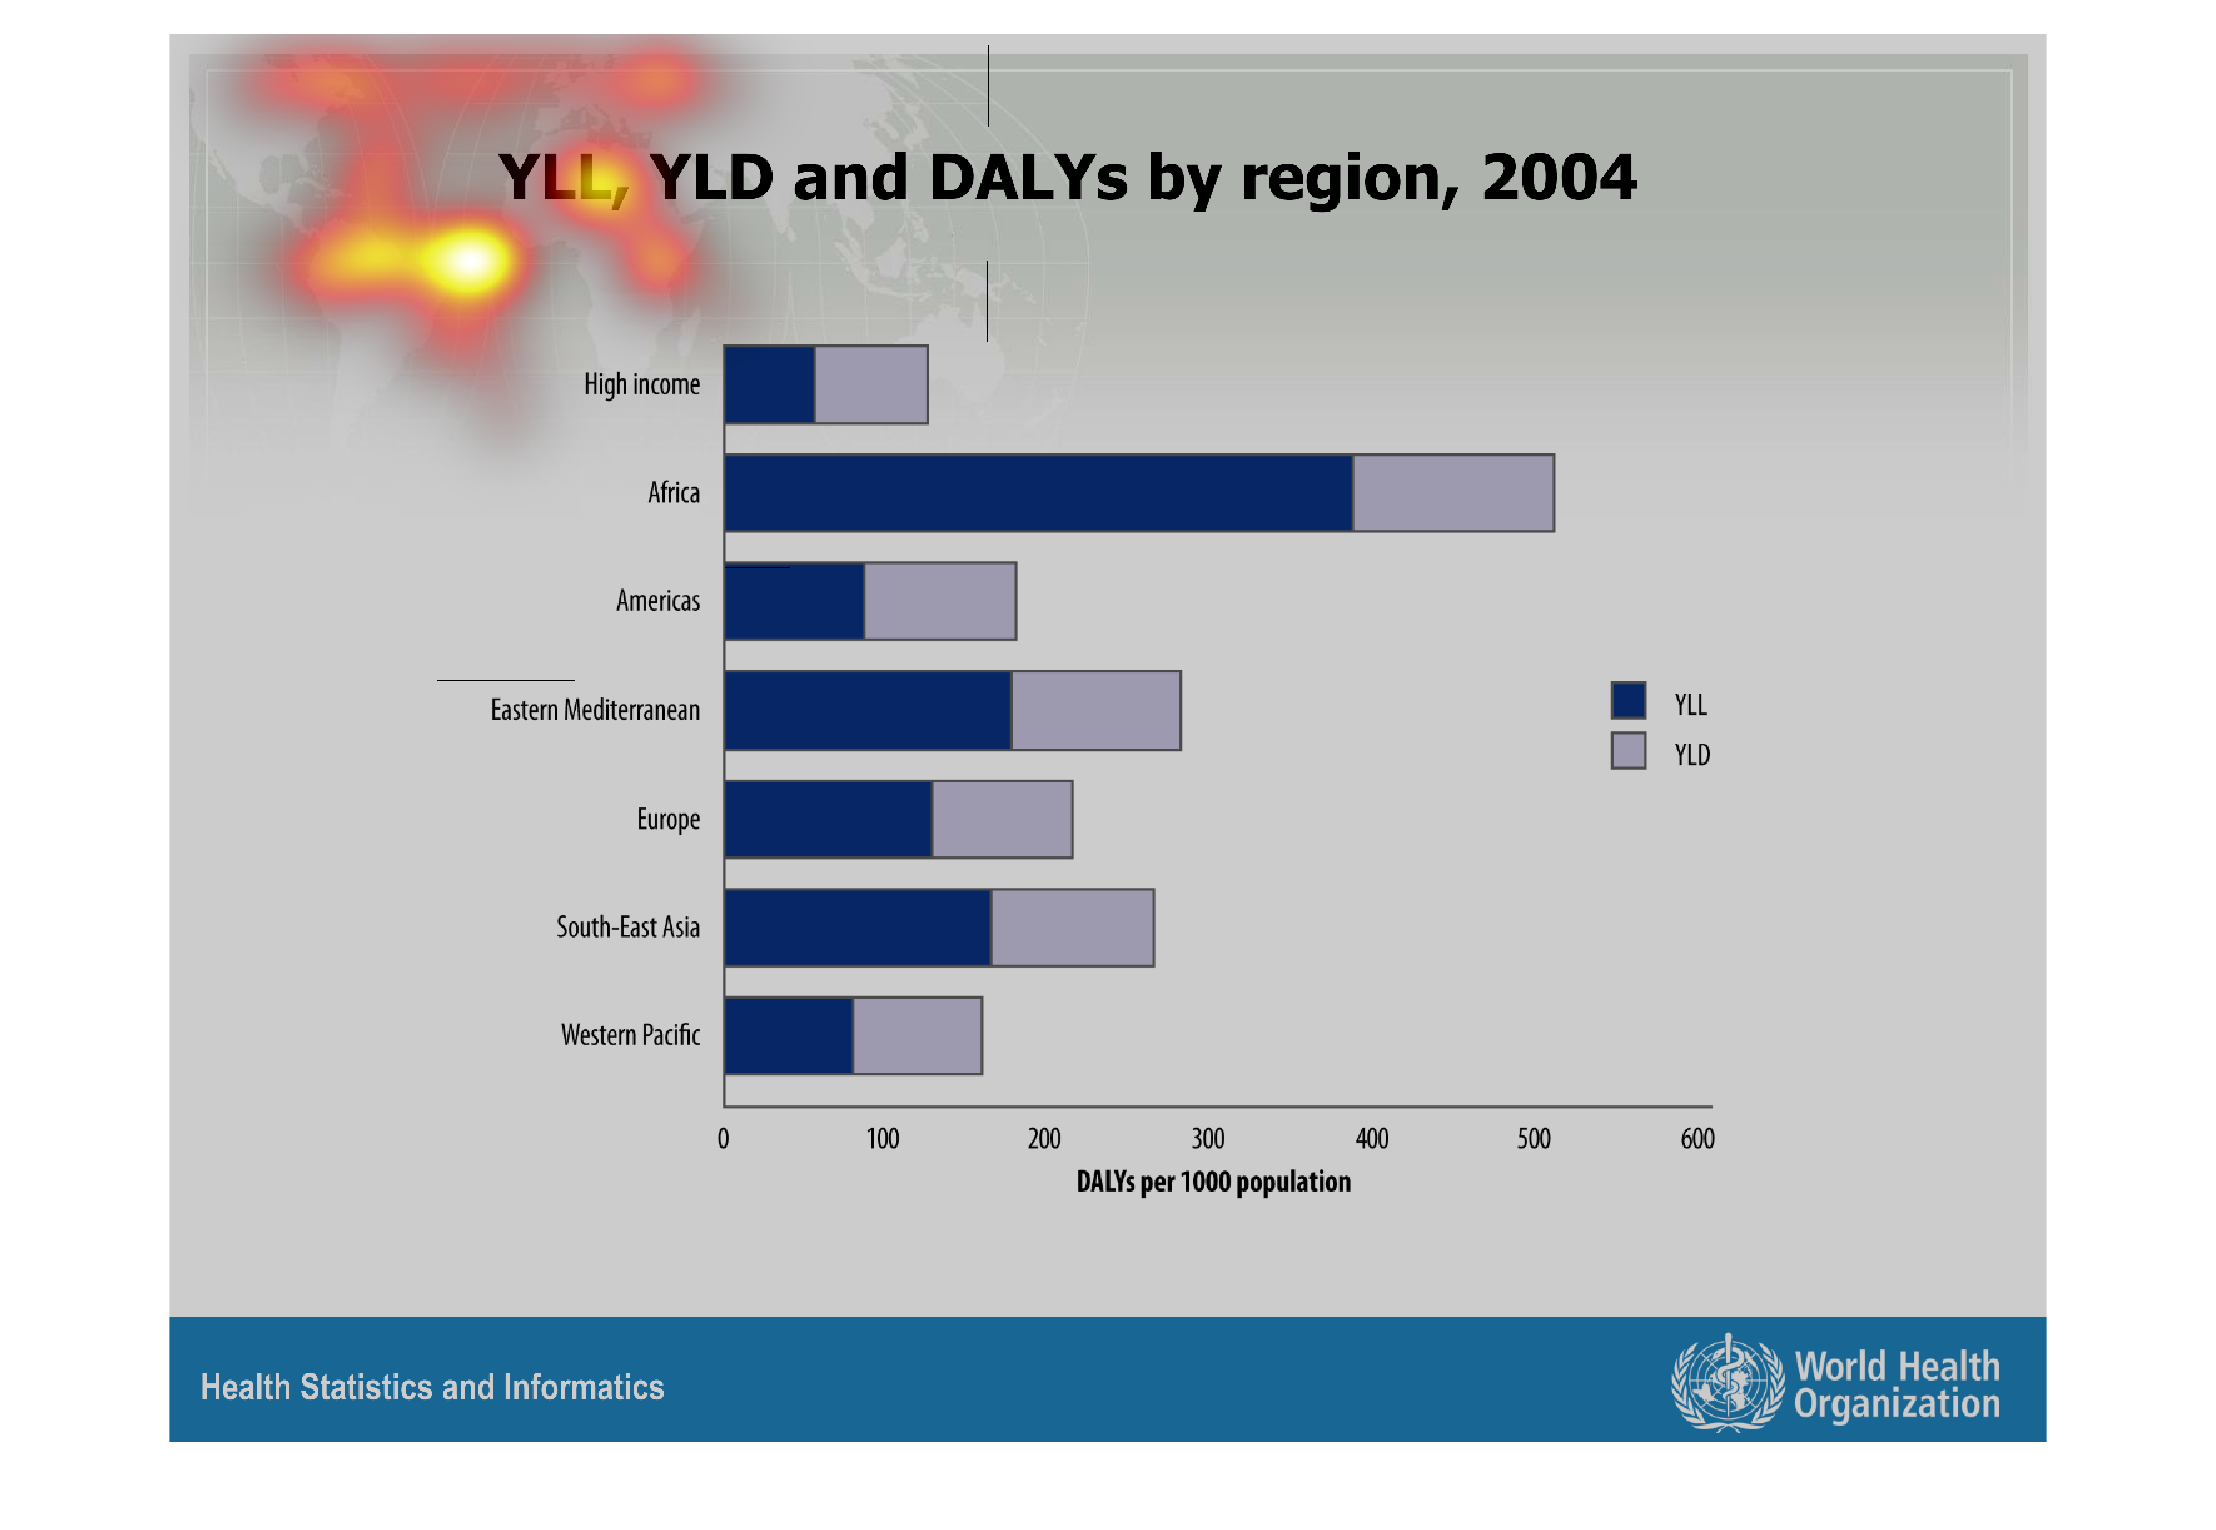
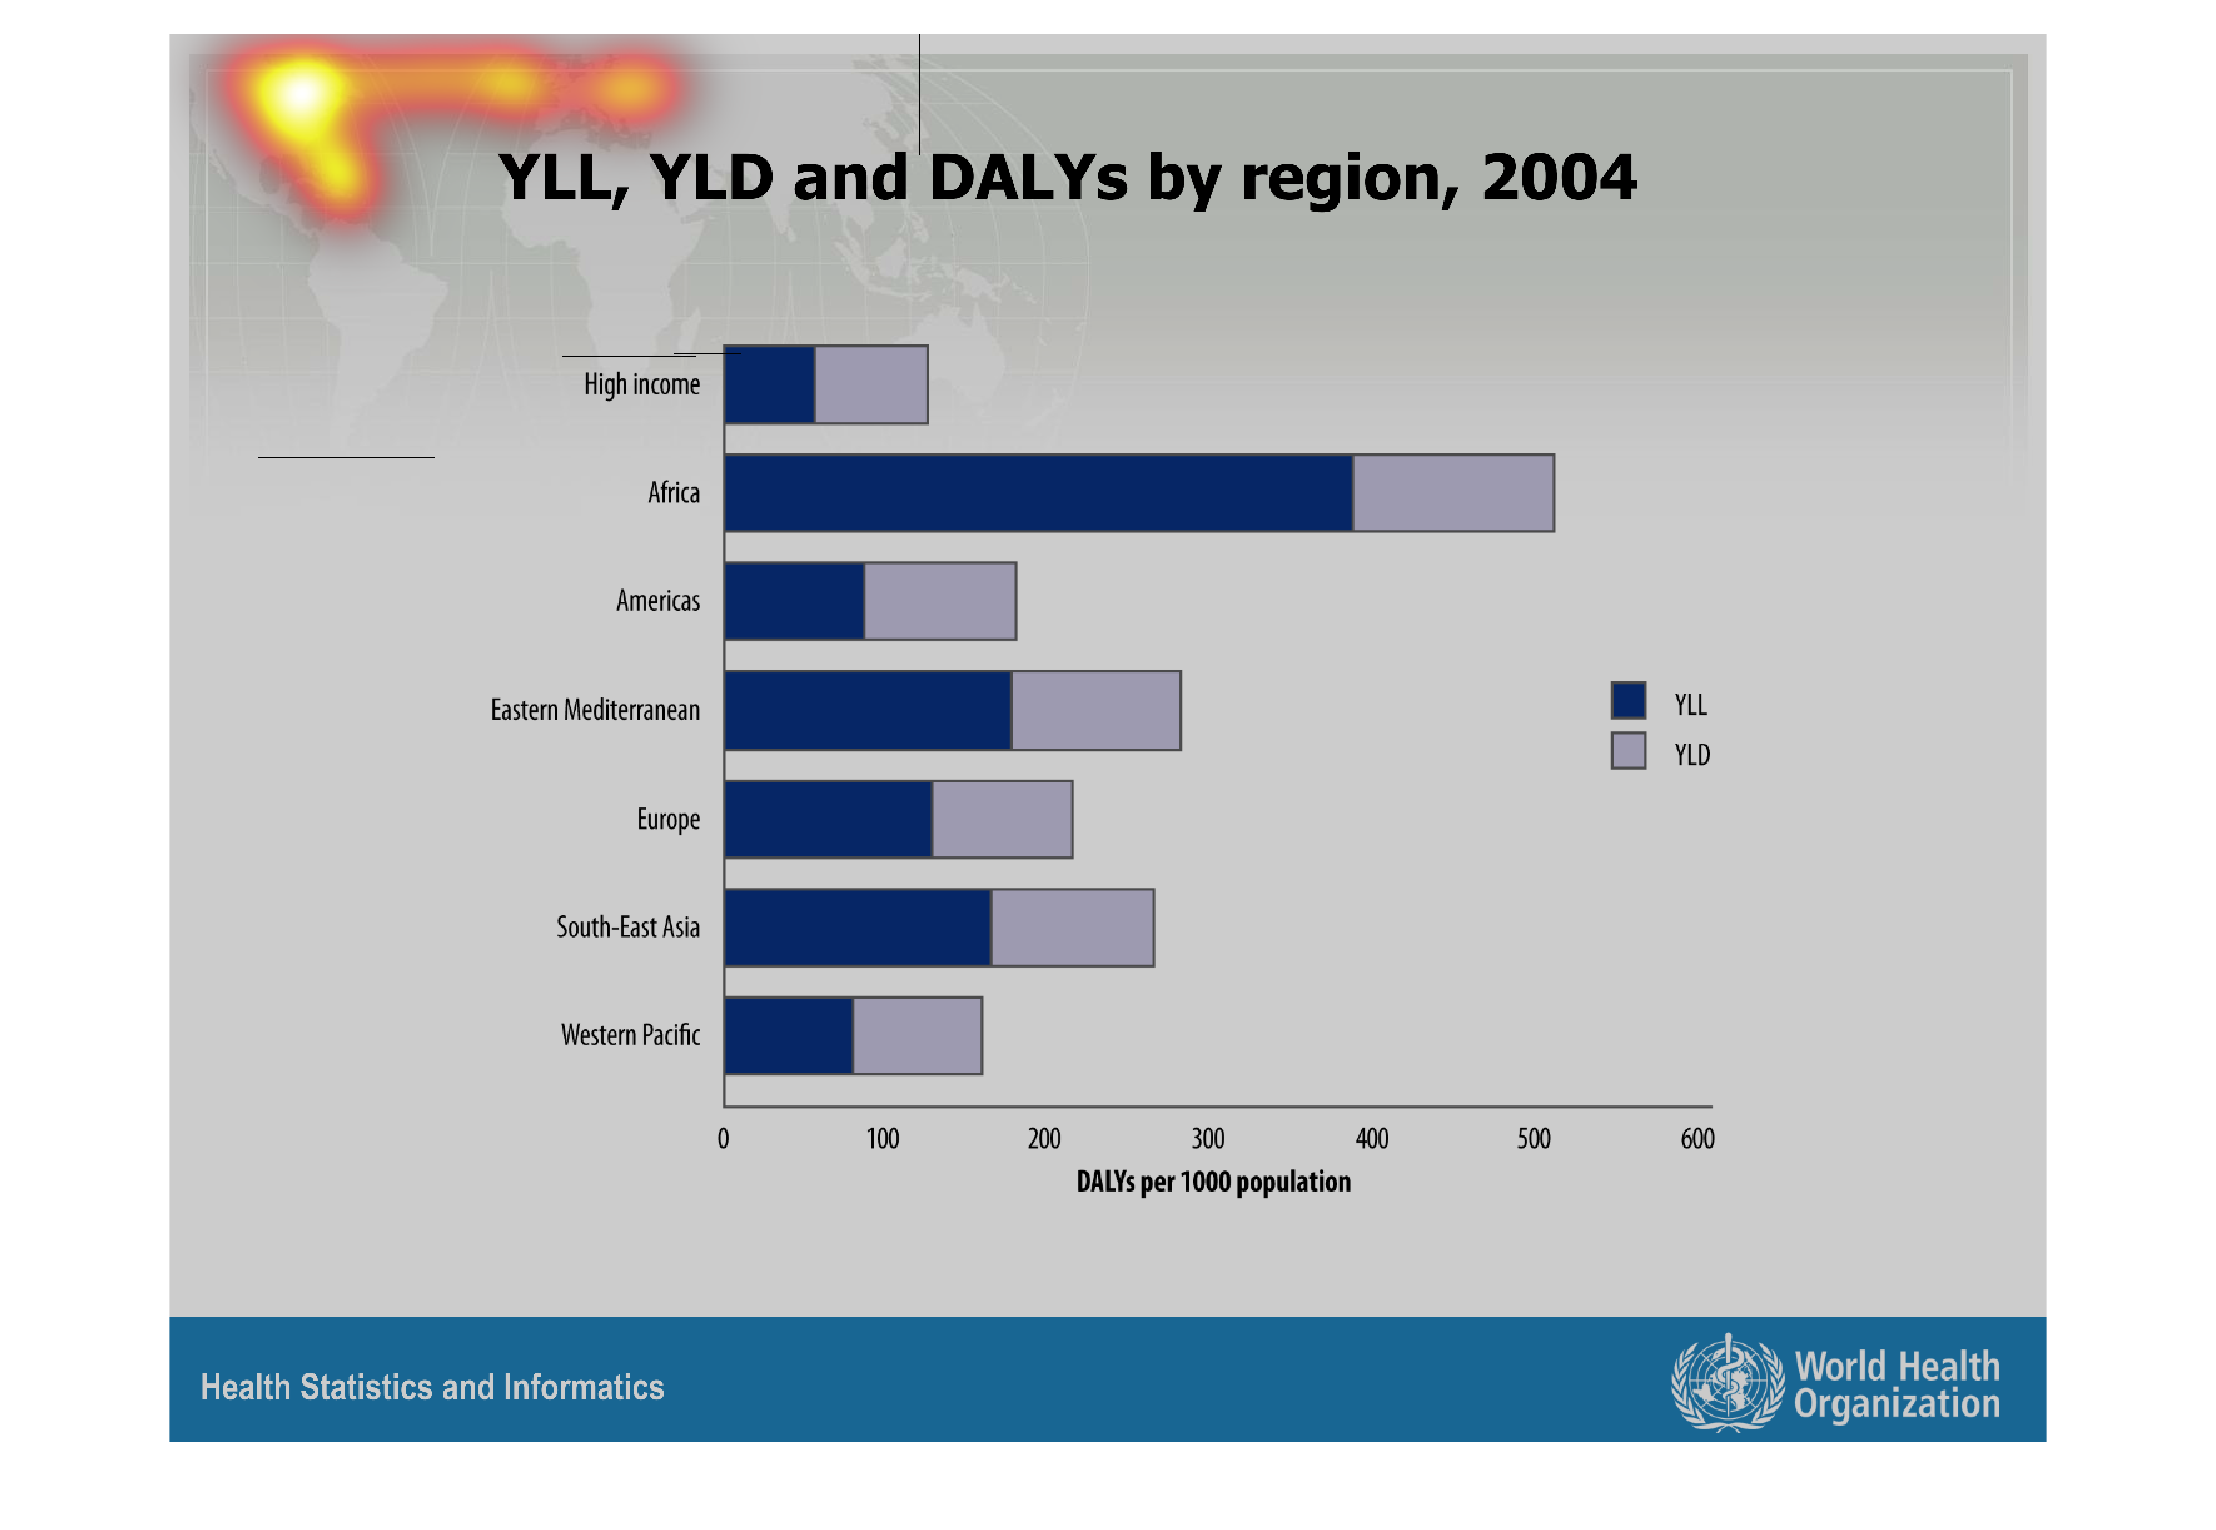
This is a graph that shows YLL, YLD and DALYs by region for the year 2004. It covers all the
continents in the world and shows these indicators as per 1000 of the population.
Warning: Image is too big to fit on screen; displaying at 67%
Warning: Image is too big to fit on screen; displaying at 67%

YLL, YLD and DALYs by region, 2004. Y axis is basically continents and geographic regions.
X axis shows bars portraying the YLL and YLD values for the regions
Warning: Image is too big to fit on screen; displaying at 67%
Warning: Image is too big to fit on screen; displaying at 67%
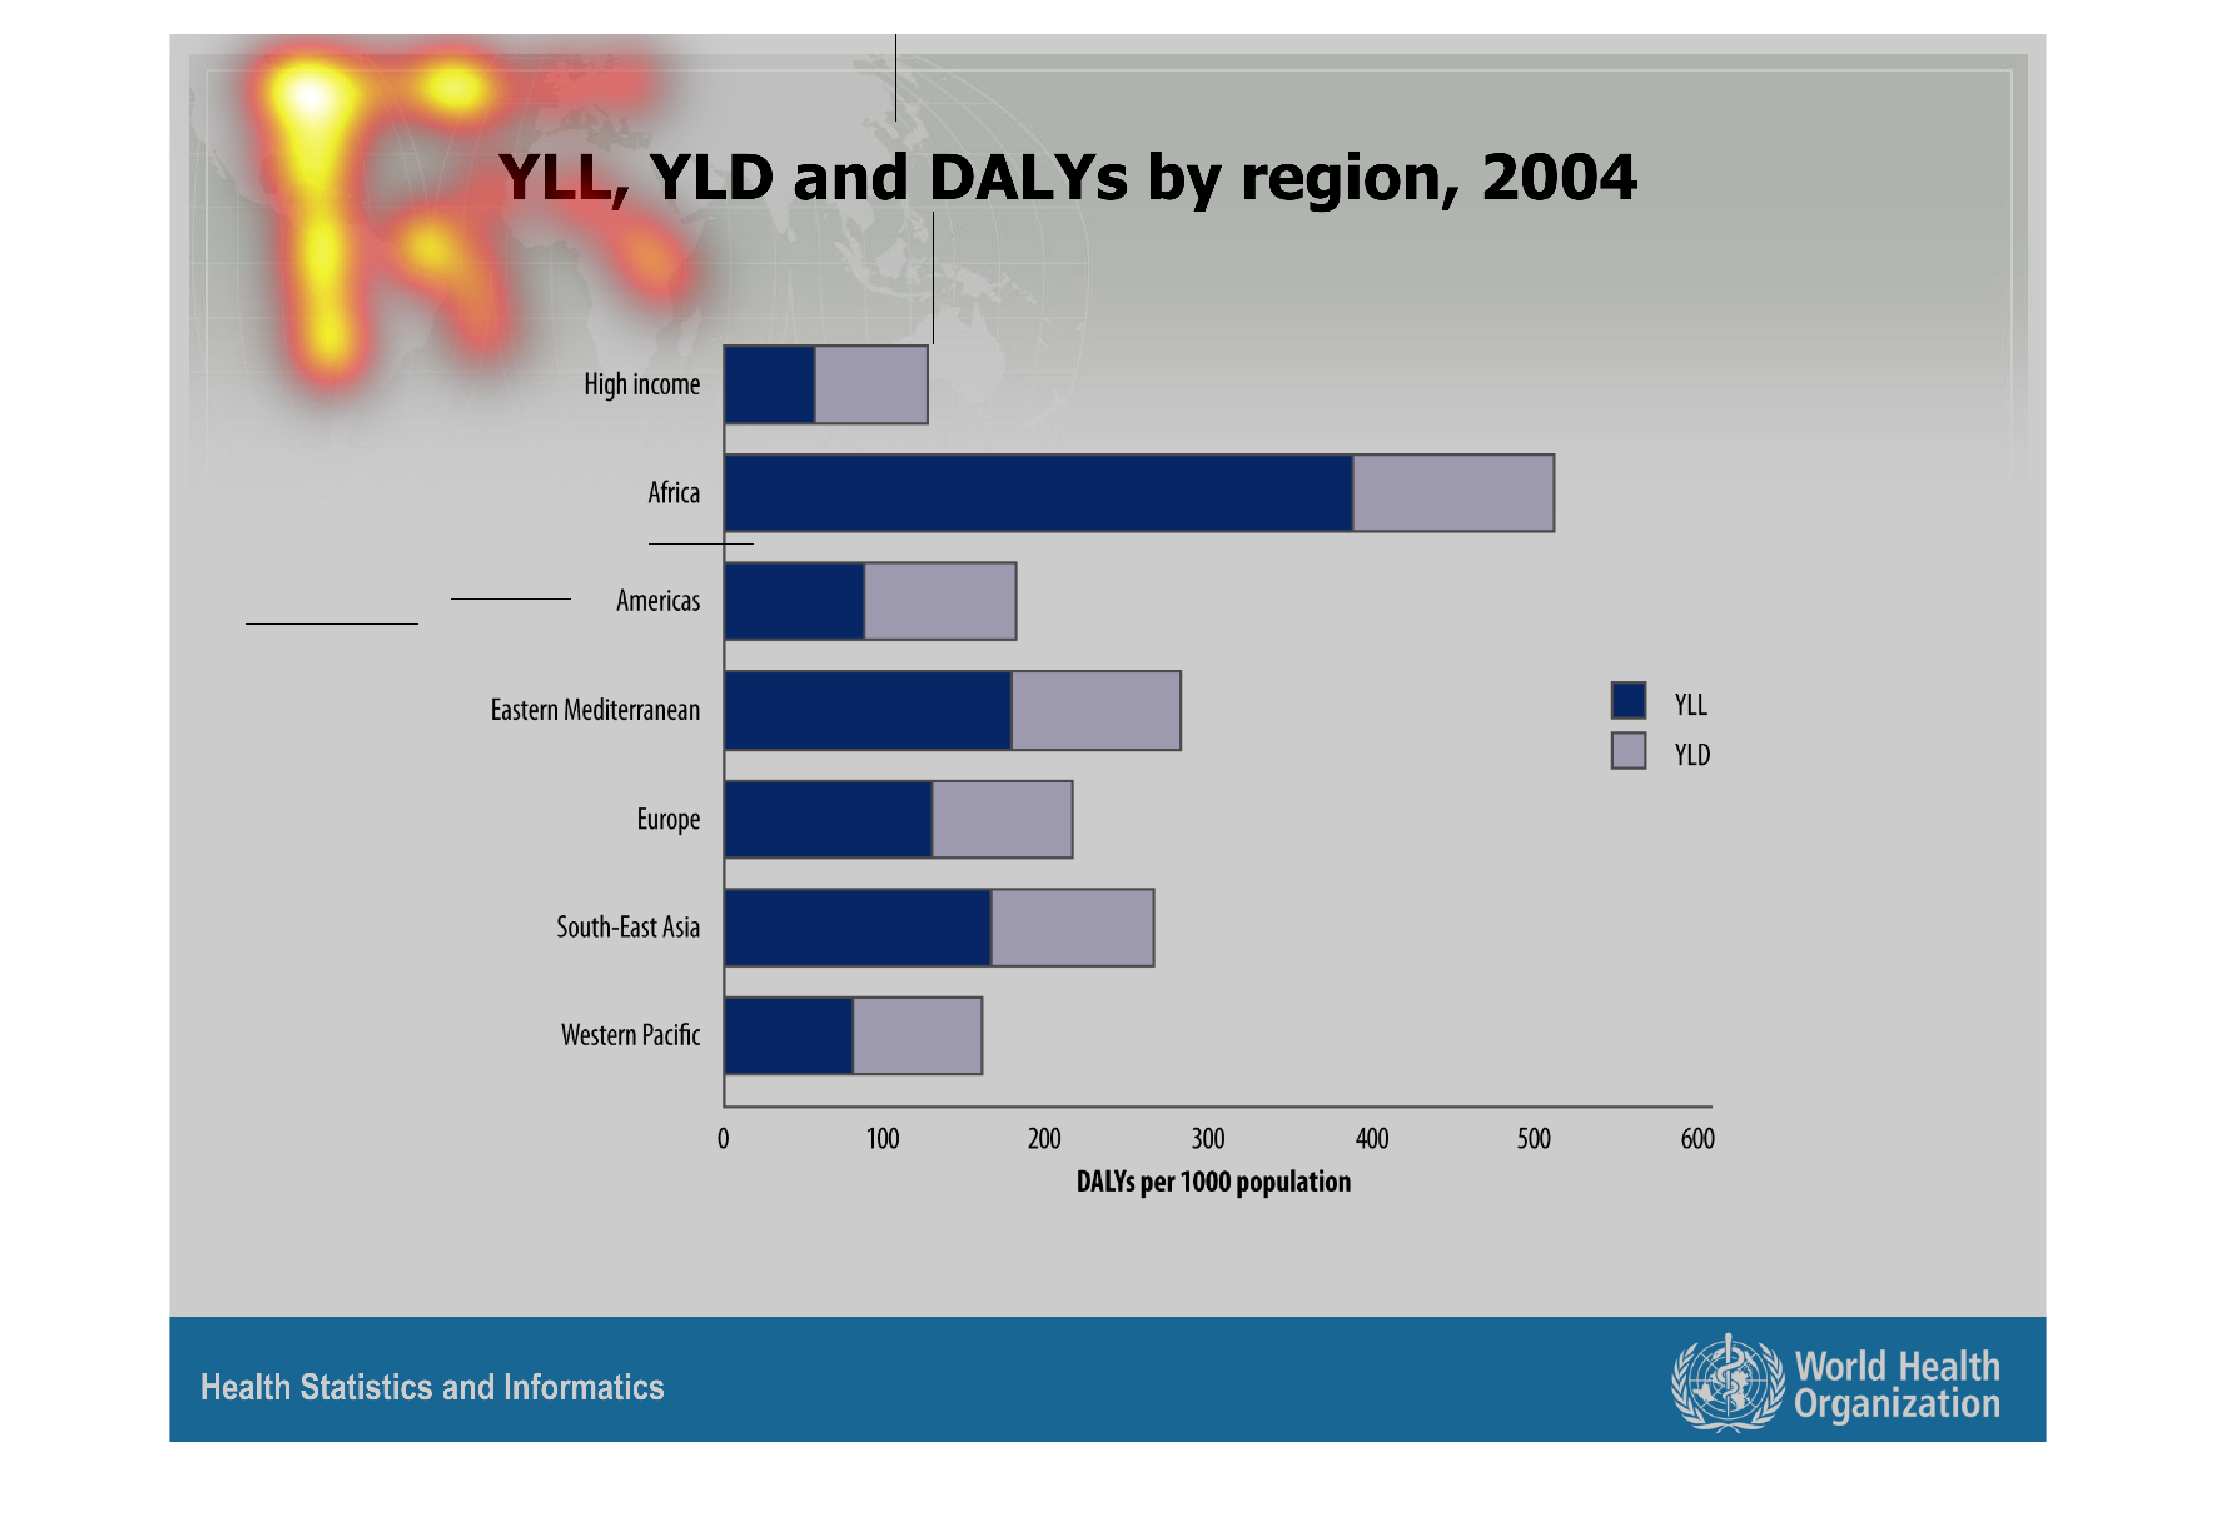
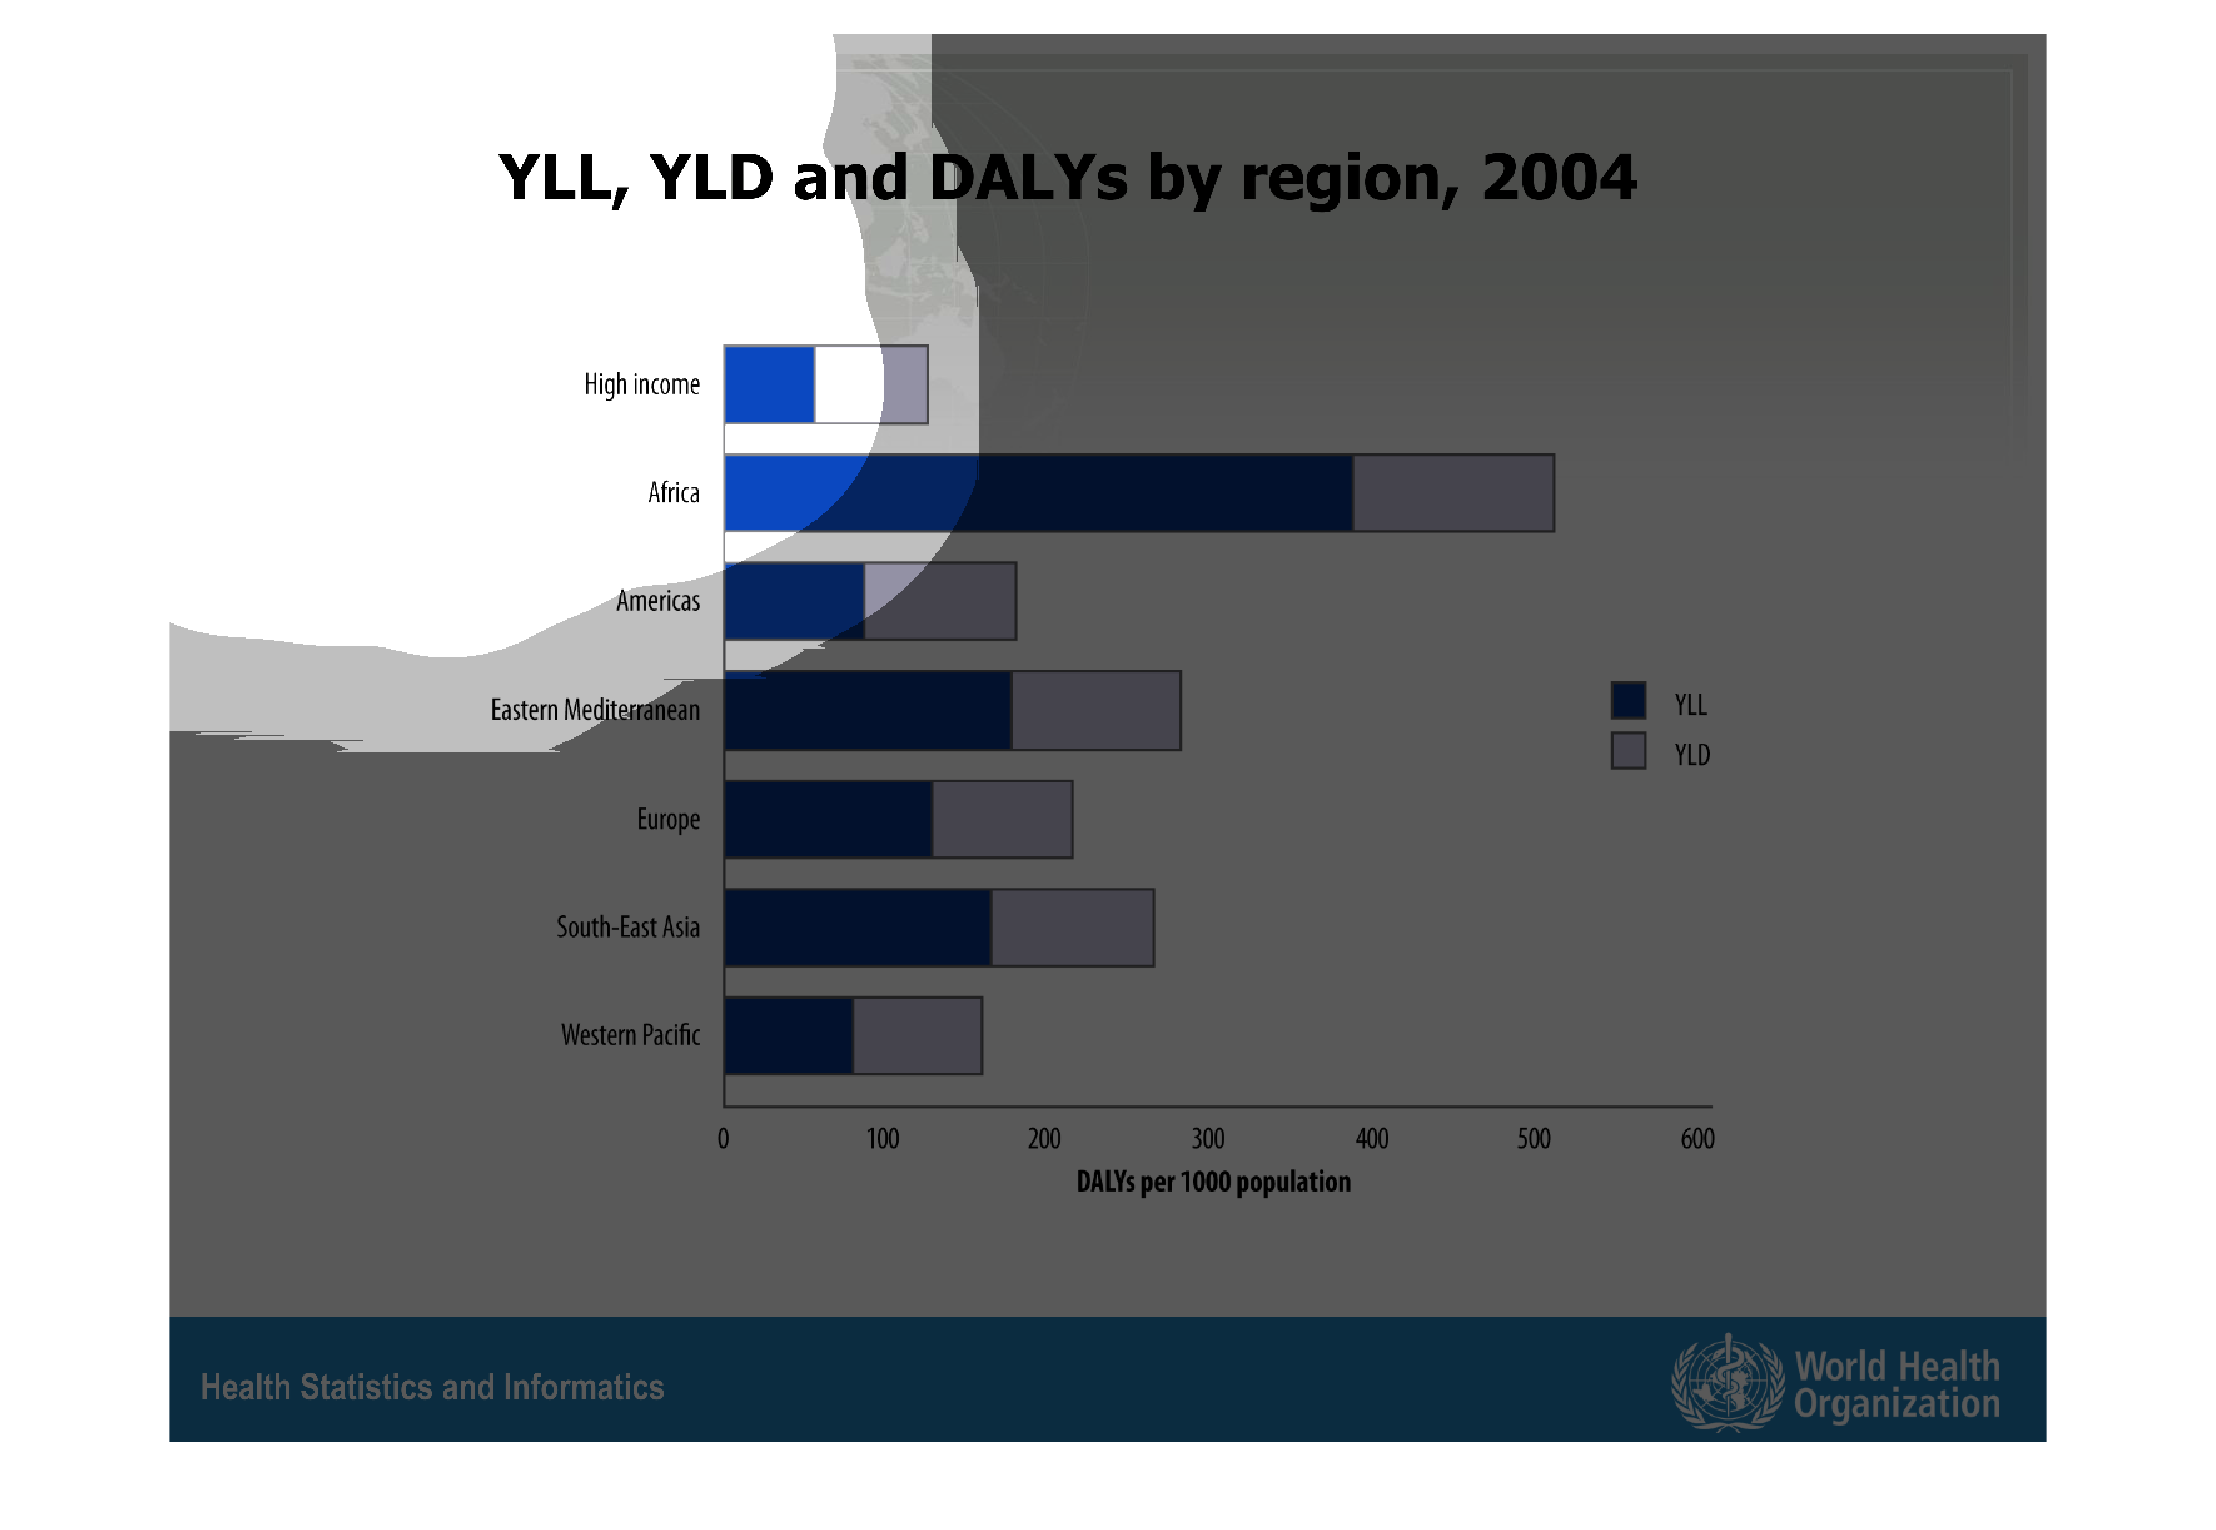
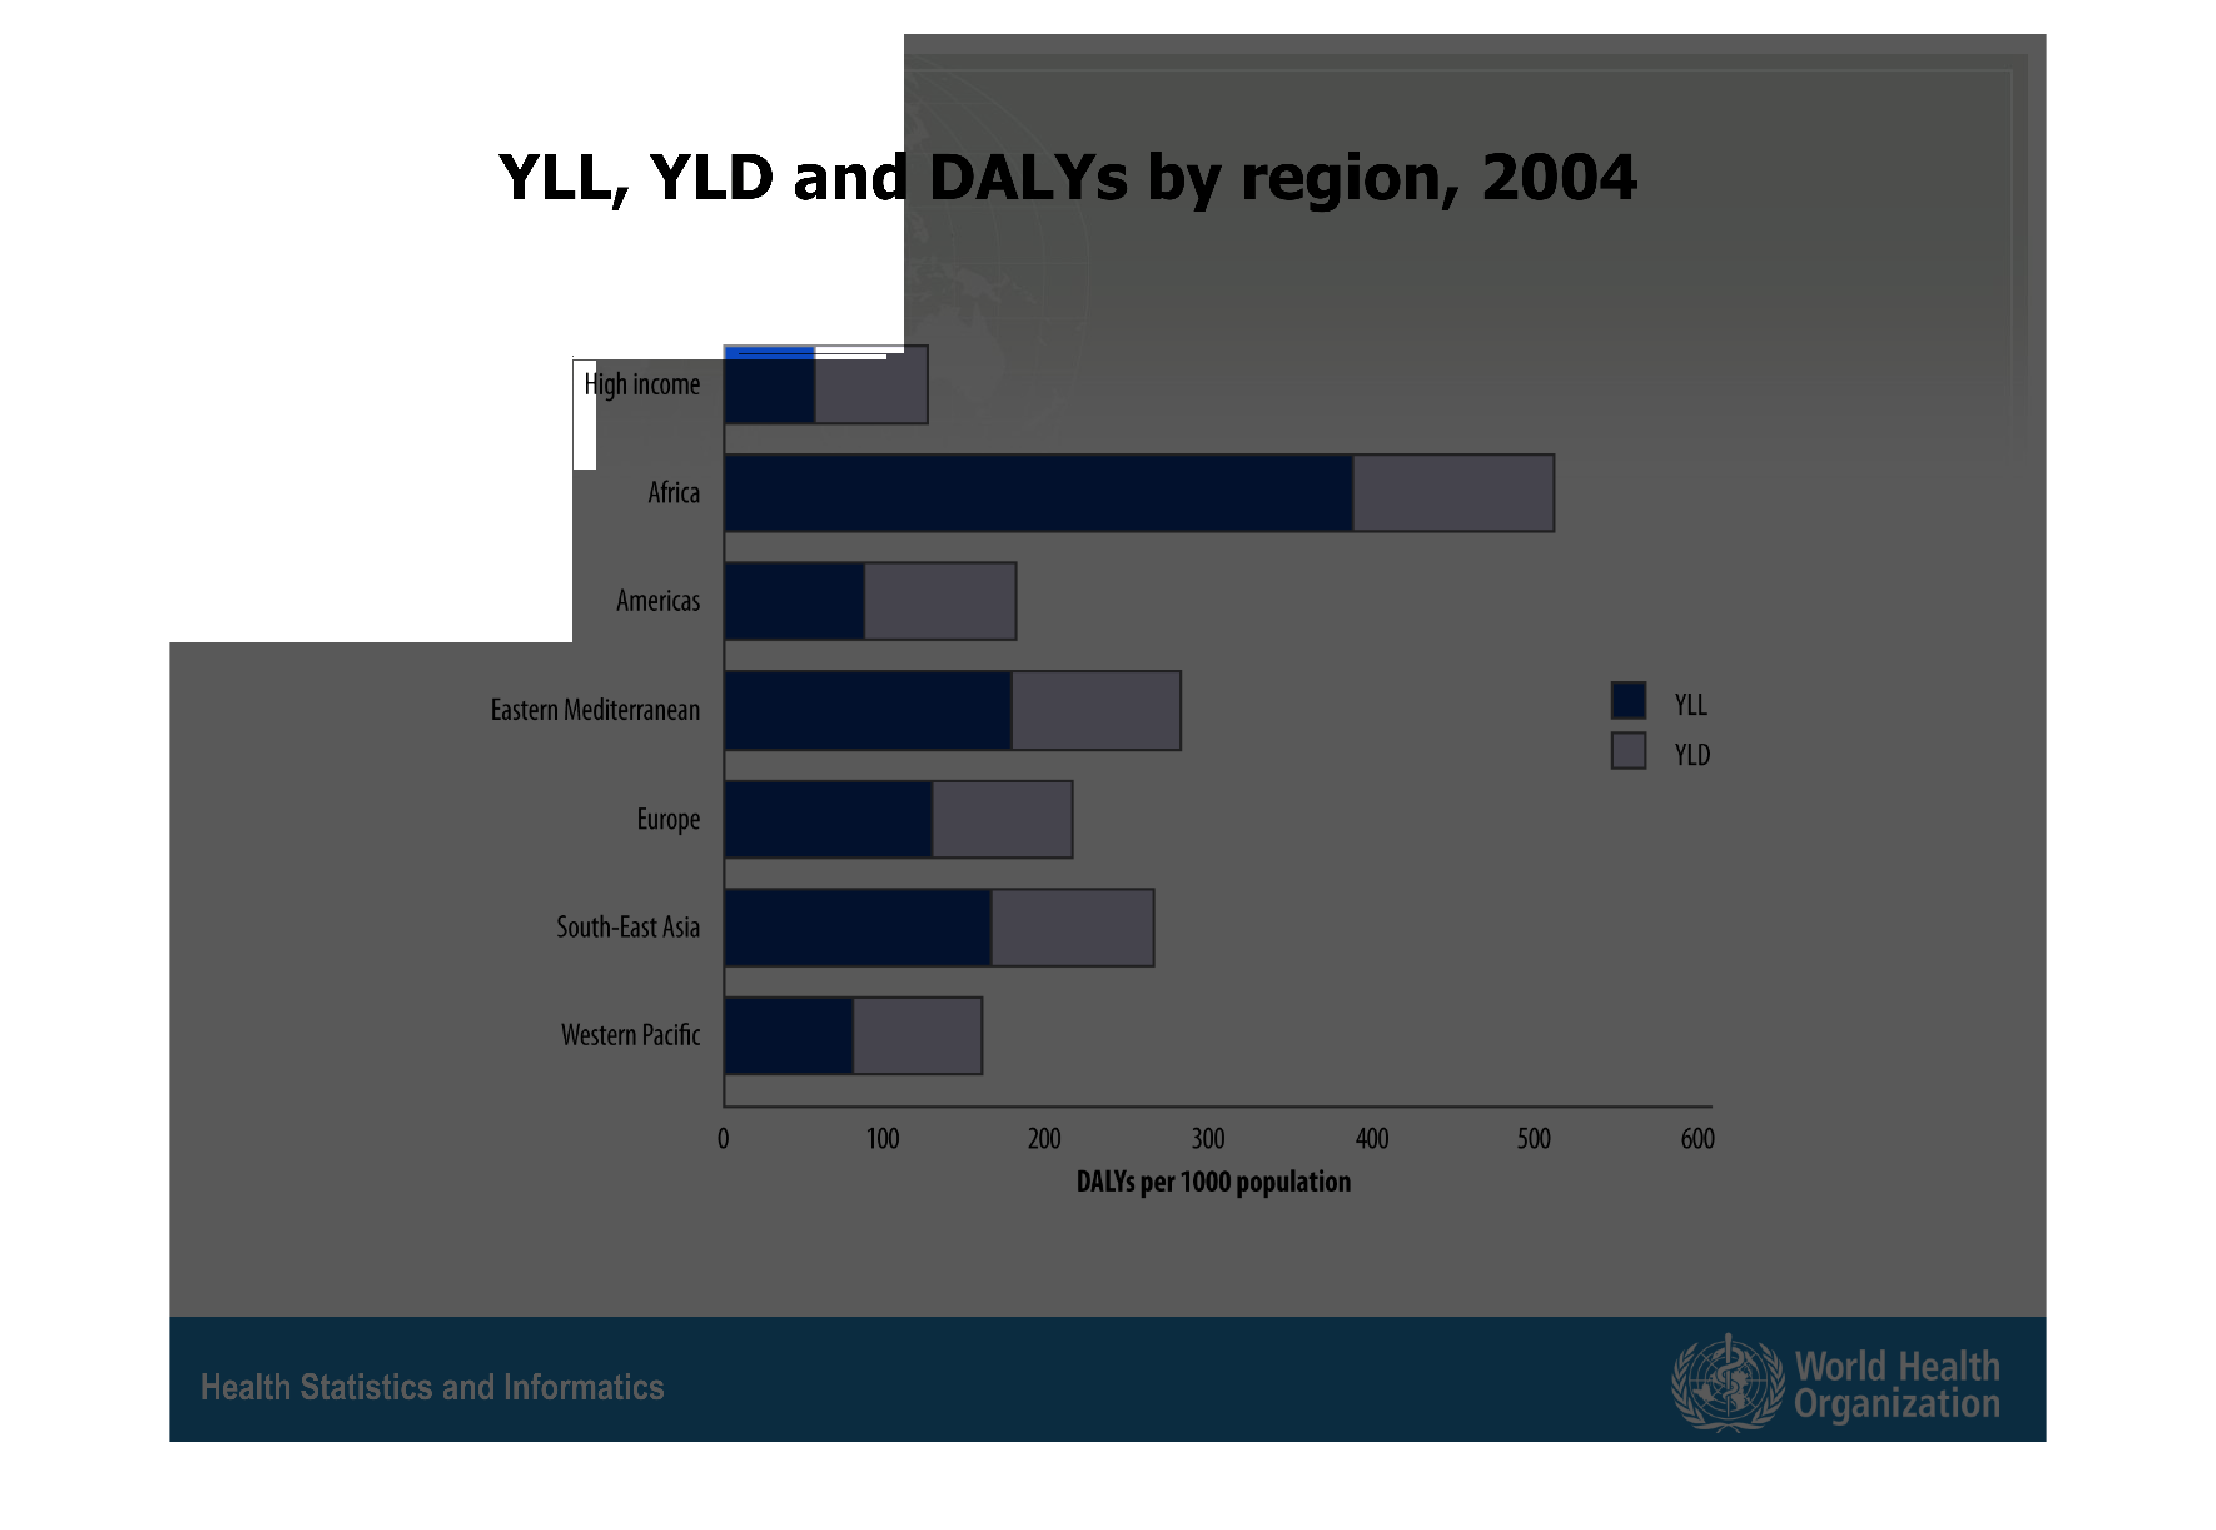
The graph displays the YLL, YLD, and DALYs by region in 2004.   It is divided by continent
for the most part, although it includes high income as well.   The highest by far is in Africa.

Warning: Image is too big to fit on screen; displaying at 67%
Warning: Image is too big to fit on screen; displaying at 67%
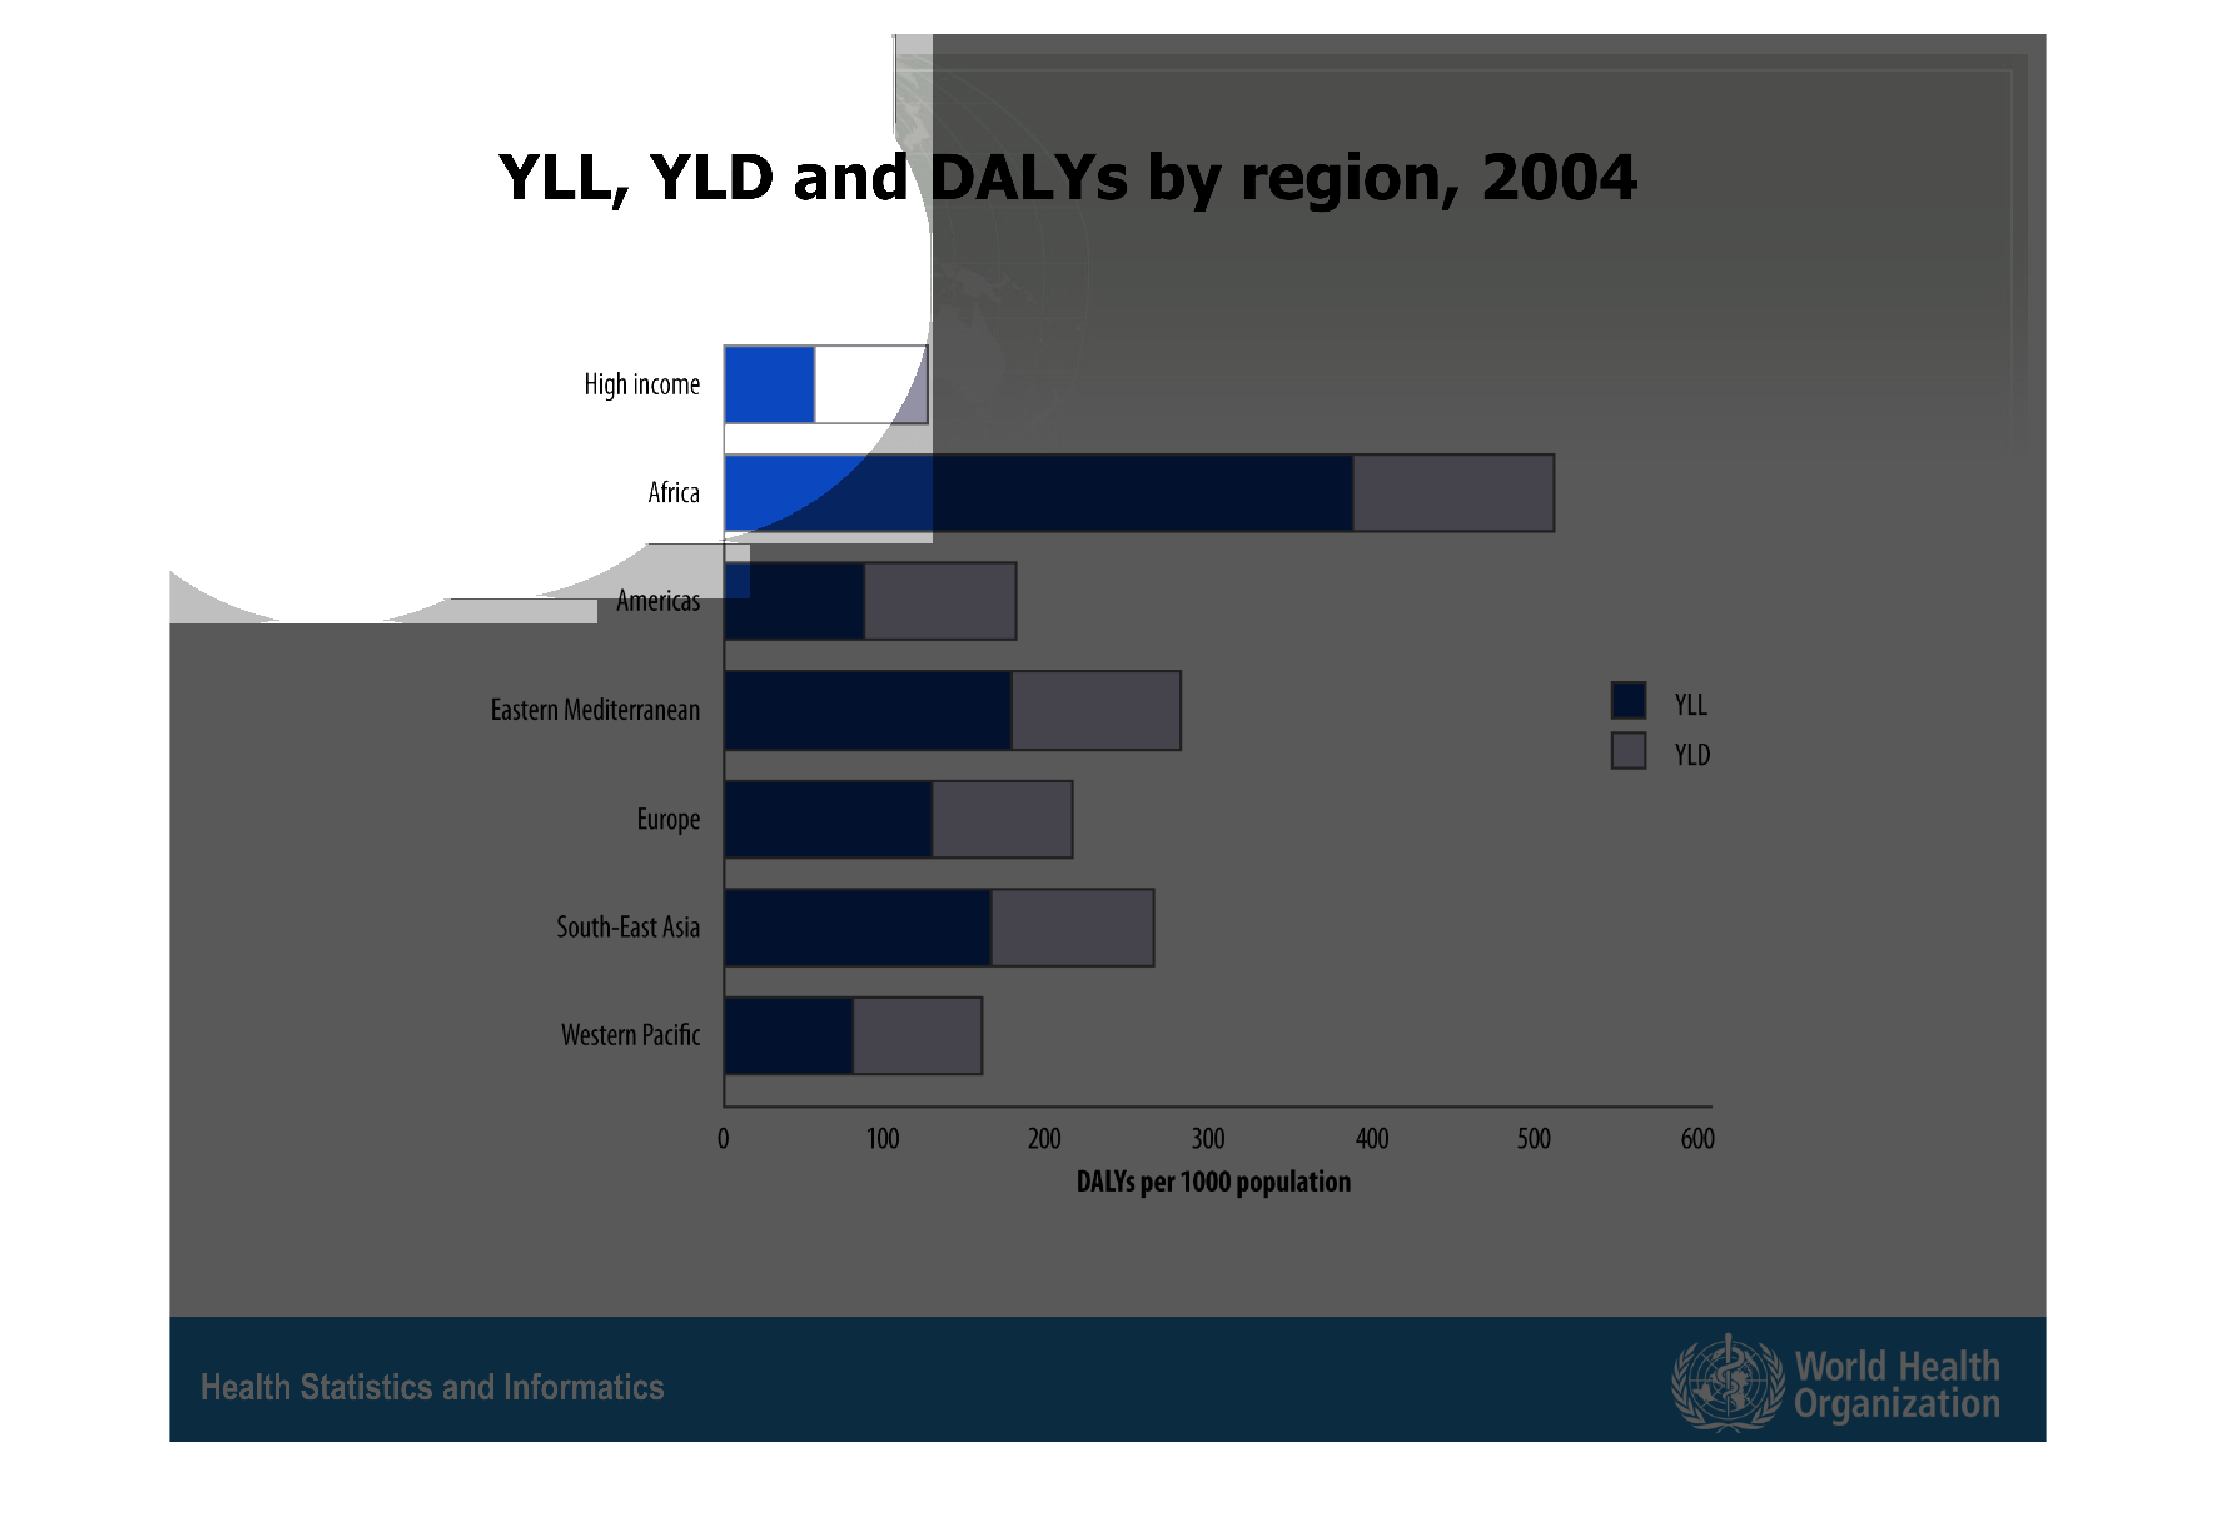
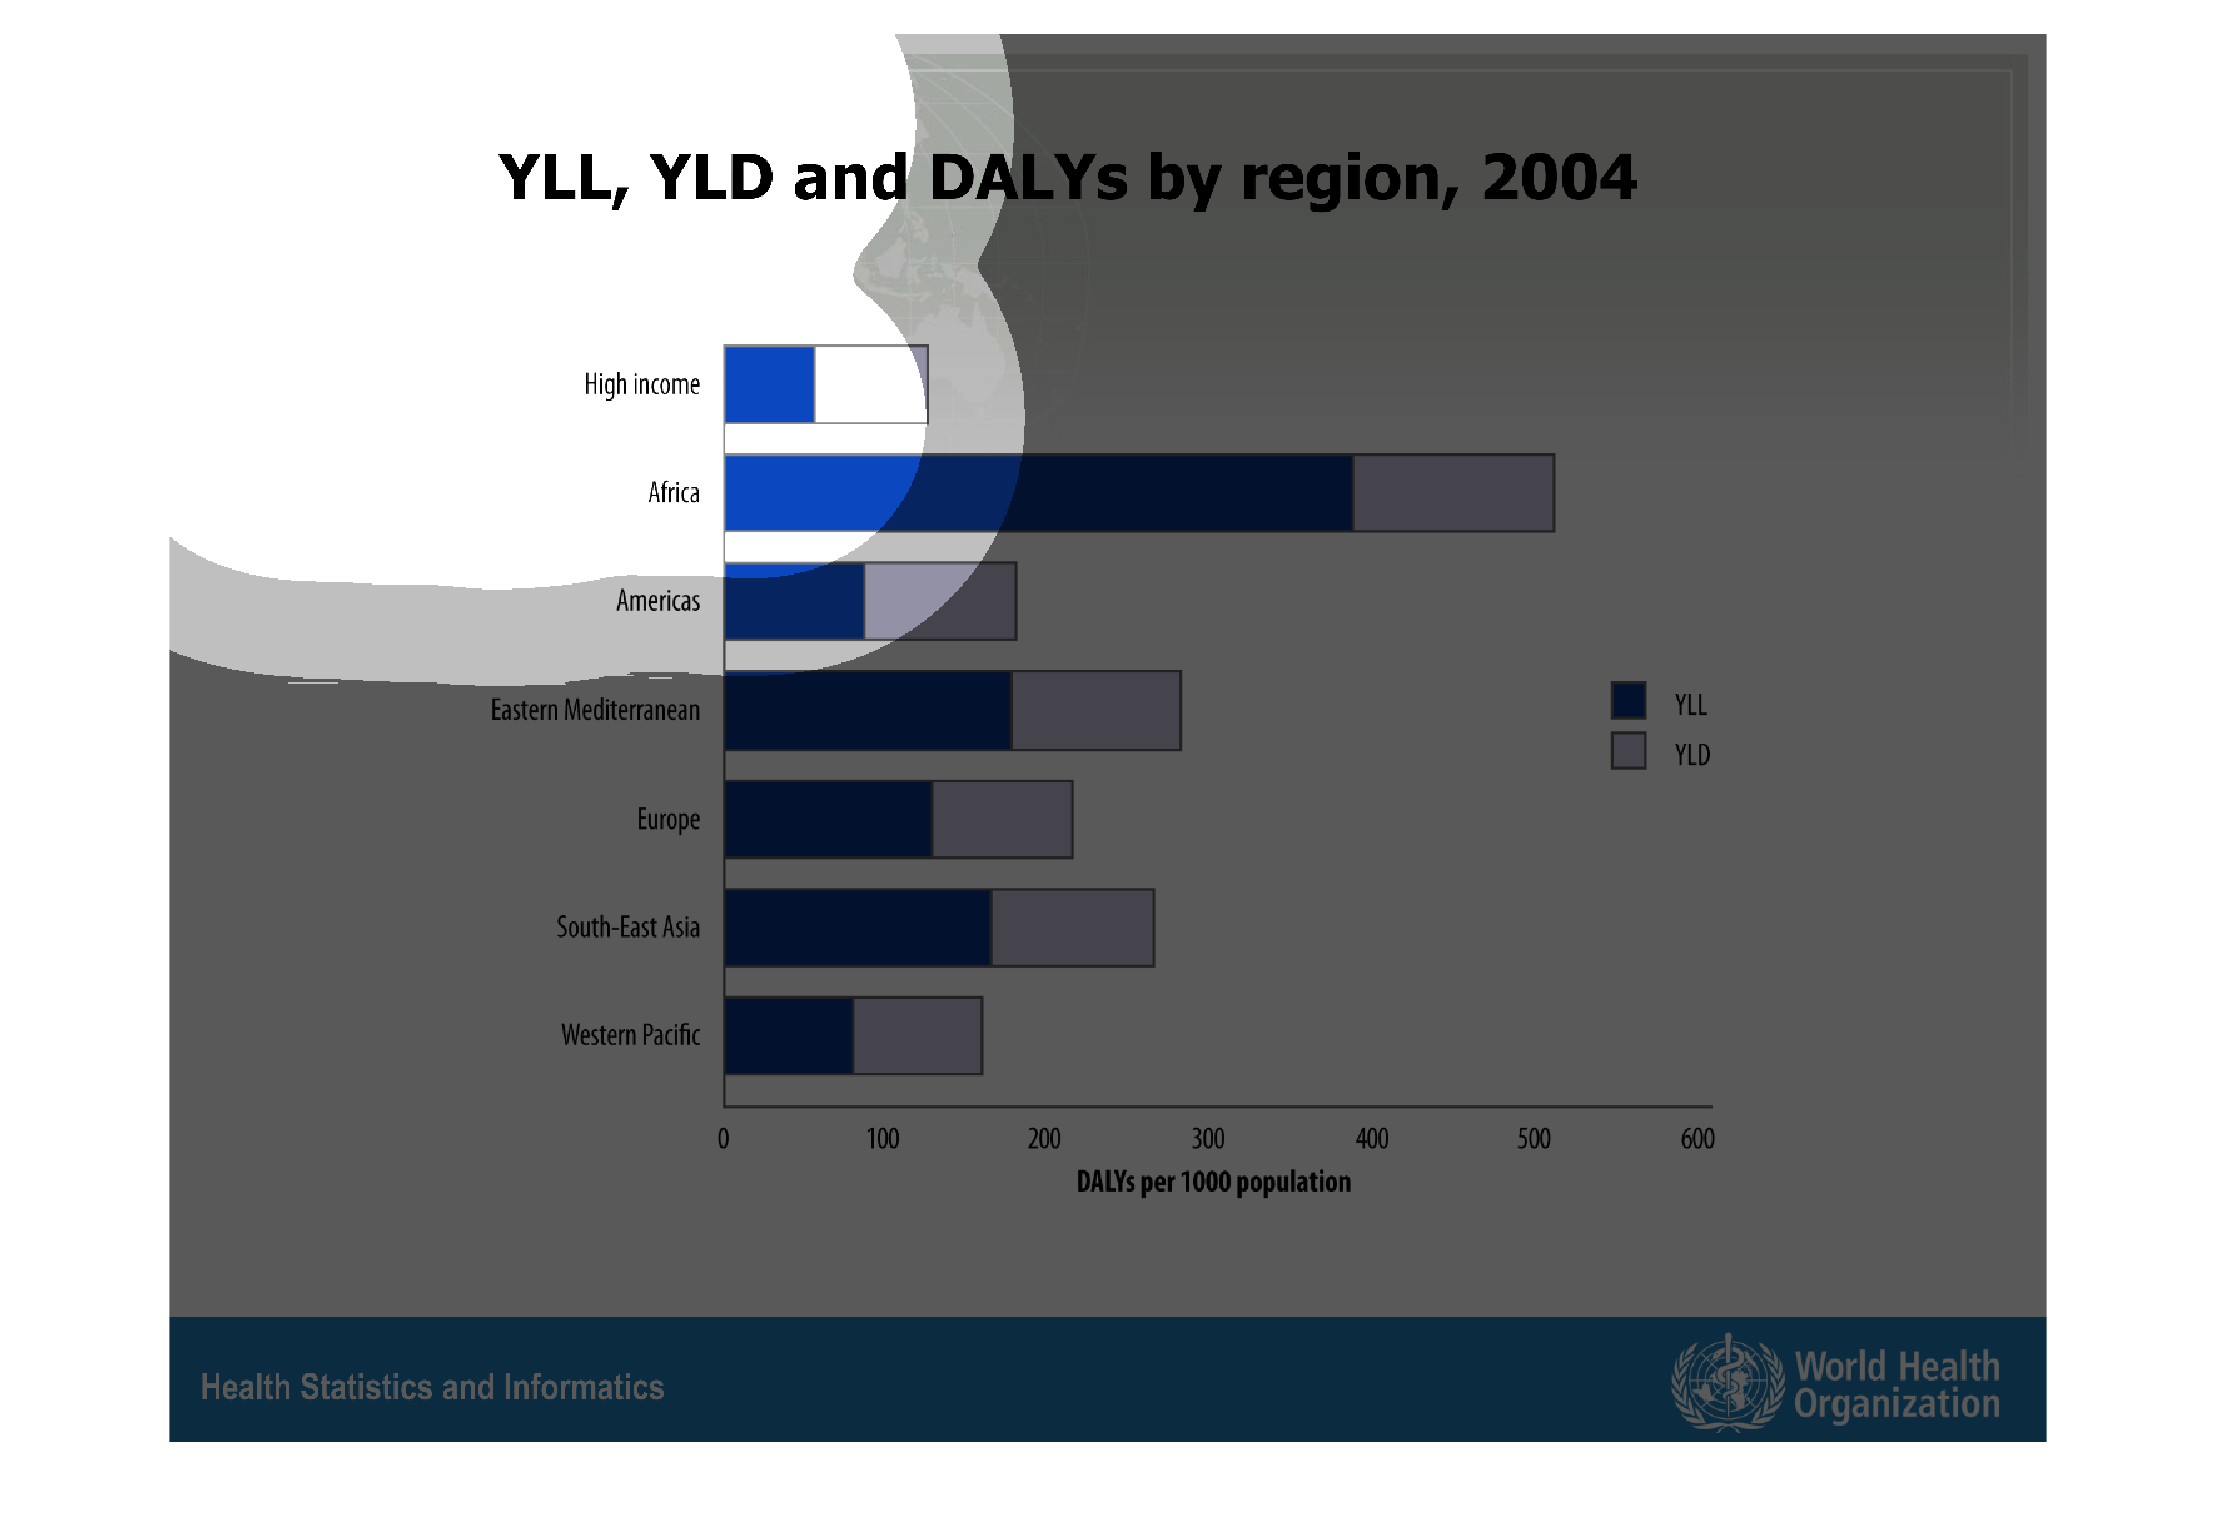
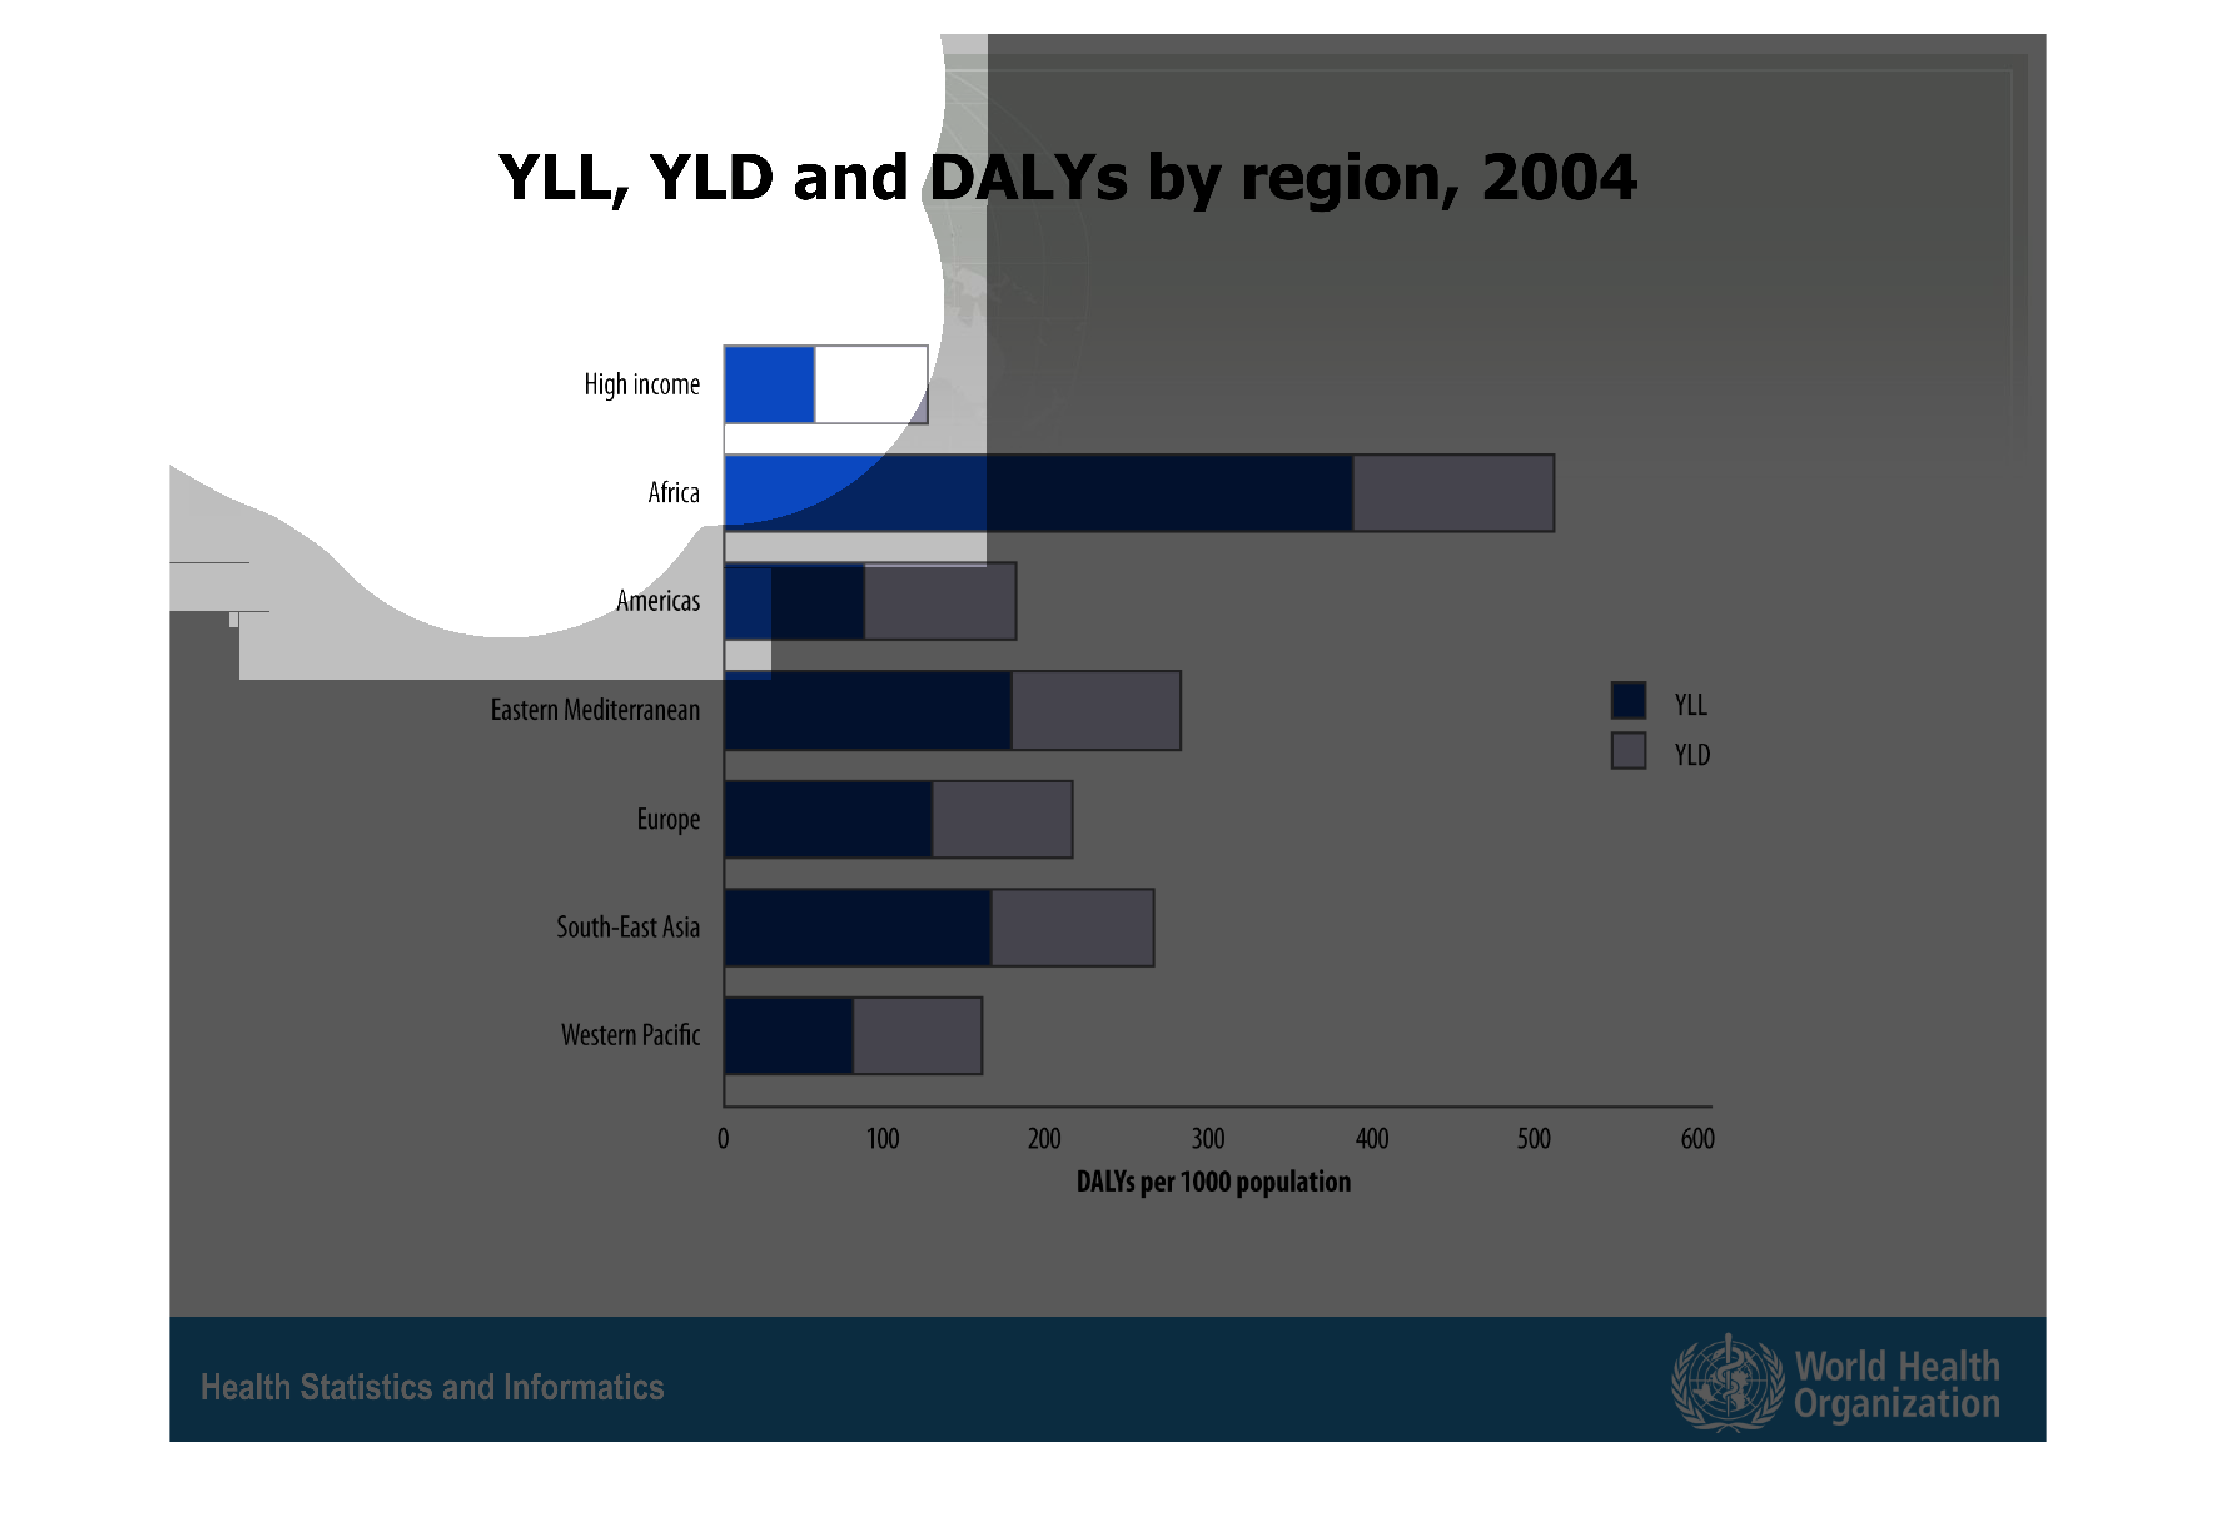
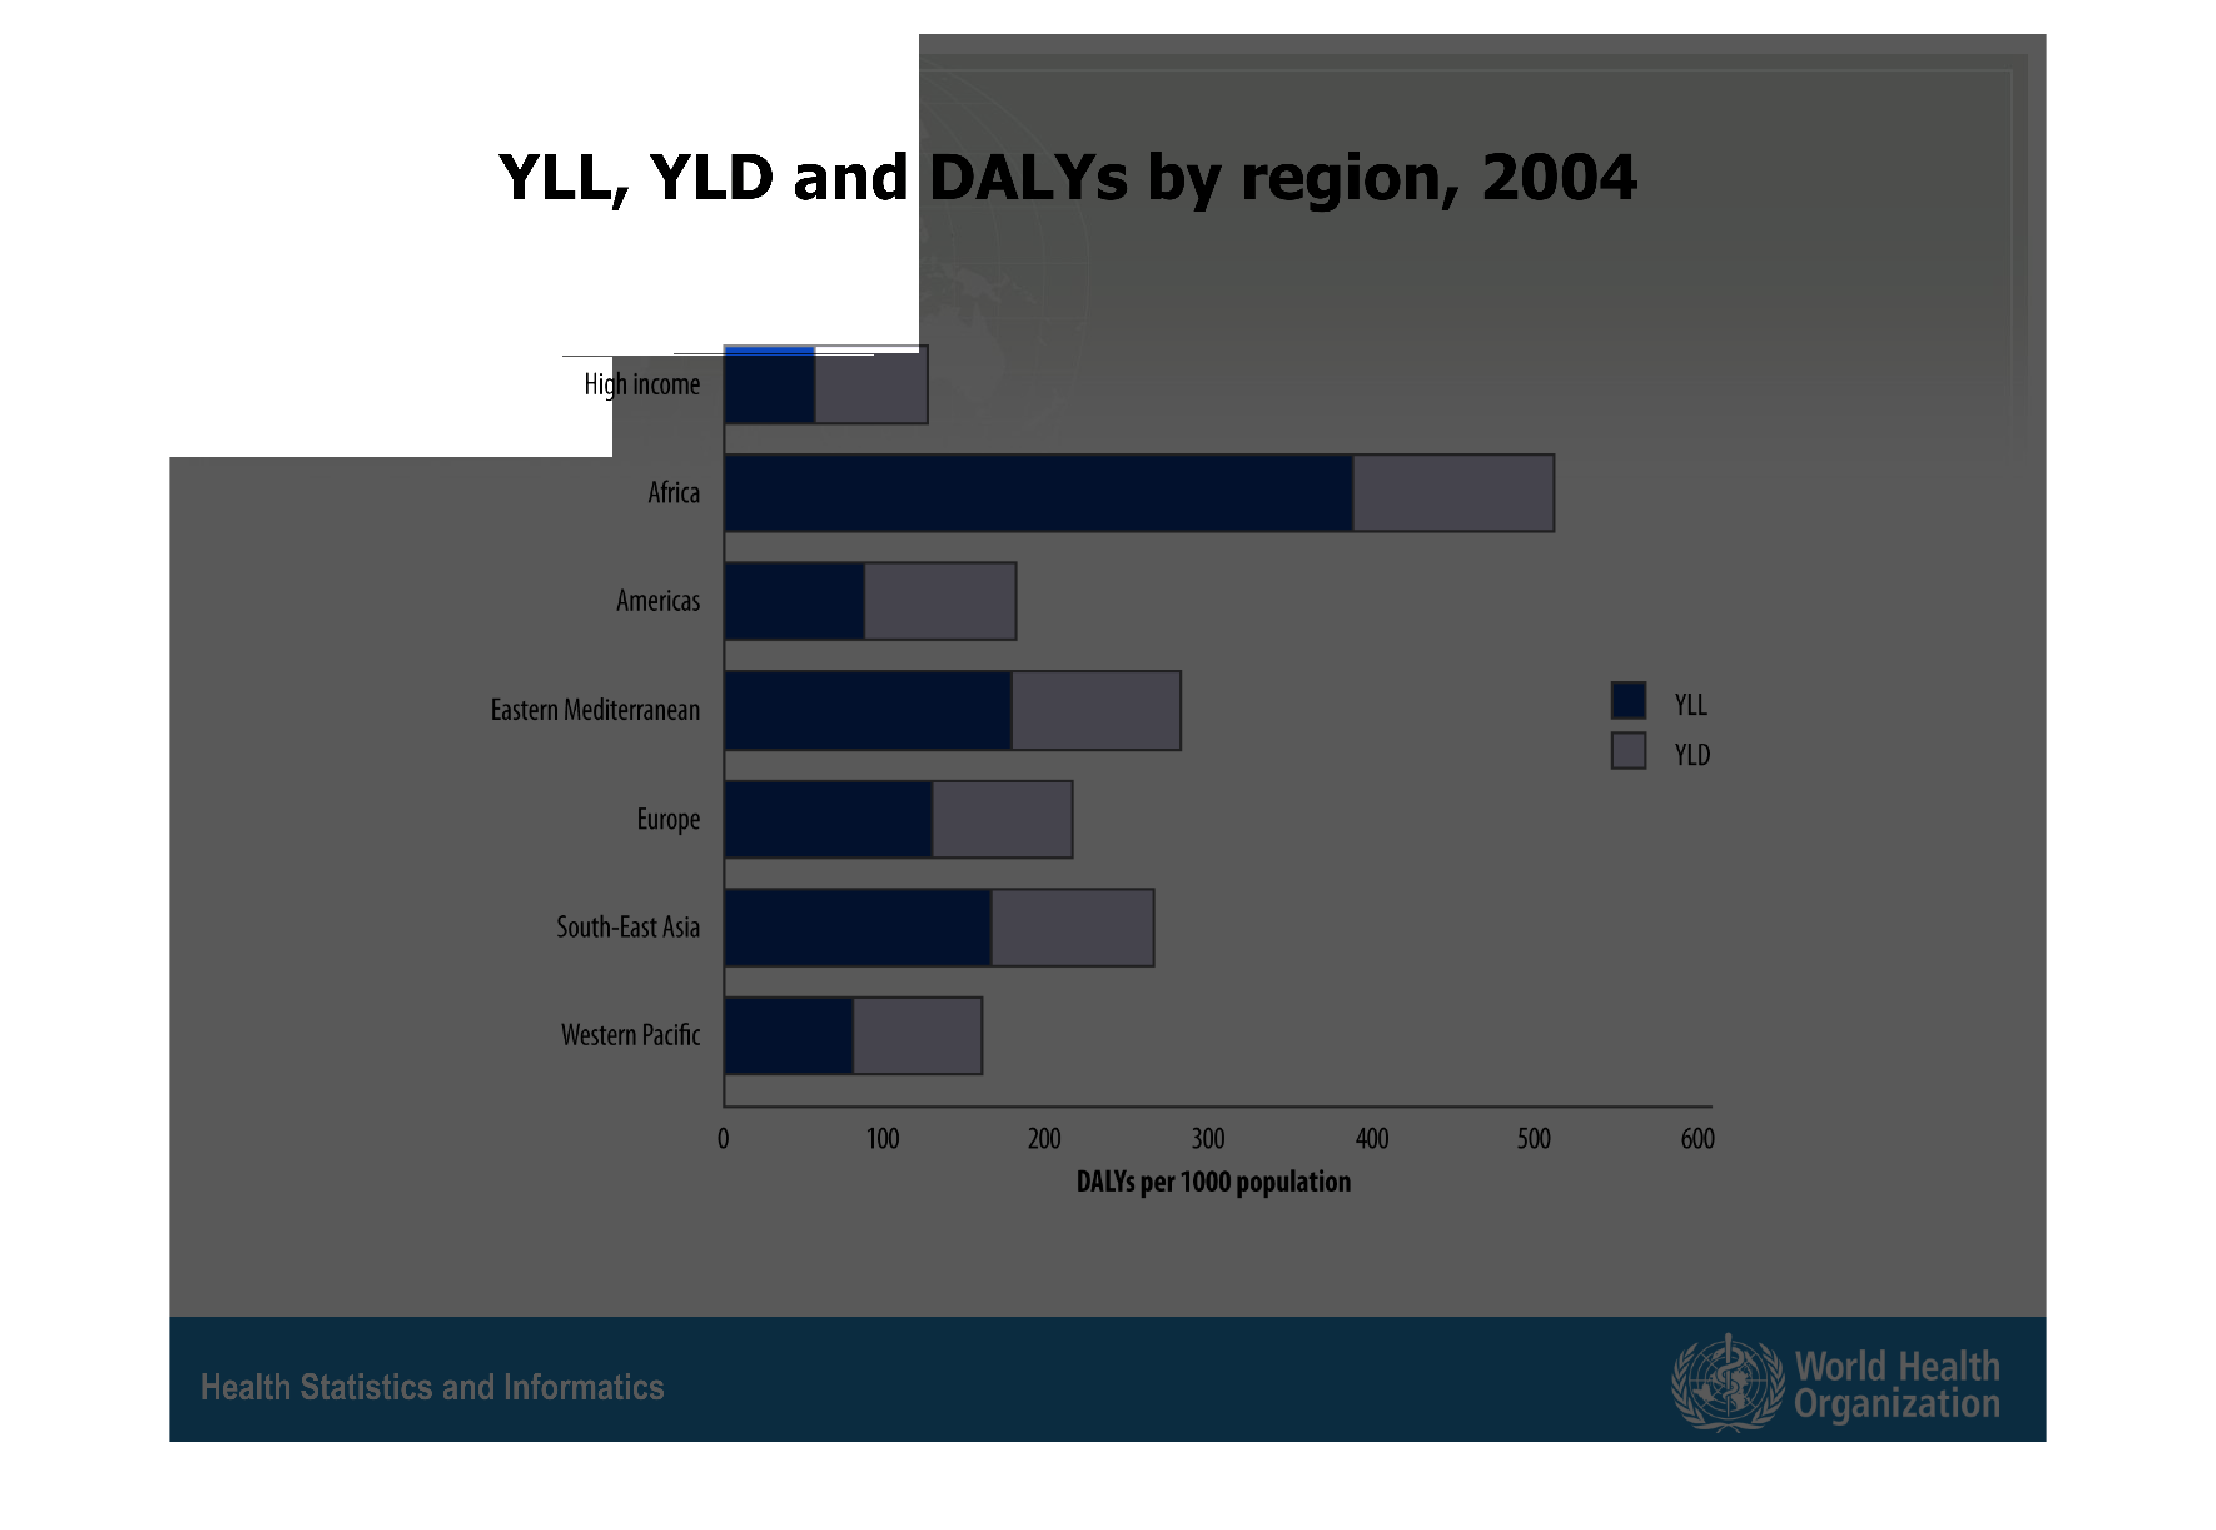
This chart describes YLL, YLD and DALYs by region, for the year 2004. Categories on the chart
inclode high income, Africa, Americas, Europe, and Western Pacific.
Warning: Image is too big to fit on screen; displaying at 67%
Warning: Image is too big to fit on screen; displaying at 67%
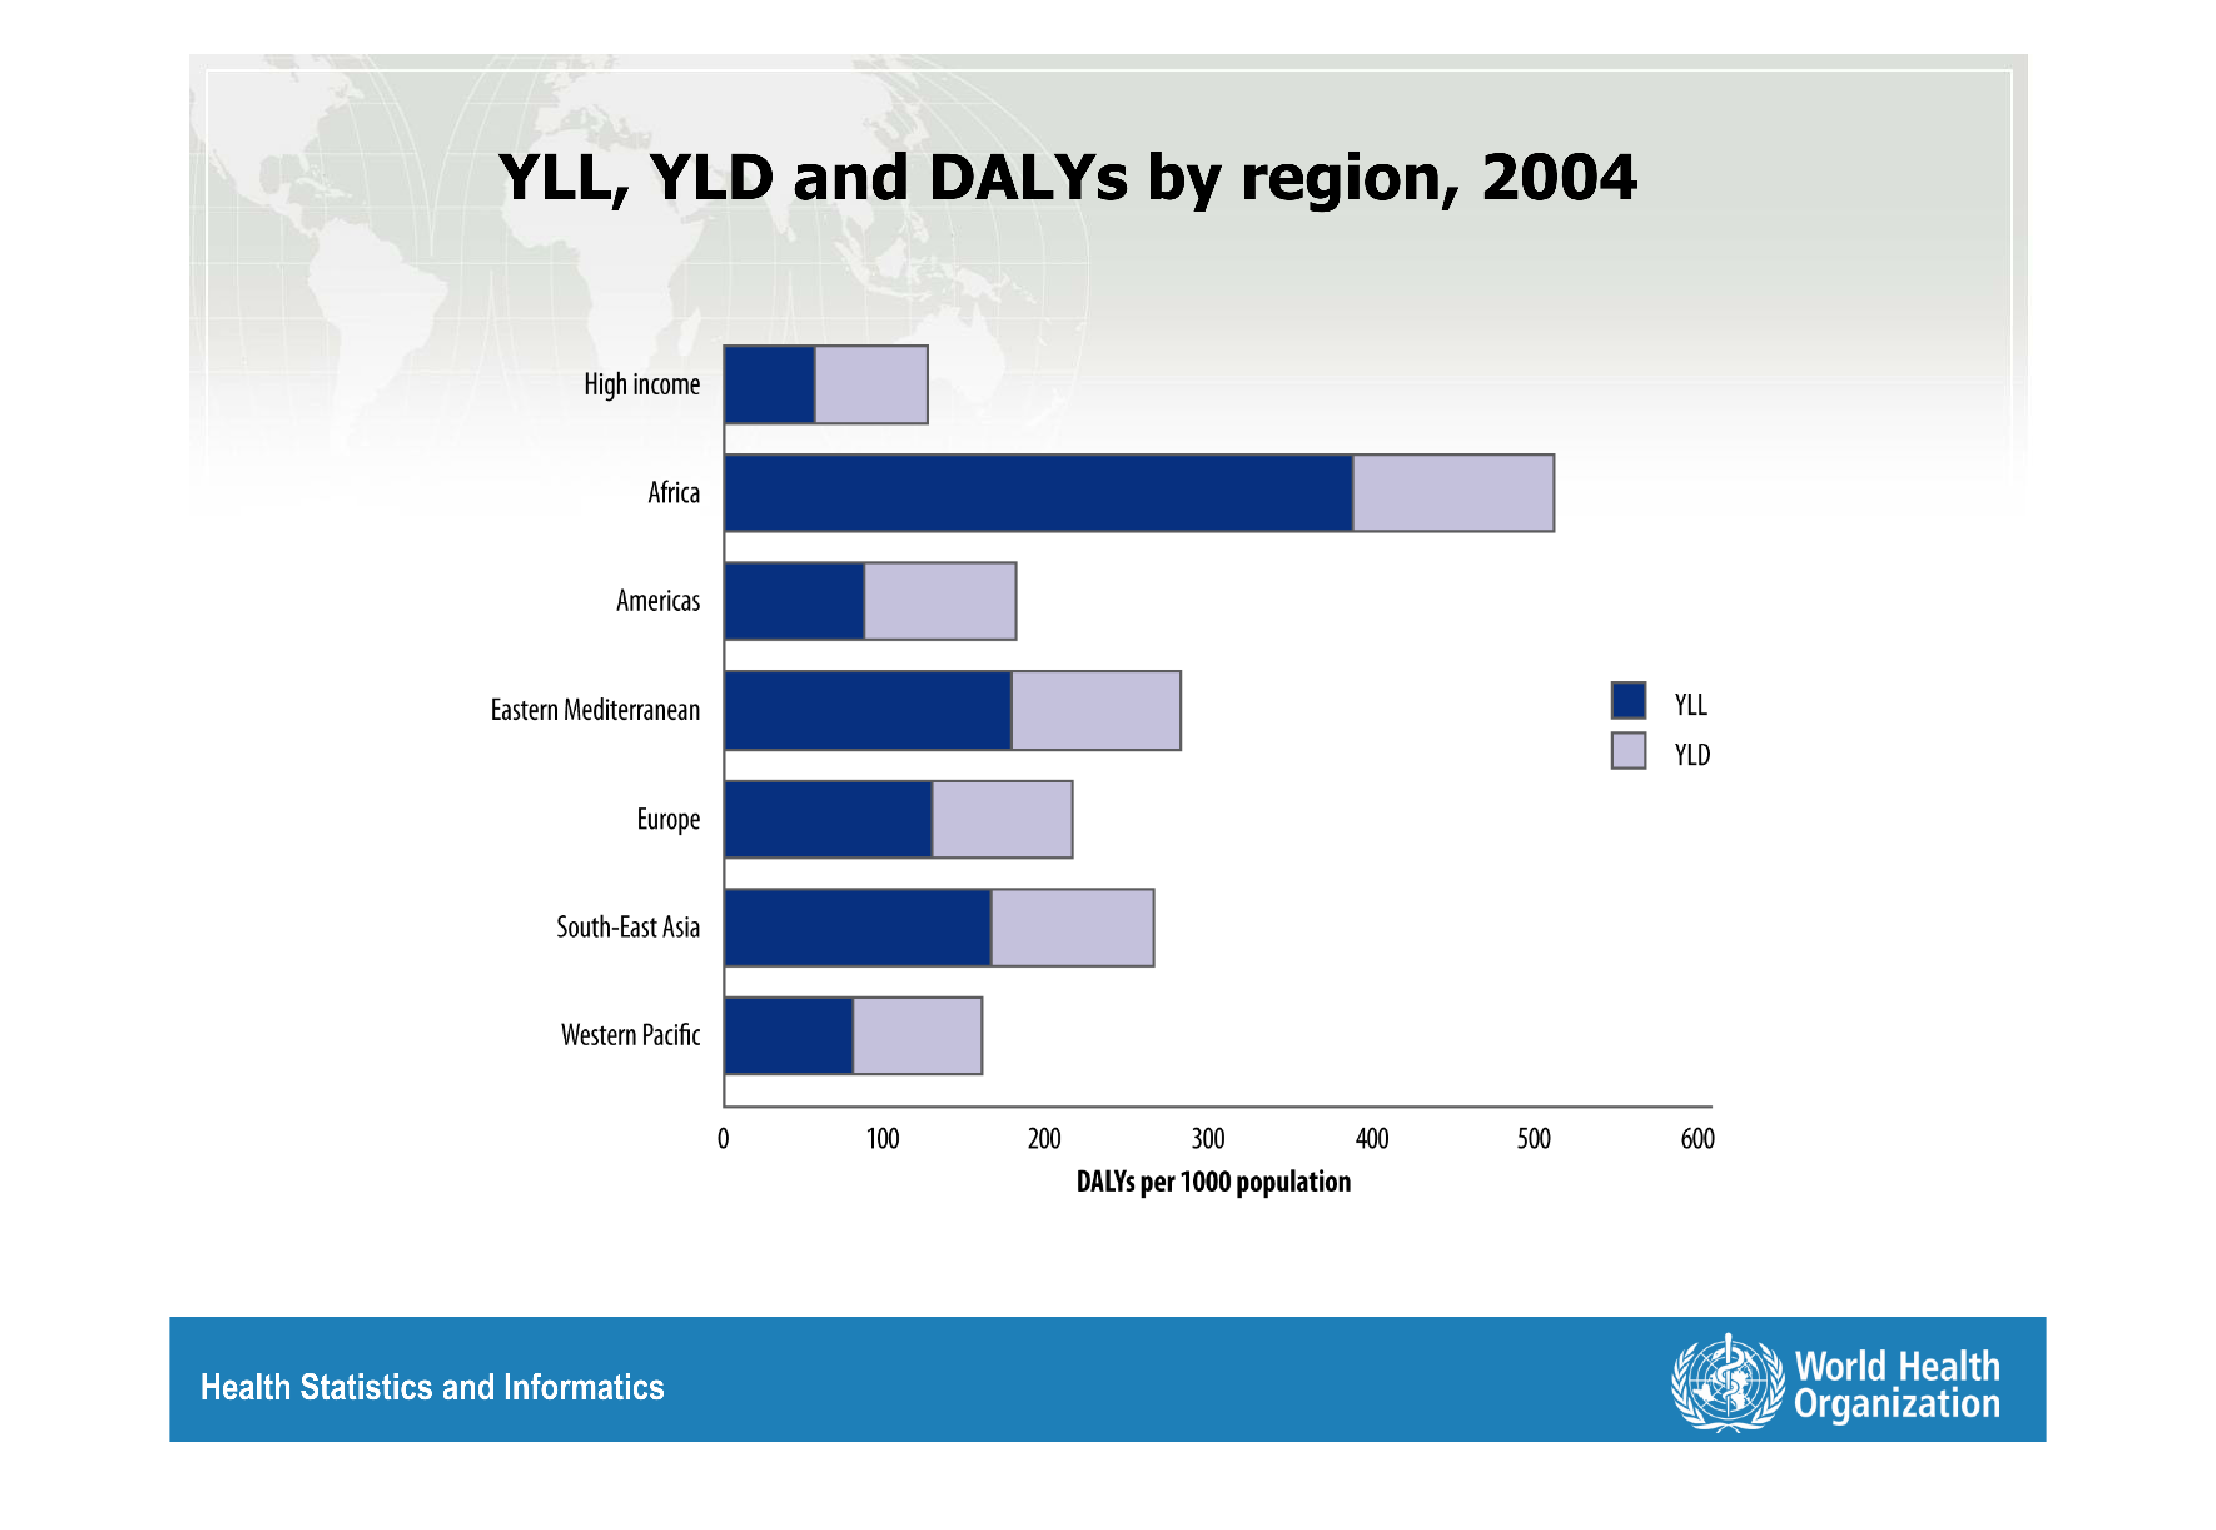
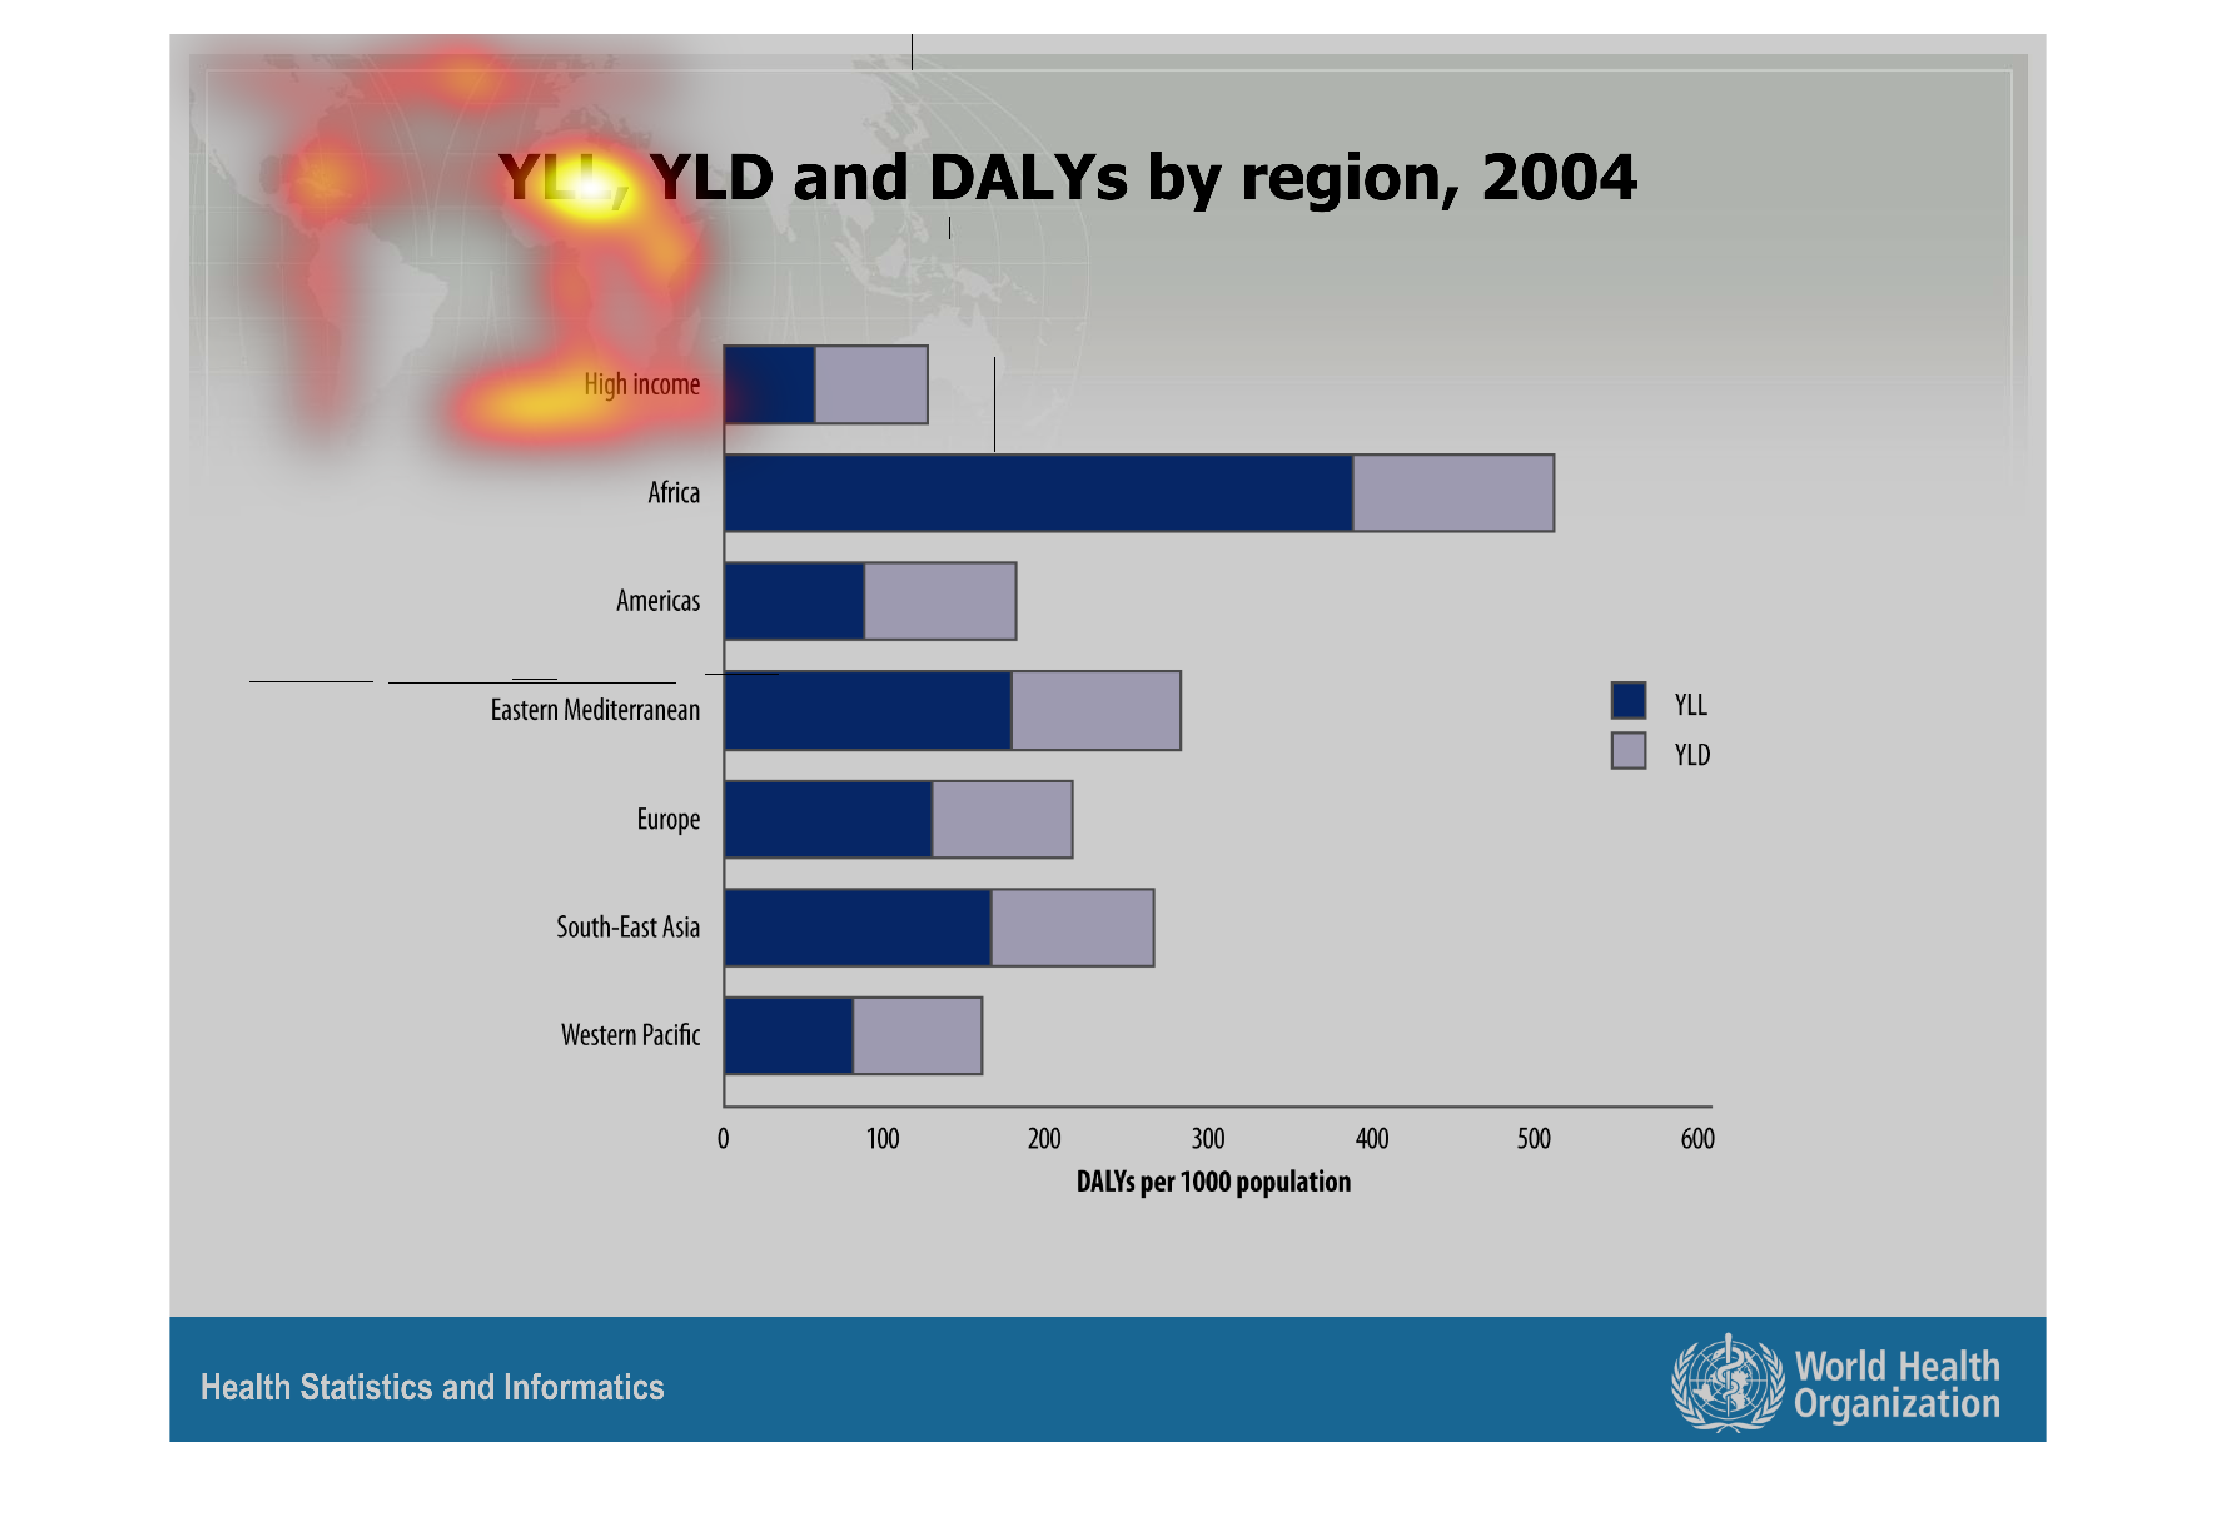
This image is a bar graph showing the YLL, YLD & DALYs by region as of 2004. The region with
most YLL (years life lost) and highest YLD (years living disabled) based on DALYs per 1000
population appears to be Africa. Africa has ~400 YLL for every DALYs per 1000 population in
2004.
Warning: Image is too big to fit on screen; displaying at 67%
Warning: Image is too big to fit on screen; displaying at 67%
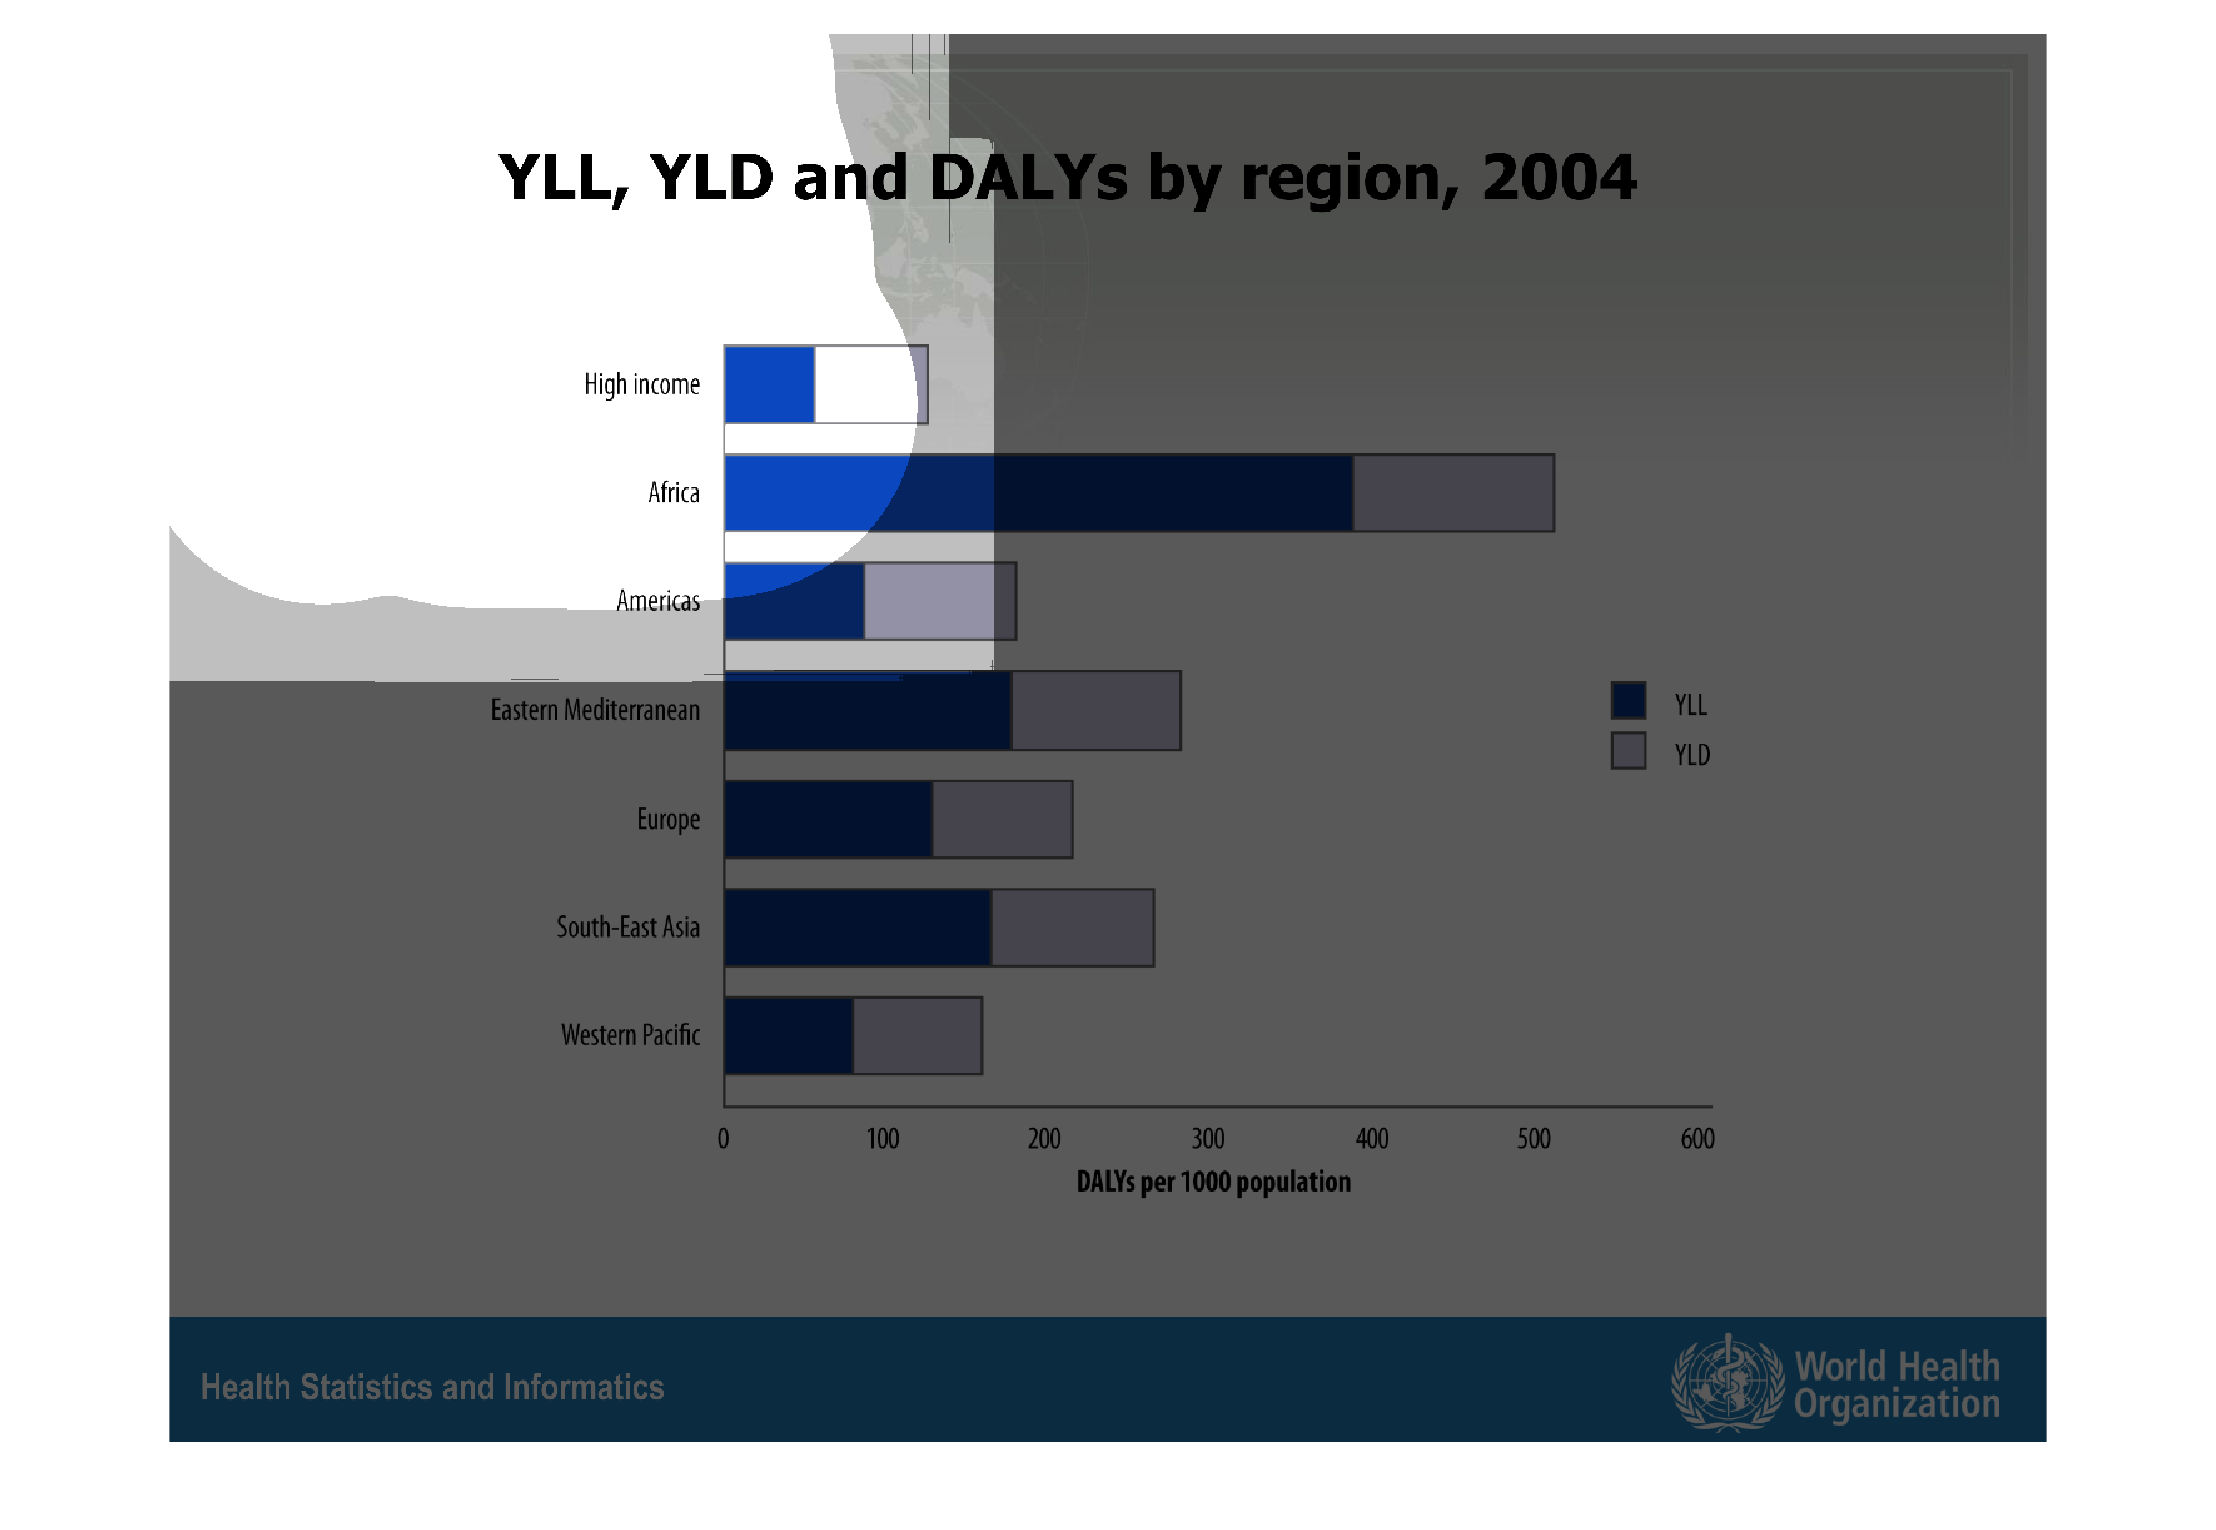
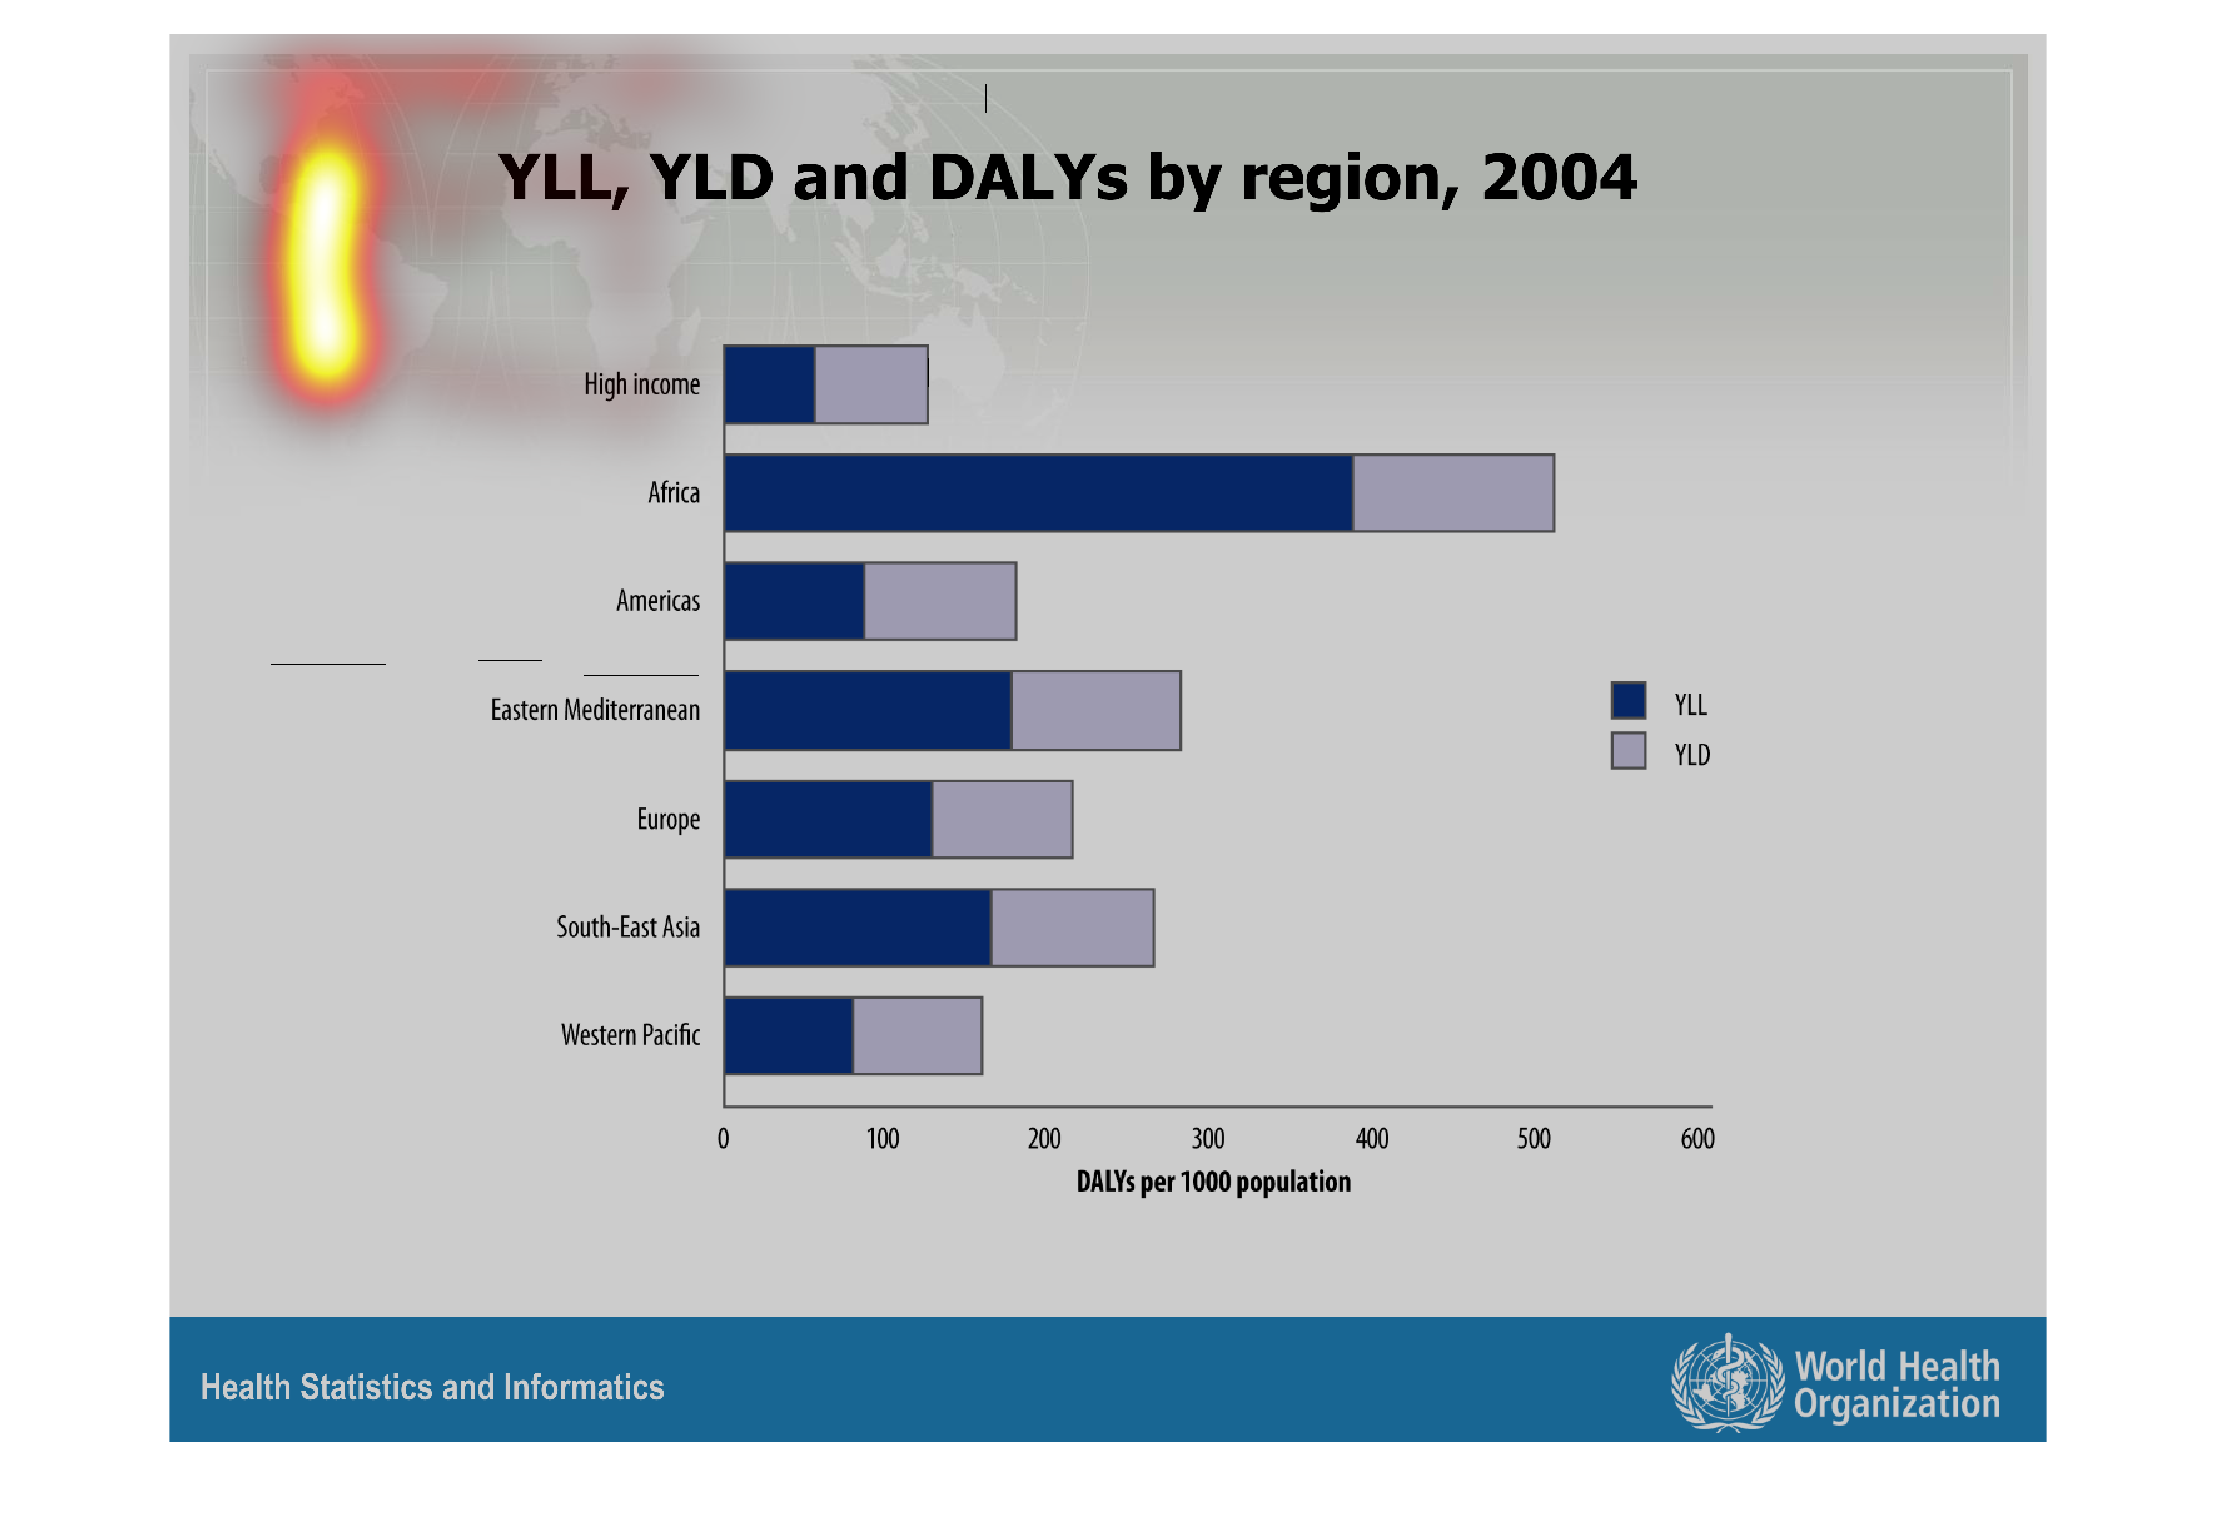
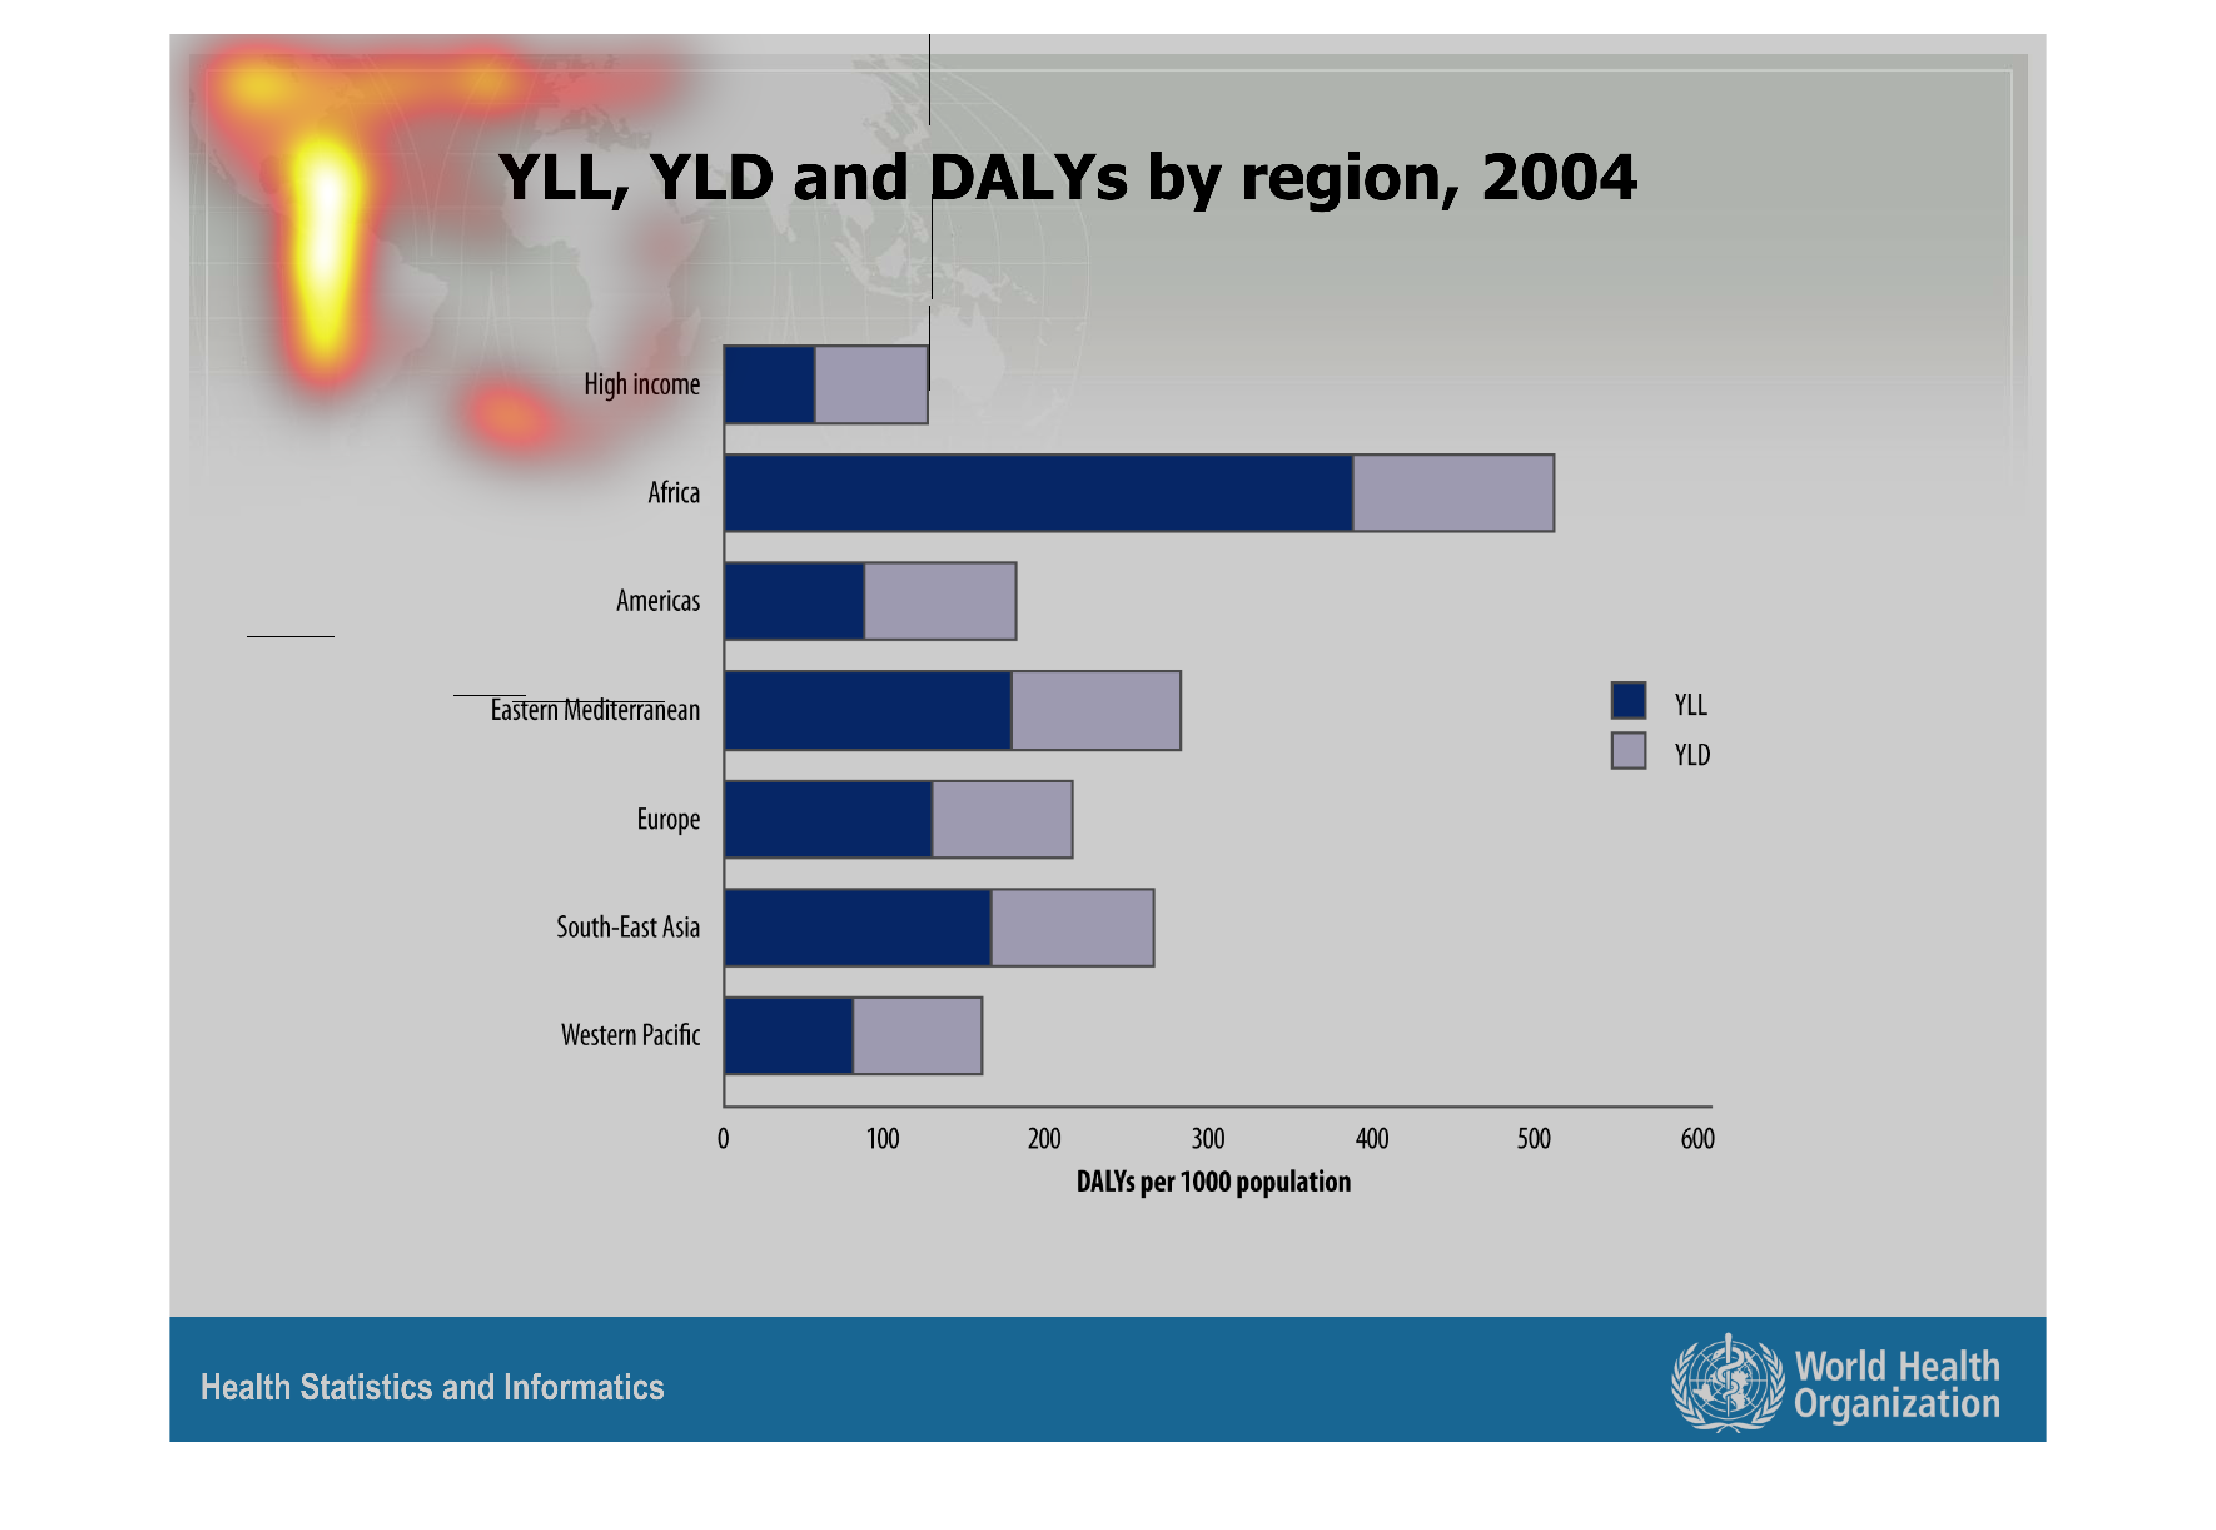
This bar graph has something to do with Money in different countries and regions around the
globe on a daily basis in 2004. Africa has the highest YLL/YLD combination while the americas
have nearly half that amount. The Americas, Eastern Mediteranean and Europe or the developed
countries have nowhere near the amount of YLL/YLD combinations as the developing countries
like the continent of Africa.
Warning: Image is too big to fit on screen; displaying at 67%
Warning: Image is too big to fit on screen; displaying at 67%
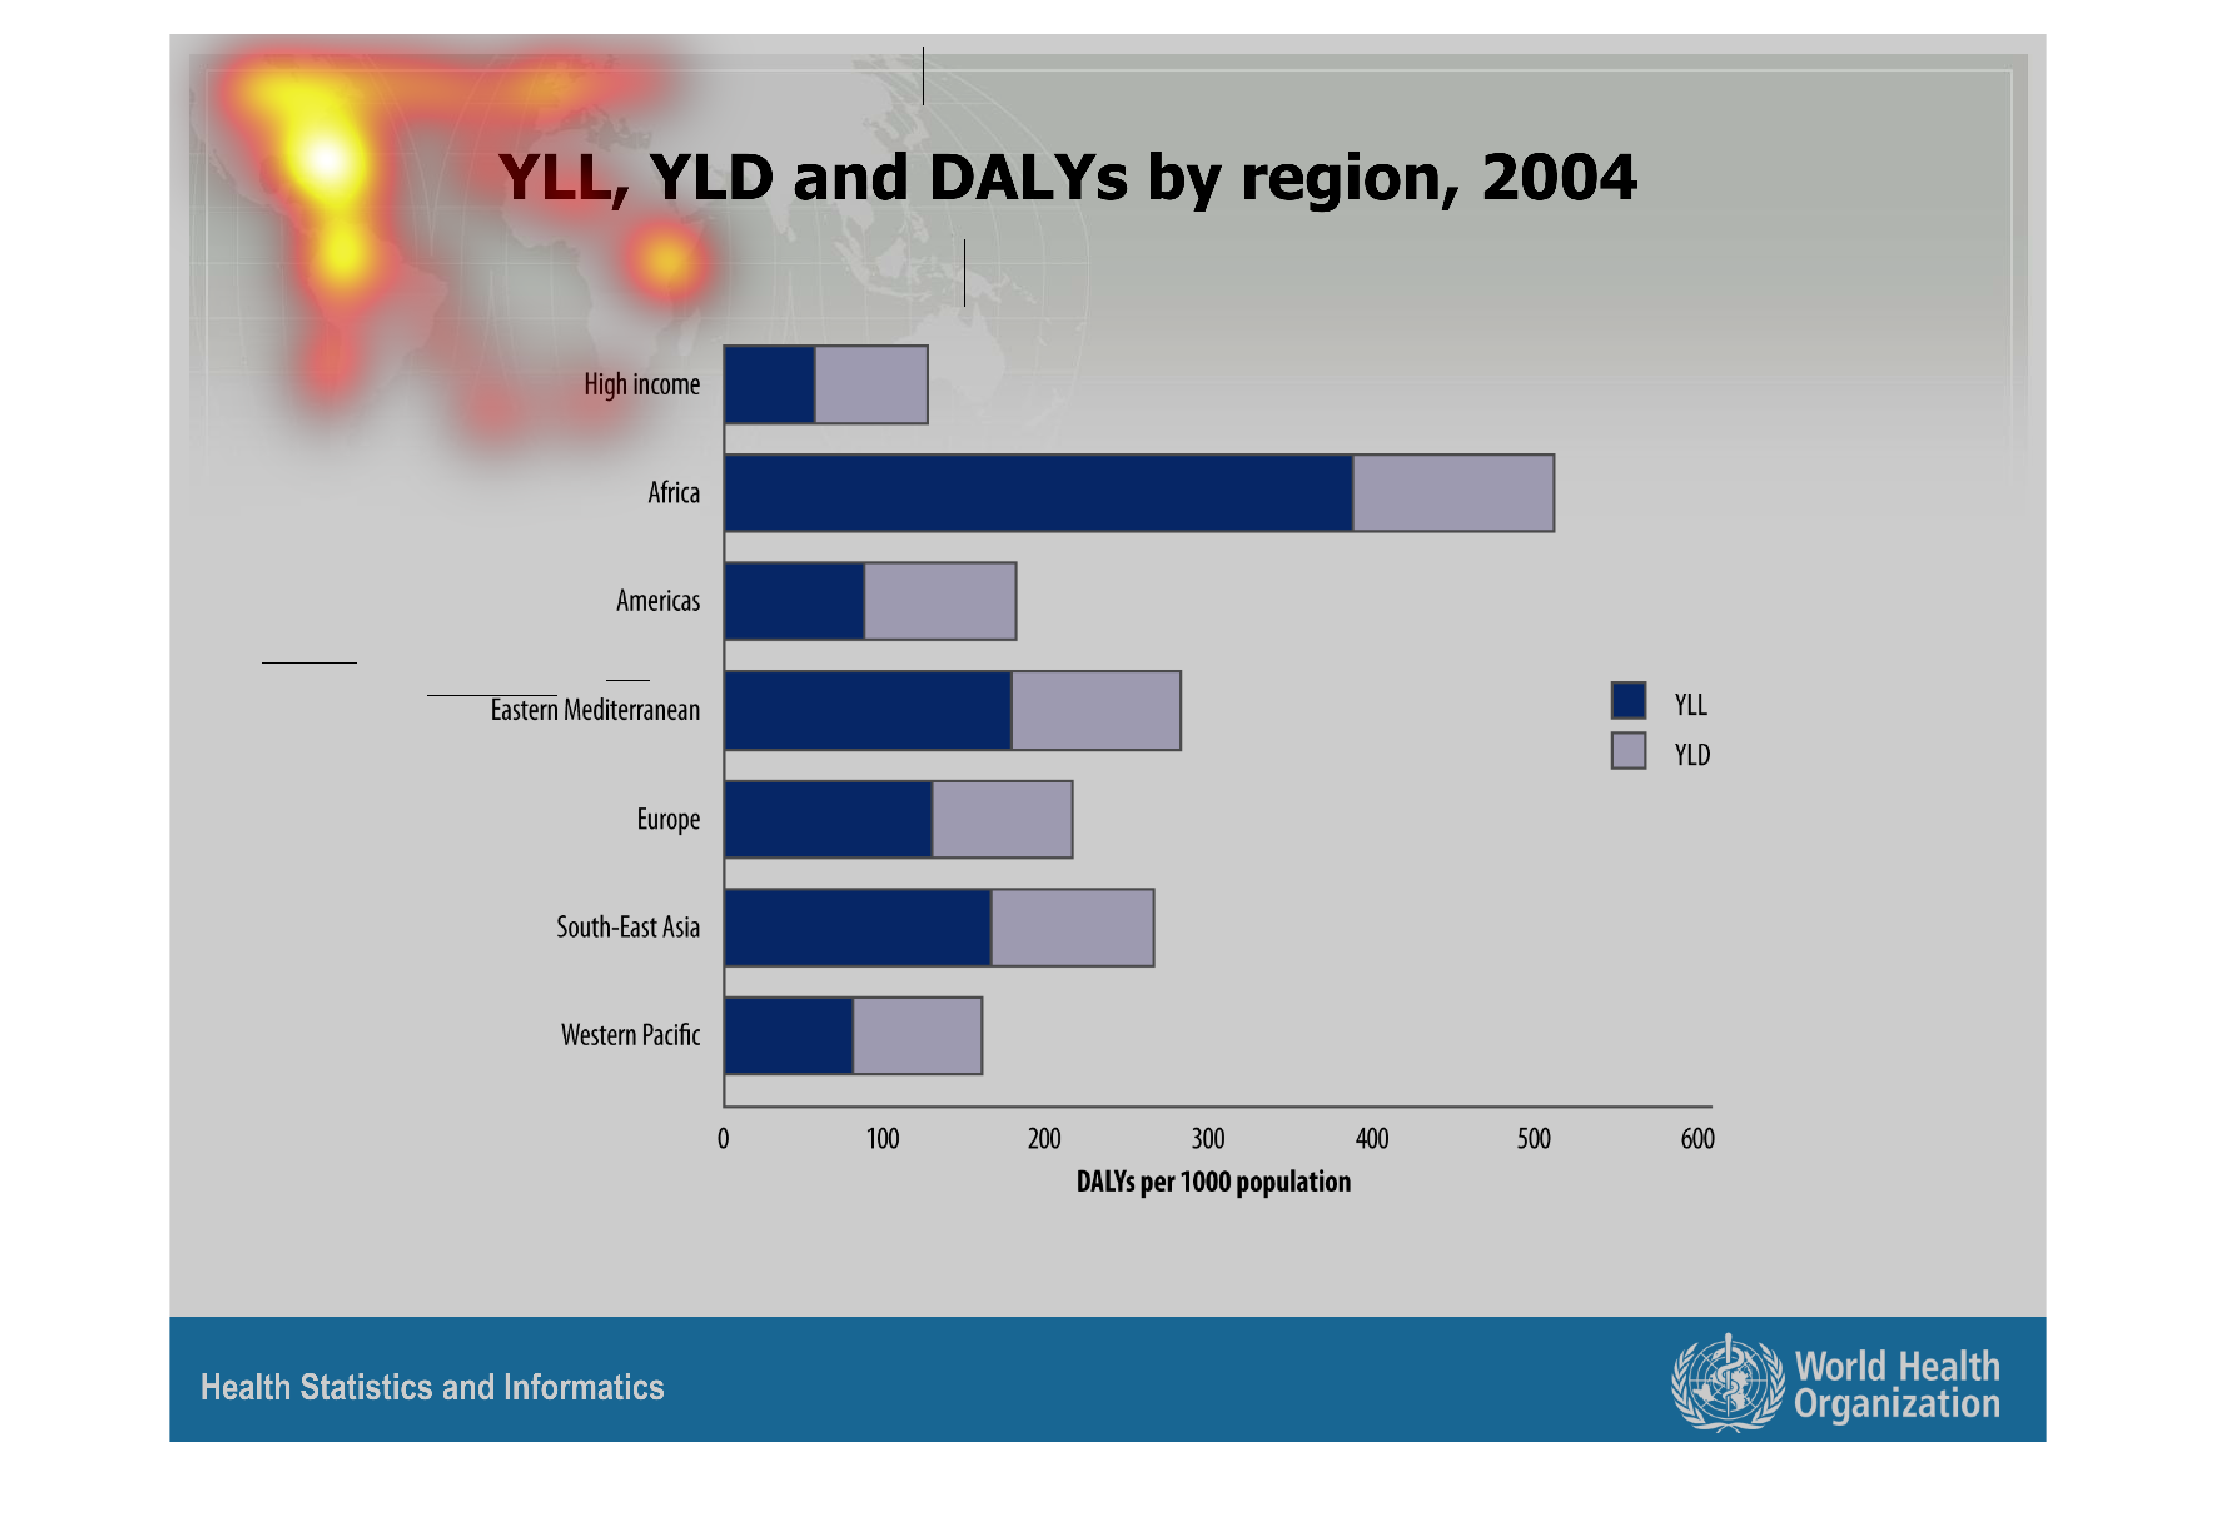
This graph shows YLL, YLD and DALYs by region. The data was collected in 2004. Africa had
the largest amount of any region displayed. There was also a section that included "high income"
Warning: Image is too big to fit on screen; displaying at 67%
Warning: Image is too big to fit on screen; displaying at 67%
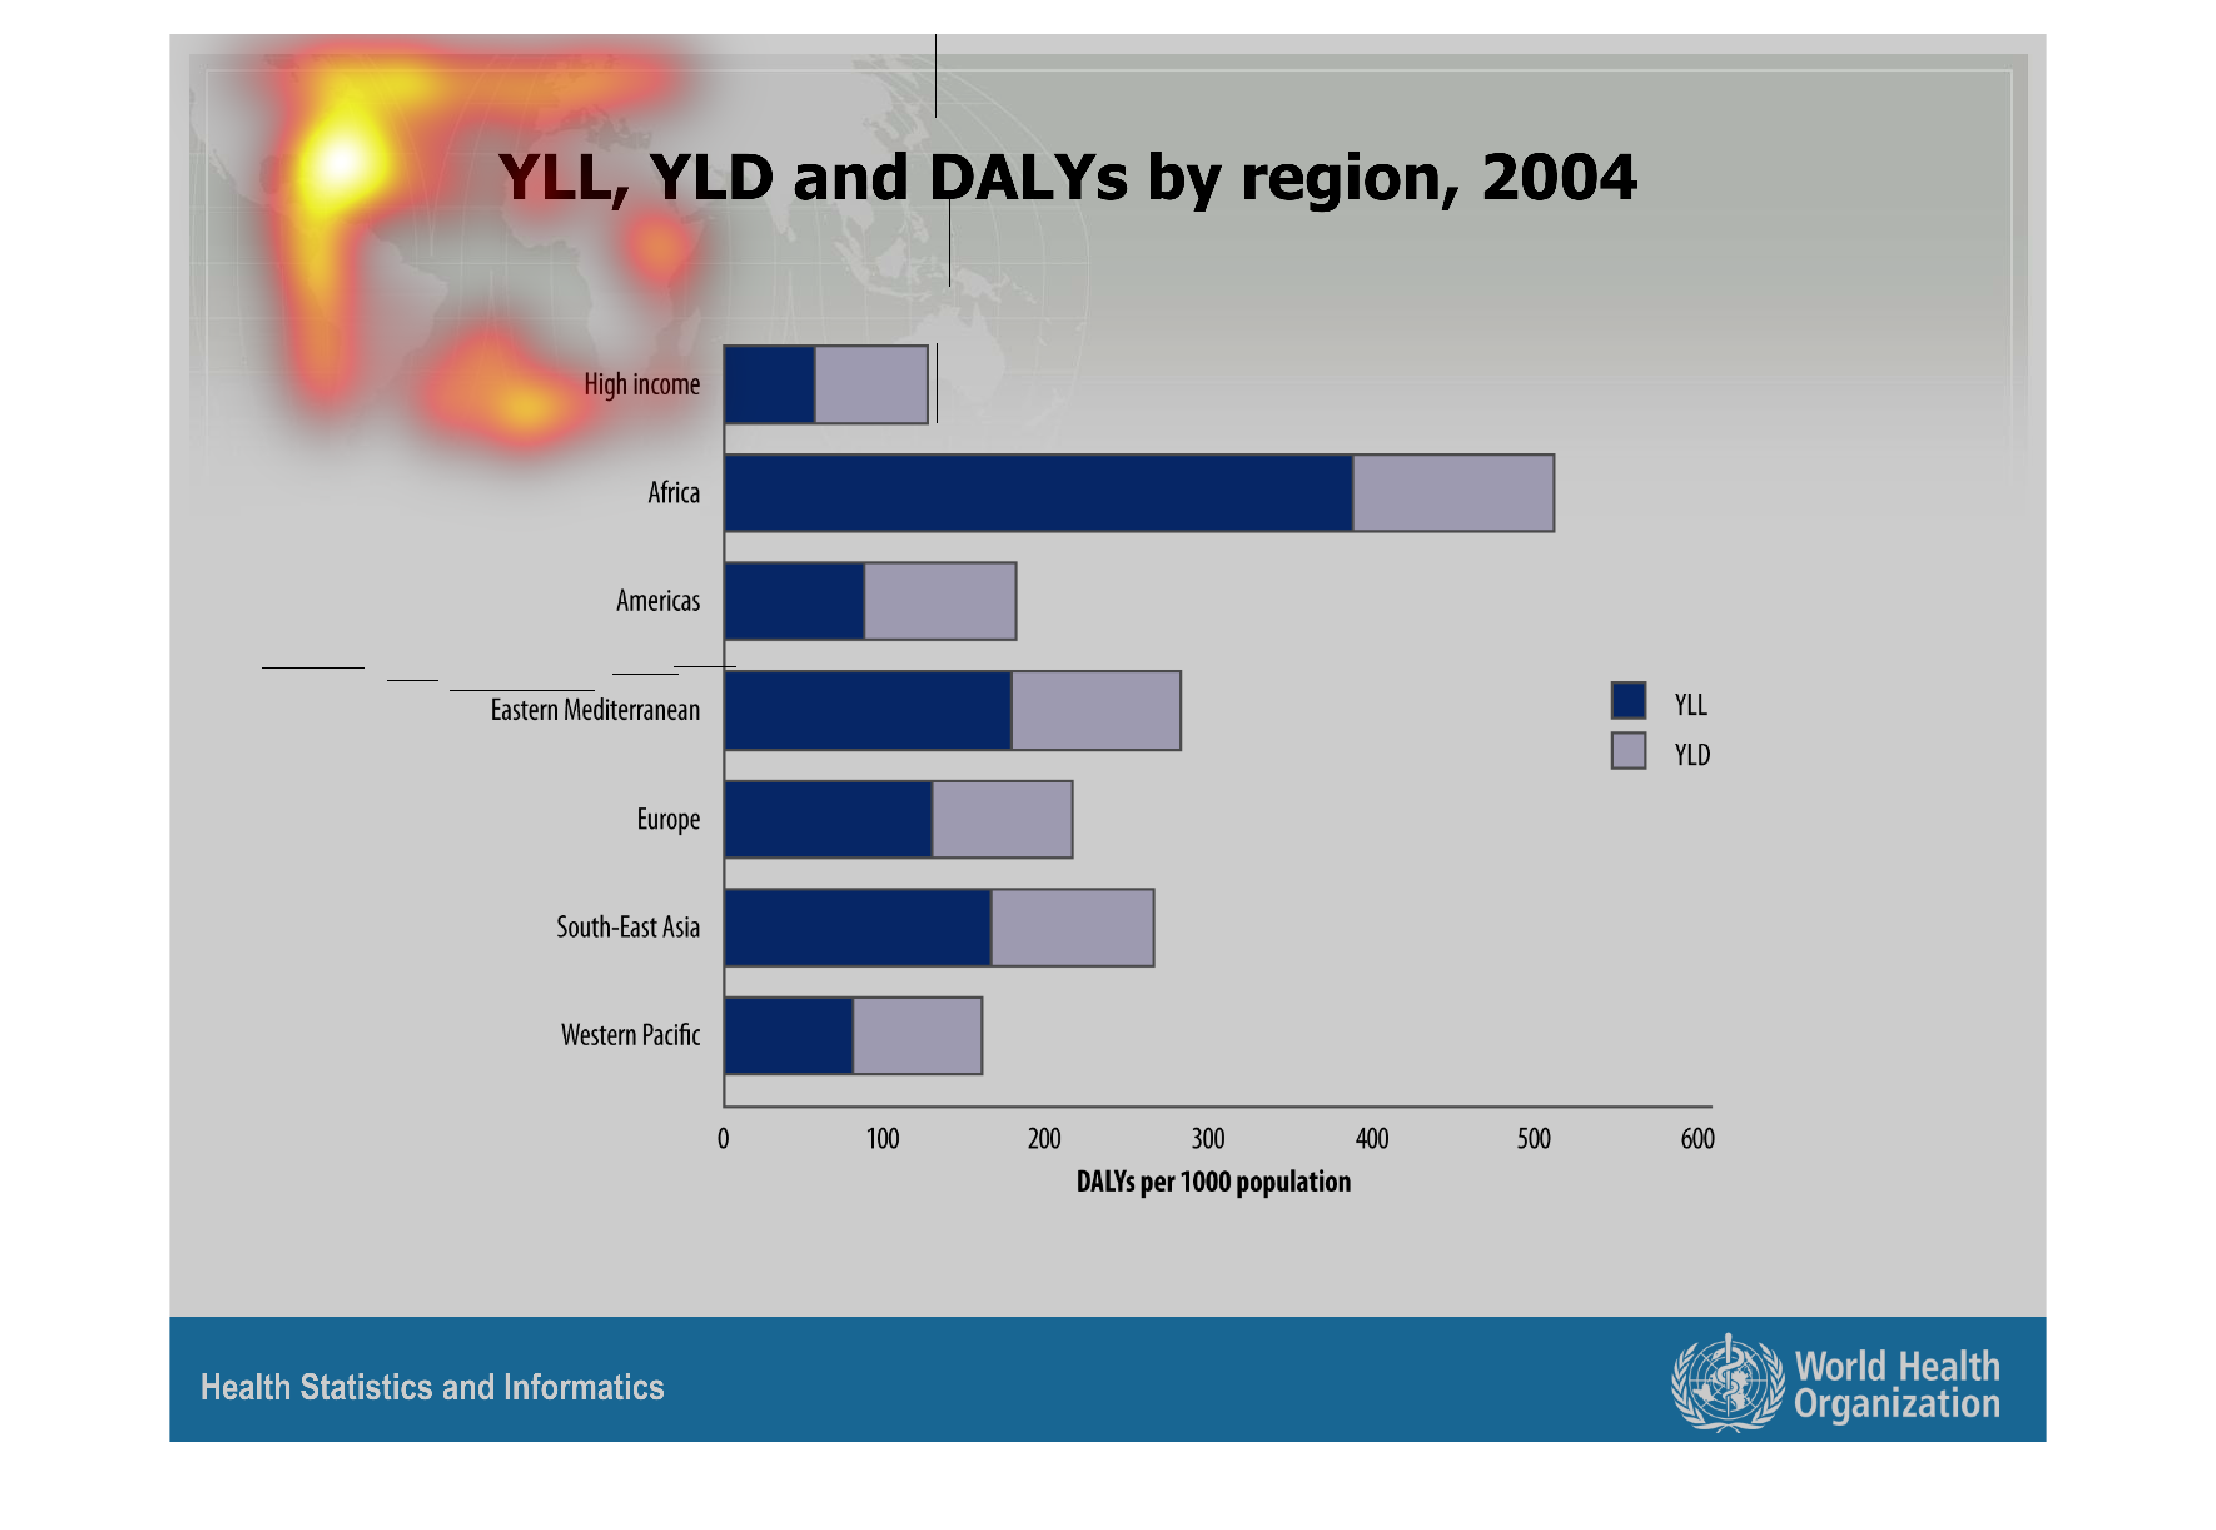
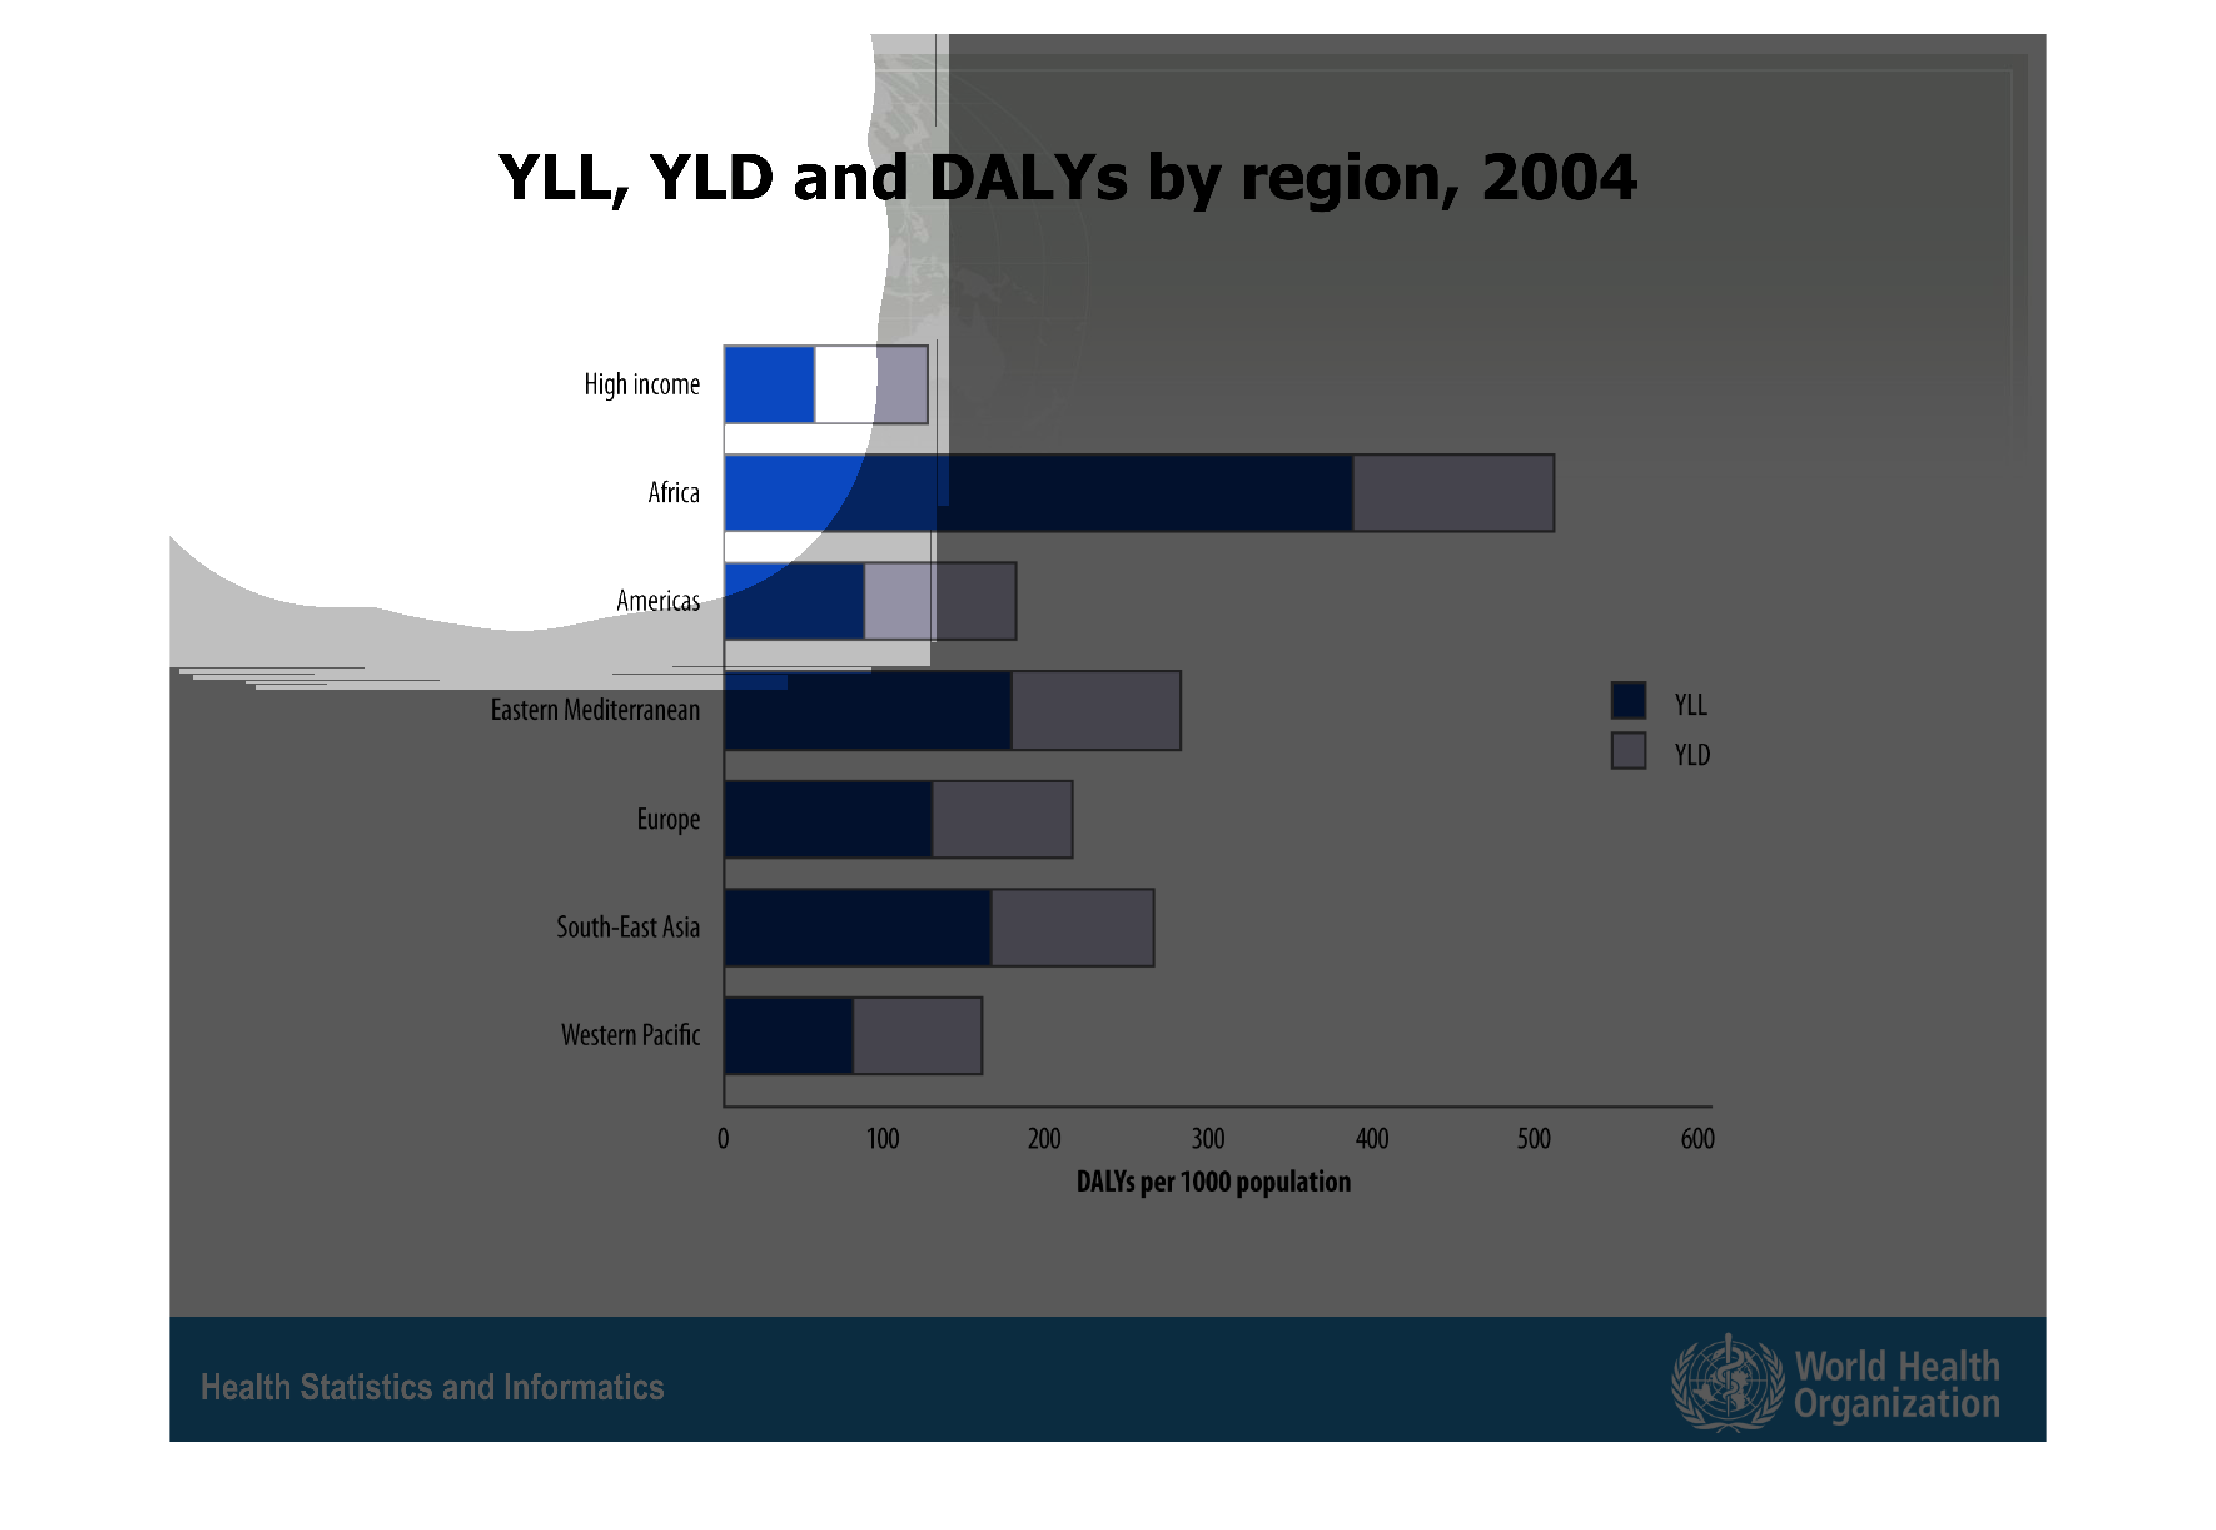
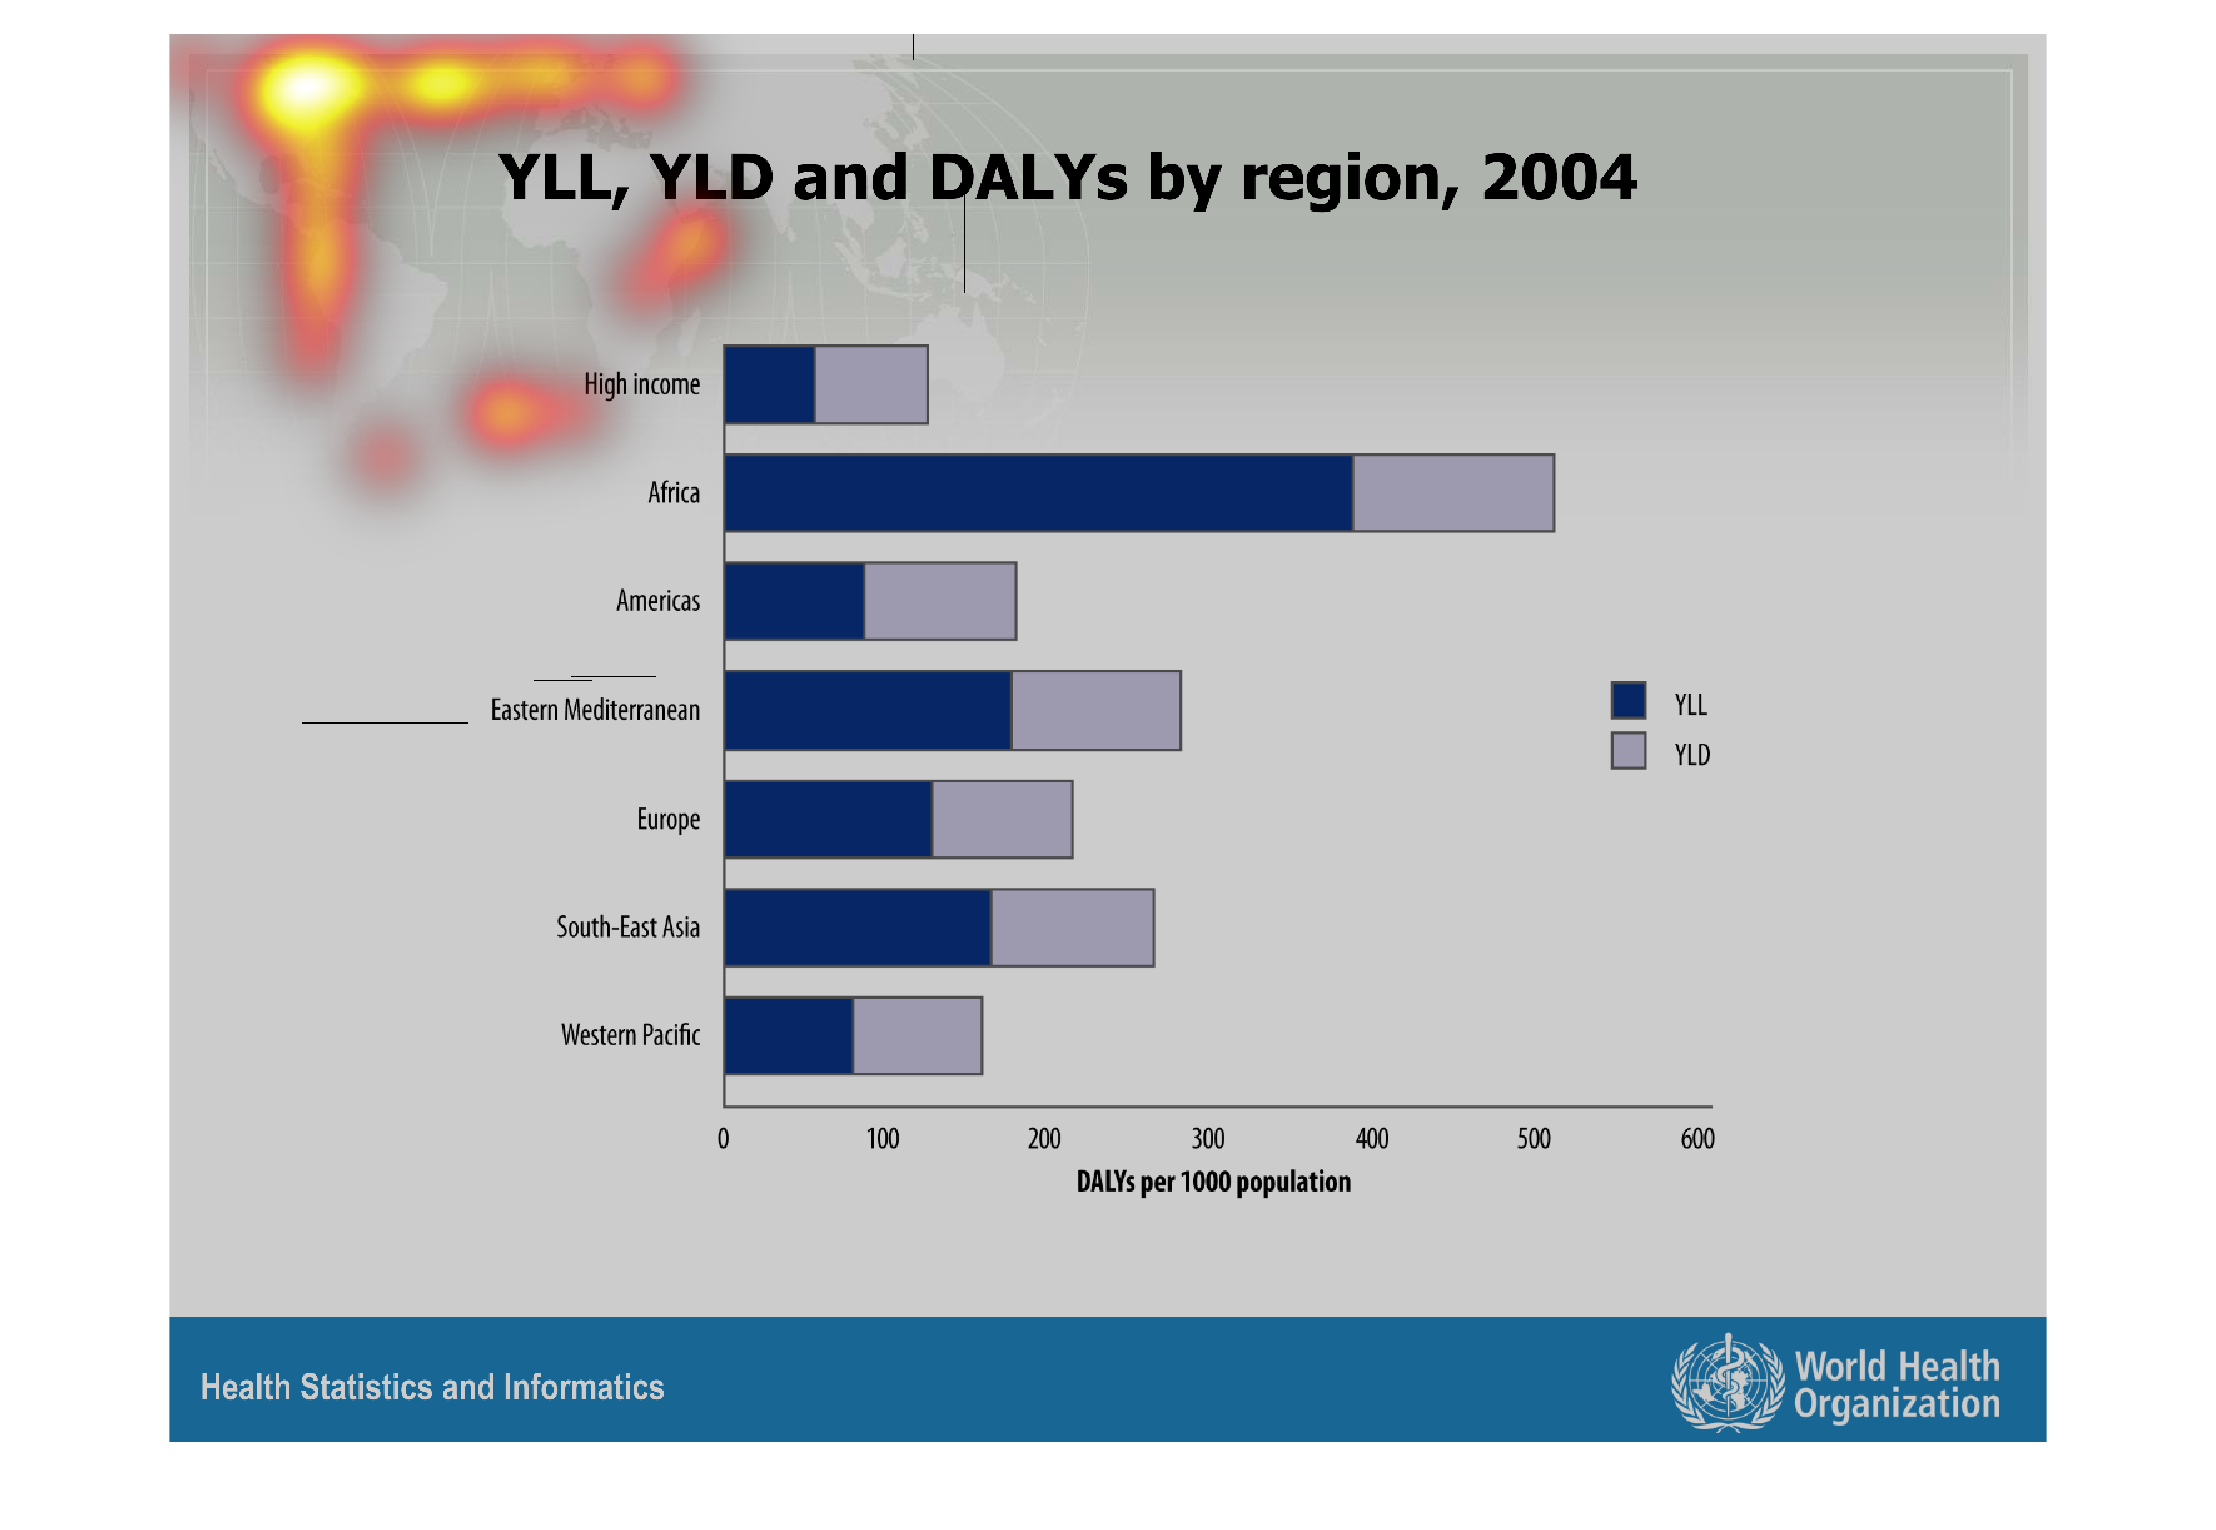
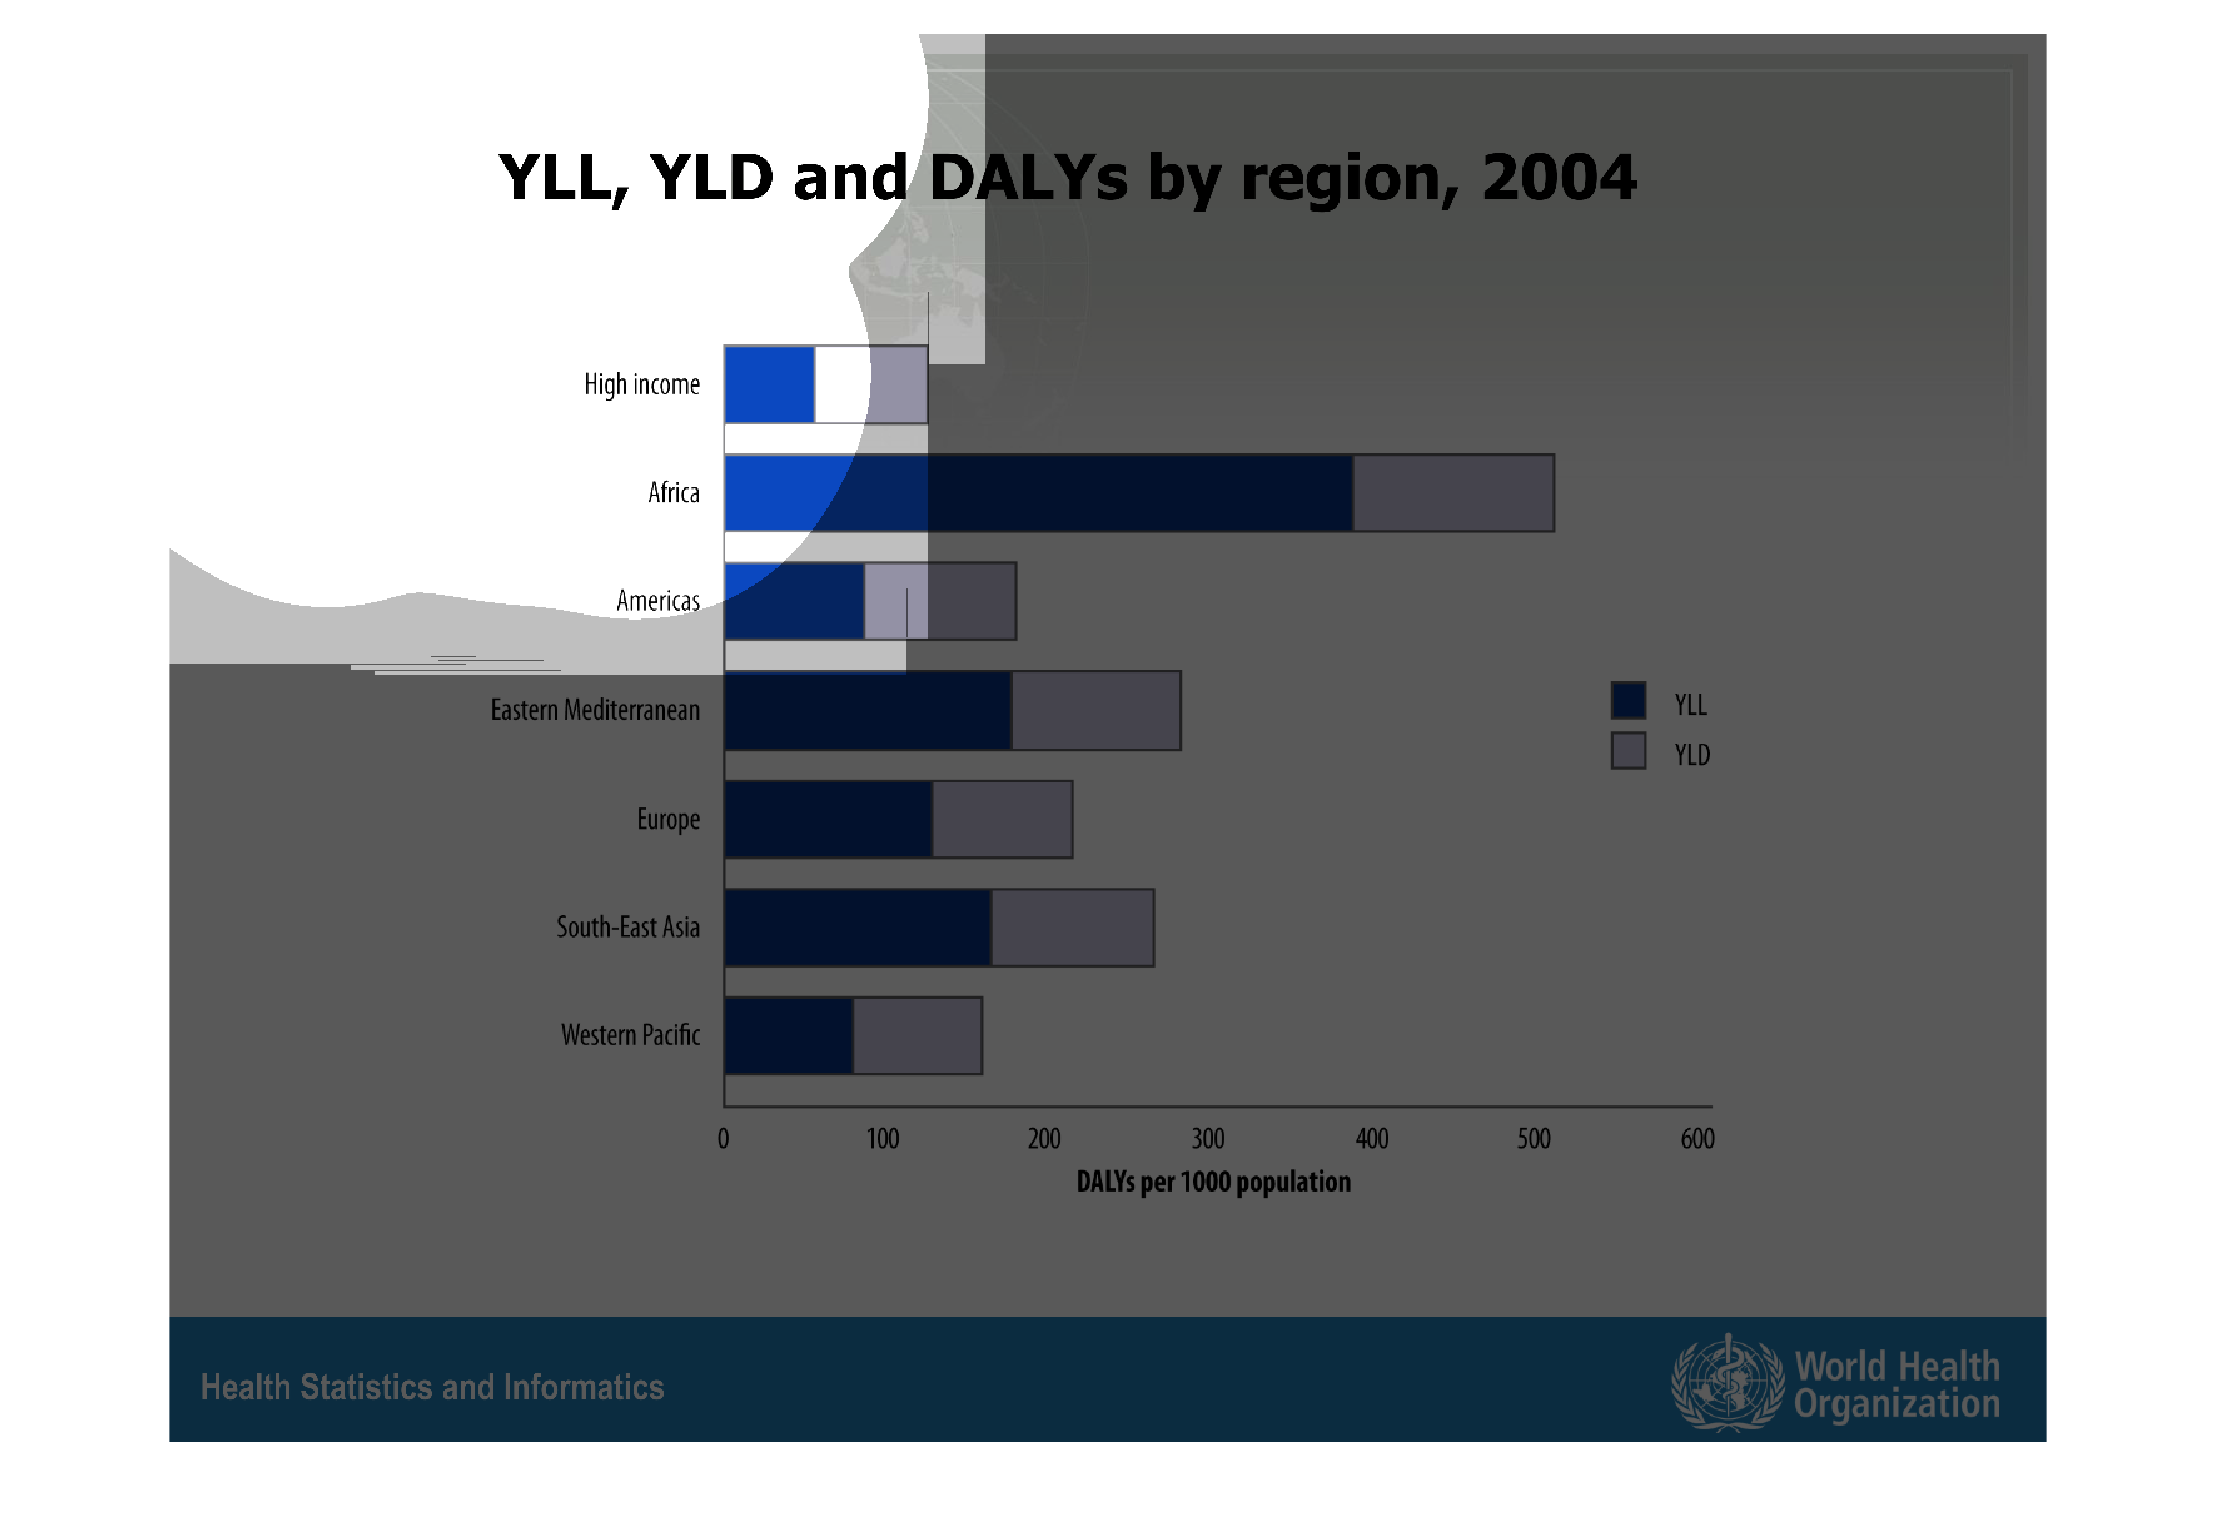
Chart of YLL, YLD, AND DALYs by region, 2004 including a key.  Africa has the most YLL by
far.  Eastern Mediterranean and Africa are pretty much tied for YLD.
Warning: Image is too big to fit on screen; displaying at 67%
Warning: Image is too big to fit on screen; displaying at 67%
This chart shows YLL, YLD and DLY's by region. This is for the year 2004. The graph represents
amounts per 1,000 people. The geographic portion is split into 6 sections.
Warning: Image is too big to fit on screen; displaying at 67%
Warning: Image is too big to fit on screen; displaying at 67%
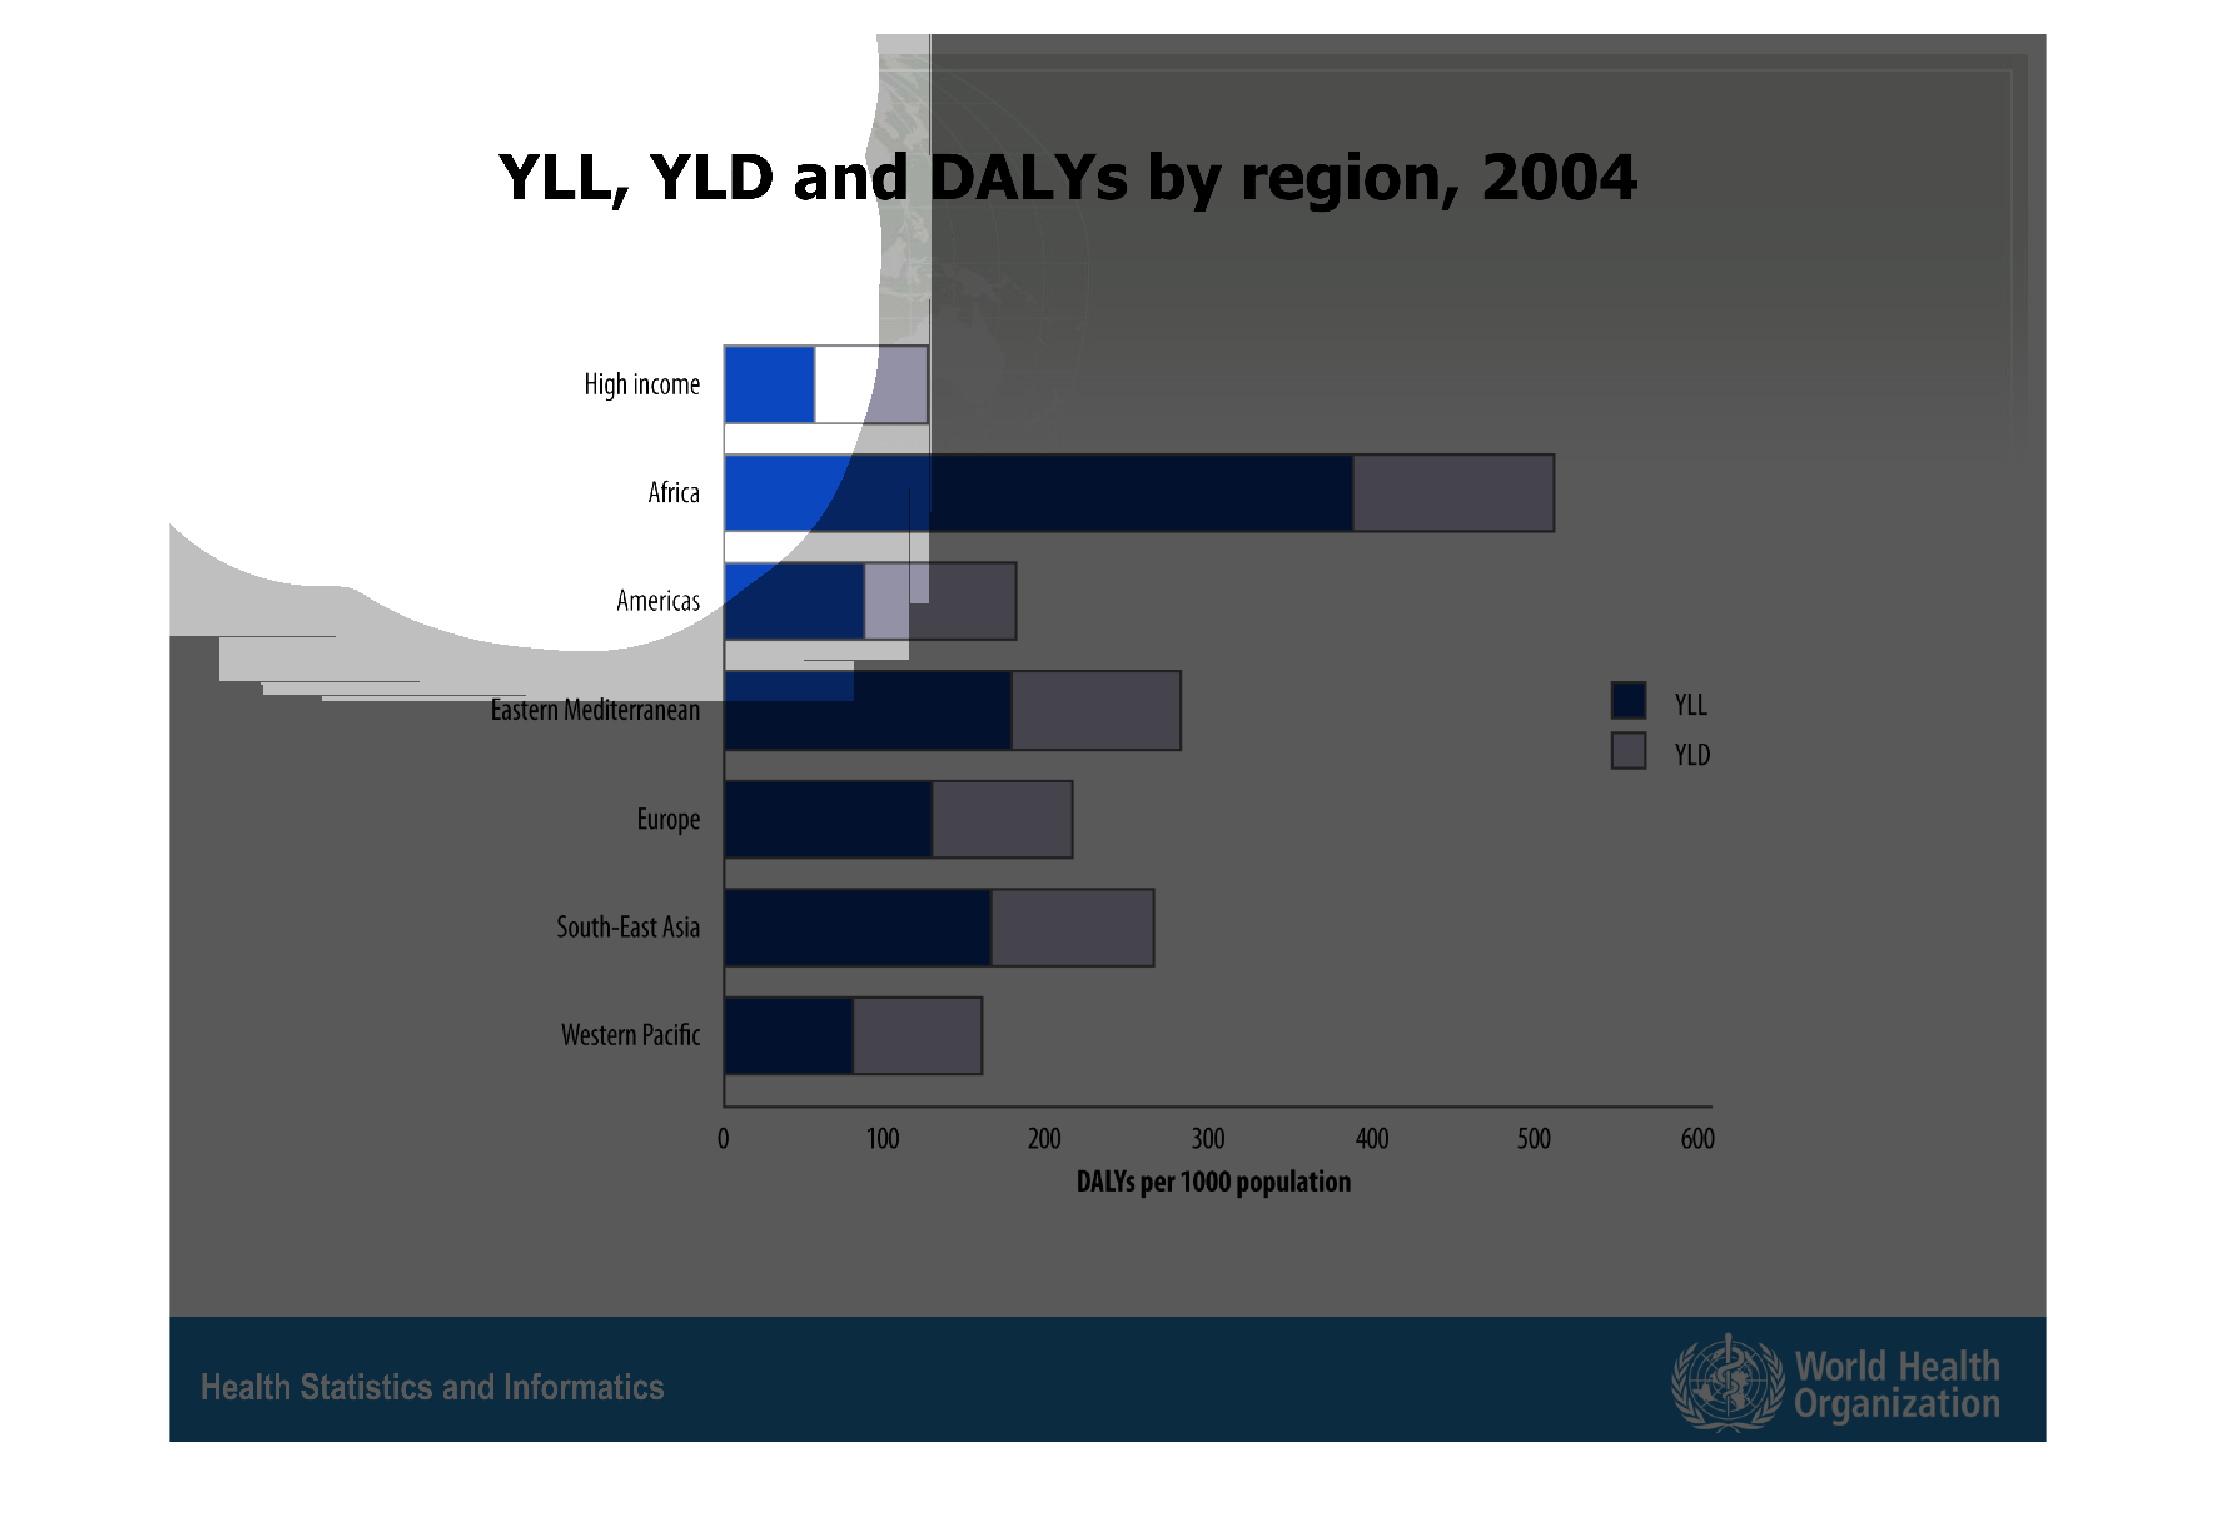
This graph illustrates YLL, YLD, and DALYs by region in 2004.  Africa has the highest rates
and high income countries have the lowest rates by population.
Warning: Image is too big to fit on screen; displaying at 67%
Warning: Image is too big to fit on screen; displaying at 67%
YLL, YLD, and DALYs by region 2003 A table showing which region had the most of both yll and
yld.. With there being more yll in the world then ylds. I don't know what else to write down
because it's very difficult to read the graph.
Warning: Image is too big to fit on screen; displaying at 67%
Warning: Image is too big to fit on screen; displaying at 67%

This bar graph shows YLL, YLD and DALYs by region in 2004. It is divided up by Africa, Americas,
Eastern Mediterranean, Europe, South East Asia, and Western Pacific.
Warning: Image is too big to fit on screen; displaying at 67%
Warning: Image is too big to fit on screen; displaying at 67%