Warning: Image is too big to fit on screen; displaying at 67%
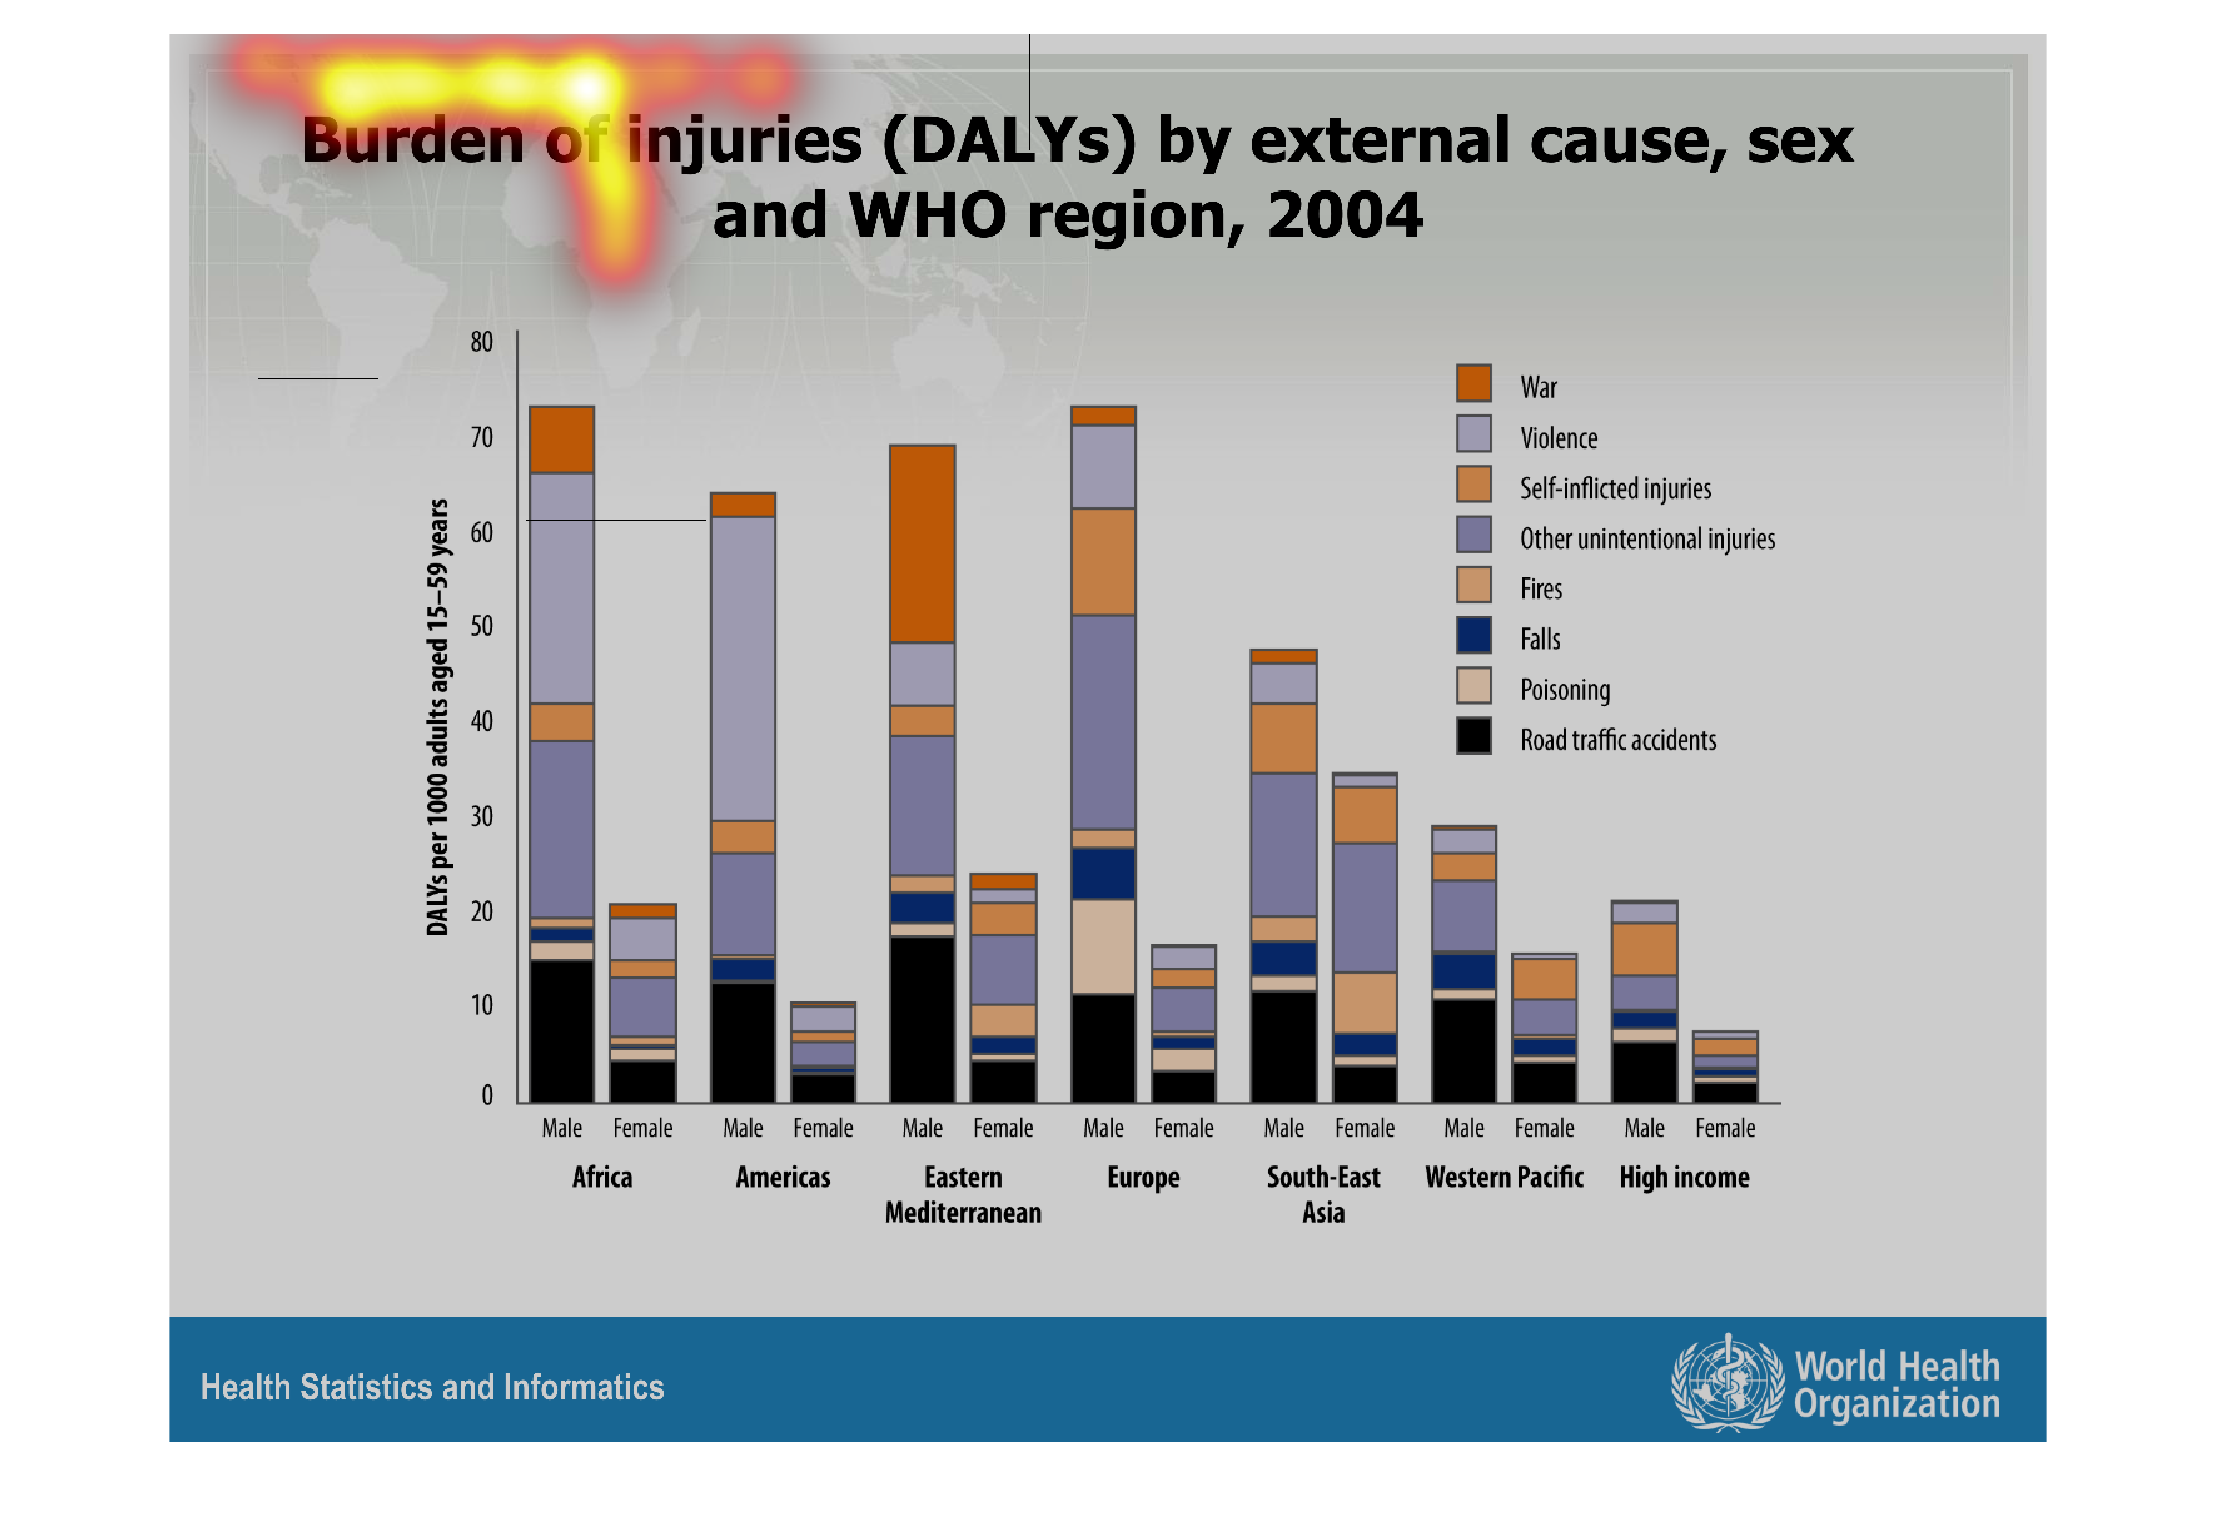
This graph shows the burden of injuries (daily's) by external cause, sex and WHO region for
2004. This ranges from war to road traffic accidents. This graph shows Americans male and
female as well as Europe and other countries.
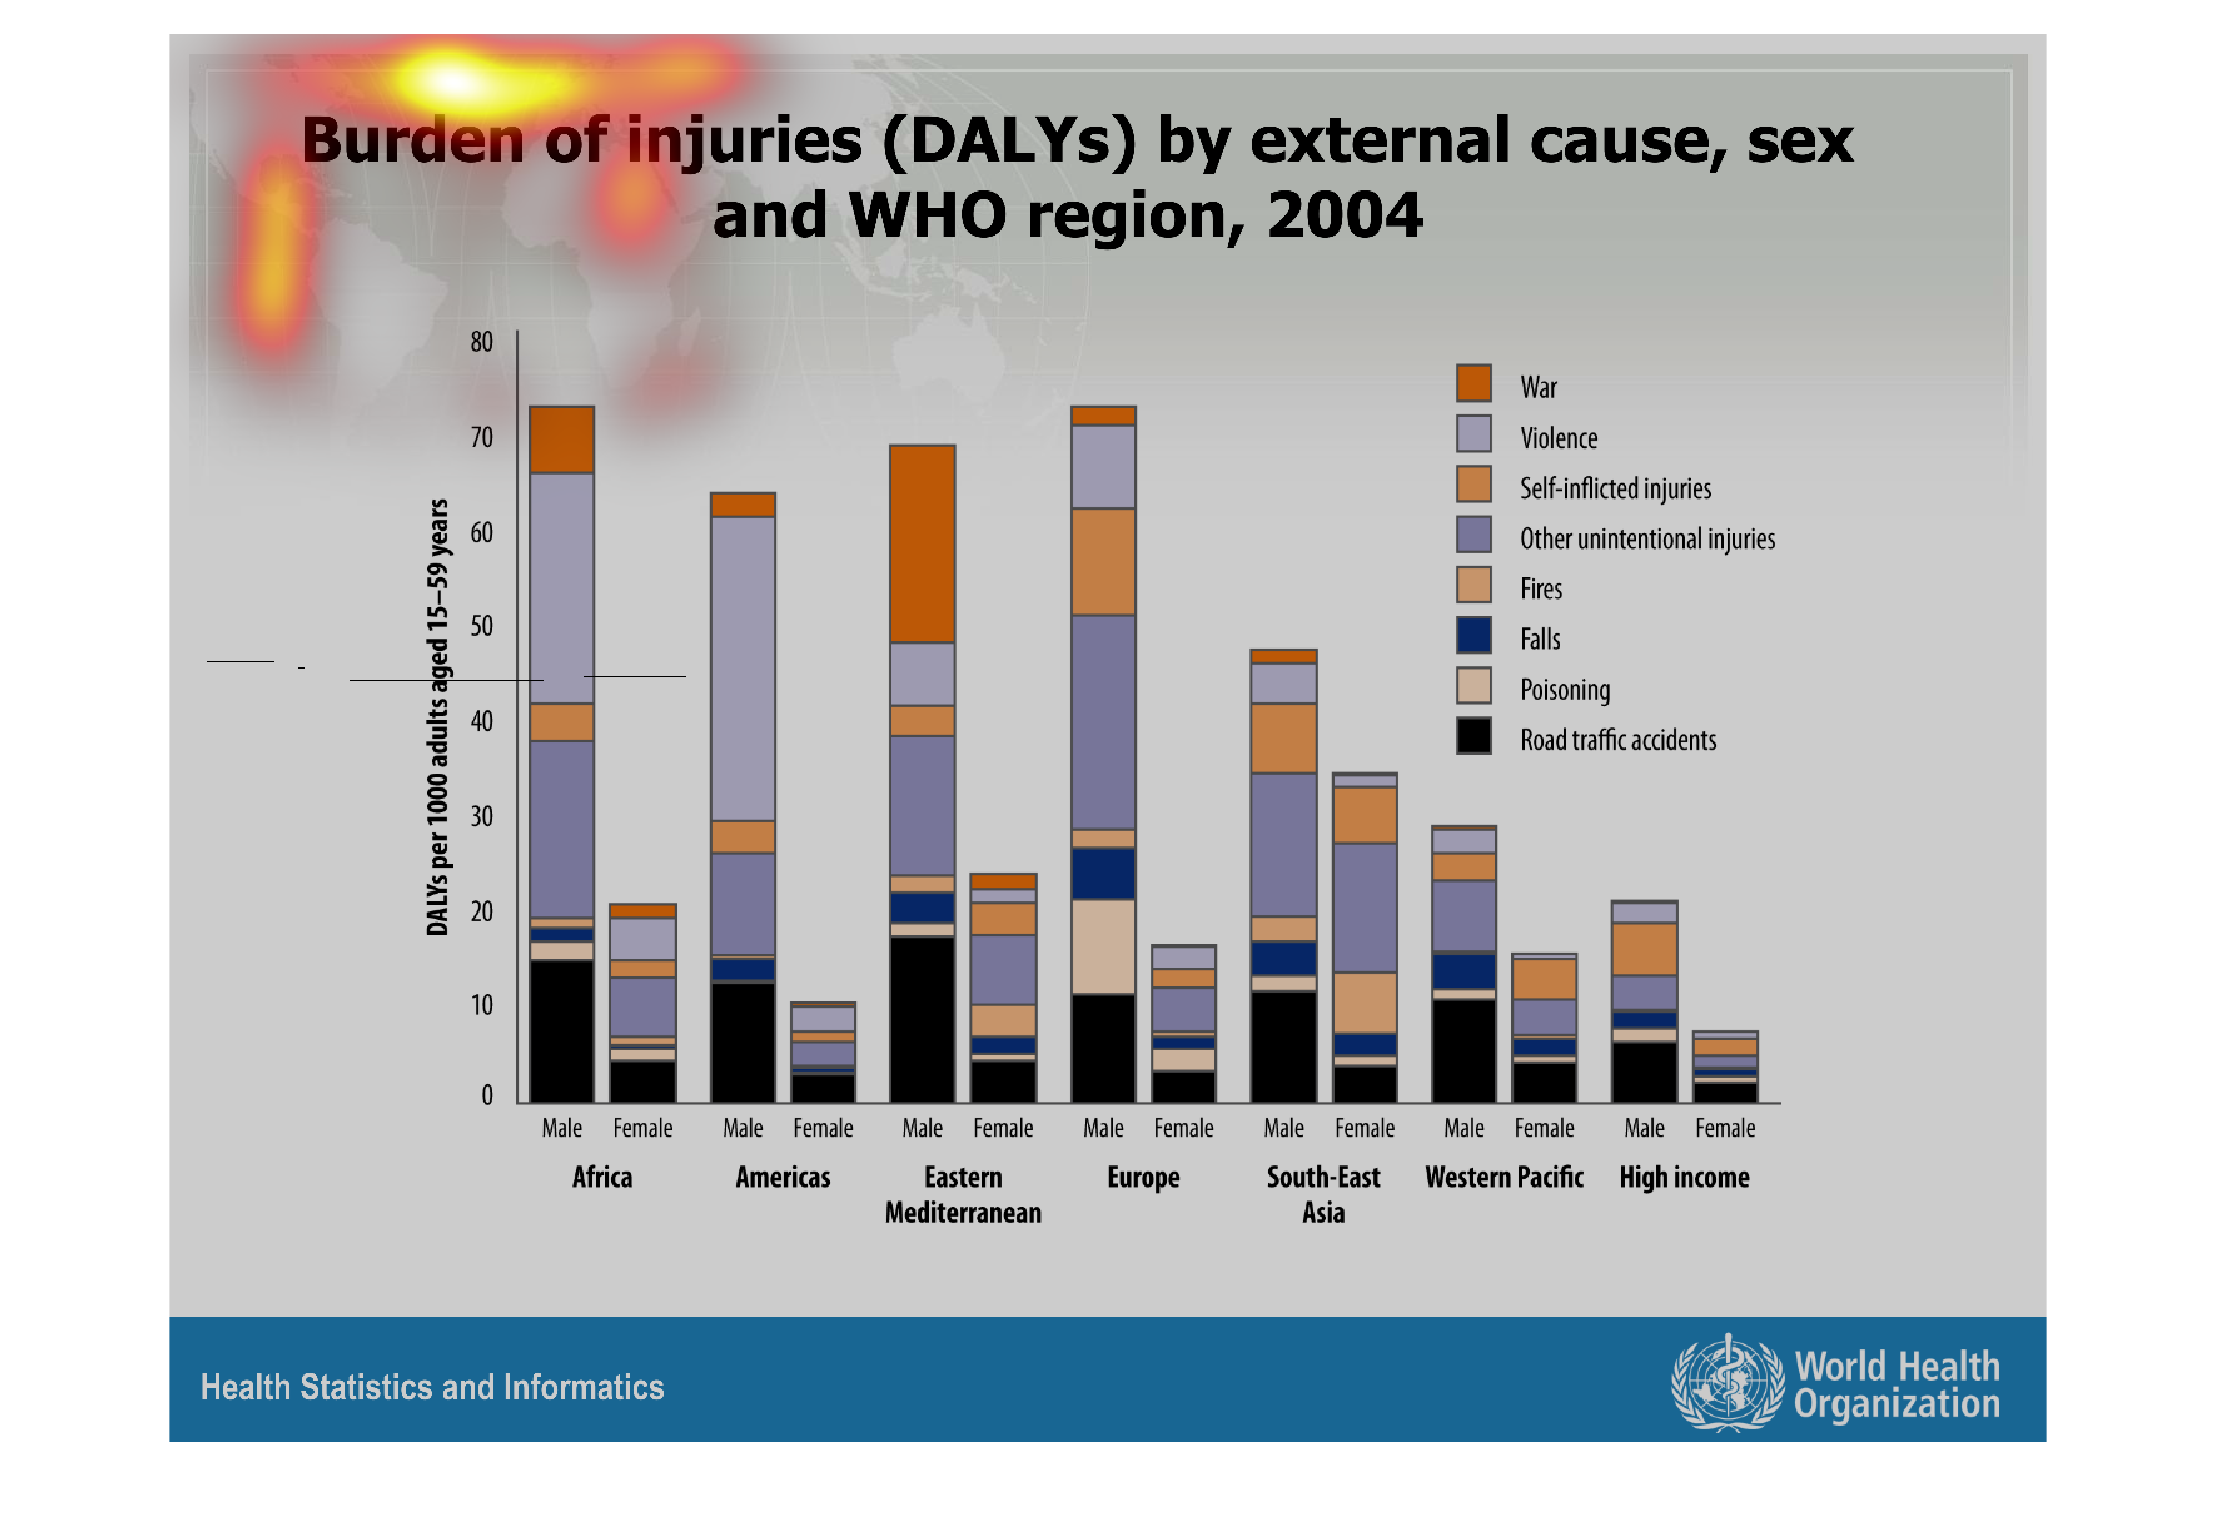
Warning: Image is too big to fit on screen; displaying at 67%
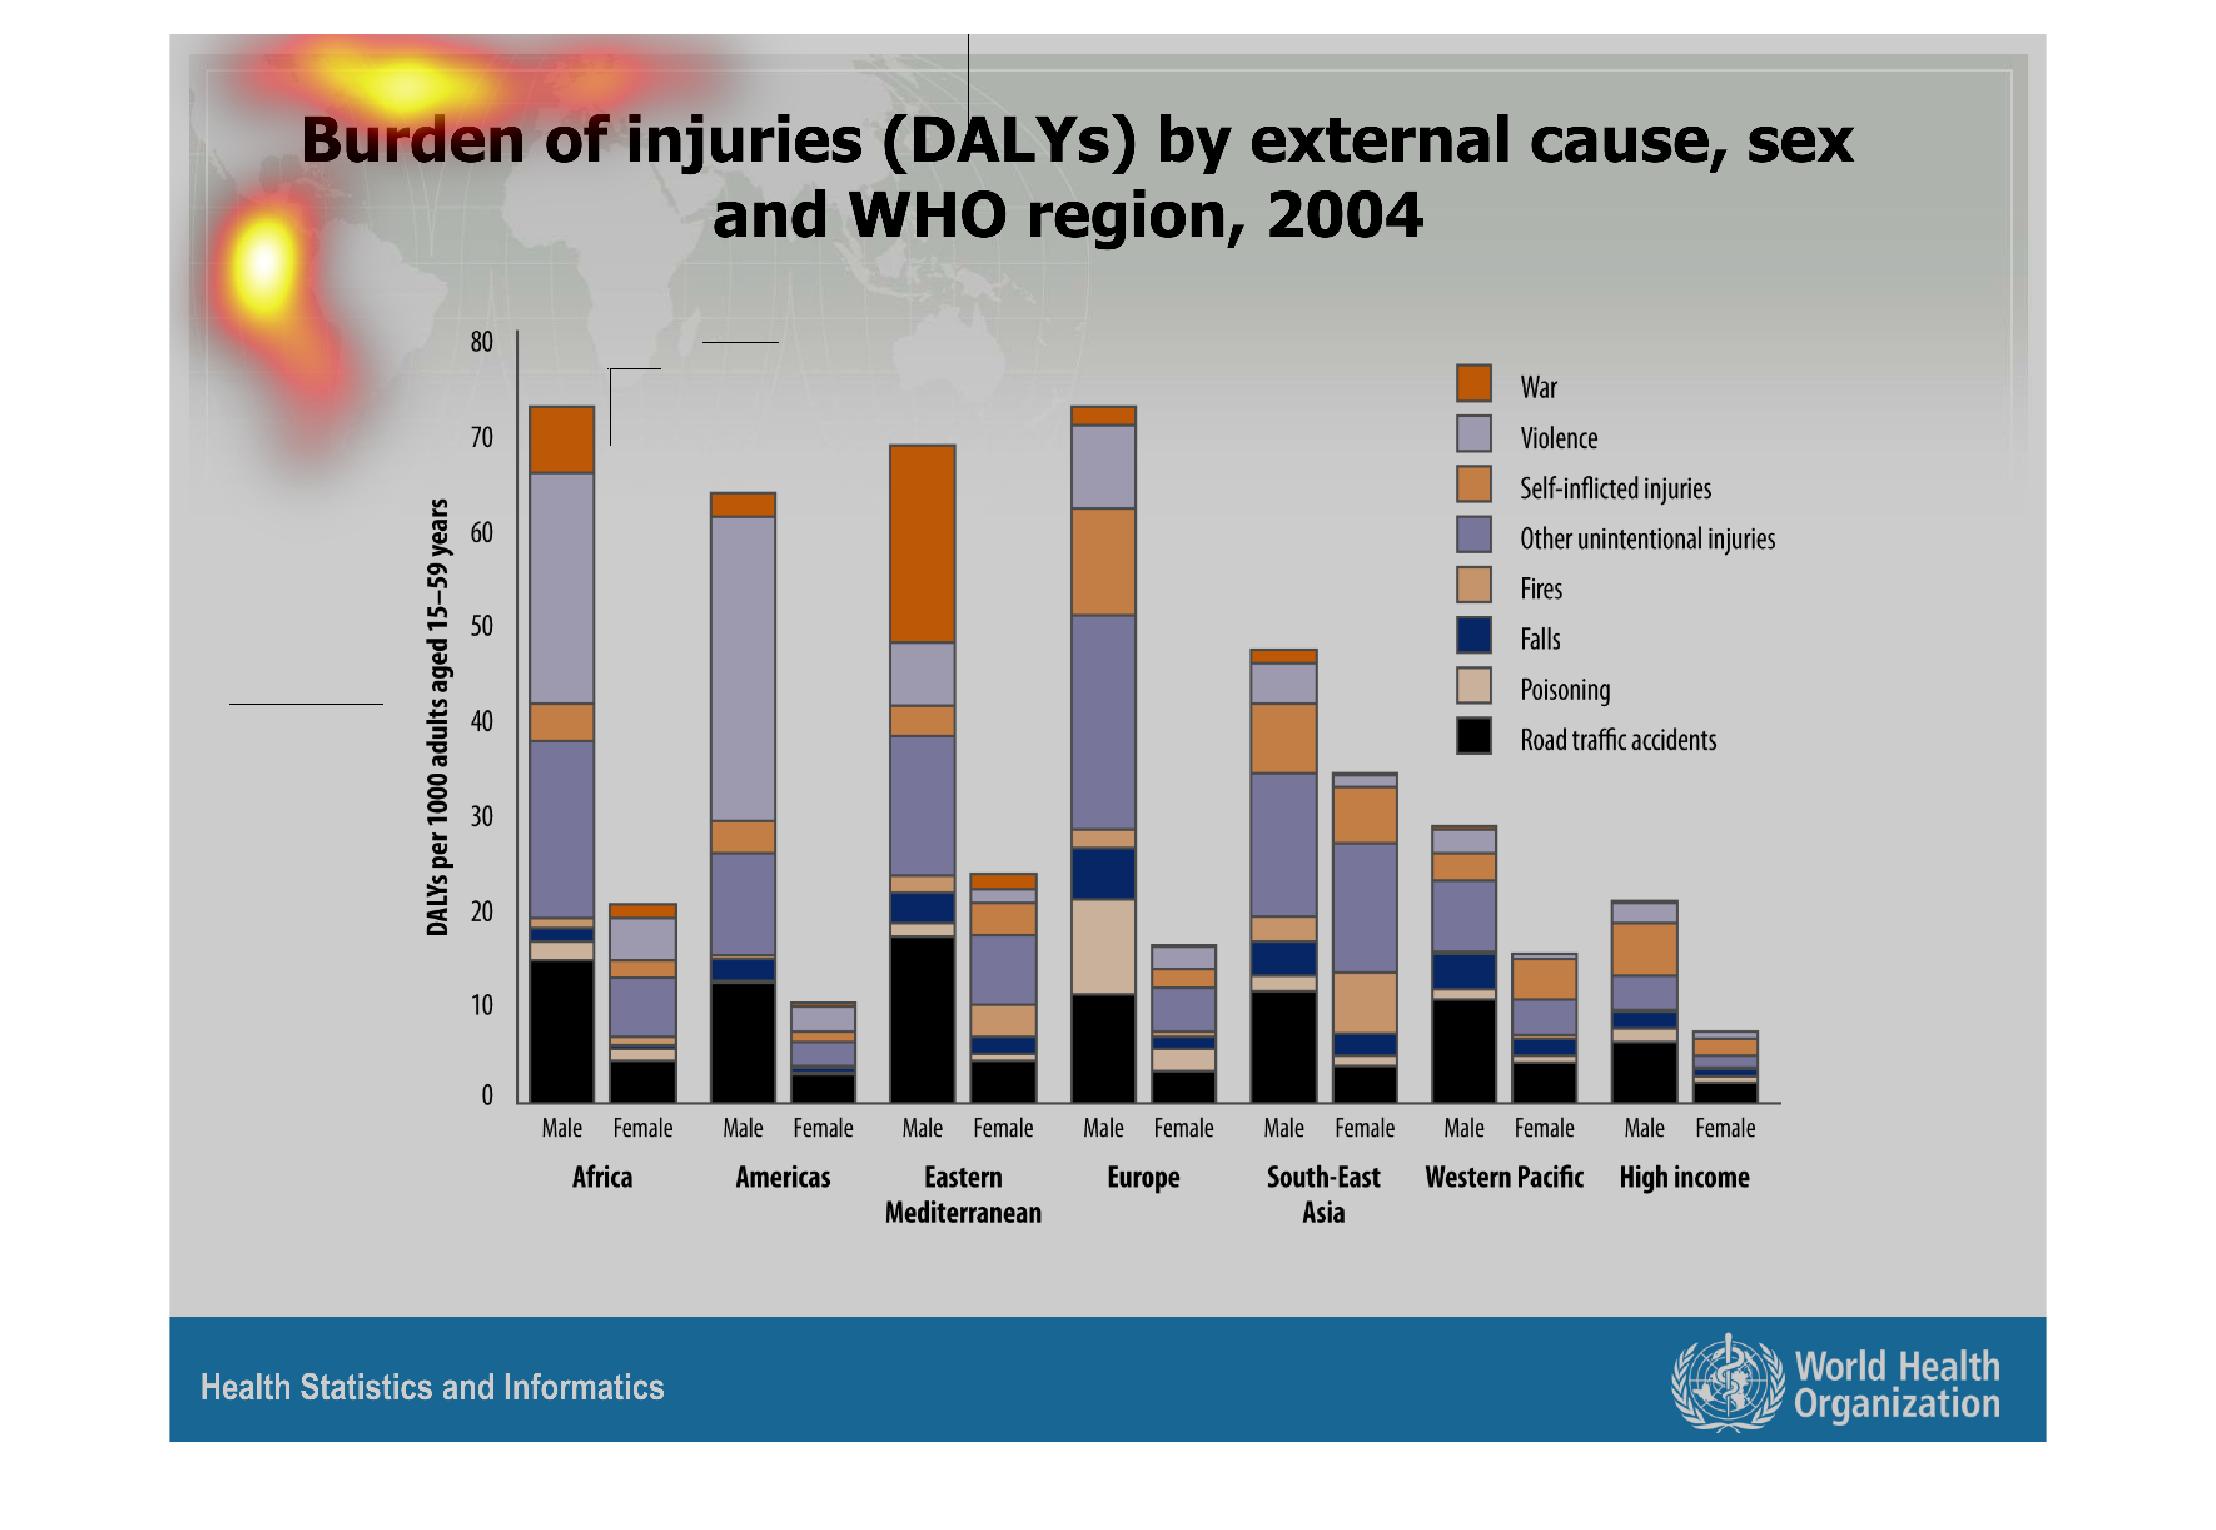
Warning: Image is too big to fit on screen; displaying at 67%
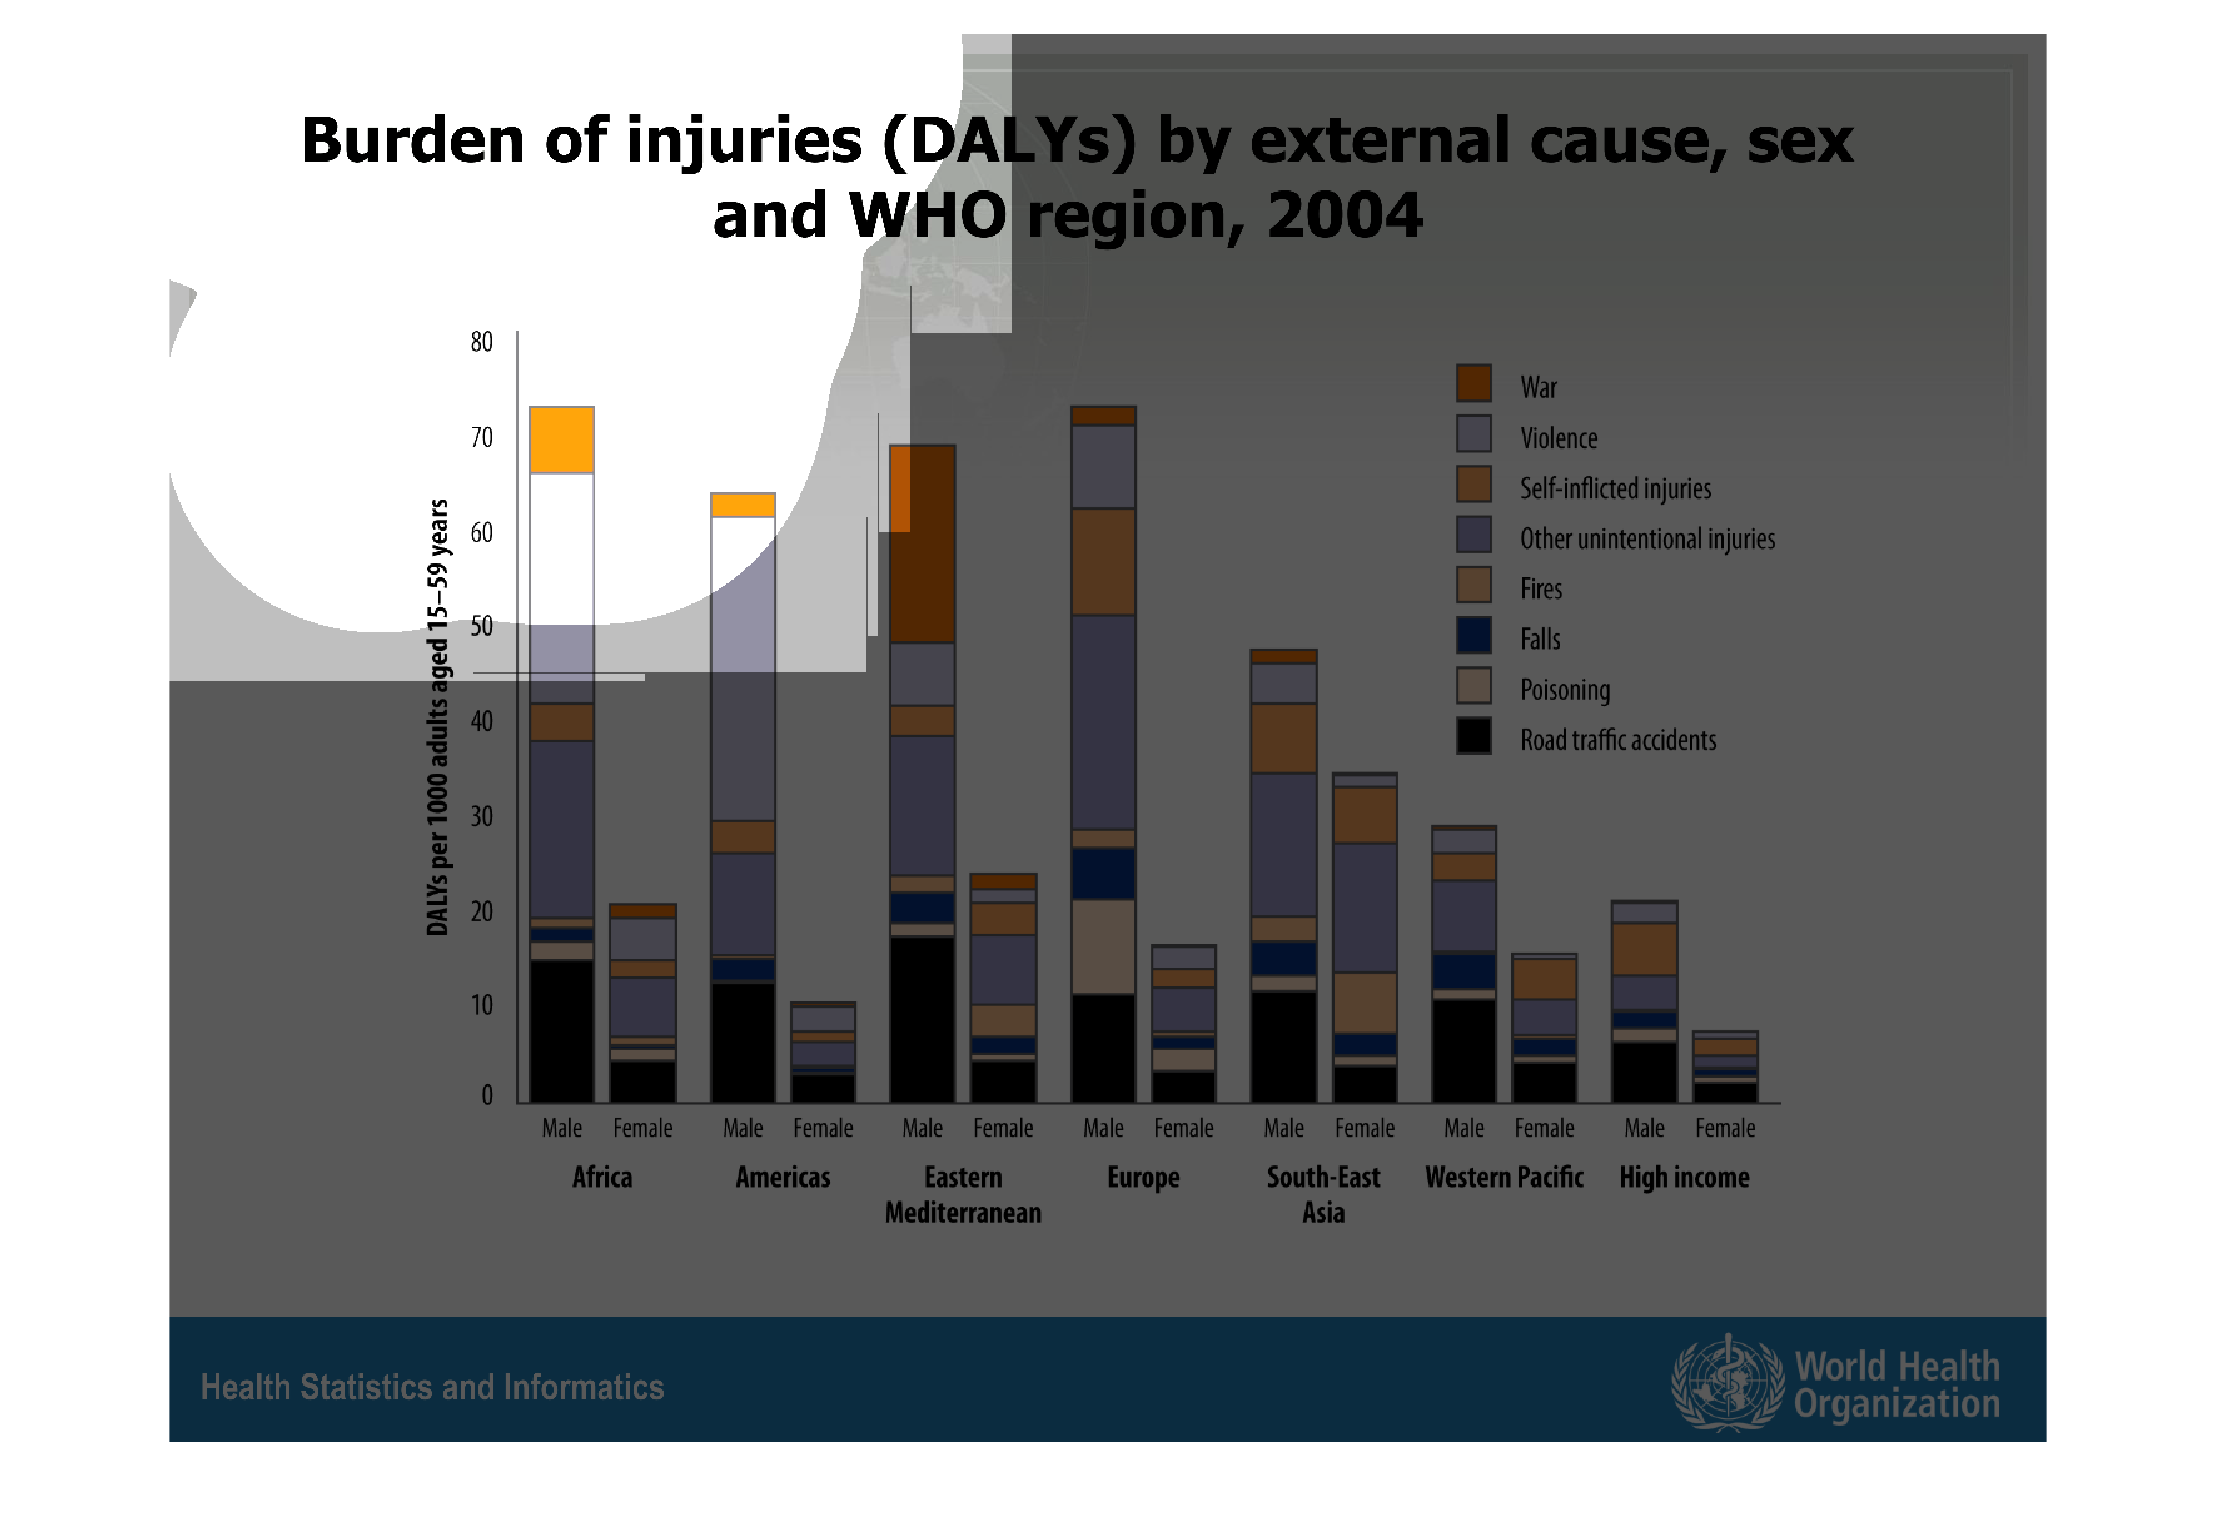
the Highest injuries by external cause, sex is Africa. because Africans they not know about
hygiene than the South East Asia, Western  Pacific and Europe
Warning: Image is too big to fit on screen; displaying at 67%
Warning: Image is too big to fit on screen; displaying at 67%
This handmade chart shows the burden and number of injuries or DALYS. I have no idea what
these terms mean or what it shows. But it looks like the injurie numbers are stable
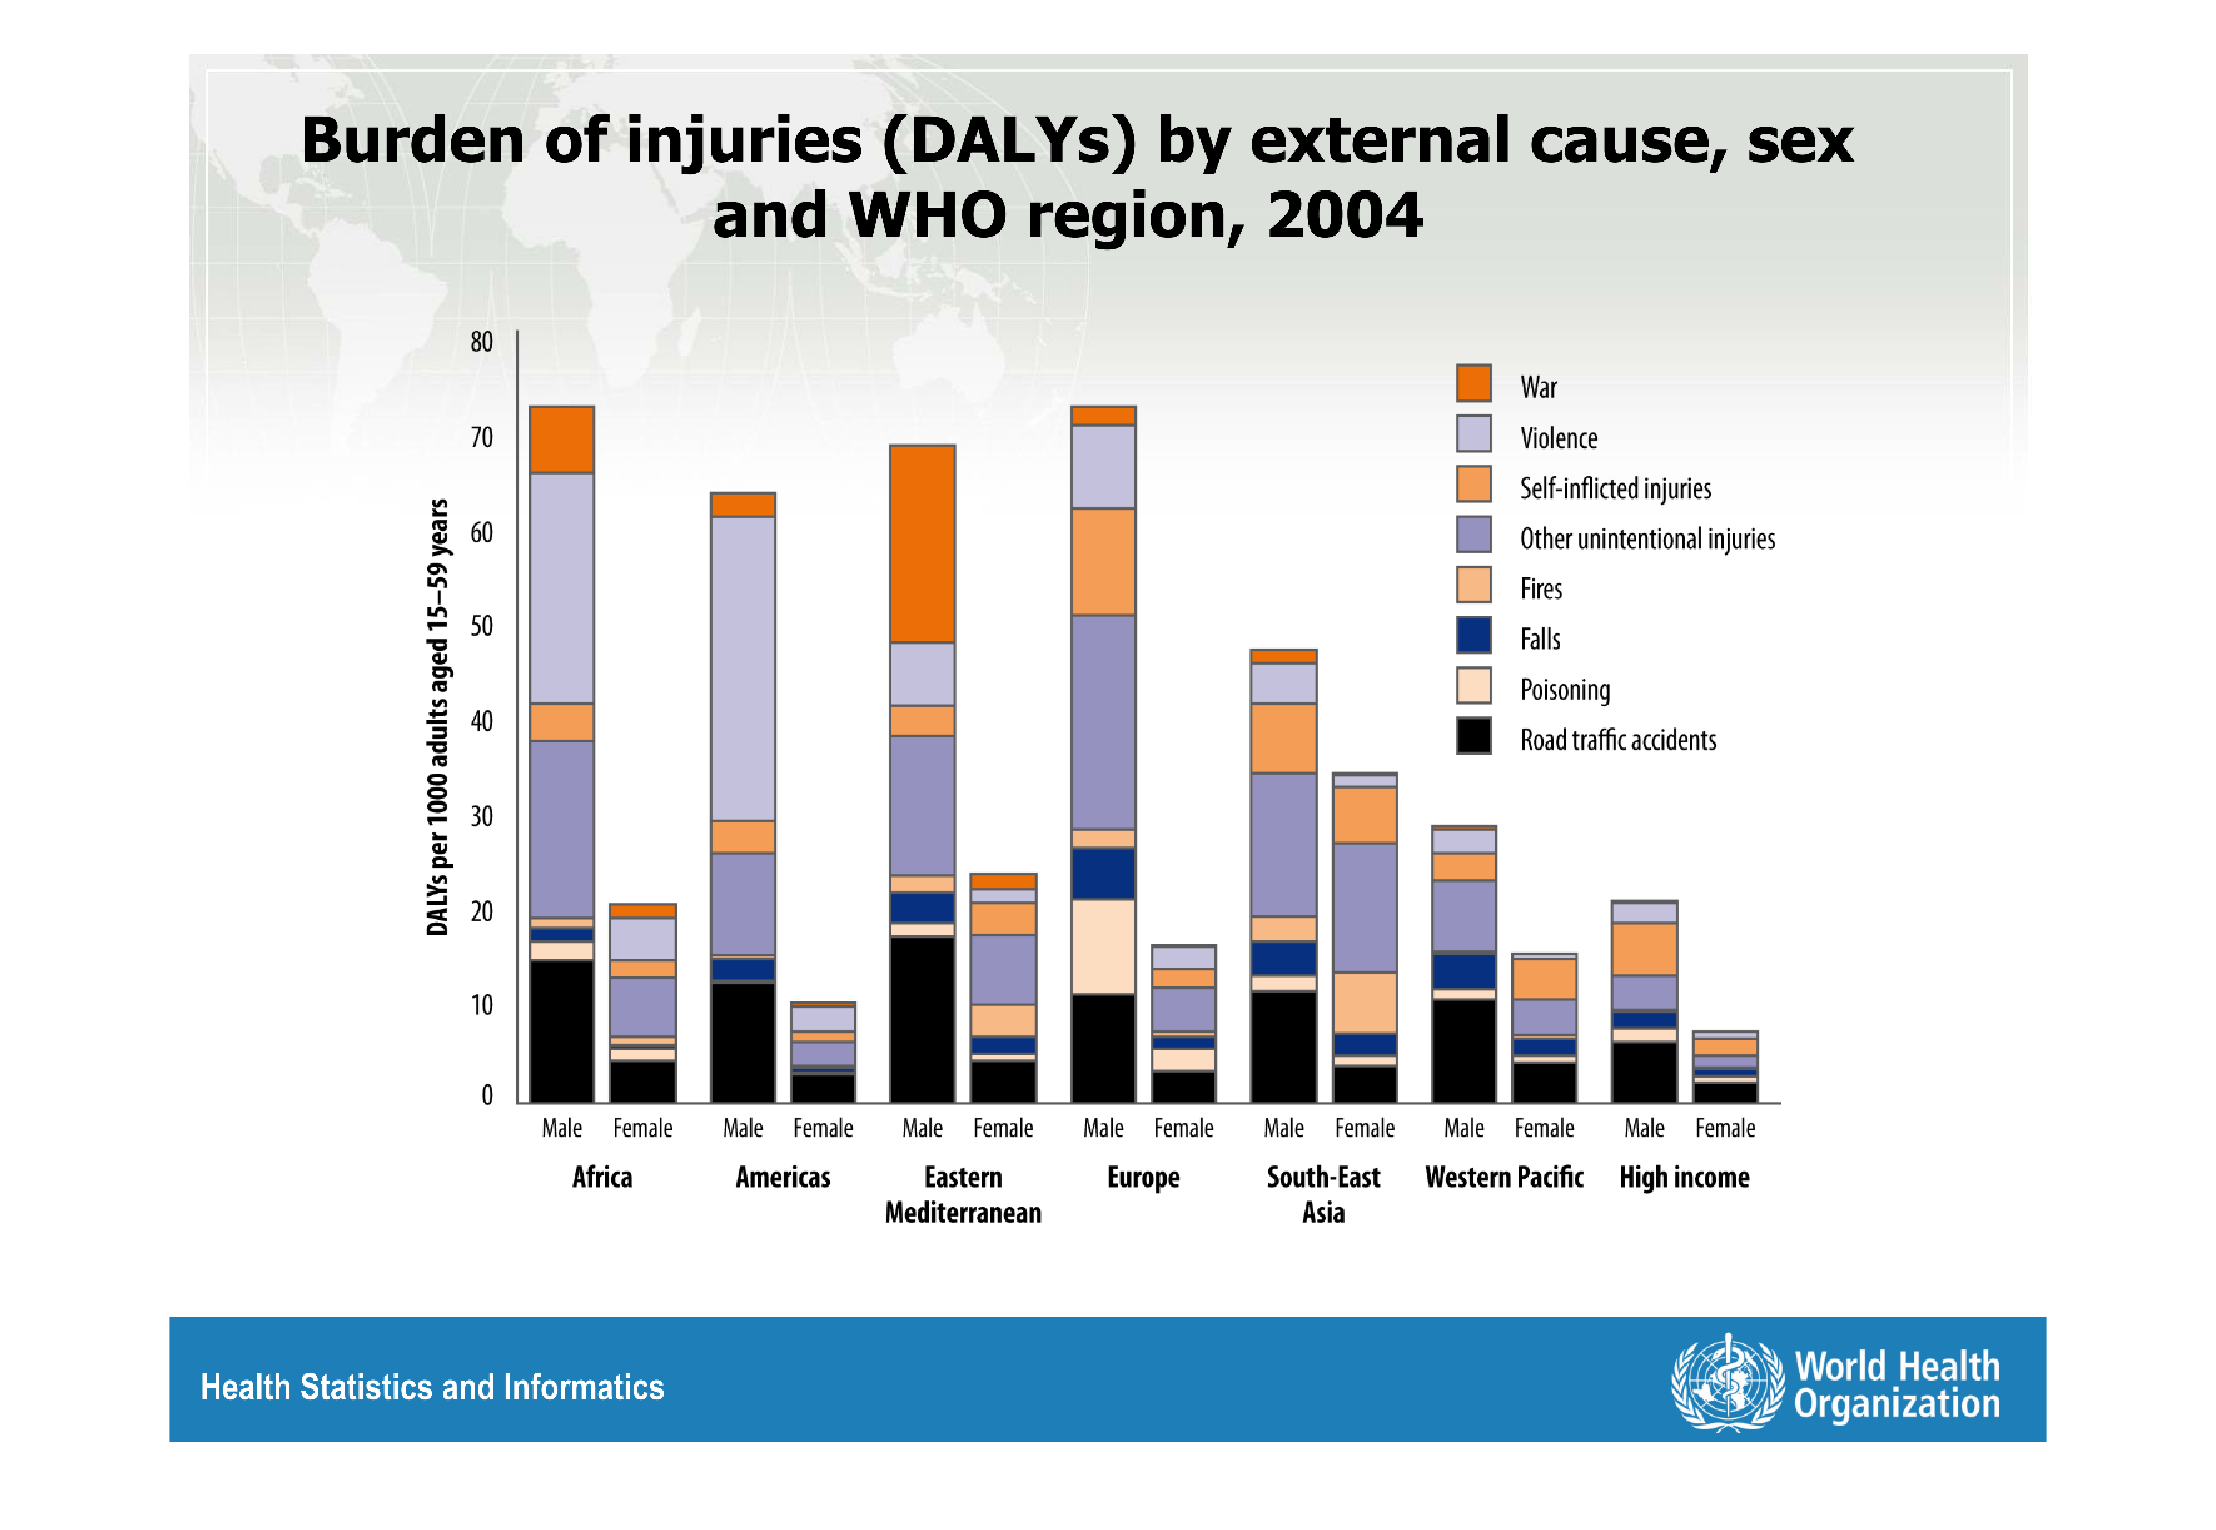
Warning: Image is too big to fit on screen; displaying at 67%
Warning: Image is too big to fit on screen; displaying at 67%
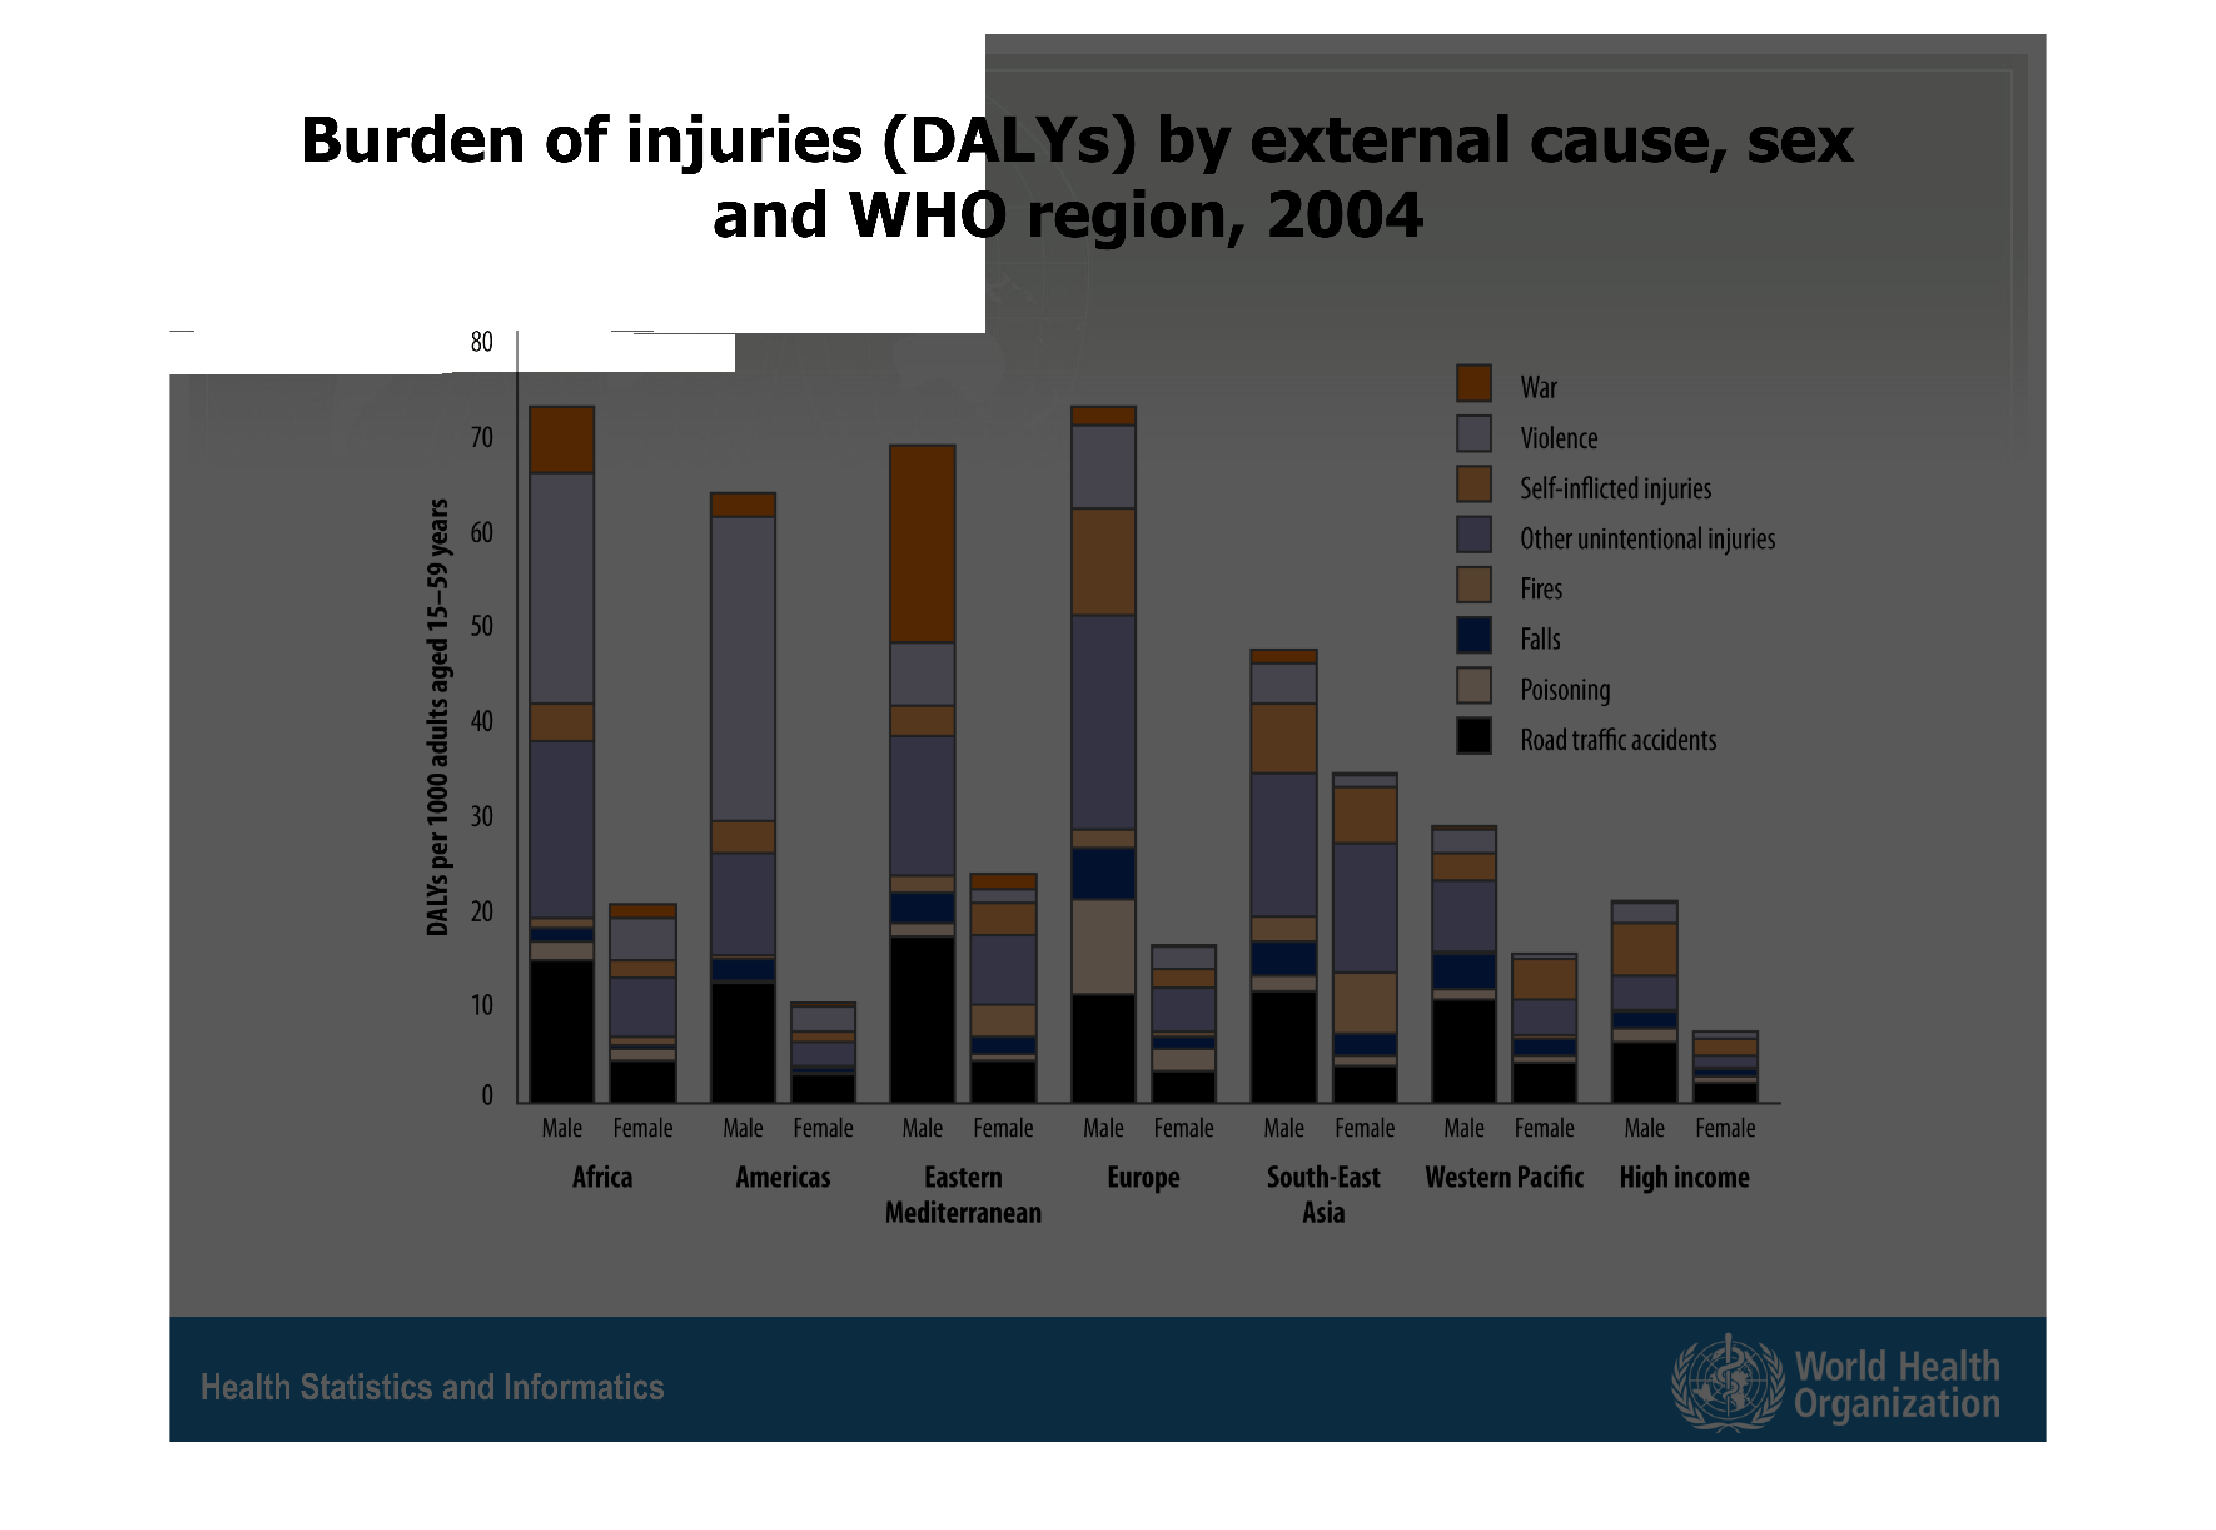
This graph presents information on the burden of injuries by external causes for people of
different sexes and in different regions in the year 2004.
Warning: Image is too big to fit on screen; displaying at 67%
Warning: Image is too big to fit on screen; displaying at 67%

This chart shows the burden of injuries by external cause, sex, and WHO regions, from 2004.
It is a series of male and female sorted vertical bars, color coded by each factor vertically.
Warning: Image is too big to fit on screen; displaying at 67%
Warning: Image is too big to fit on screen; displaying at 67%
This image describes the type of injuries sustained by people, divided by gender and region.
It looks like in general men are injured more than women.
Warning: Image is too big to fit on screen; displaying at 67%
Warning: Image is too big to fit on screen; displaying at 67%
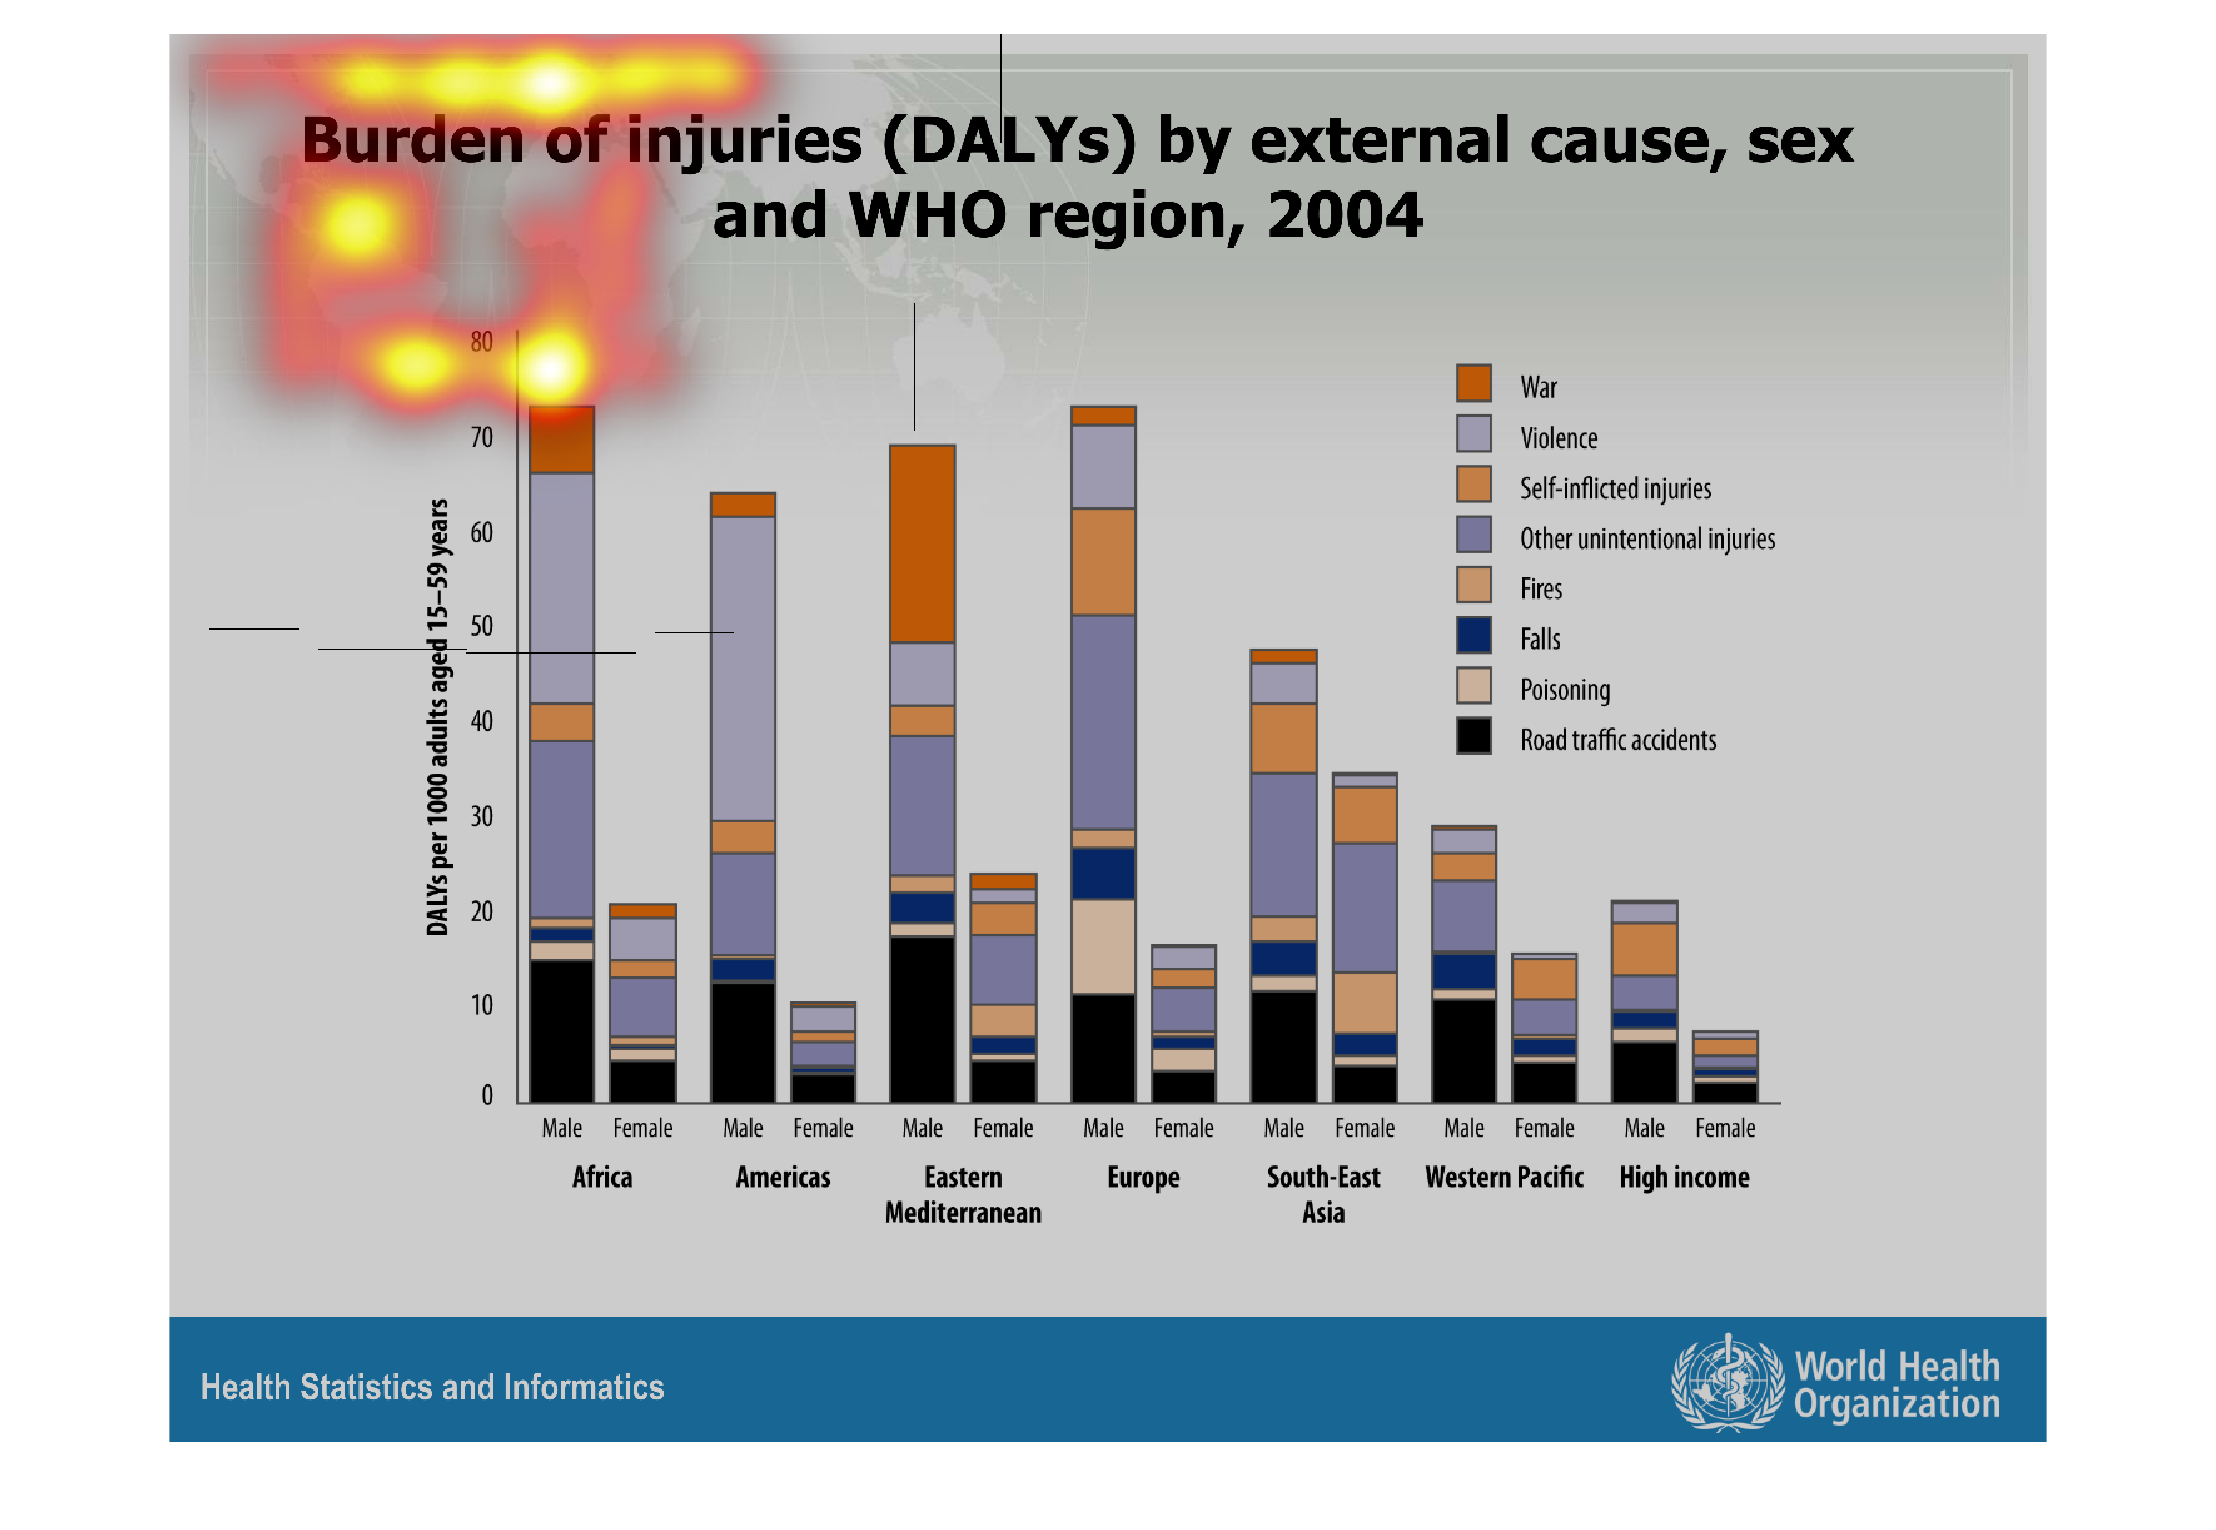
The title of the chart is Burden of injuries(Dalys) by external cause, sex, and WHO region,
2004.  It tracks War, Violence, self-inflicted, other unintended injuries , Fires, Falls,
Poisoning, road traffic accidents.  The far right shows a breakdown of high income injuries,
and it is significantly lower that the other graphs that show Africa, America, Europe and
parts of Asia.  Eastern Mediterranean seems to have a high rate of injuries of males compared
to the other areas of focus.  Africa seems to higher rate of injuries by other unintentional.
The graph shows that males have a higher rate of injuries than women, by a high margin.
Warning: Image is too big to fit on screen; displaying at 67%
Warning: Image is too big to fit on screen; displaying at 67%
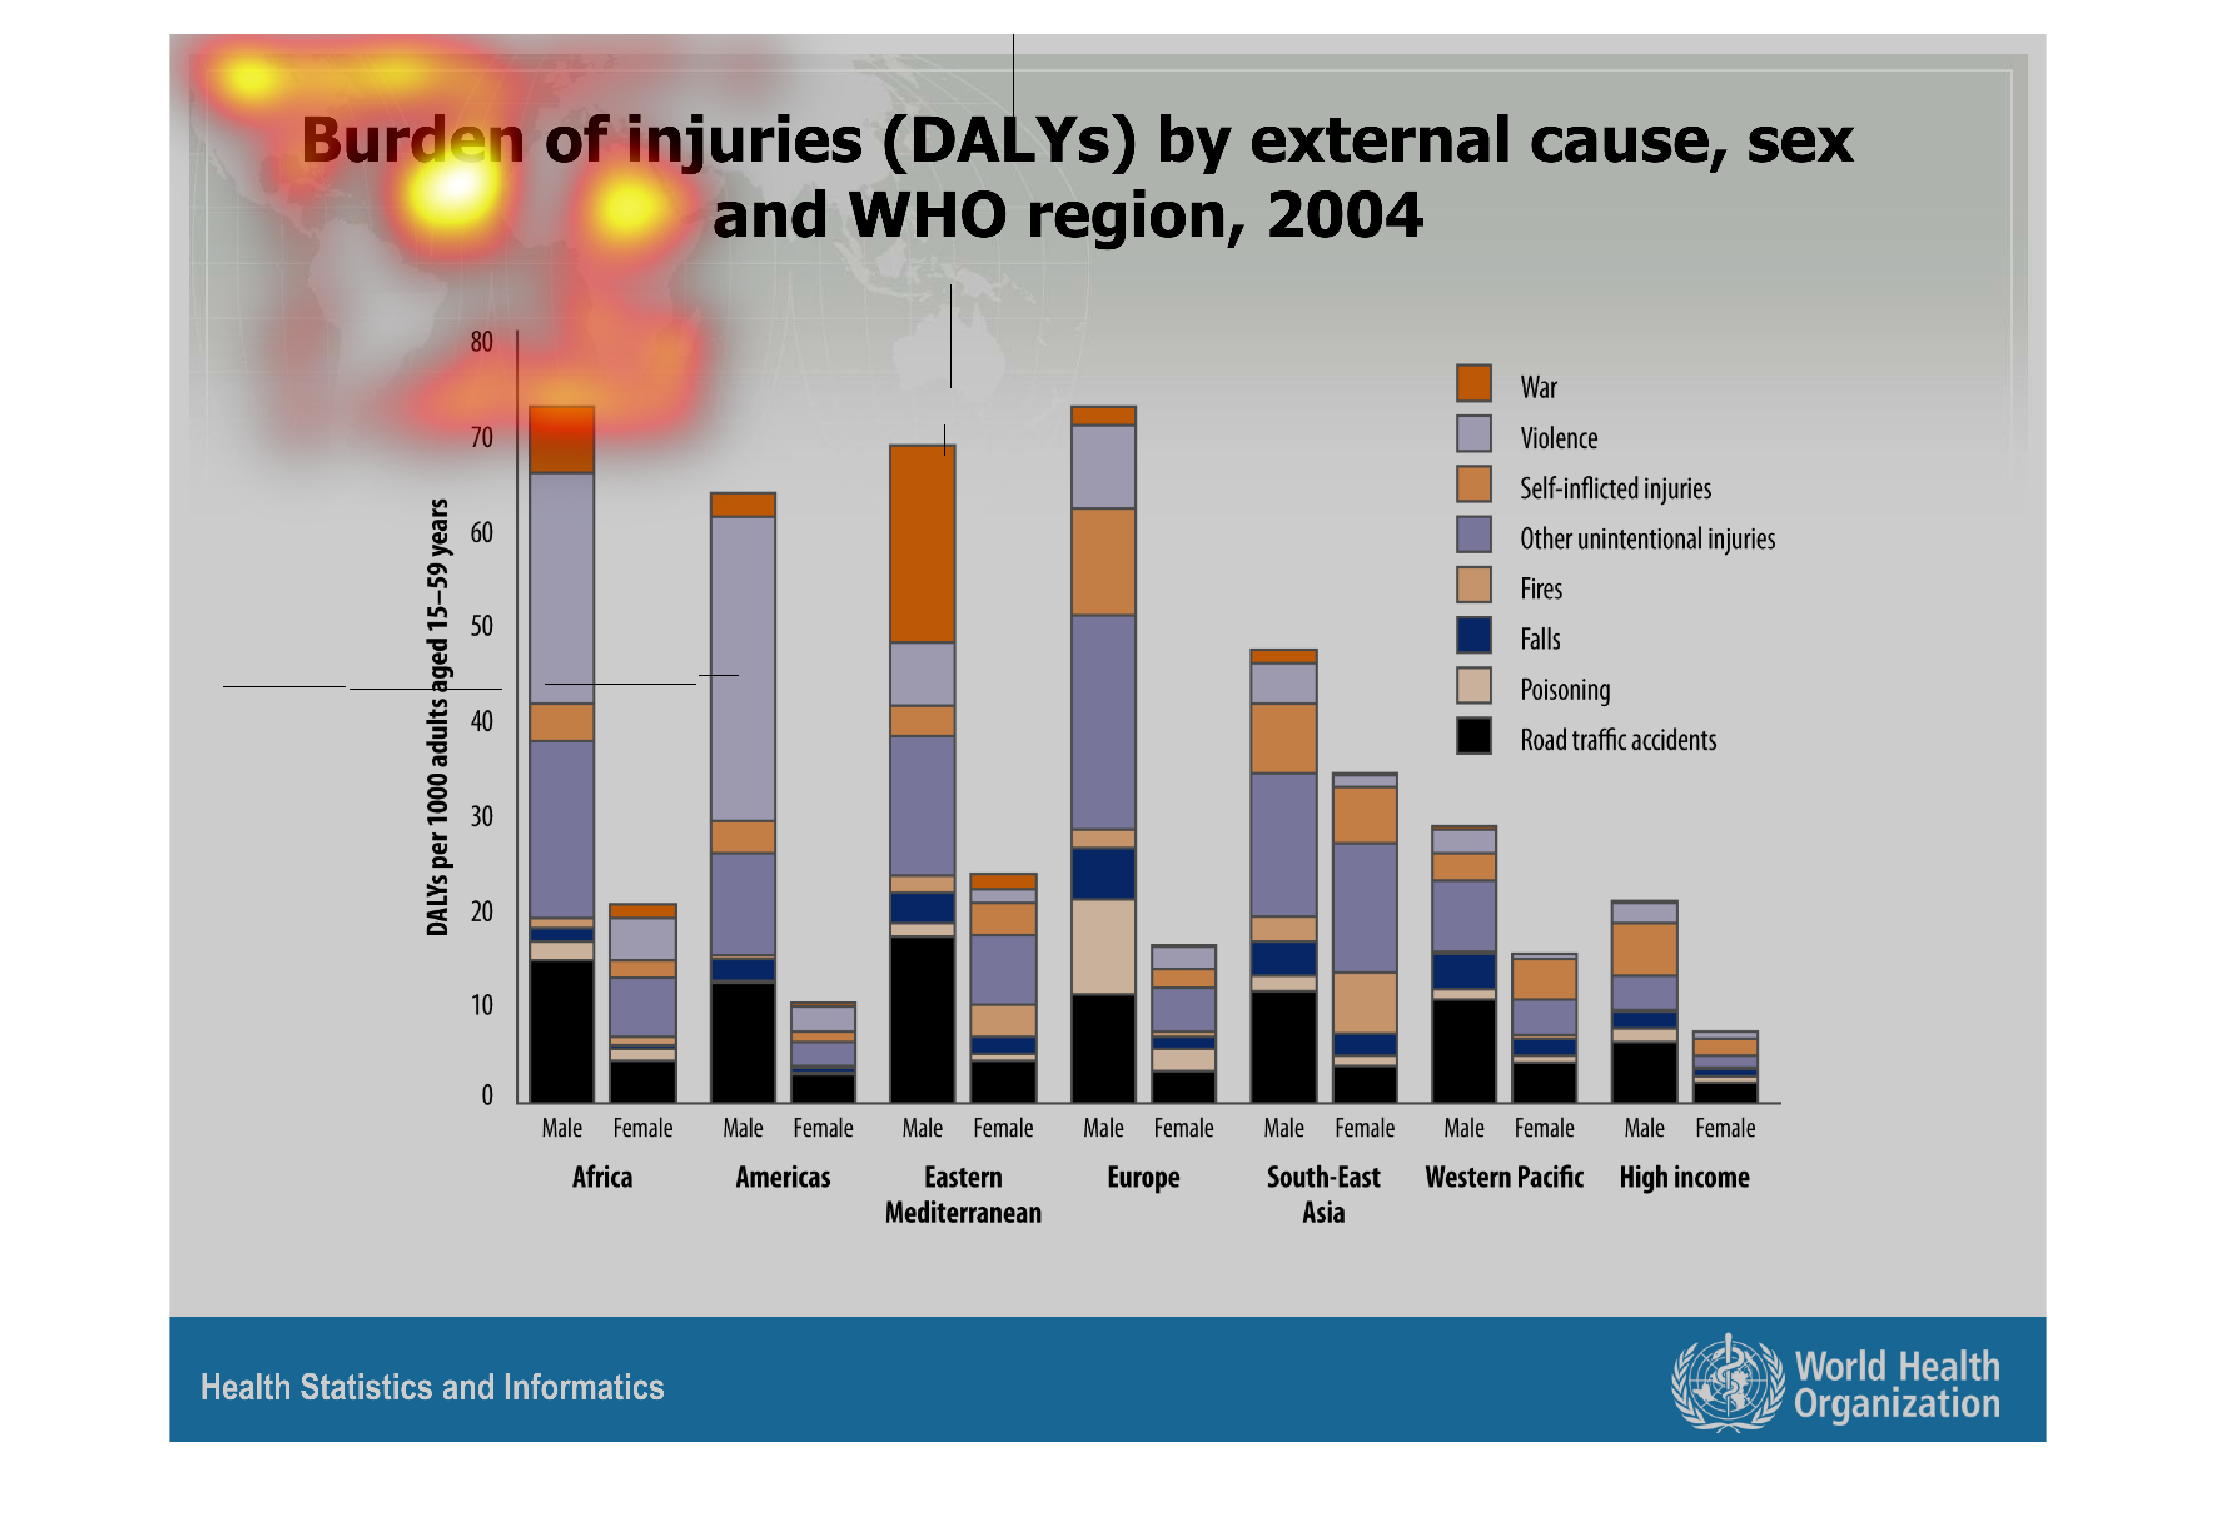
The figure presented is titled Burden of injuries (DALYs) by external cause, sex and WHO region,
2004.  The figure is a representation of the burden of injuries.
Warning: Image is too big to fit on screen; displaying at 67%
Warning: Image is too big to fit on screen; displaying at 67%
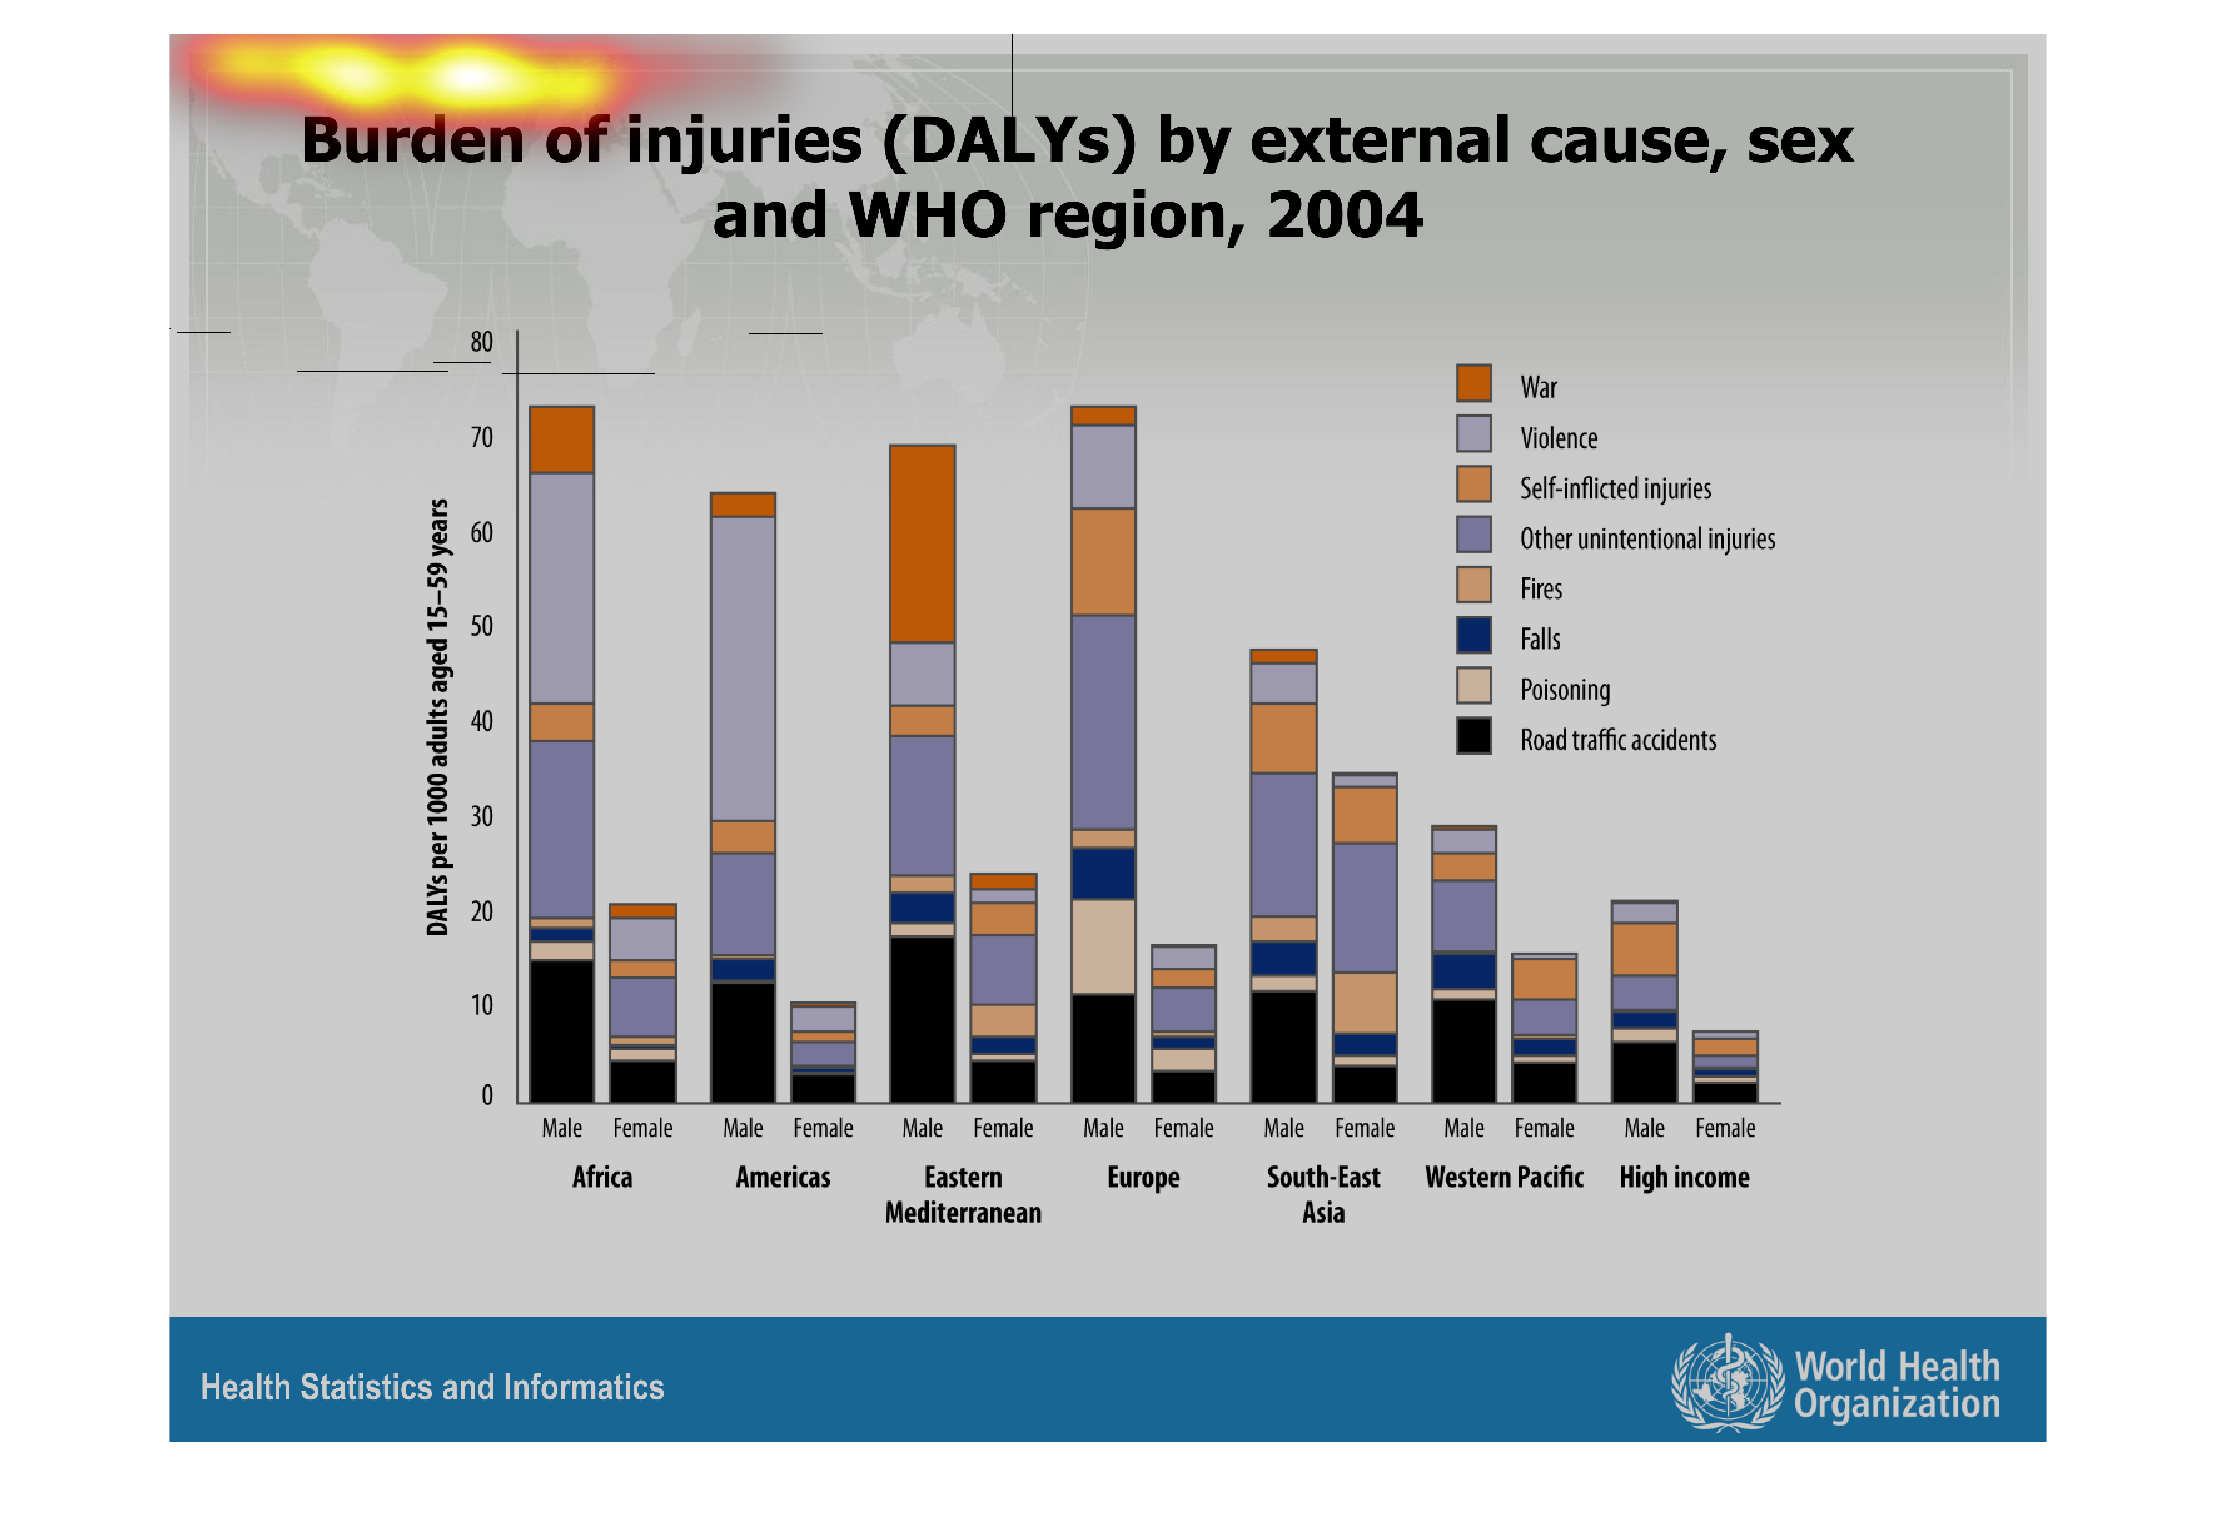
This chart shows daily injuries caused by external factors such as war, violence, fires etc..
throughout the world. It reveals data on both males and females ages 15- 59 years old .
Warning: Image is too big to fit on screen; displaying at 67%
Warning: Image is too big to fit on screen; displaying at 67%

The bar graphs show burden of injuries (DALYs) by external cause, sex, and WHO region, 2004.
On y axis is the number of DALYs per  1000 adults aged 15-59 years
Warning: Image is too big to fit on screen; displaying at 67%
Warning: Image is too big to fit on screen; displaying at 67%
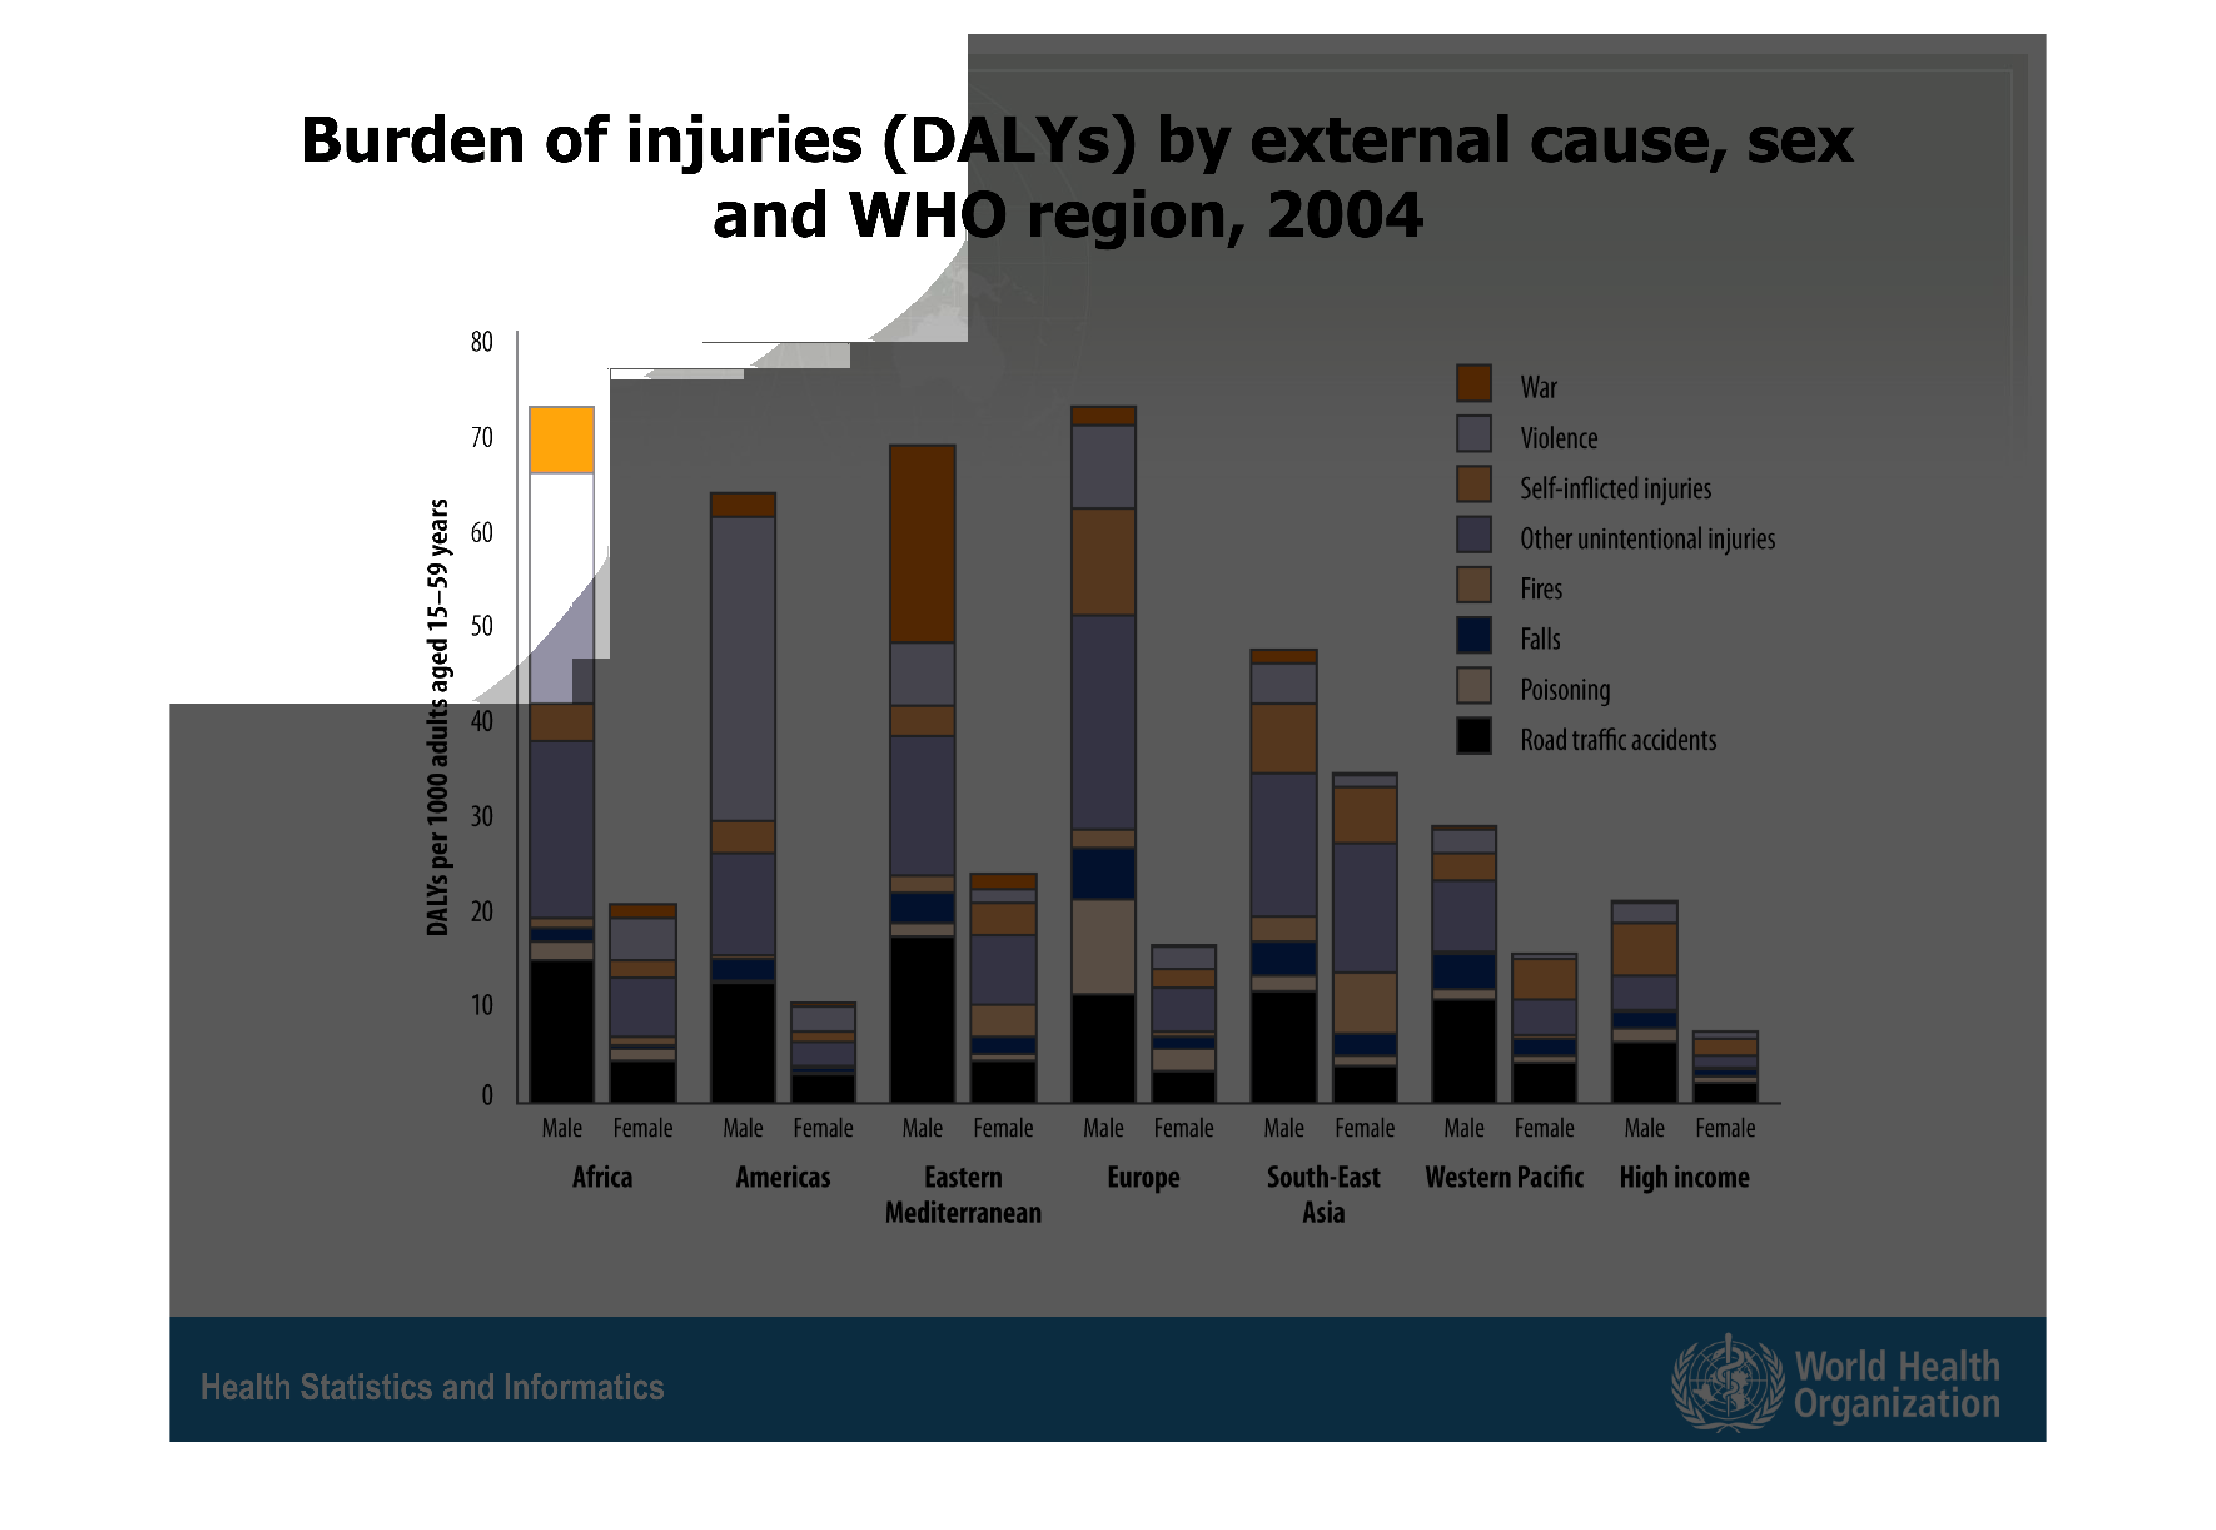
This bar graph shows the burden that certain types of injuries place on different continents
across the globe. The data is divided up by sex and according to the type of injury that was
received, either from war, self-inflicted or other type.  Those with high income are also
charted.
Warning: Image is too big to fit on screen; displaying at 67%
Warning: Image is too big to fit on screen; displaying at 67%
This graph shows that Burden of injuries by external cause, sex and WHO region in 2004. With
Males in Europe being the highest but American males being the most violent. High Income being
the lowest with both female and male.
Warning: Image is too big to fit on screen; displaying at 67%
Warning: Image is too big to fit on screen; displaying at 67%
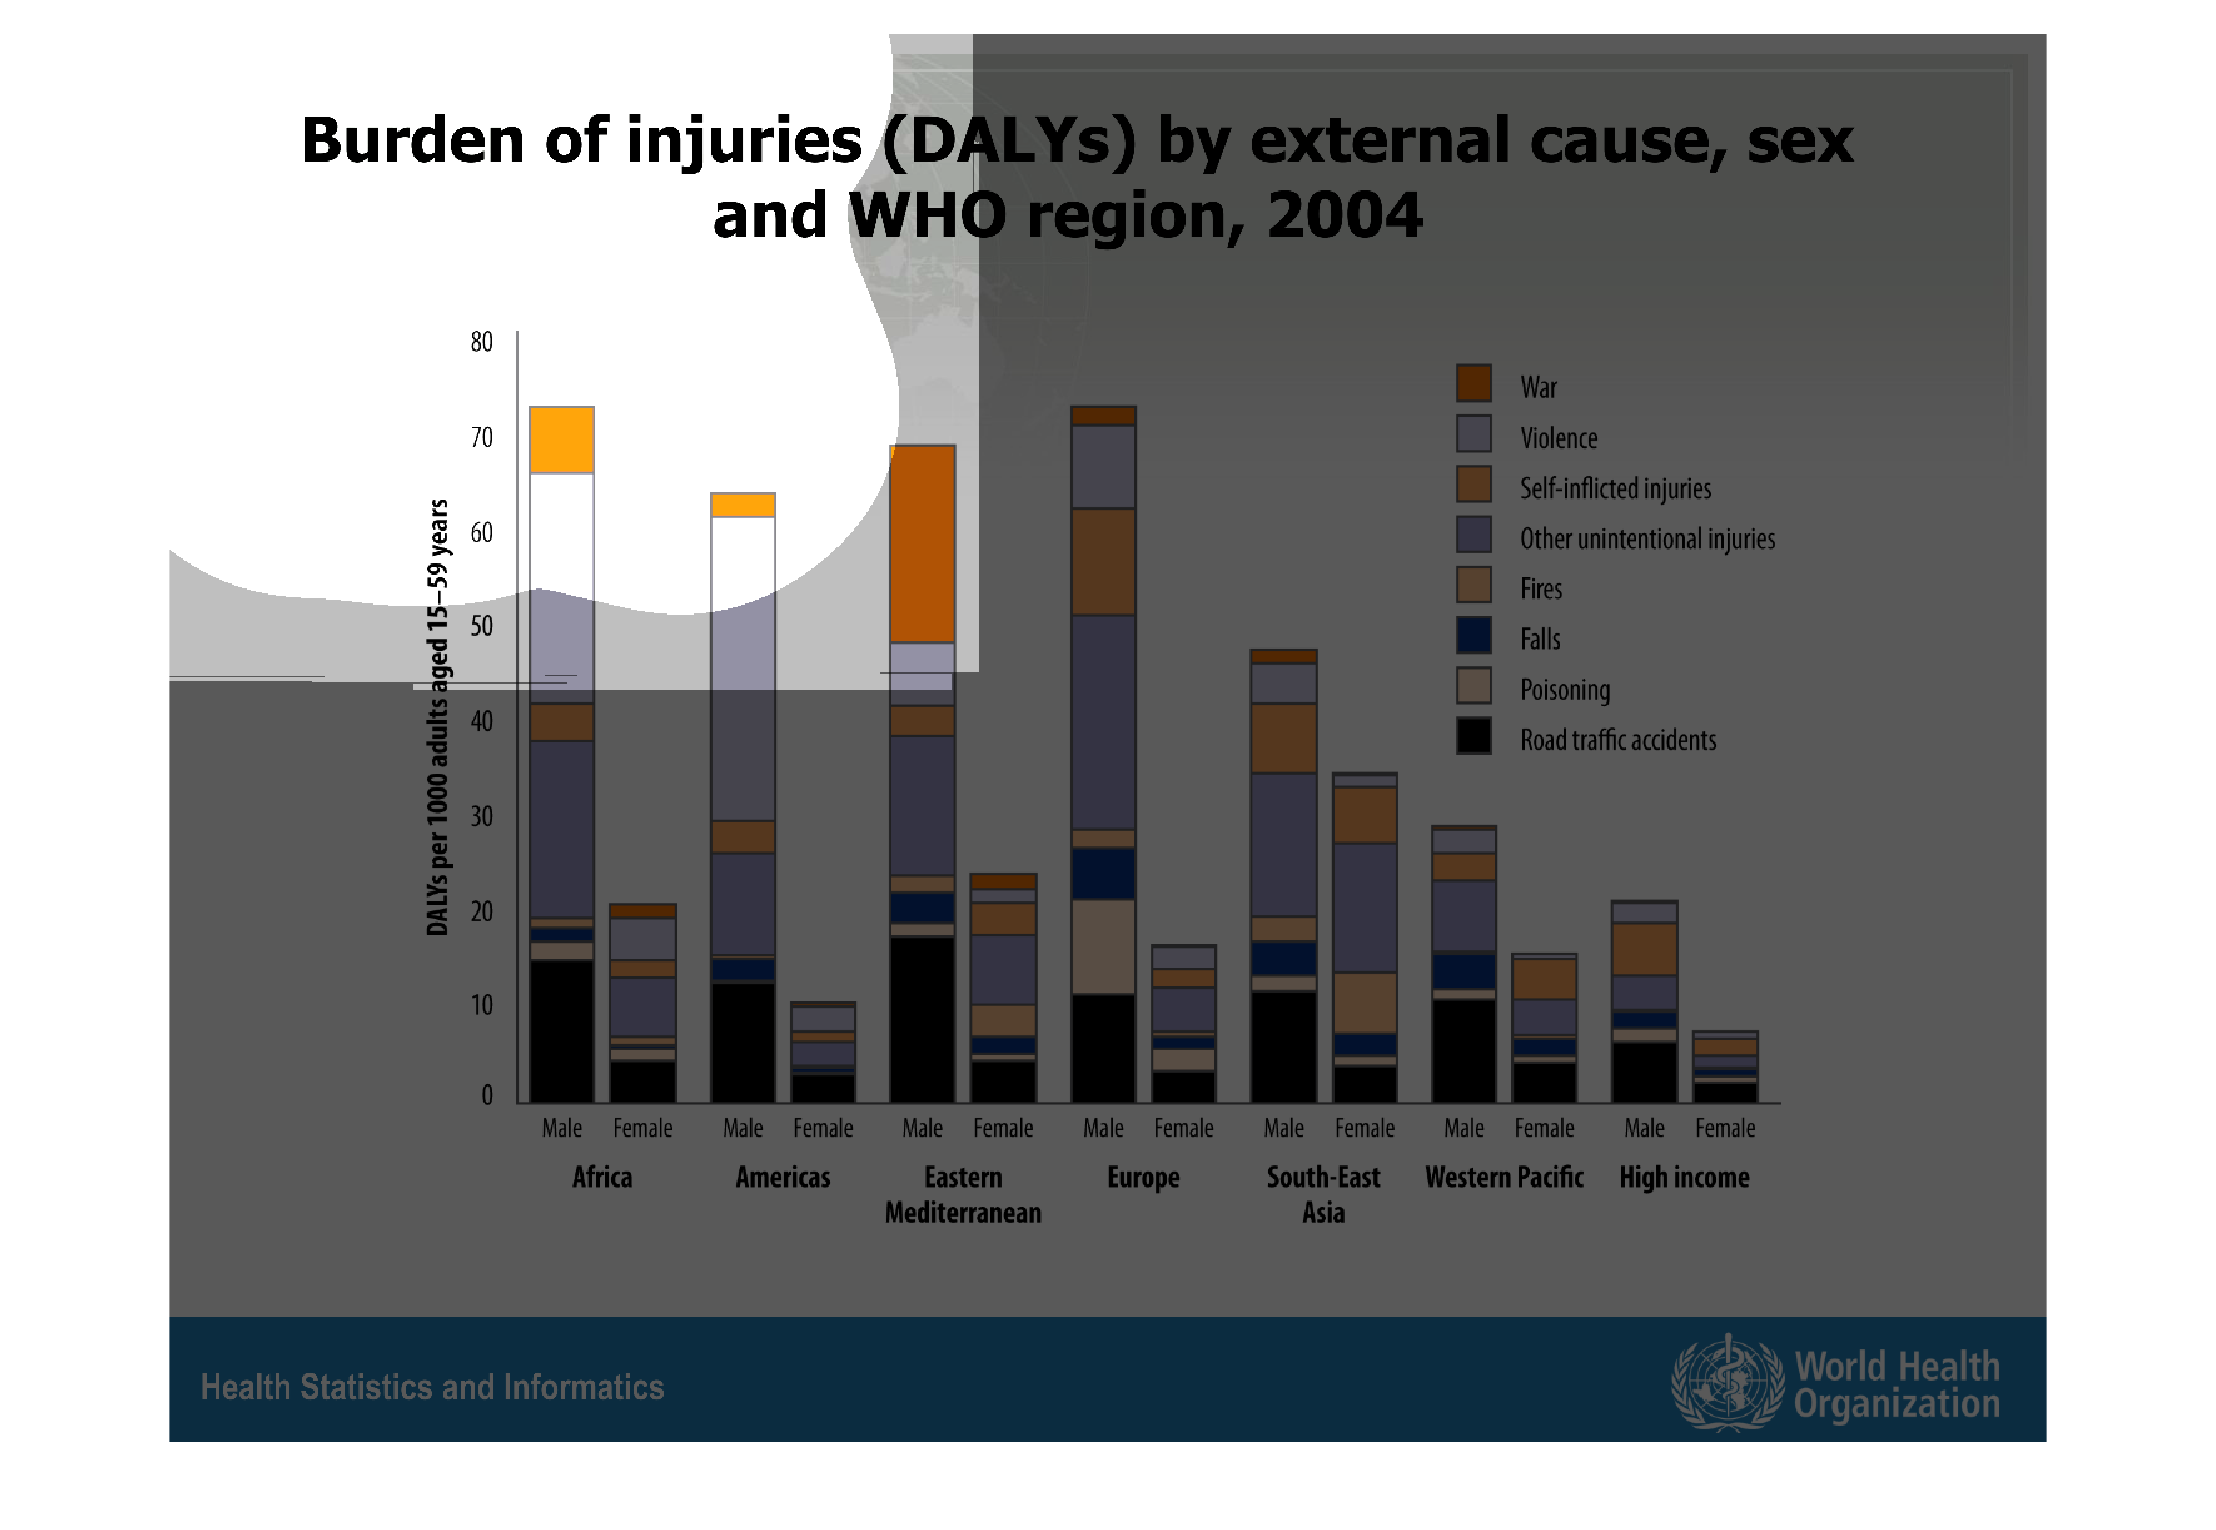
This graph shows injury DALYs, sorted by sex and region. Accidental and deliberate deaths
were higher overall for men, with some of the highest suicide and accident rates in Africa,
Europe and Eastern Europe and the Western Pacific. Low rates occurred among women in the Western
Pacific region, and among both women and men in high-income societies.
Warning: Image is too big to fit on screen; displaying at 67%
Warning: Image is too big to fit on screen; displaying at 67%
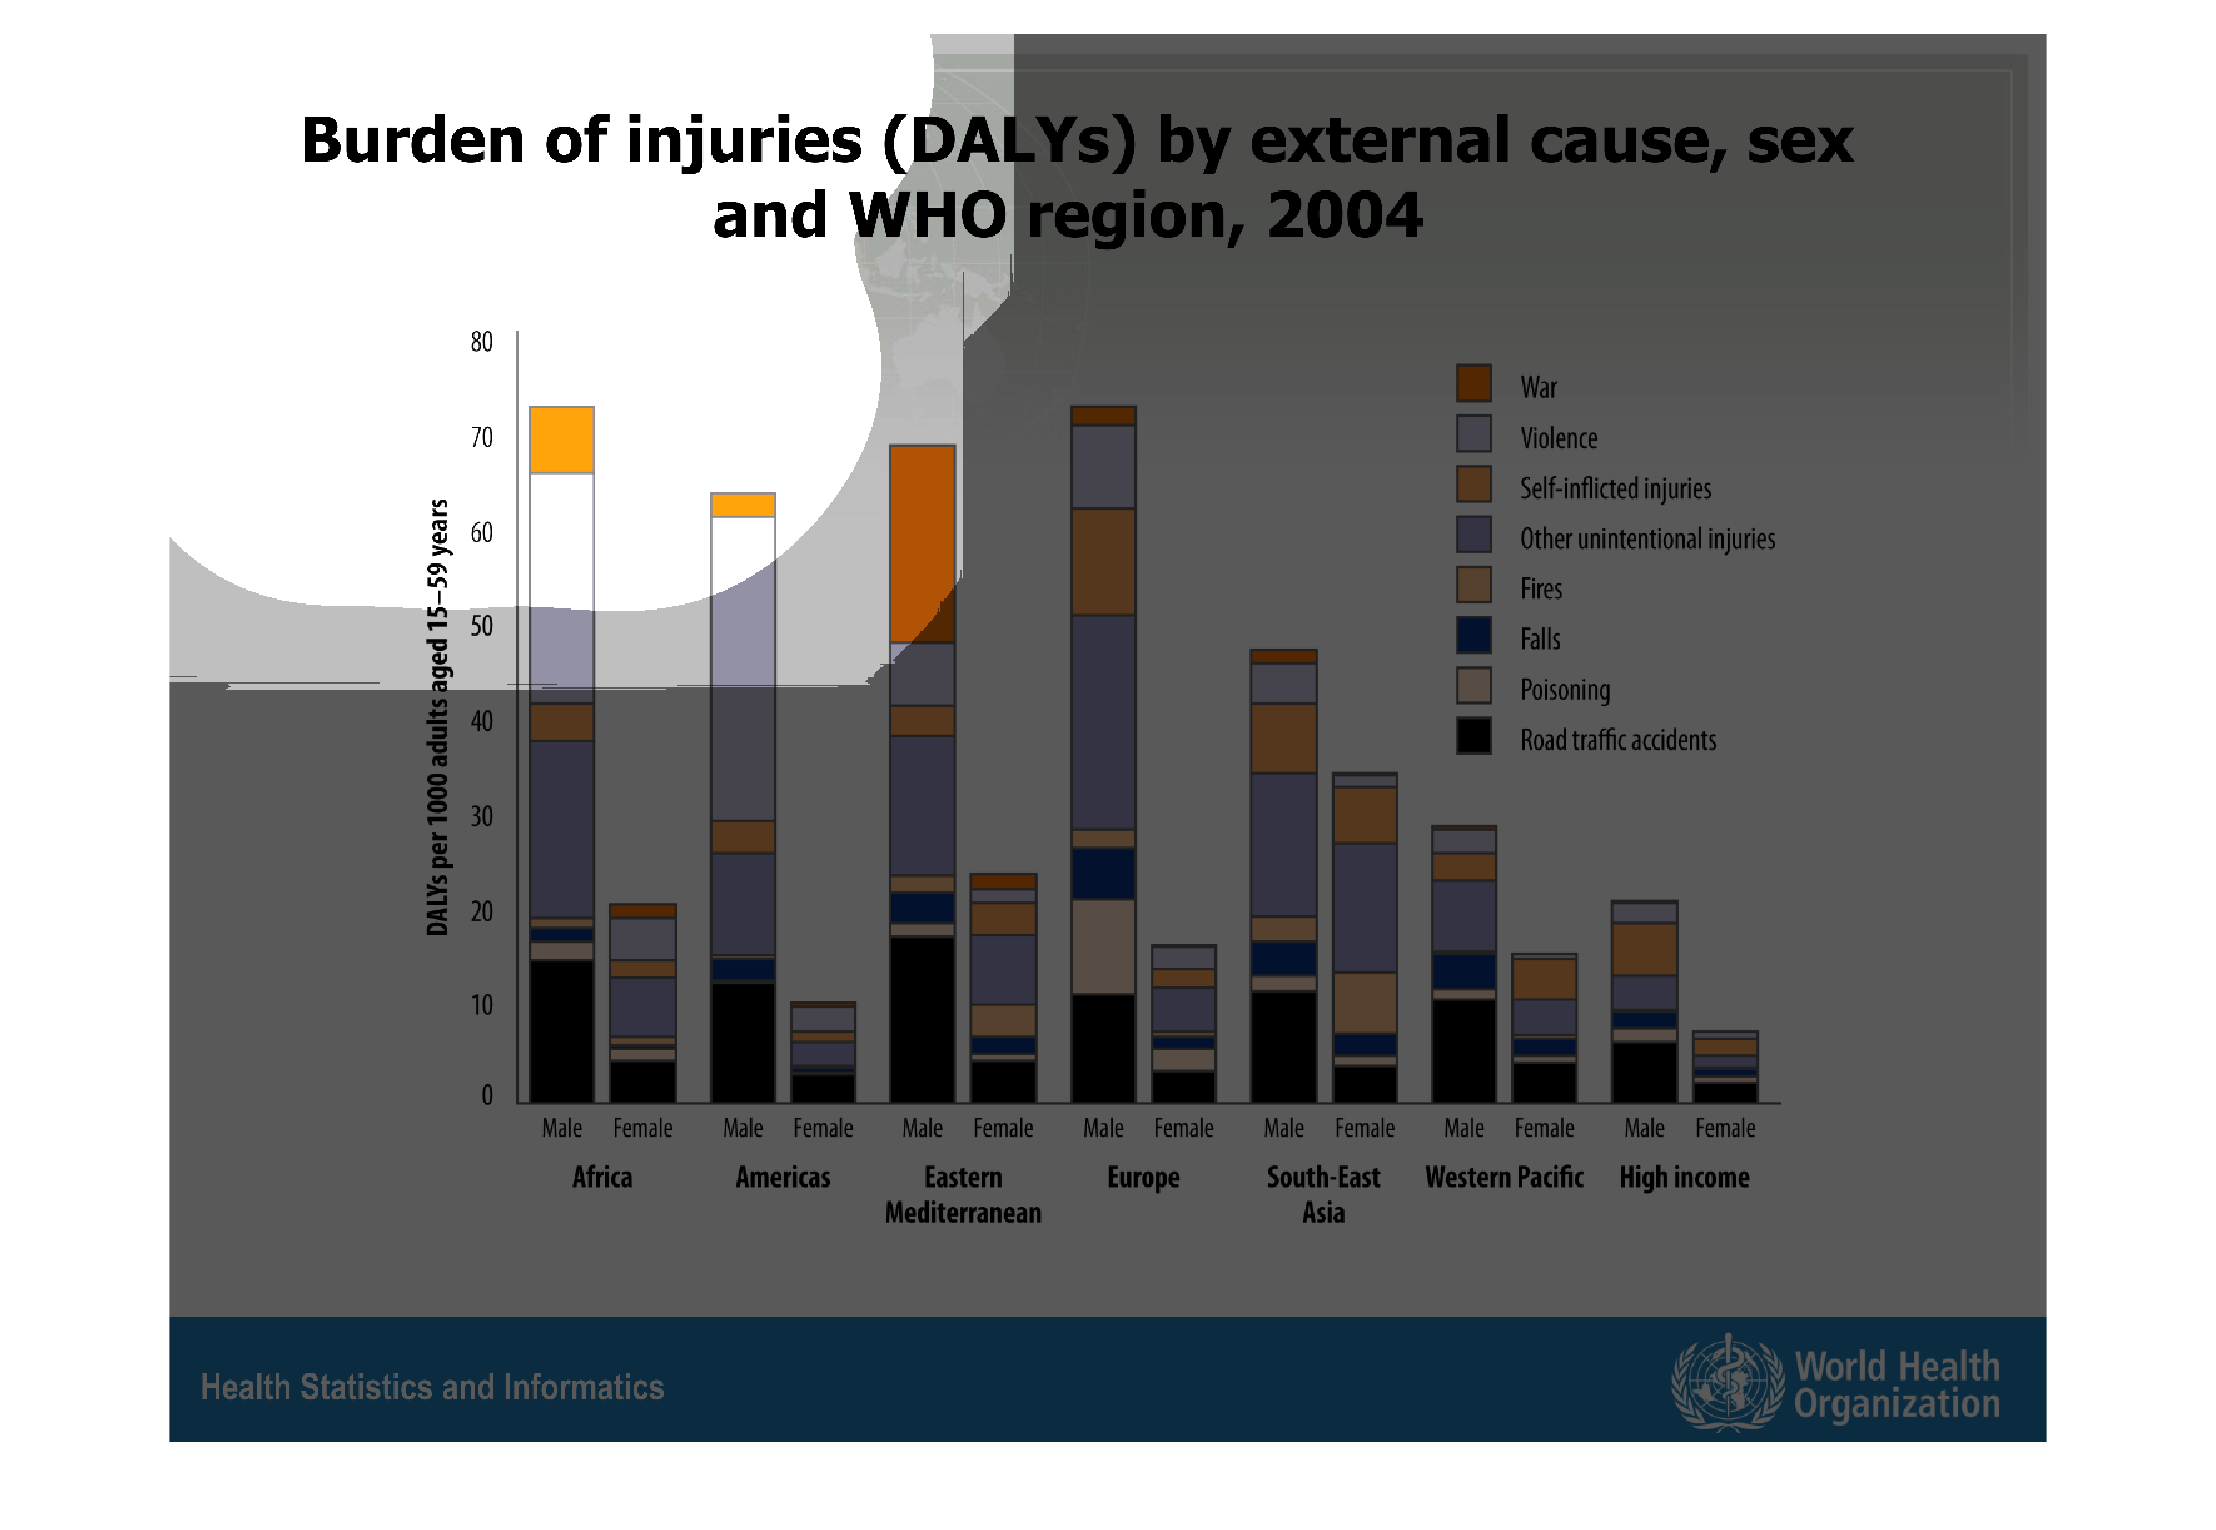
This graph illustrates burden of injuries by cause, sex, and WHO region in 2004.  Categories
are: war, violence, self inflicted, other countries, fees, fails, poisoning, and road traffic.

Warning: Image is too big to fit on screen; displaying at 67%
Warning: Image is too big to fit on screen; displaying at 67%