Warning: Image is too big to fit on screen; displaying at 67%
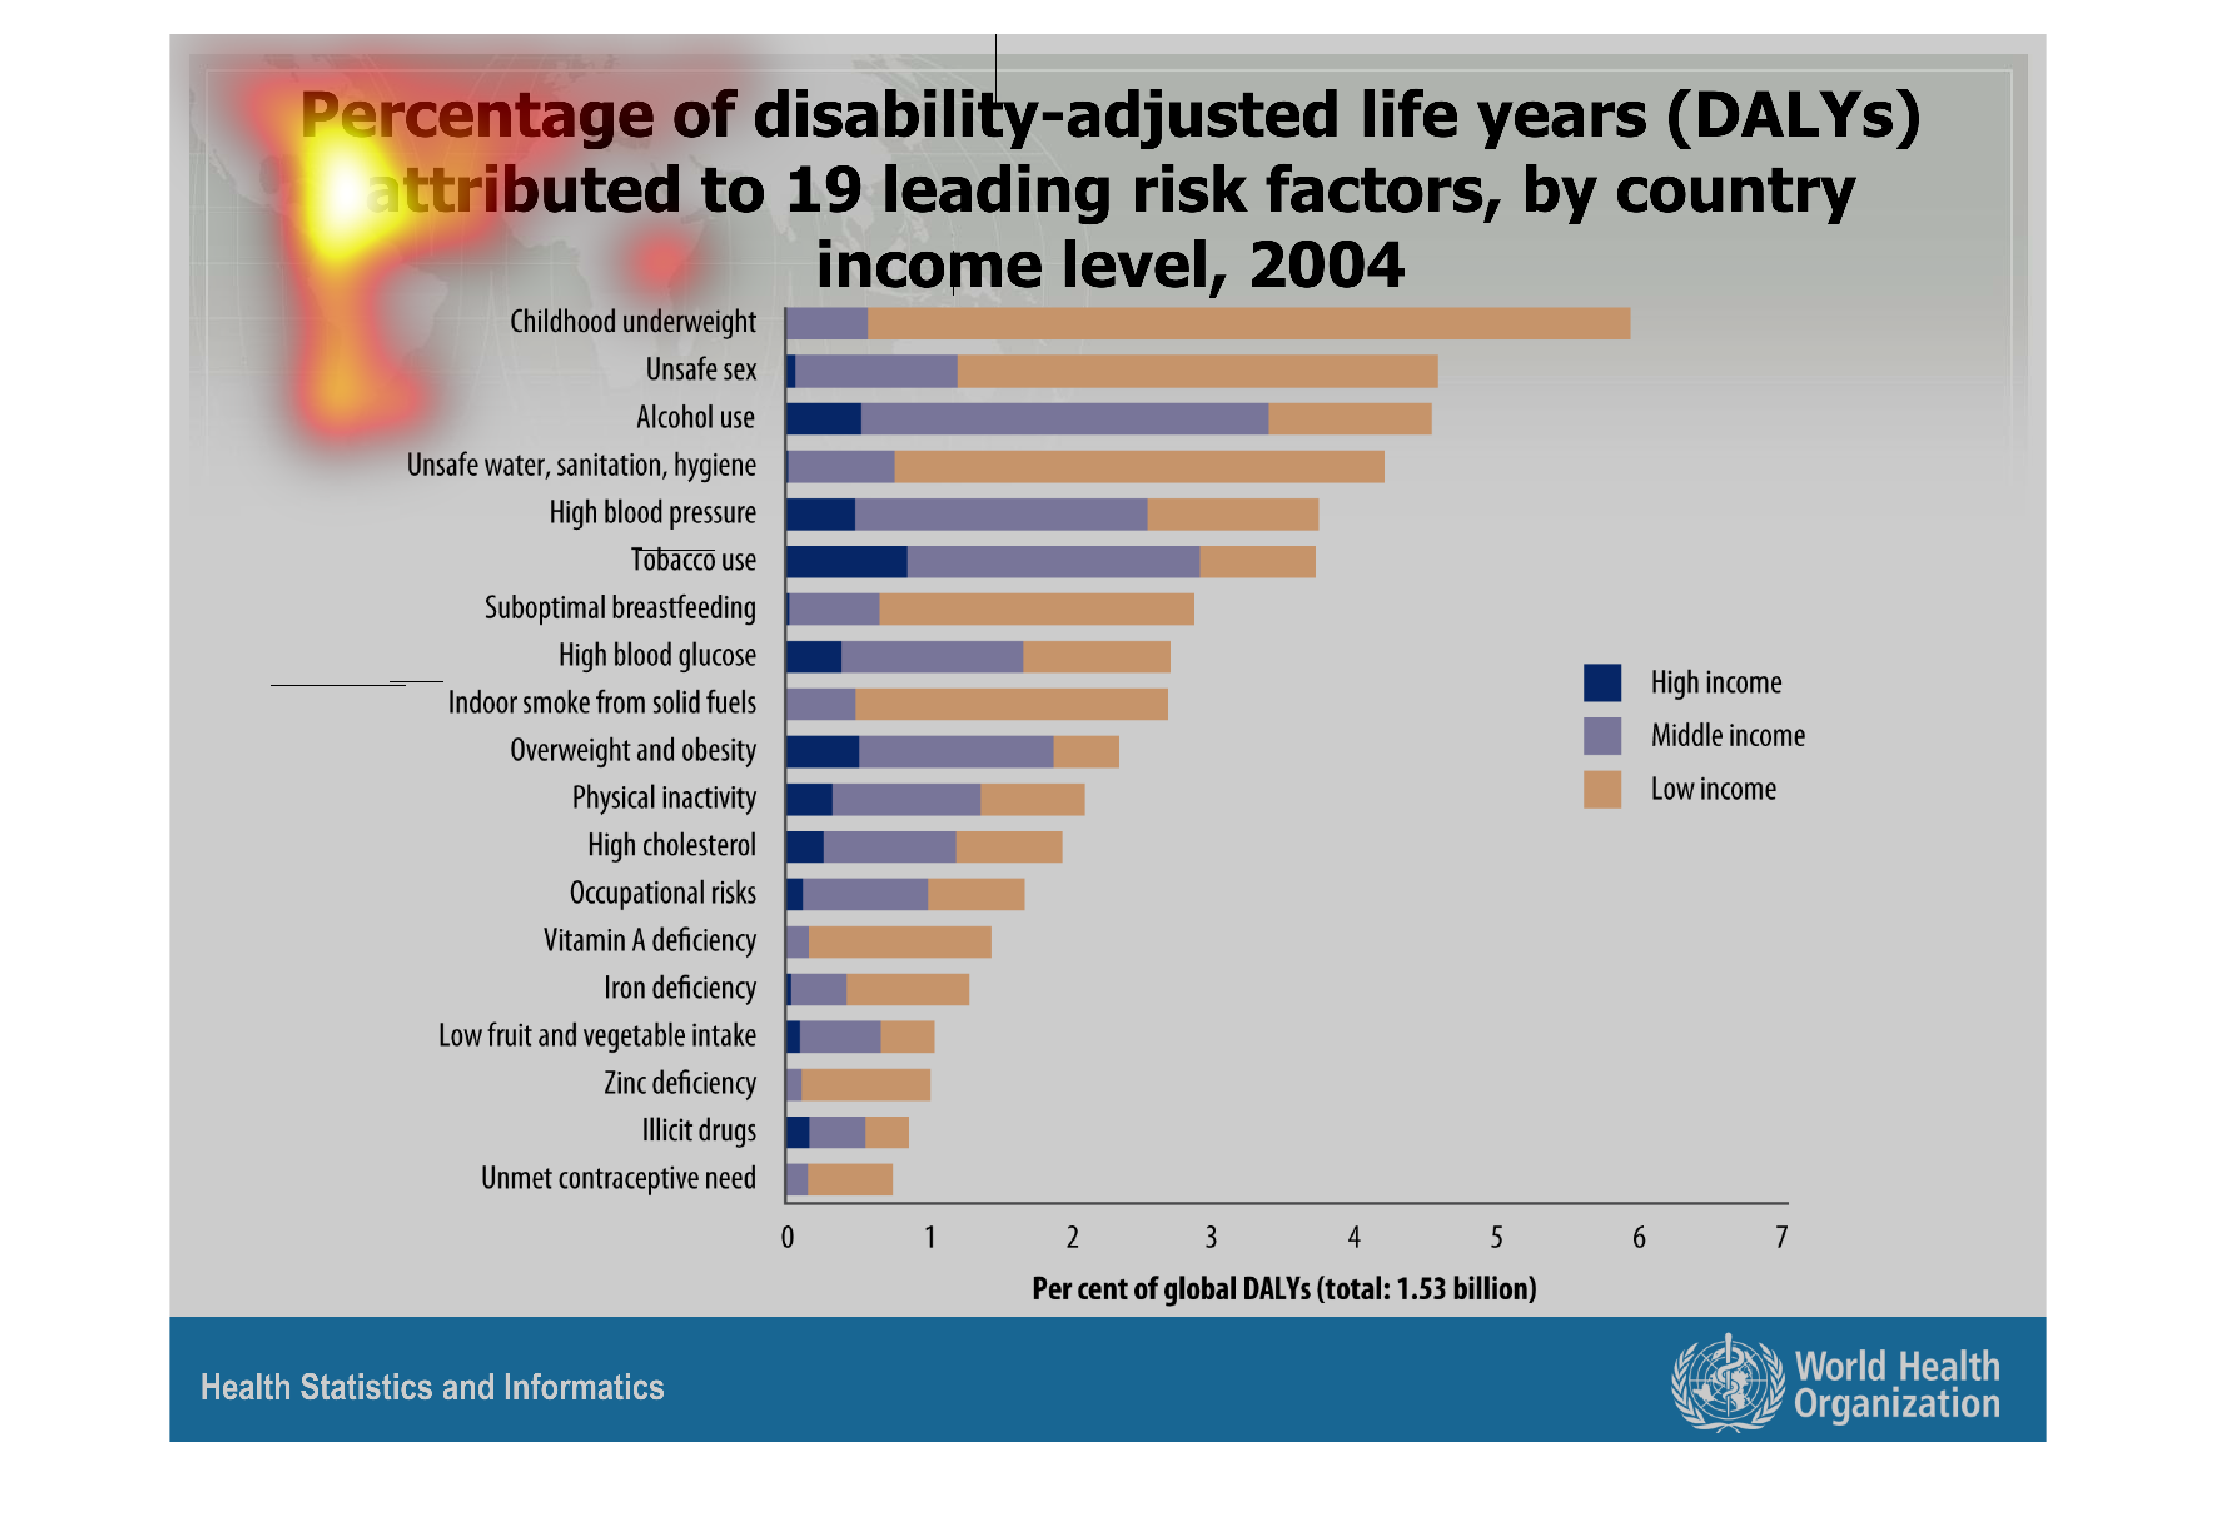
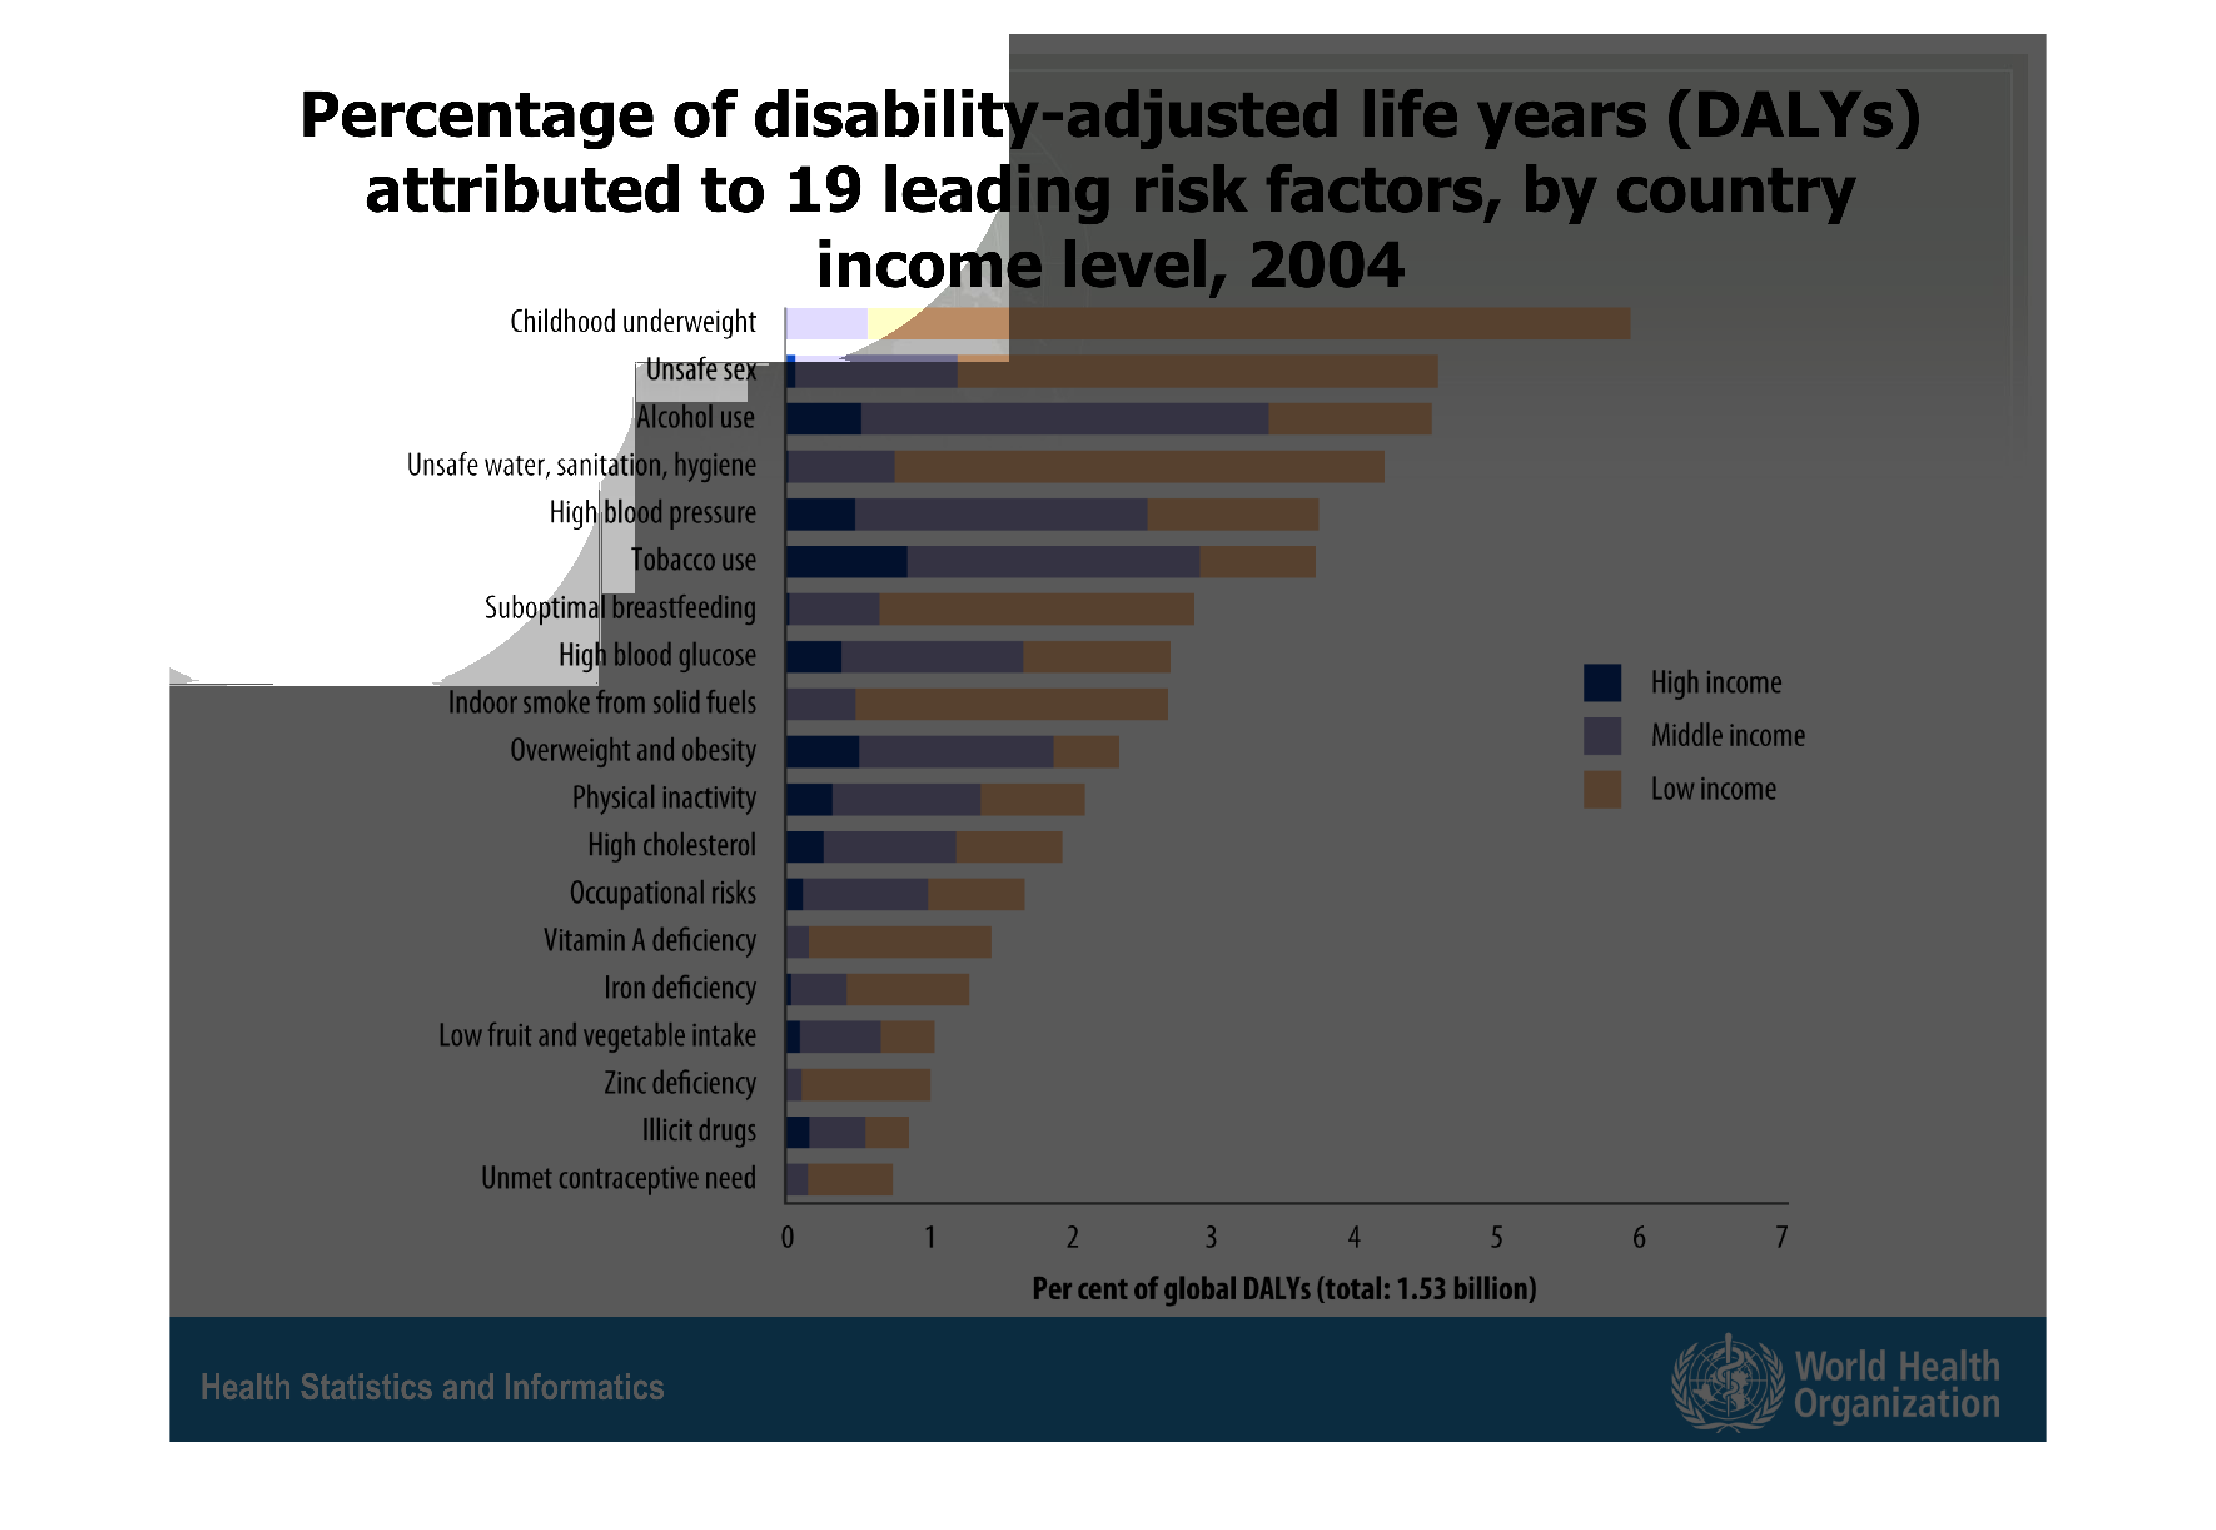
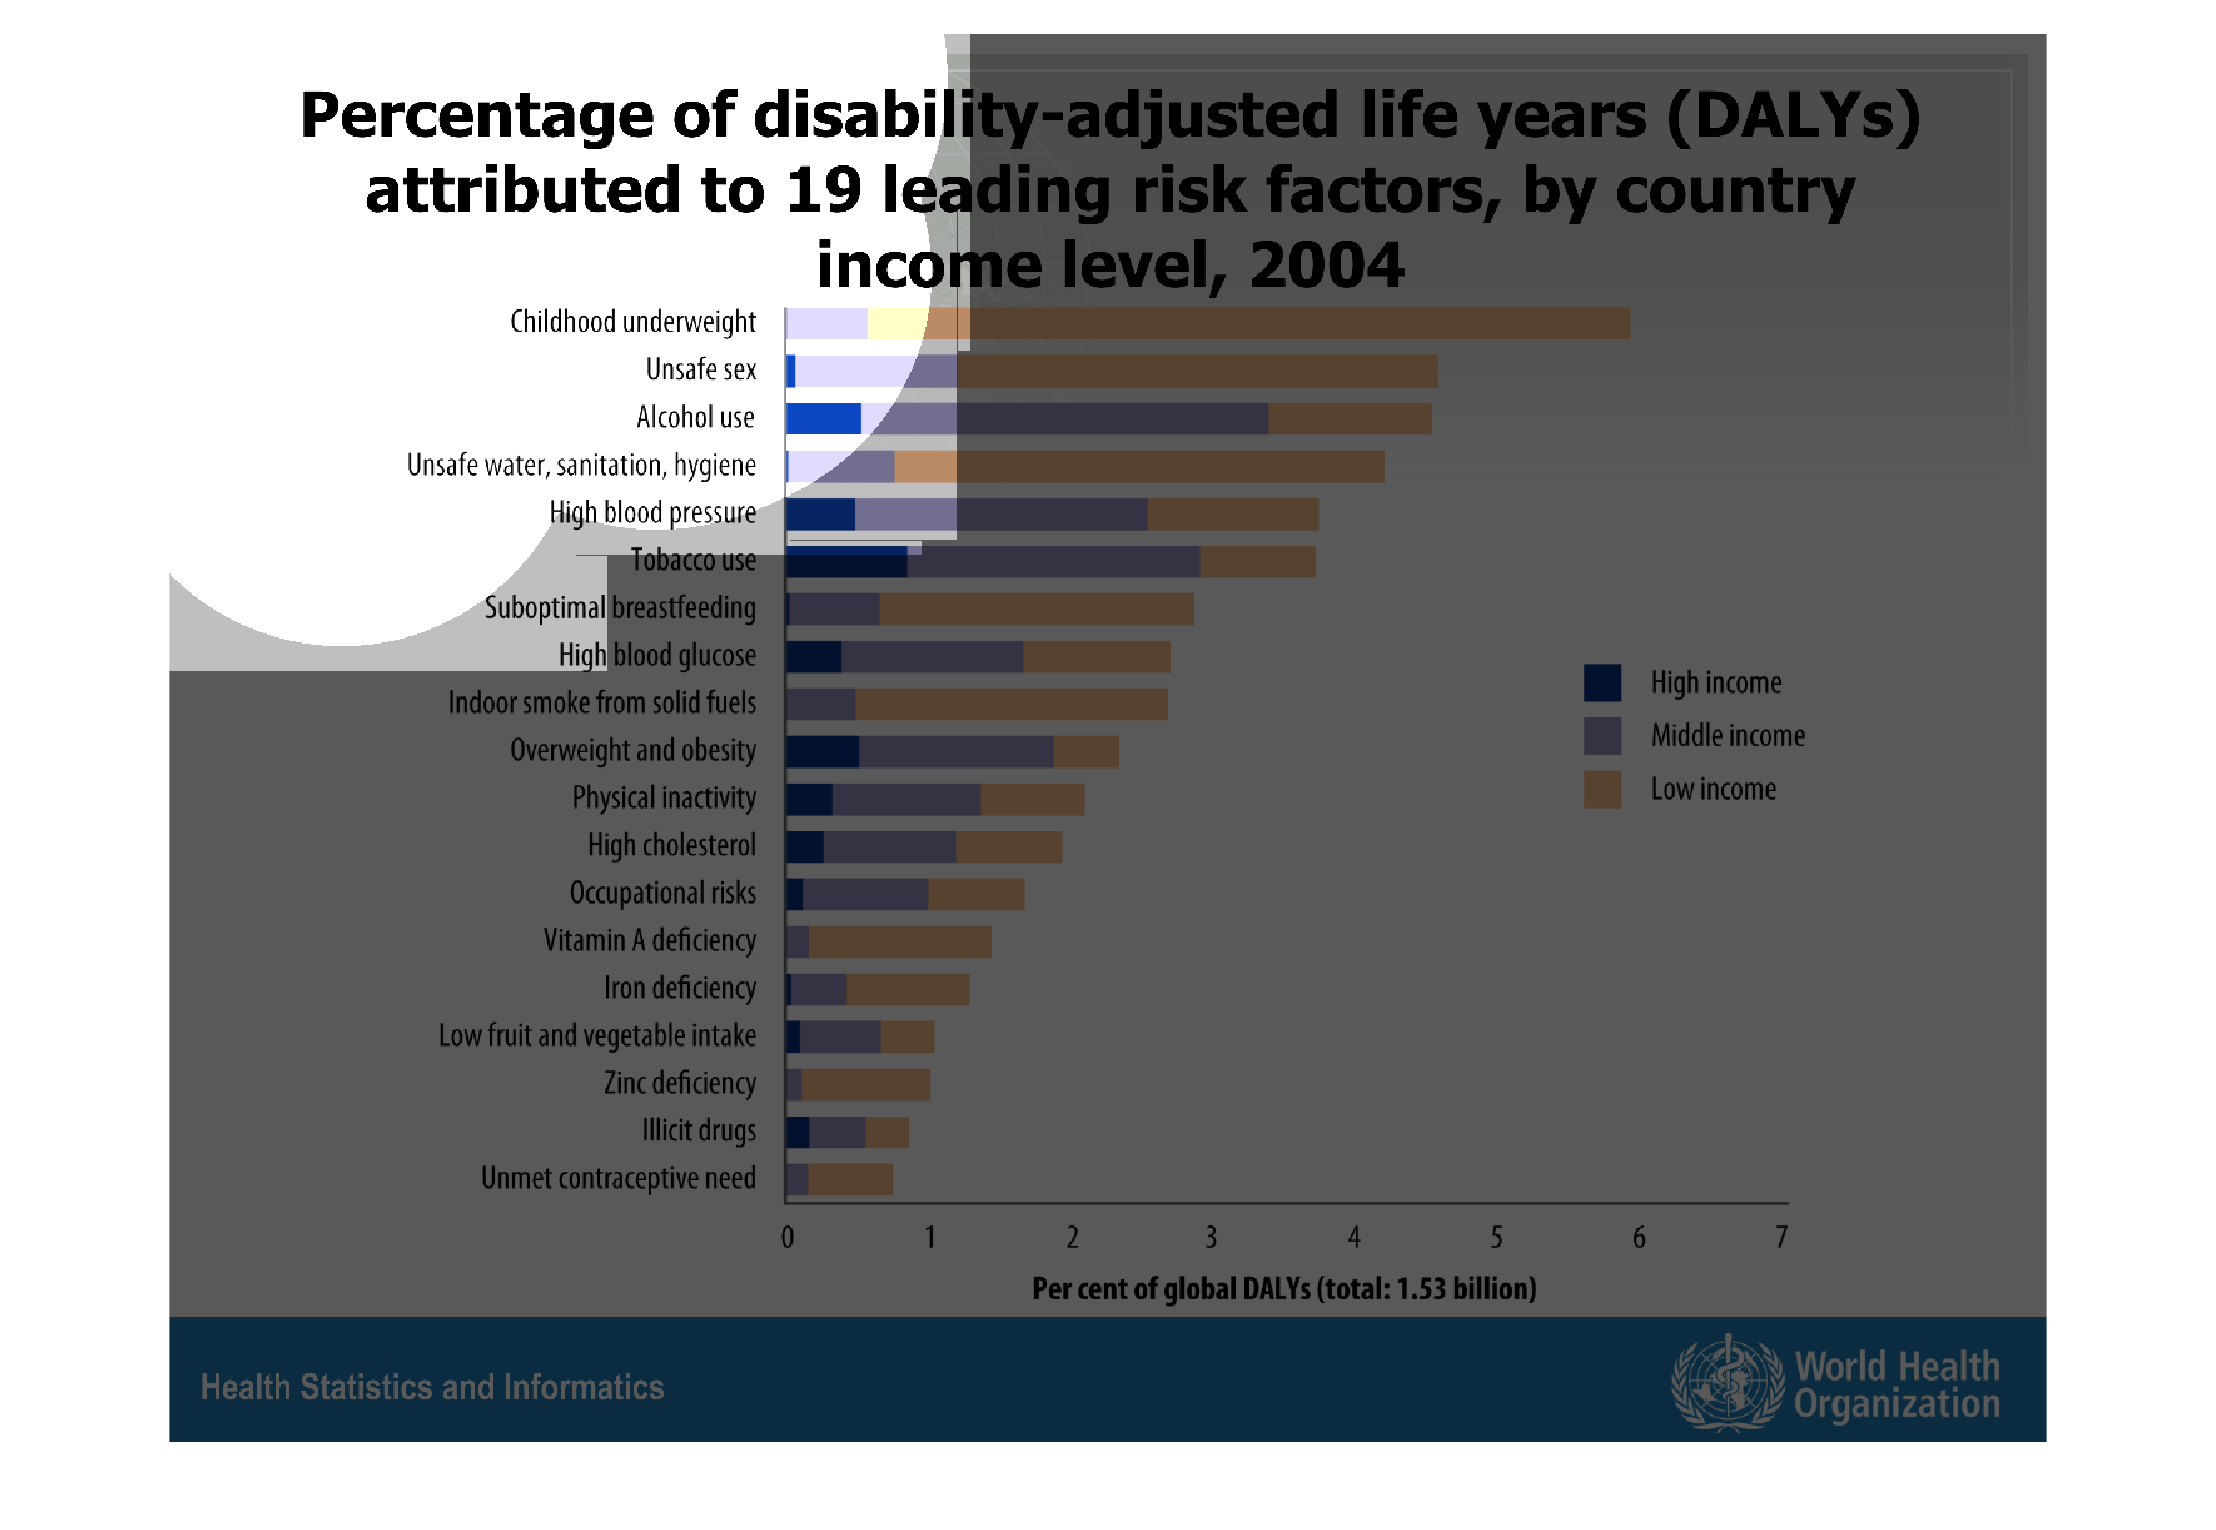
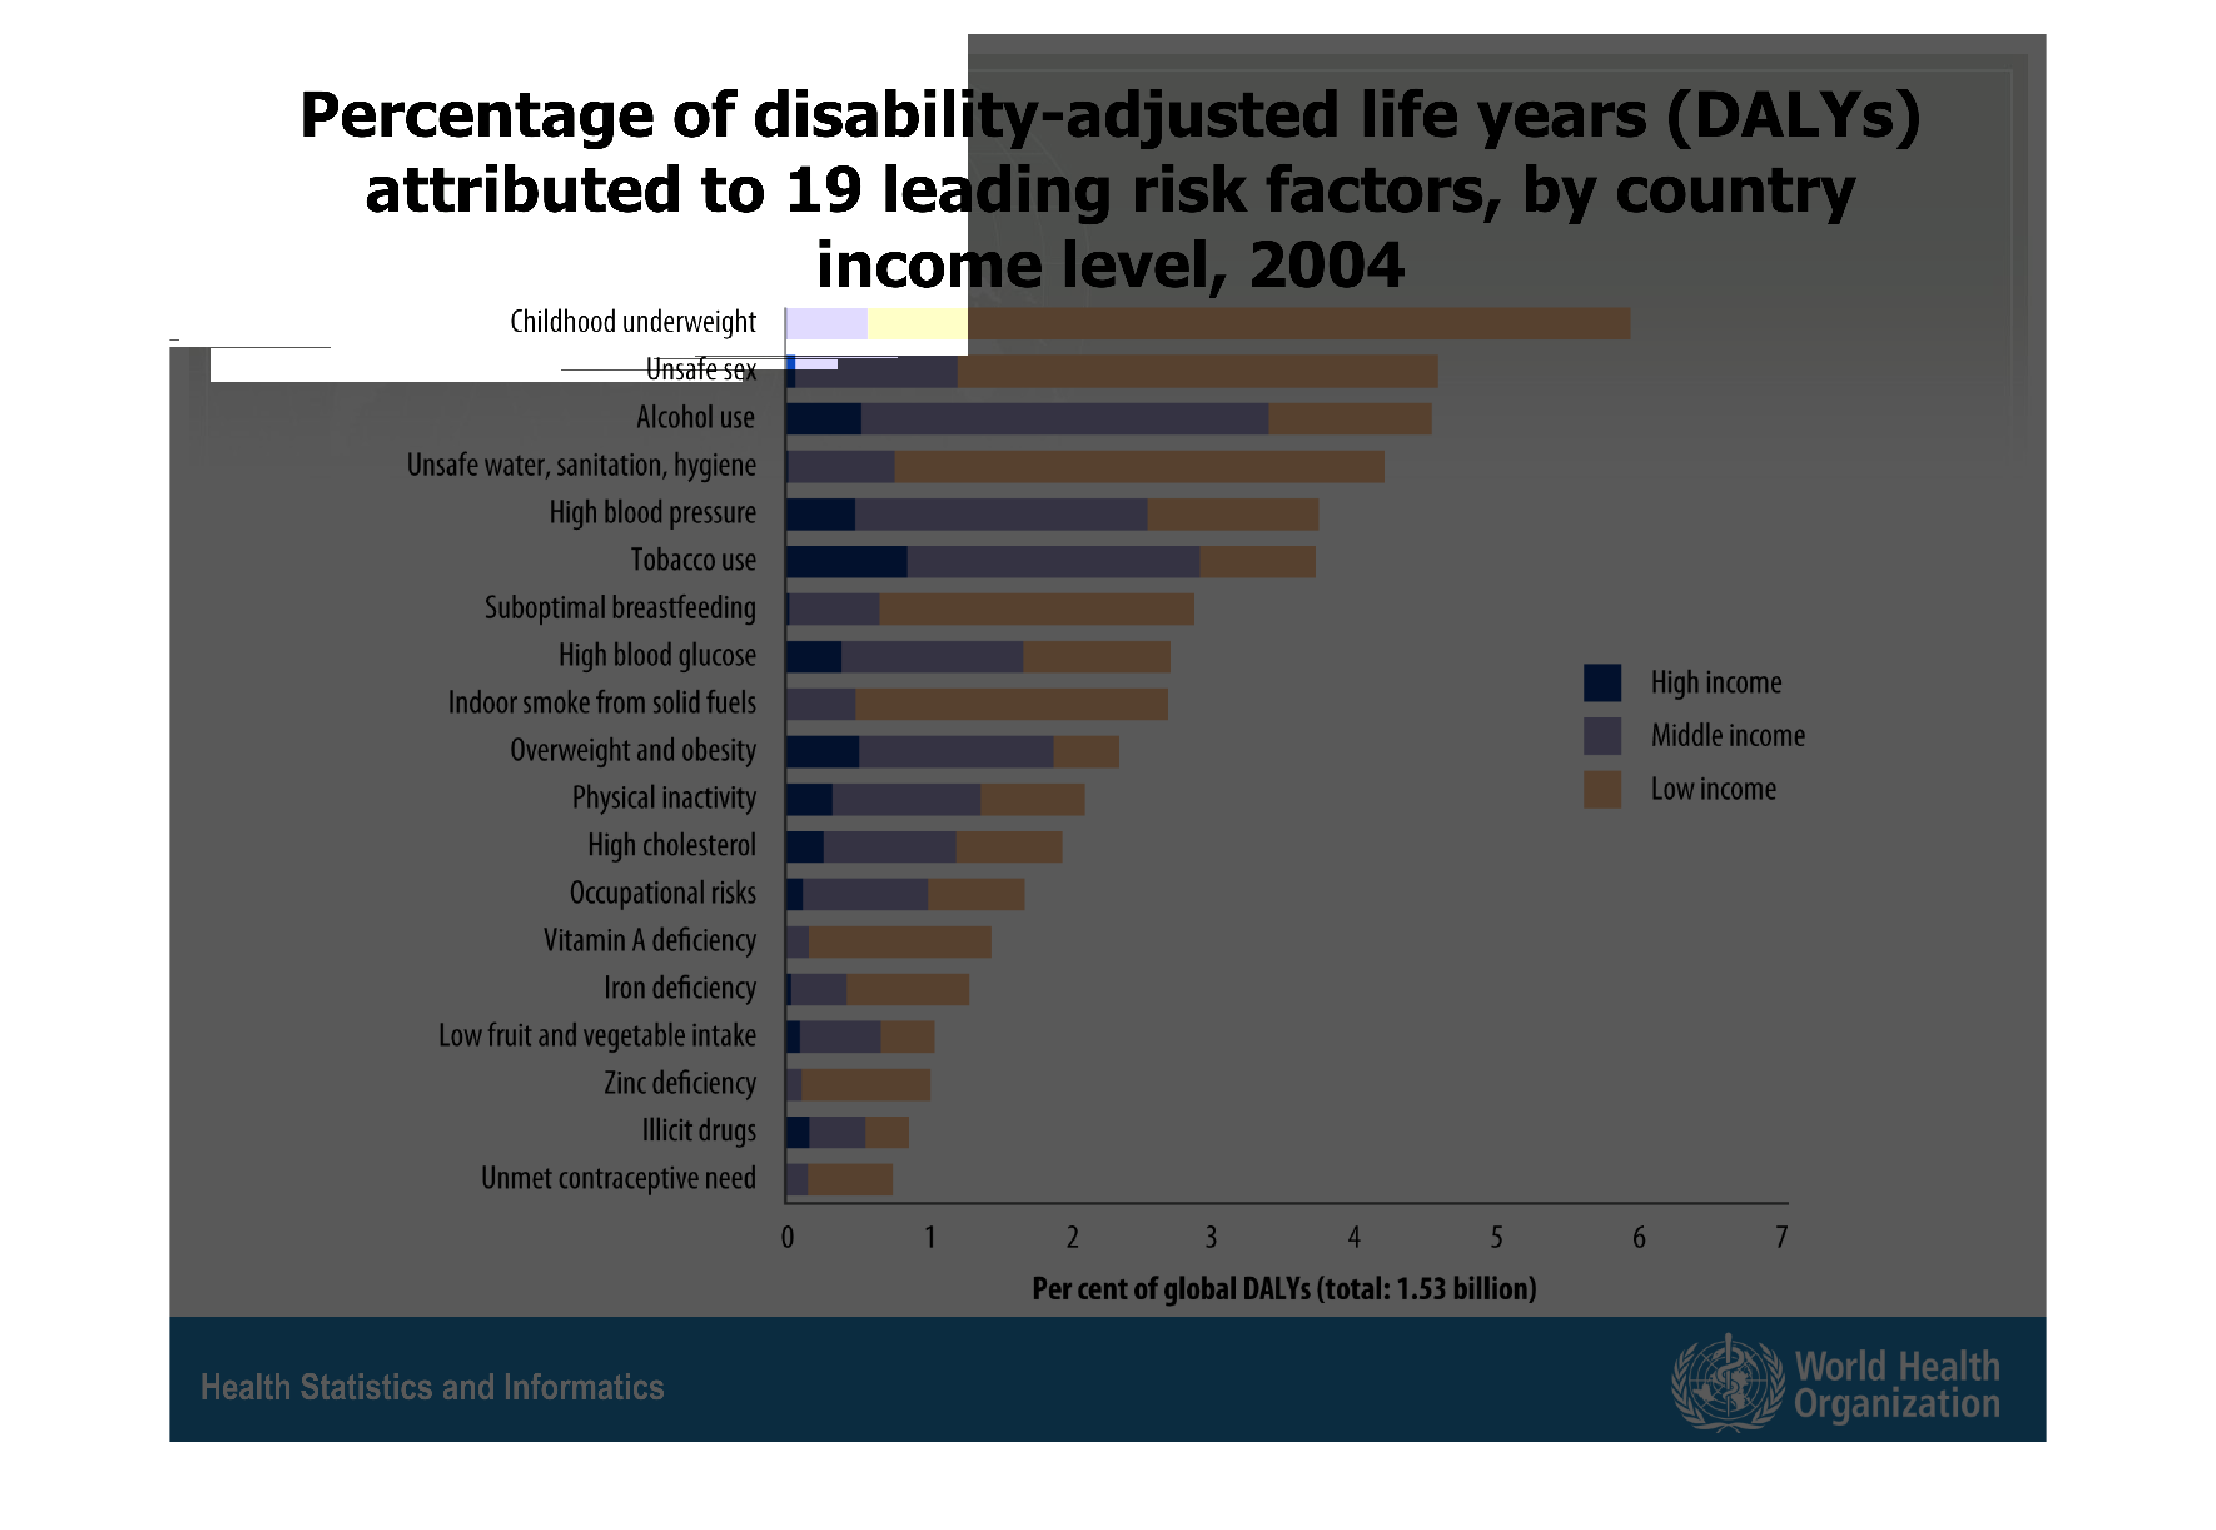
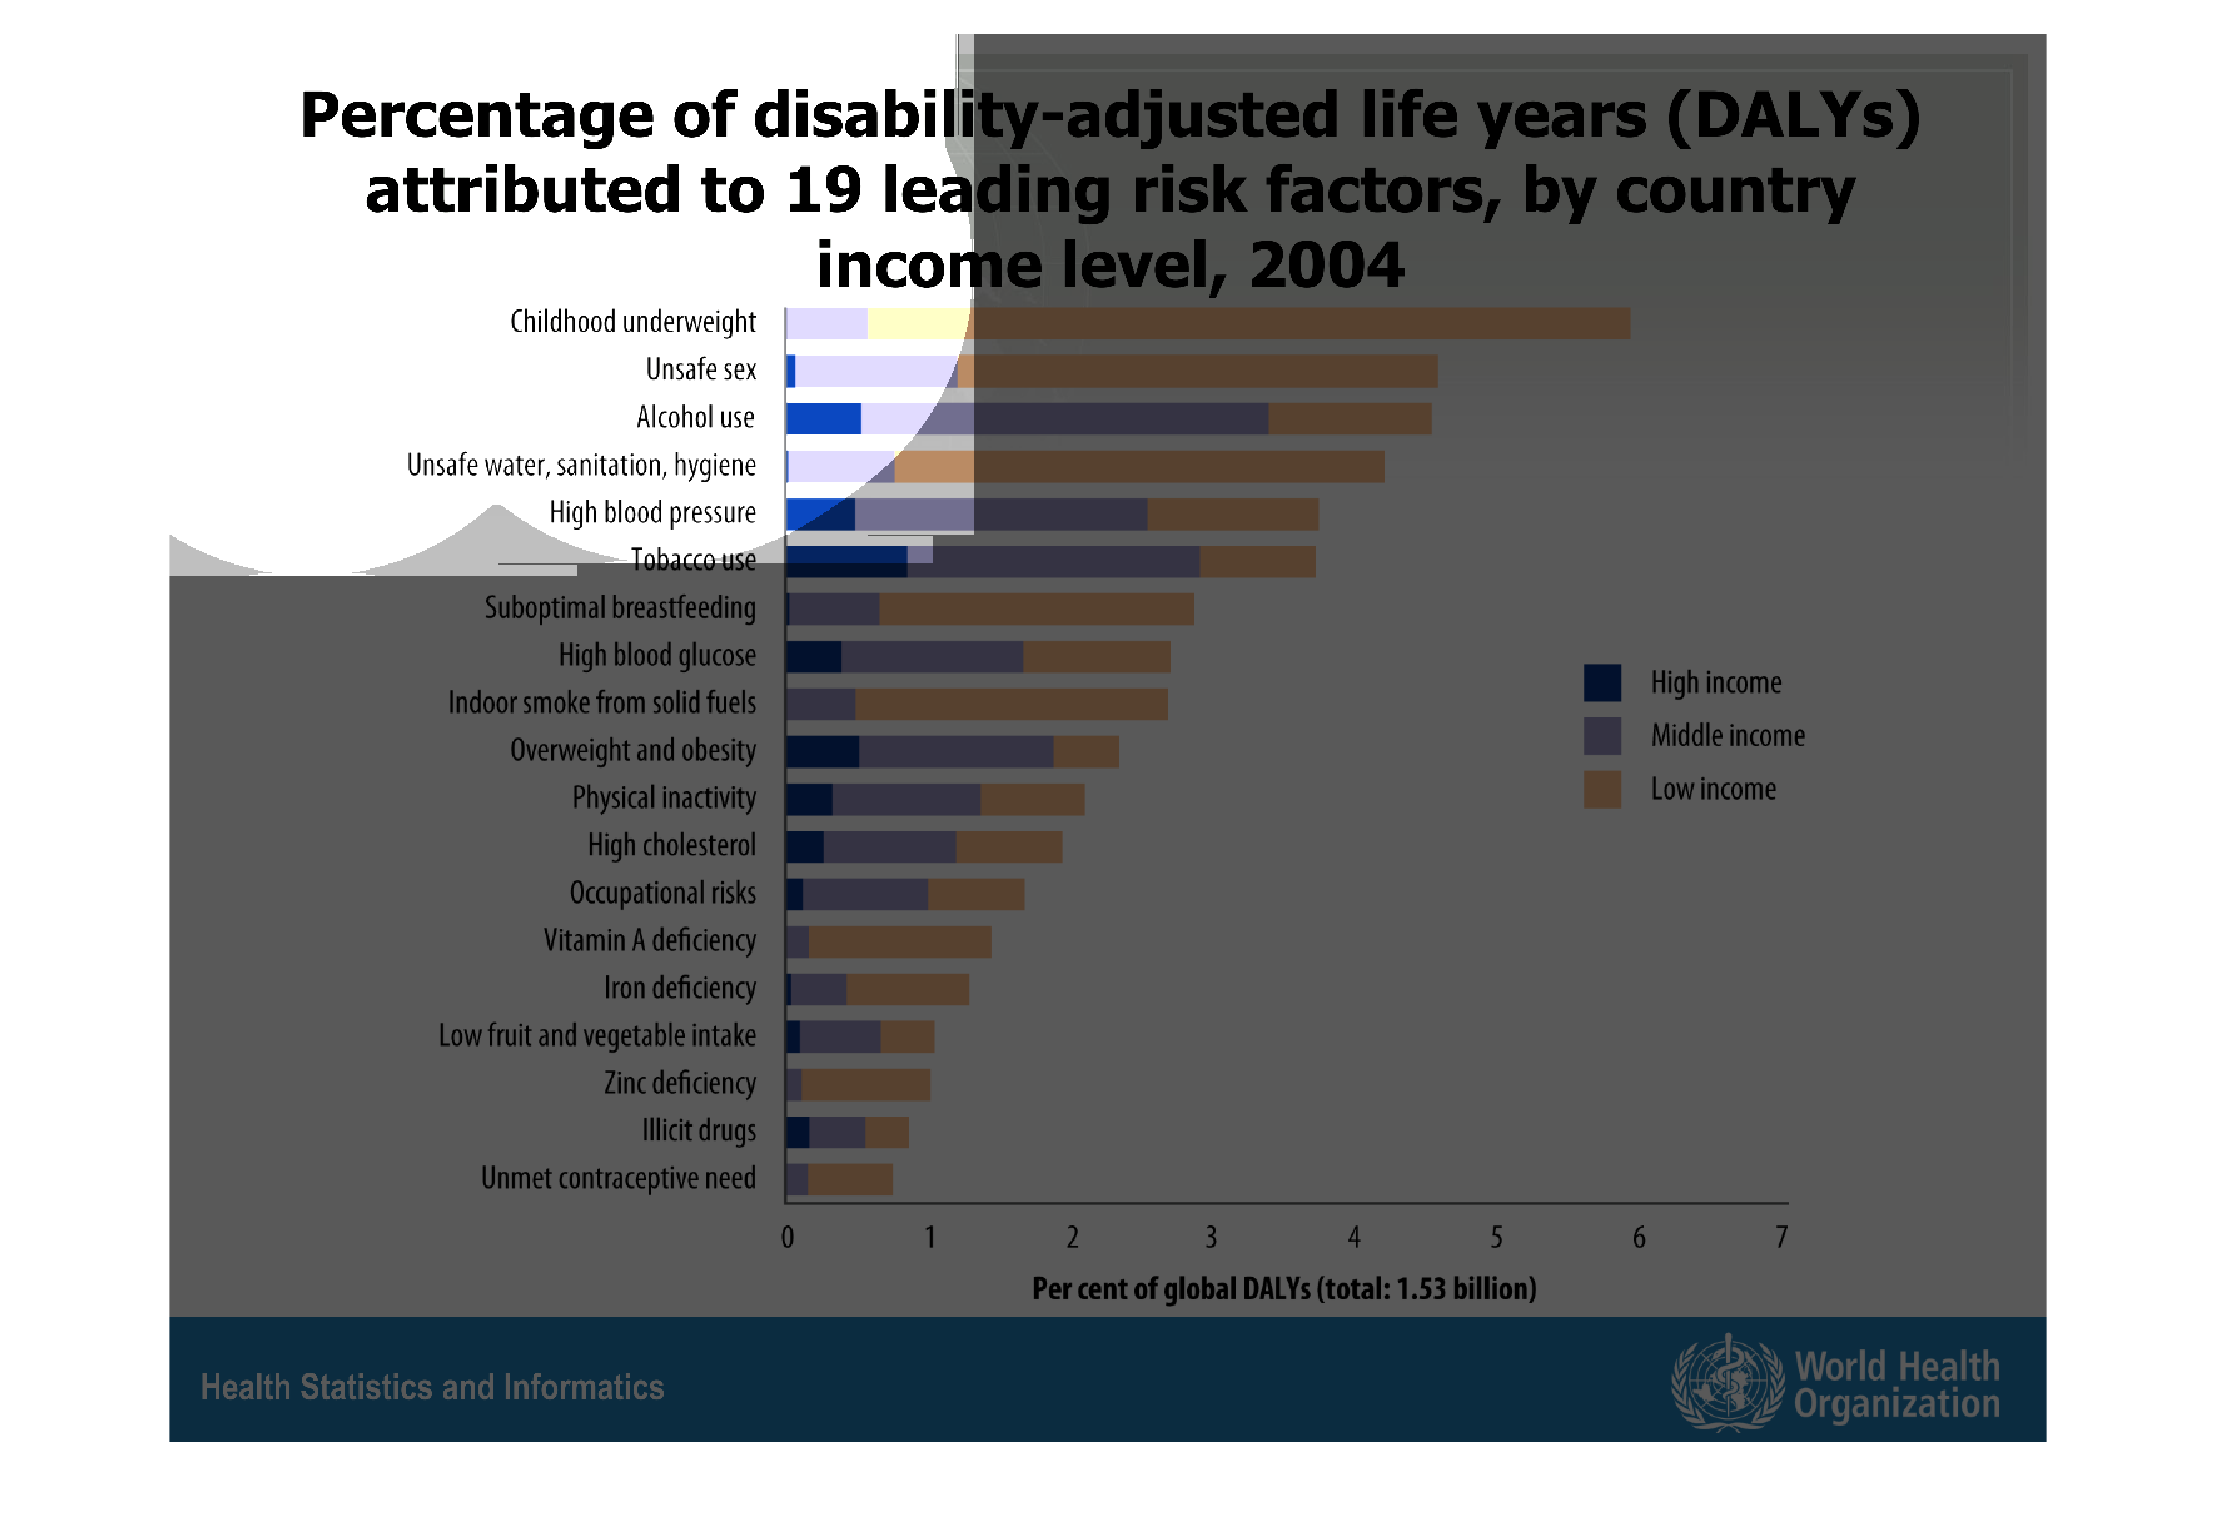
This is a graph that shows the percentage of adjusted life years (DALYs) attributed to the
19 leading risk factors by country income level and it covers the year 2004.
Warning: Image is too big to fit on screen; displaying at 67%
Warning: Image is too big to fit on screen; displaying at 67%
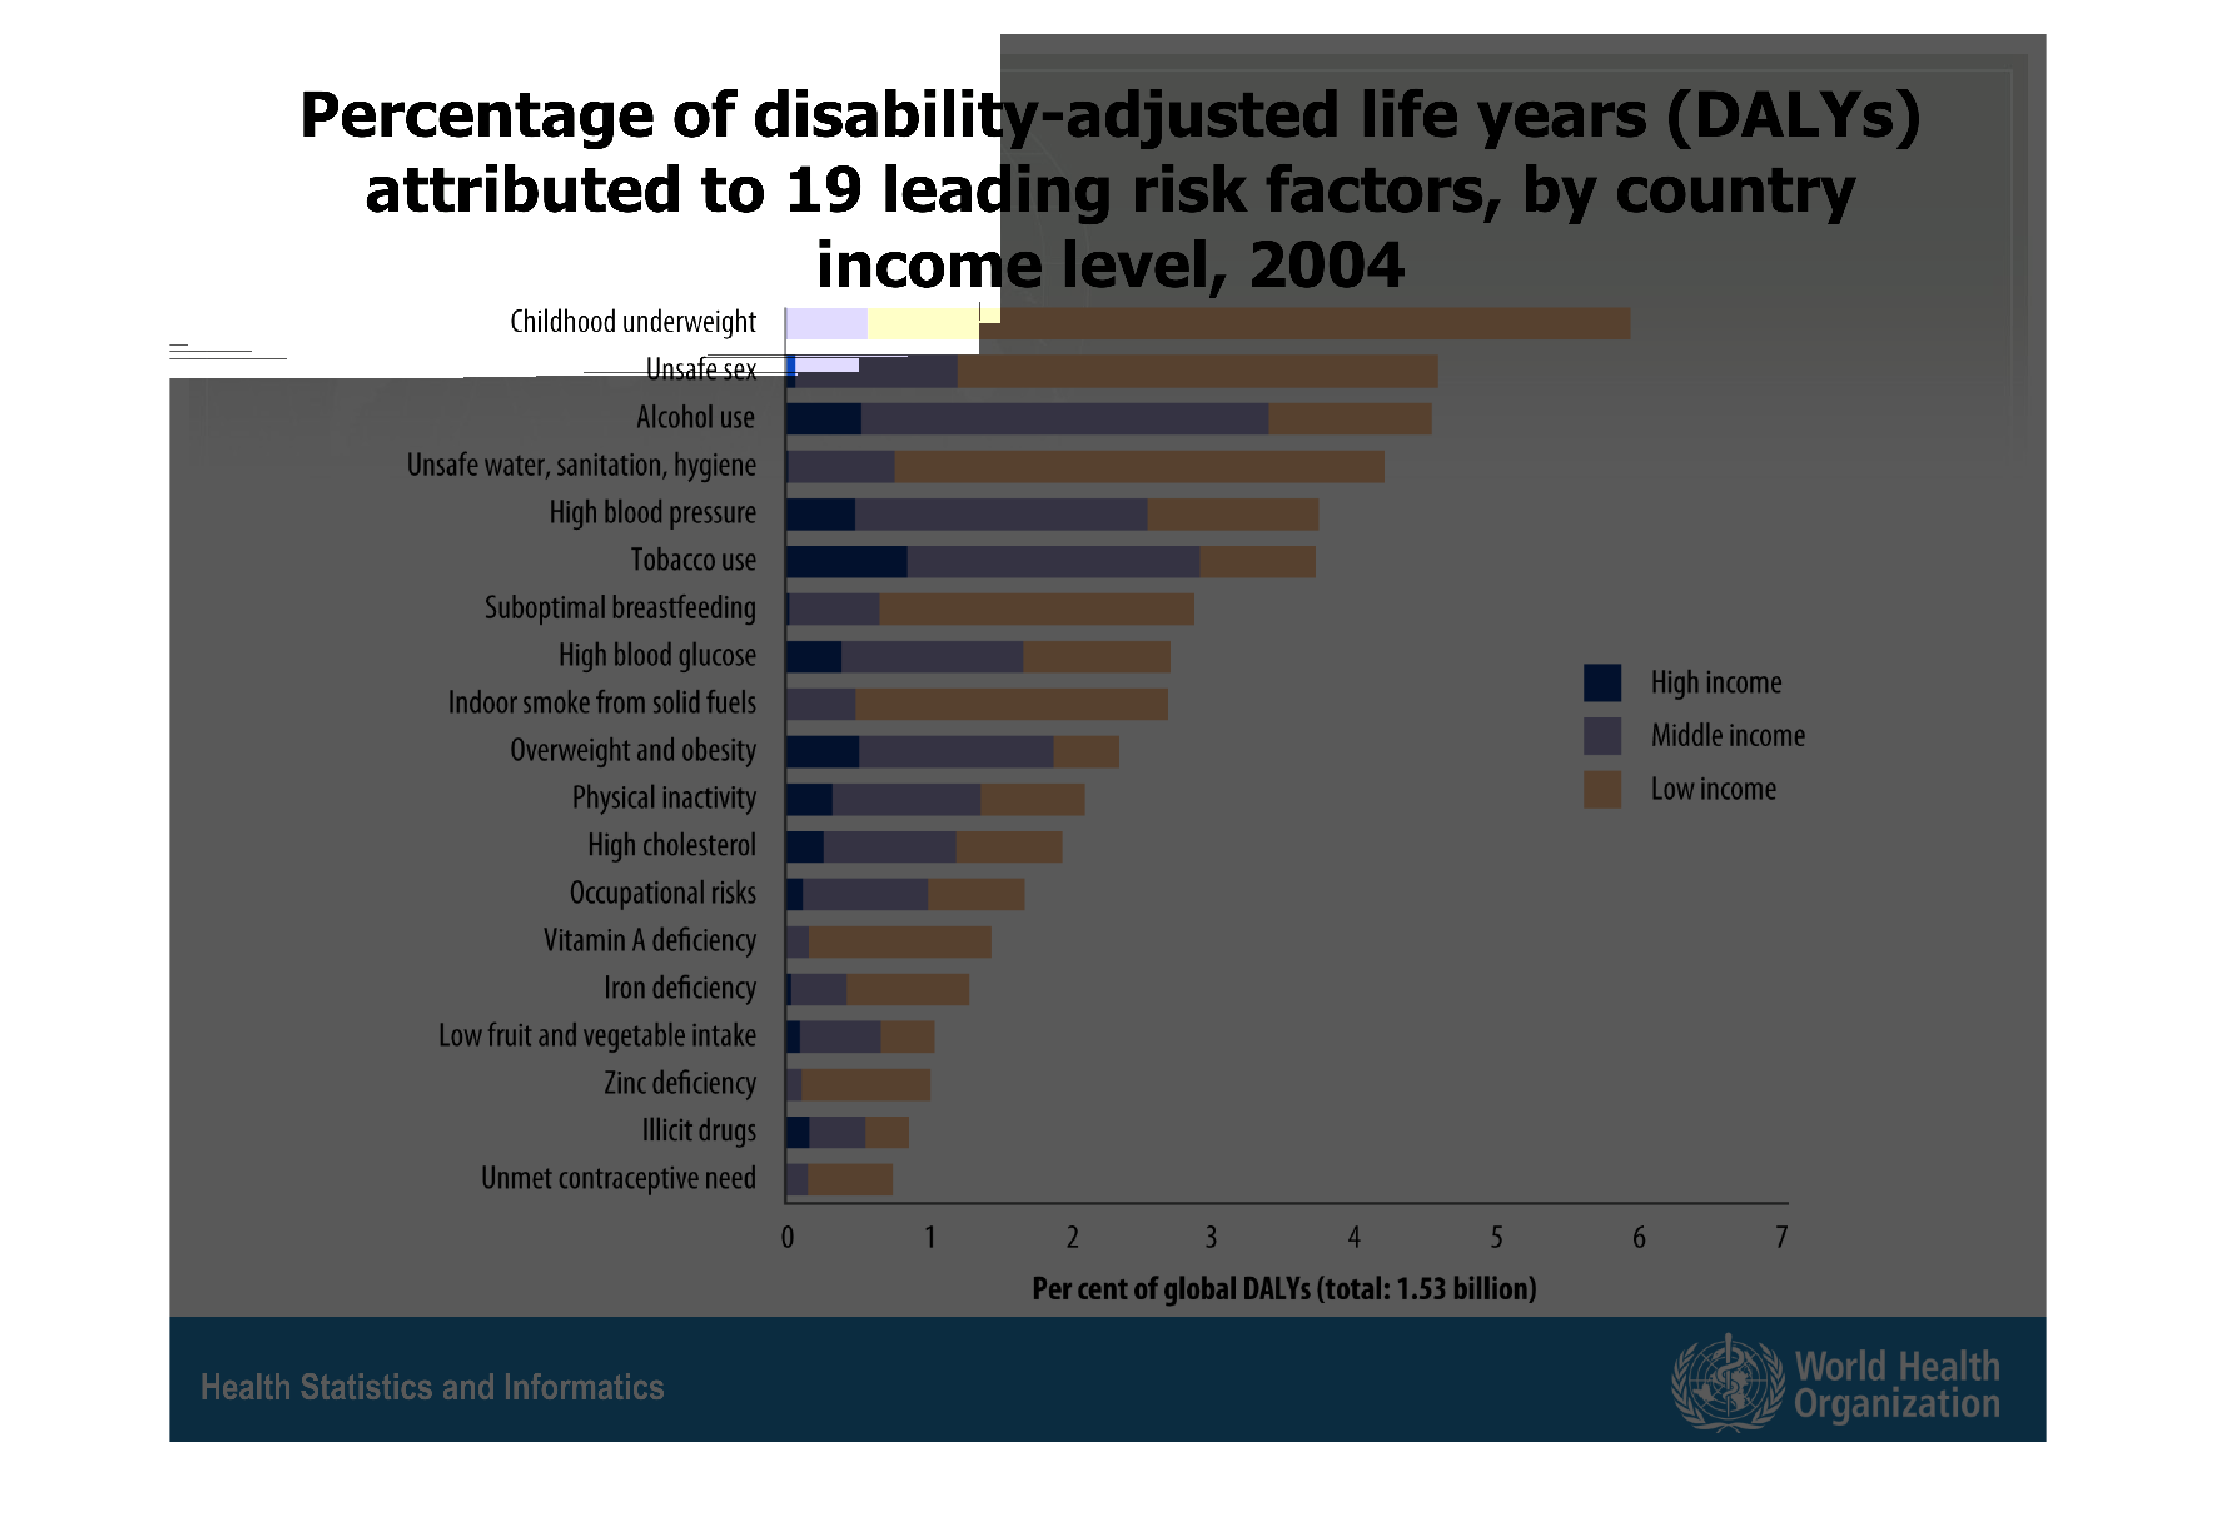
It is a graph showing the percentage of disability adjusted life years attributed to 19 leading
risk factors, by country income level in 2004. The risk factors include unhealthy risks such
as high blood pressure and smoking and deficiencies.
Warning: Image is too big to fit on screen; displaying at 67%
Warning: Image is too big to fit on screen; displaying at 67%
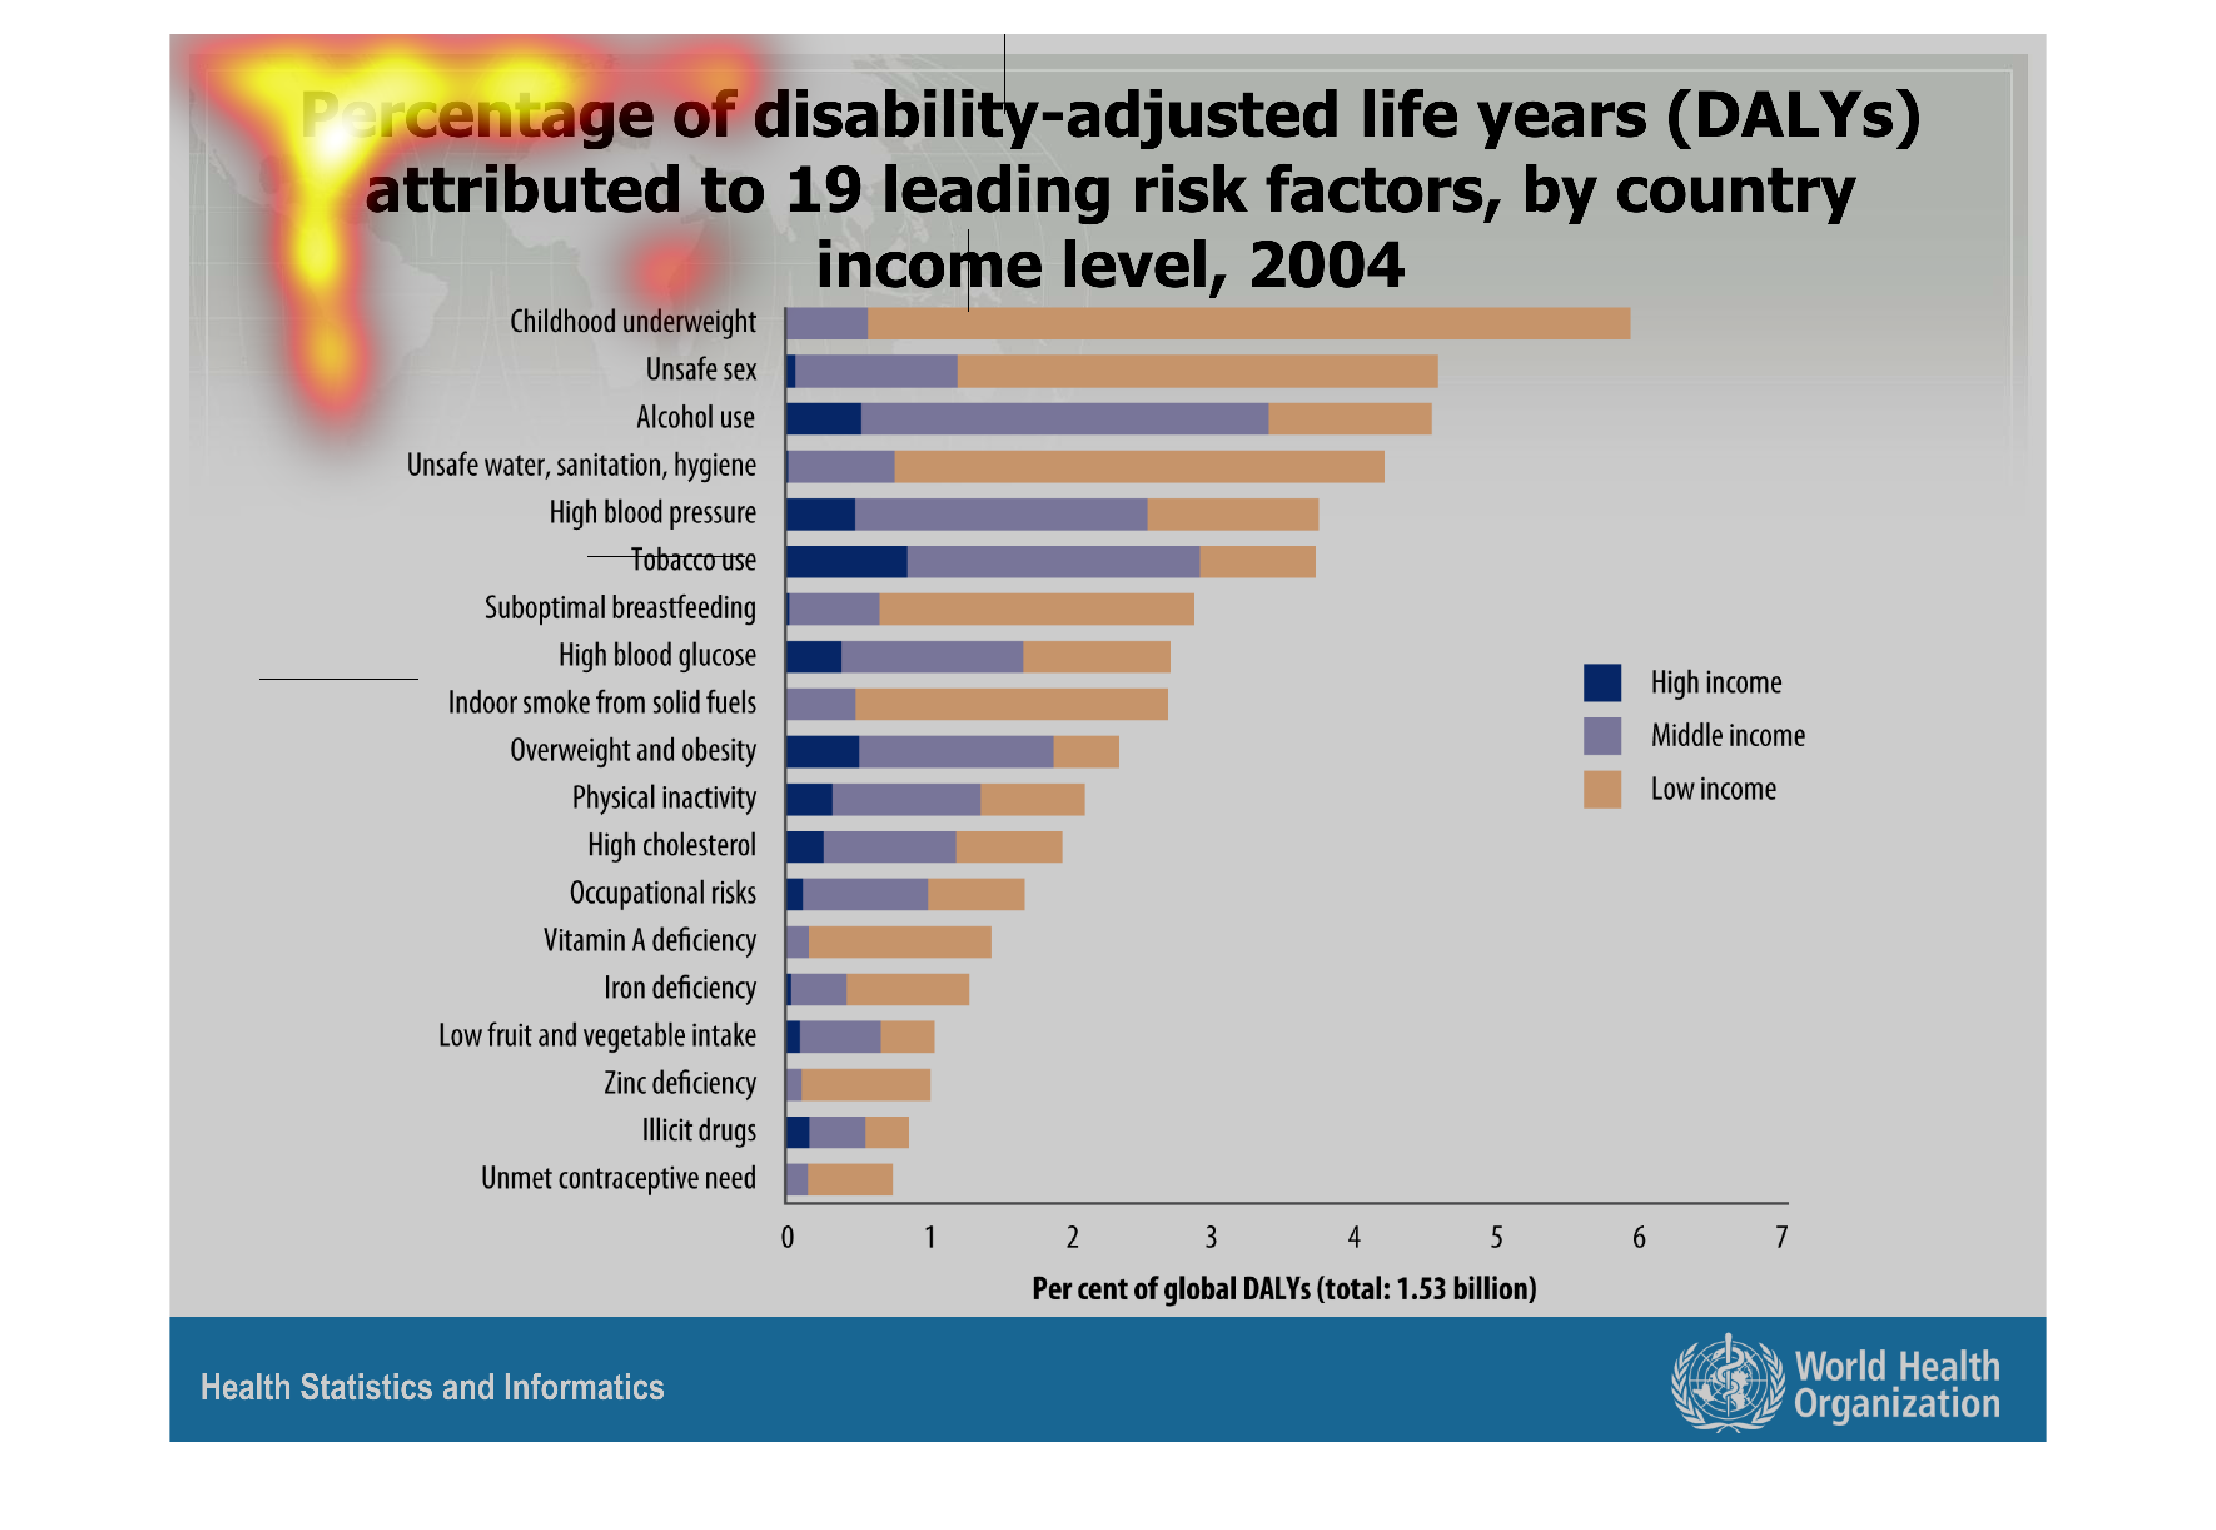

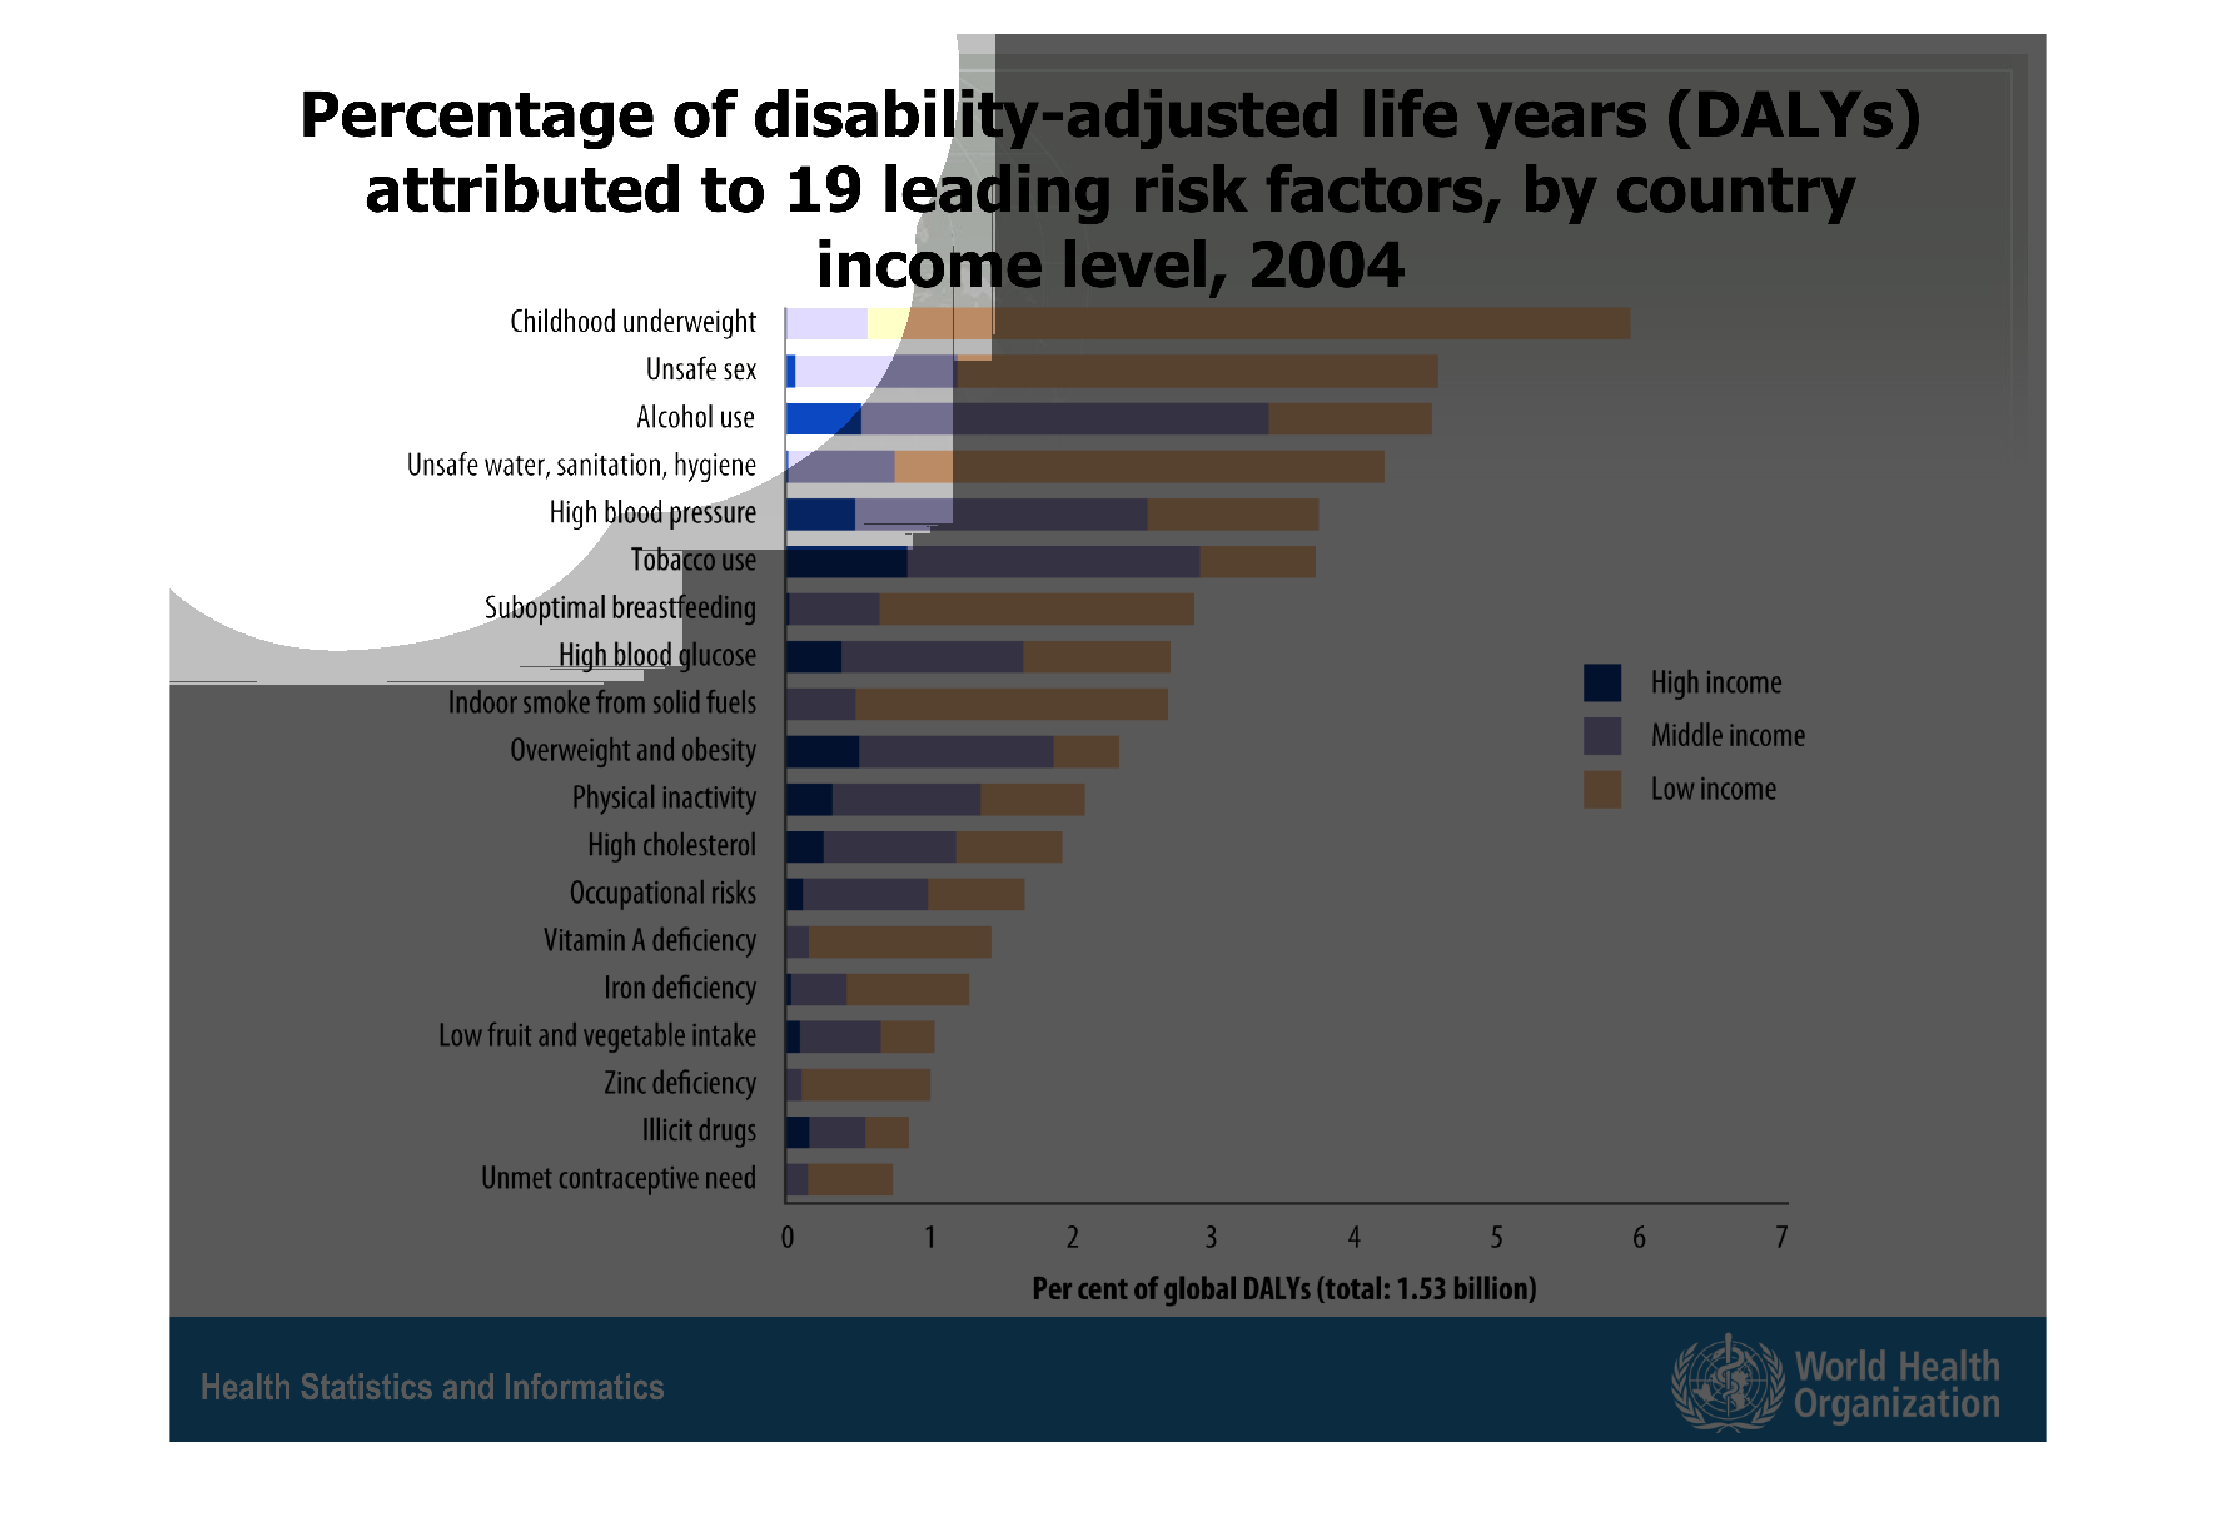
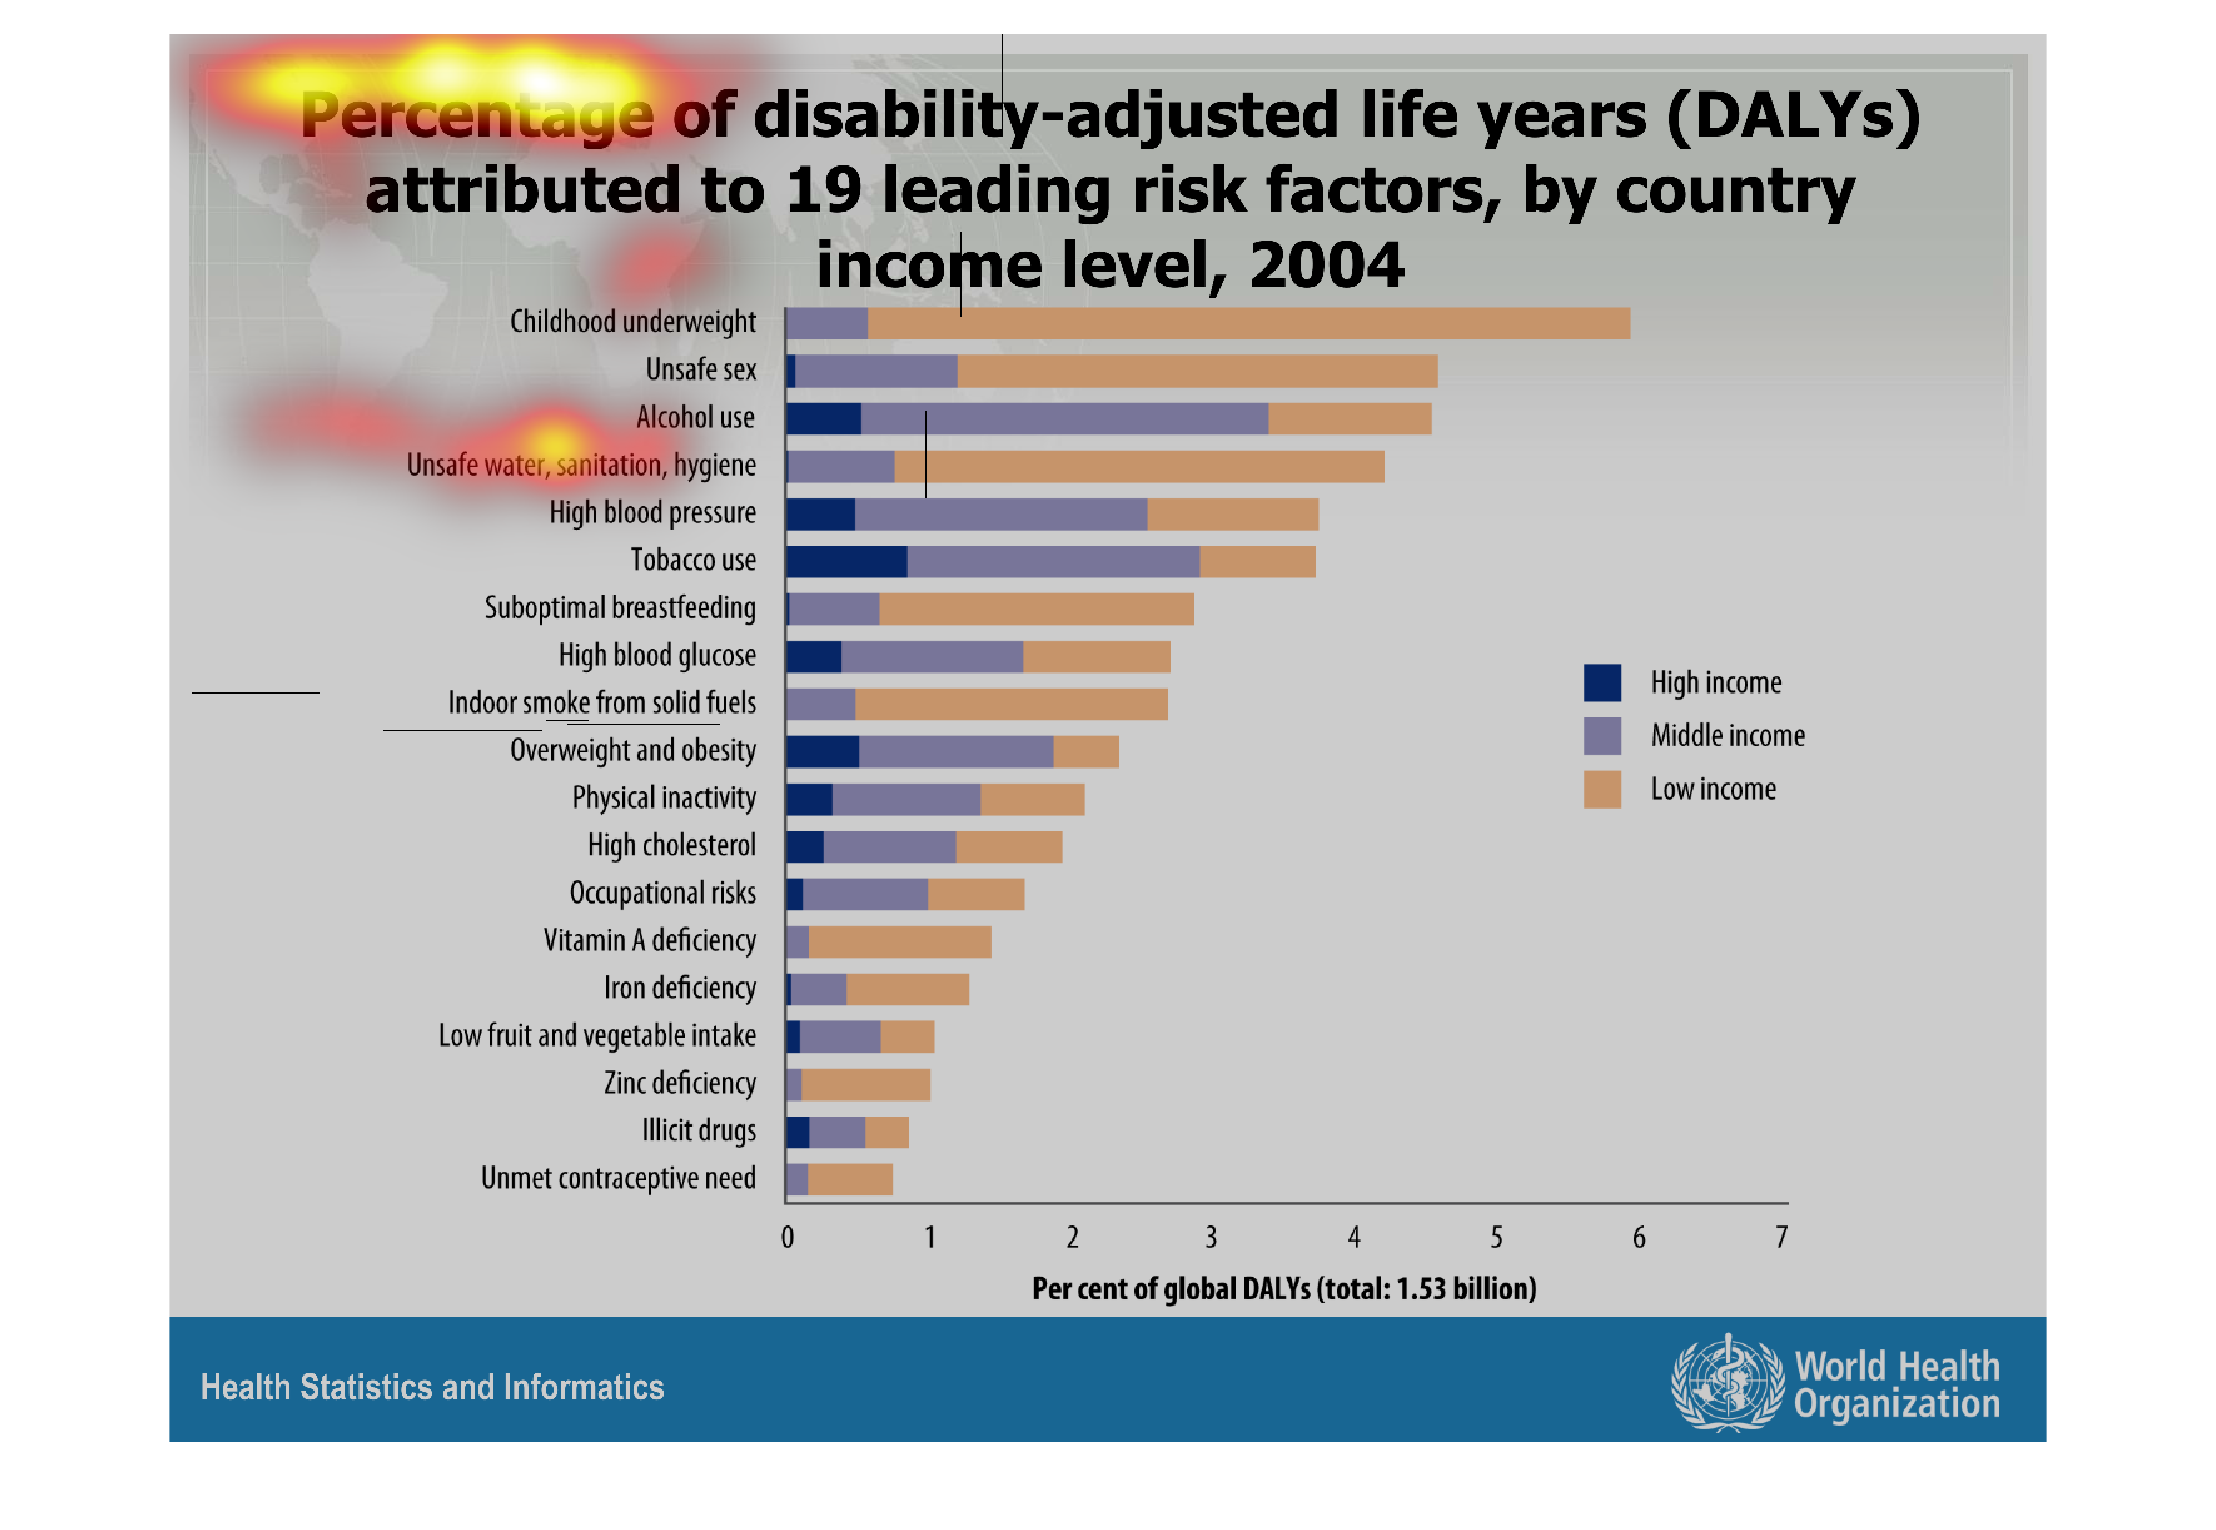
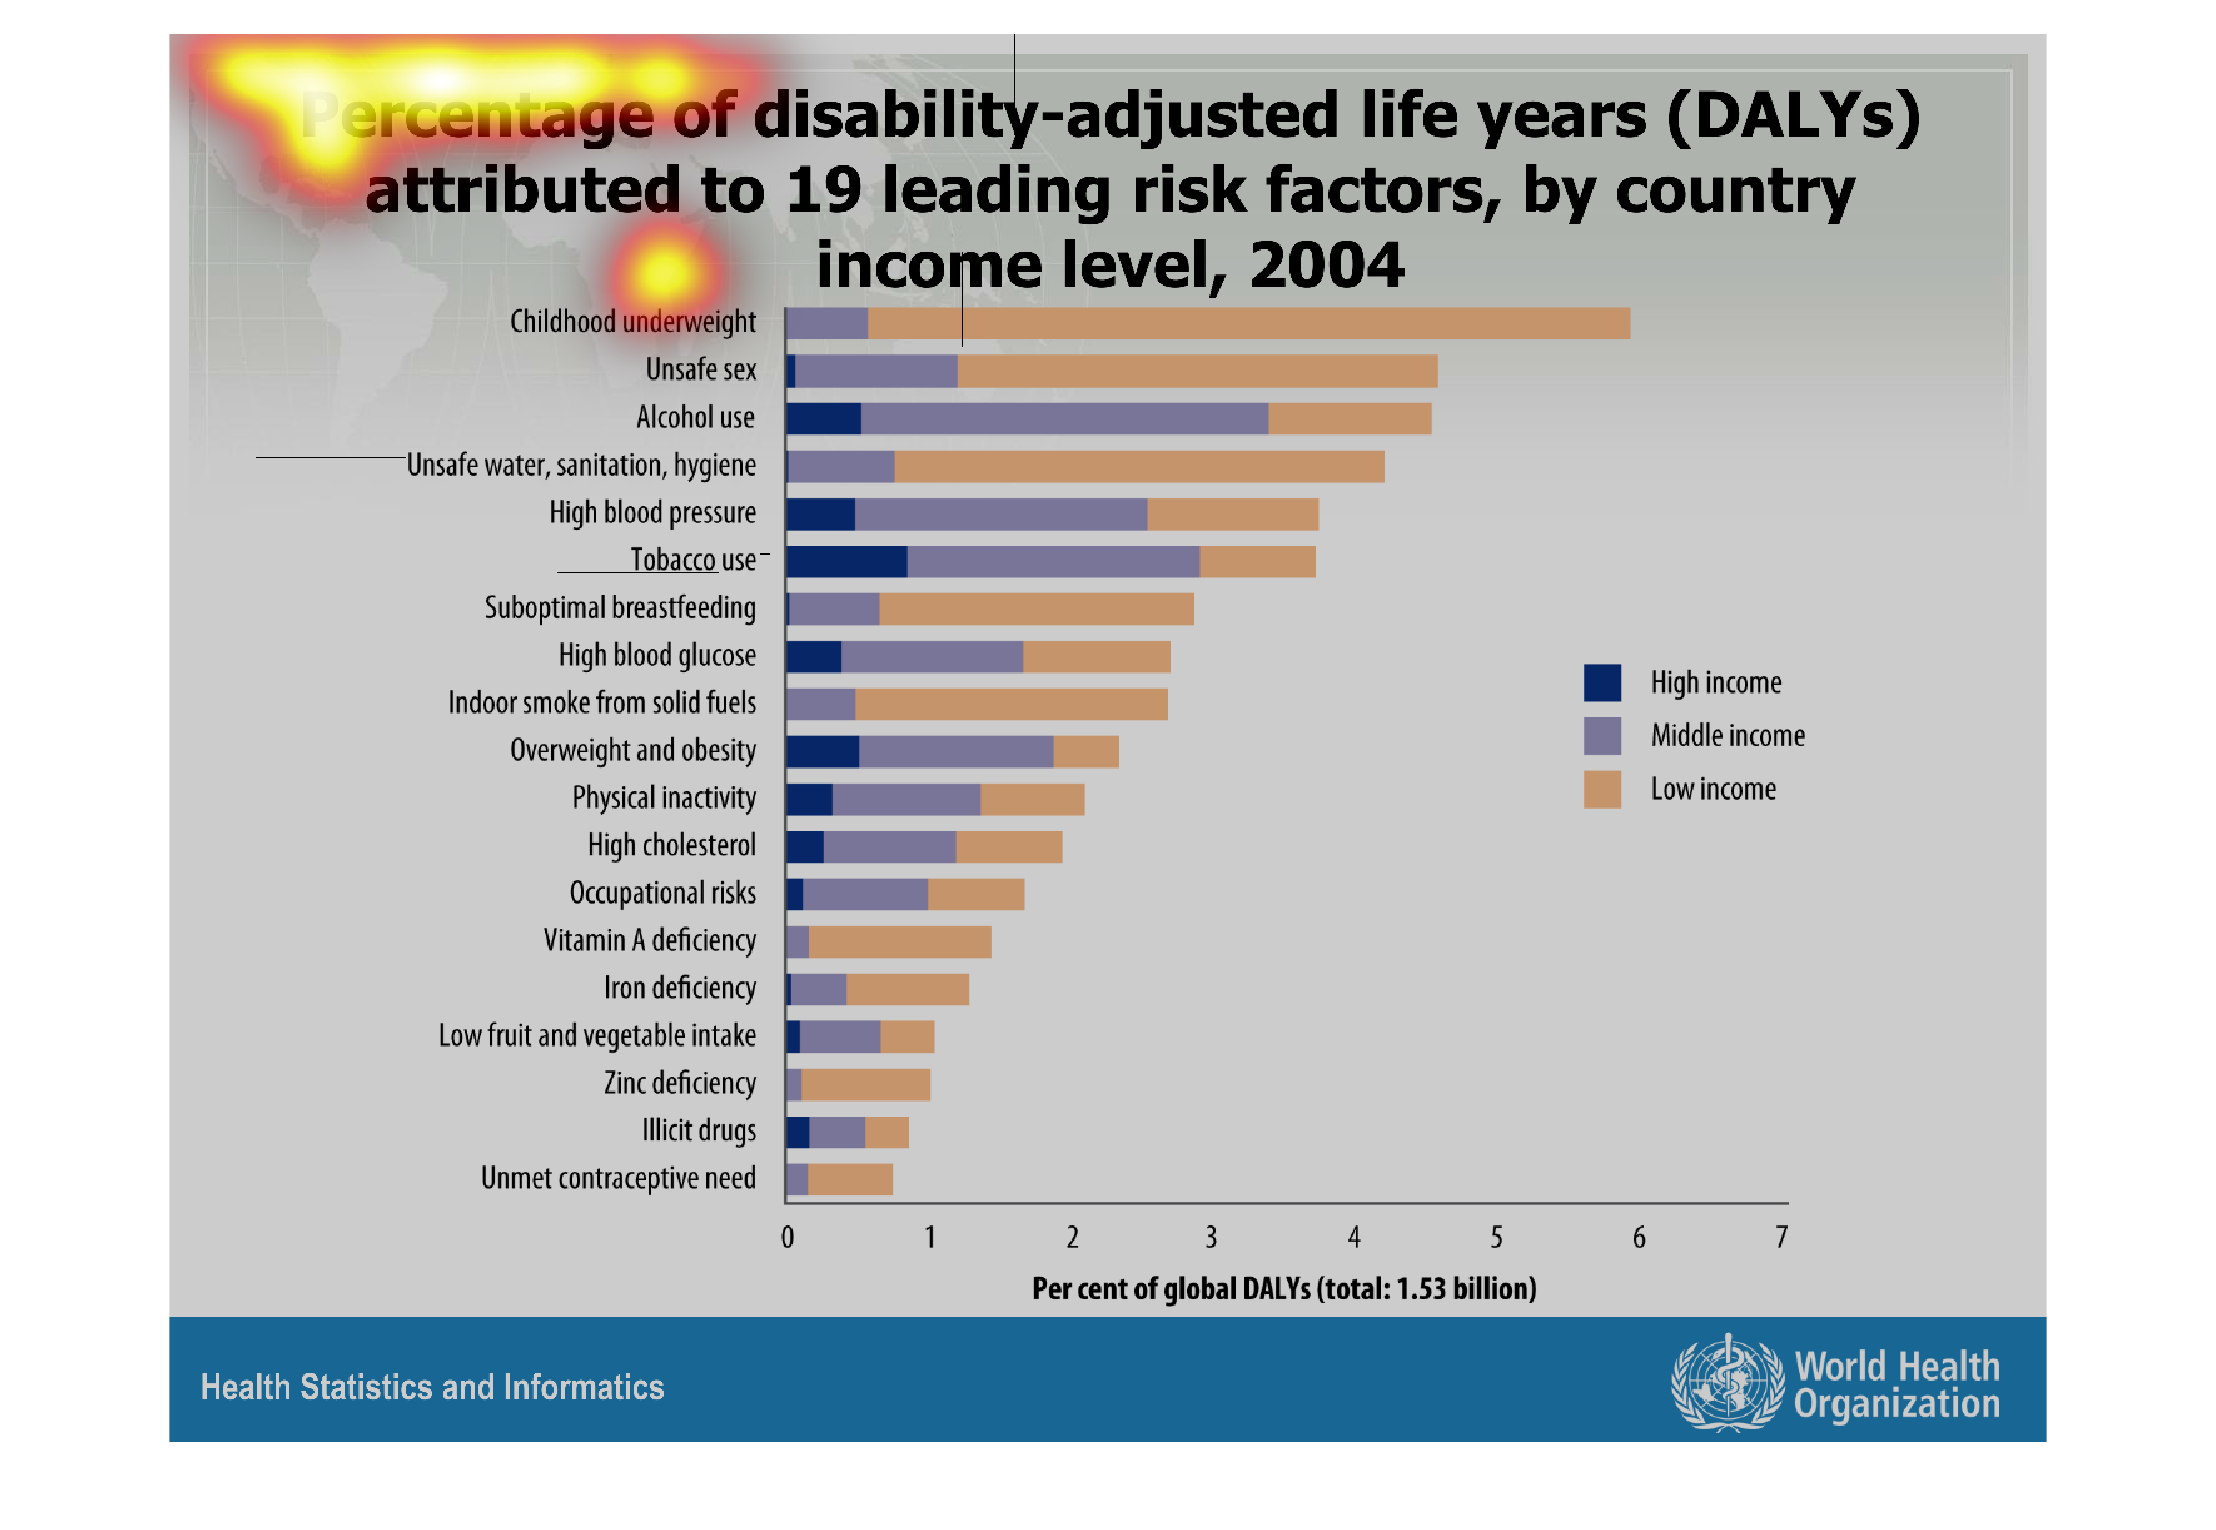
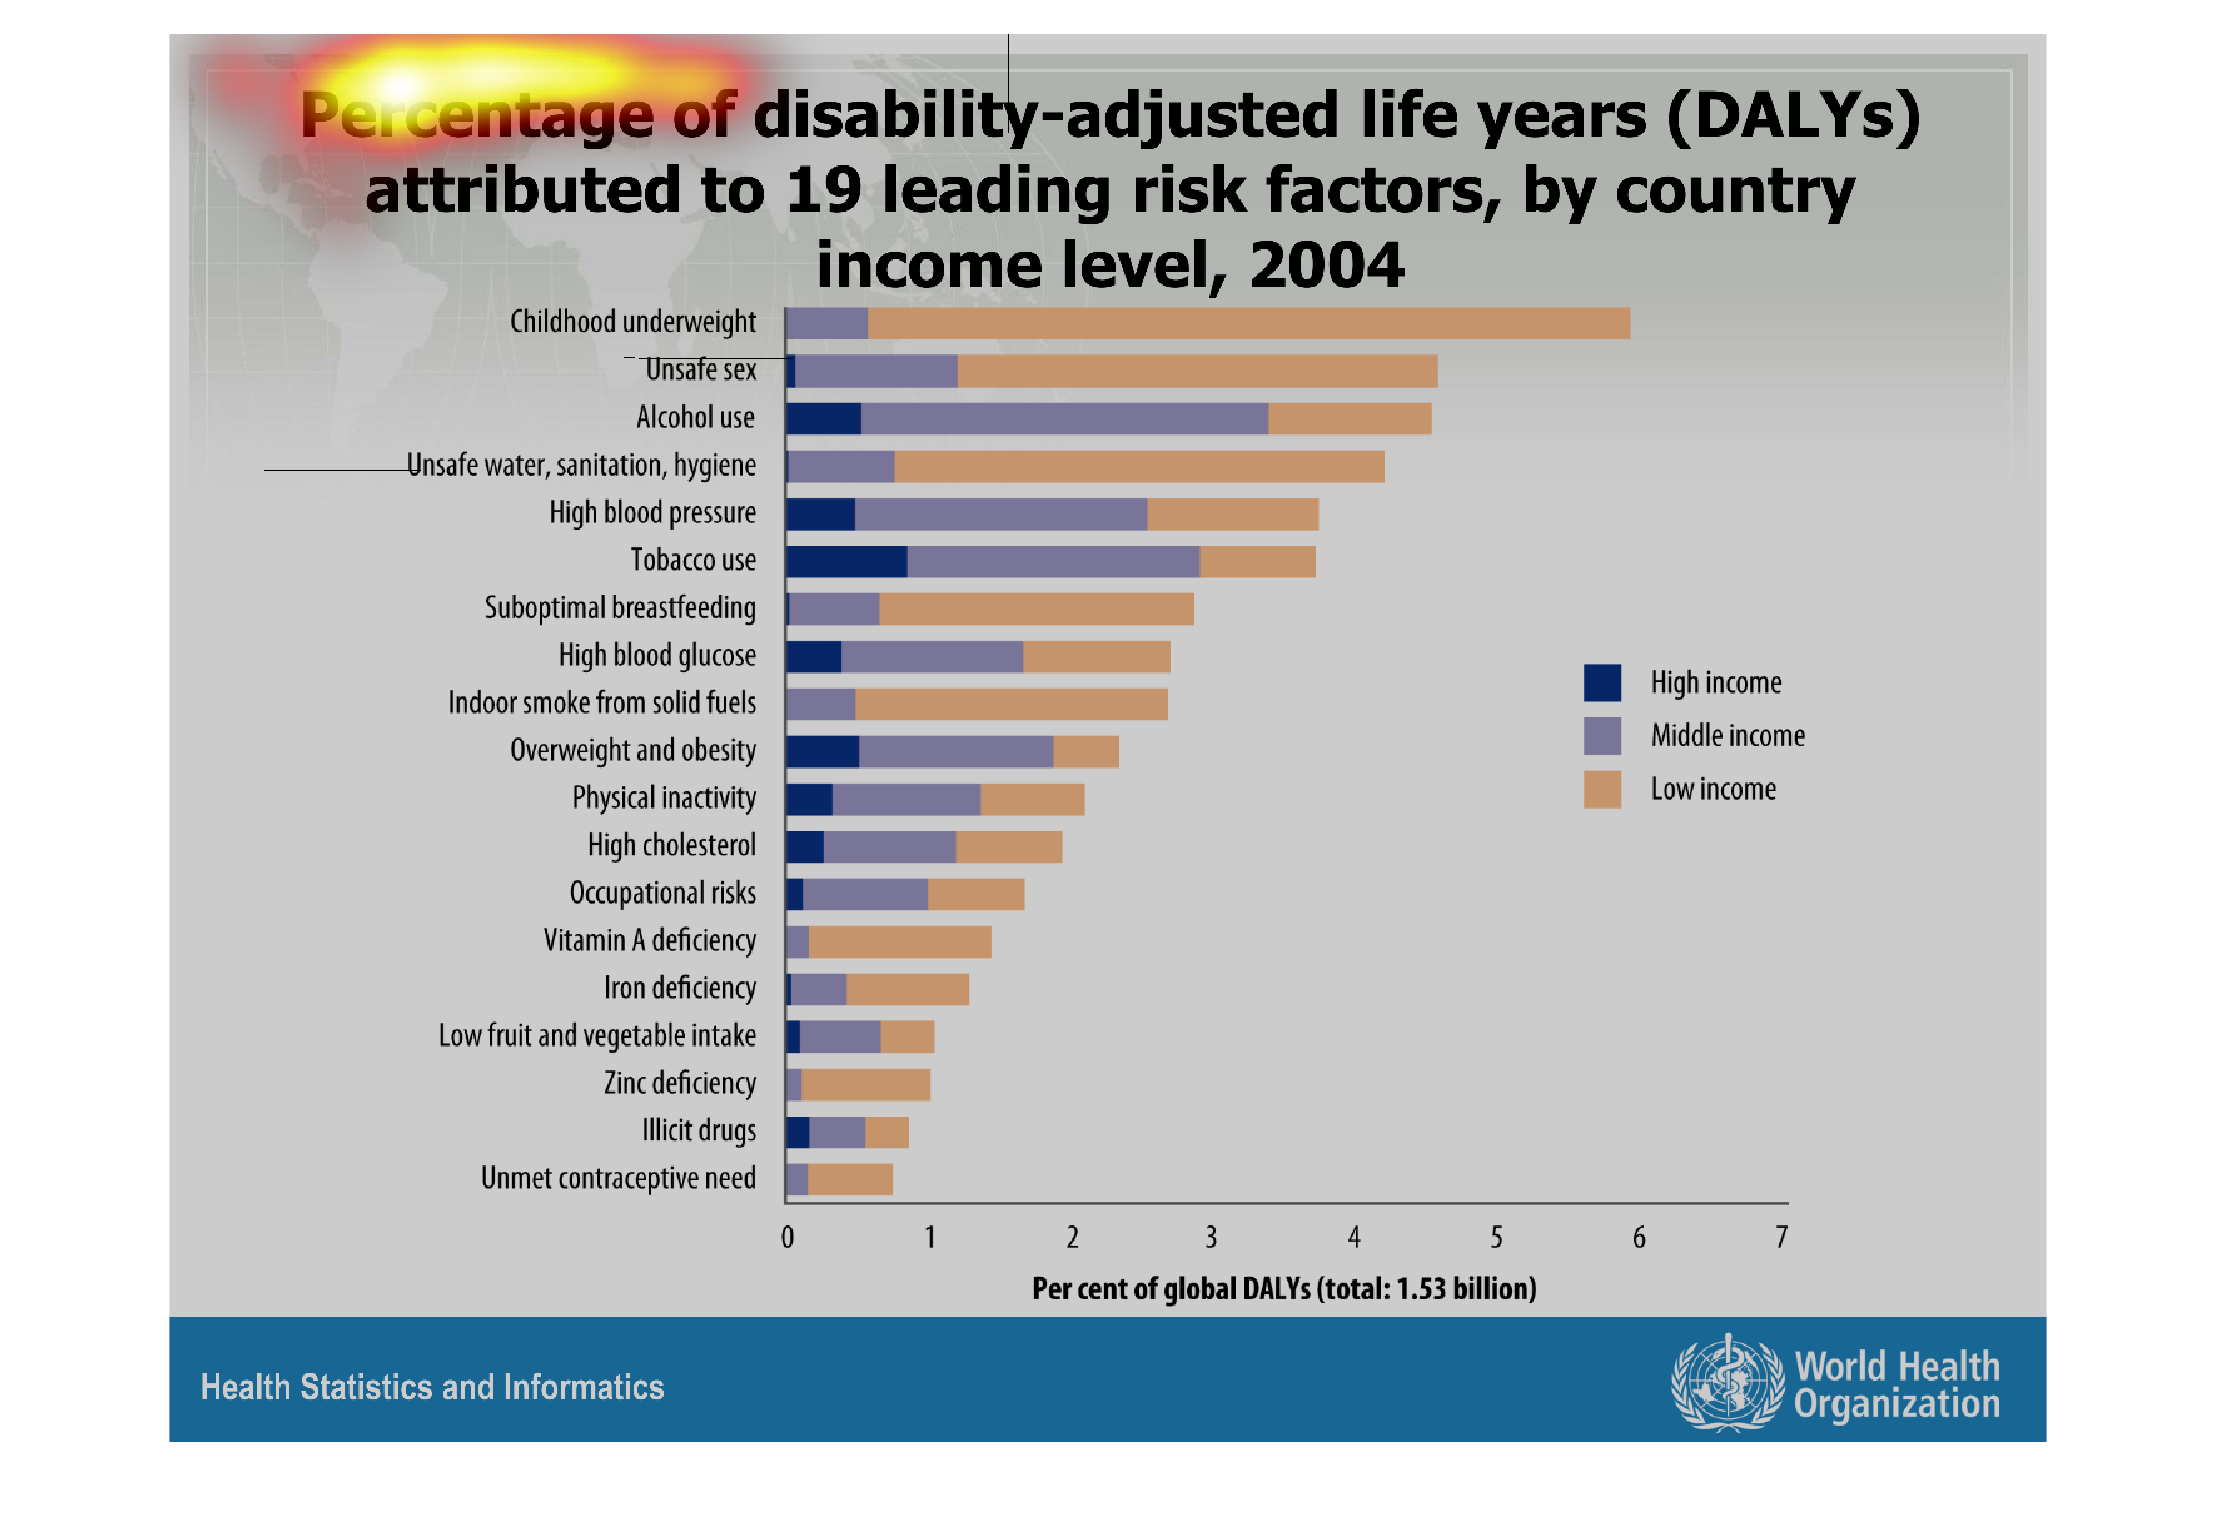
The graph represents the percentage of disability-adjusted life years (DALYs) attributed to
19 leading rist factors by country income level.  The graph is represented in colors by dark
blue as "High Income", light blue as "Middle income" and yellow/gold as "Low income".
Warning: Image is too big to fit on screen; displaying at 67%
Warning: Image is too big to fit on screen; displaying at 67%

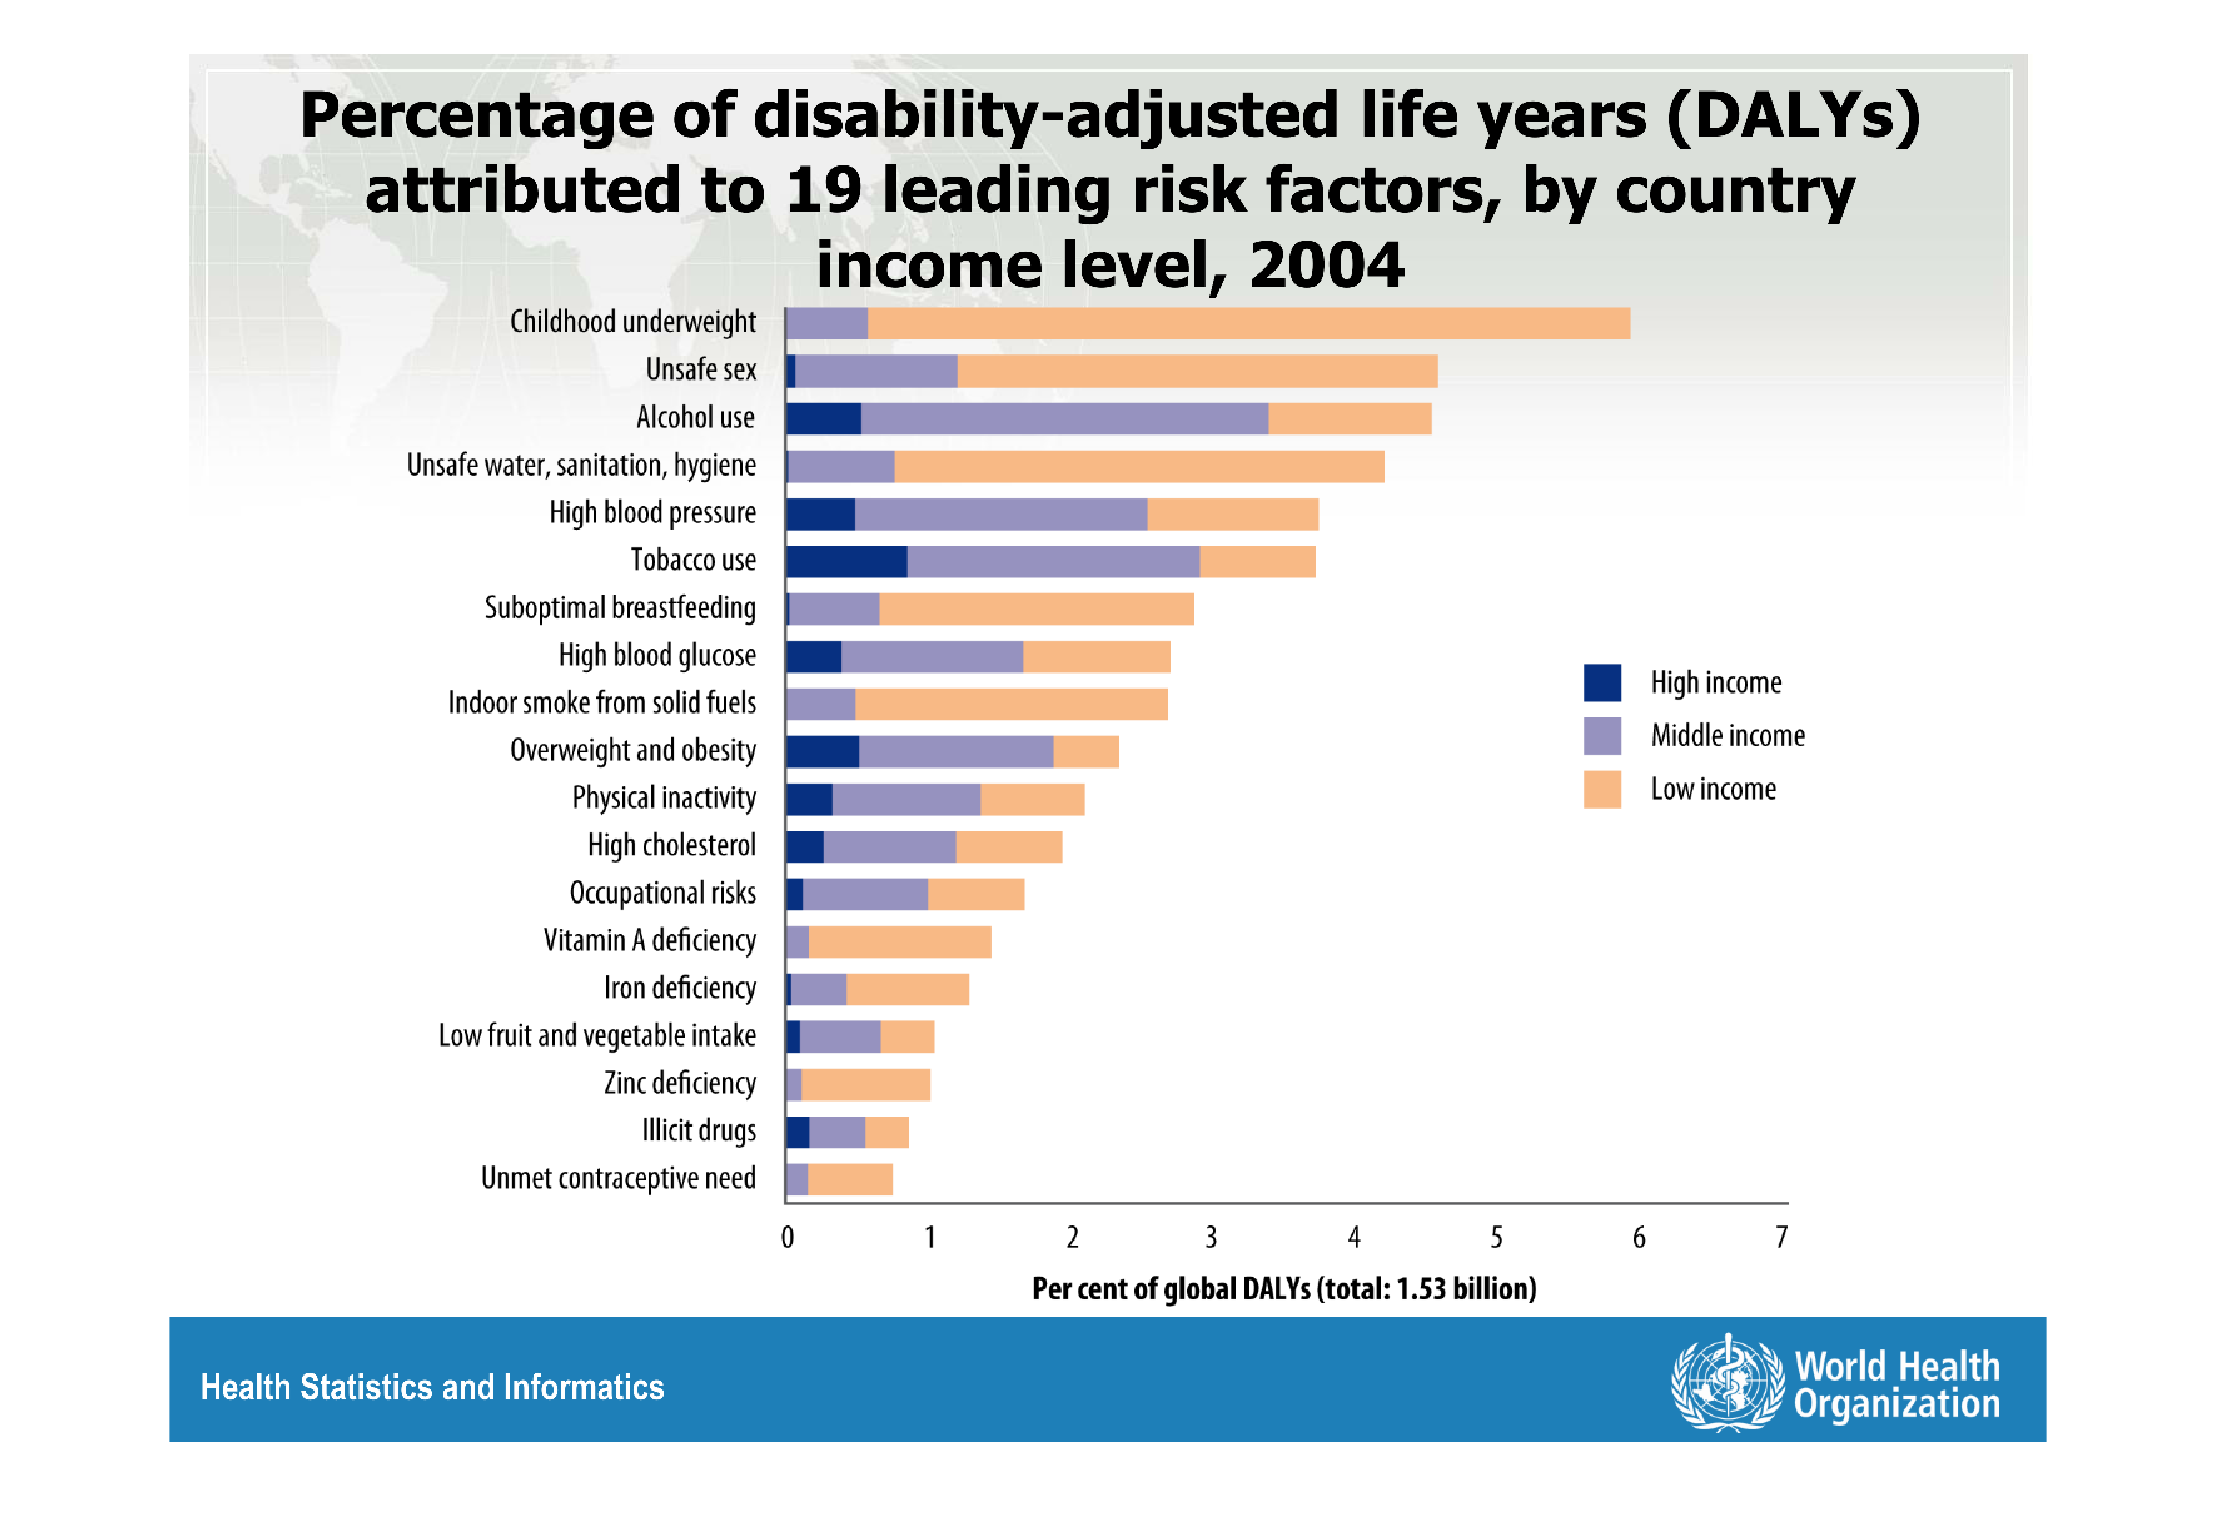
This is a graph of the percentage disability adjusted life years attributed to 19 leading
risk factors by country. The greatest risk factor being underweight in childhood, while the
least risk factor was illicit drugs.
Warning: Image is too big to fit on screen; displaying at 67%
Warning: Image is too big to fit on screen; displaying at 67%
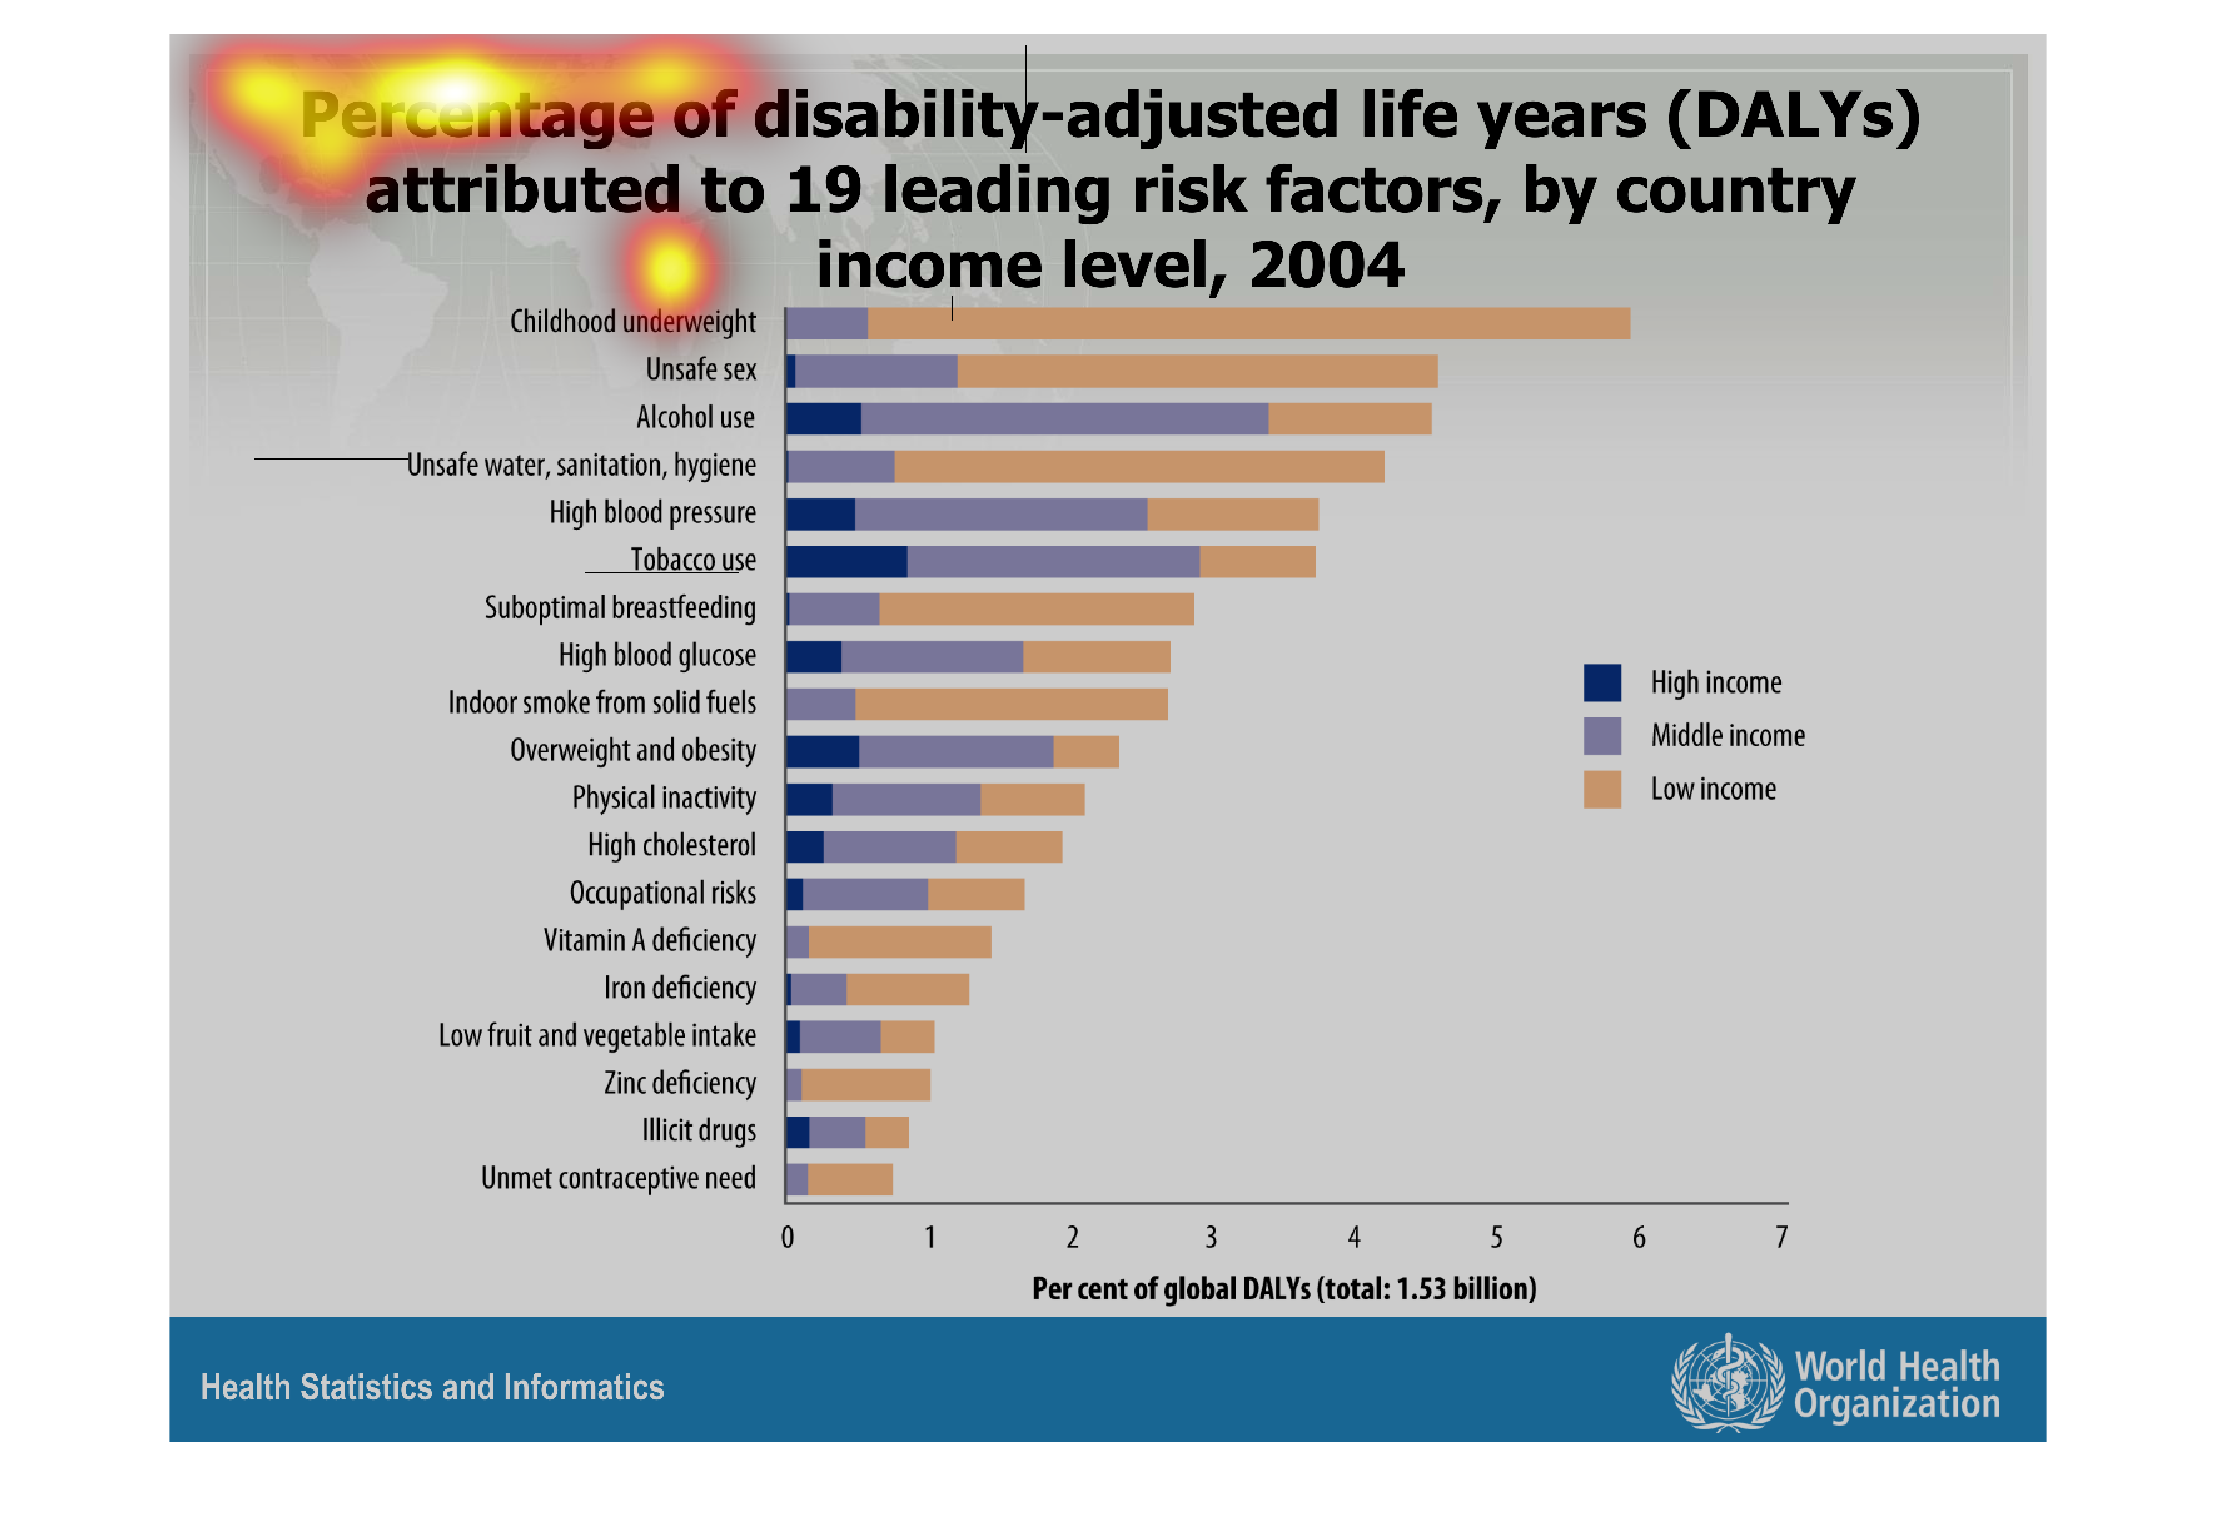
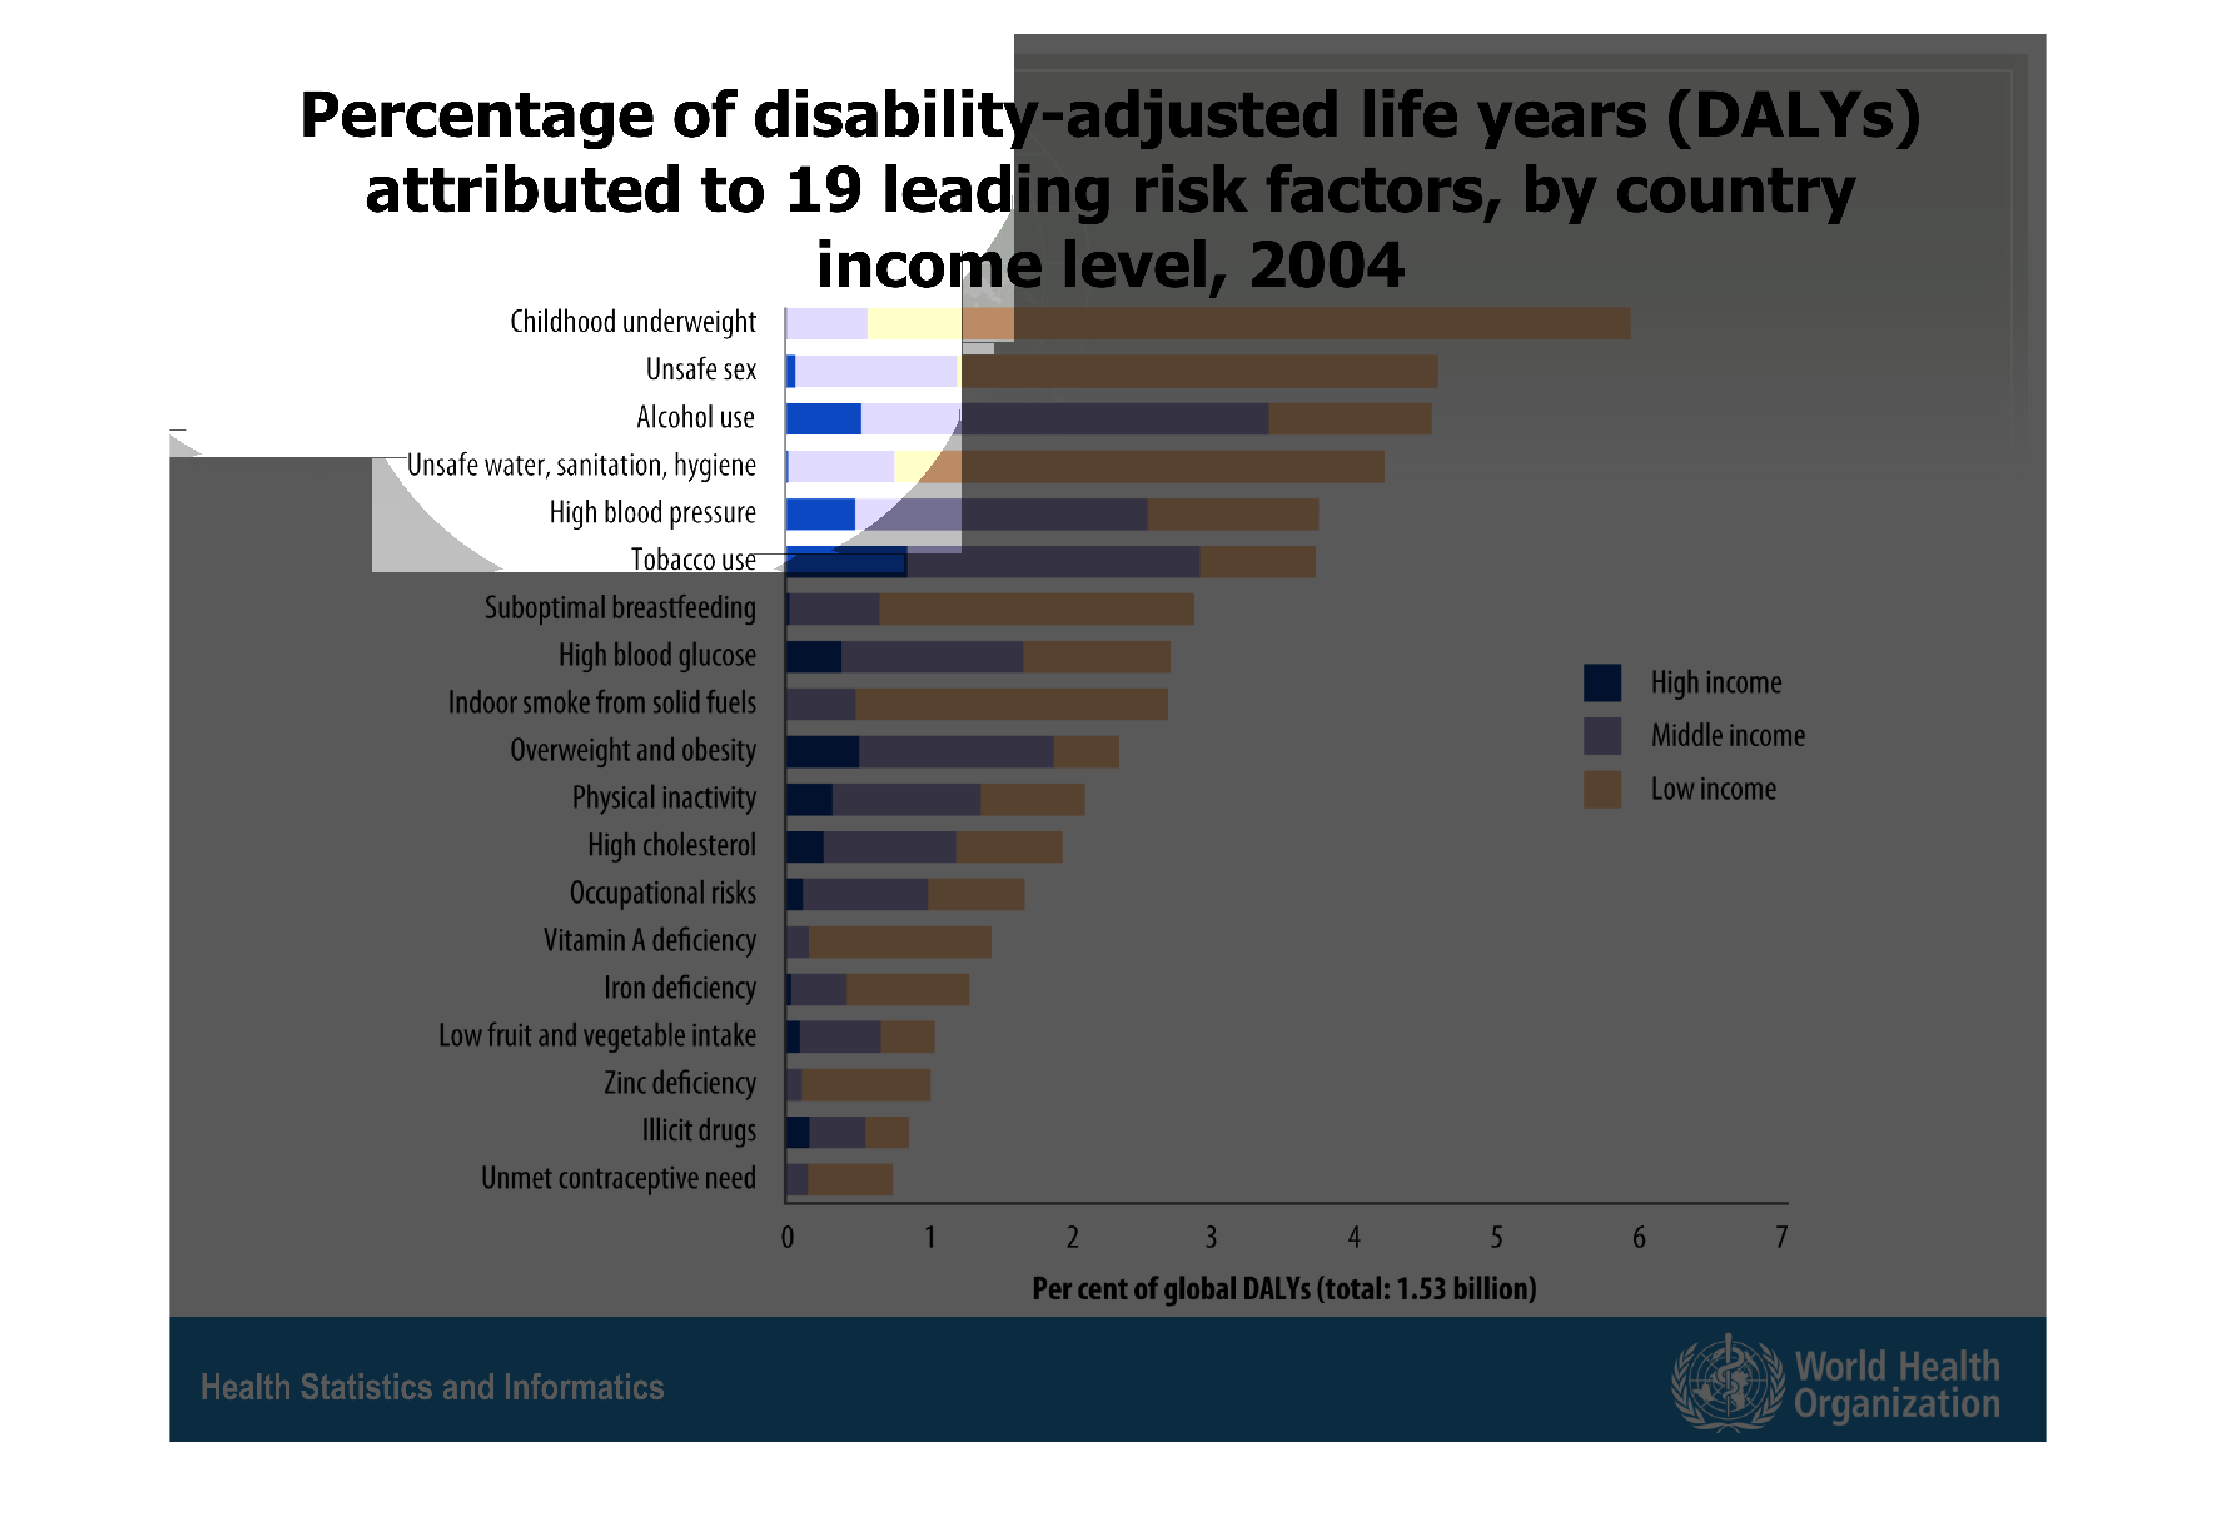
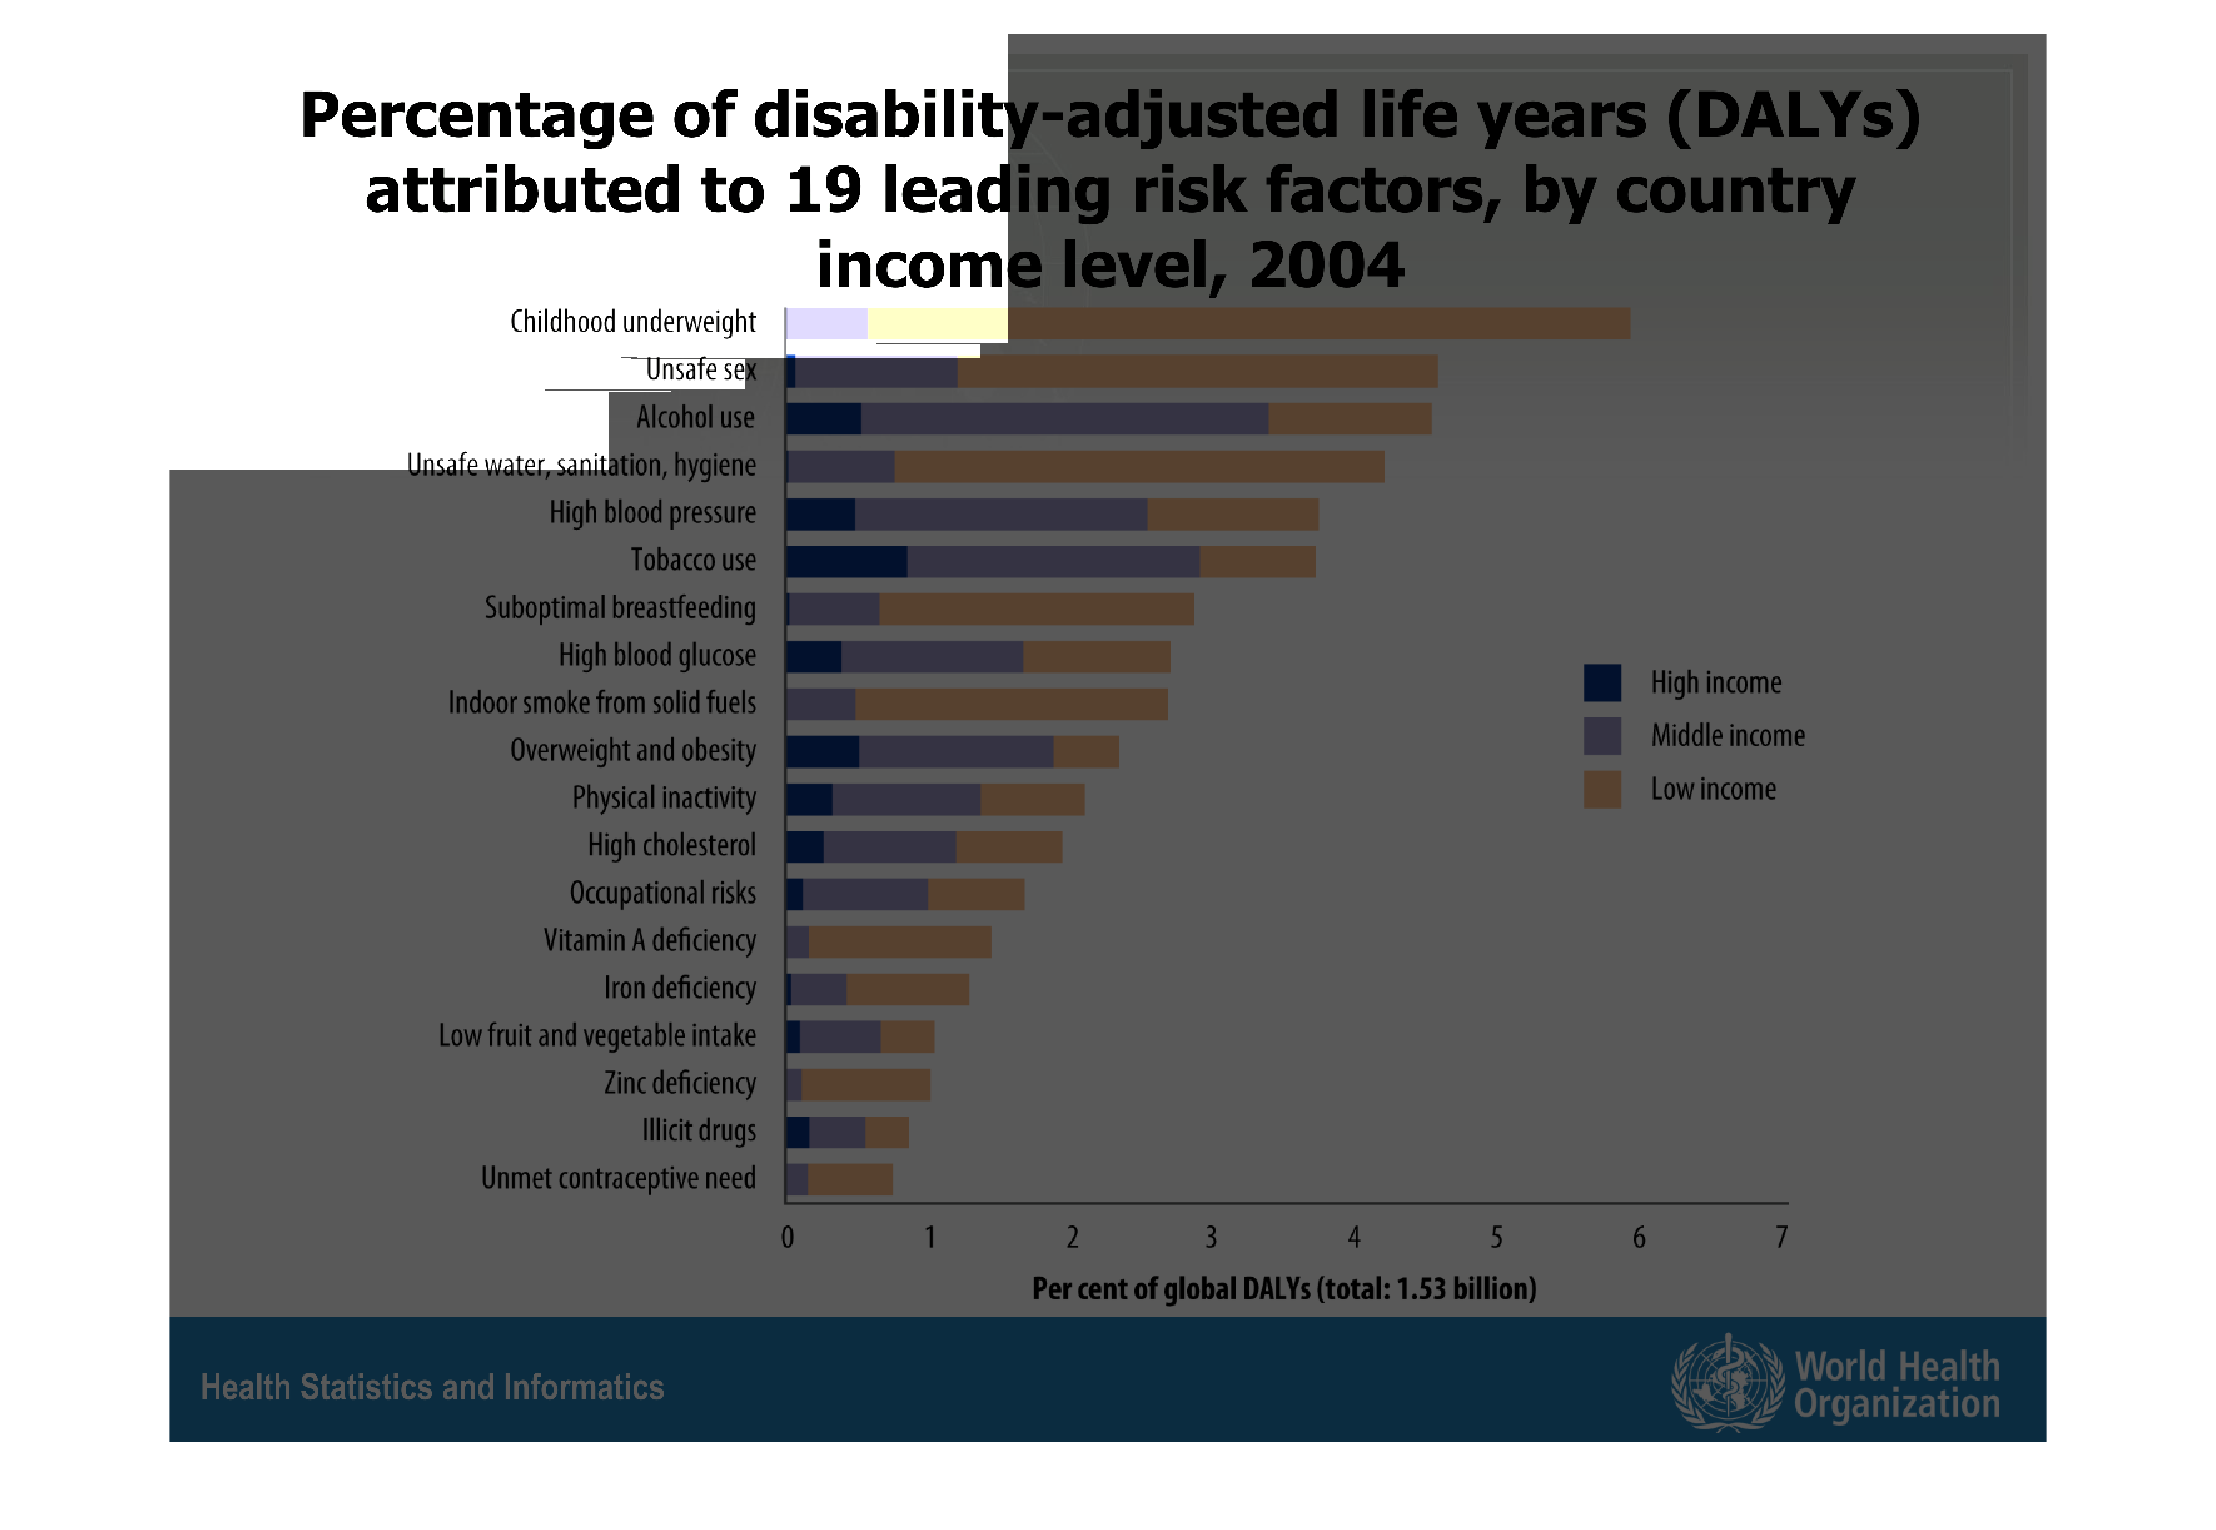
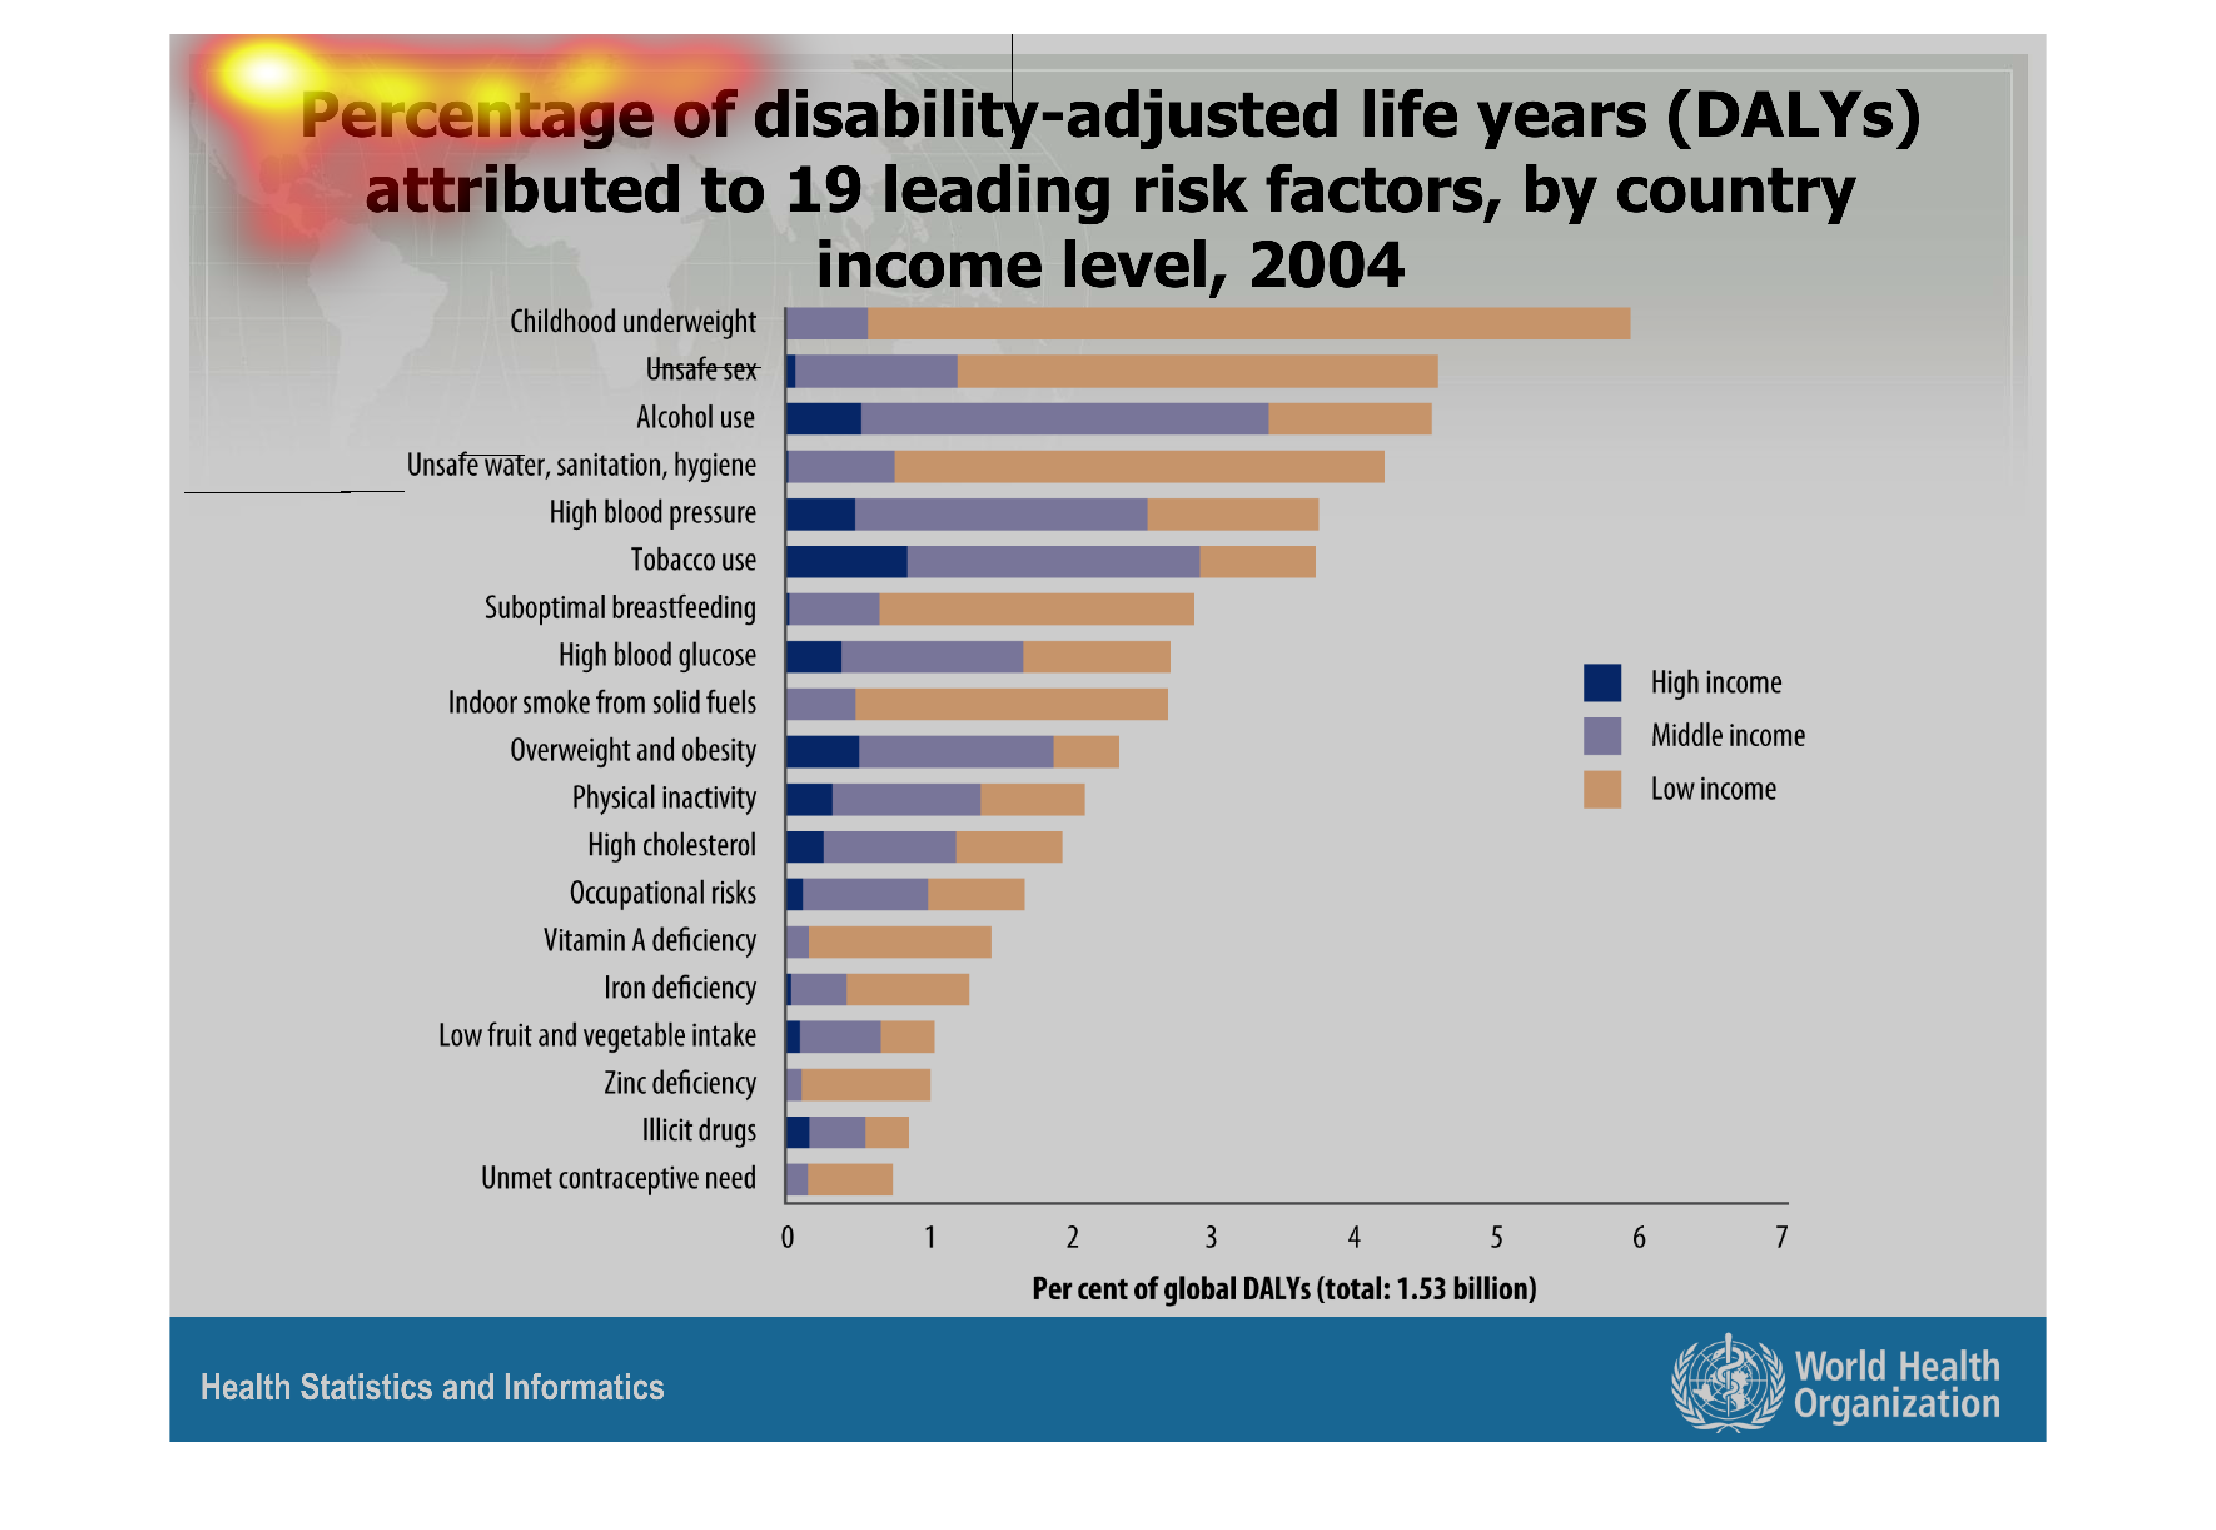
The graph shows the relationship between the global percentage of disabilty-age life-years,
to the 19 most risky factors among lower-upper class individuals. Childhood obesity, affecting
the lower income families, tops the chart for adjusted life years, while the Contraception
need is bringing up the rear with less than 1 adjusted life year.  Generally, the lower income/class
have the major percentage; the middle and upper class are respectively lower percentages.
Warning: Image is too big to fit on screen; displaying at 67%
Warning: Image is too big to fit on screen; displaying at 67%
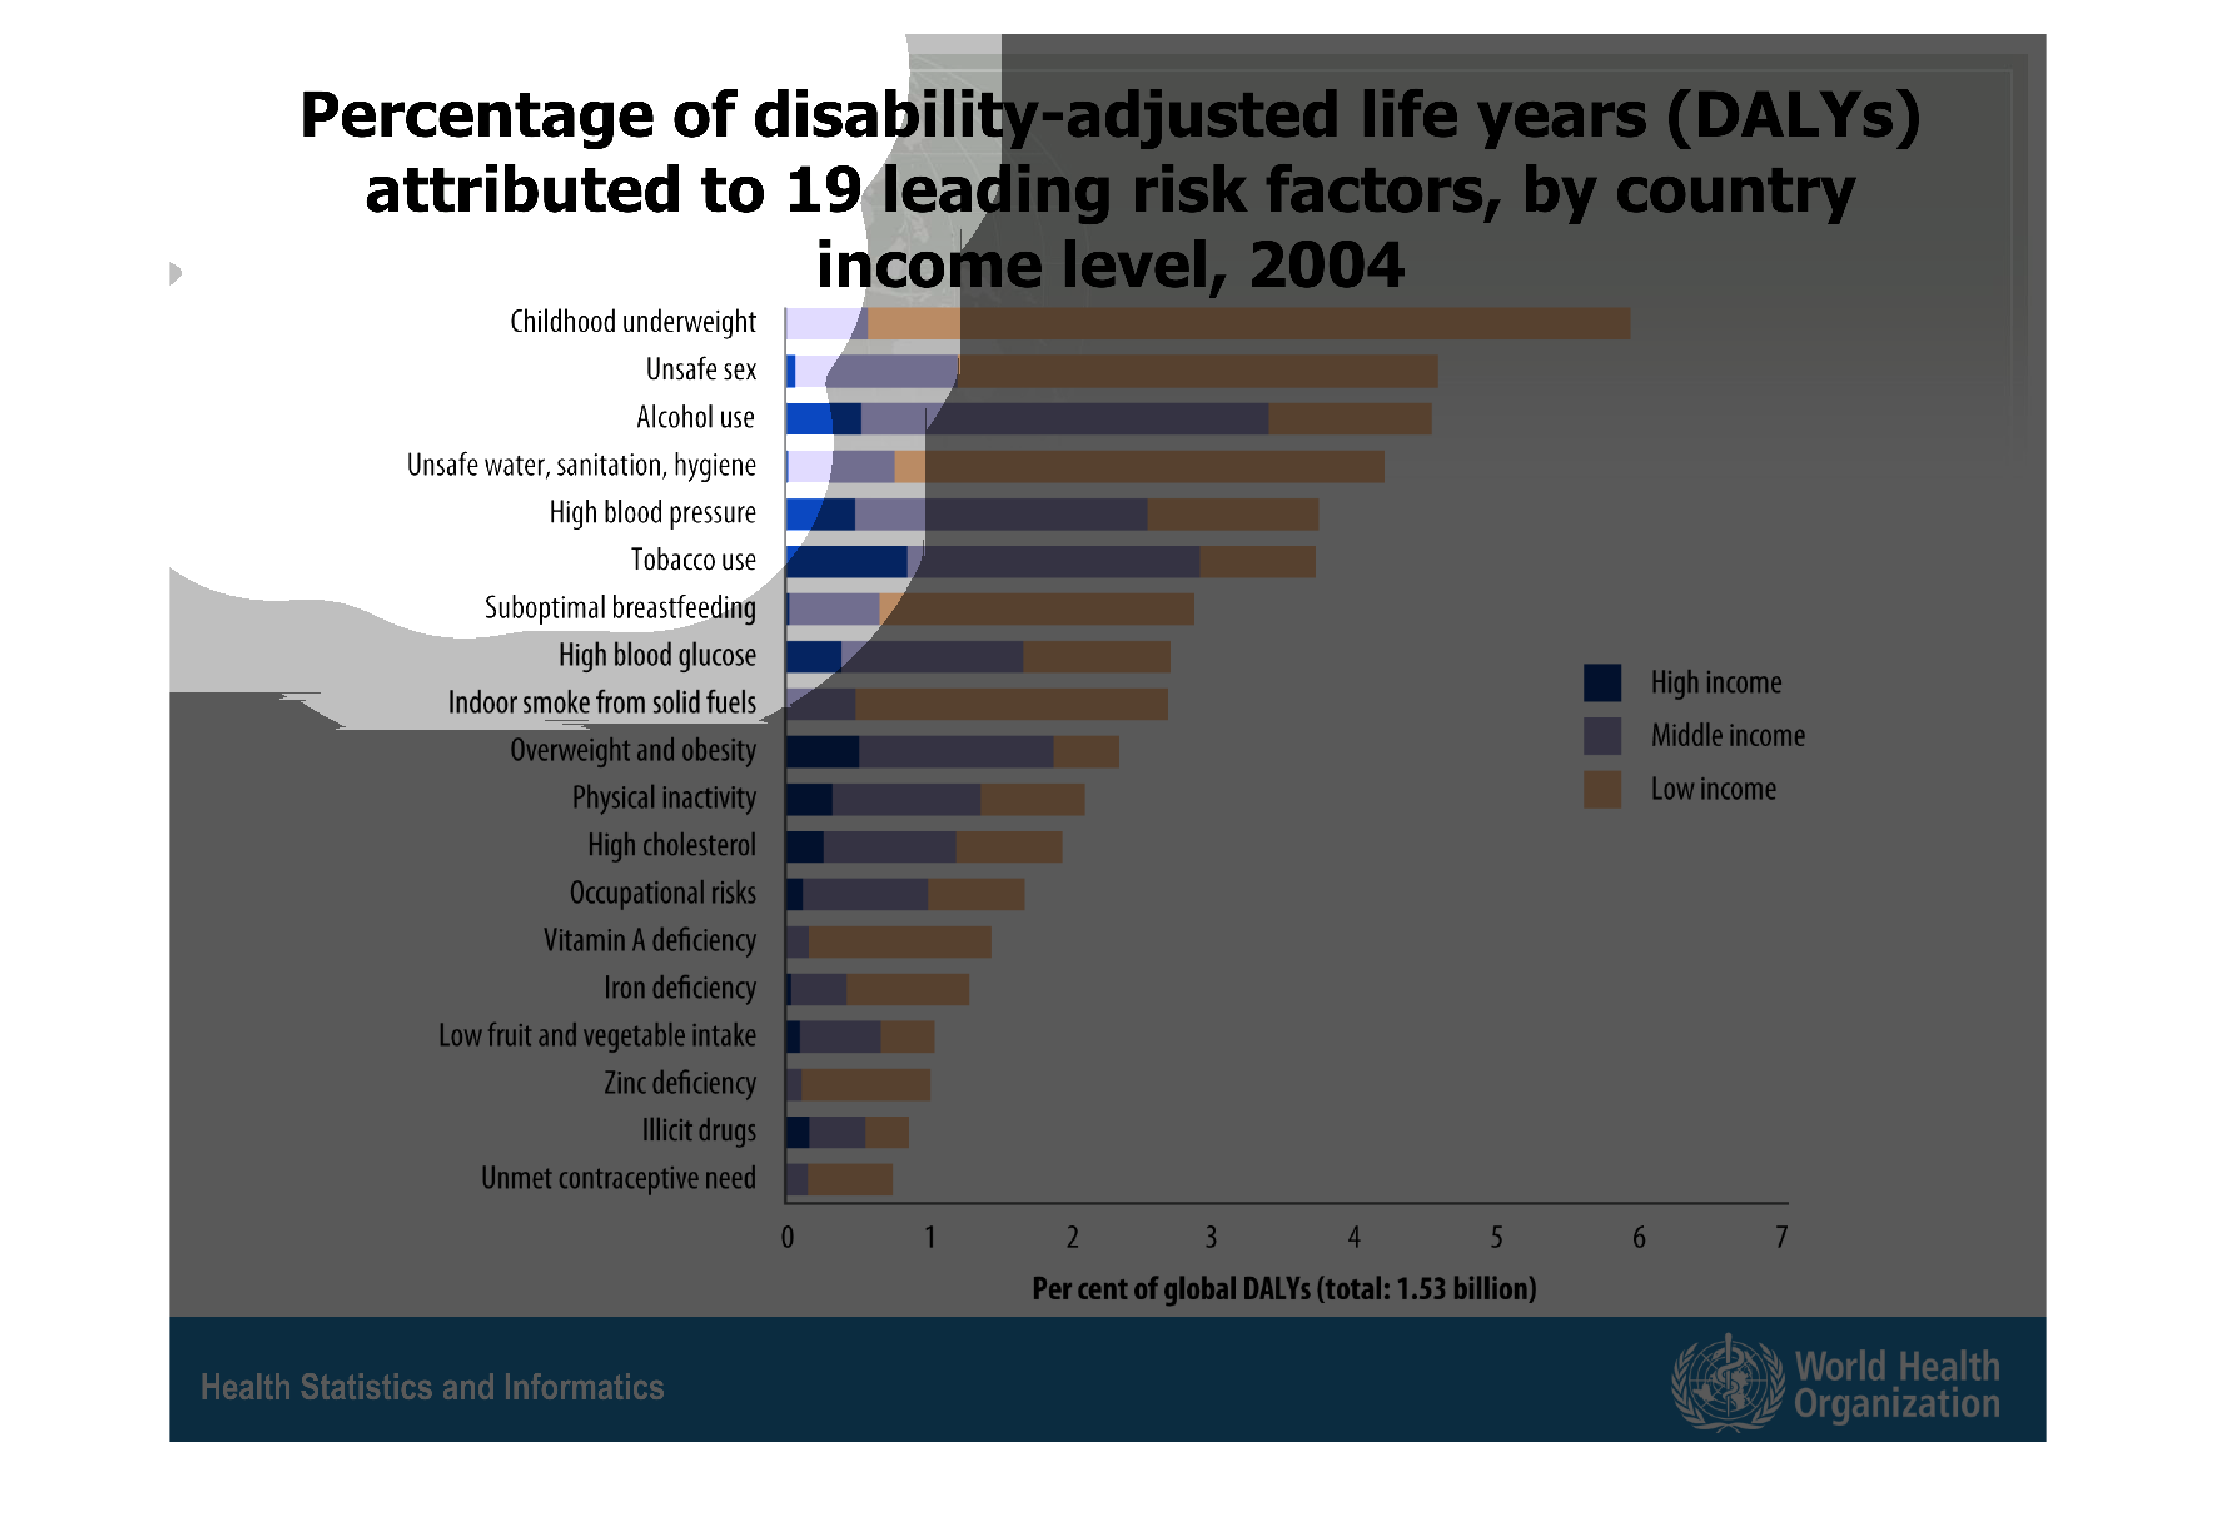
A graph showing how different attributes and life decisions affect your life-span. Many low
income people suffer from being malnutrition during childhood. Unsafe sex also leads to disabilities.
Warning: Image is too big to fit on screen; displaying at 67%
Warning: Image is too big to fit on screen; displaying at 67%
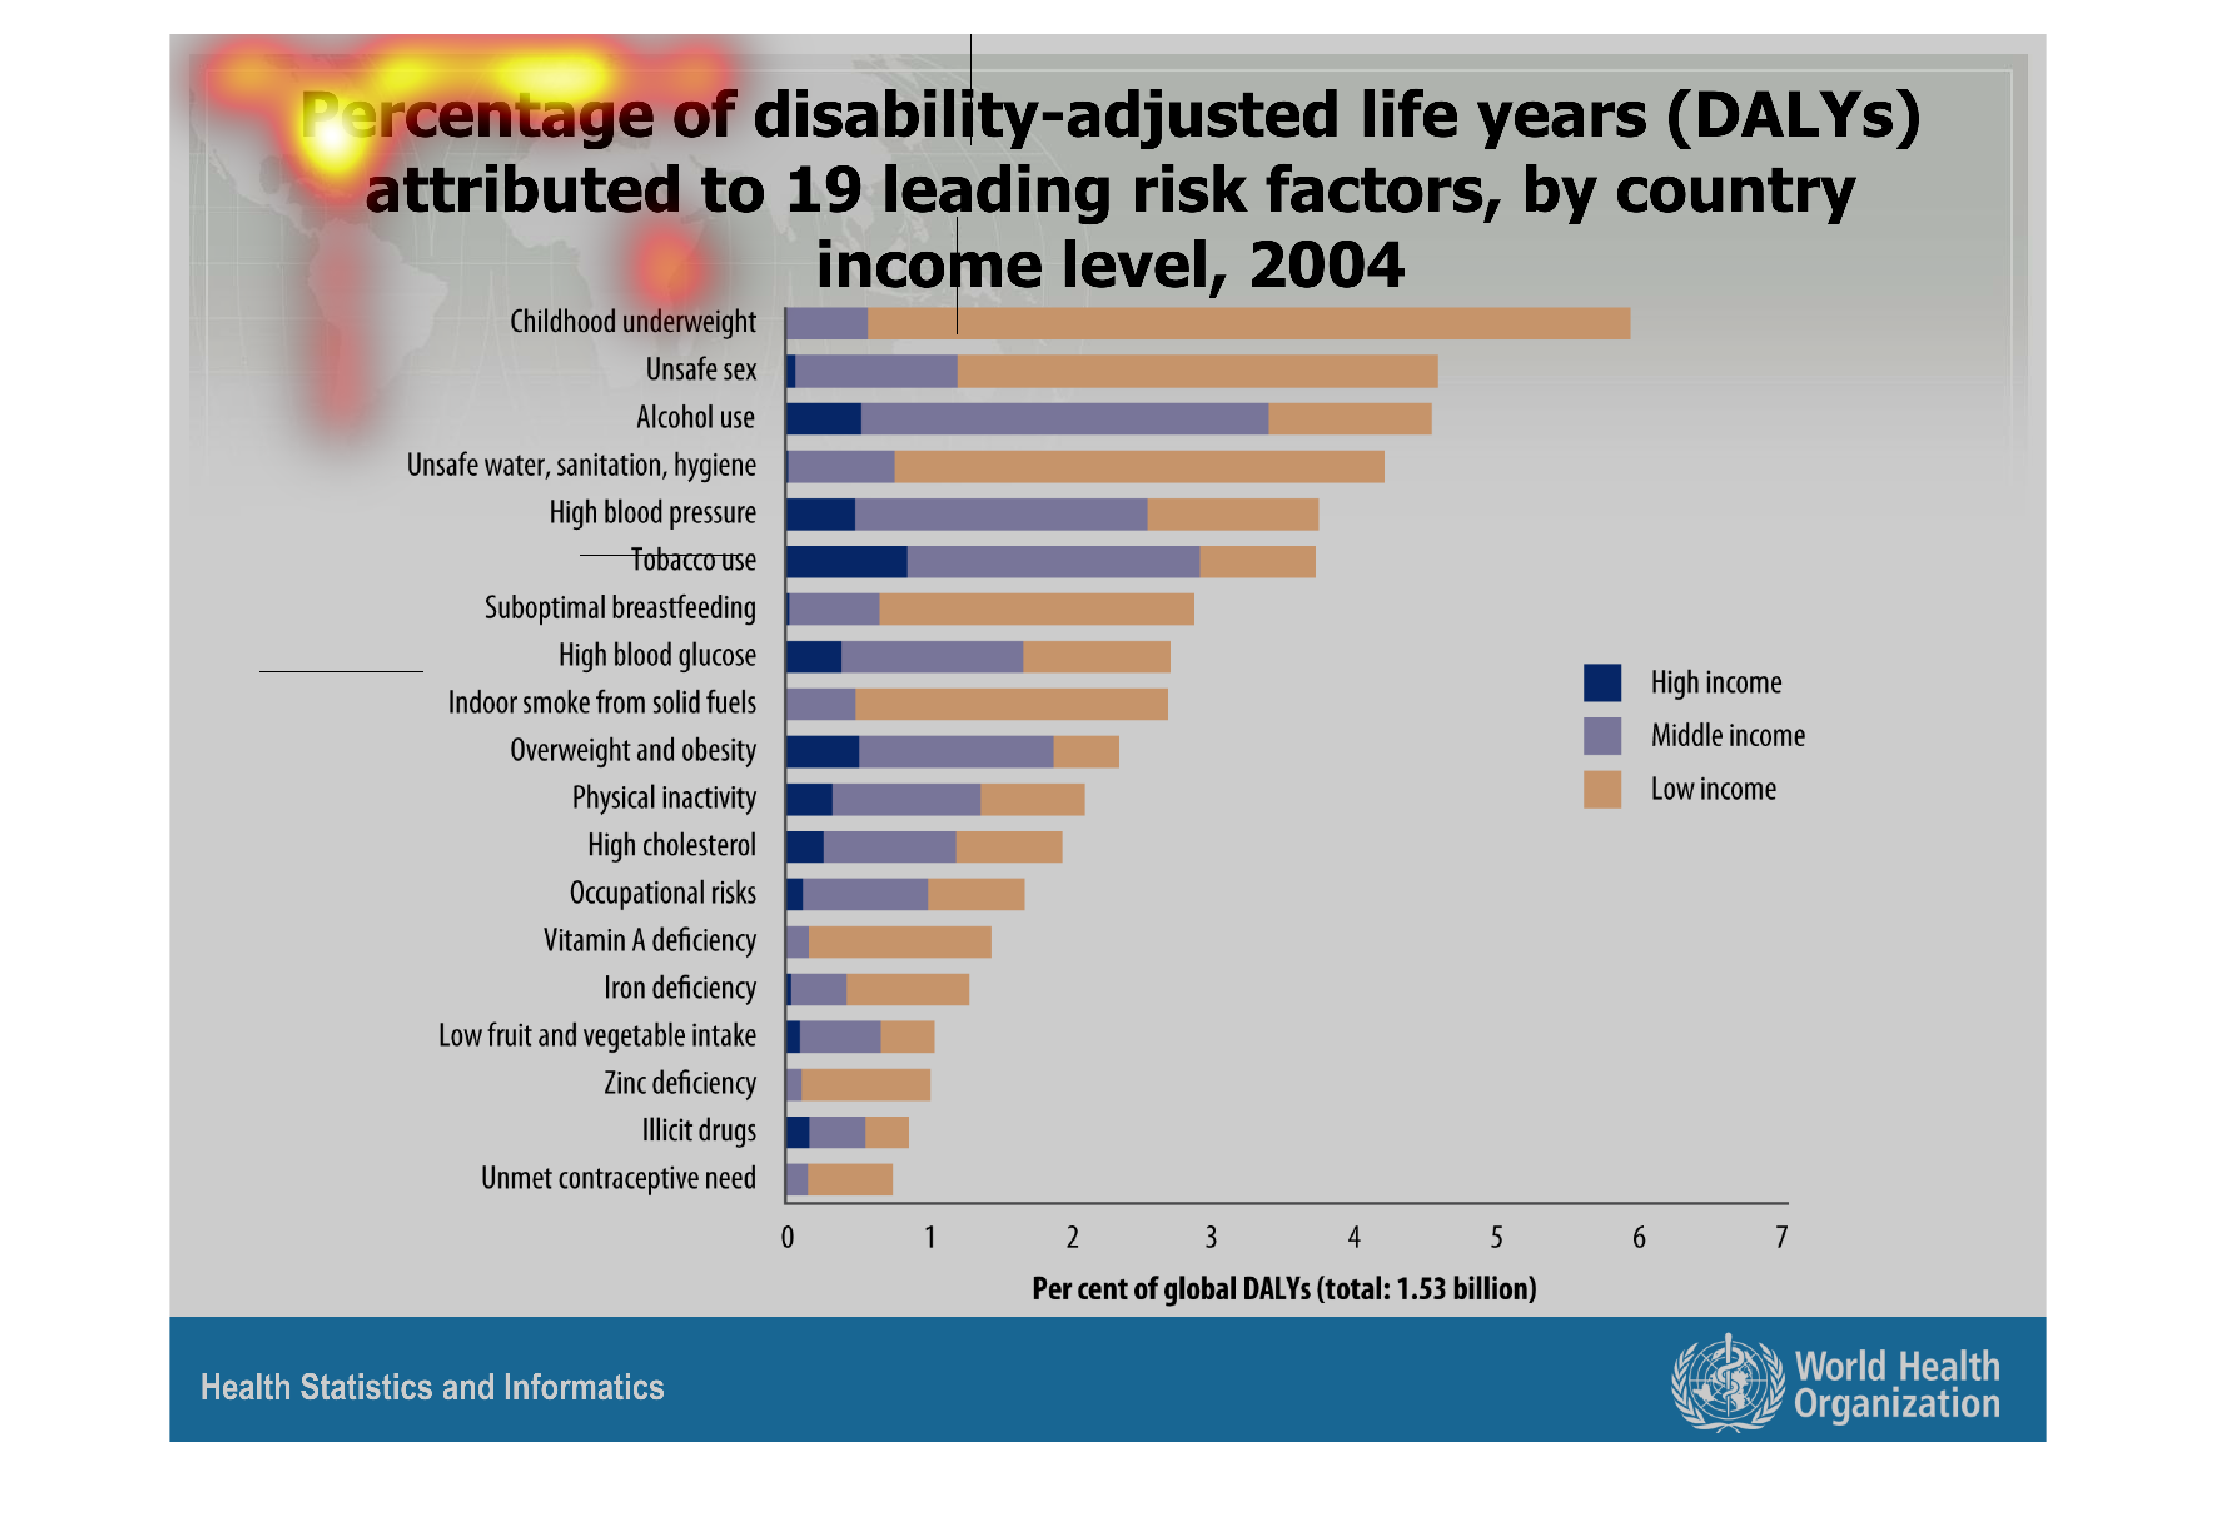
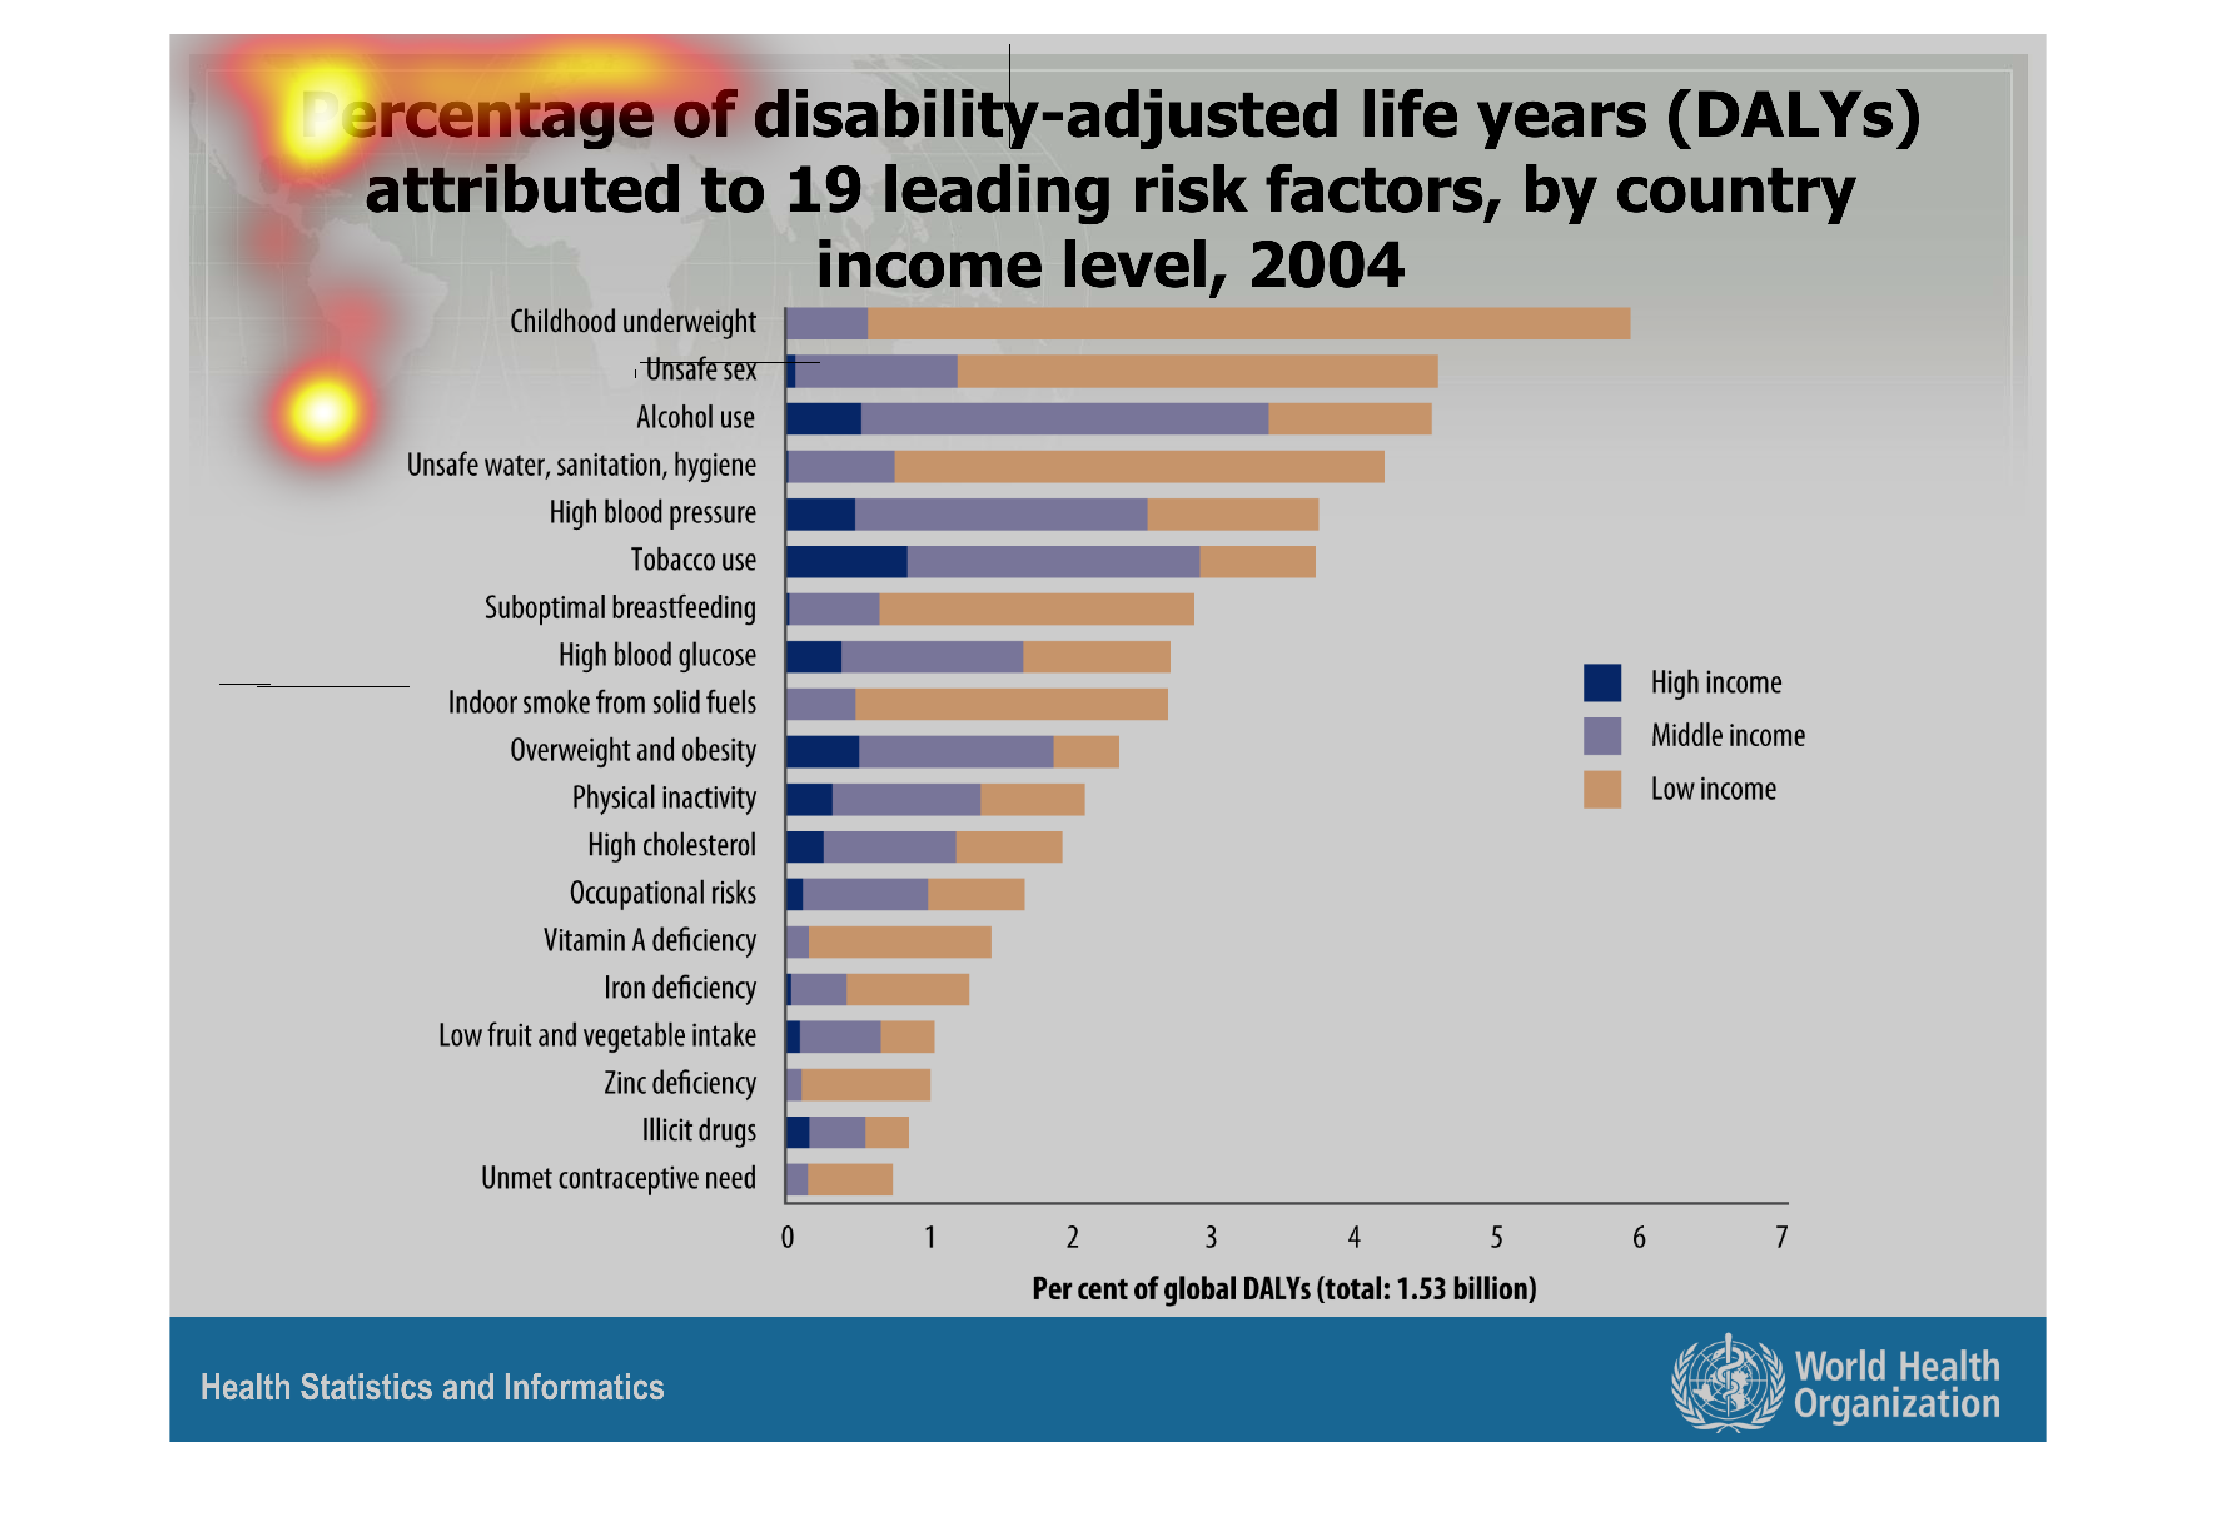
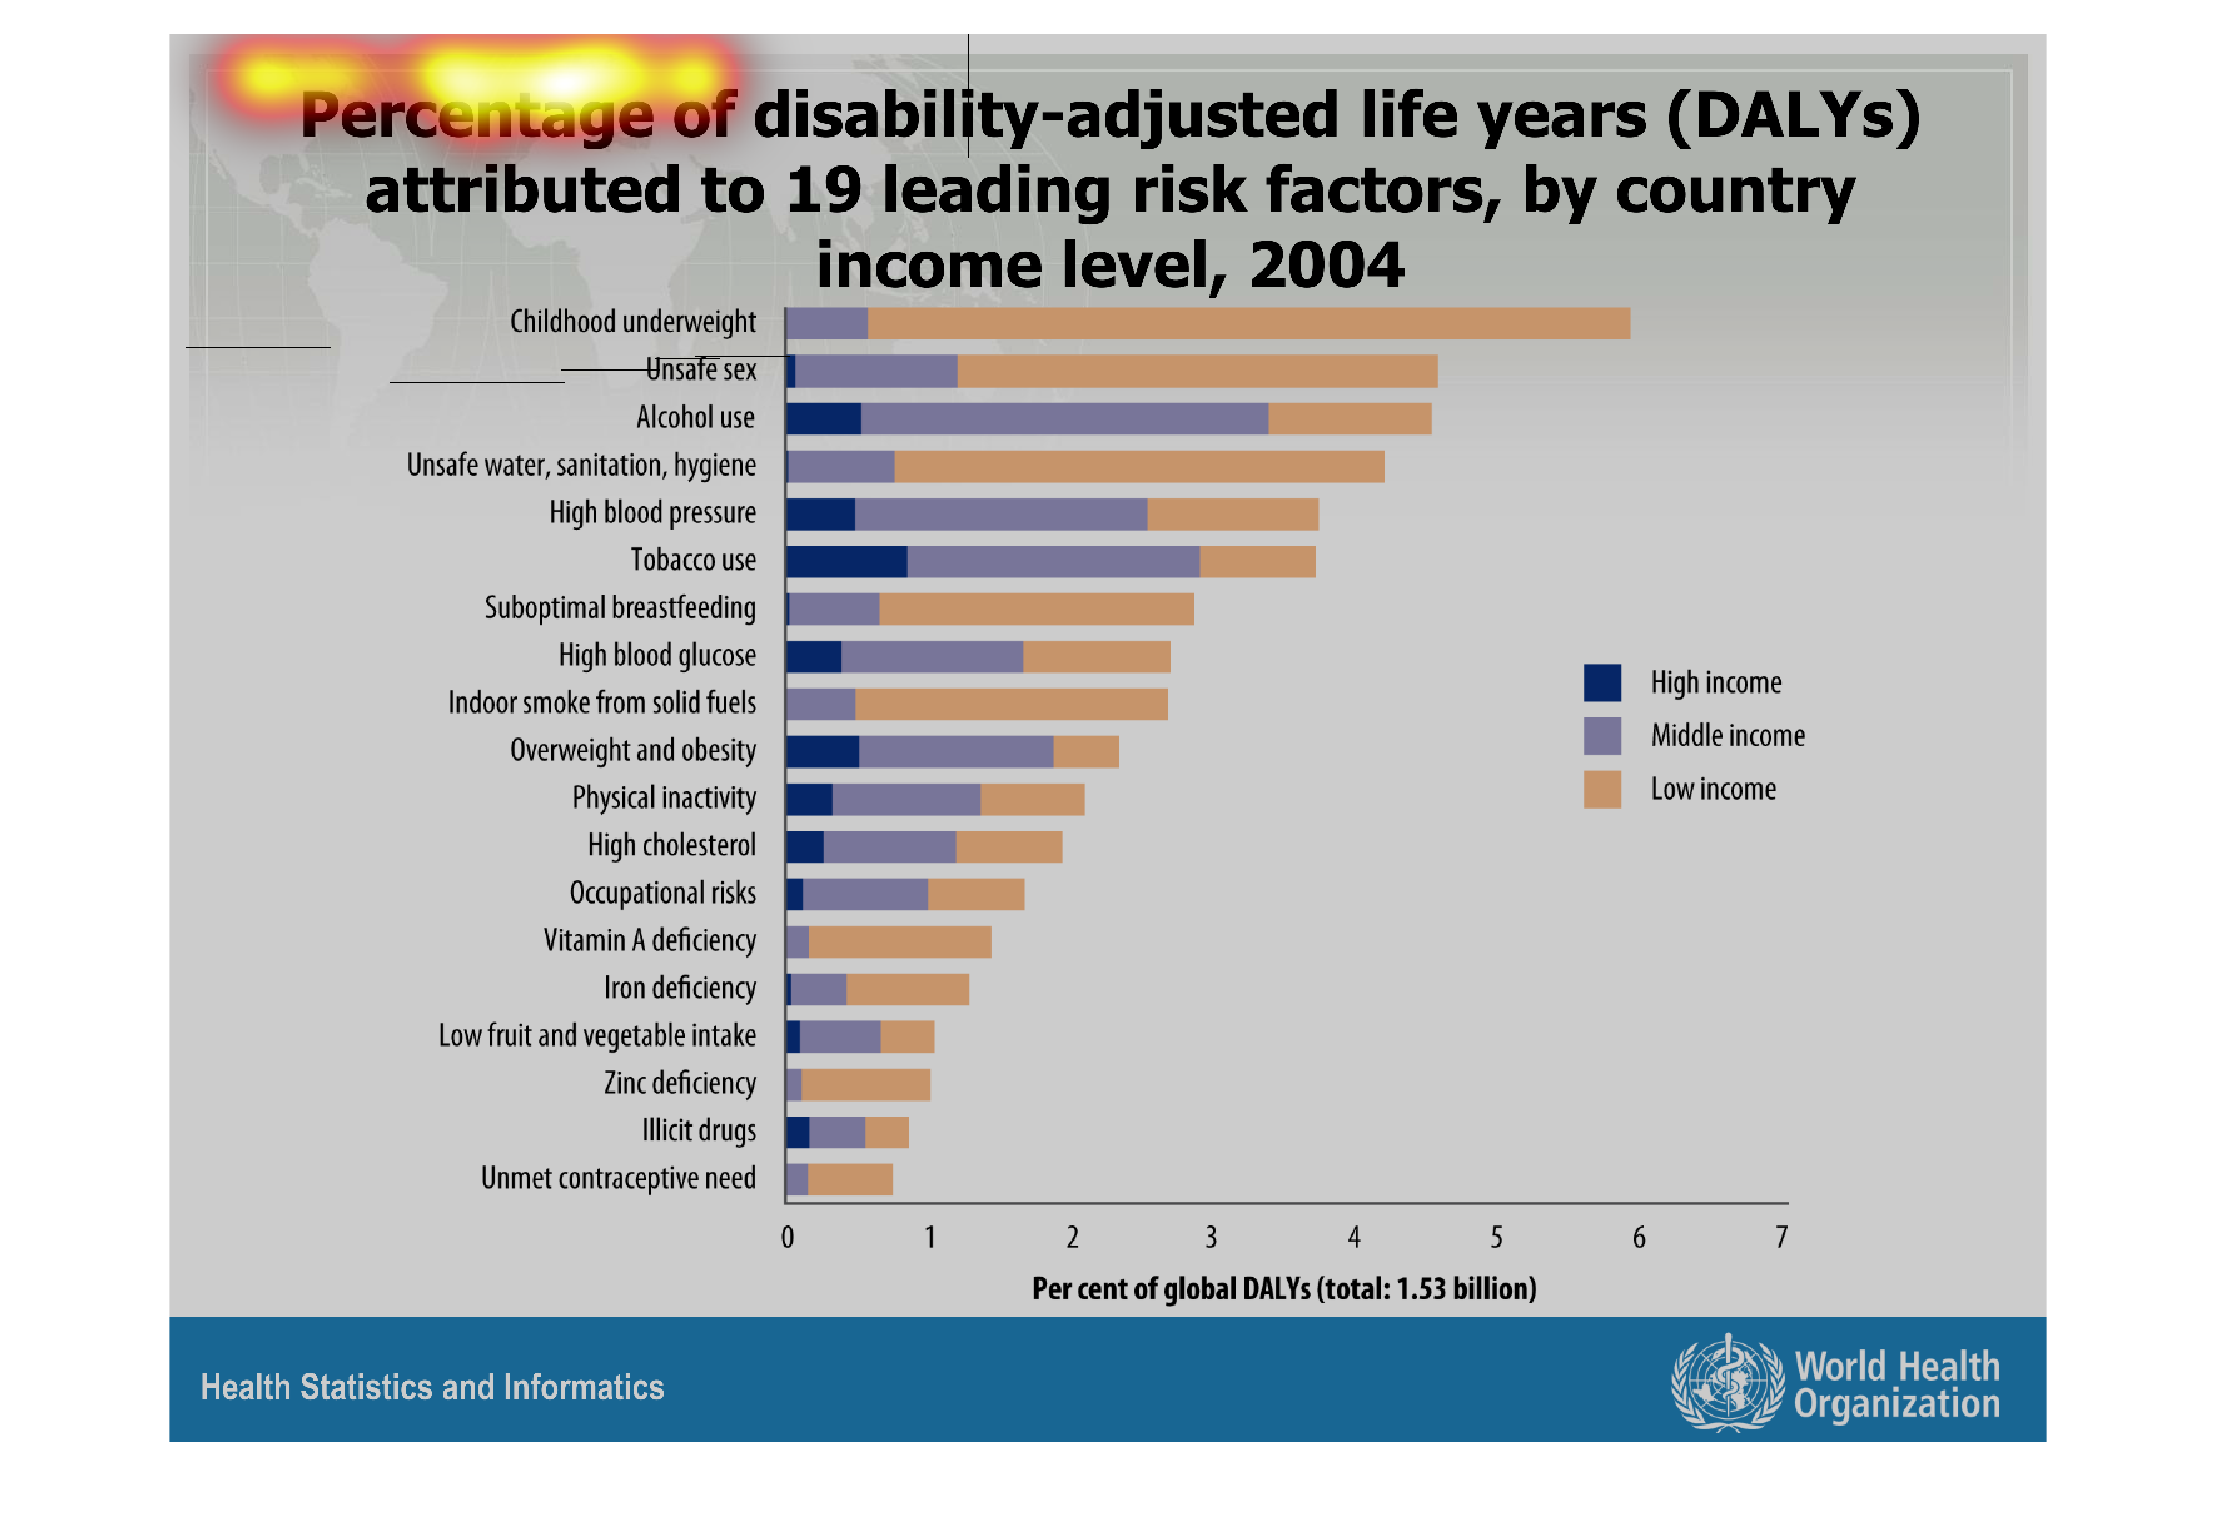
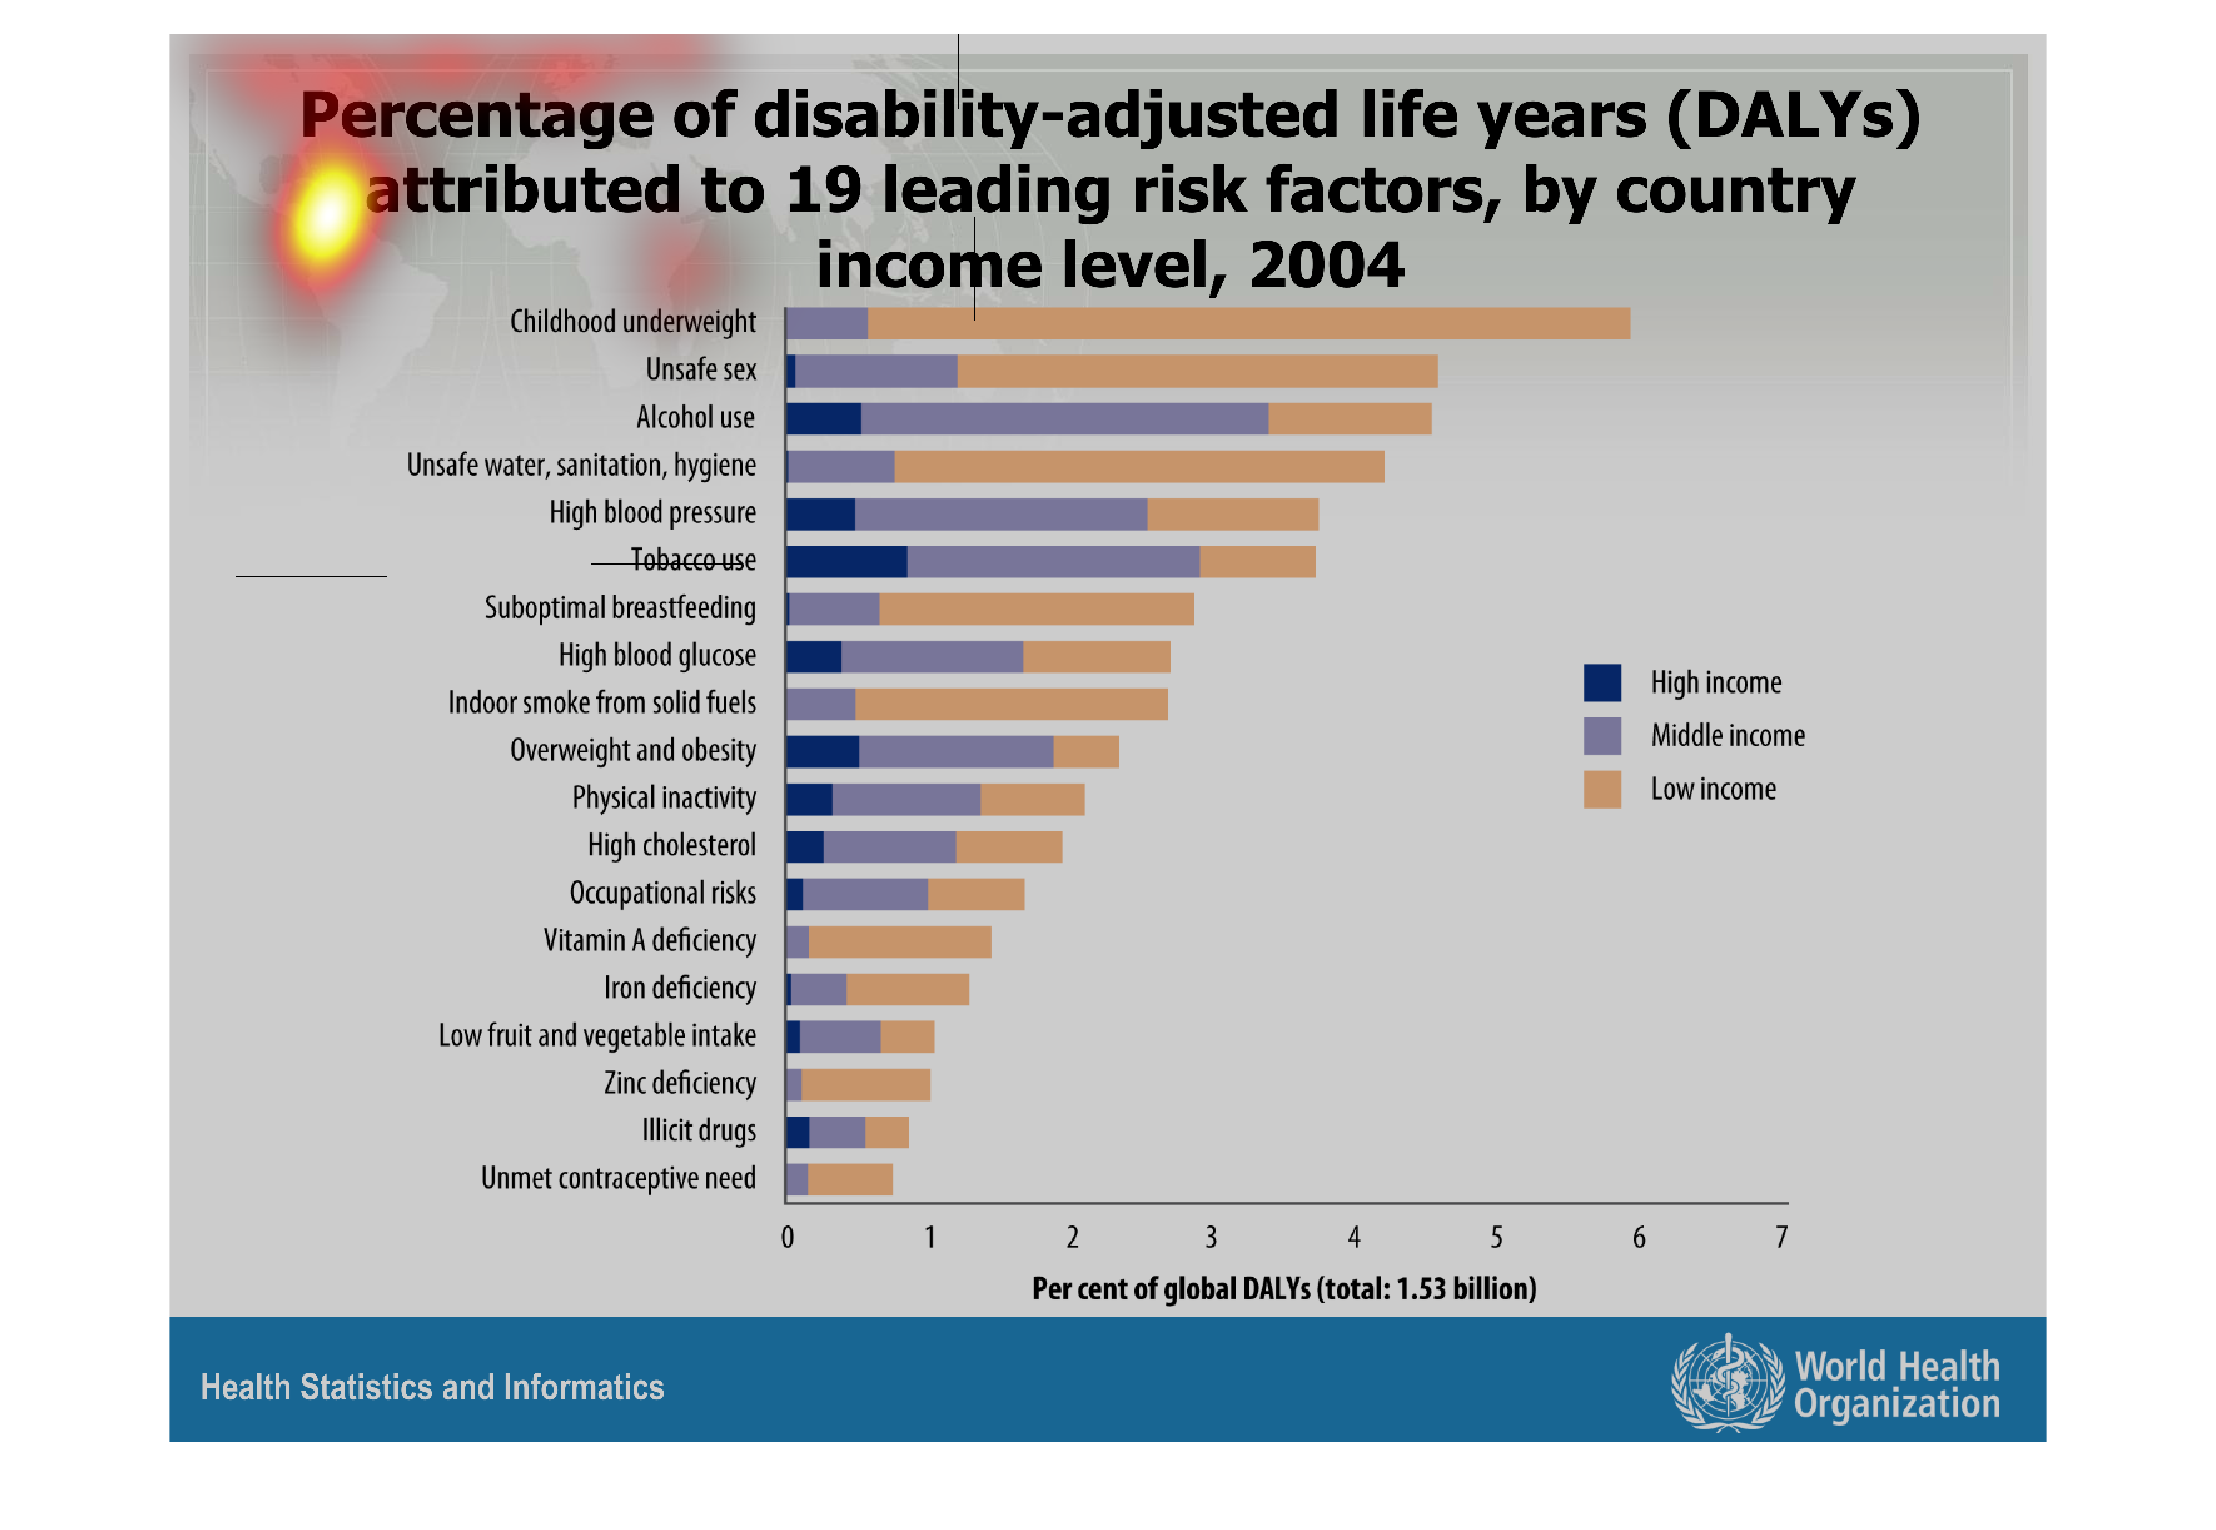
The image on the left hand side is an age expectancy graph for individuals based on income
level based on certain health factors.  For example the biggest risk factor for low income
households is that a child being underweight; by a large proportion this is the biggest finding
from the study percentage wise.
Warning: Image is too big to fit on screen; displaying at 67%
Warning: Image is too big to fit on screen; displaying at 67%
This graph illustrates the percentage of liability adjusted life years or DALYs attributed
to leading risk factors by country and income level in the year 2004.
Warning: Image is too big to fit on screen; displaying at 67%
Warning: Image is too big to fit on screen; displaying at 67%
This handmade chart shows the disability adjusted life years (DALY) as measured in certain
behaviors or results in ones life. Other than that hard to interpret
Warning: Image is too big to fit on screen; displaying at 67%
Warning: Image is too big to fit on screen; displaying at 67%
This graph shows how a disability can affect your lifespan. We can see that some conditions
have a larger effect in lifespan than others. Income is also a factor in how this graph is
arranged.
Warning: Image is too big to fit on screen; displaying at 67%
Warning: Image is too big to fit on screen; displaying at 67%
This is a series of bar graphs depicting the percentage of disability adjusted life years
attributed to 19 leading risk factors by country and income level in 2004.
Warning: Image is too big to fit on screen; displaying at 67%
Warning: Image is too big to fit on screen; displaying at 67%
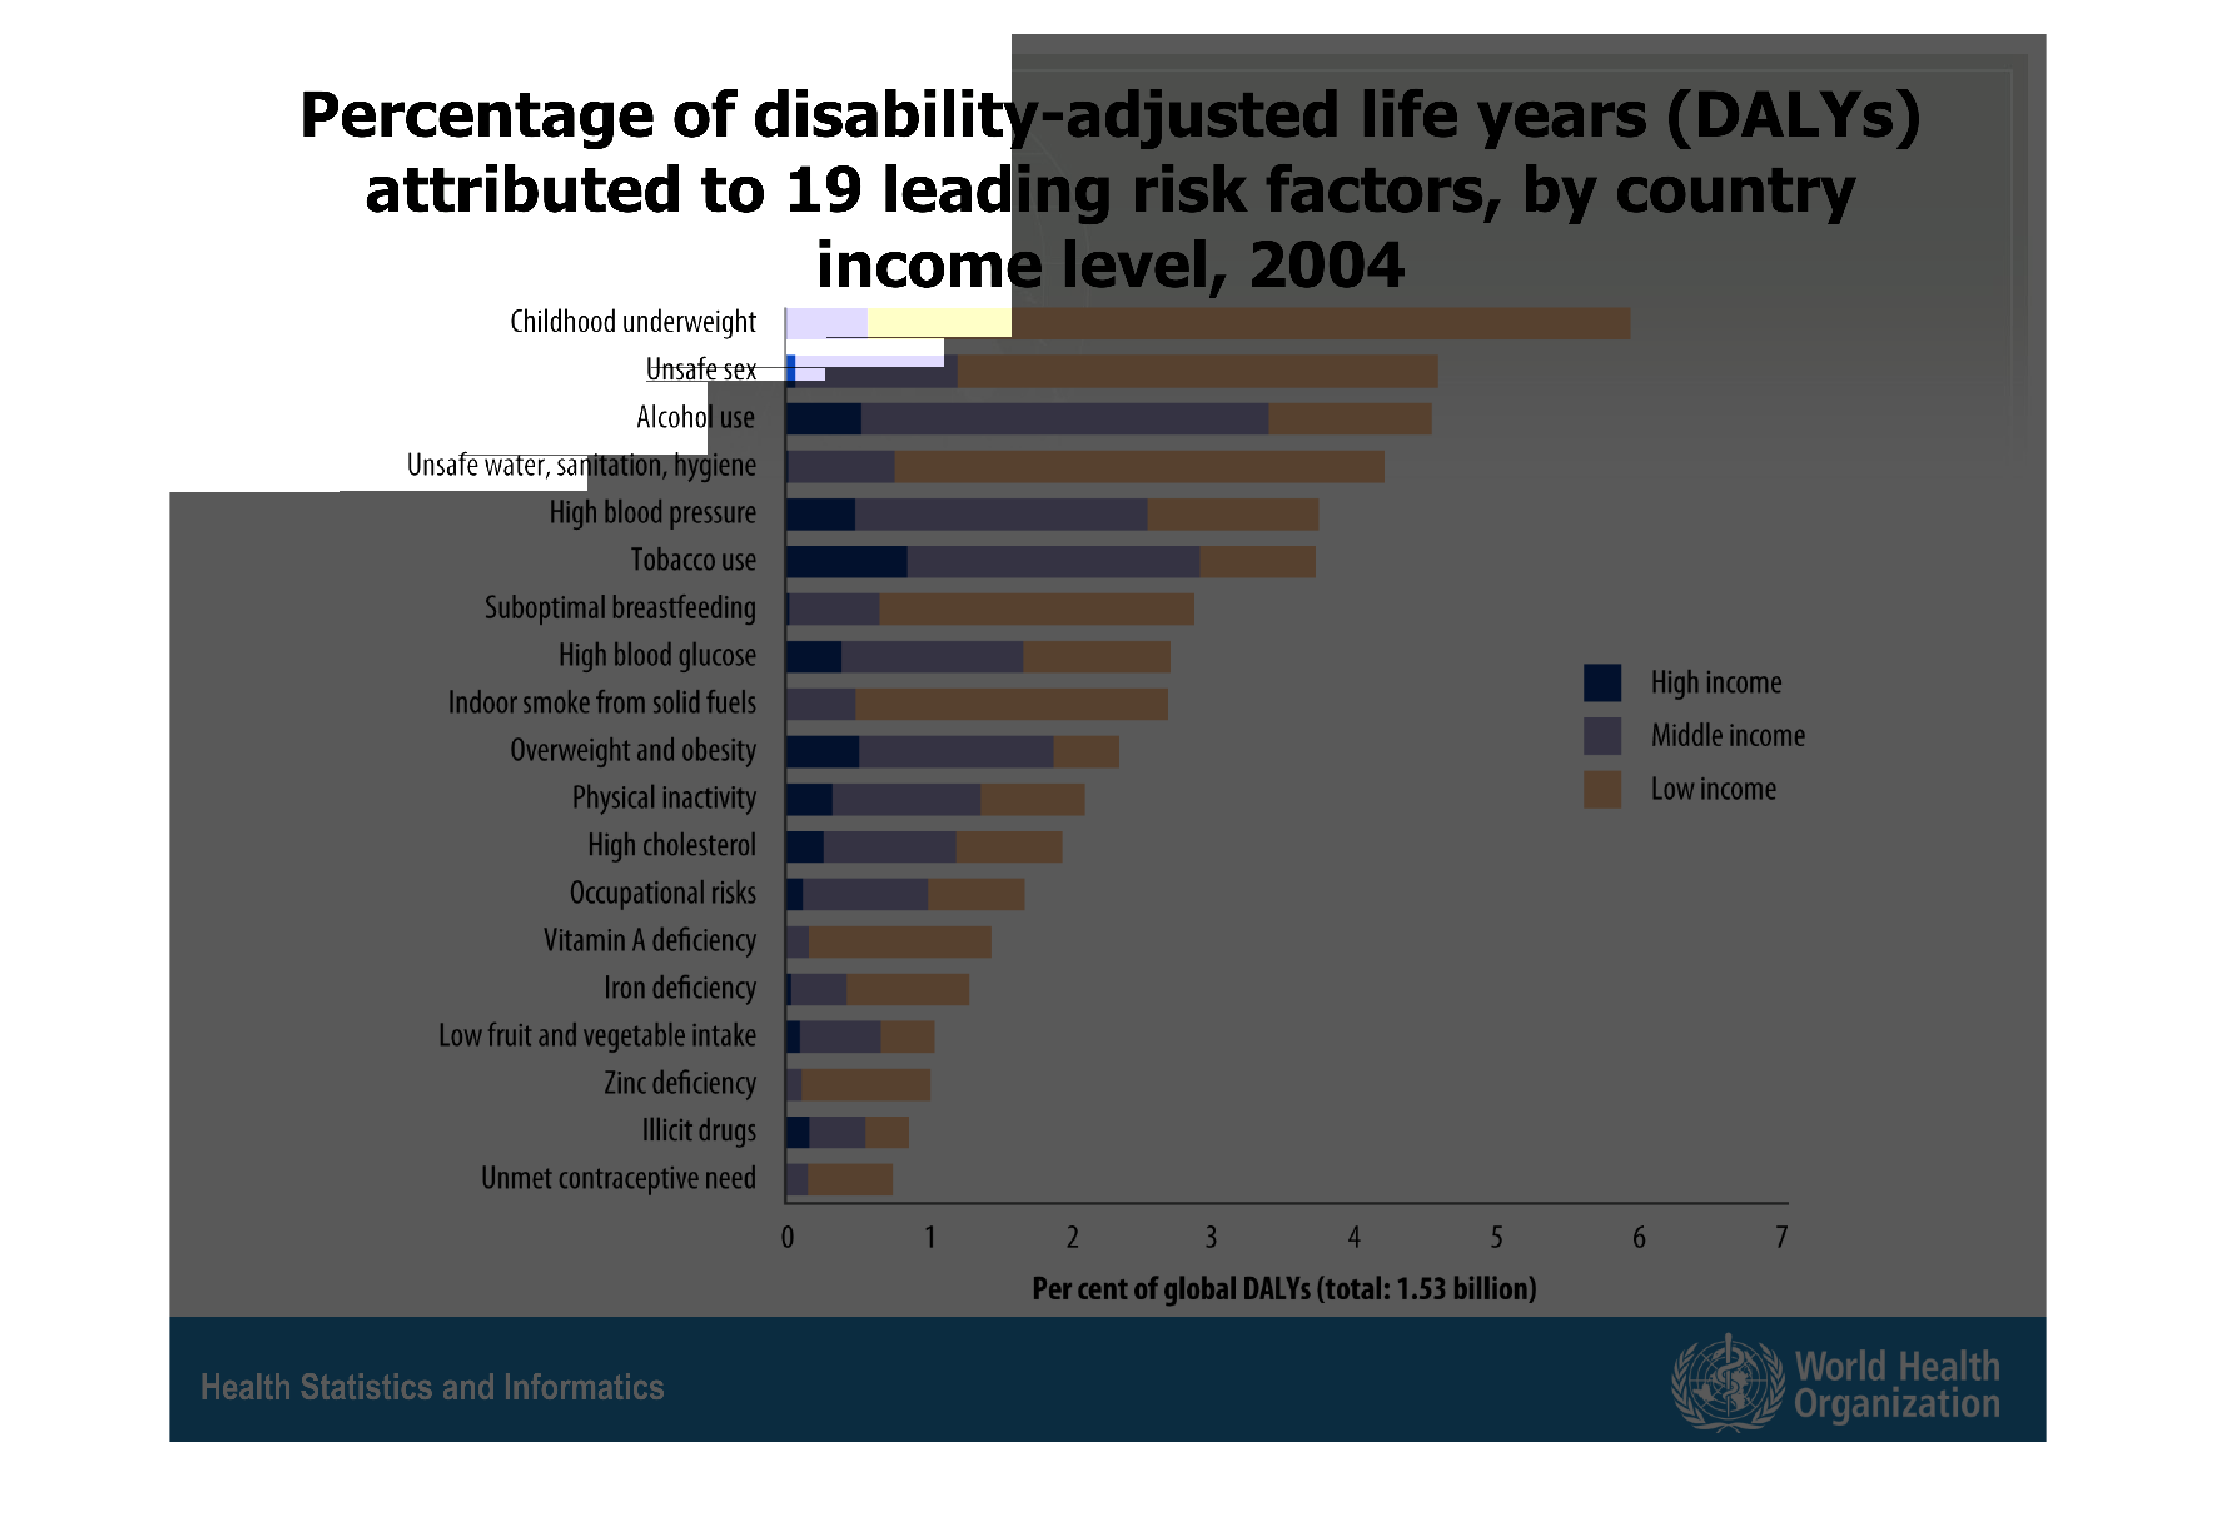
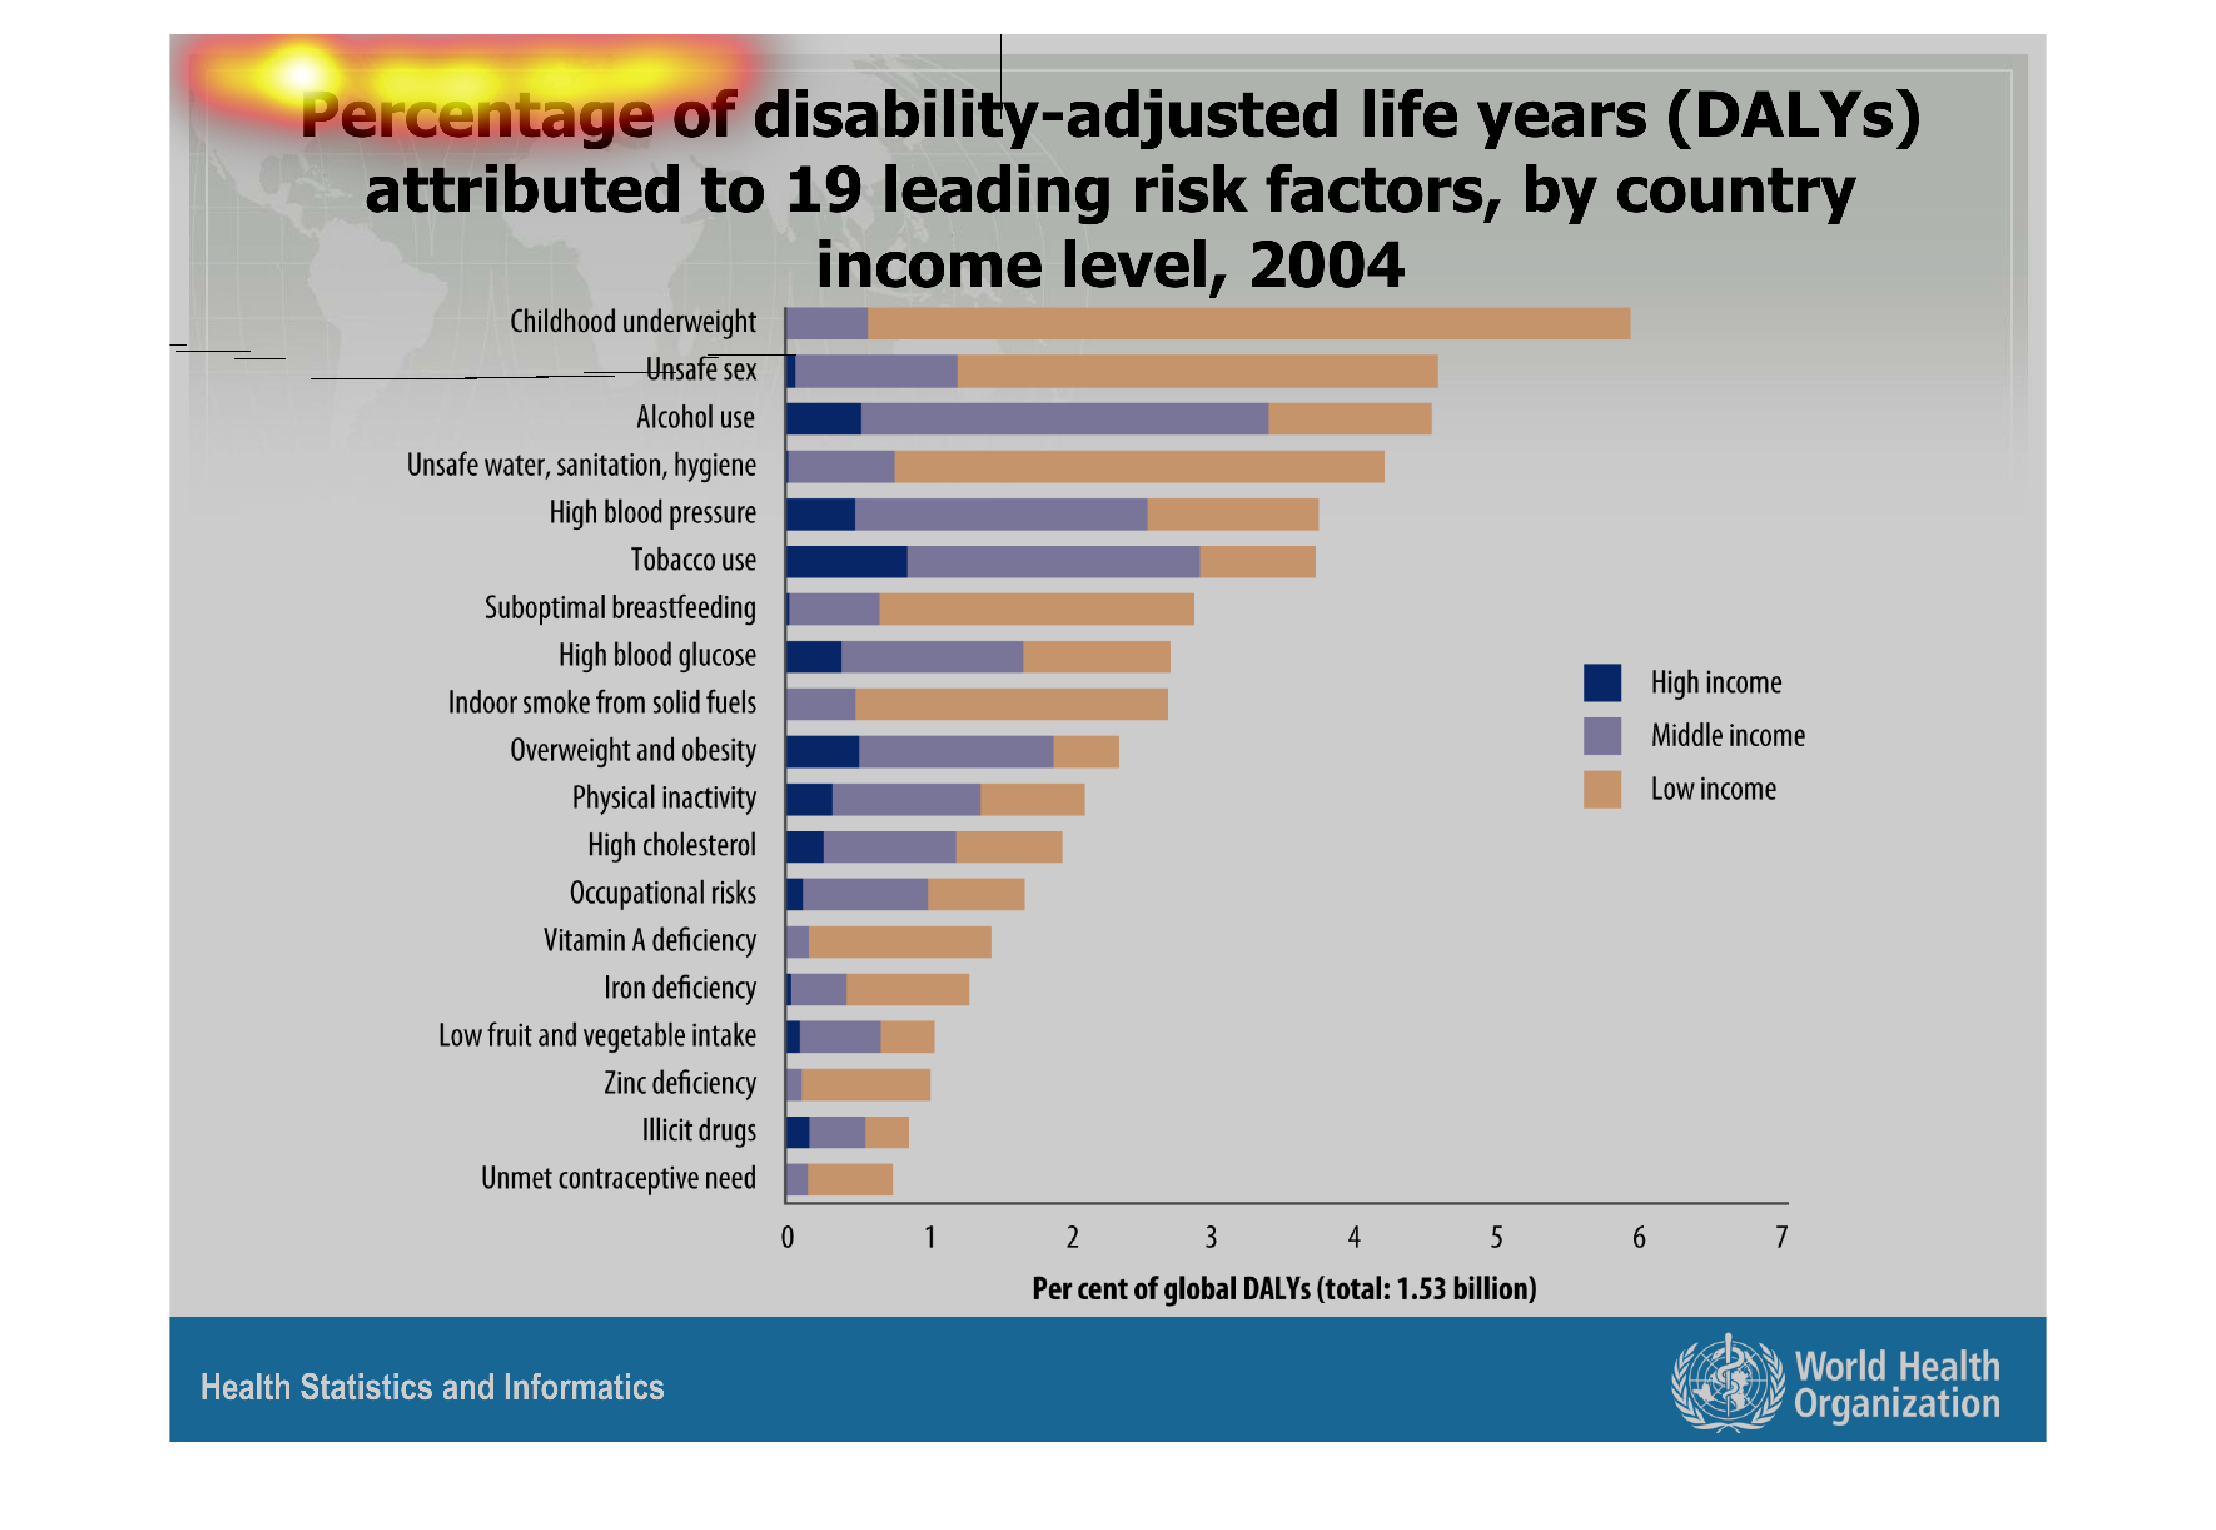
The image depicts a bar graph of the percentage of disability-adjusted life years (DALYs)
attributed to 19 leading risk factors, by country income level in 2004. Country income levels
include: High income, Middle income, and Low income. The data shows DALYs affected by over-consumption
of foods, tobacco, alcohol, and stress in higher income countries versus basic deficiencies
and certain diseases in lower income countries where nutrition is not as good and healthcare
is not as advanced.
Warning: Image is too big to fit on screen; displaying at 67%
Warning: Image is too big to fit on screen; displaying at 67%