Warning: Image is too big to fit on screen; displaying at 67%
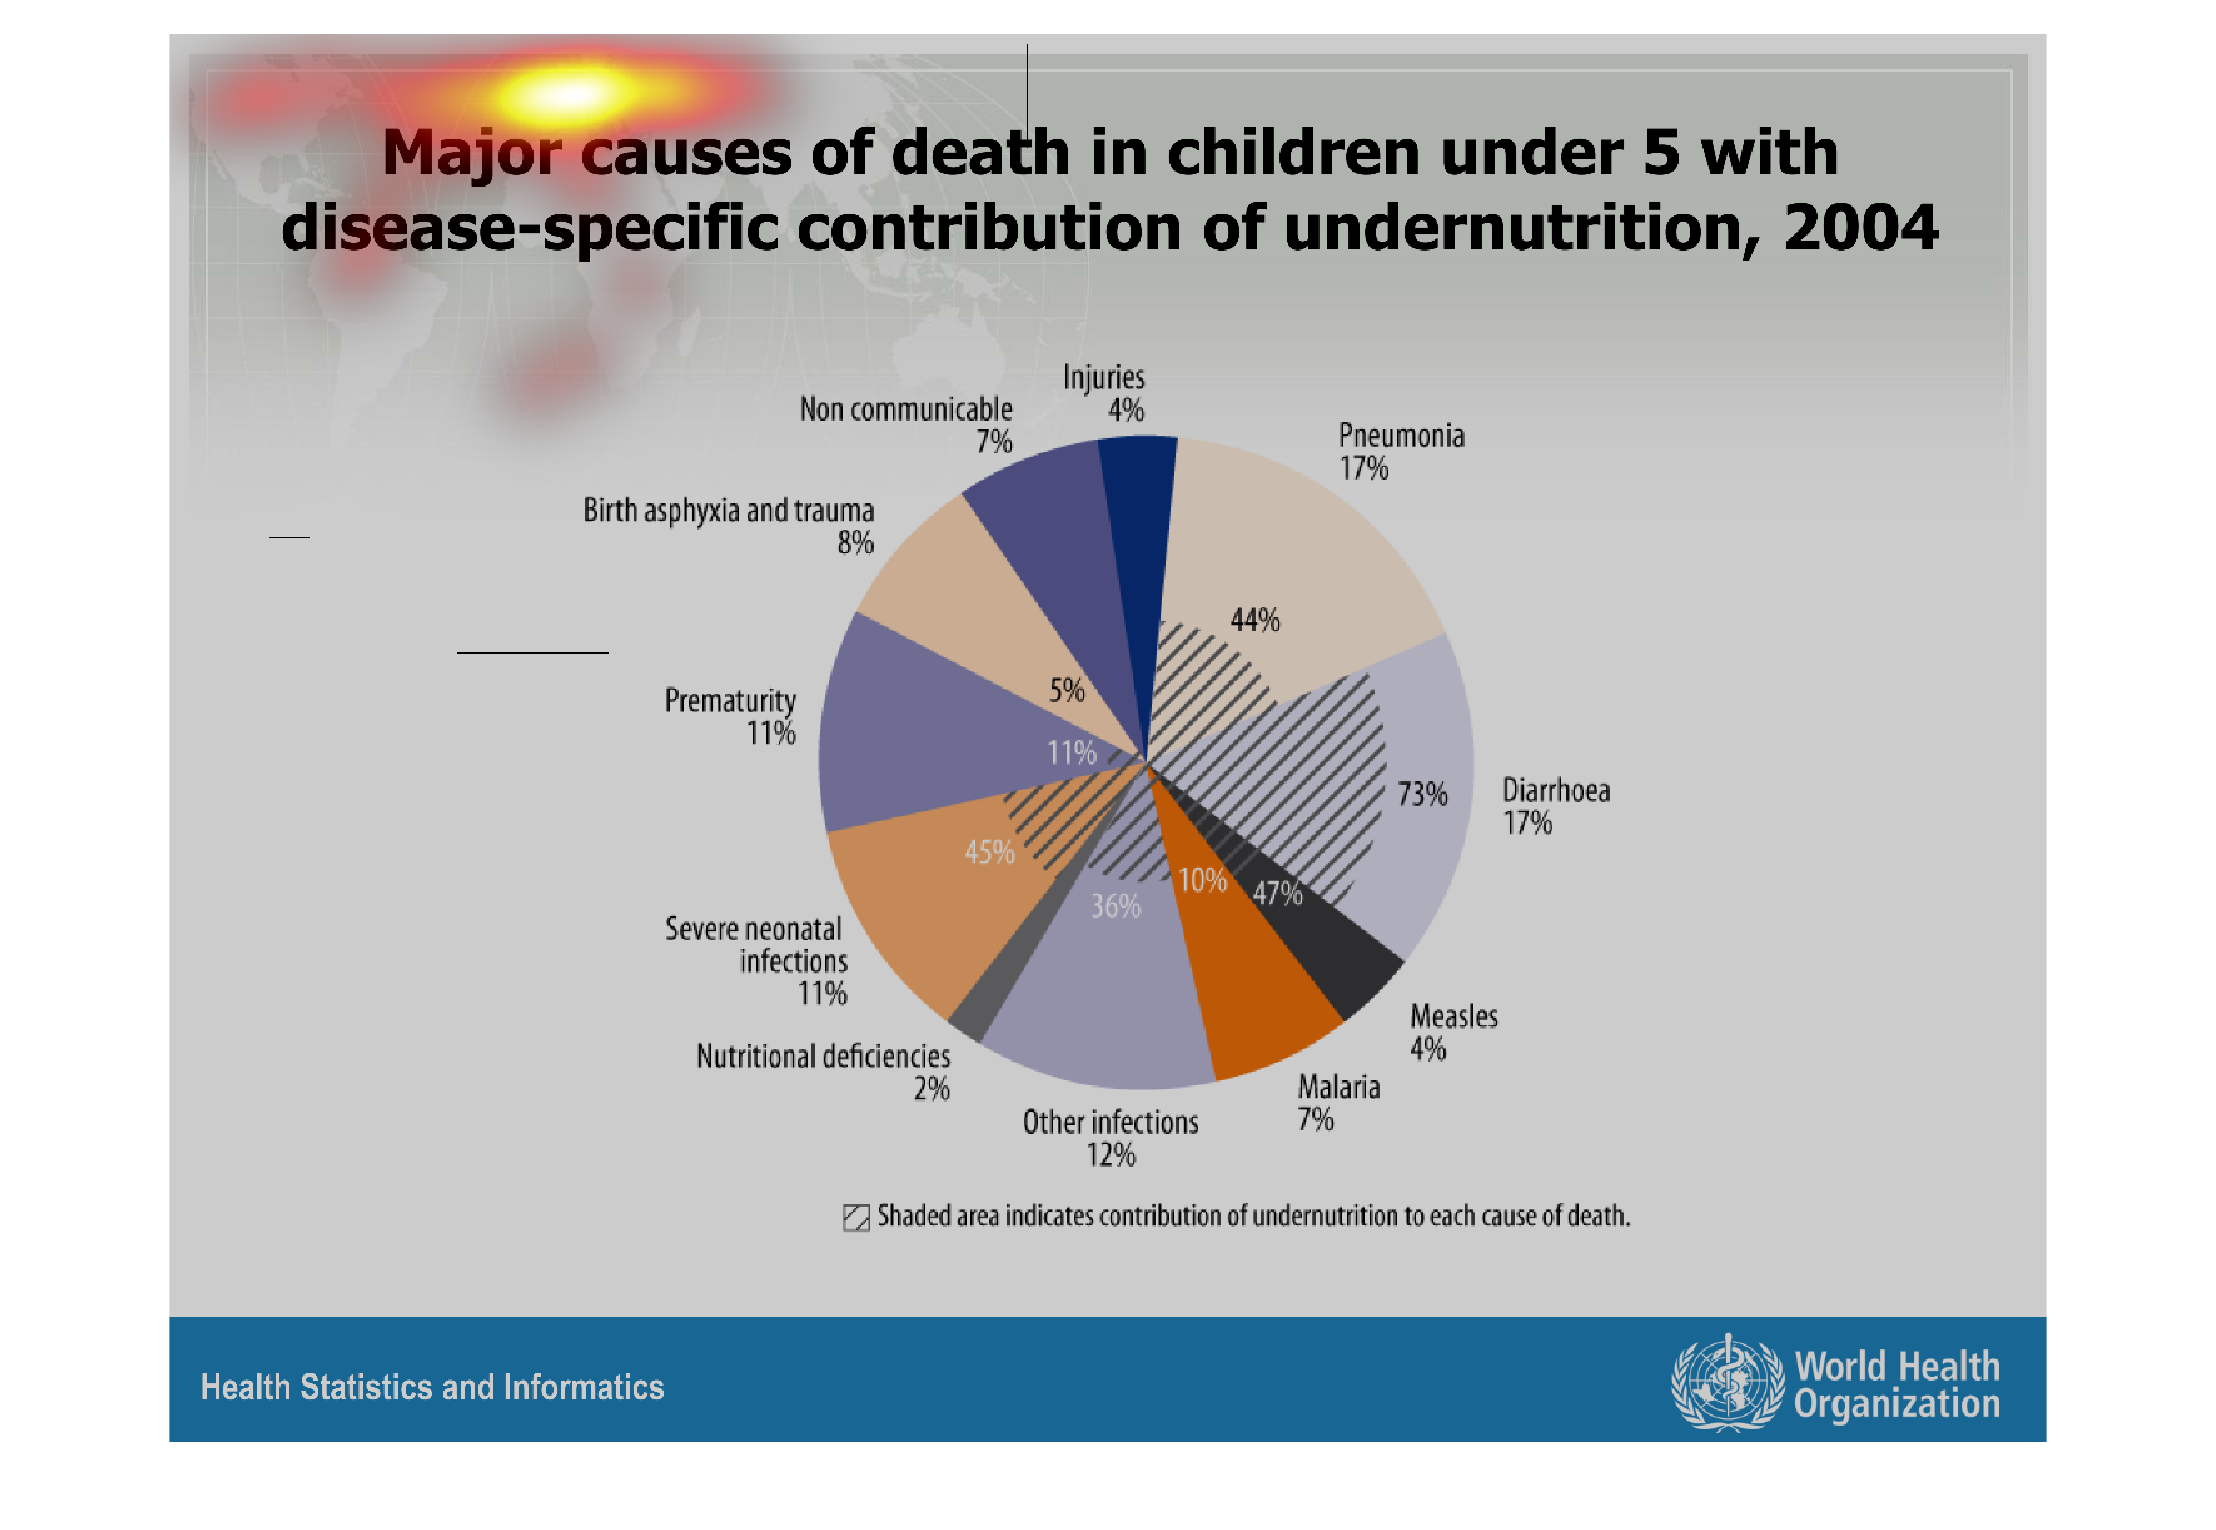
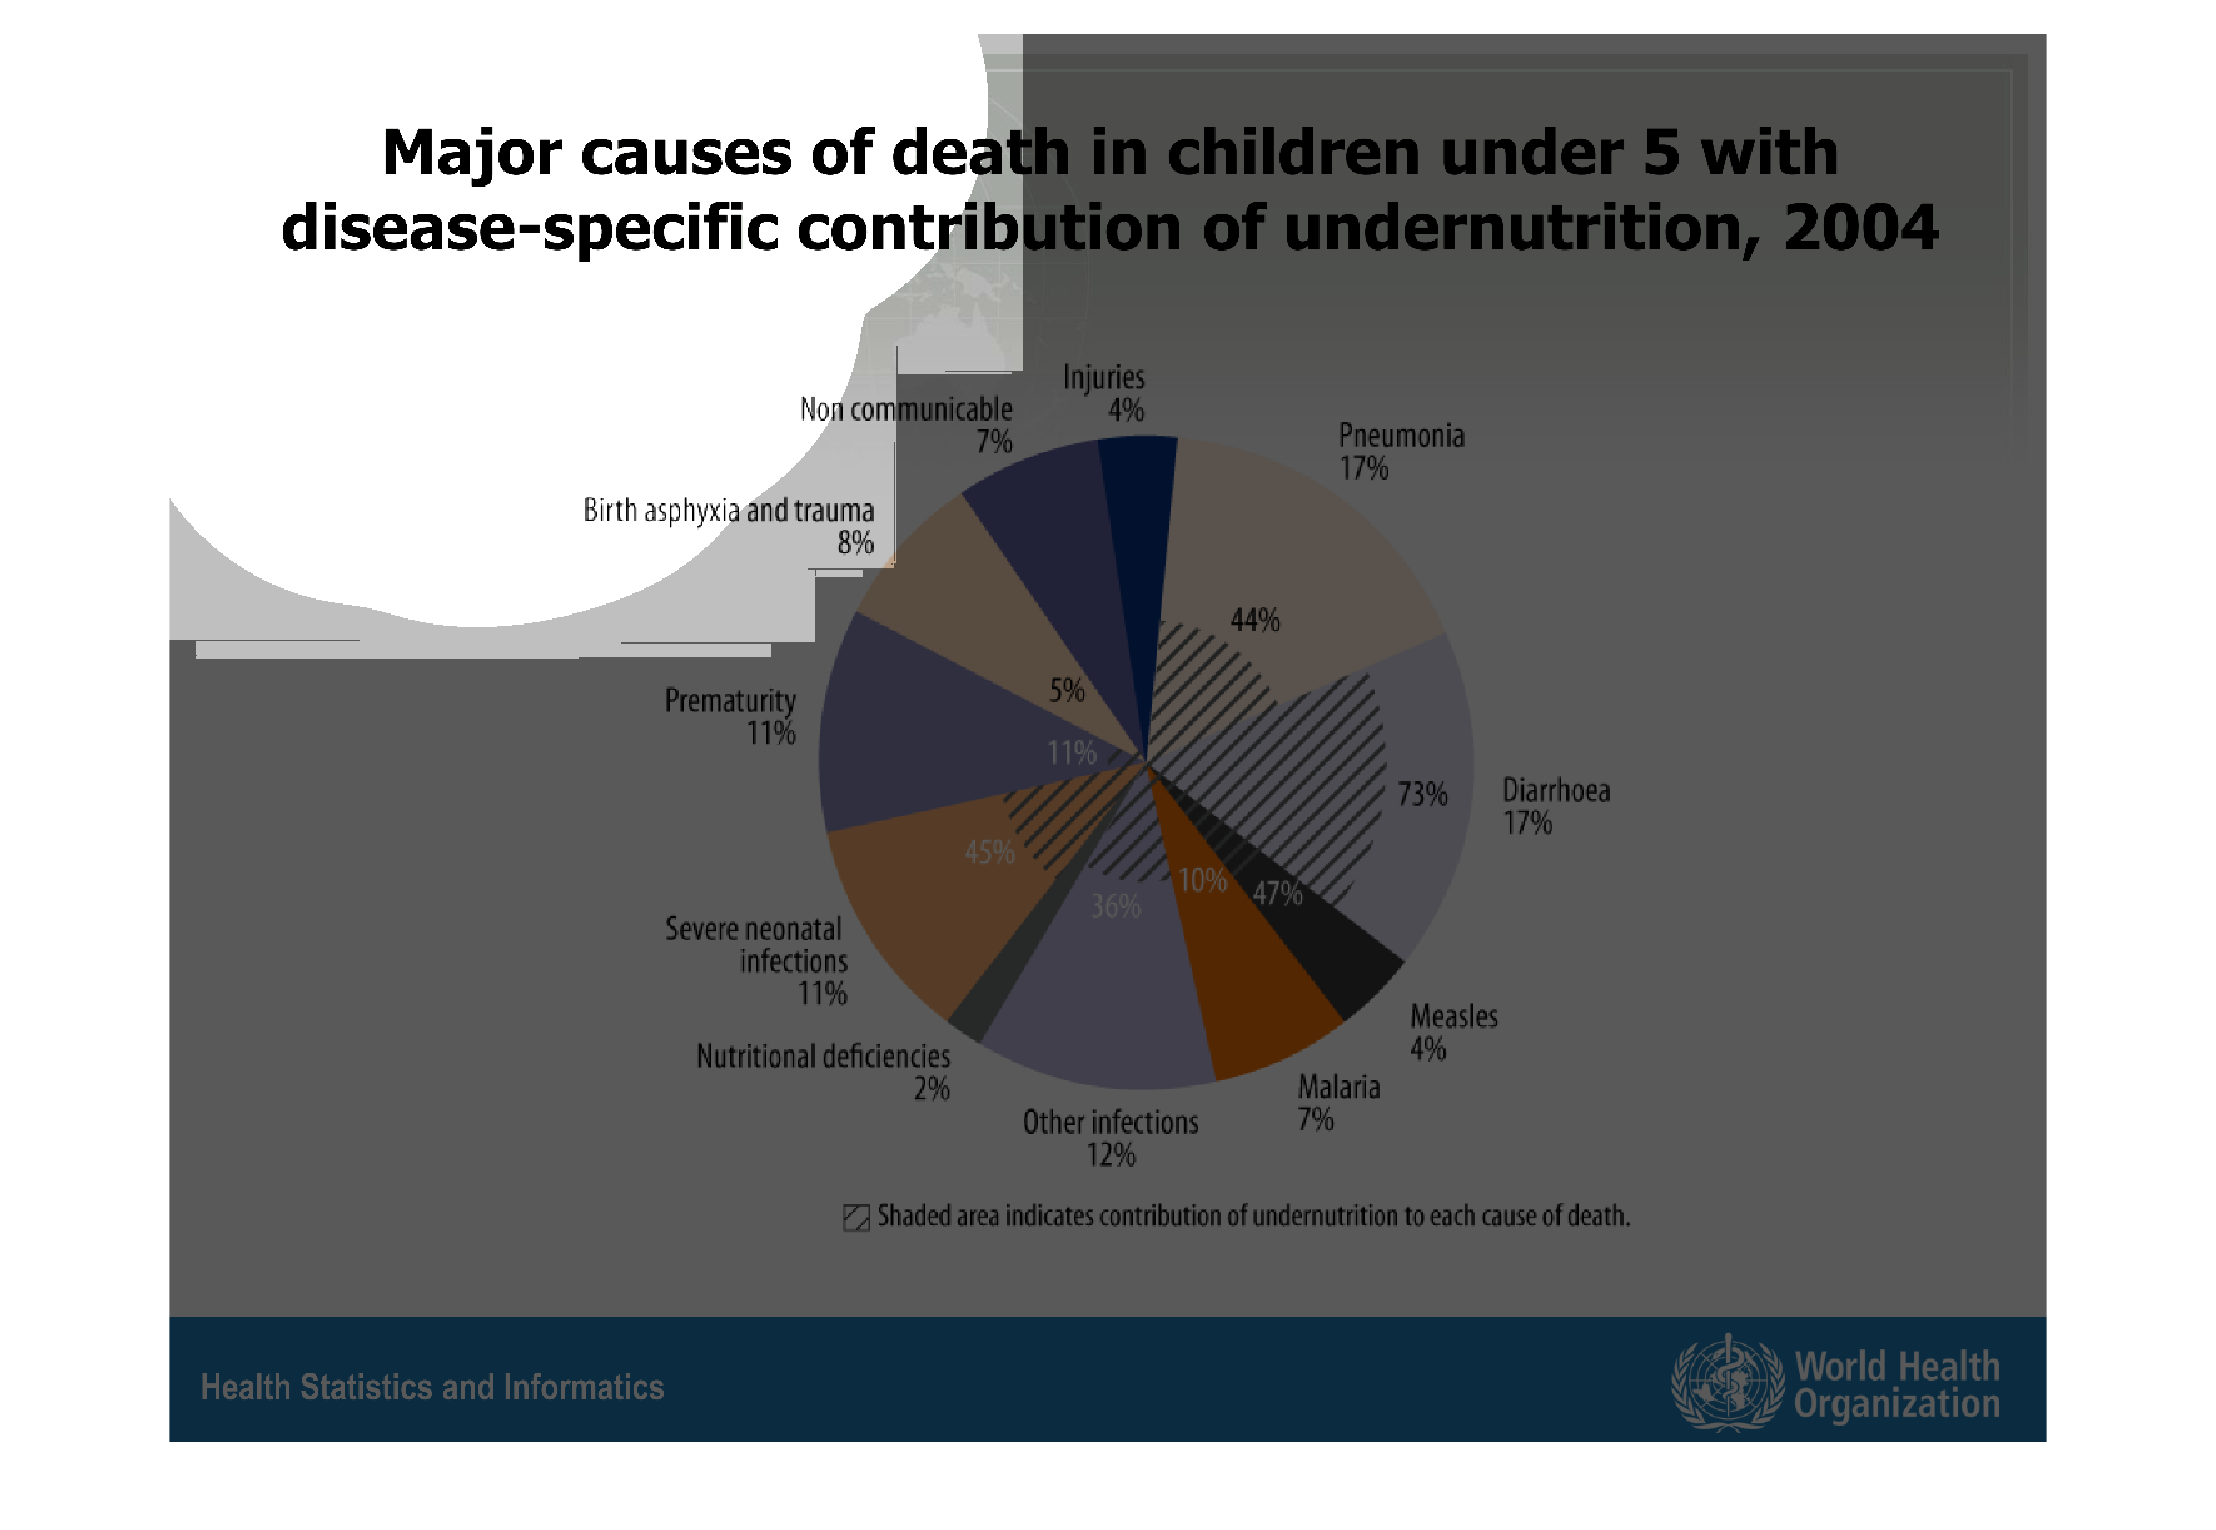
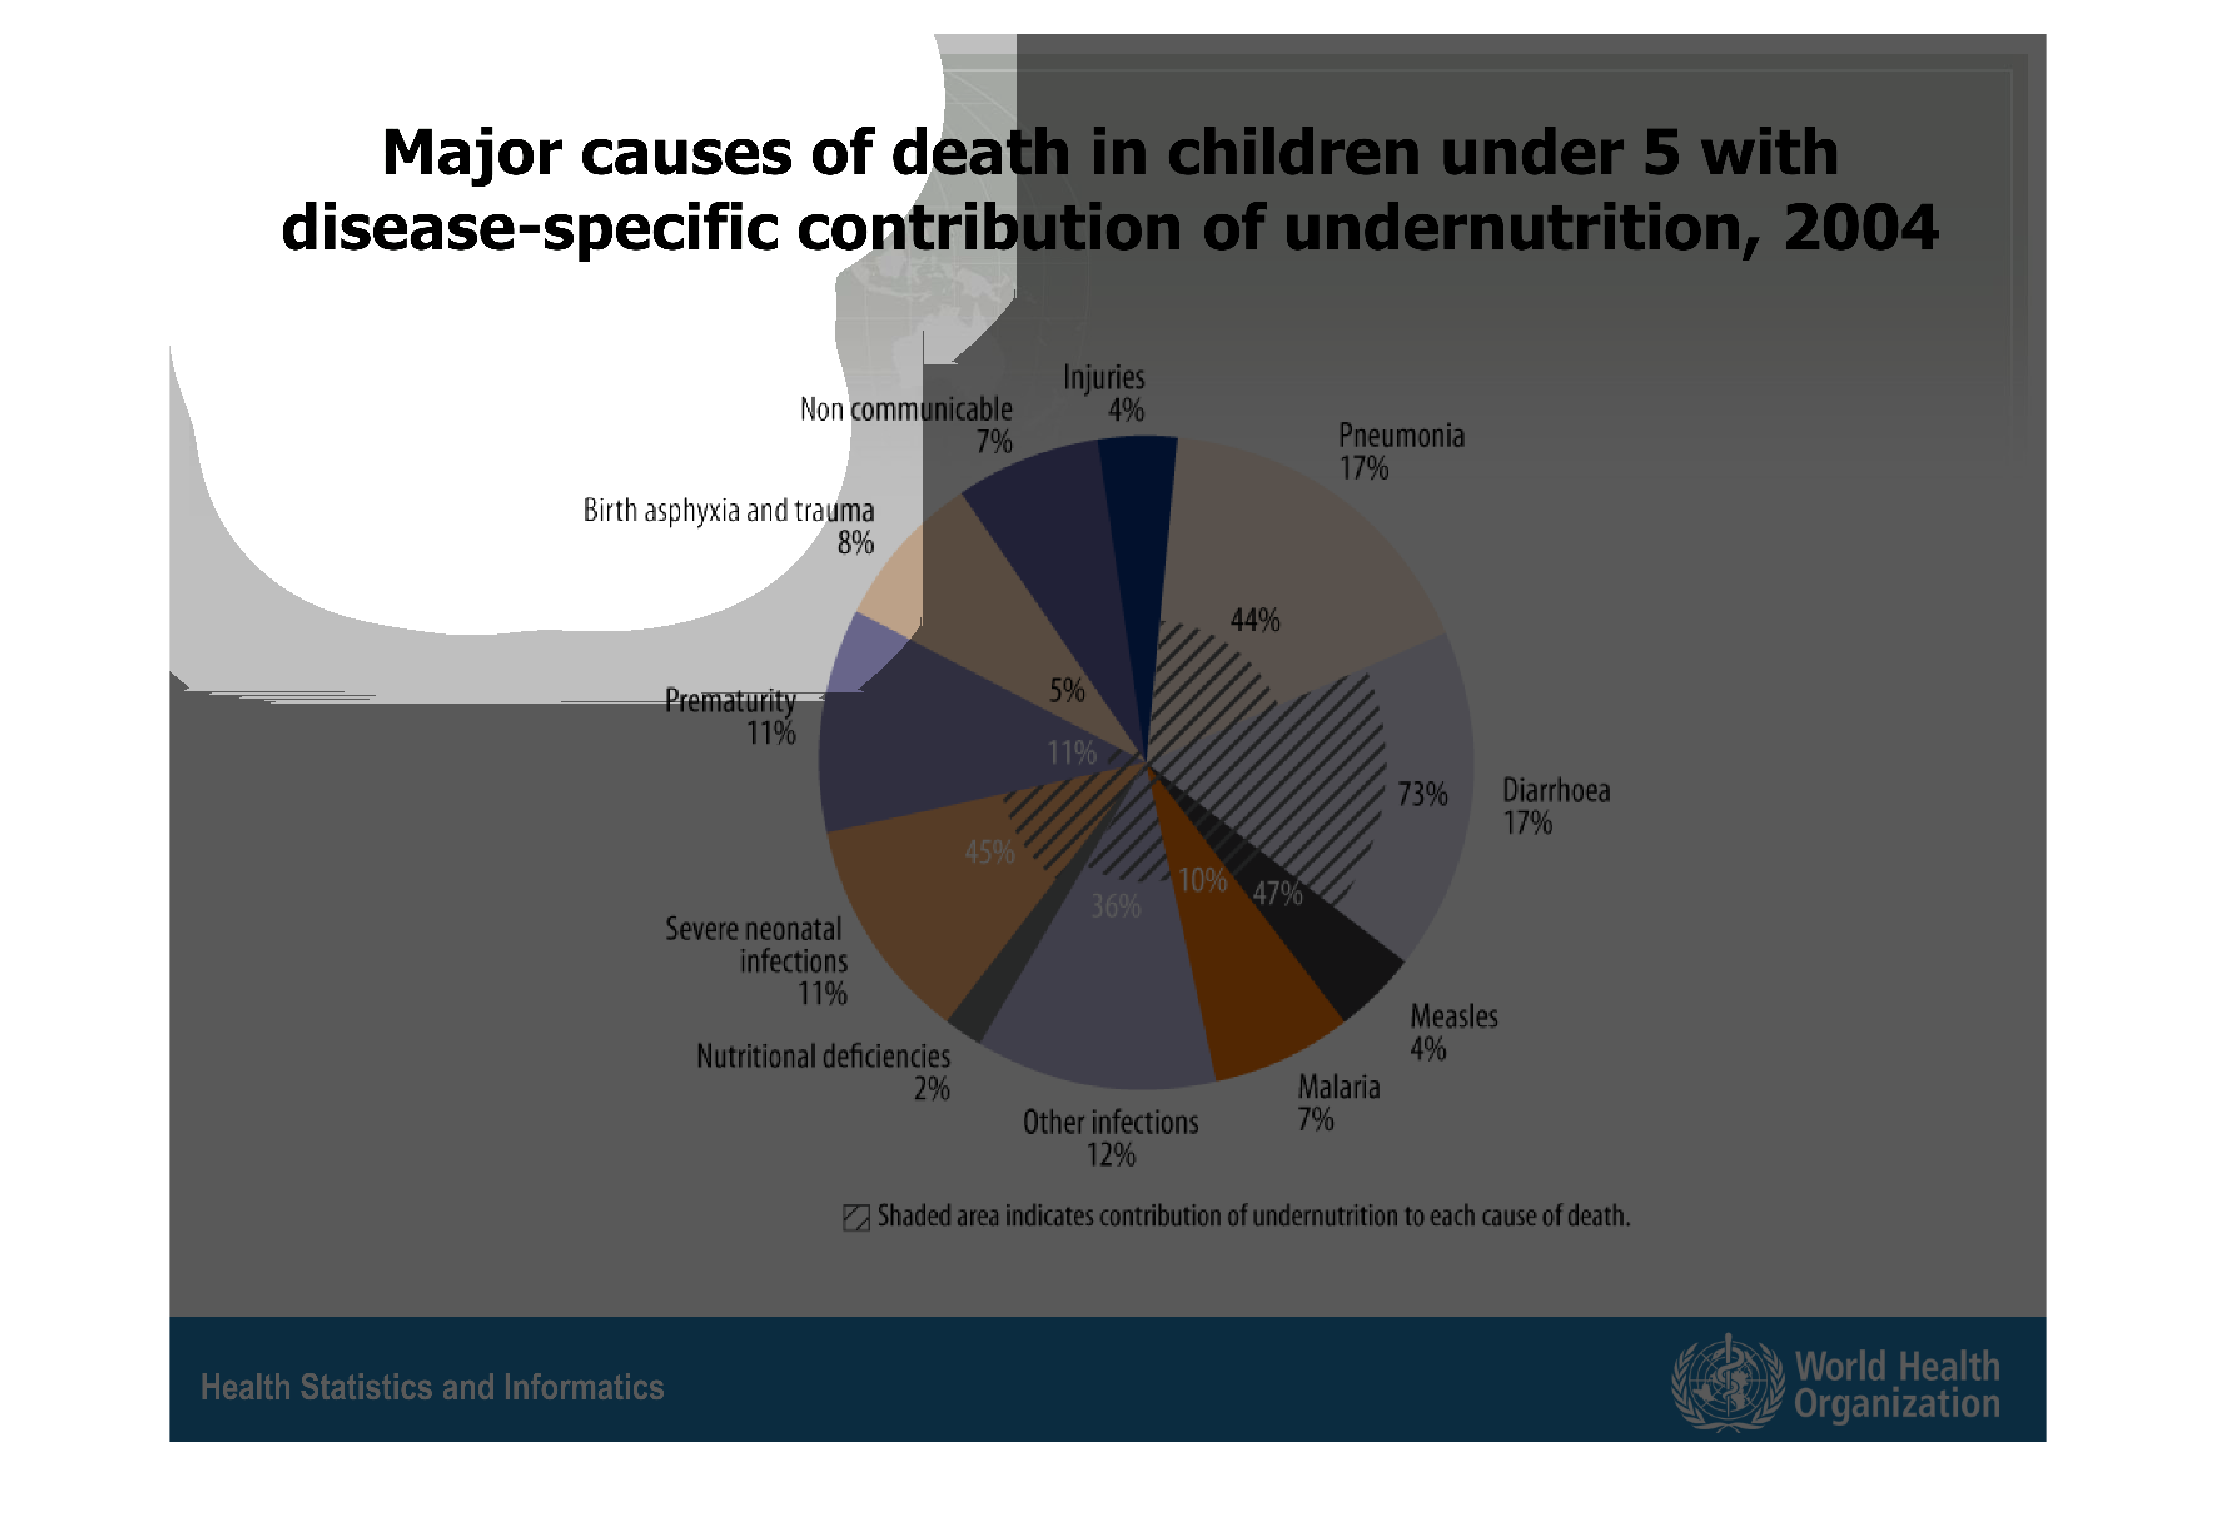
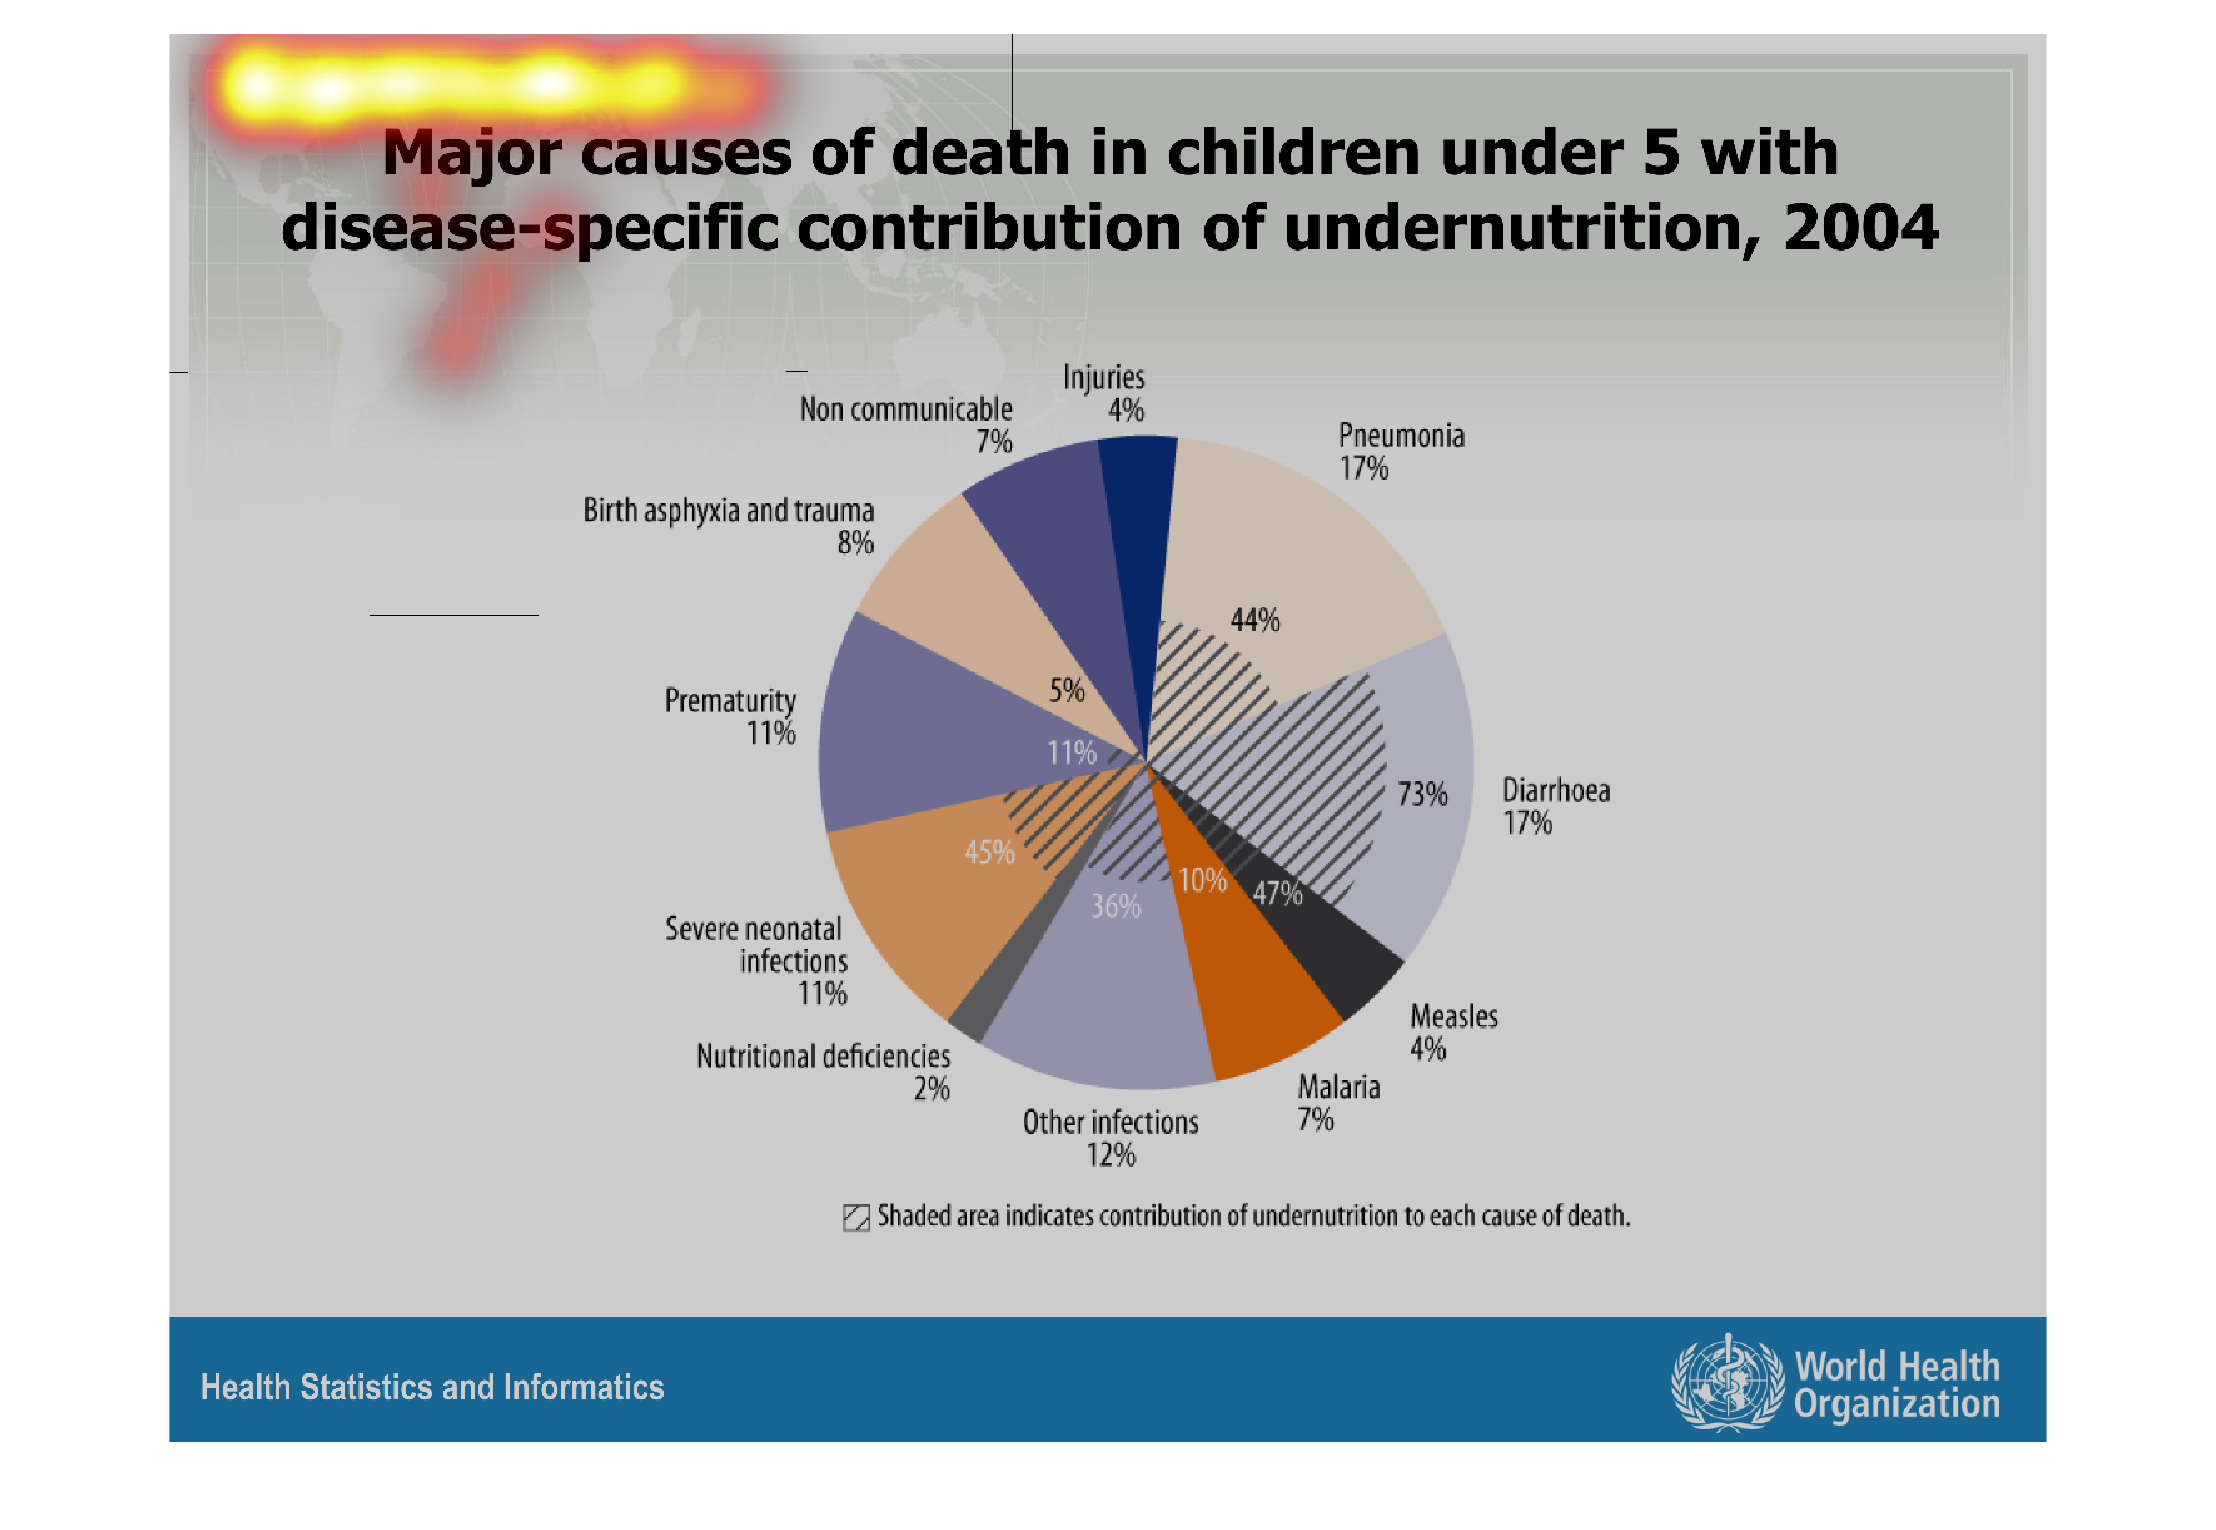
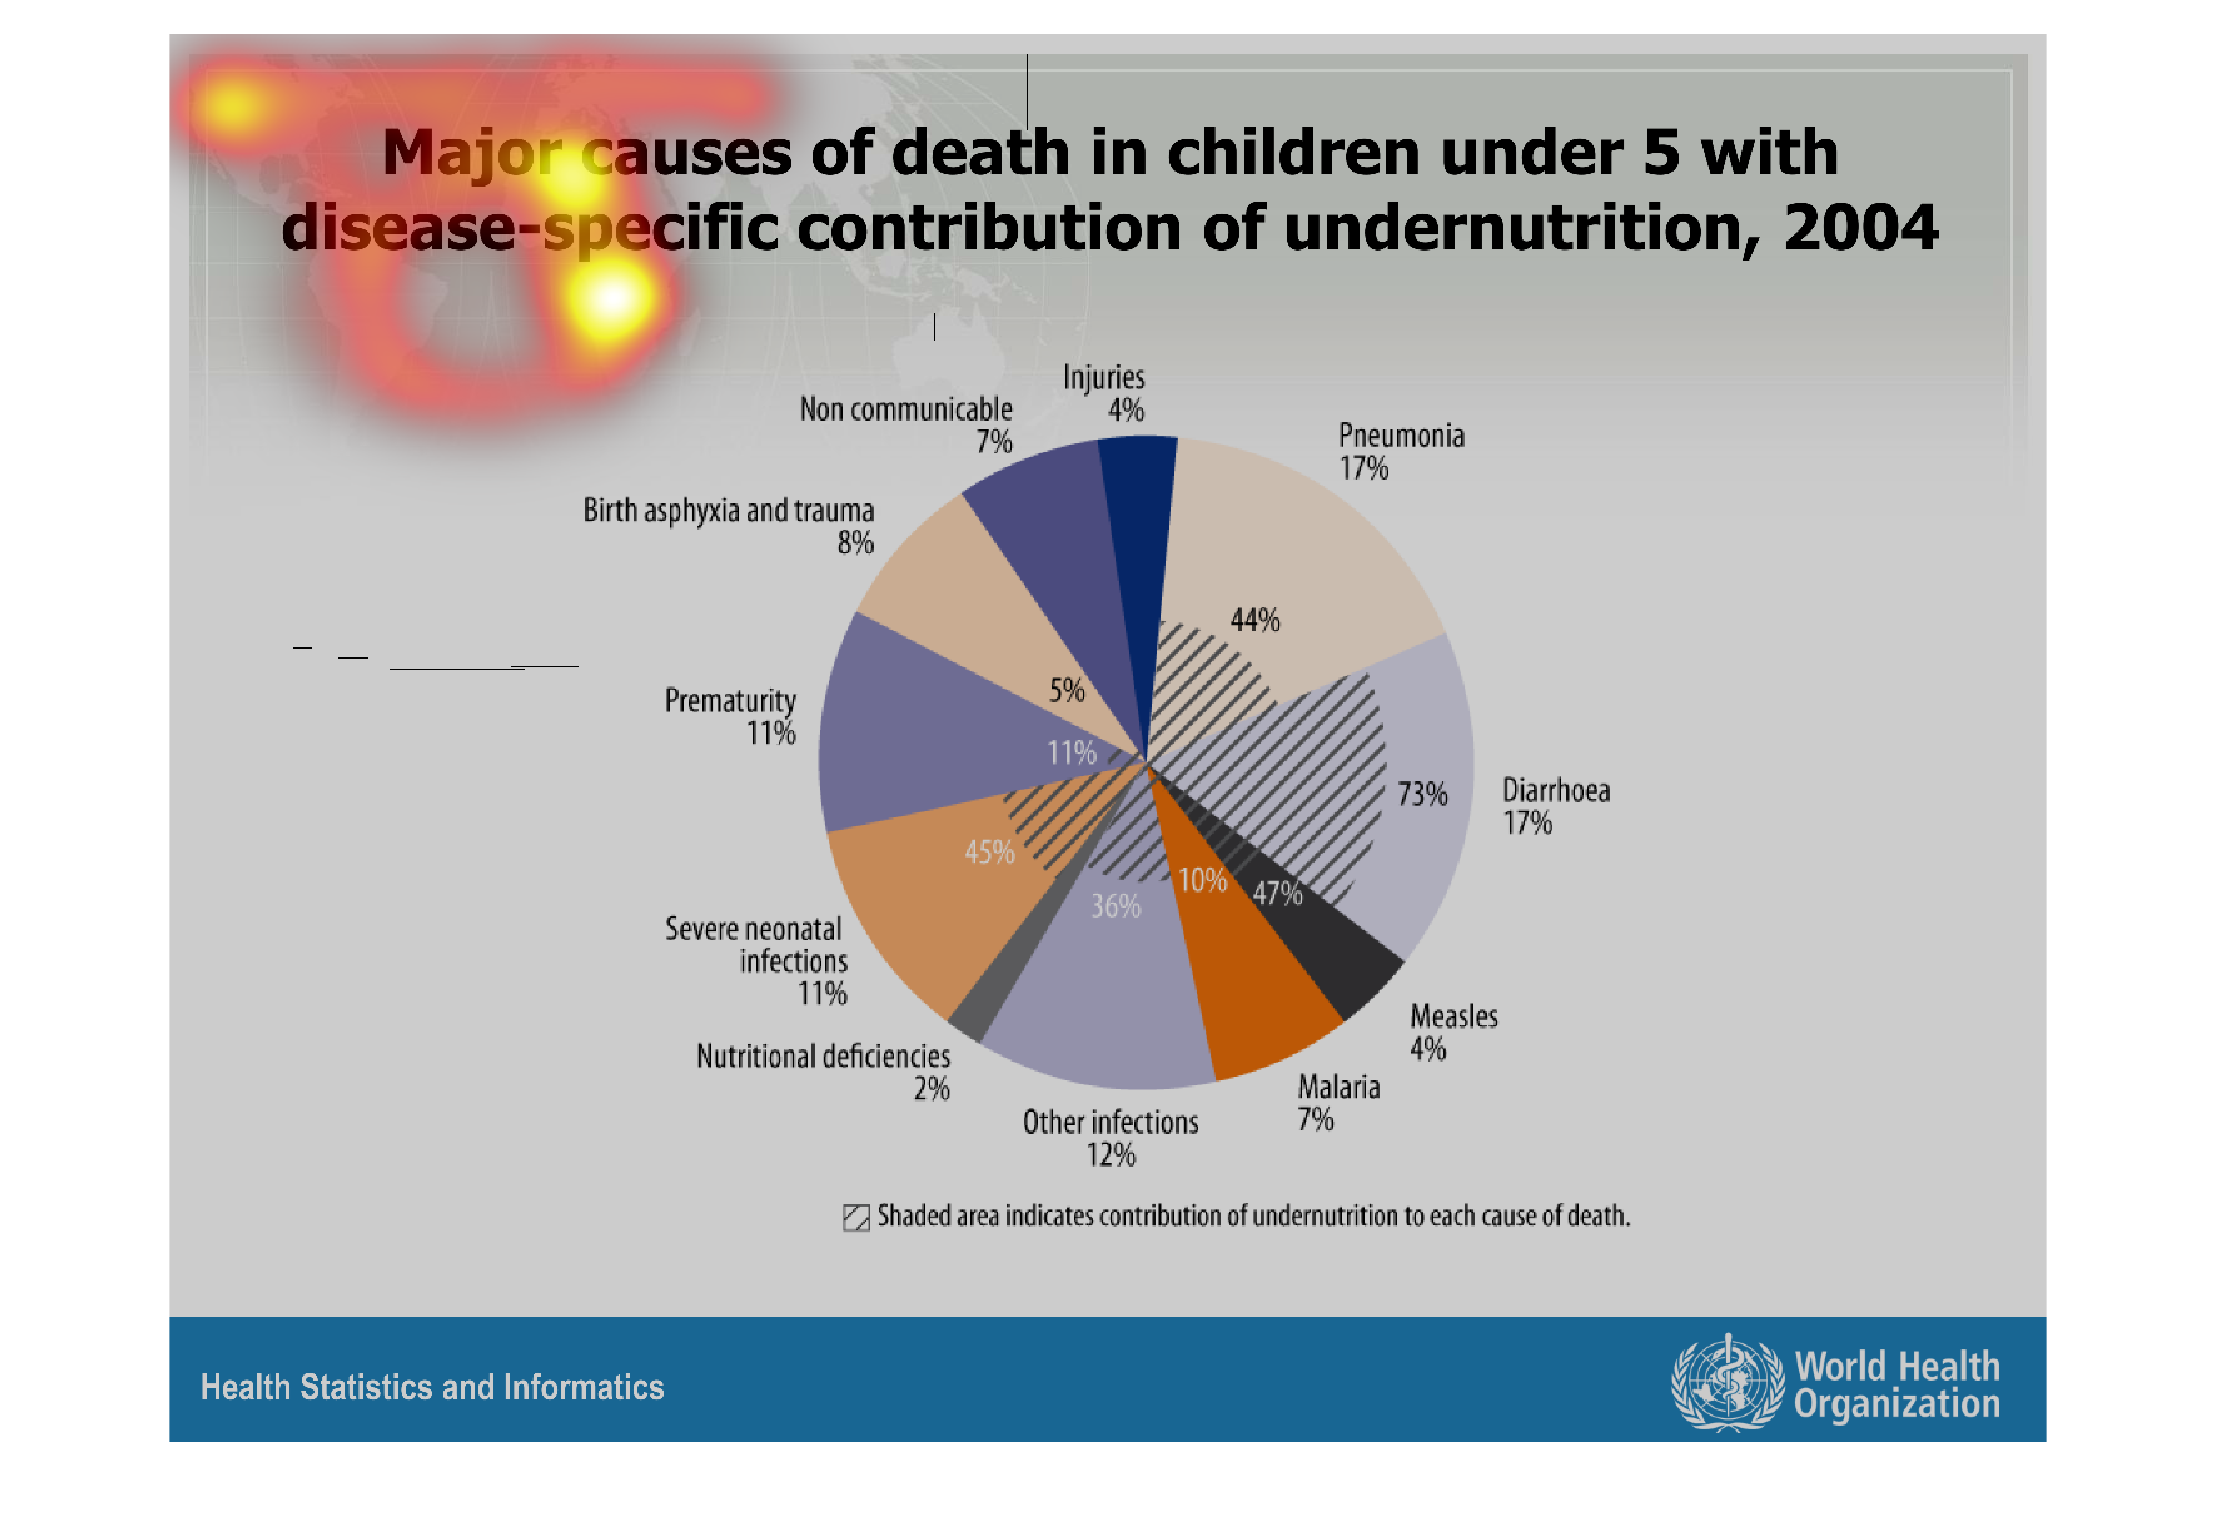
This is a graph of the major causes of death in children under 5 with a disease specific contribution.
The most common cause of death is pneumonia, and the second most common cause is diarrhea.
Warning: Image is too big to fit on screen; displaying at 67%
Warning: Image is too big to fit on screen; displaying at 67%
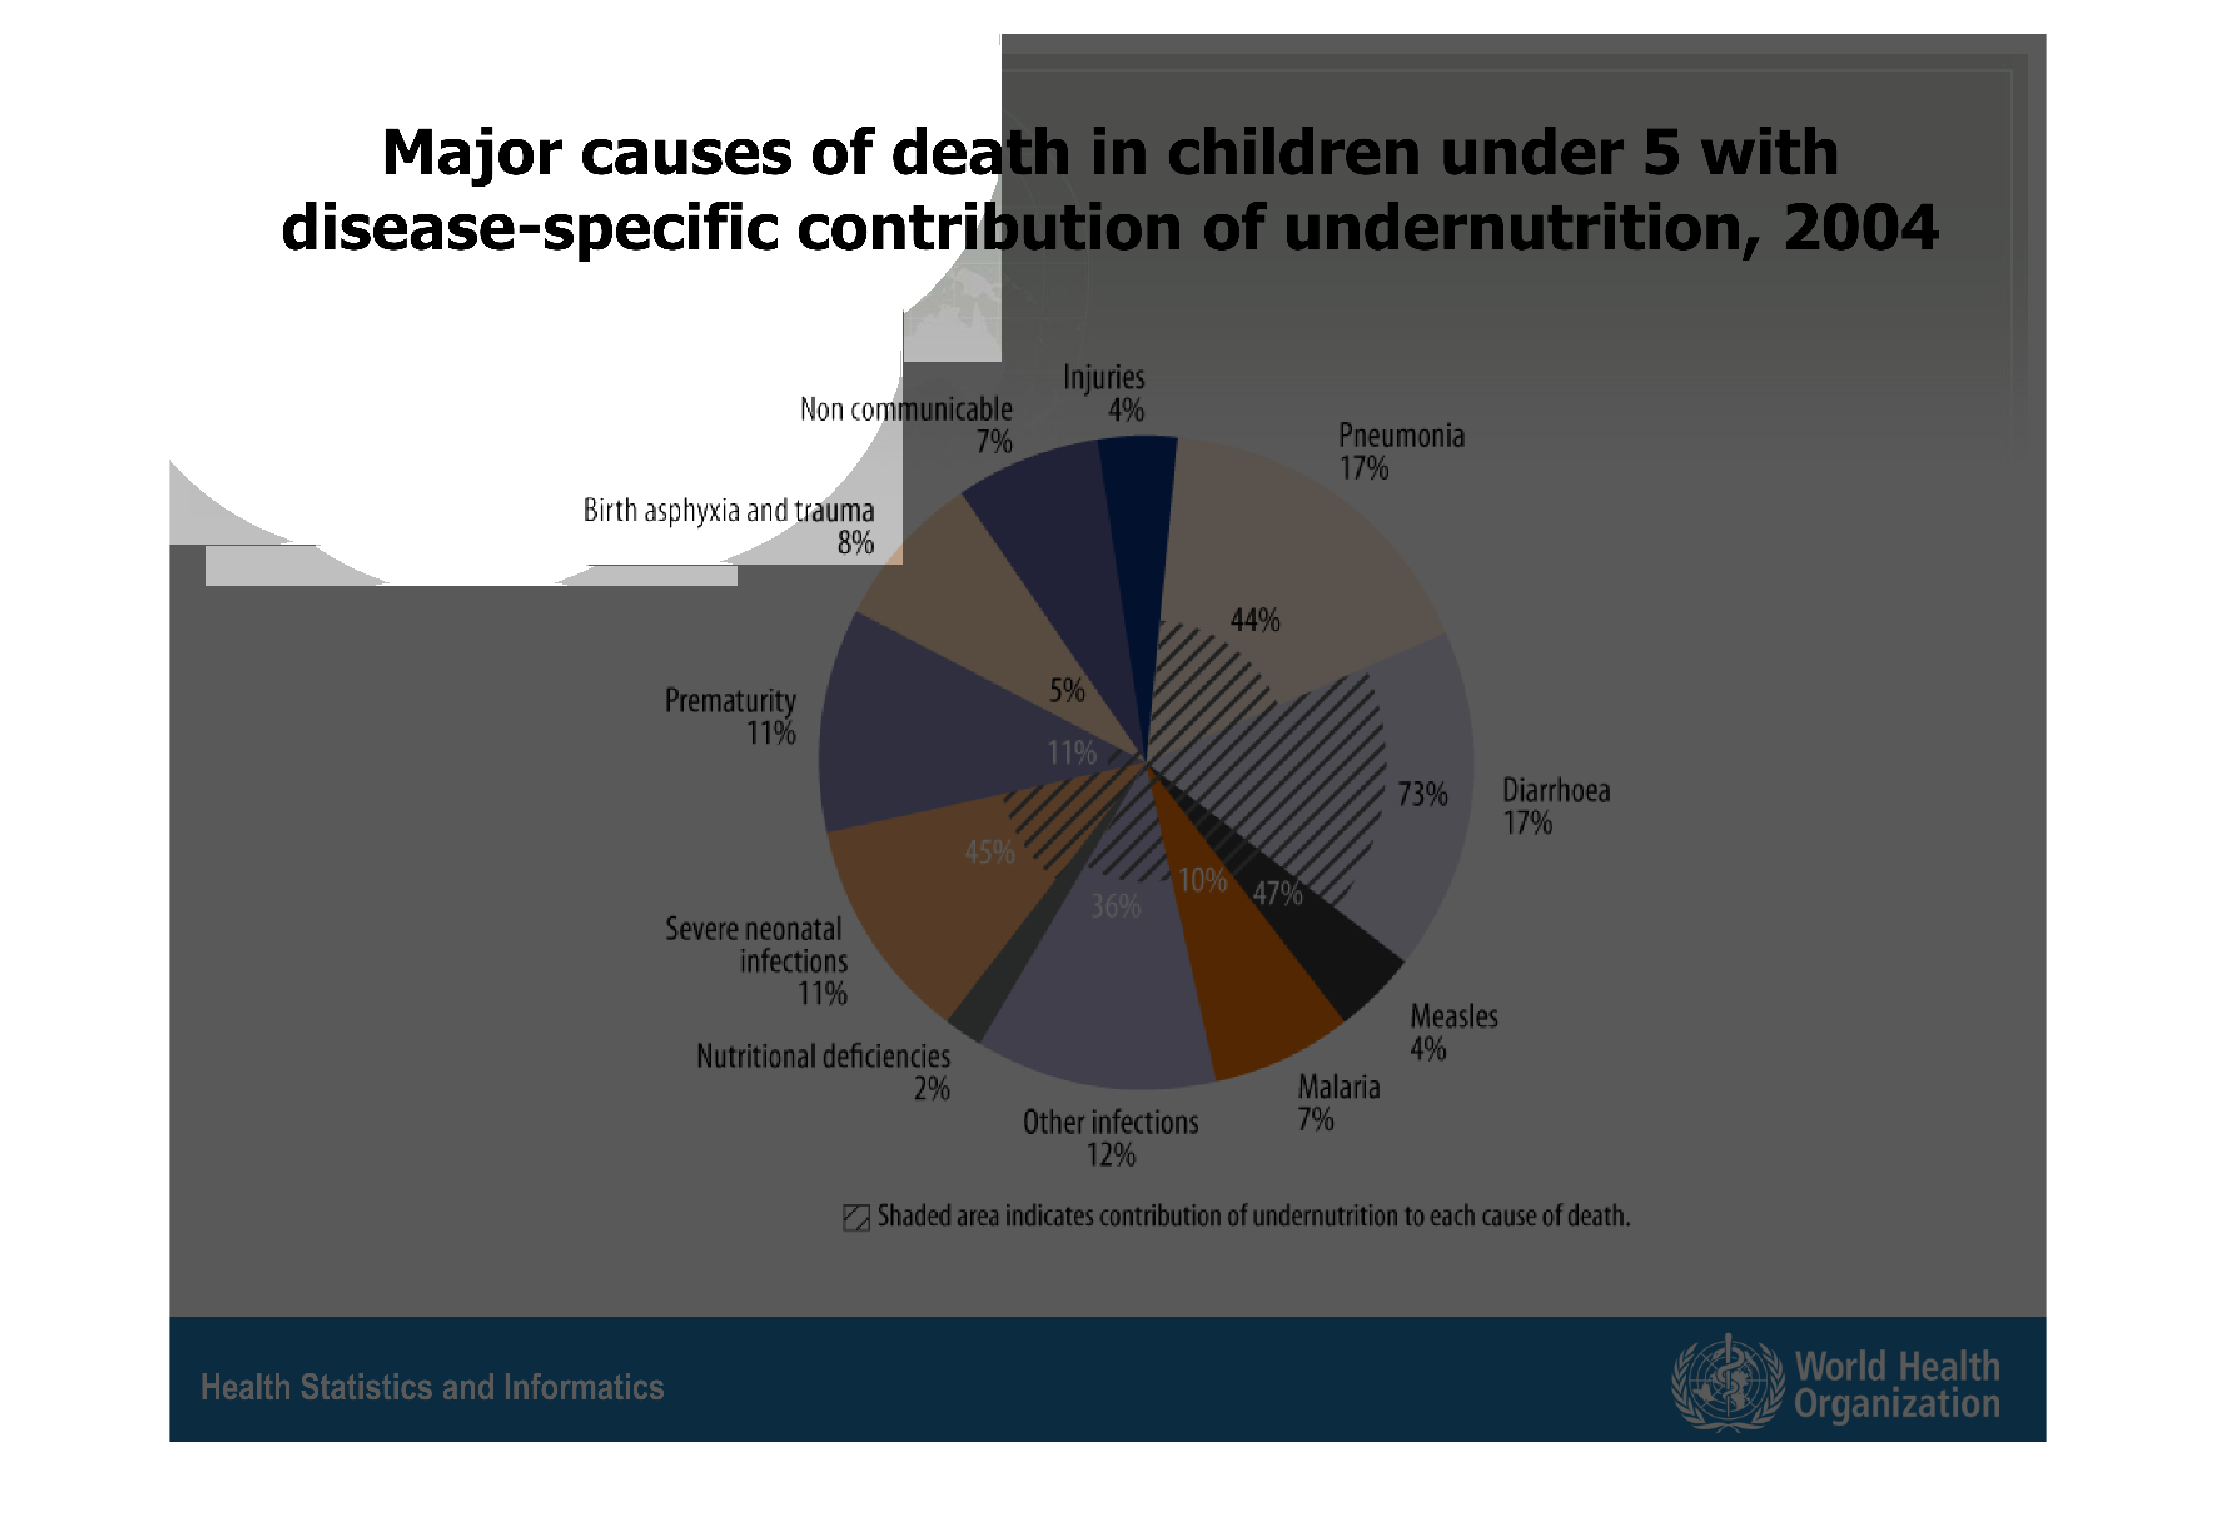
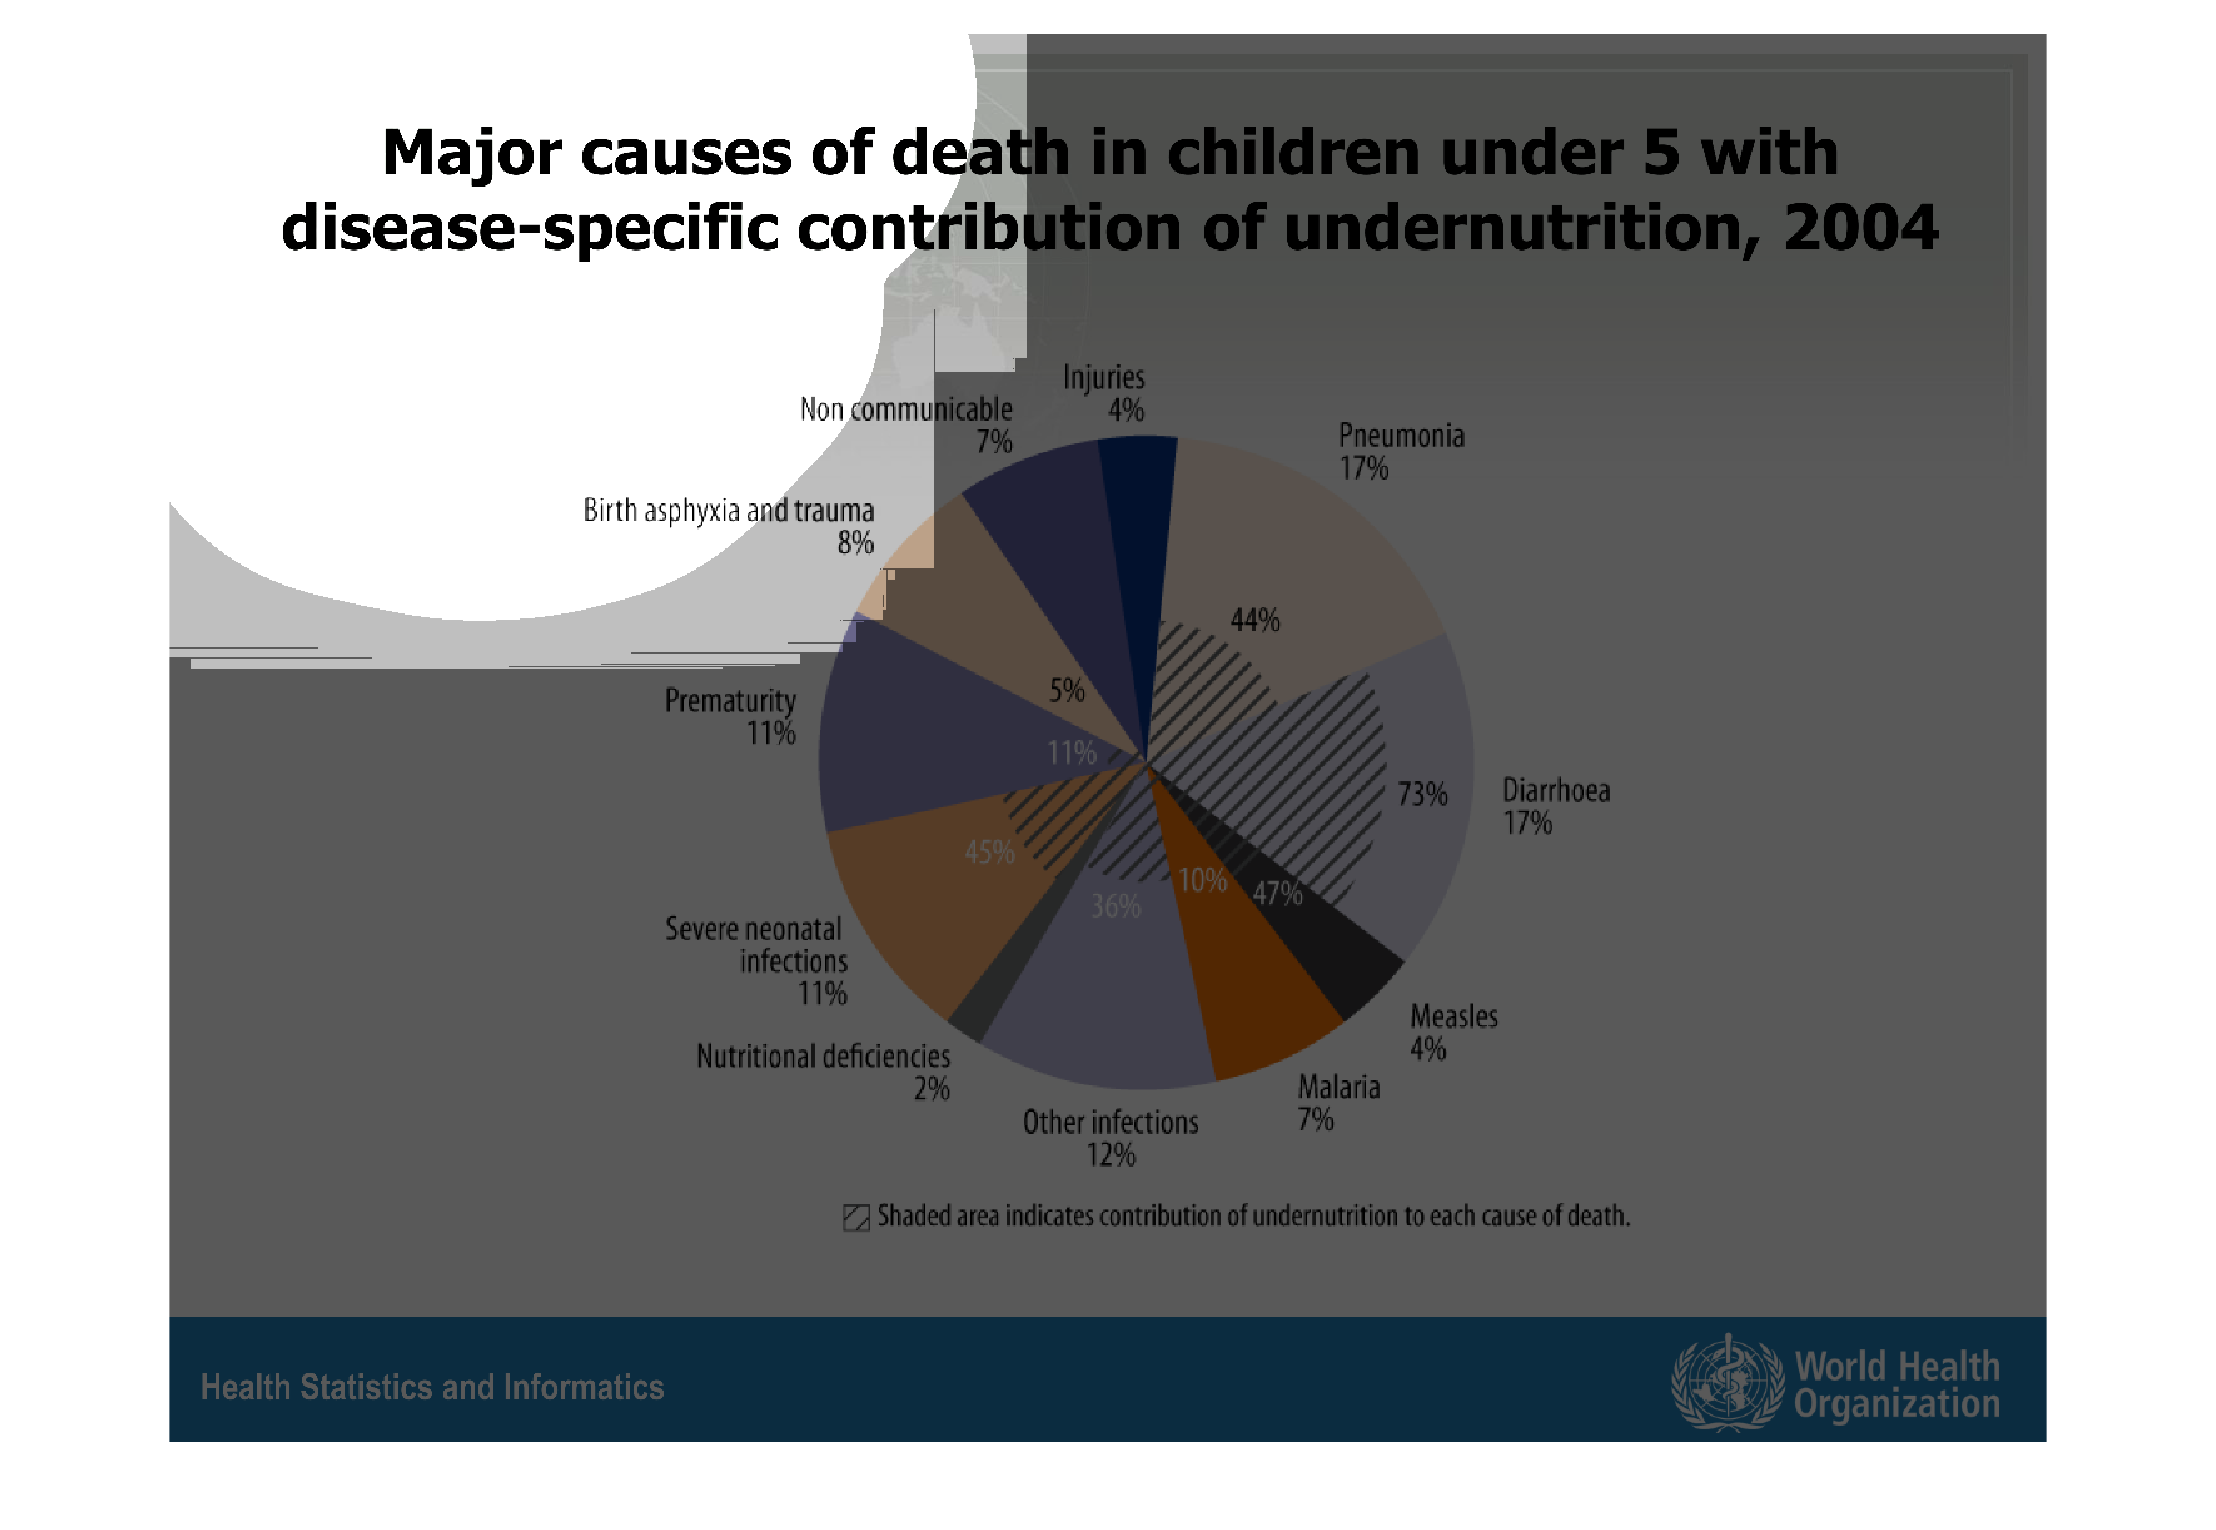
The graph shows major causes of death in children under 5 with disease specific contribution
of undernutrition in 2004. Areas are shaded with stripes to indicate contribution to undernutrition
in each case of death for each disease.
Warning: Image is too big to fit on screen; displaying at 67%
Warning: Image is too big to fit on screen; displaying at 67%
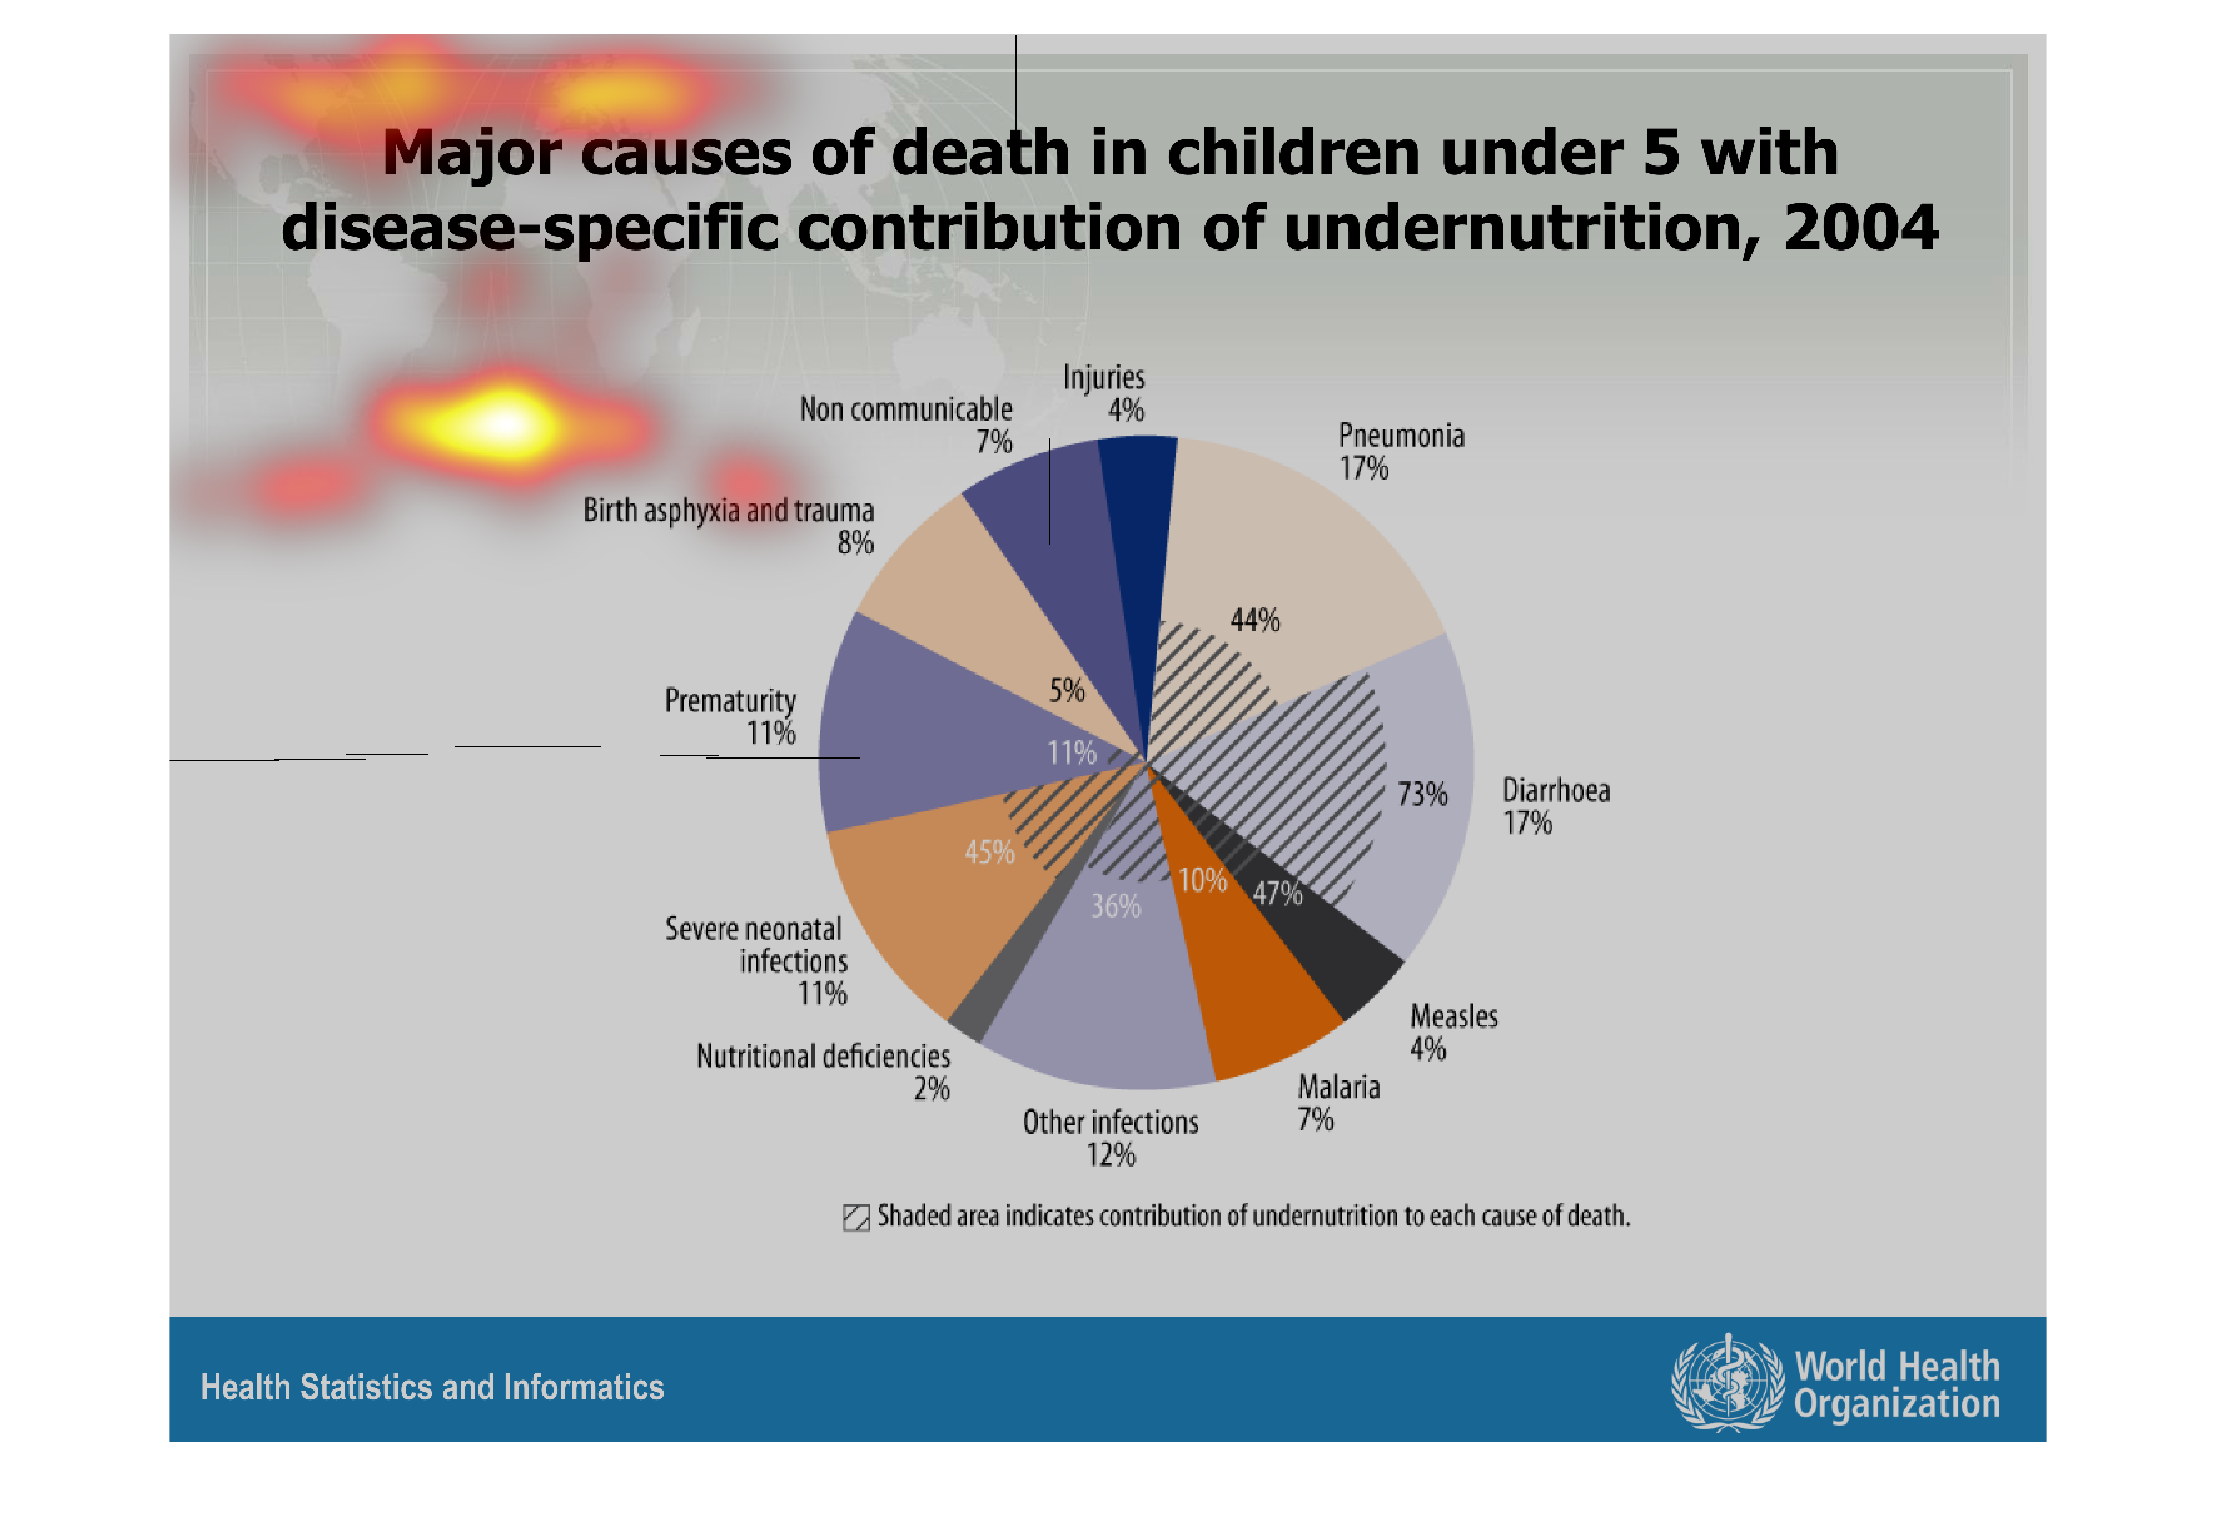
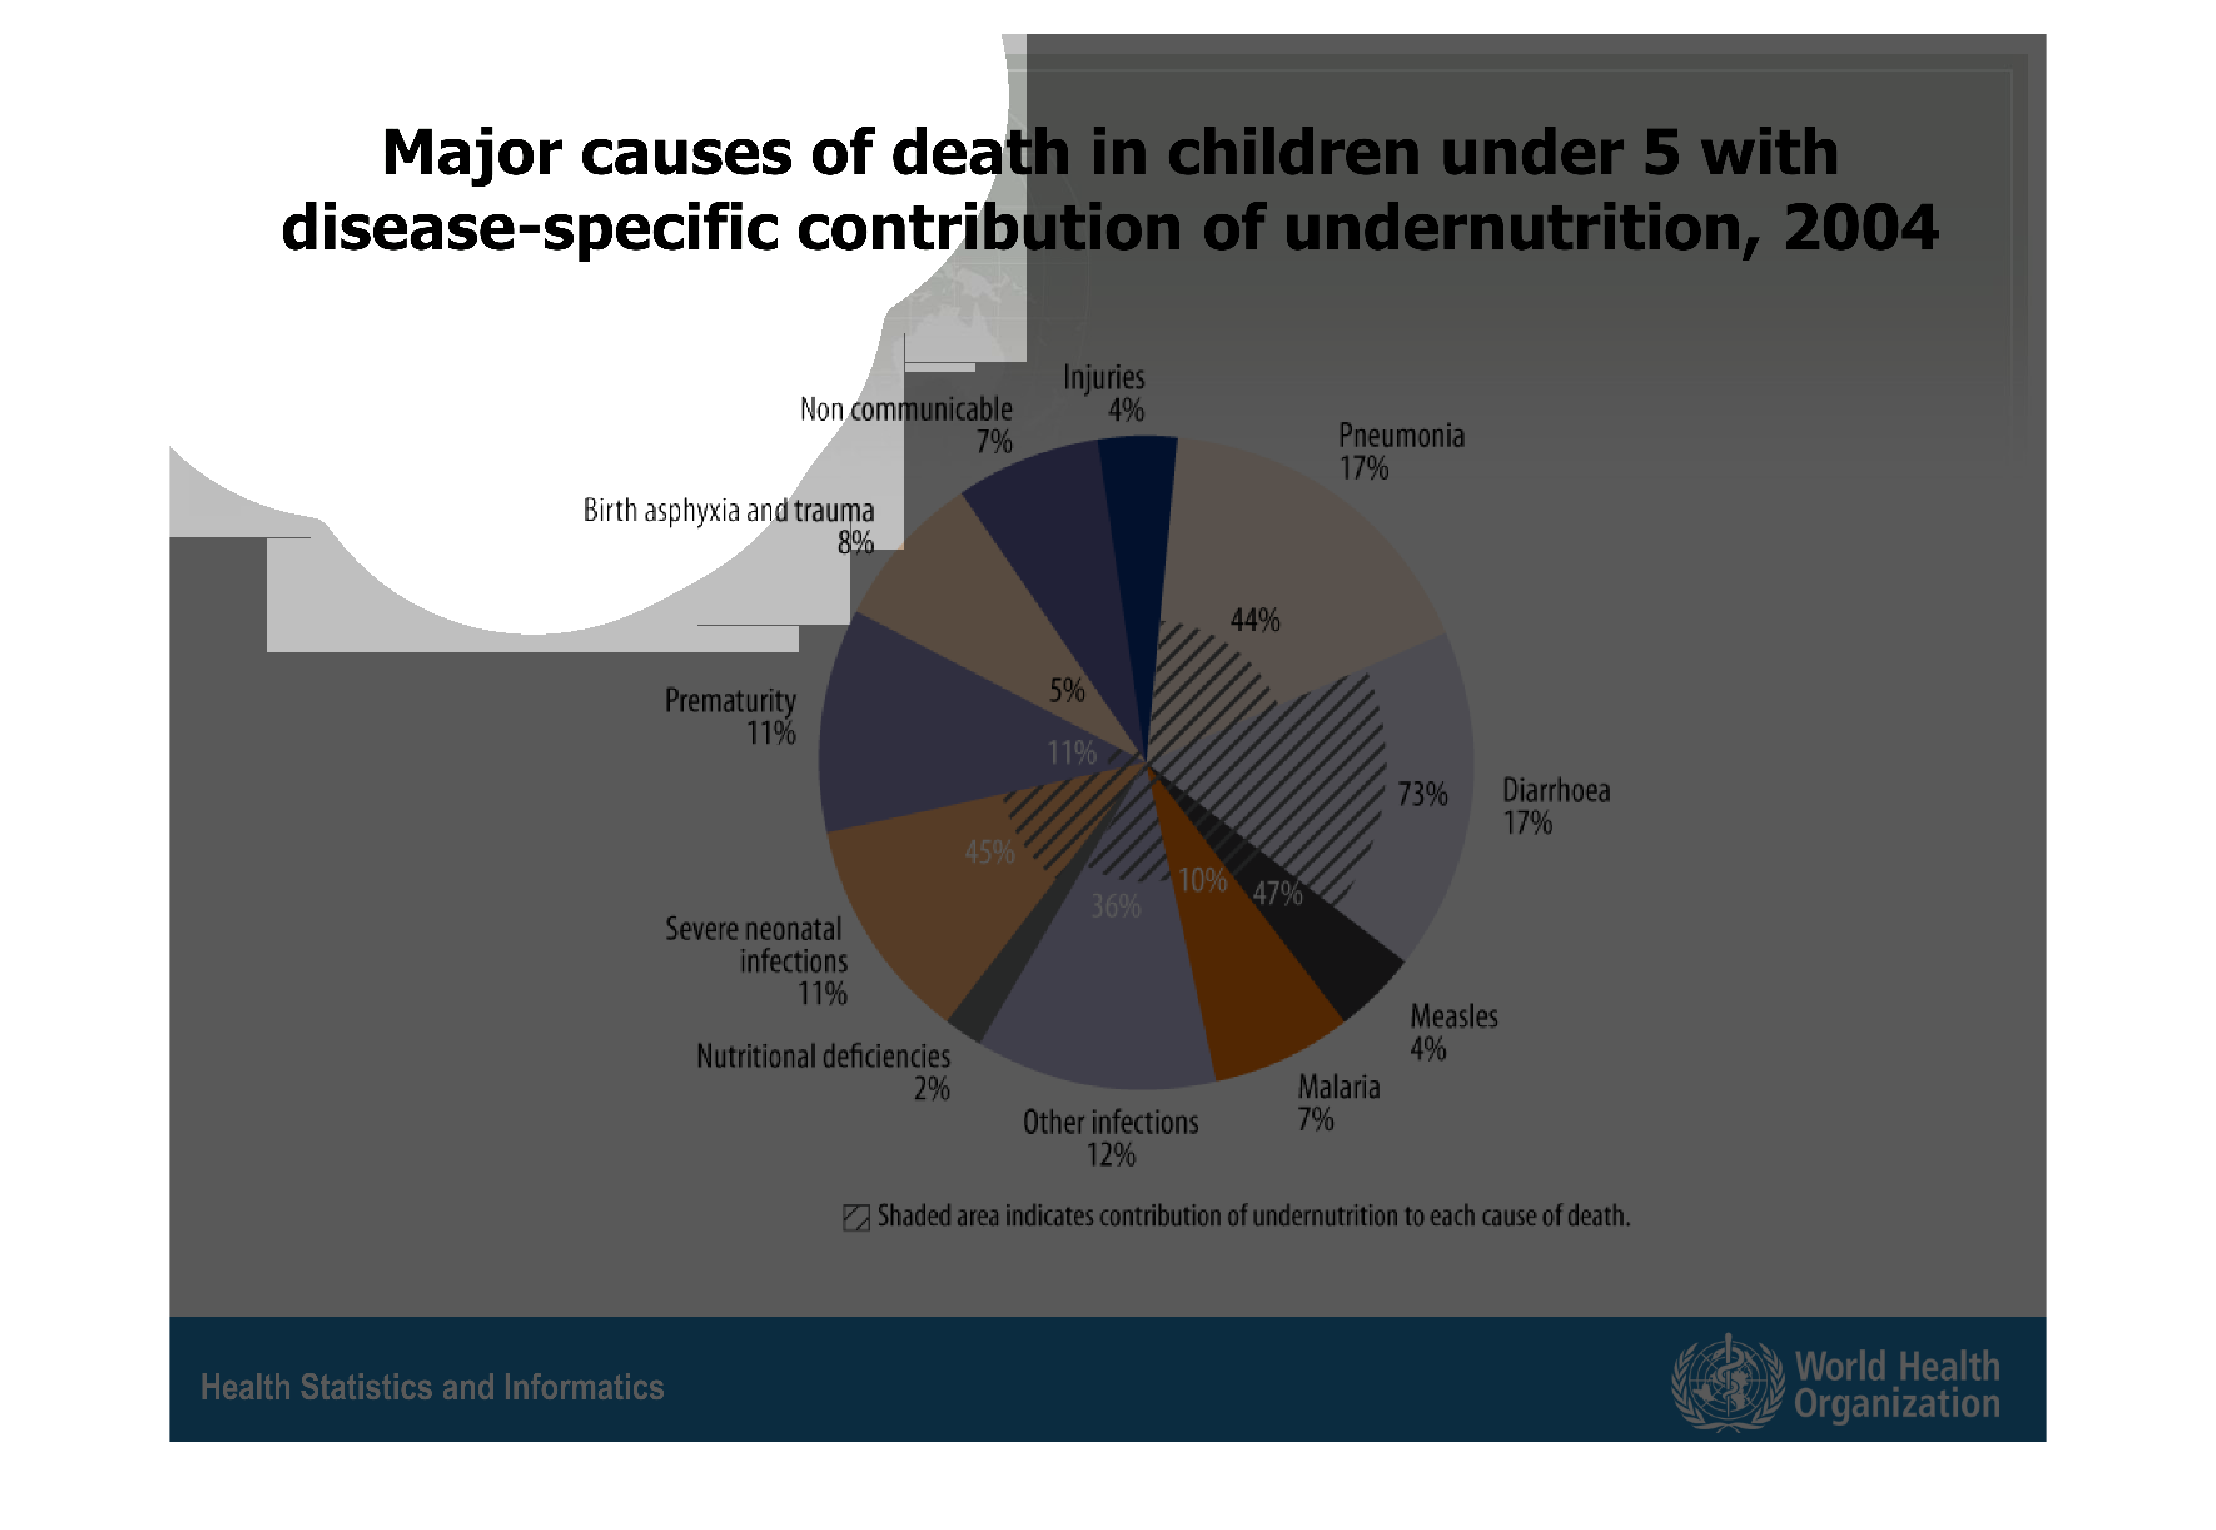
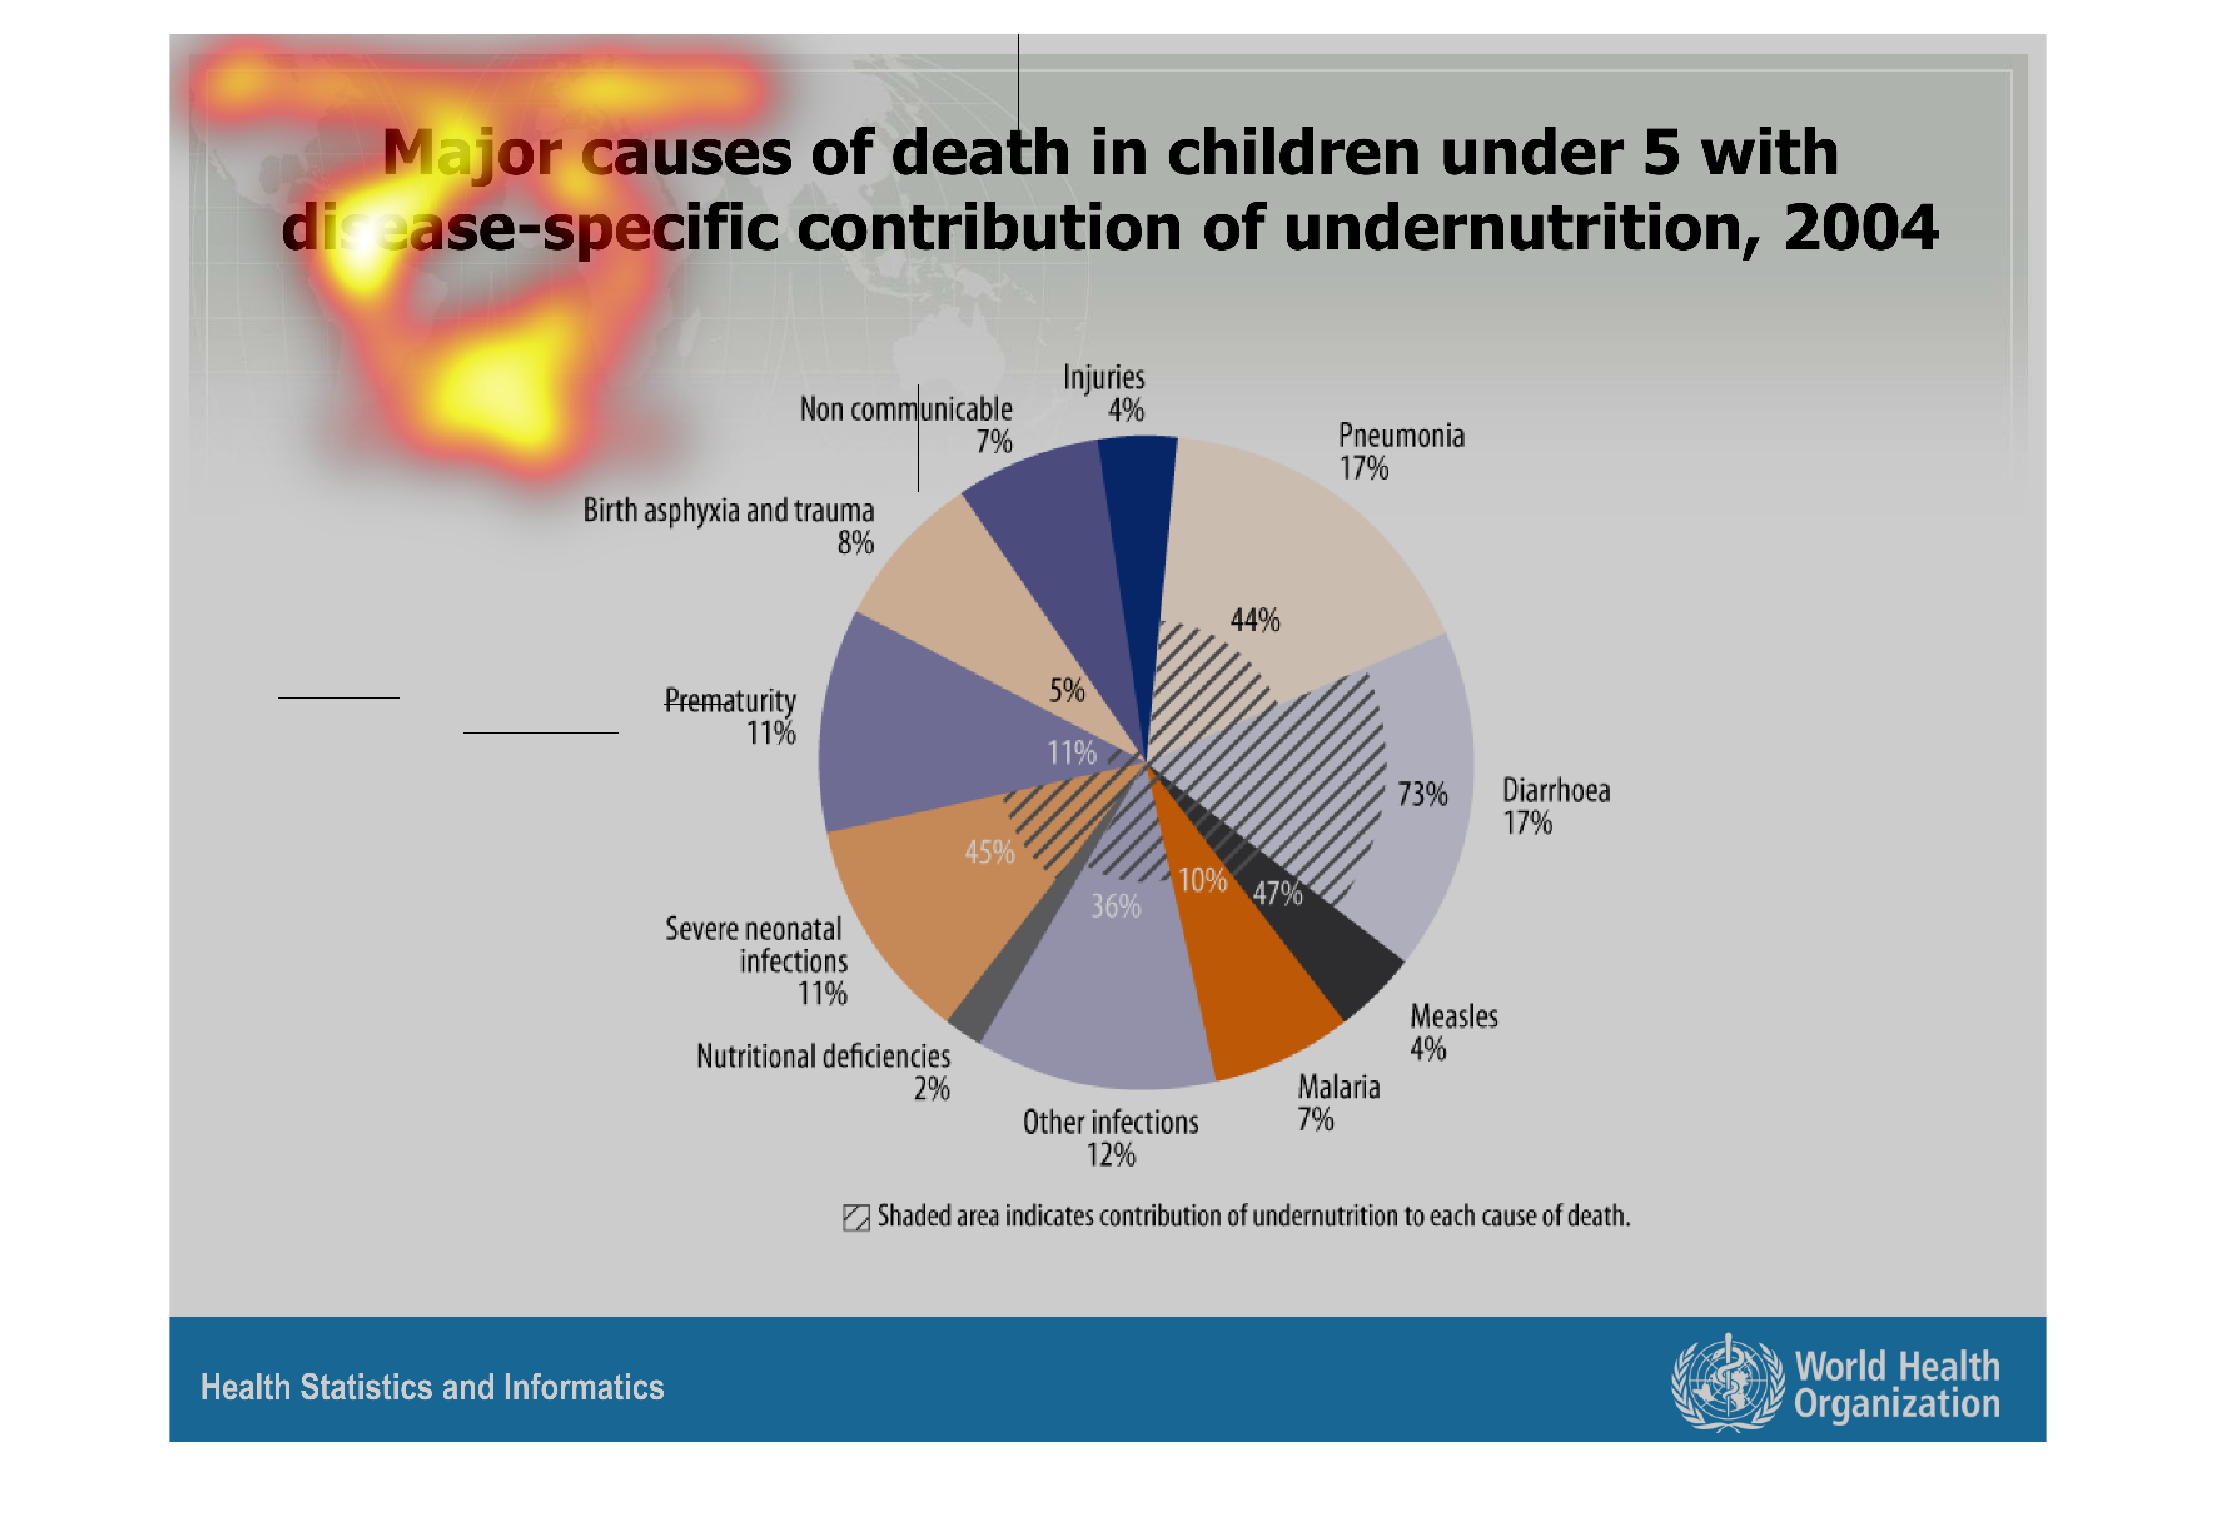
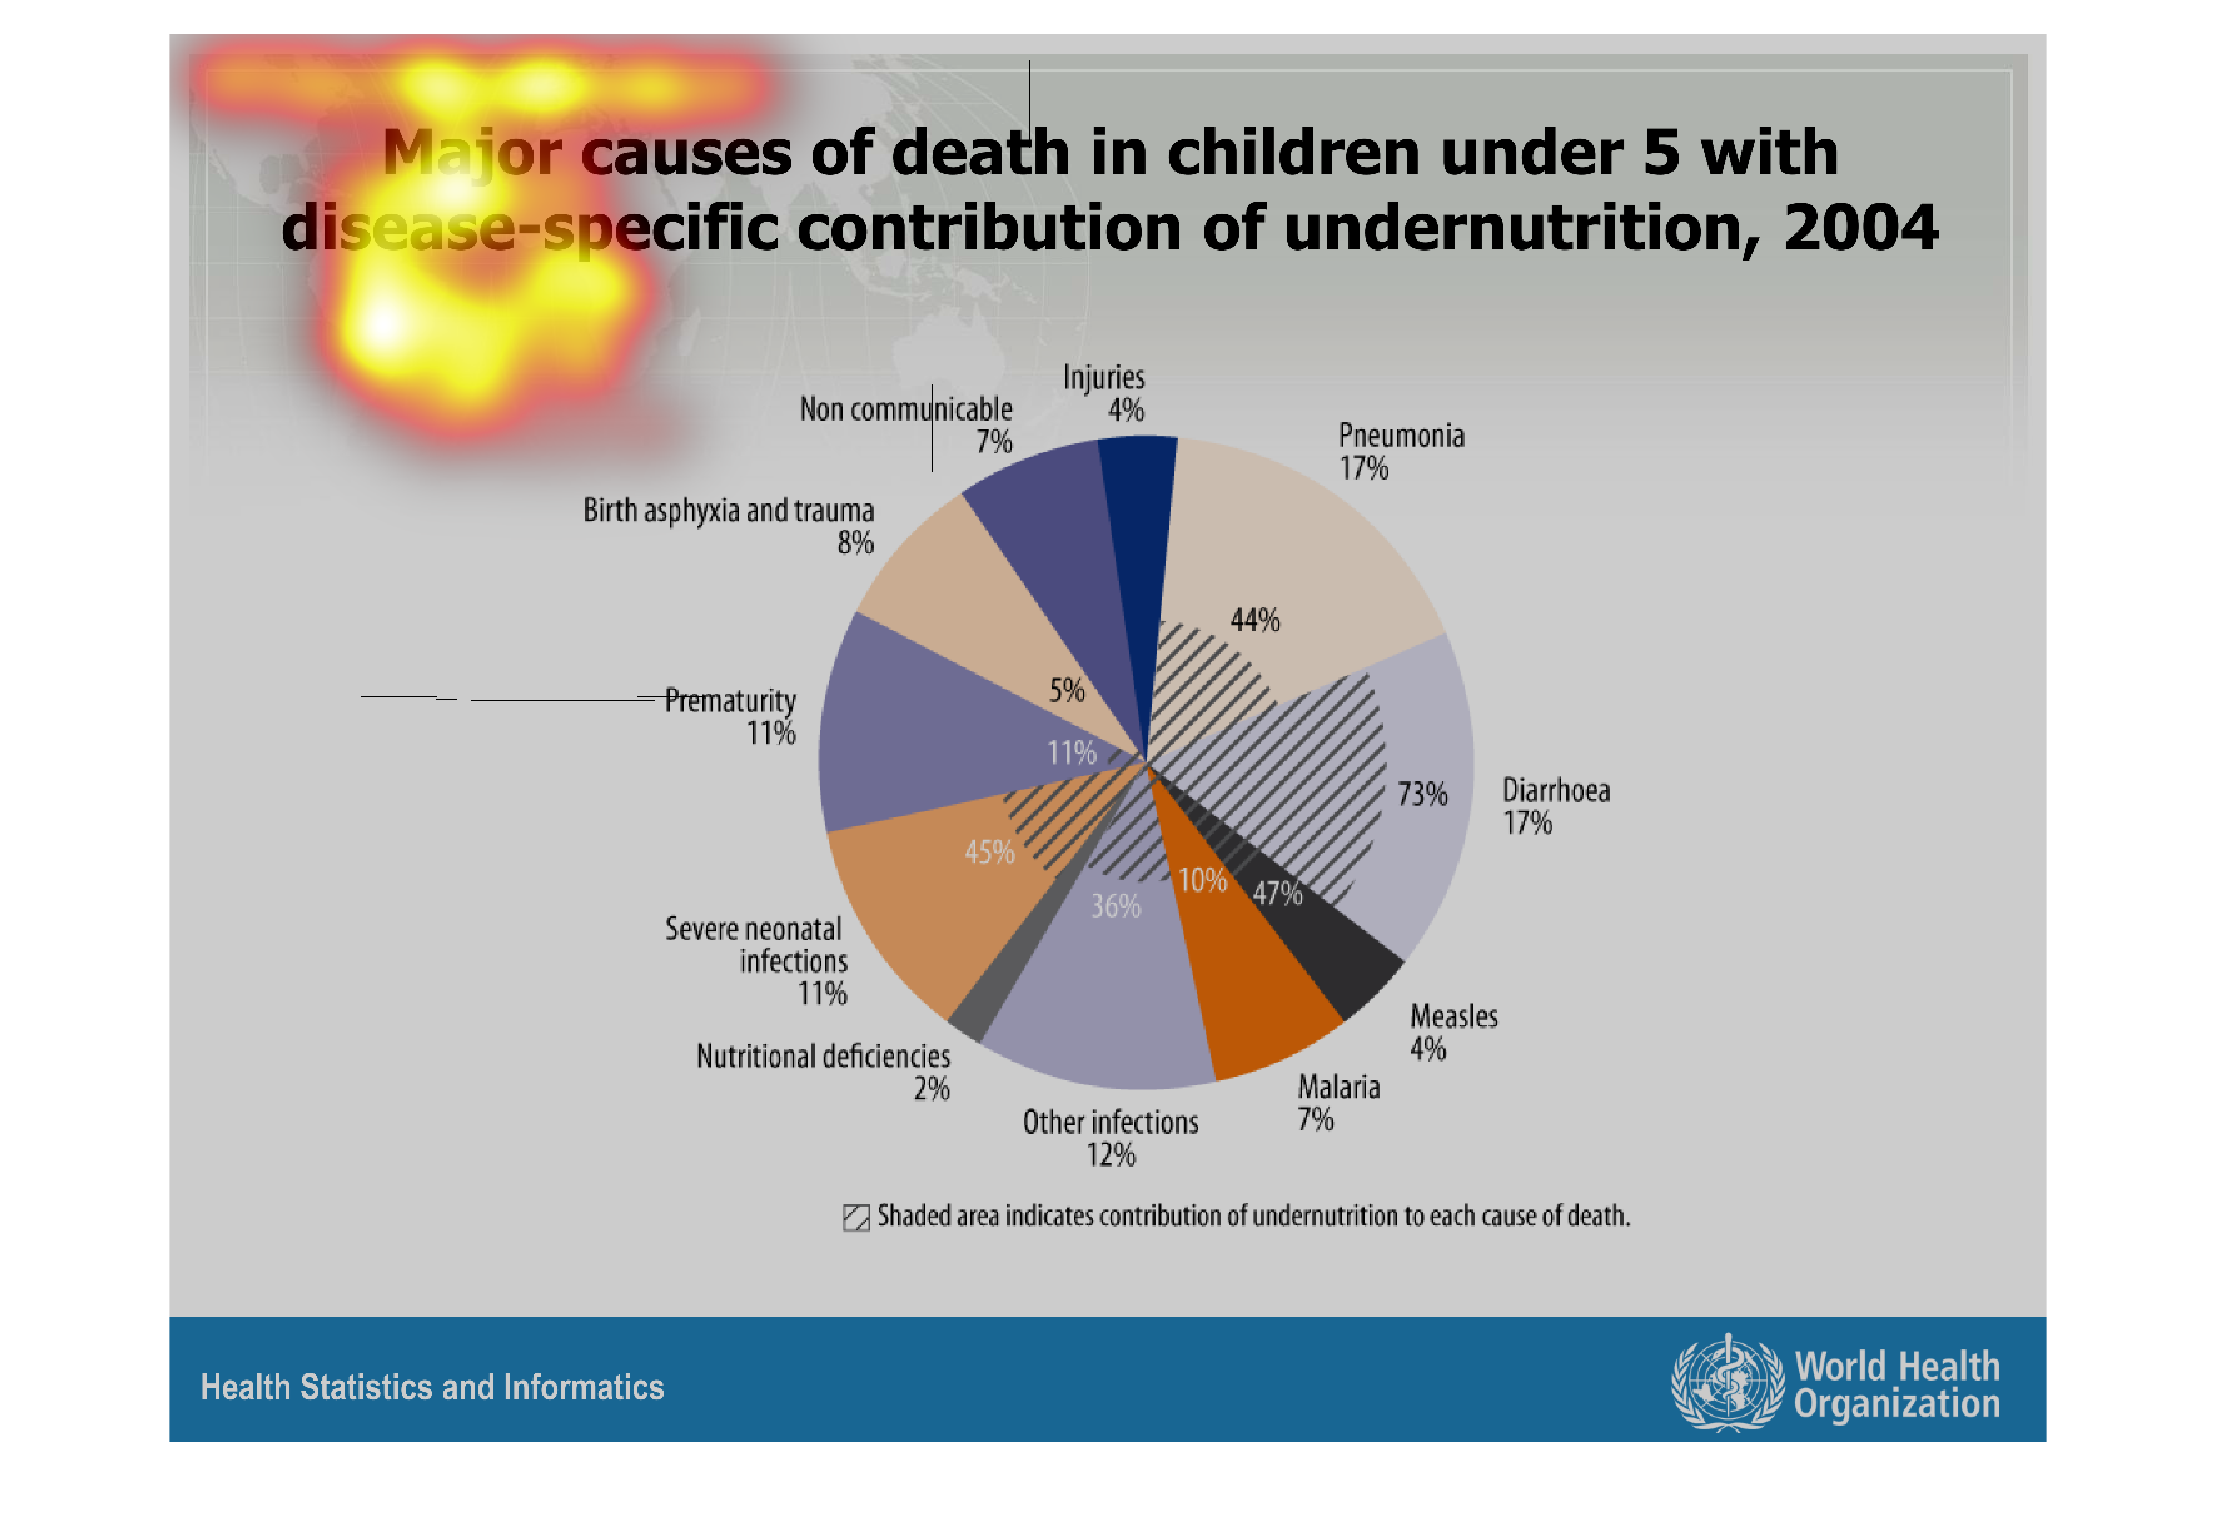
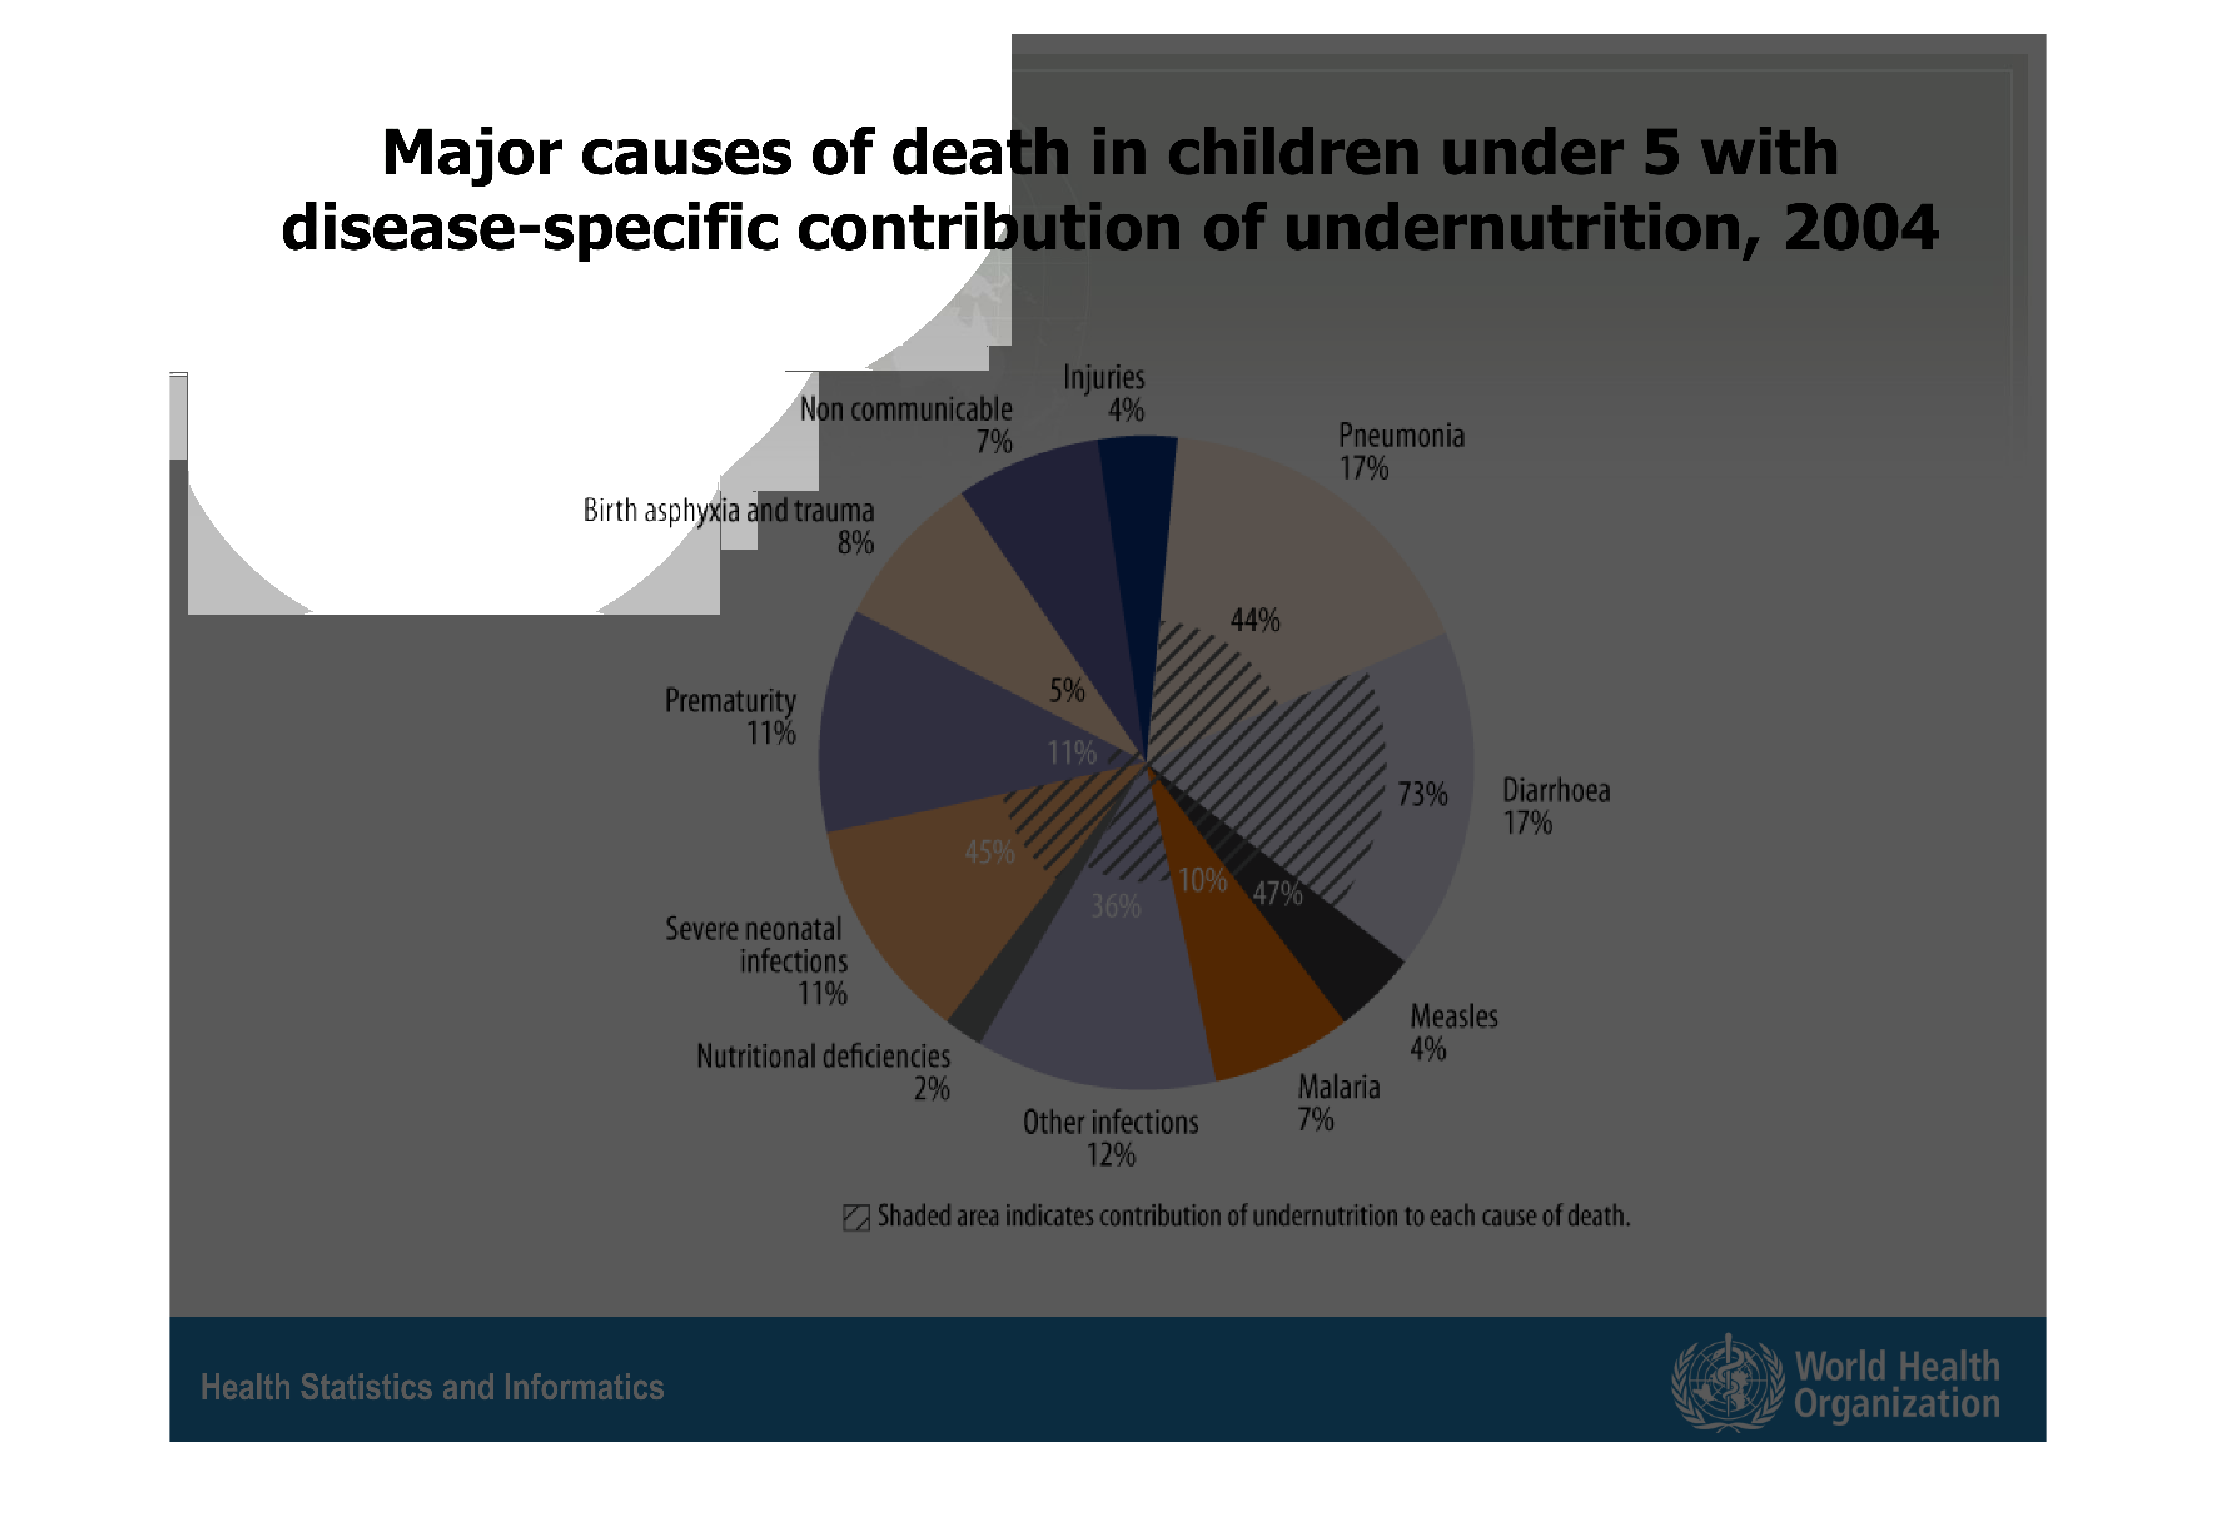
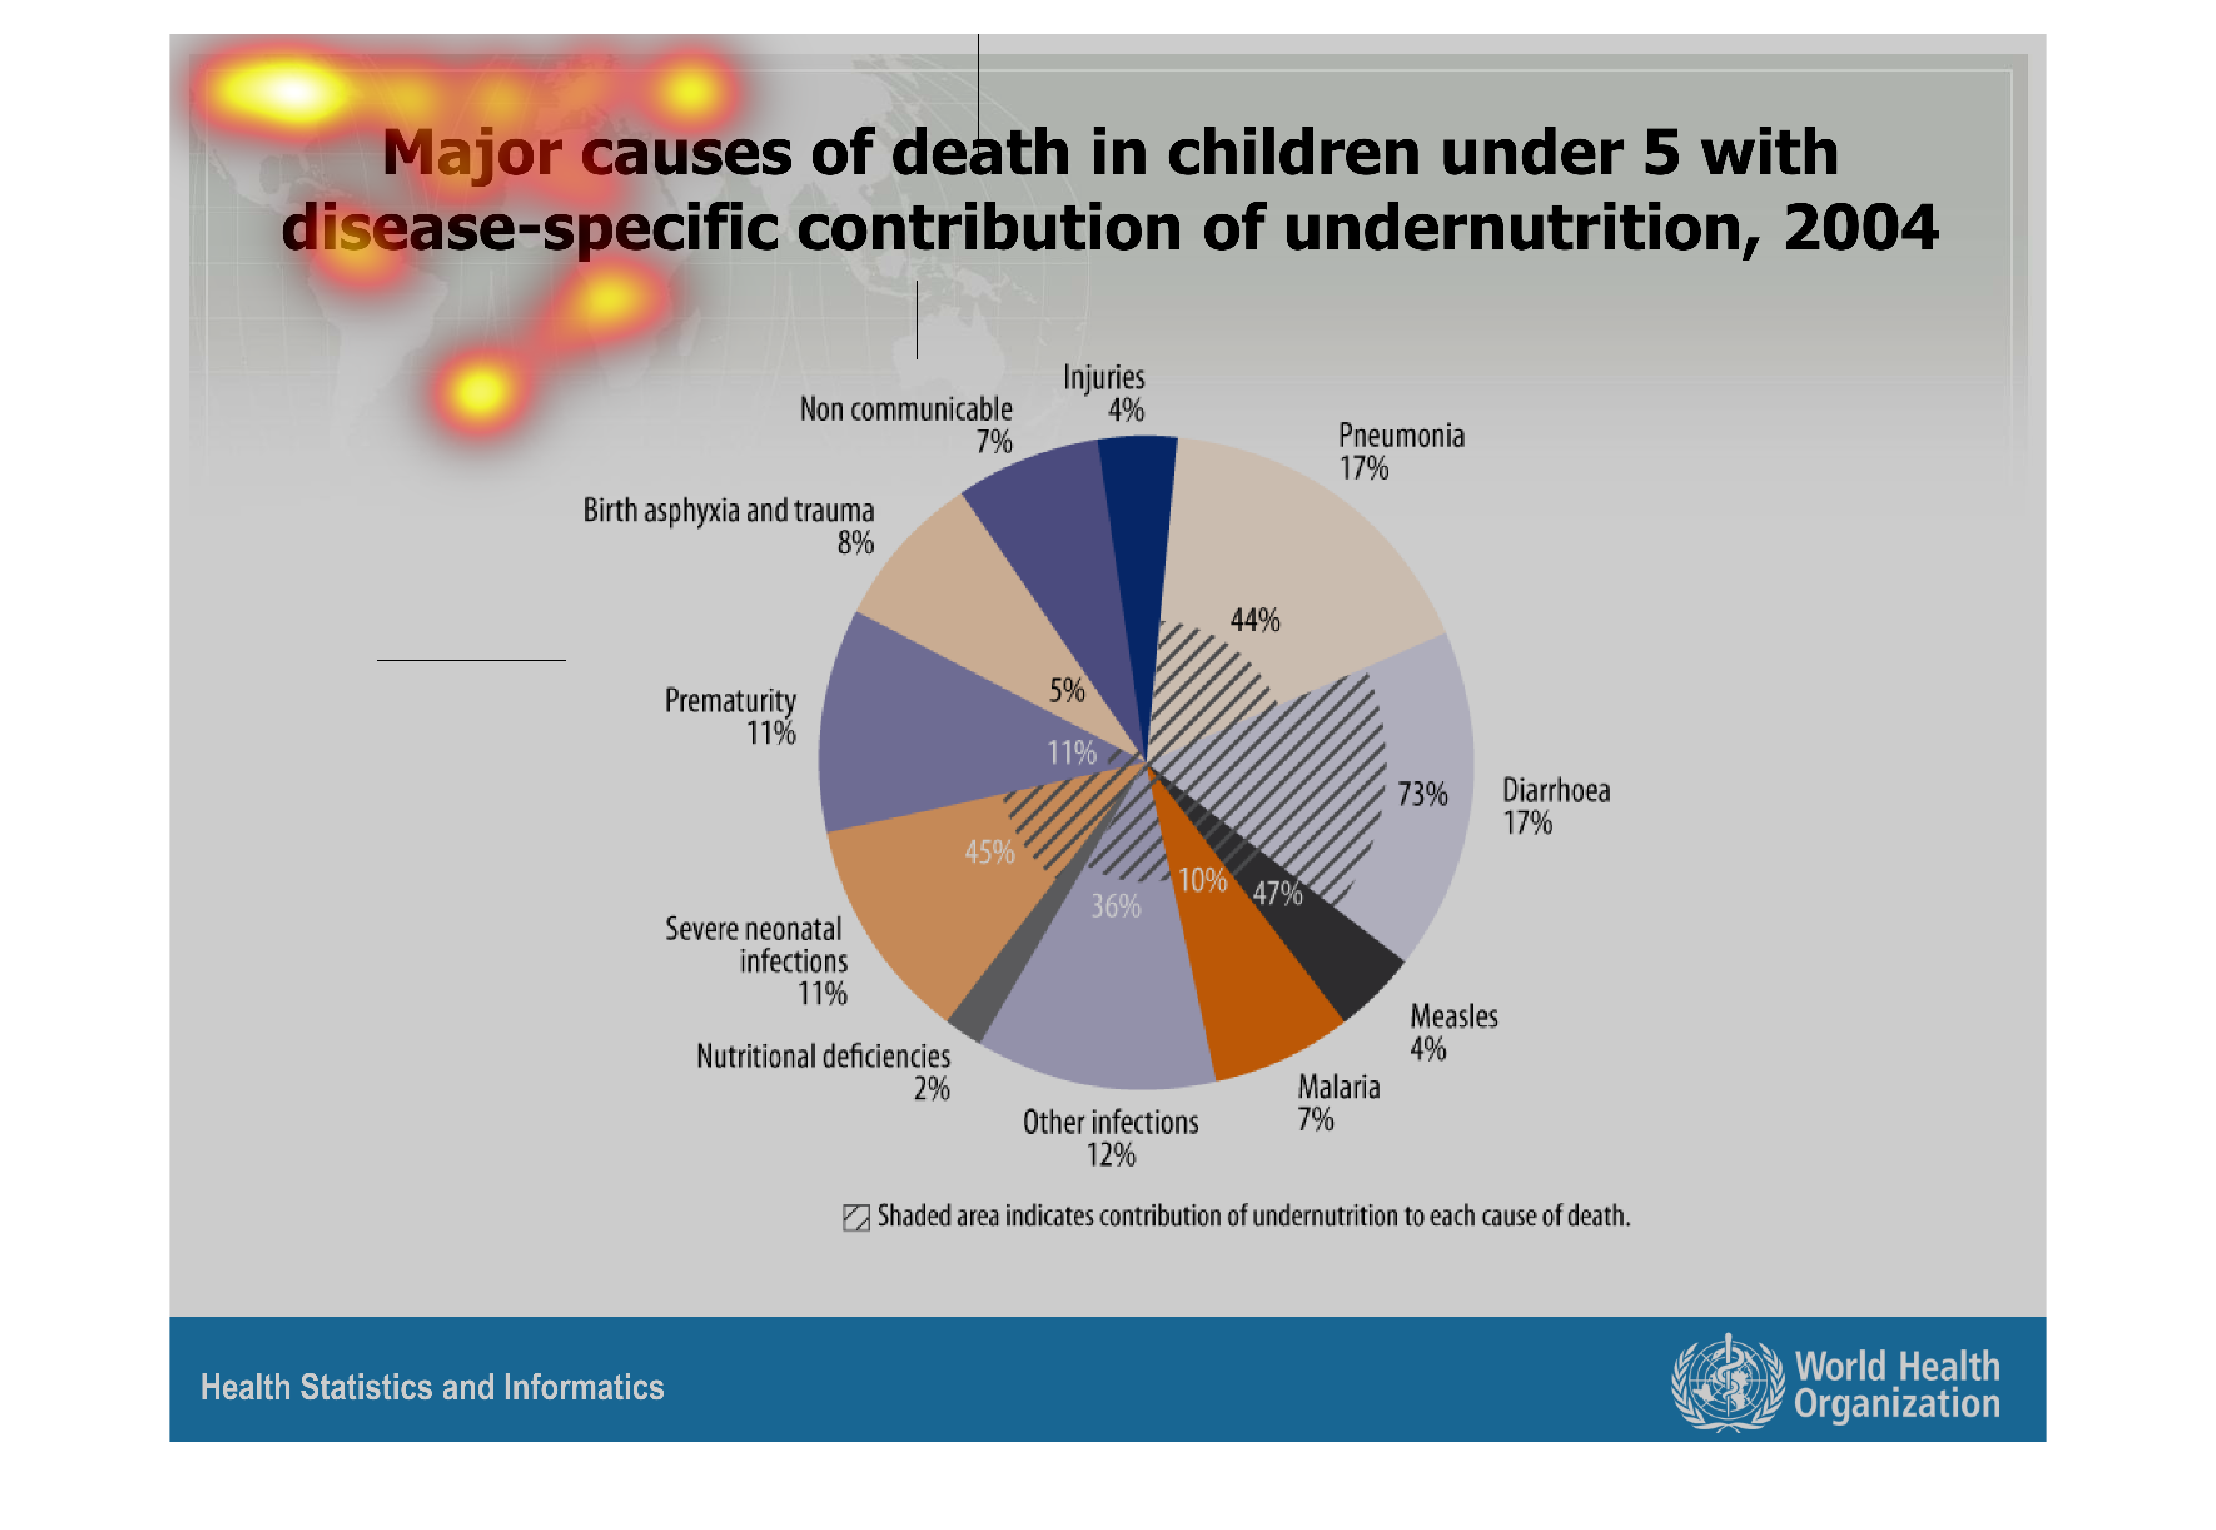
A infographic pie chart of causes of death for children under 5 years old from 2004 data.
Shows wide variety are causes but pneumonia is singular greatest cause.
Warning: Image is too big to fit on screen; displaying at 67%
Warning: Image is too big to fit on screen; displaying at 67%
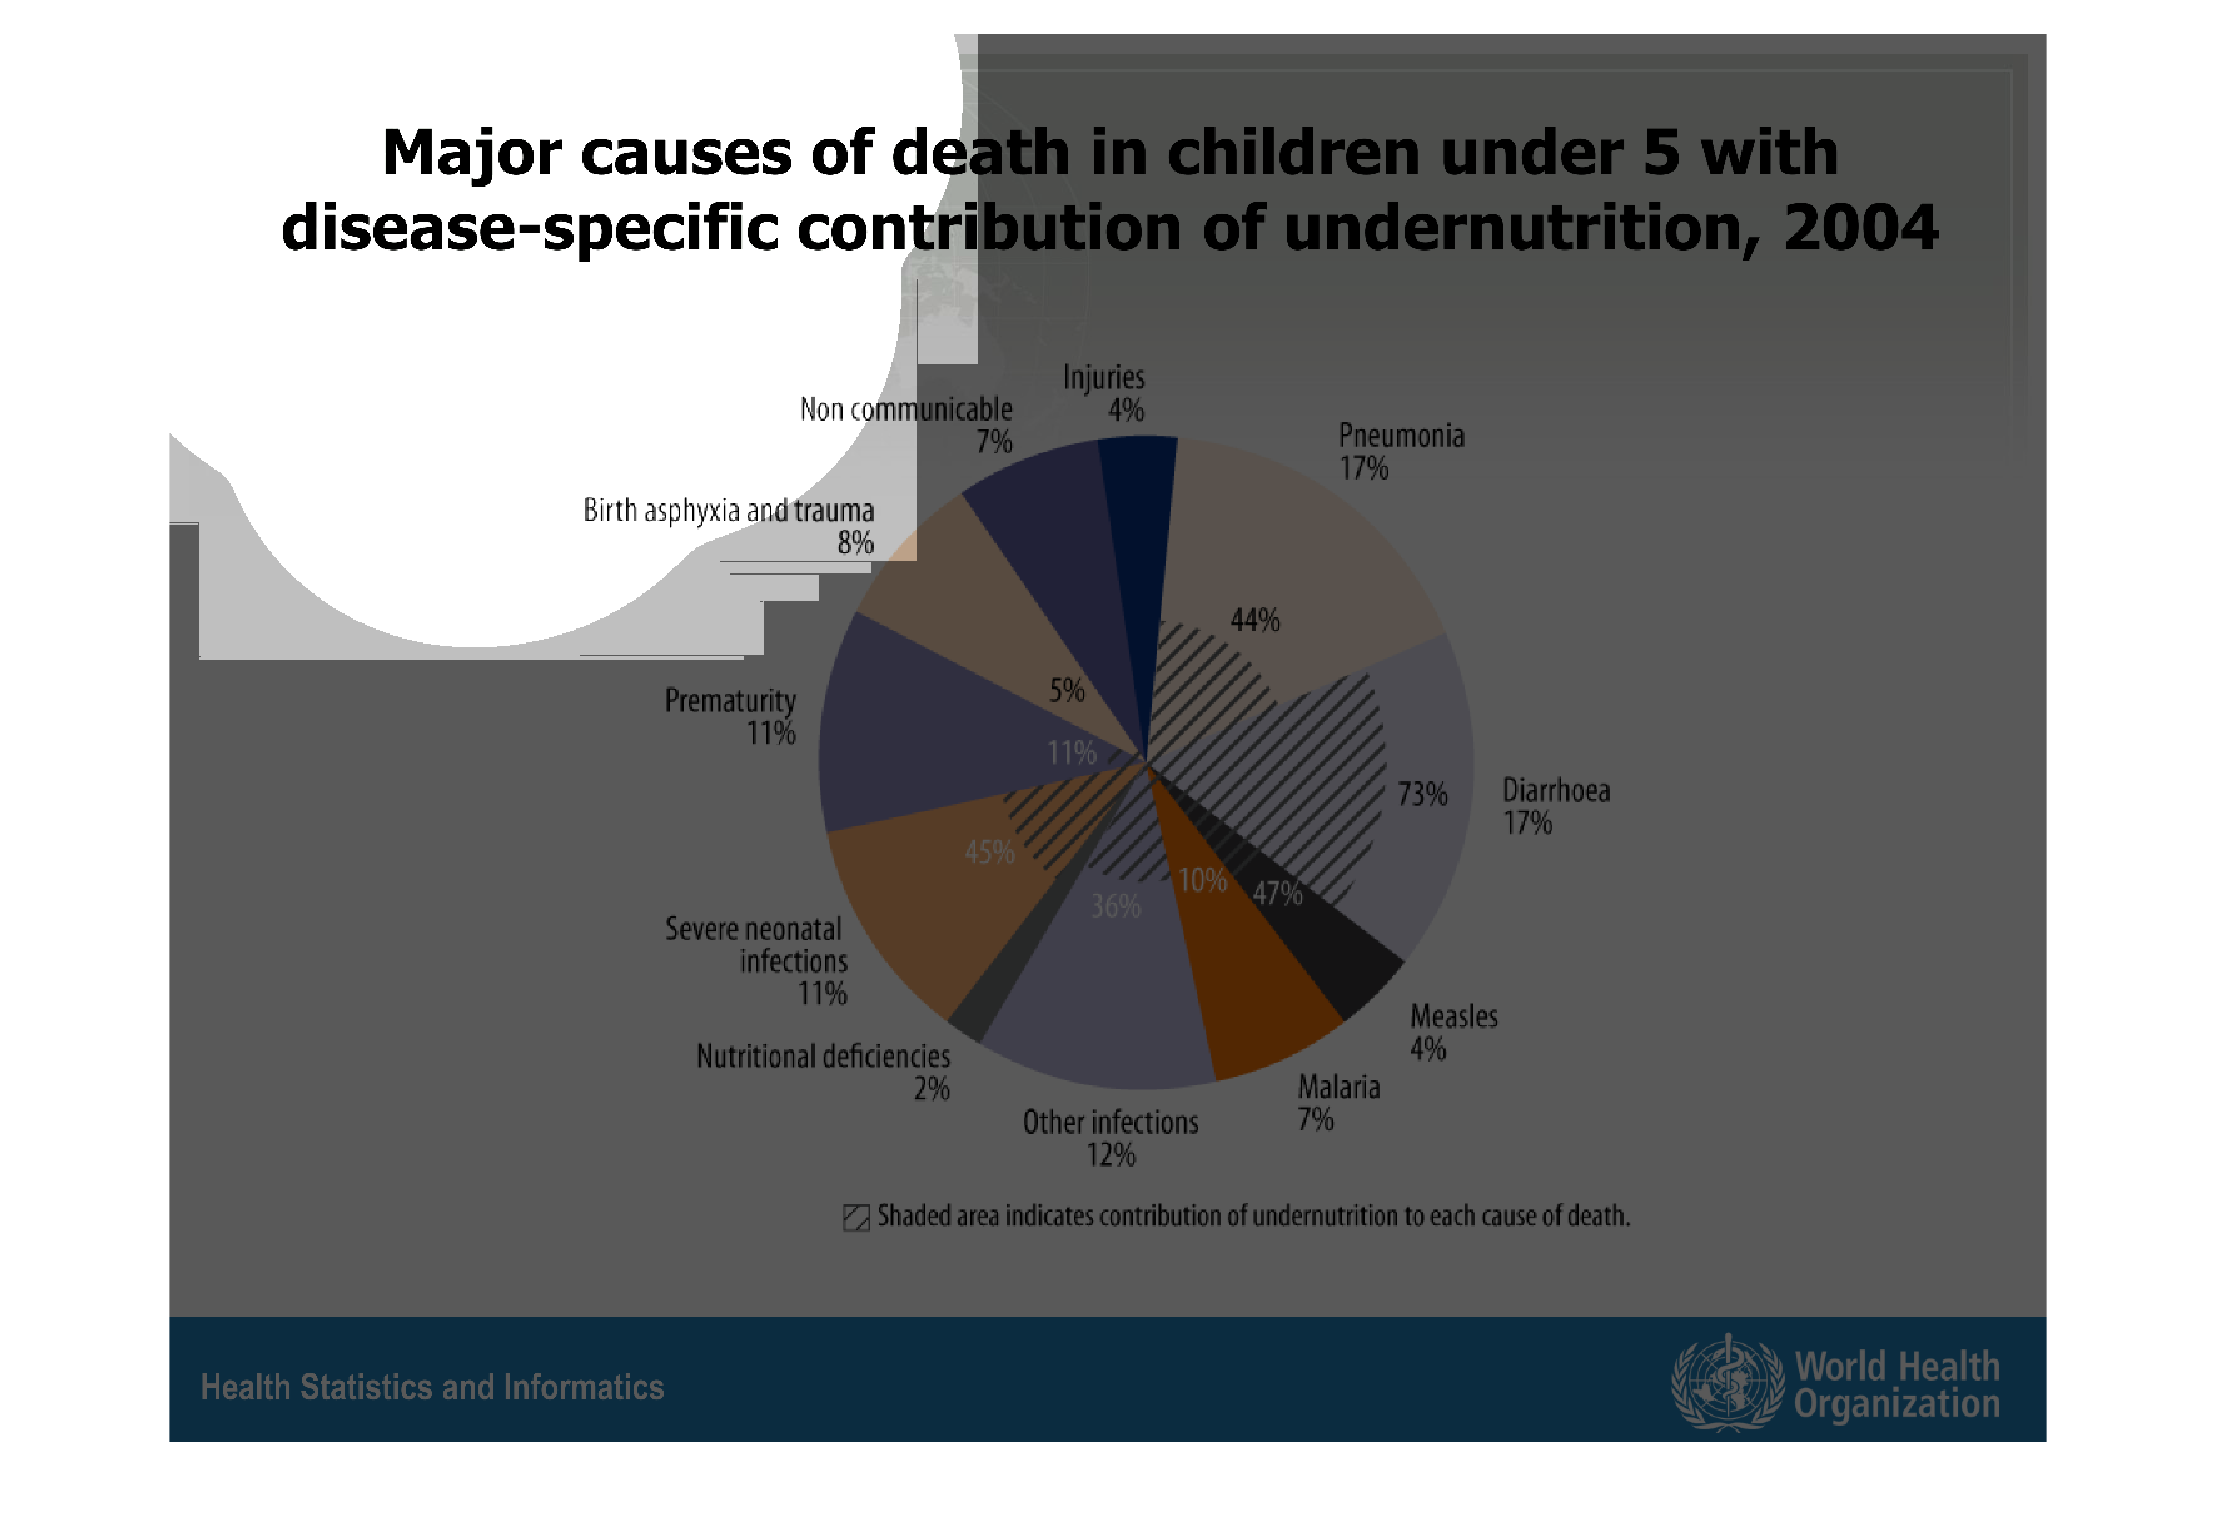
This chart shows major causes of death in children under five years of age with disease specific
contribution of undernutrition from 2004.   Other infections is the cause of around 12 percent
and Reverse nenatal infections, premajority, at 11 percent with Dieorhea and Pneumonia accounting
for the most at 17 percent.
Warning: Image is too big to fit on screen; displaying at 67%
Warning: Image is too big to fit on screen; displaying at 67%
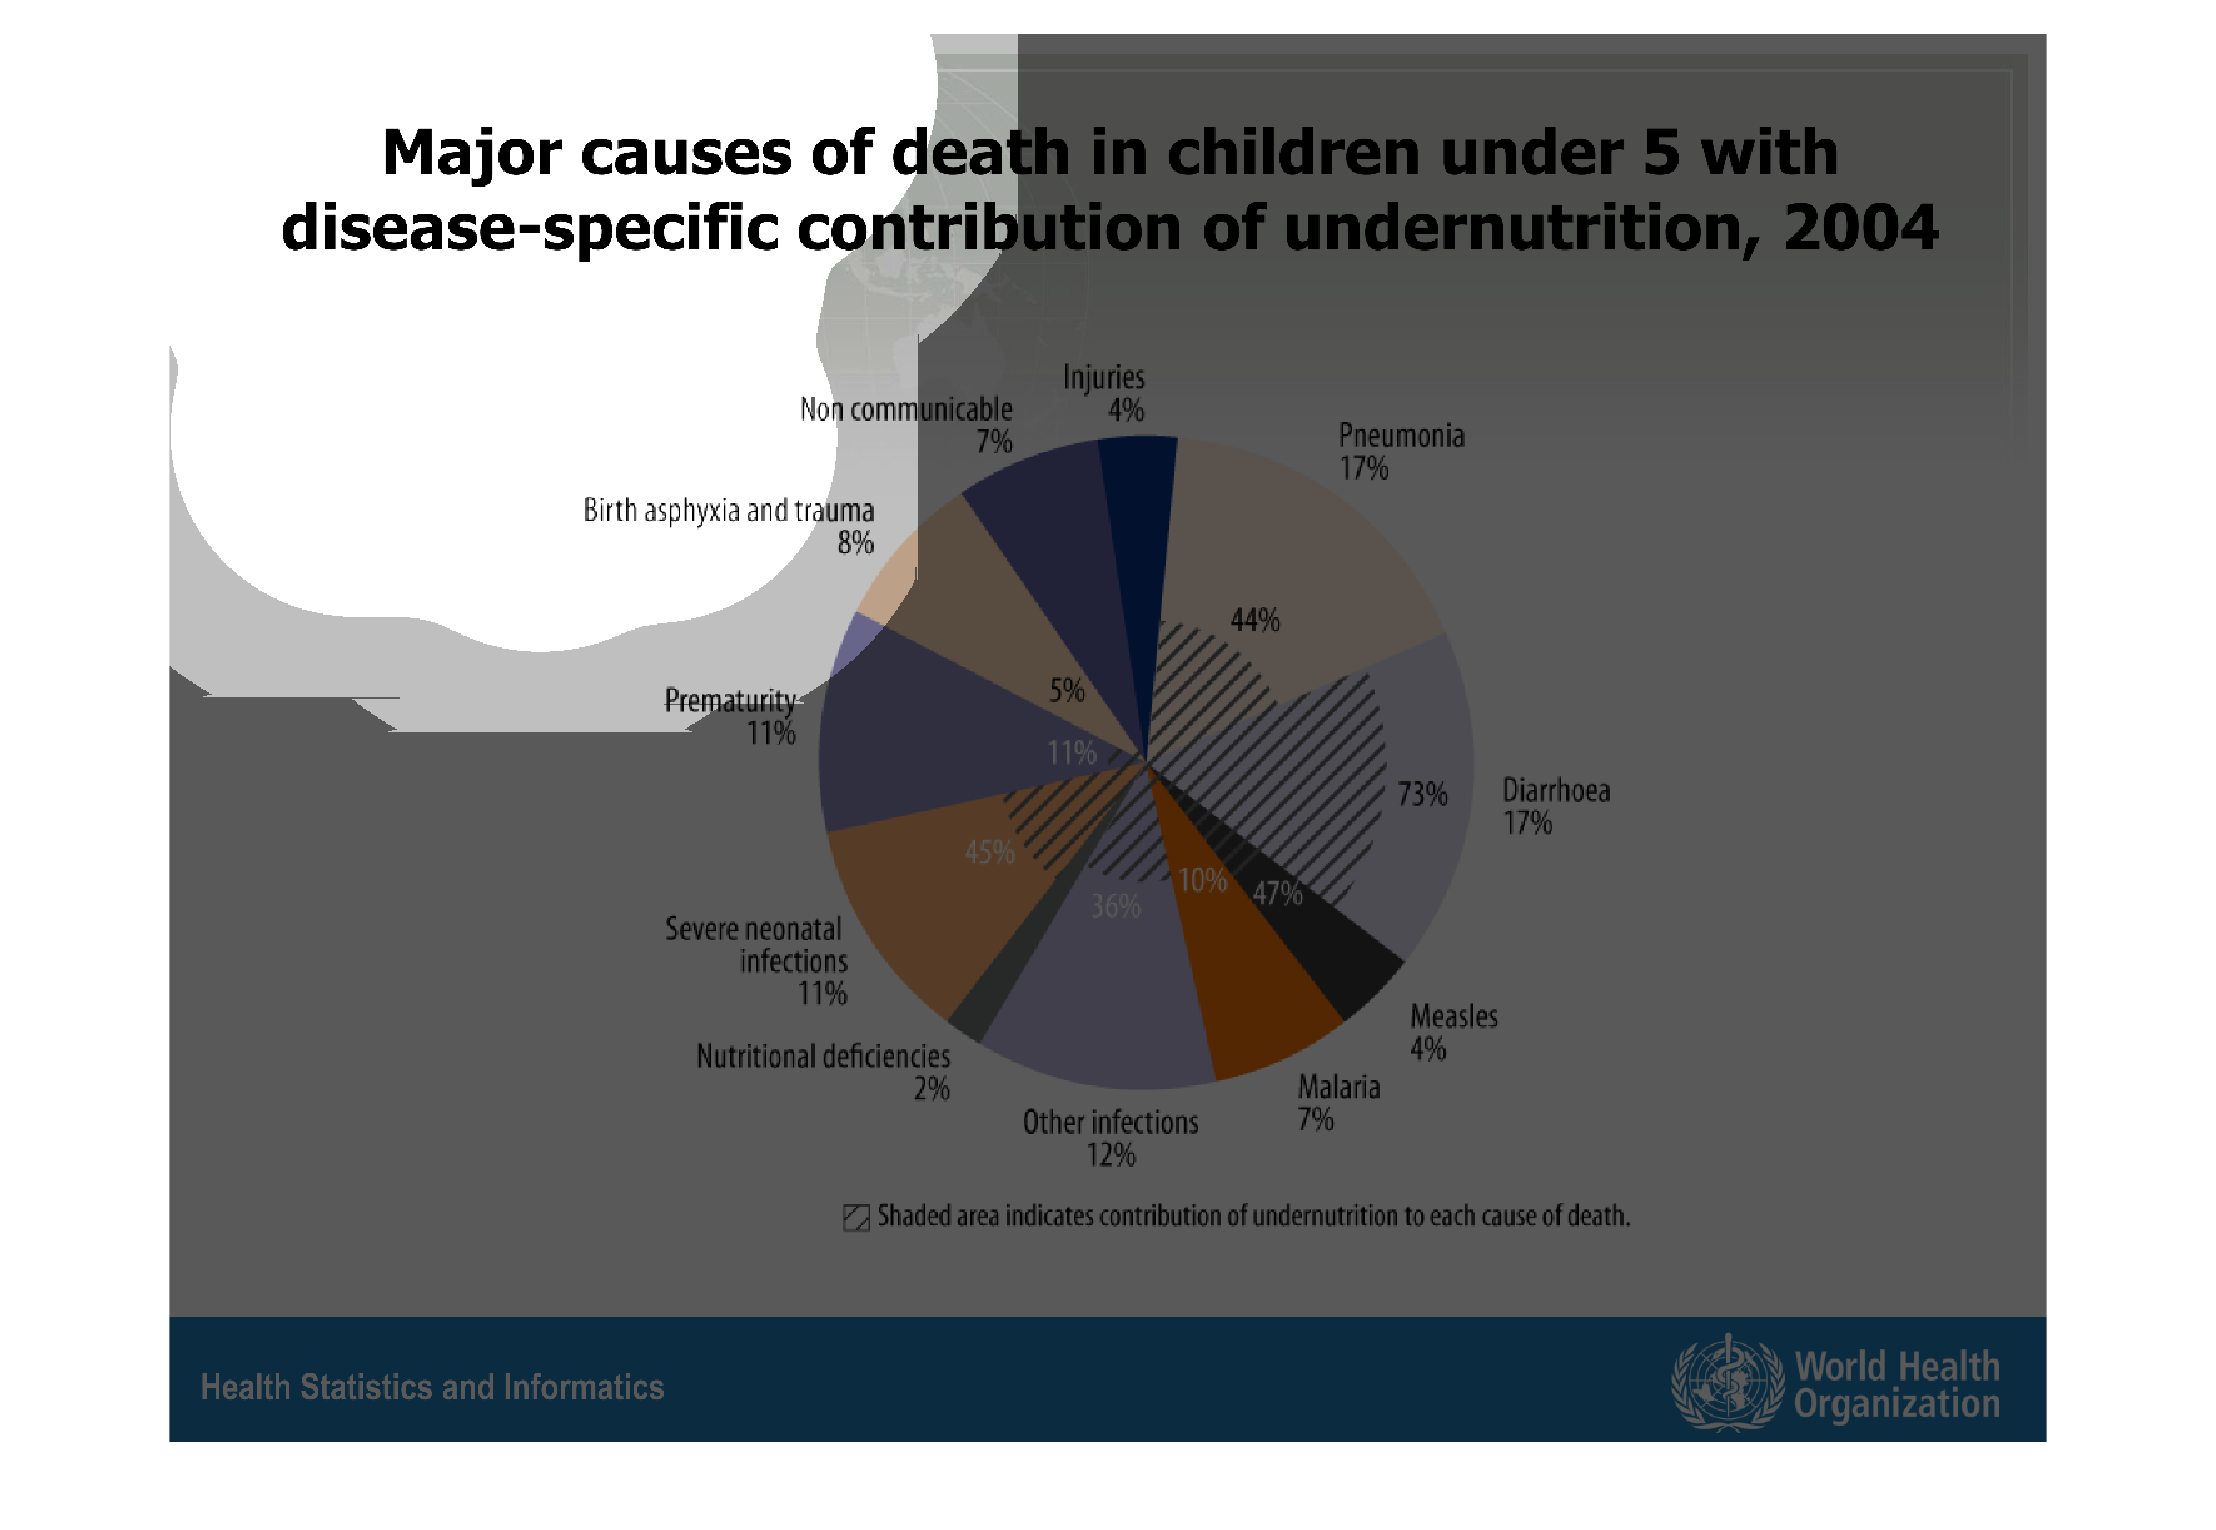
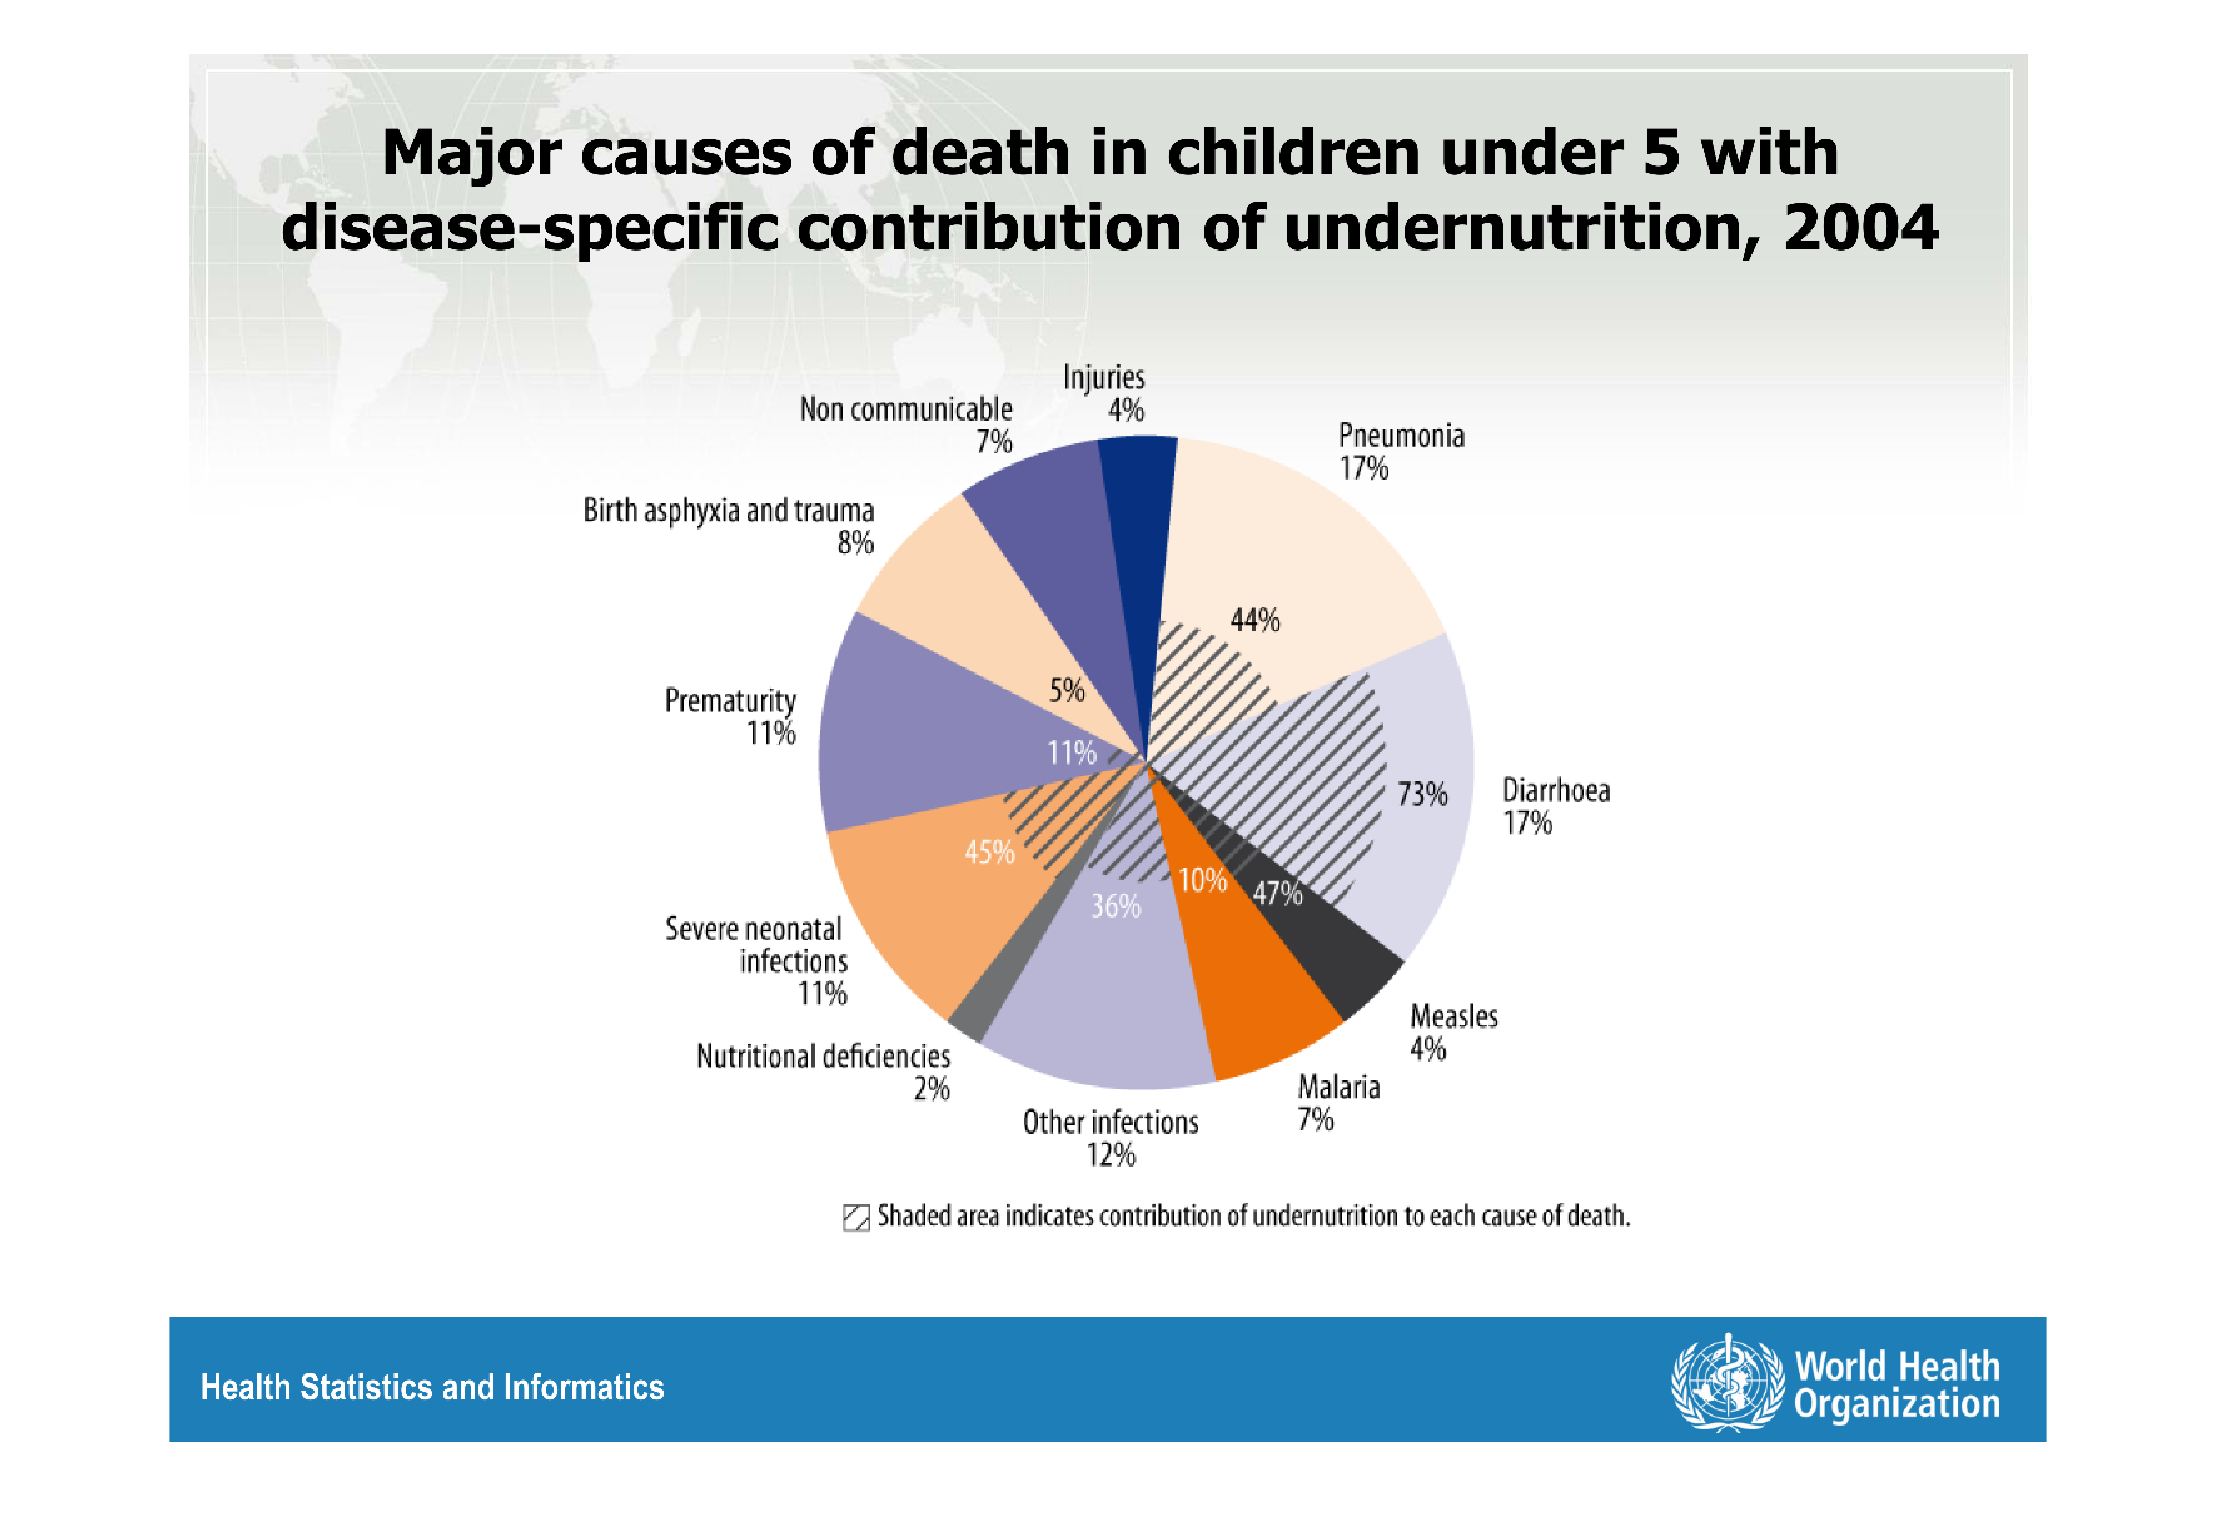
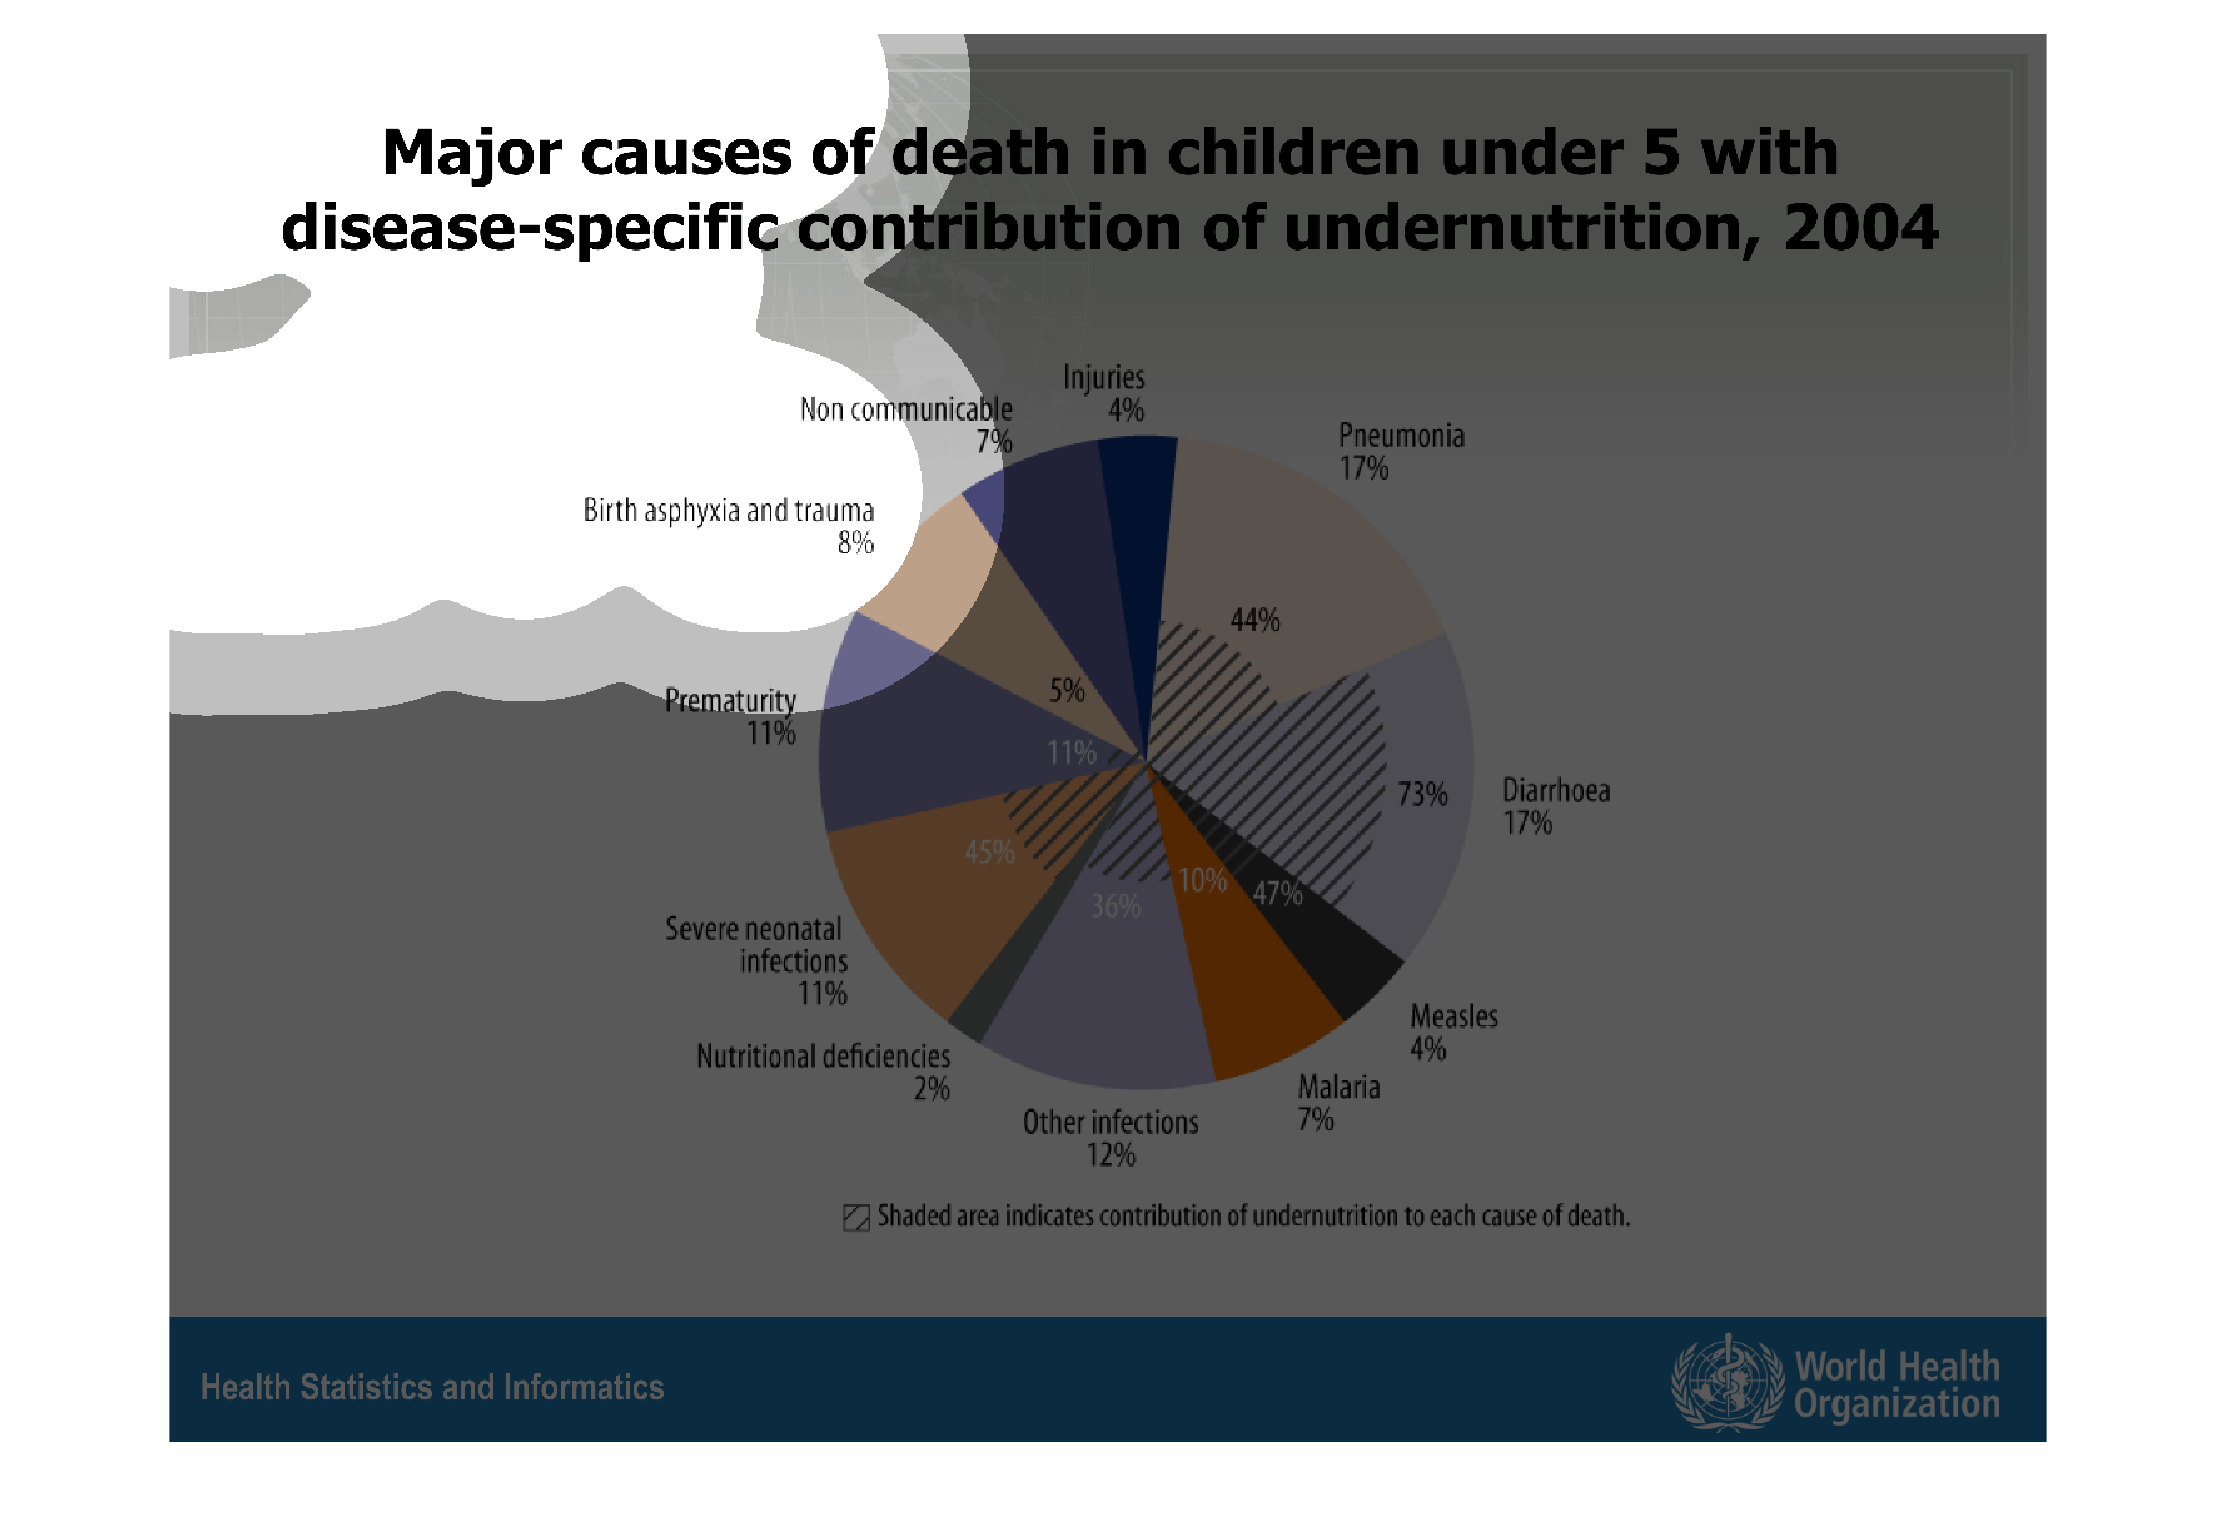
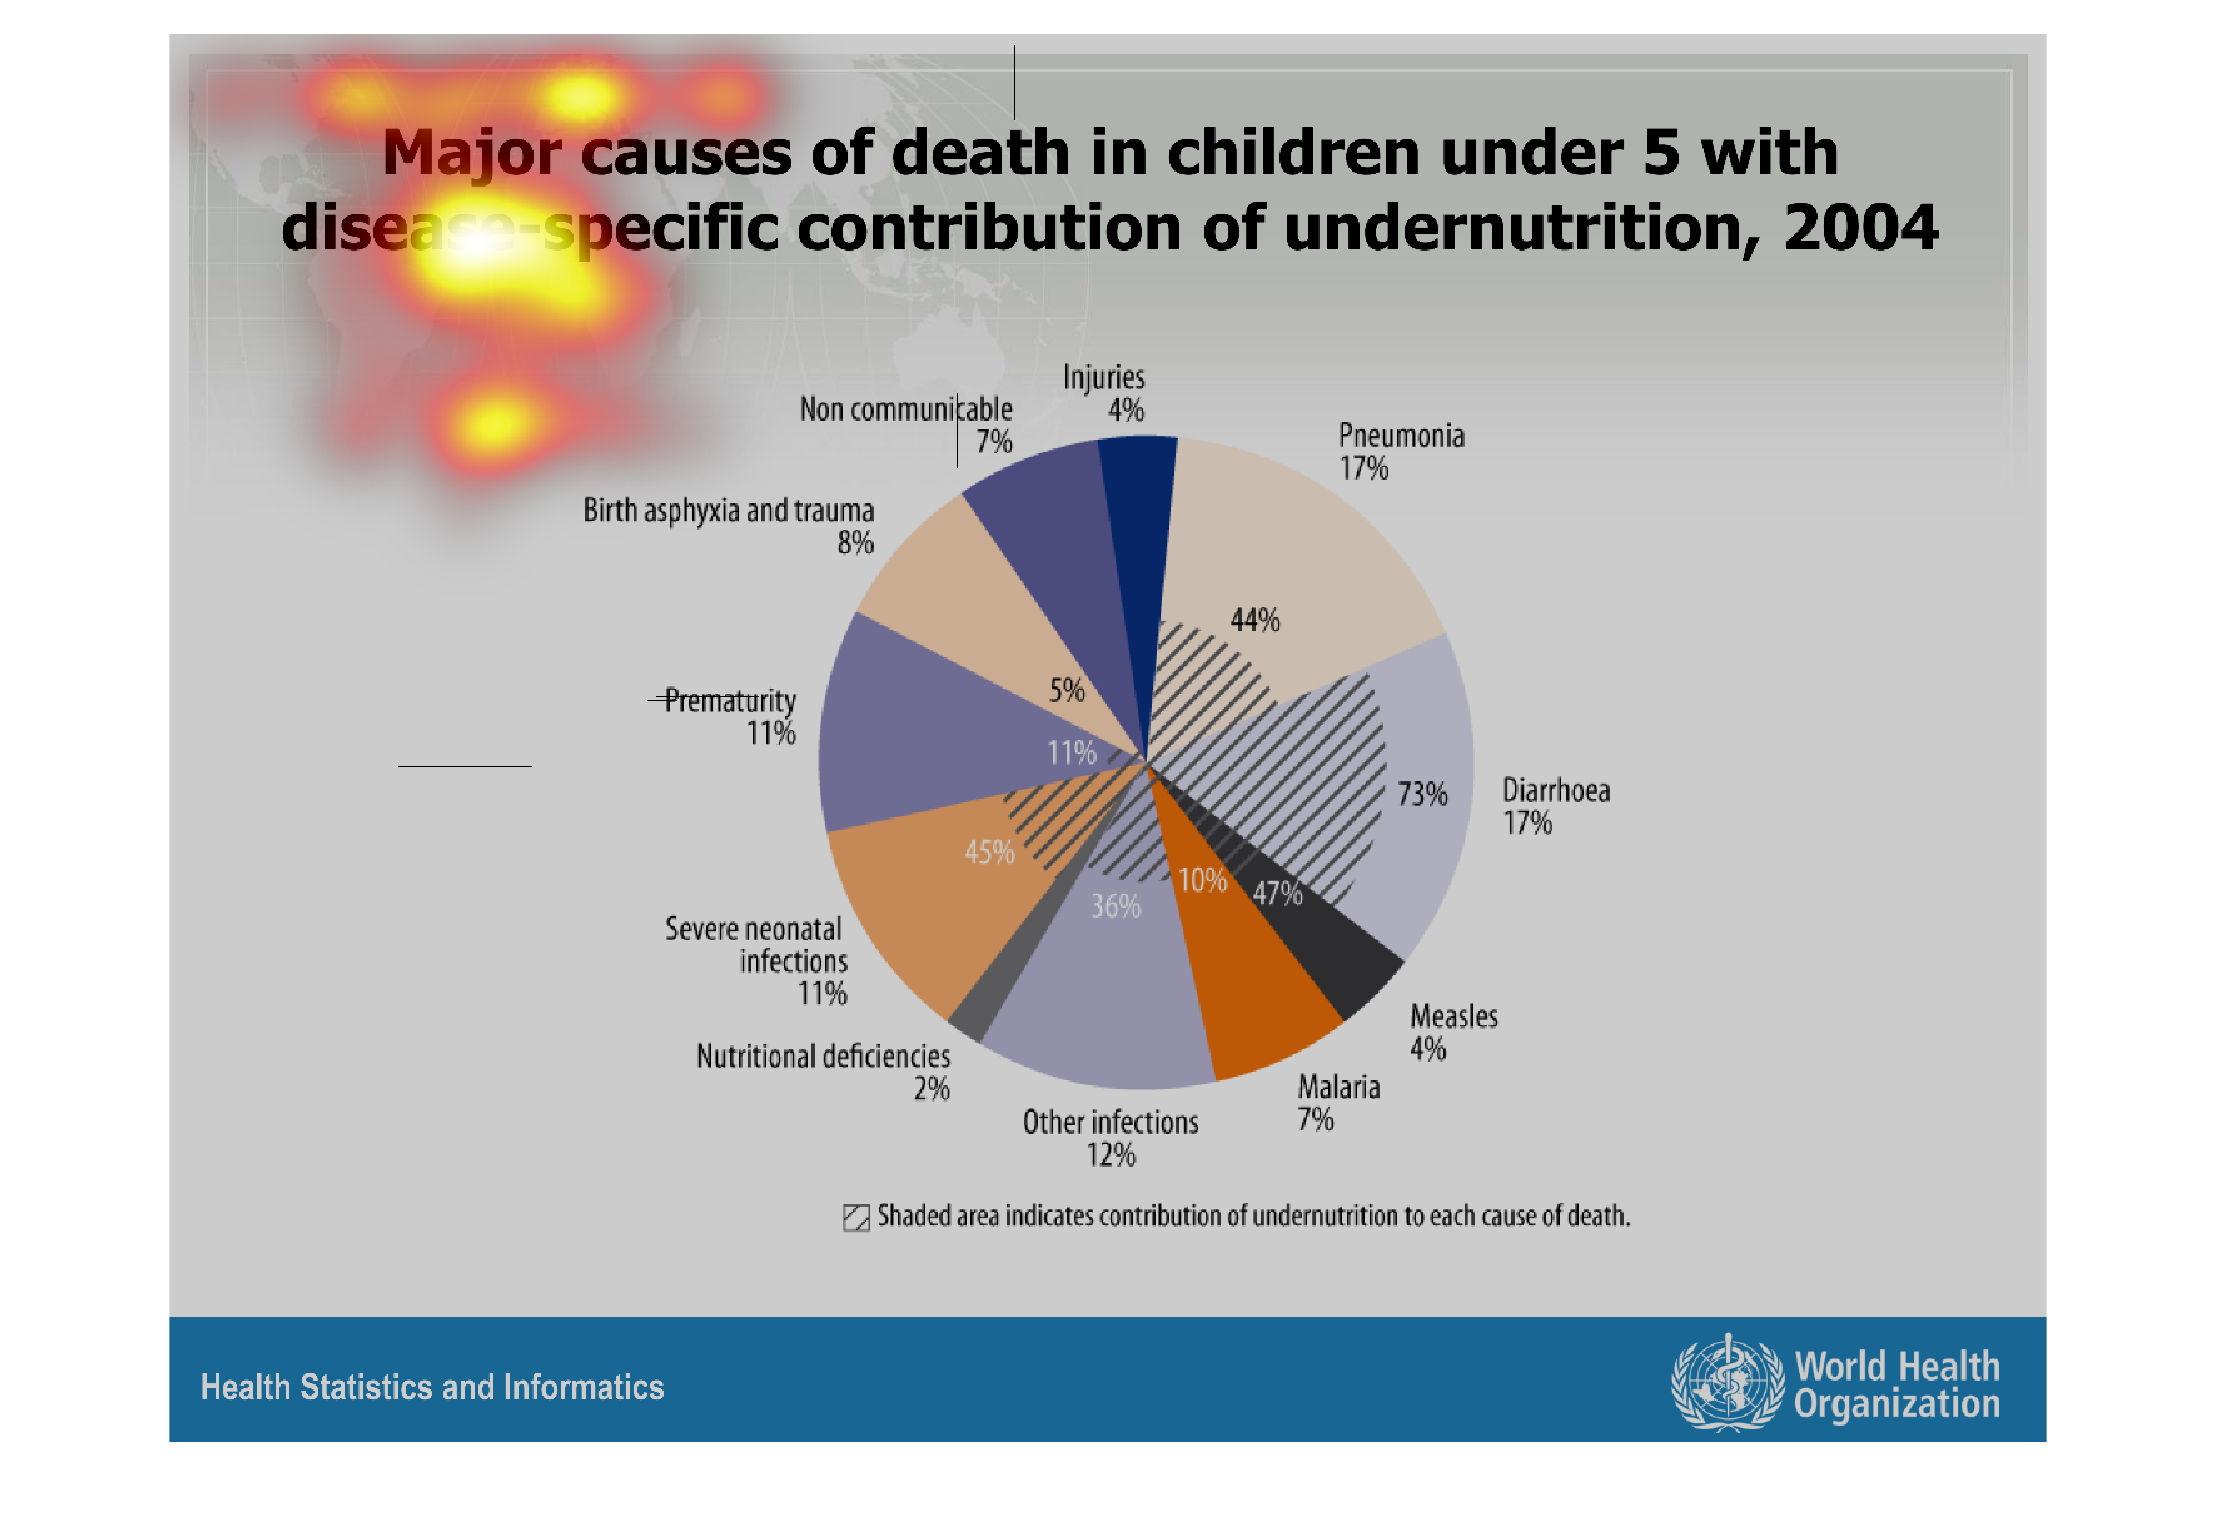
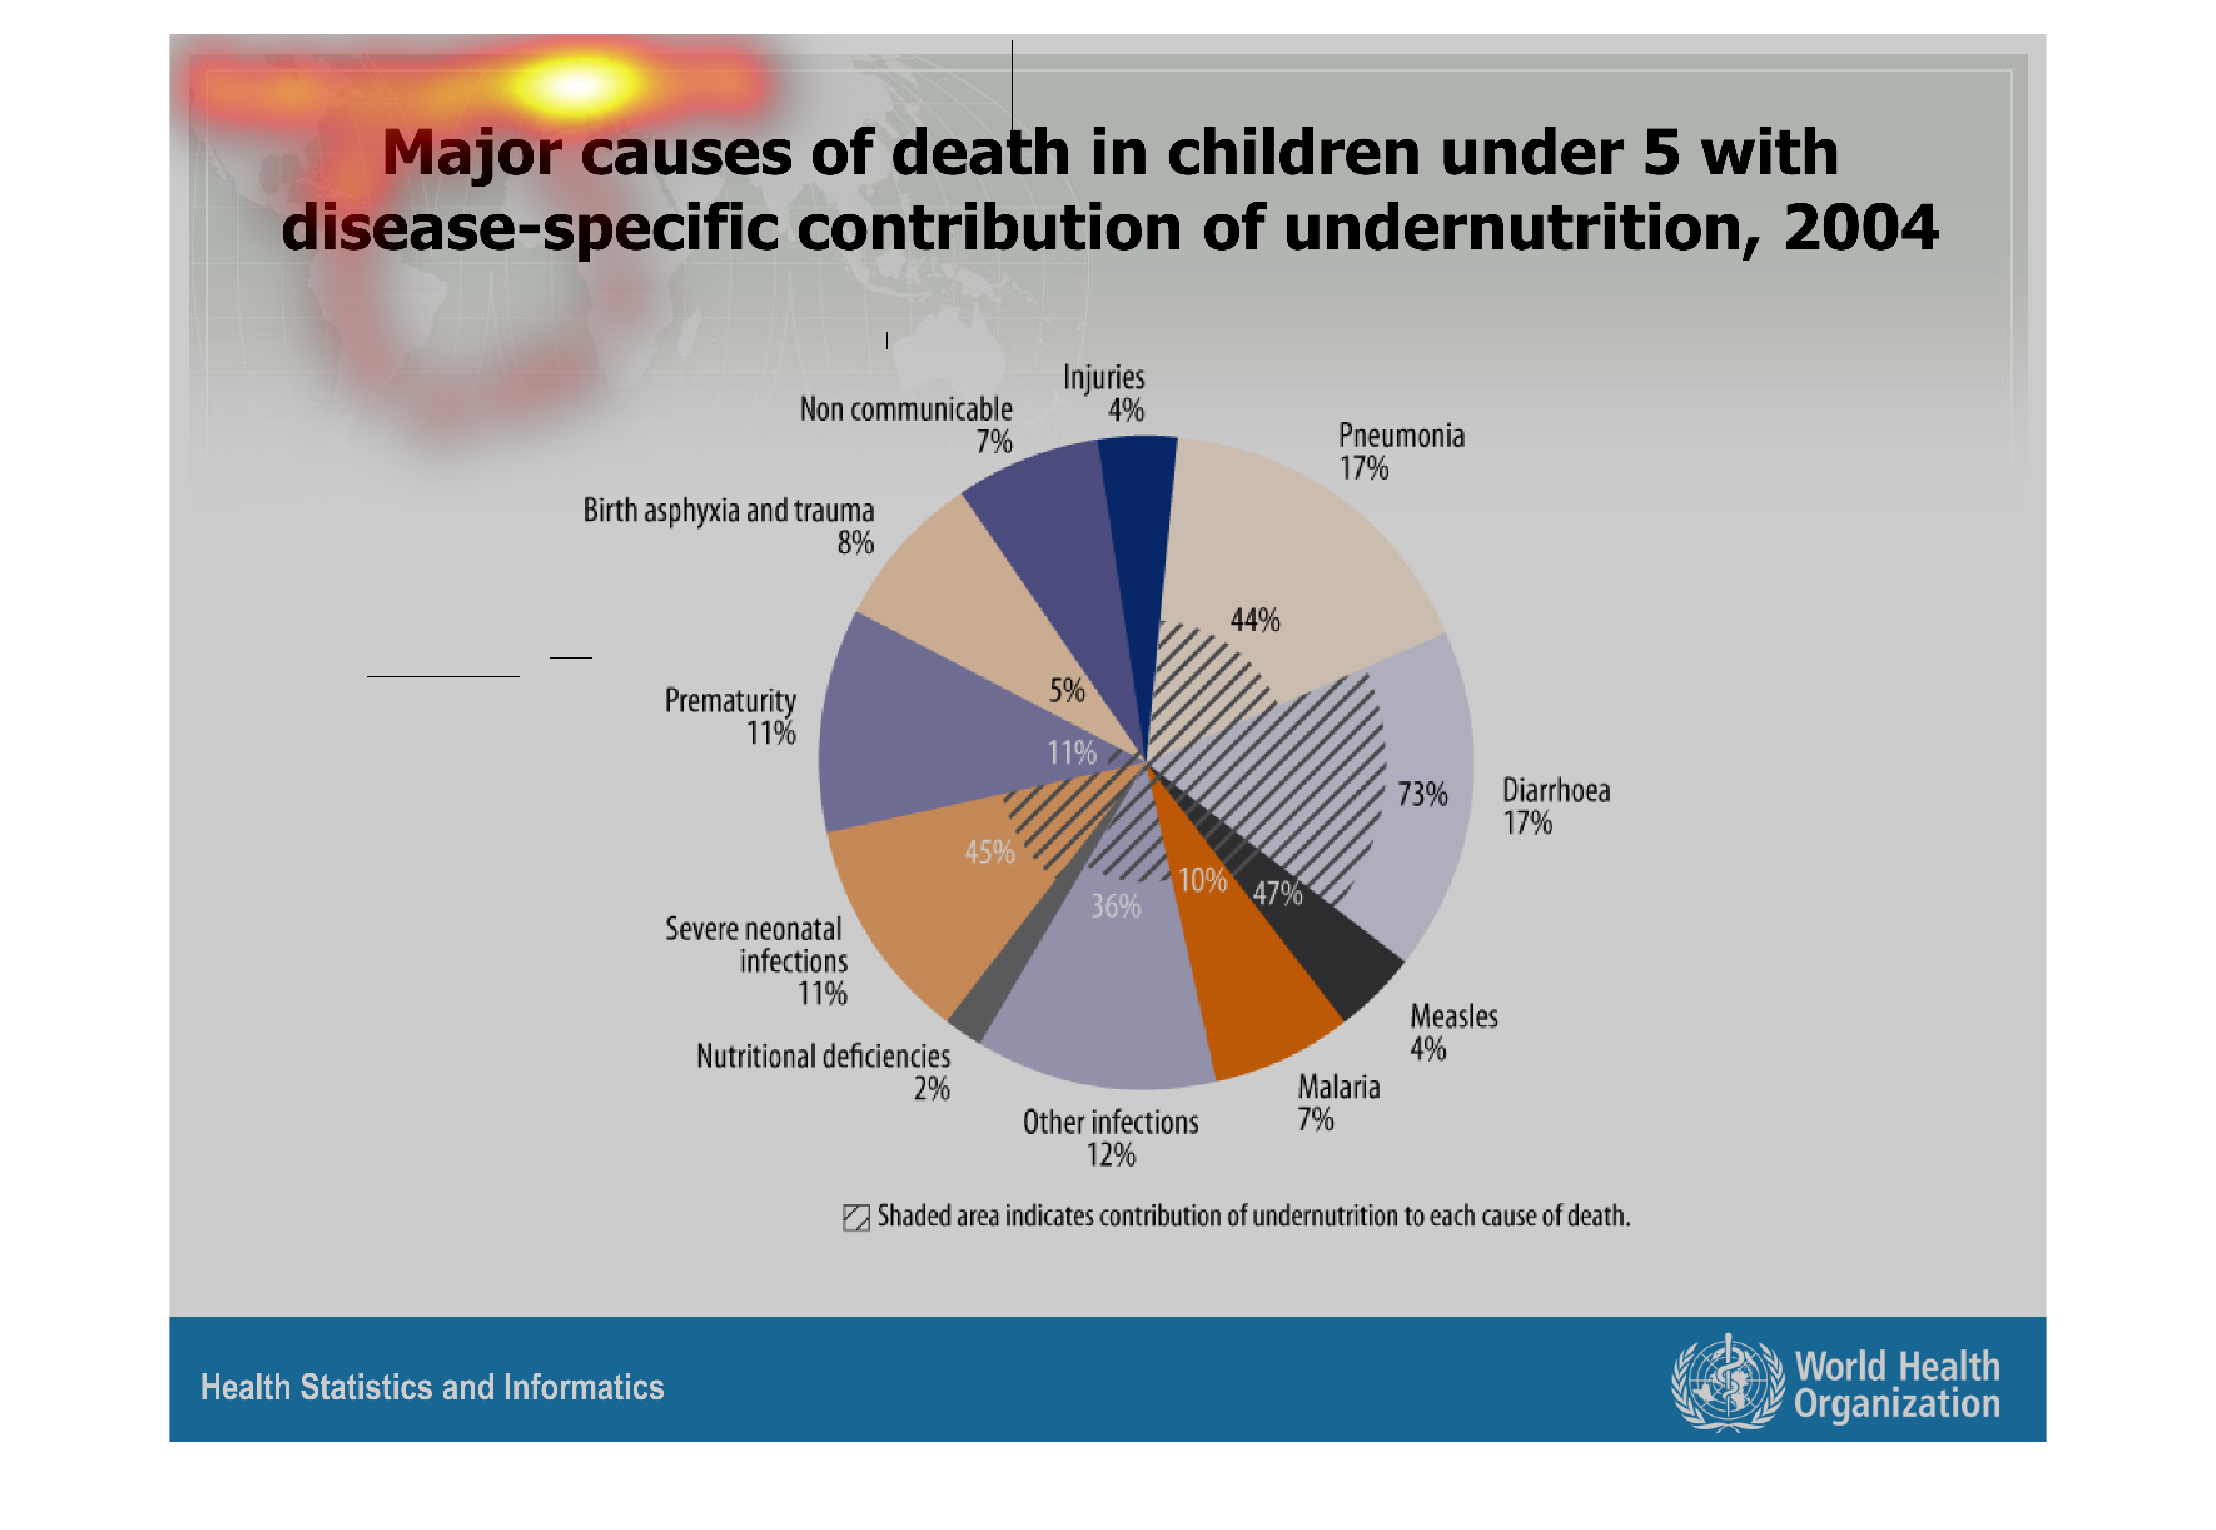
This is a pie chart denoting major causes of death in children under 5, by disease-specific
contribution of under-nutrition. The under-nutrition is denoted by hashed shading inside each
category.
Warning: Image is too big to fit on screen; displaying at 67%
Warning: Image is too big to fit on screen; displaying at 67%
This graph displays the causes of death in children under the age of 5 with under-nutrition.
The sizes if the slices don't accurately depict the numbers they represent. Pneumonia, diarrhea,
other infections and prematurity are some of the largest causes of death. On each slice, the
percentage of deaths which occured in conjunction with under-nutrition is denoted by a percentage
and a striped area.
Warning: Image is too big to fit on screen; displaying at 67%
Warning: Image is too big to fit on screen; displaying at 67%

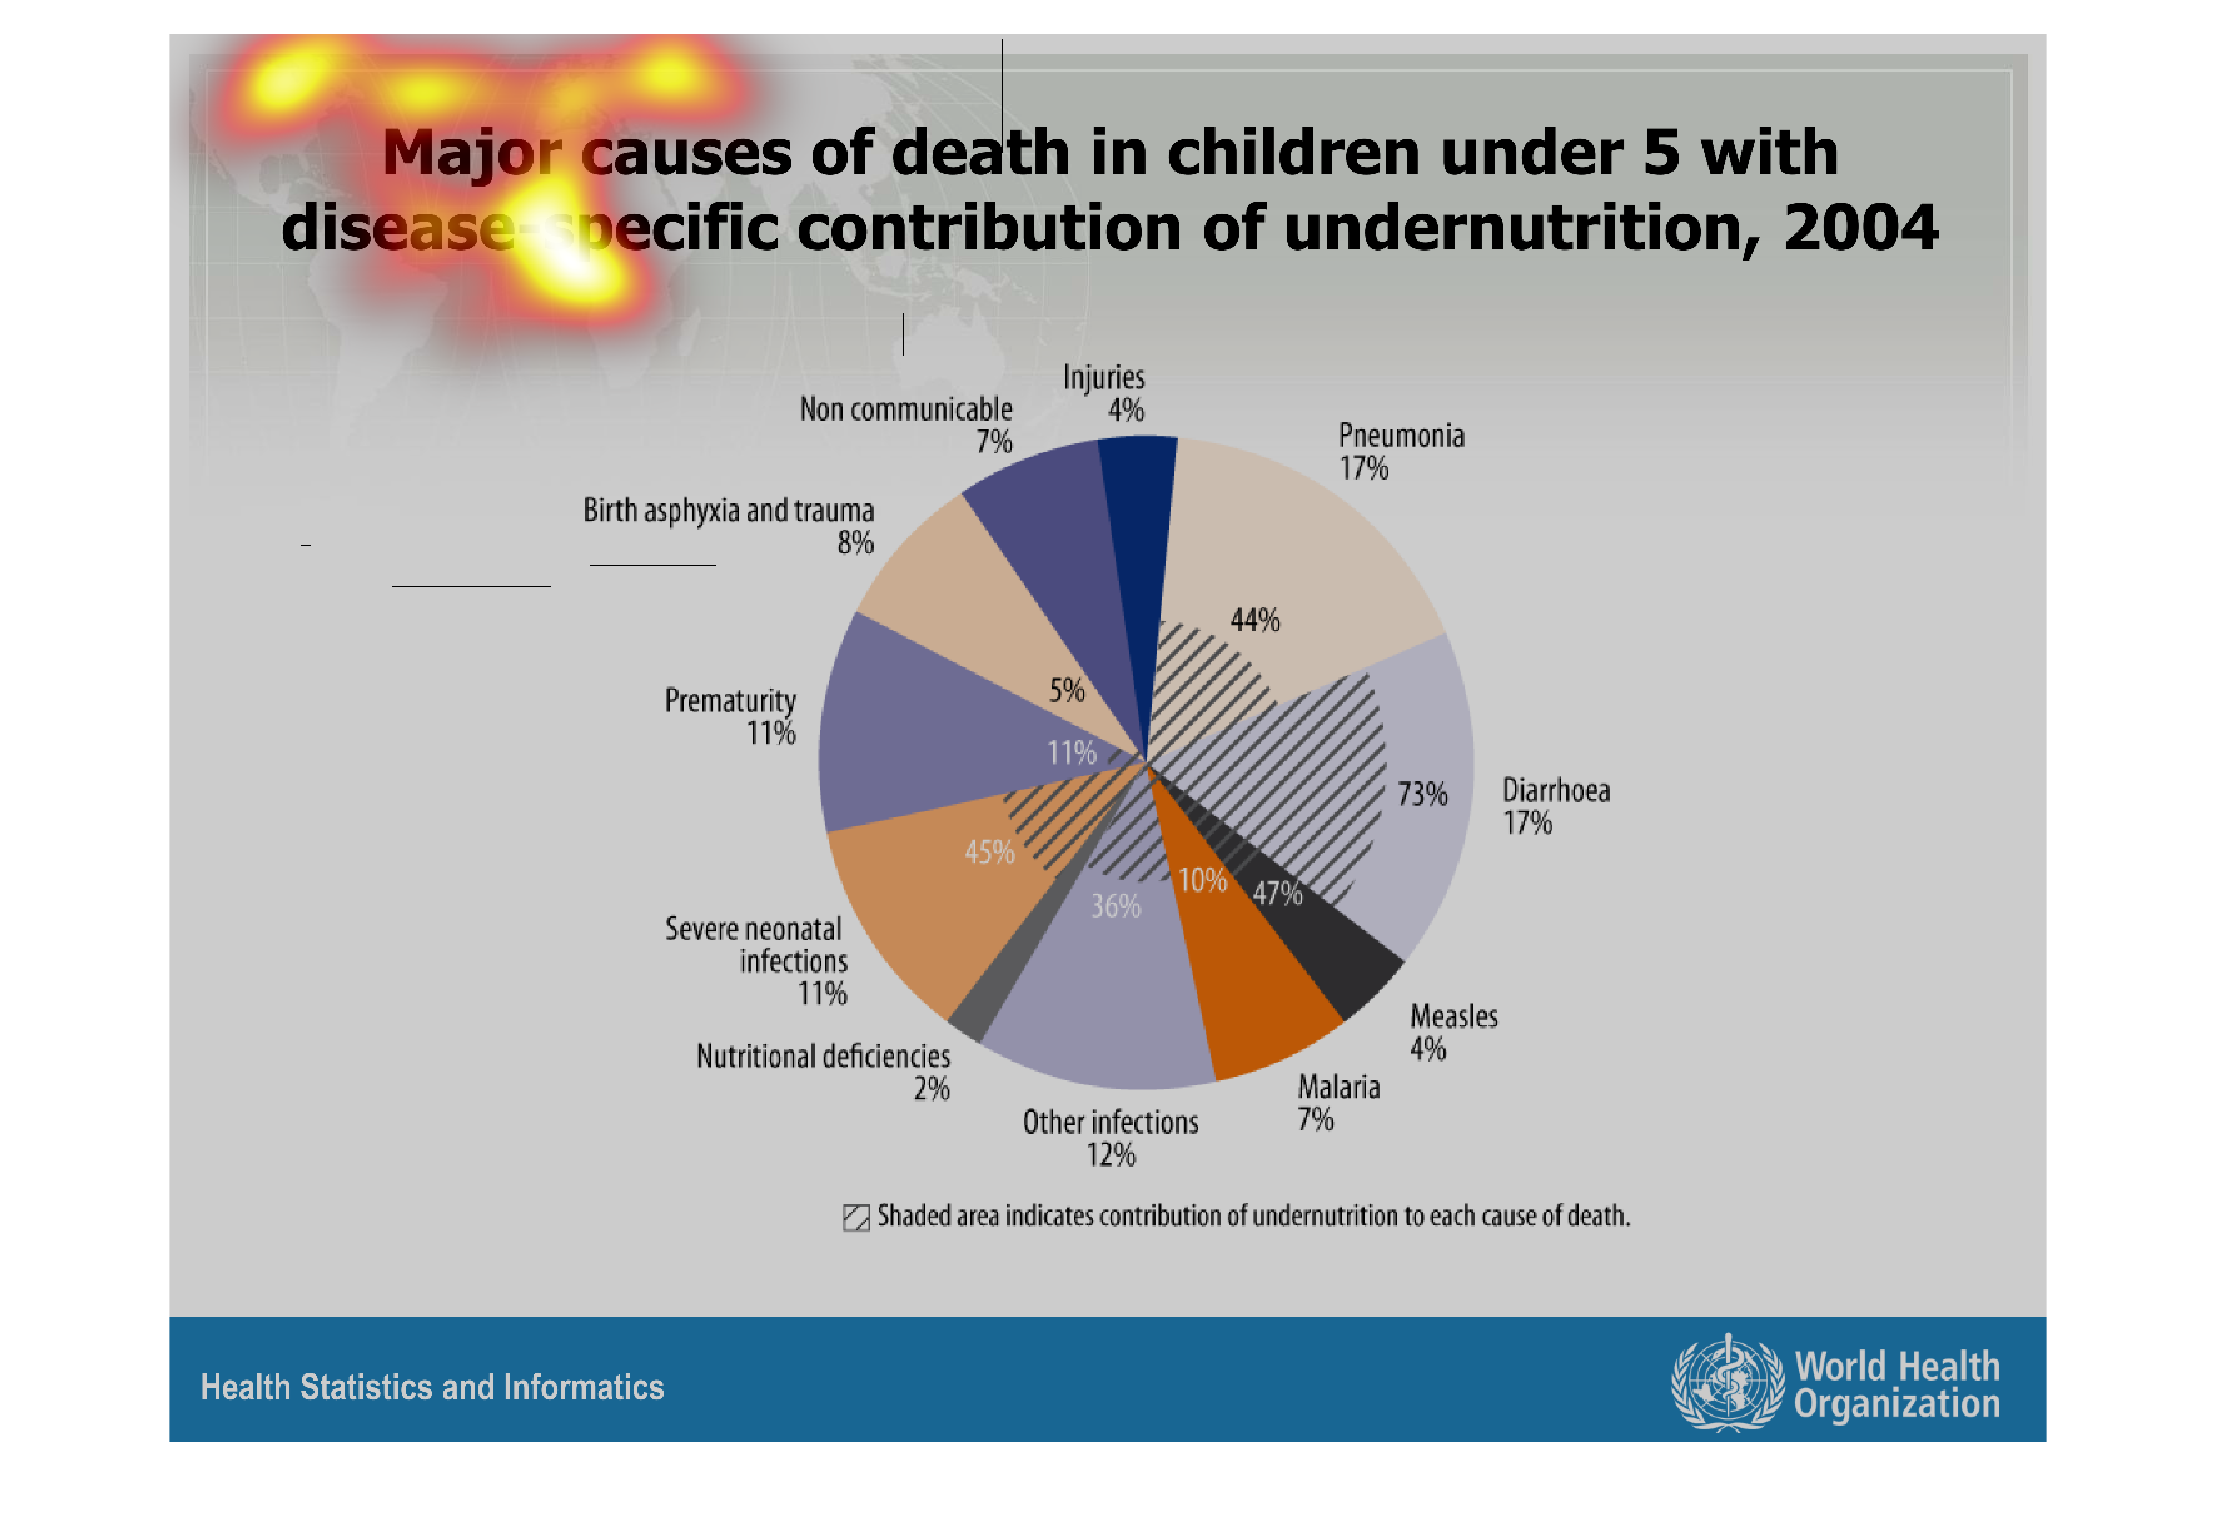
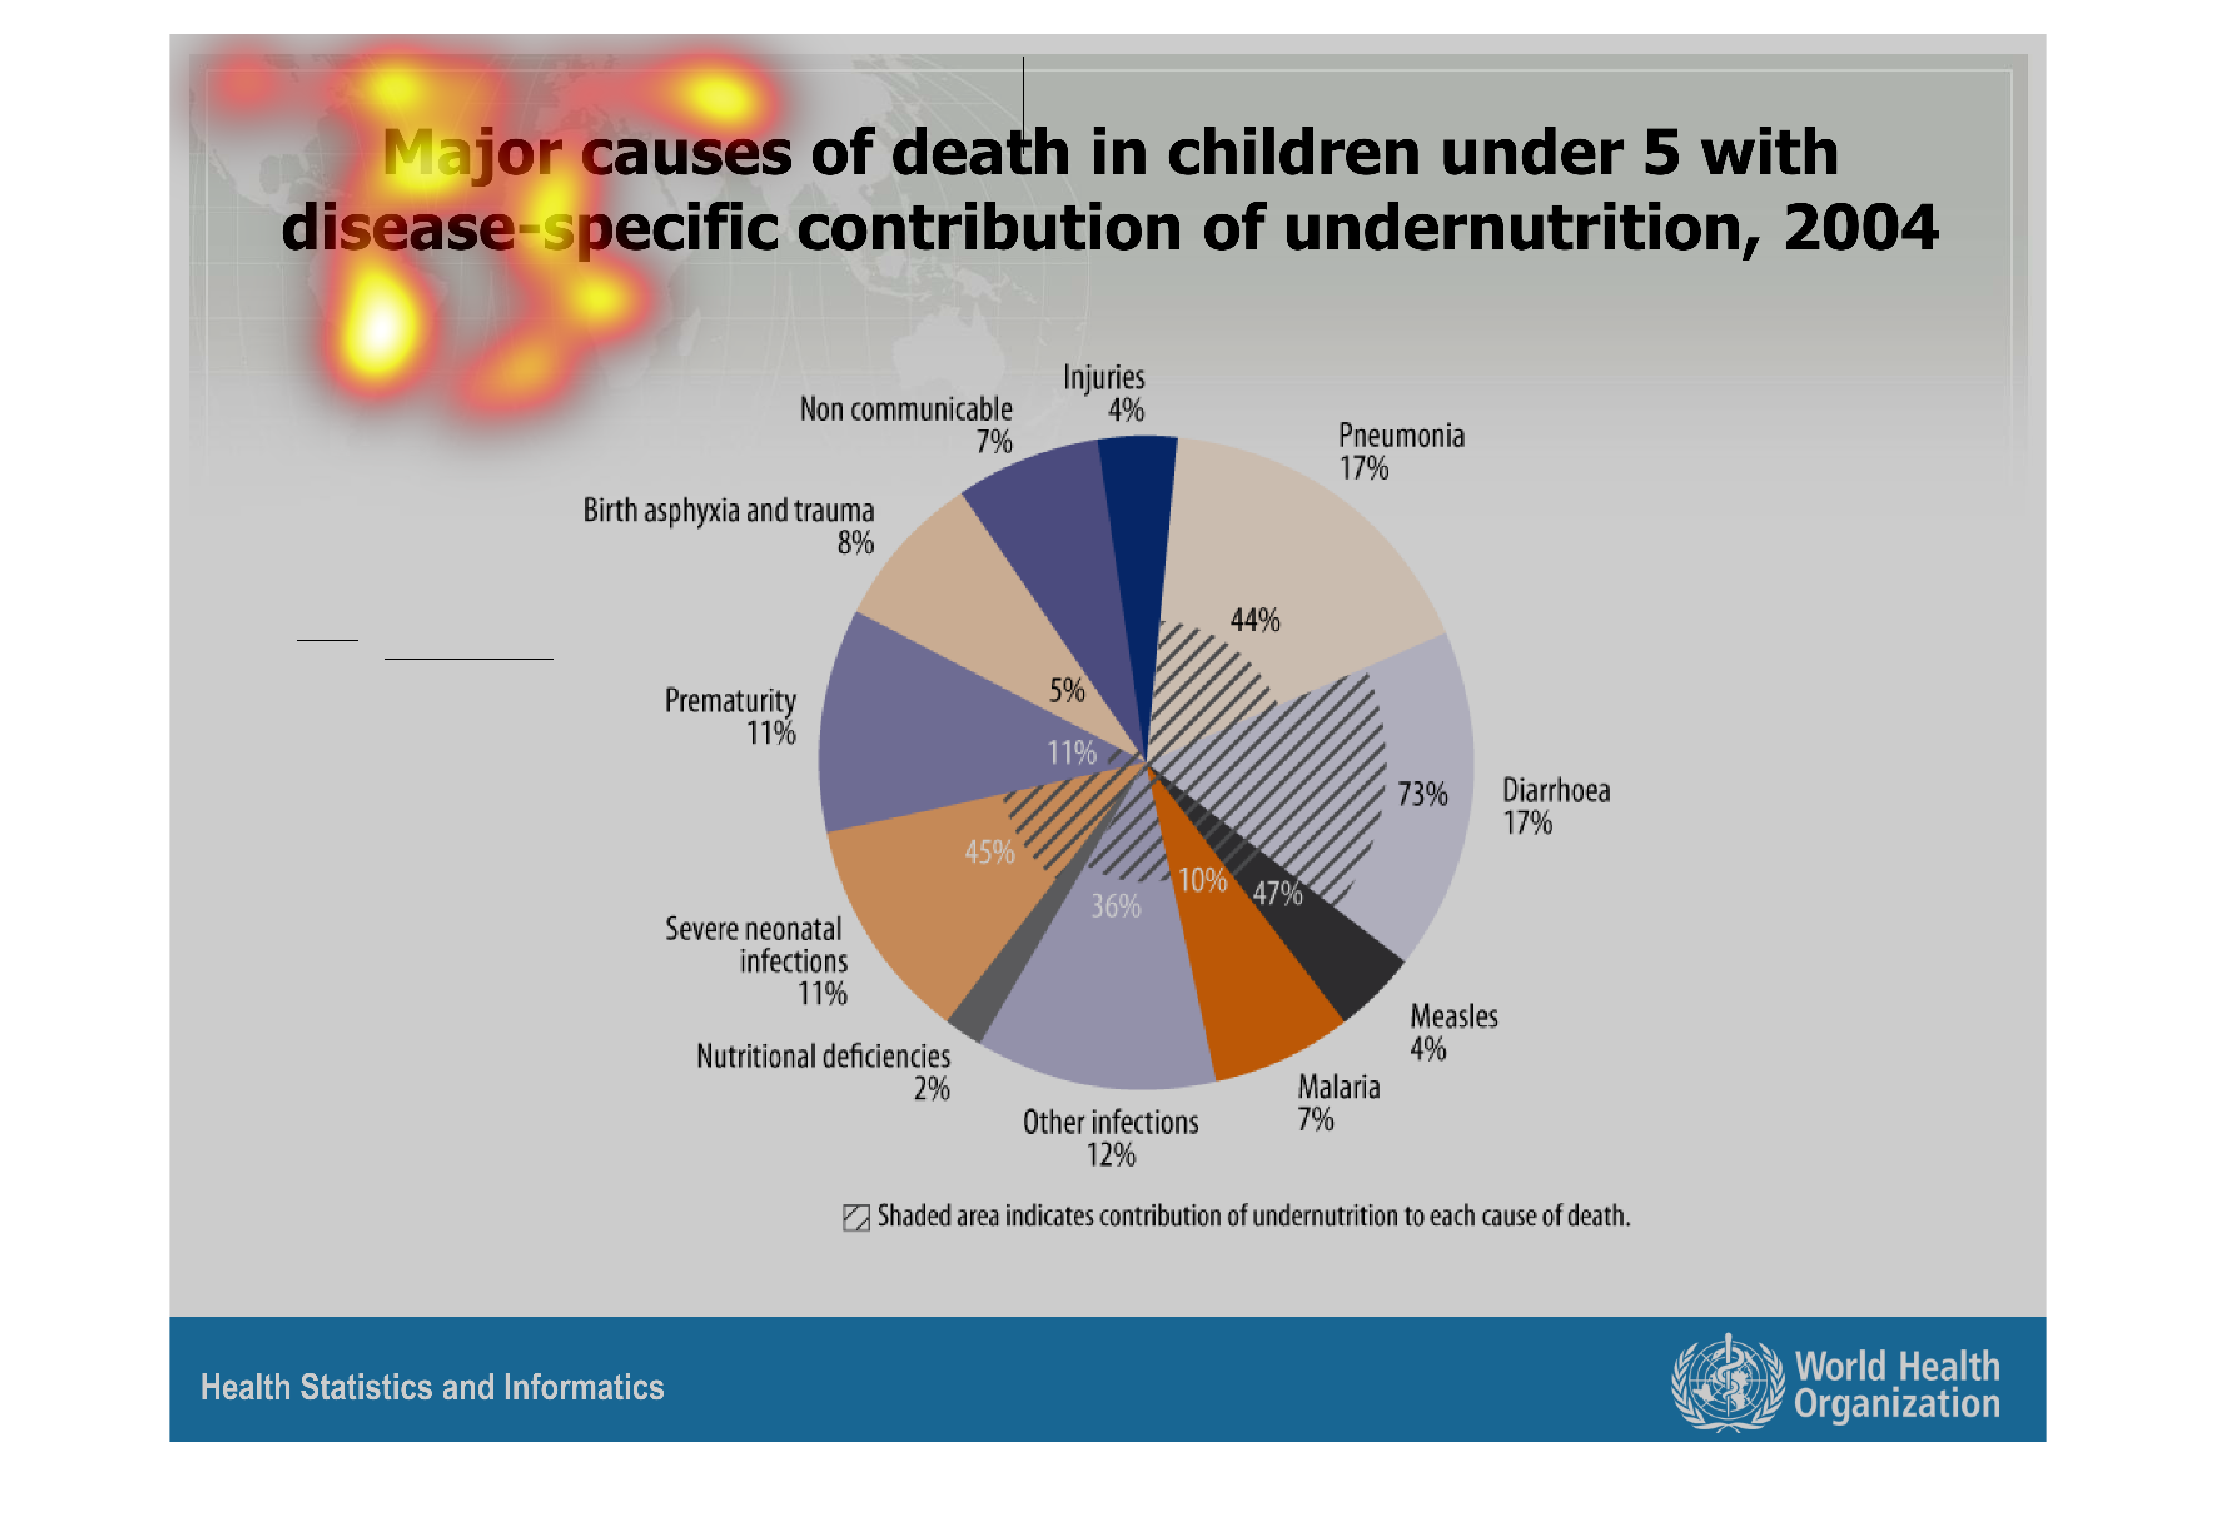
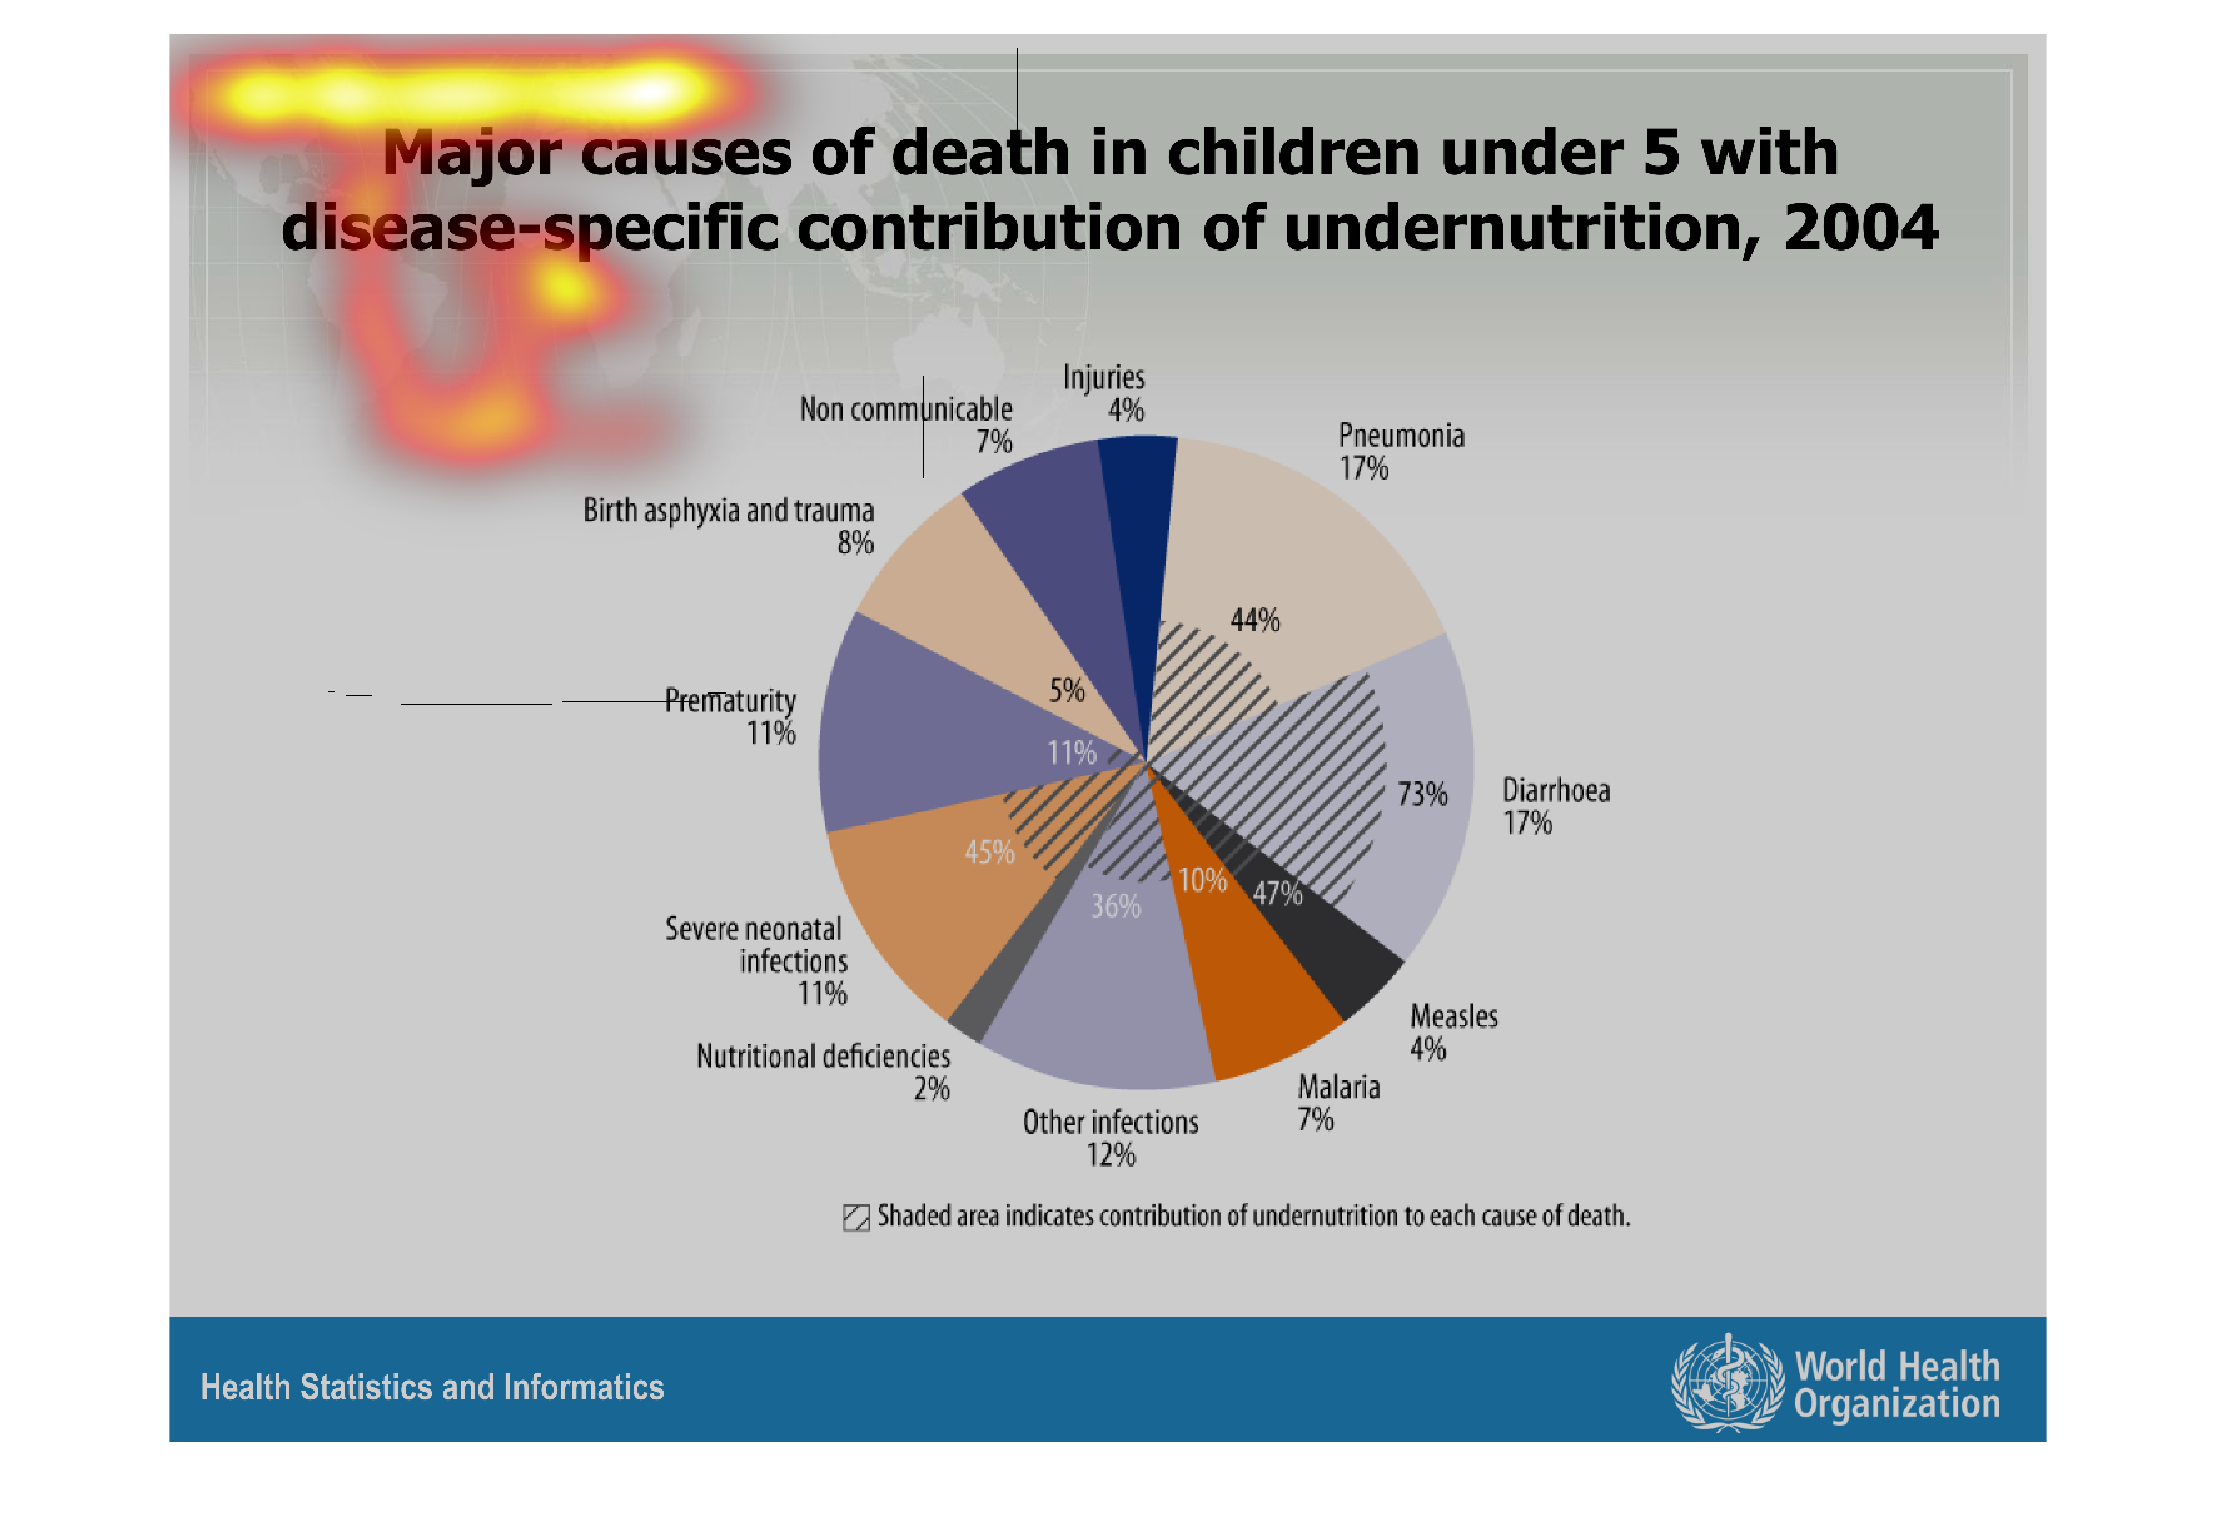
This is a pie chart of the causes of infant mortality and how much malnutrition leads to each
cause of death. Malnutrition plays a significant role in infant mortality.
Warning: Image is too big to fit on screen; displaying at 67%
Warning: Image is too big to fit on screen; displaying at 67%
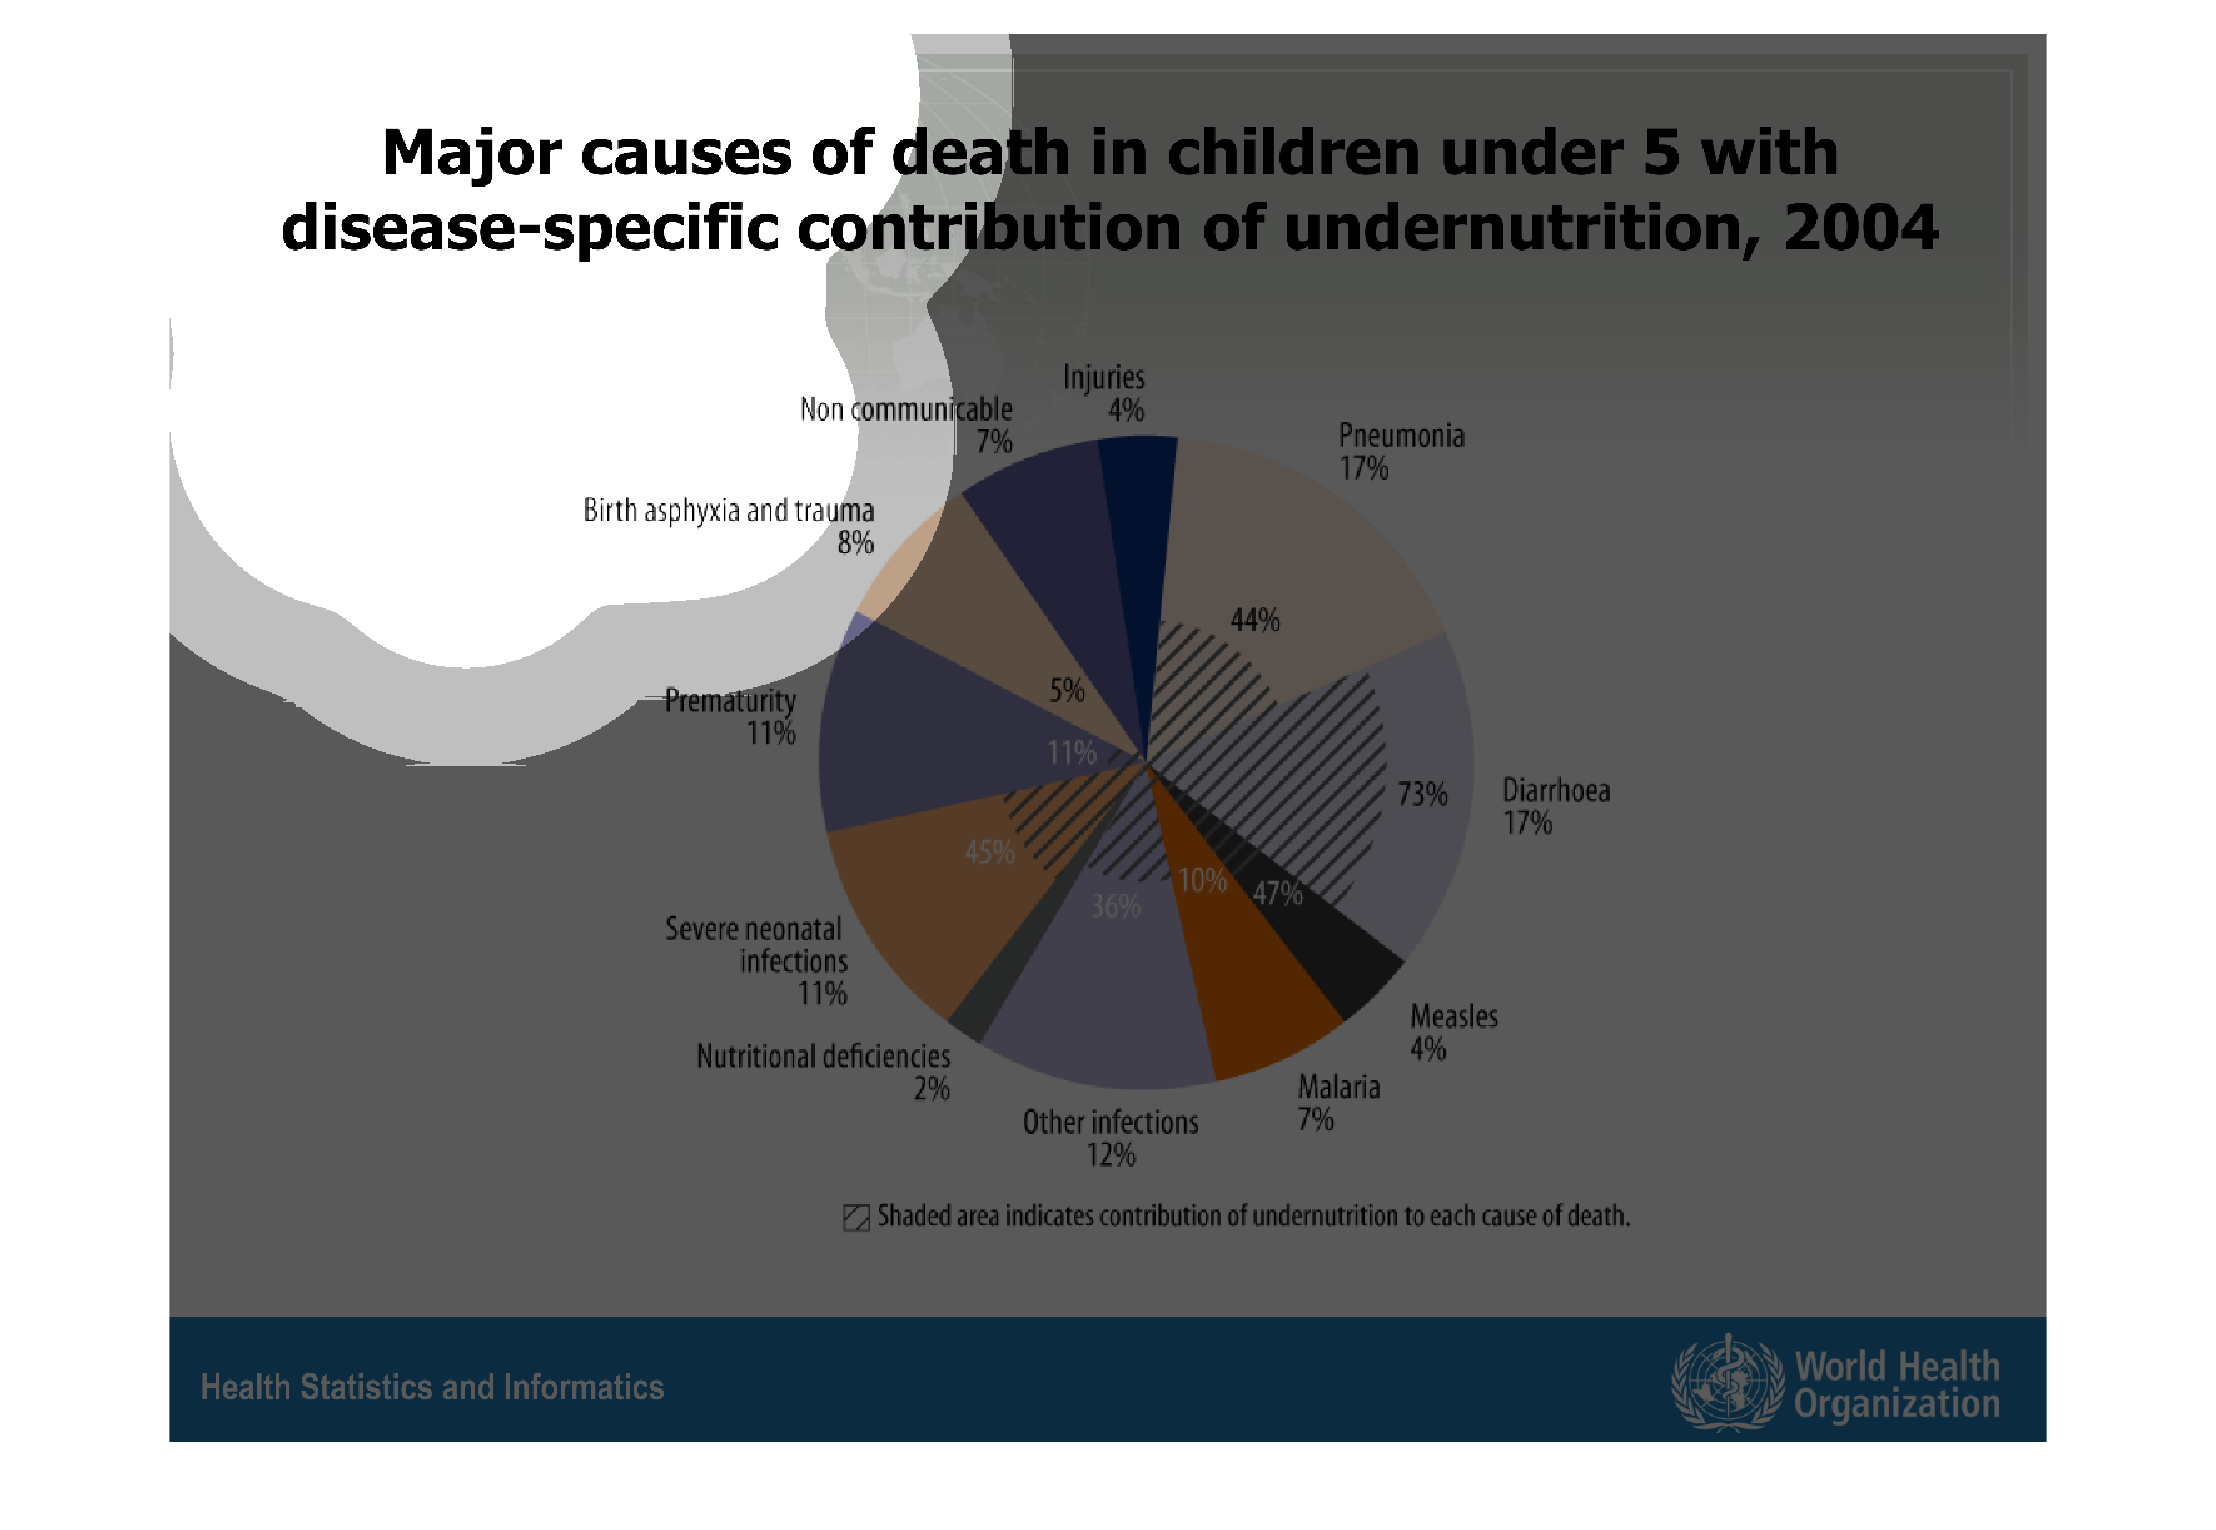
This image or figure shows or depicts in statistical pie chart format the major causes of
death of children under 5 with disease specific contribution of undernutrition, 2004.
Warning: Image is too big to fit on screen; displaying at 67%
Warning: Image is too big to fit on screen; displaying at 67%
This graph shows number of deaths in children under 5 for disease contribution of under nutrition
in 2004. This graph shows diseases that range from measles to pneumonia.
Warning: Image is too big to fit on screen; displaying at 67%
Warning: Image is too big to fit on screen; displaying at 67%
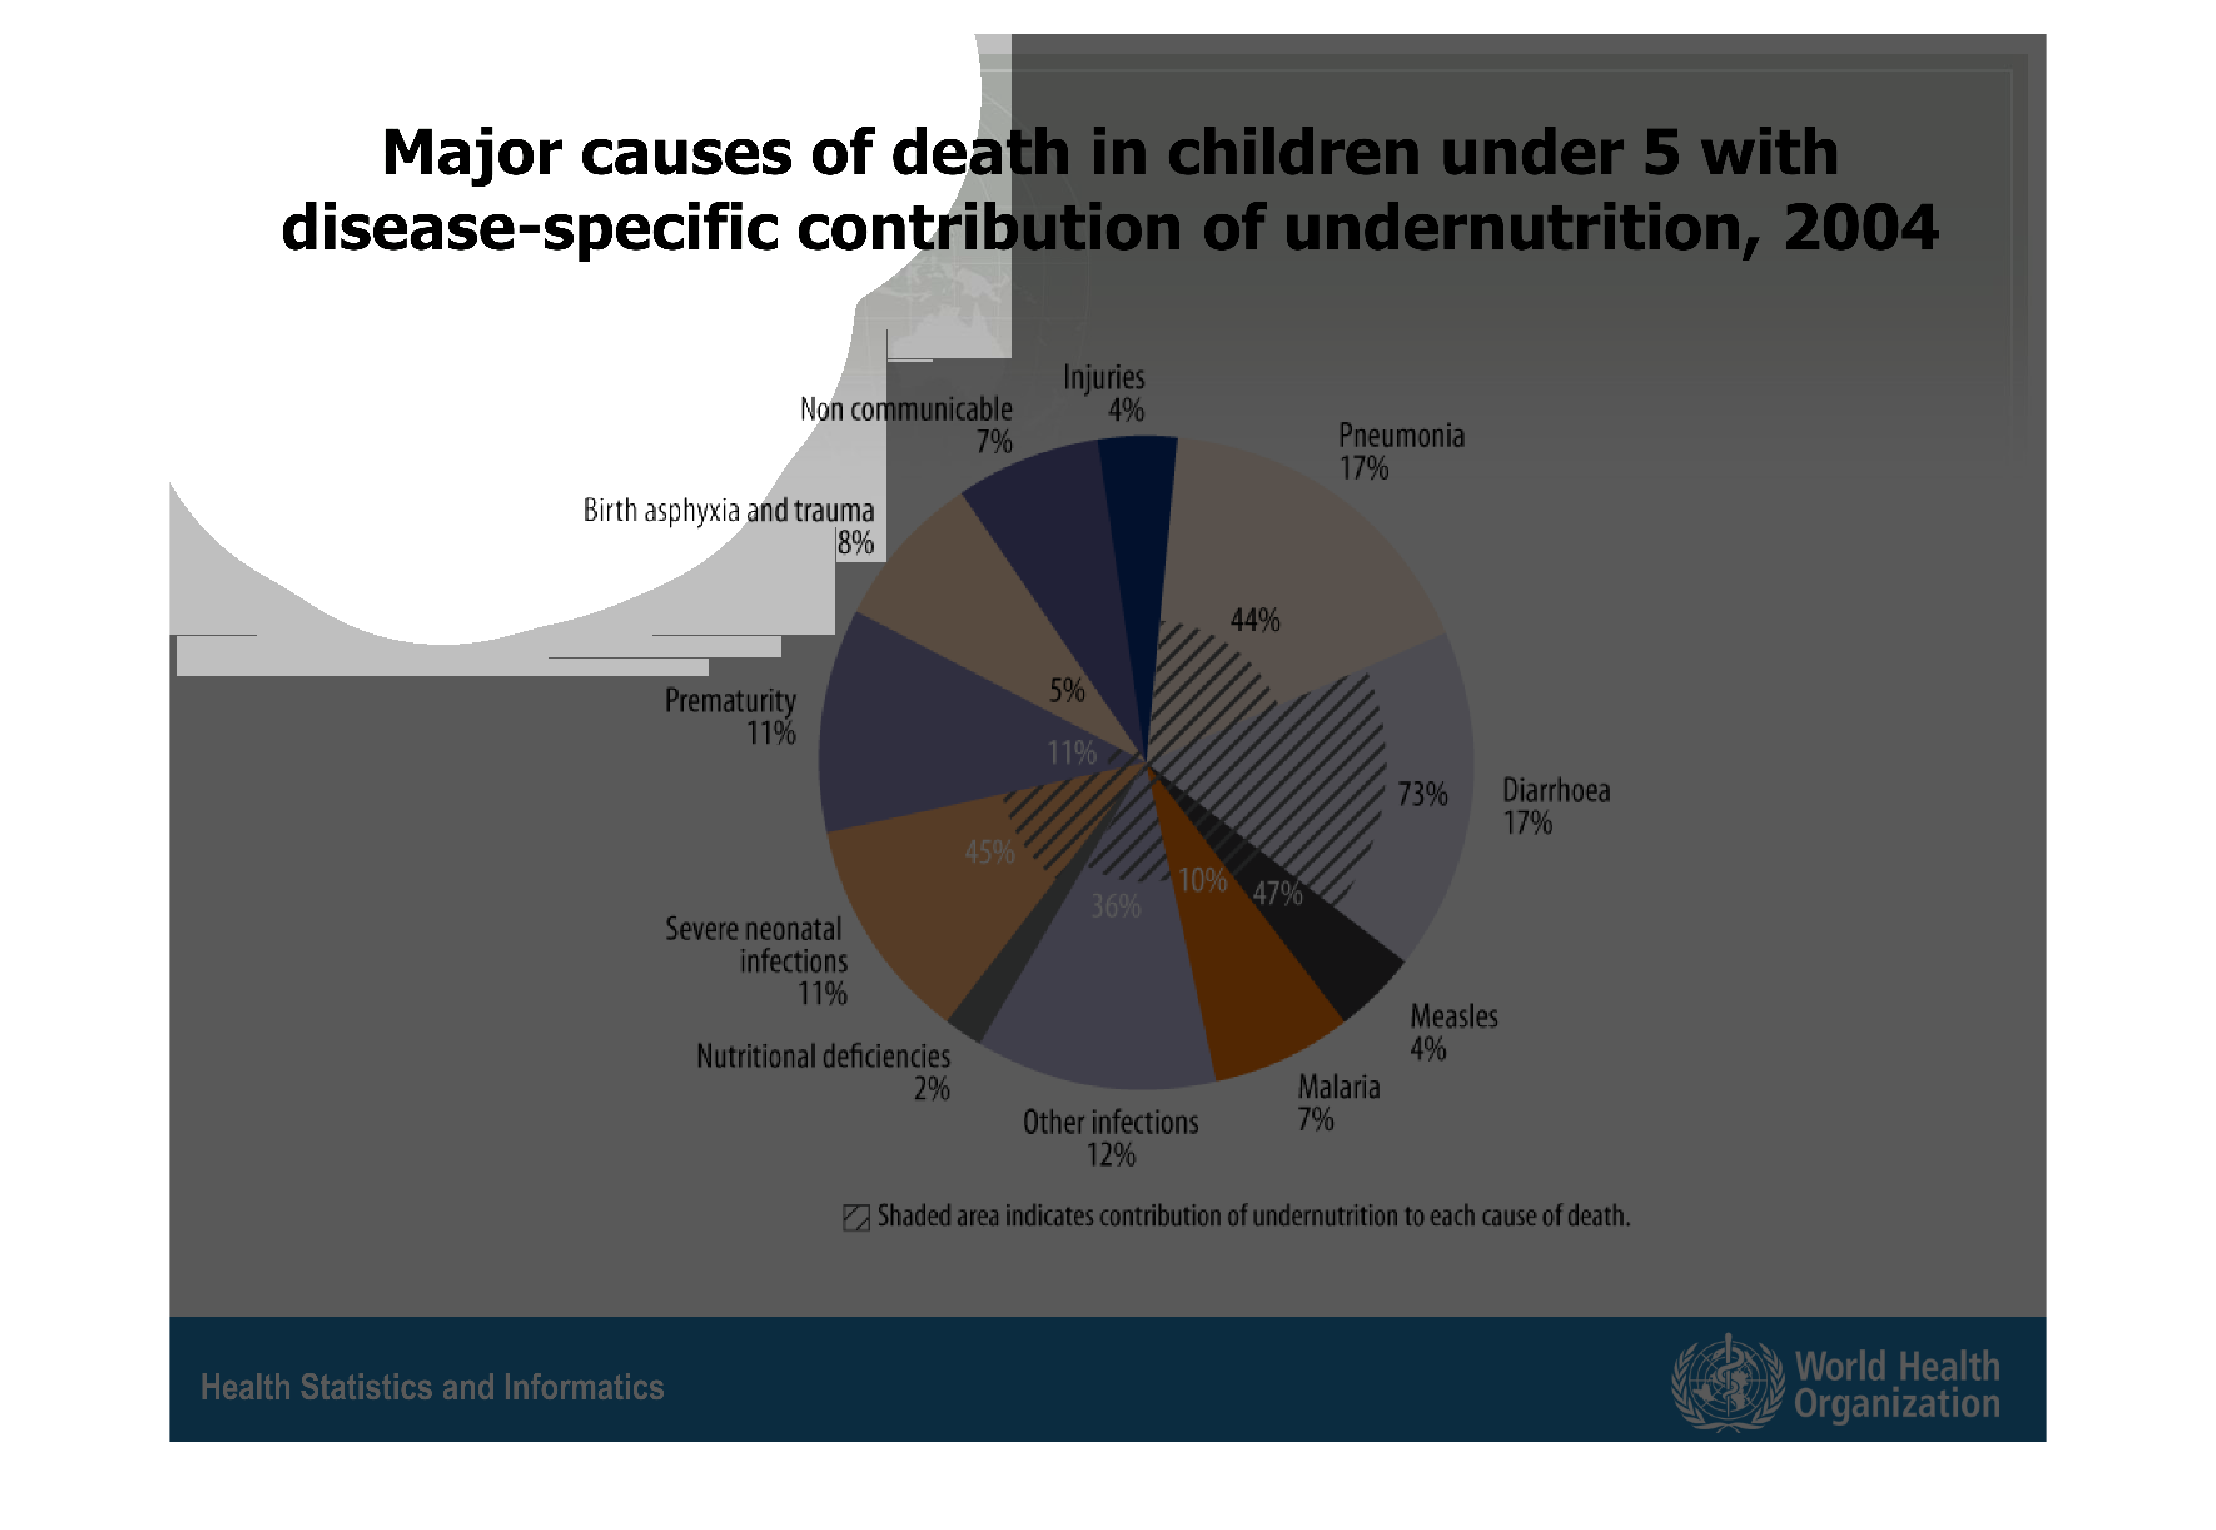
The chart shows the major causes of death in children under 5 by disease and under nutrition
in the year 2005.  The top two are Pneumonia and Diarhoea.  Both are at 17%.
Warning: Image is too big to fit on screen; displaying at 67%
Warning: Image is too big to fit on screen; displaying at 67%
This is a pie chart depicting major causes of death in children under five with disease-specific
contribution of undernutrition in the year 2004. Pneumonia and diarrhea are shown to be the
leaders.
Warning: Image is too big to fit on screen; displaying at 67%
Warning: Image is too big to fit on screen; displaying at 67%
A chart showing major causes of death of children under five with disease specific contribution
of undernutrition in 2004. including injuries and malaria.
Warning: Image is too big to fit on screen; displaying at 67%
Warning: Image is too big to fit on screen; displaying at 67%