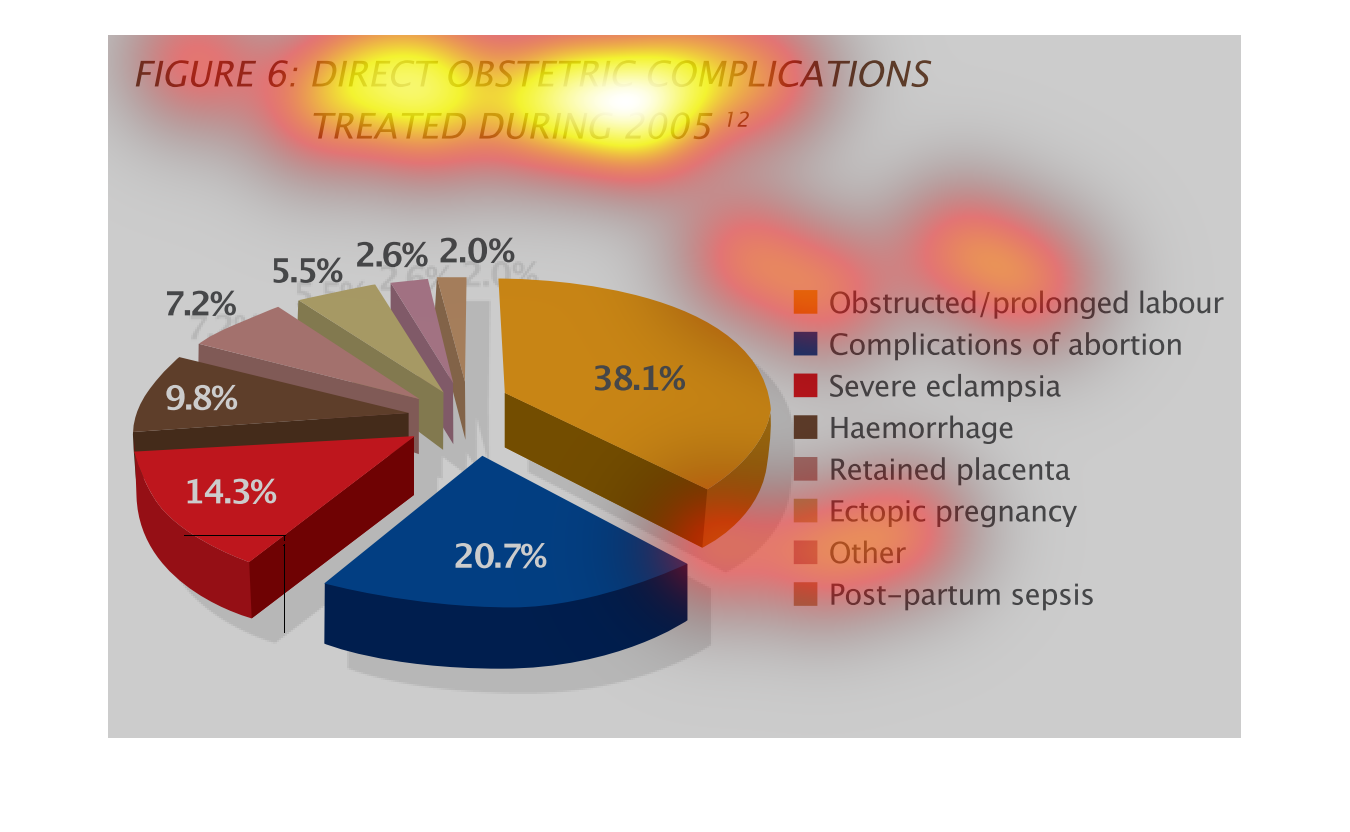
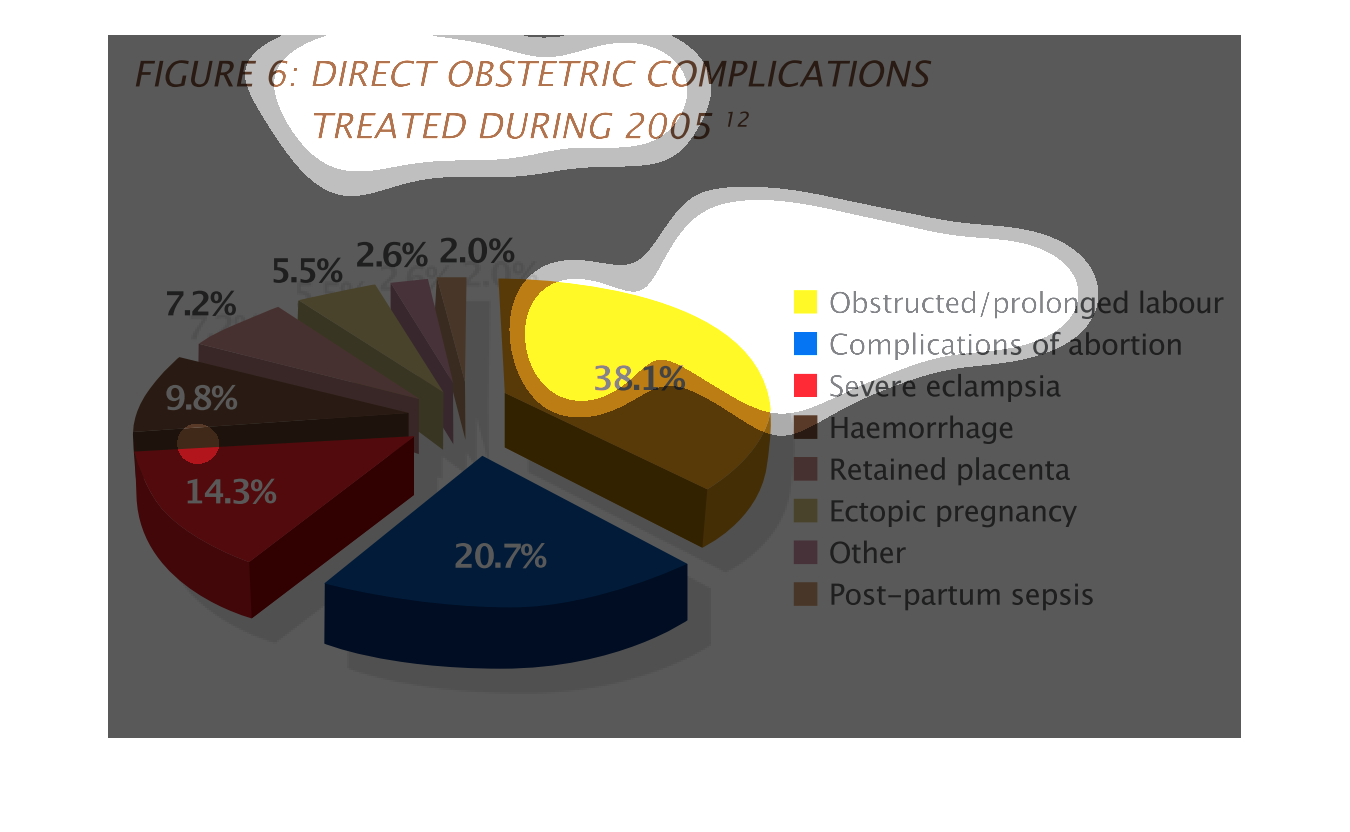
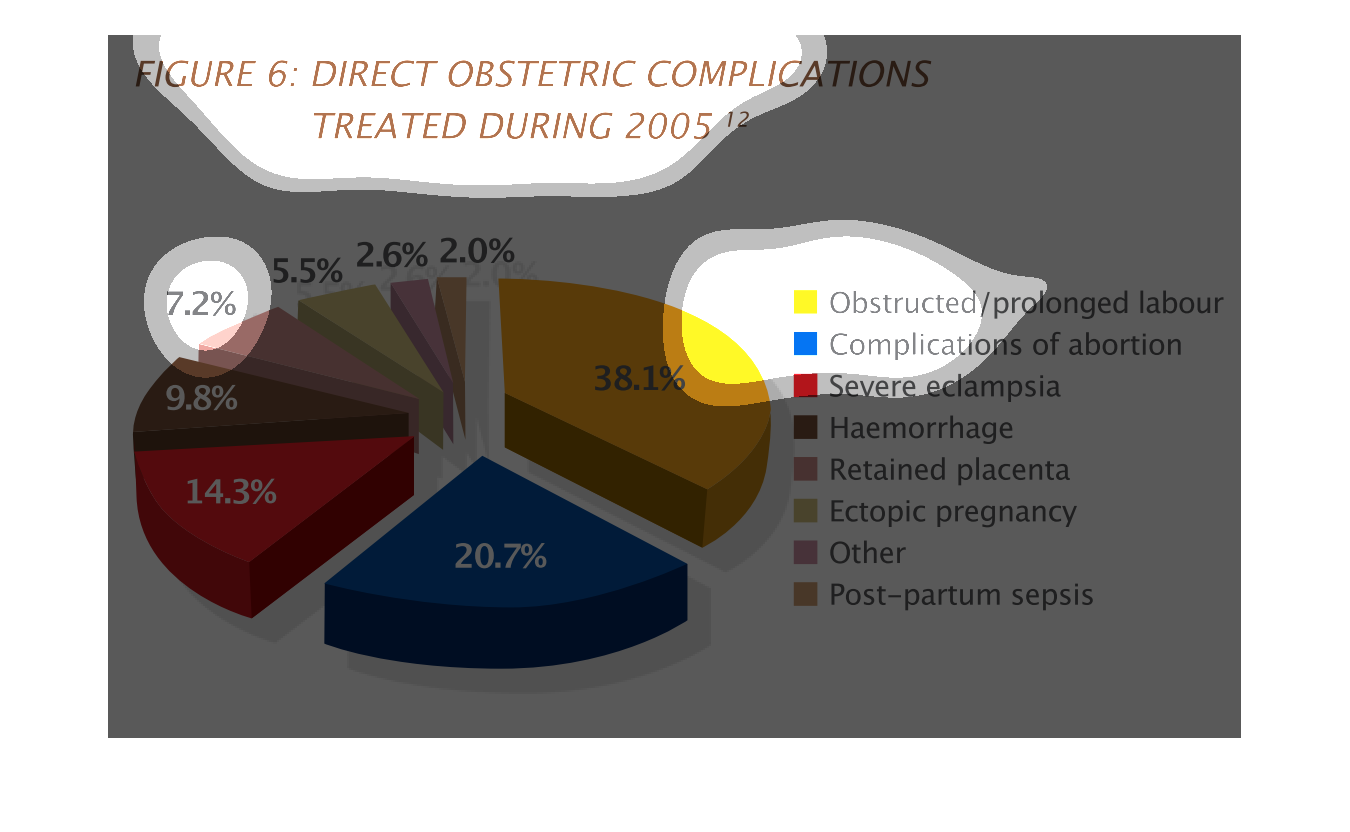
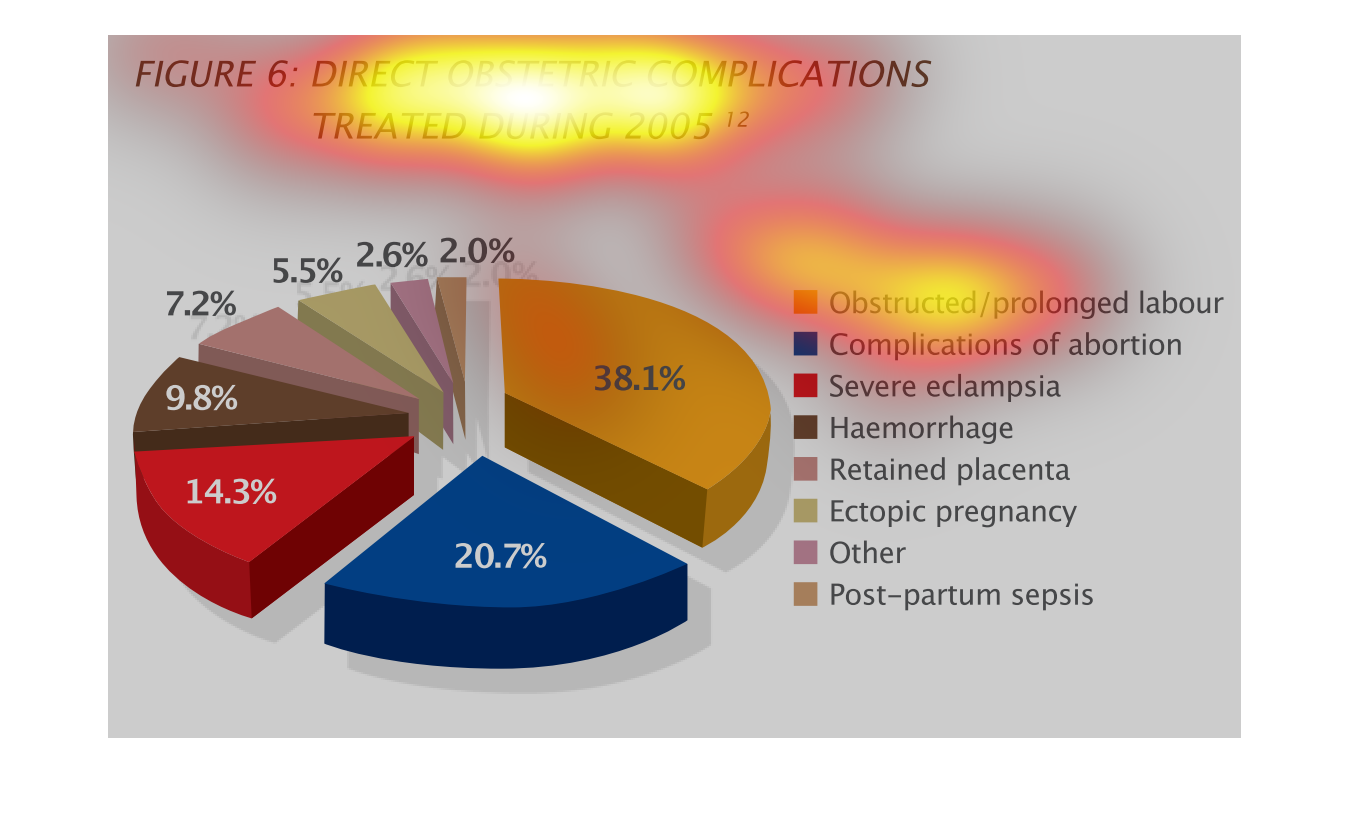
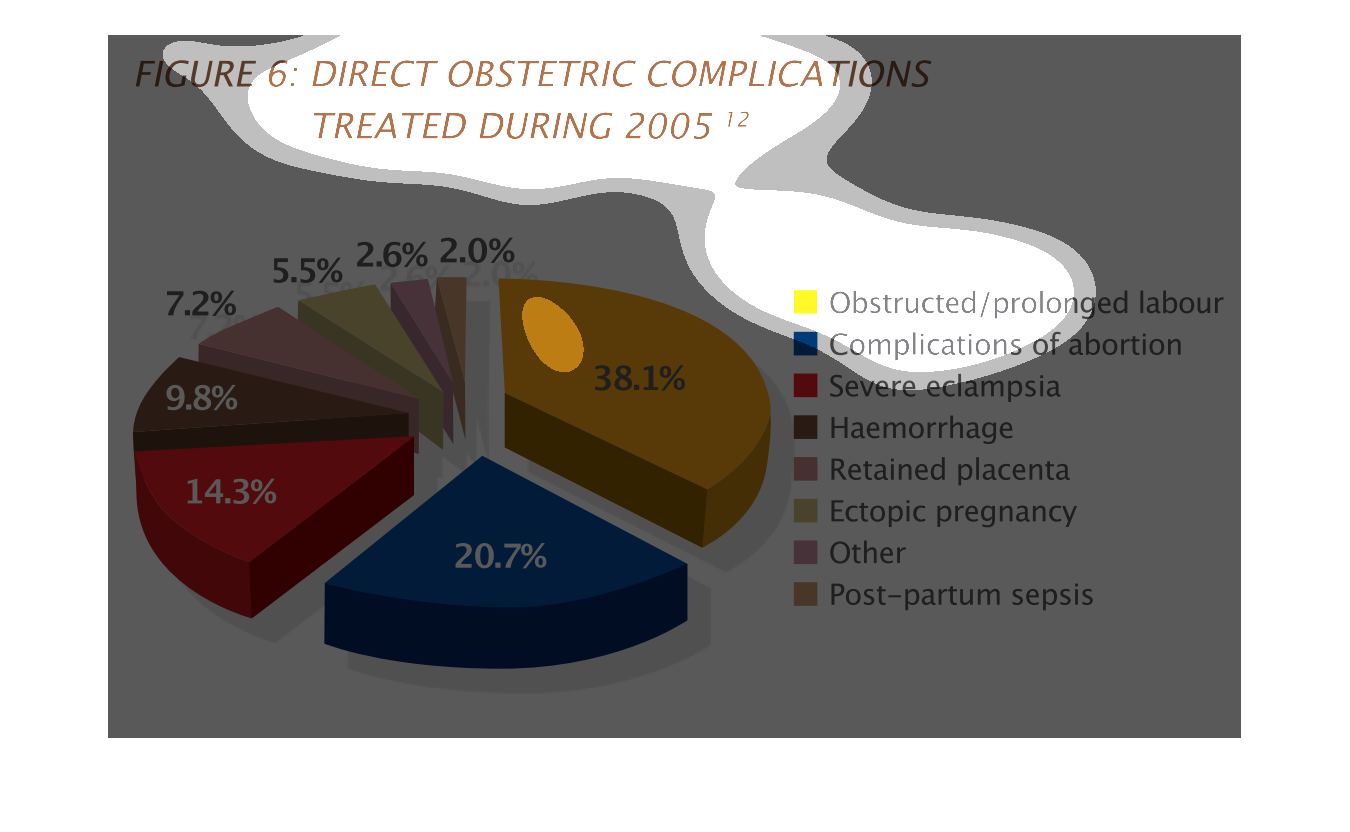
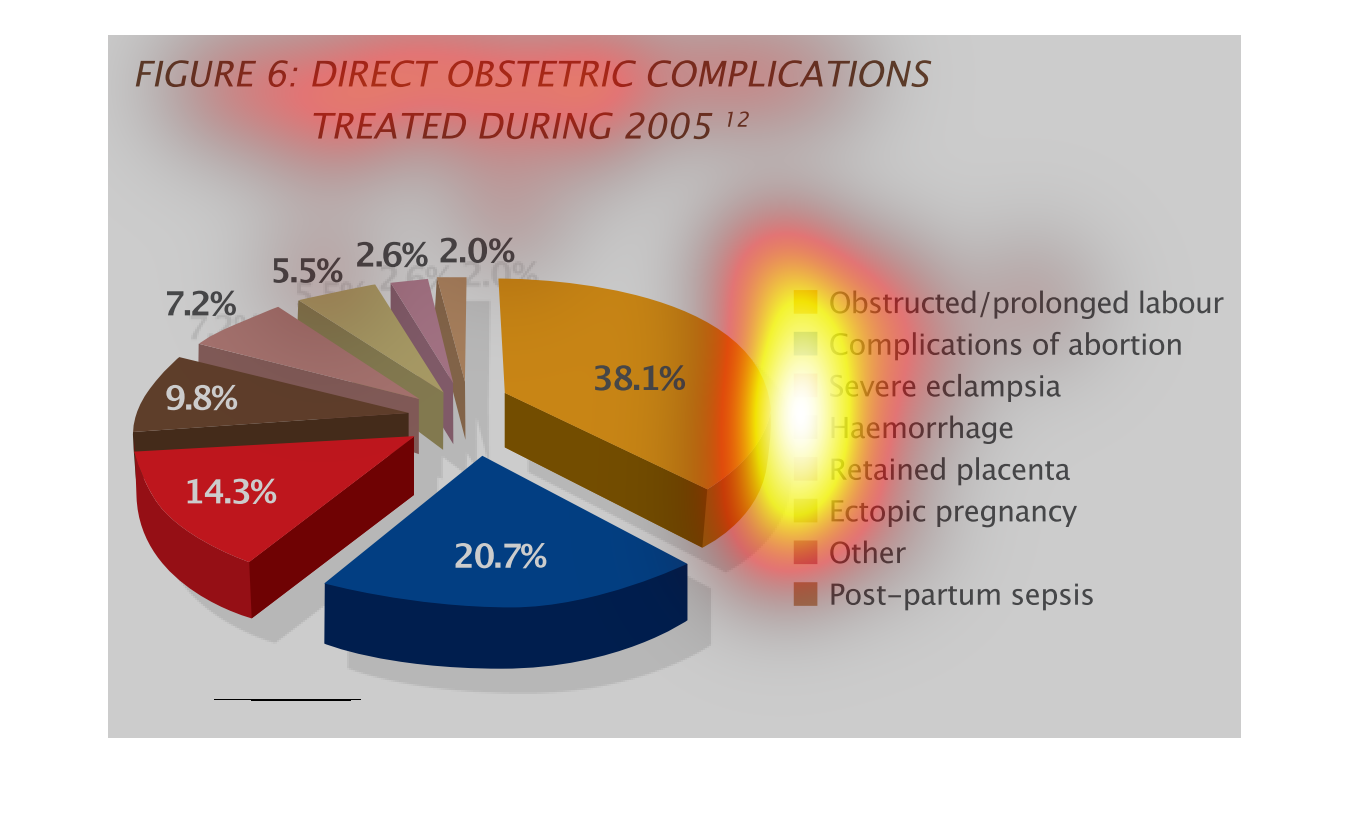
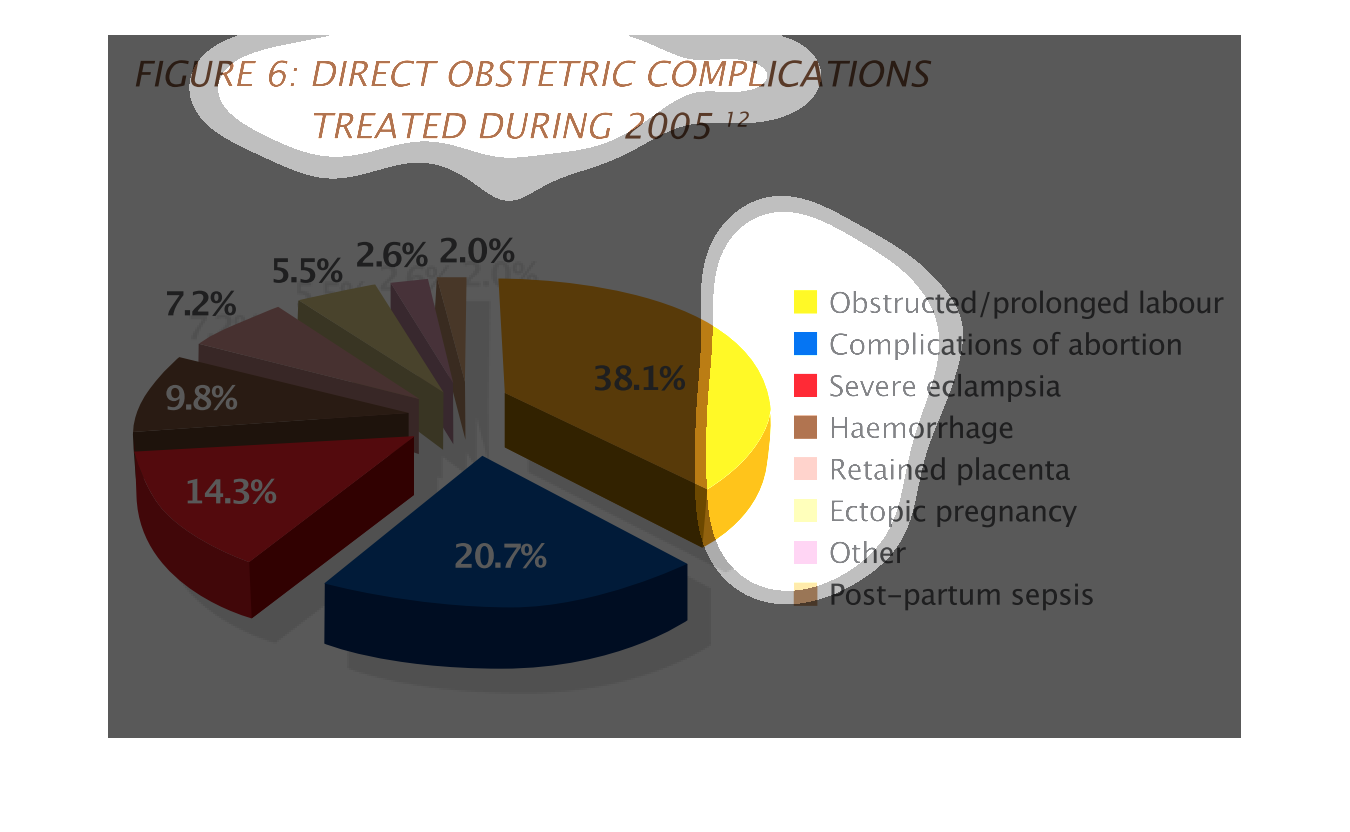
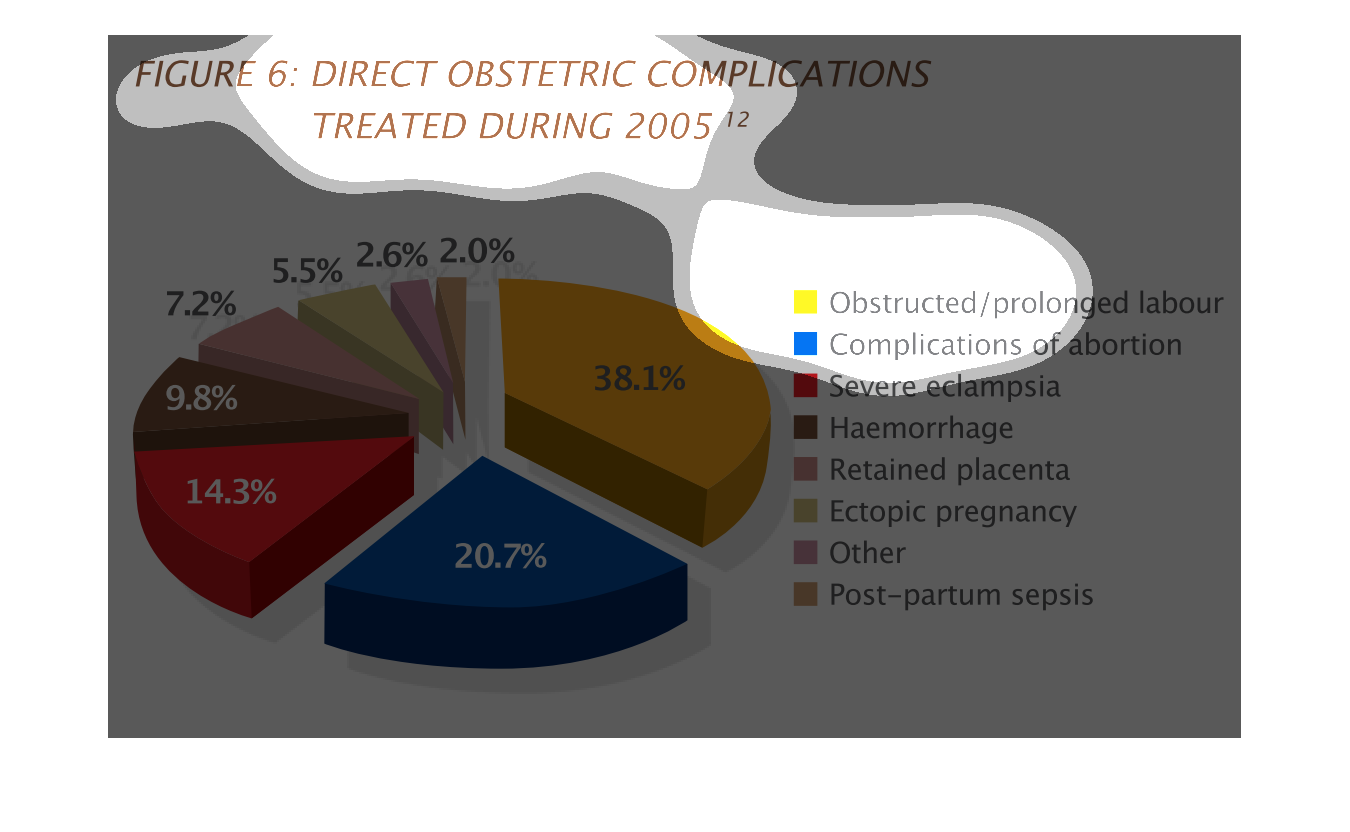
The pie chart reqpresents direct obstetric complications treated during 2005. Top three complications
being obstructed/prolonged birth at 38.1%, complications of abortion at 20.7%, and severe
eclampsia at 14.3%.
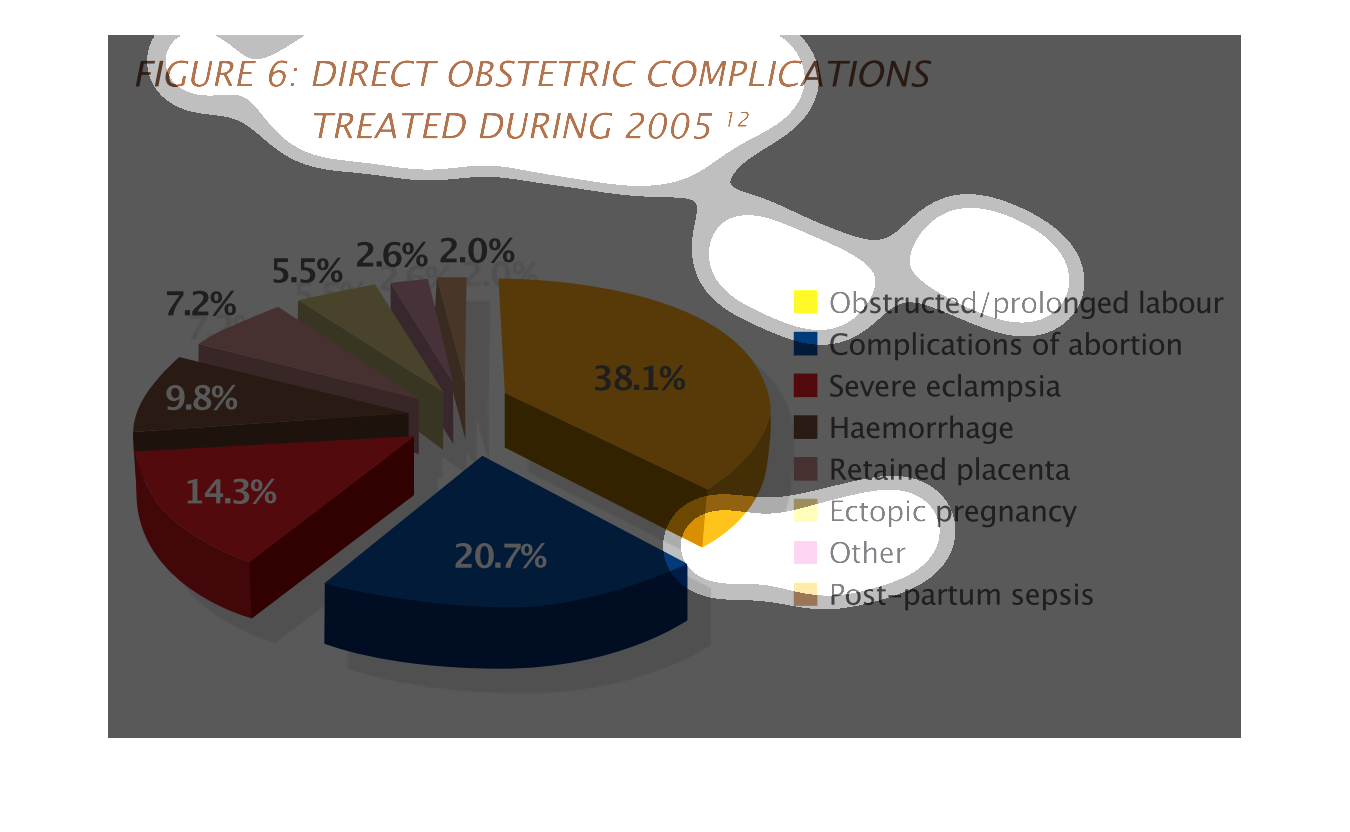
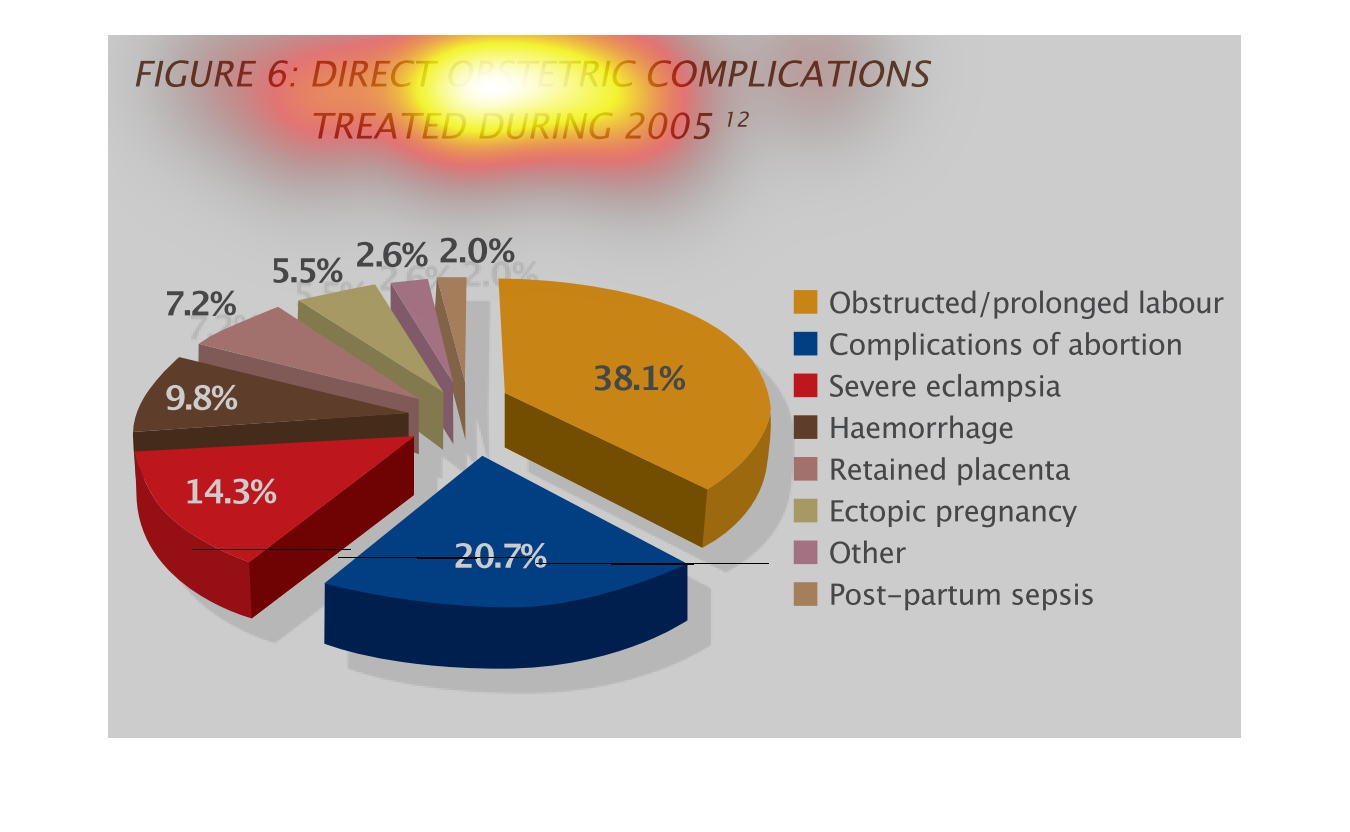
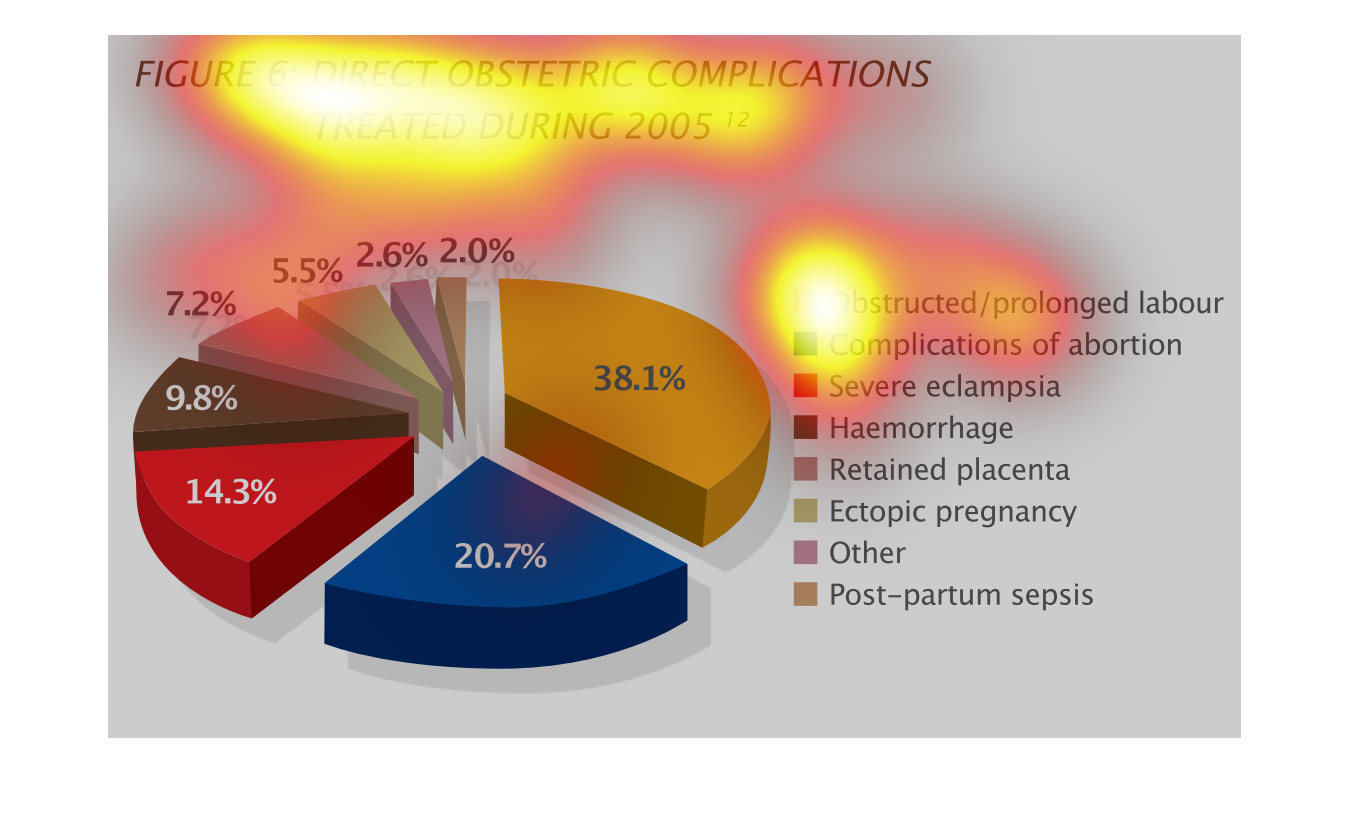
This chart describes direct obstetric complications treated during the year 2005. Different
categories on the chart are represented by different colors.
This image shows a circle graph which depicts direct obstetric complications treated during
2005.  Different pregnancy complications are listed and given a color.  These colors are then
drawn in the circle graph and given percentages to show the amount of each type of complication
that occurred.
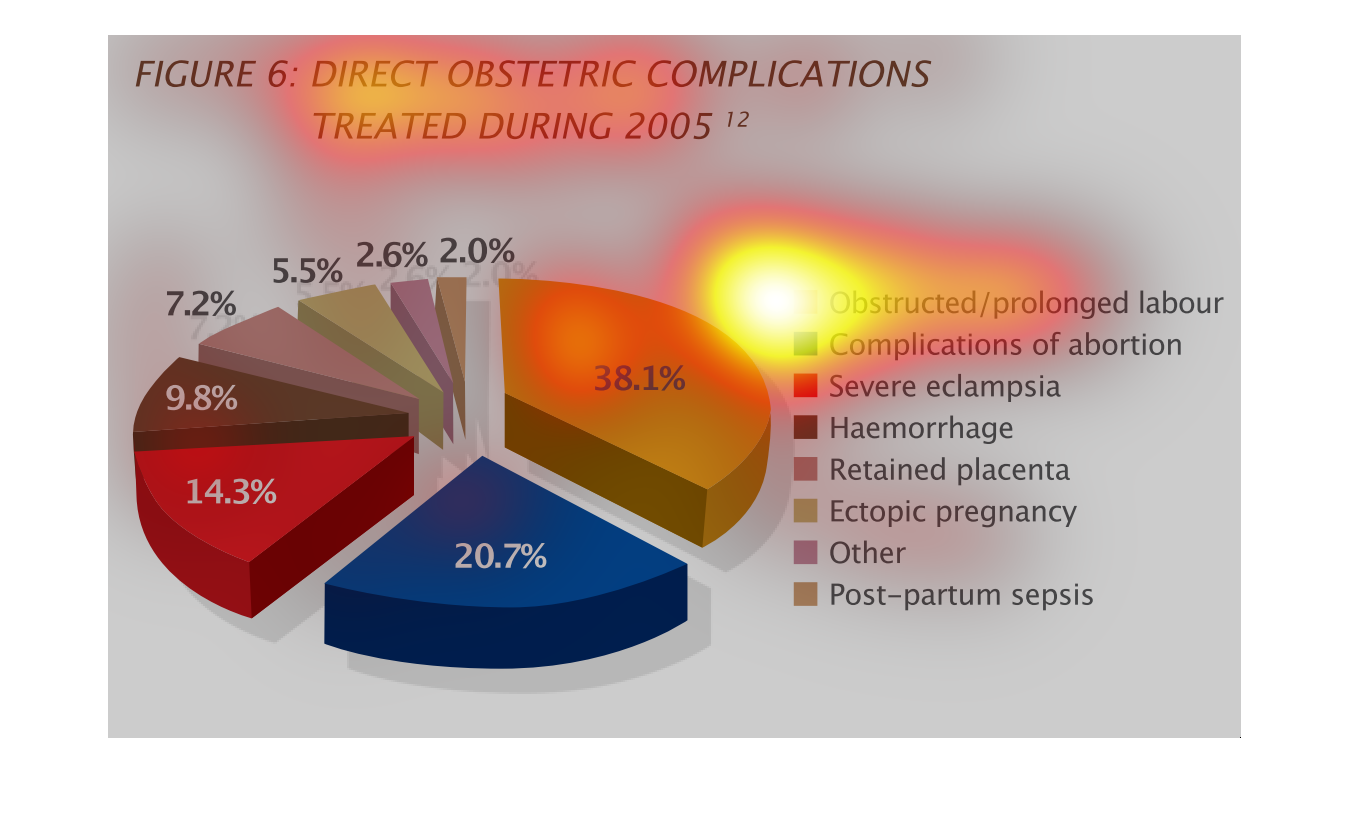
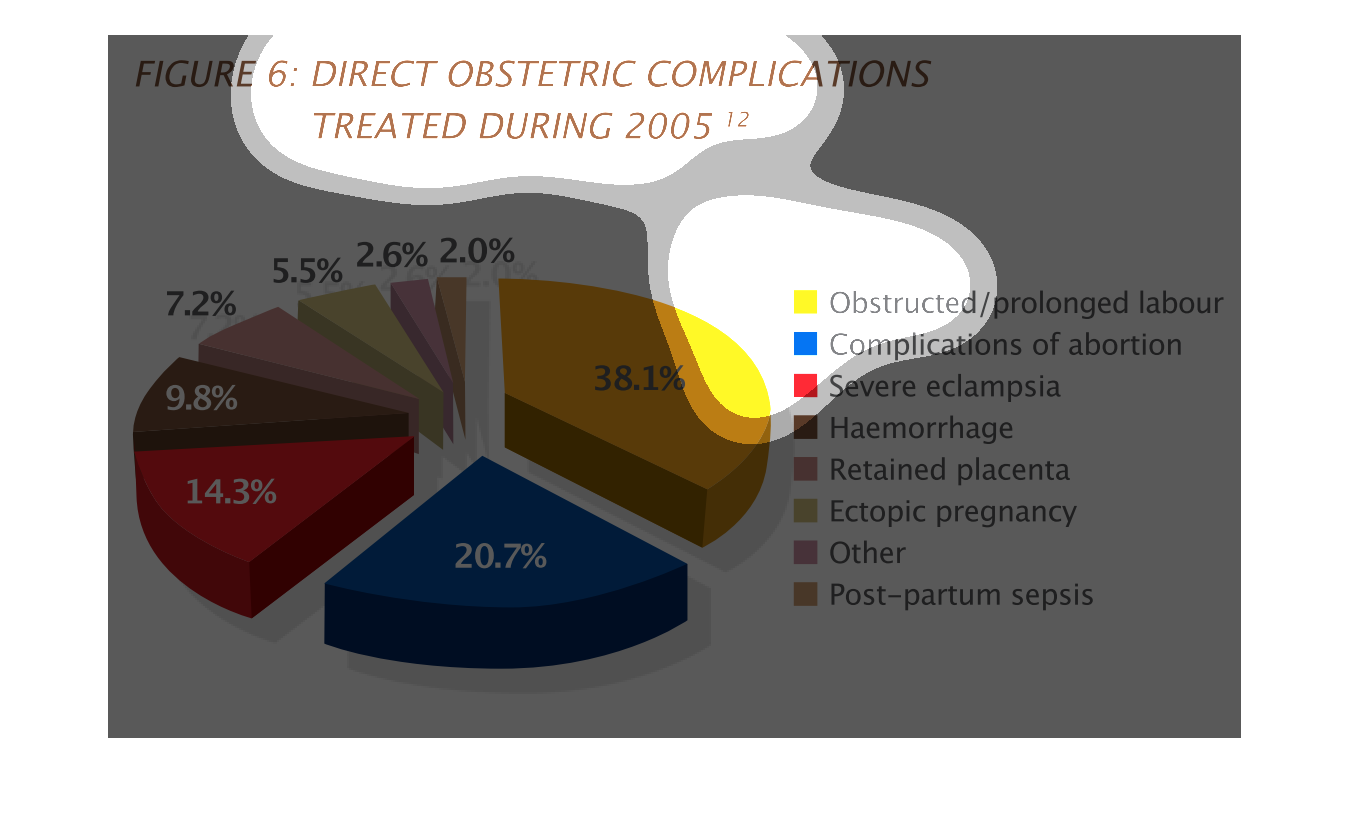
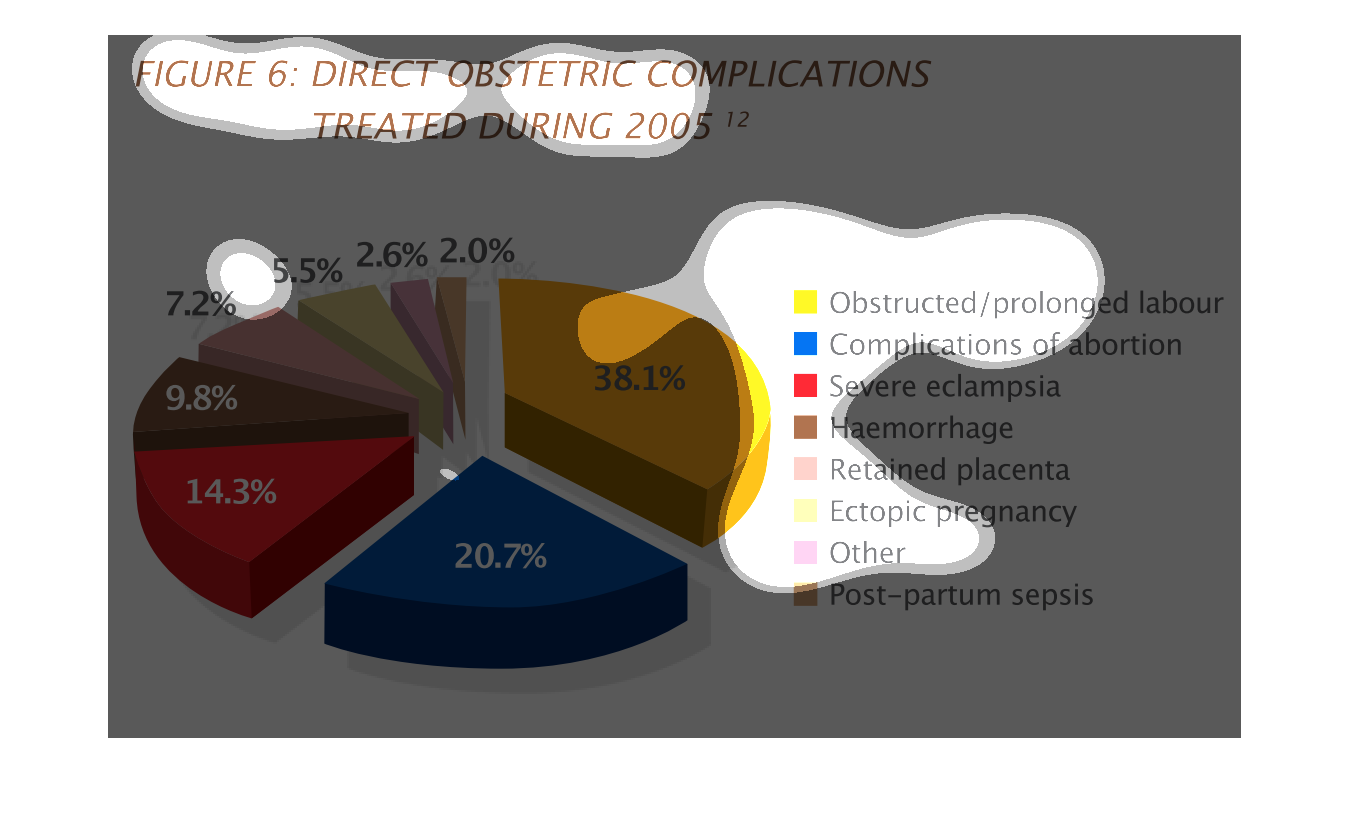
This is a pie chart which describes the direct obstetric complications in 2005. Each color
represents a different category. The largest category is represented in yellow and is 38%
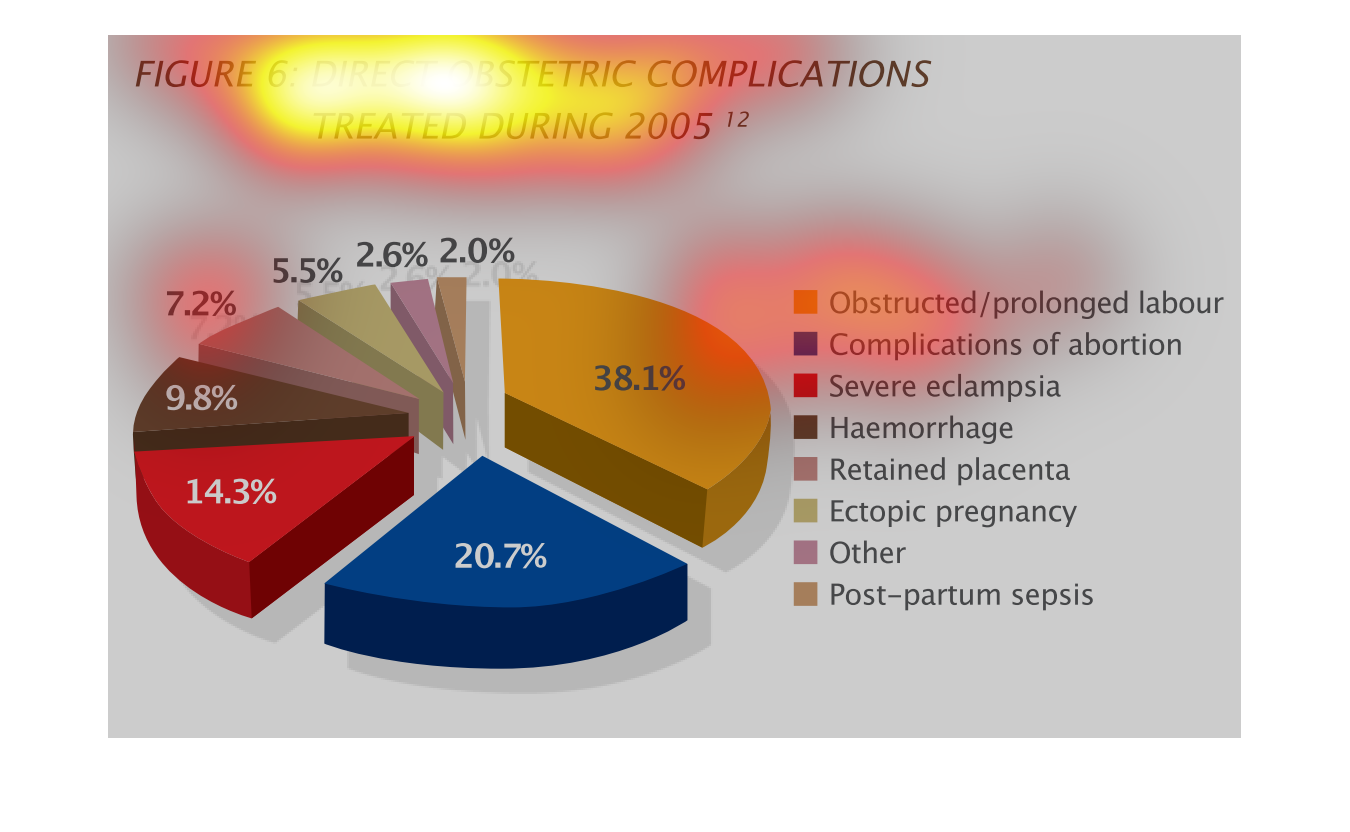
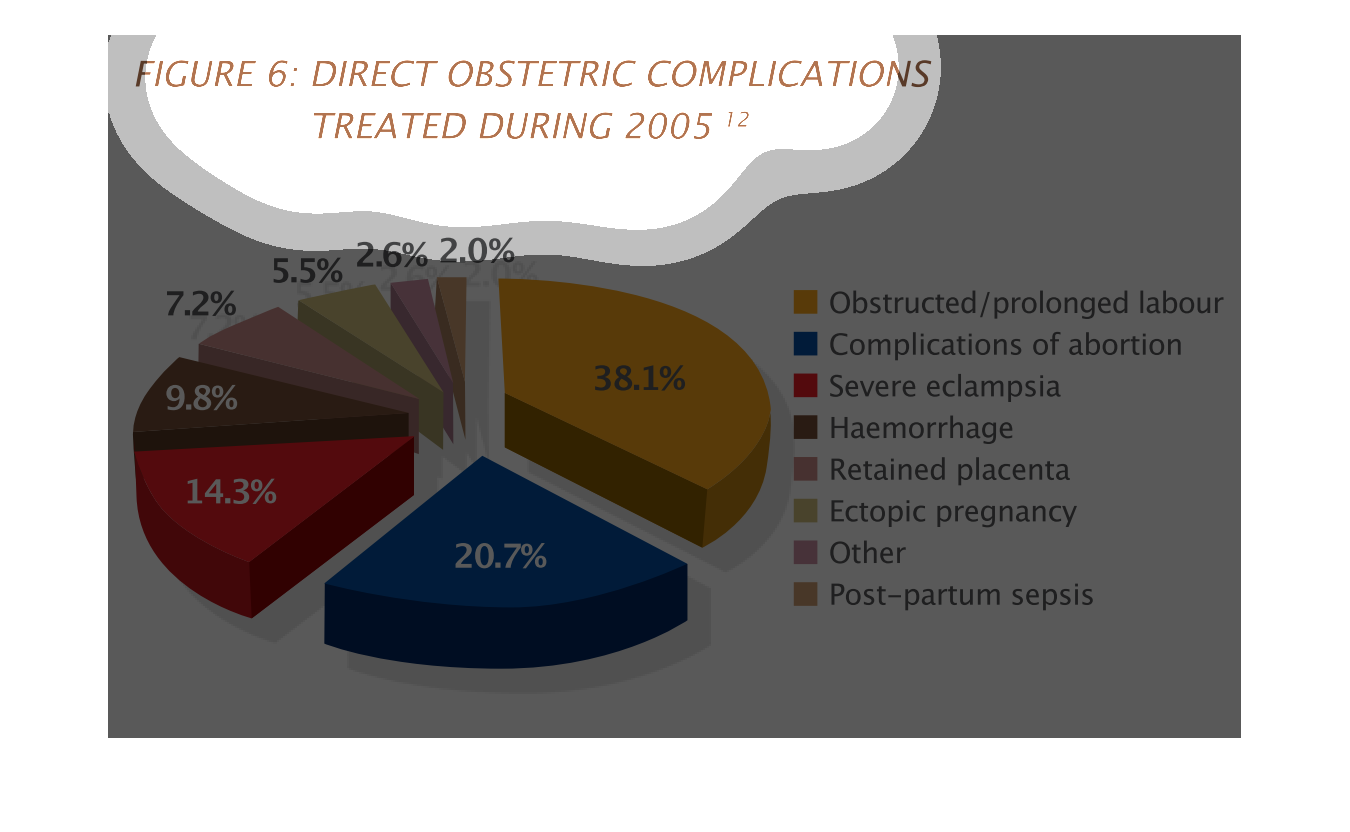
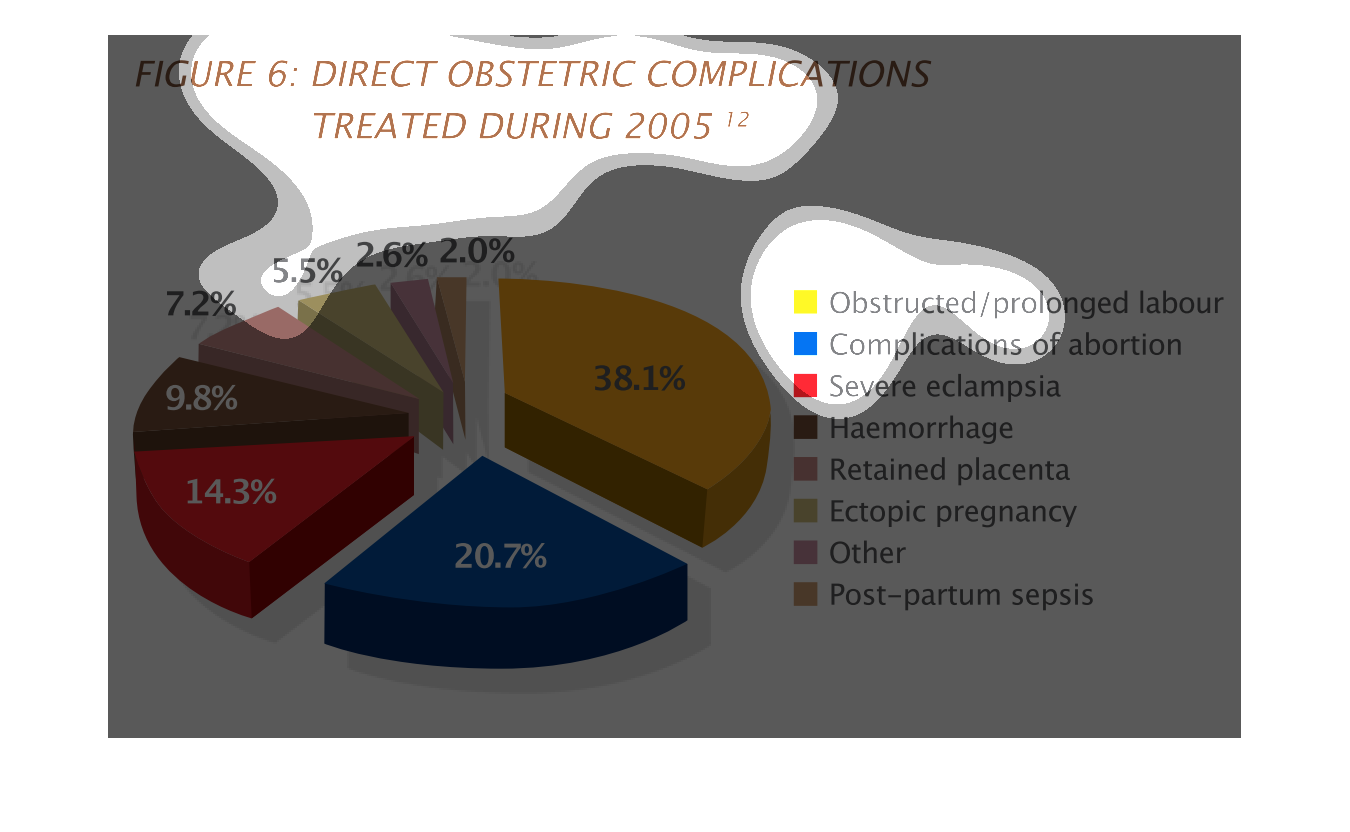
This image or figure shows or depicts in statistical pie chart format direct obstetric comlications
treat during 2005. There are 7 different categories.
This handmade chart shows something related to obstetrics in 2005. Other than that it doesn't
say much because there is no context on what country or what region.
This chart illustrates the direct obstetric complications treated in 2005. Obstructed or prolonged
labor makes up the majority of obstetric complications treated, with complications of abortion,
severe eclampsia, haemmorhage, retained placenta, Ectopic pregnancy, other, and post-partum
sepsis accounting for the other obstetric complications treated, in that order.
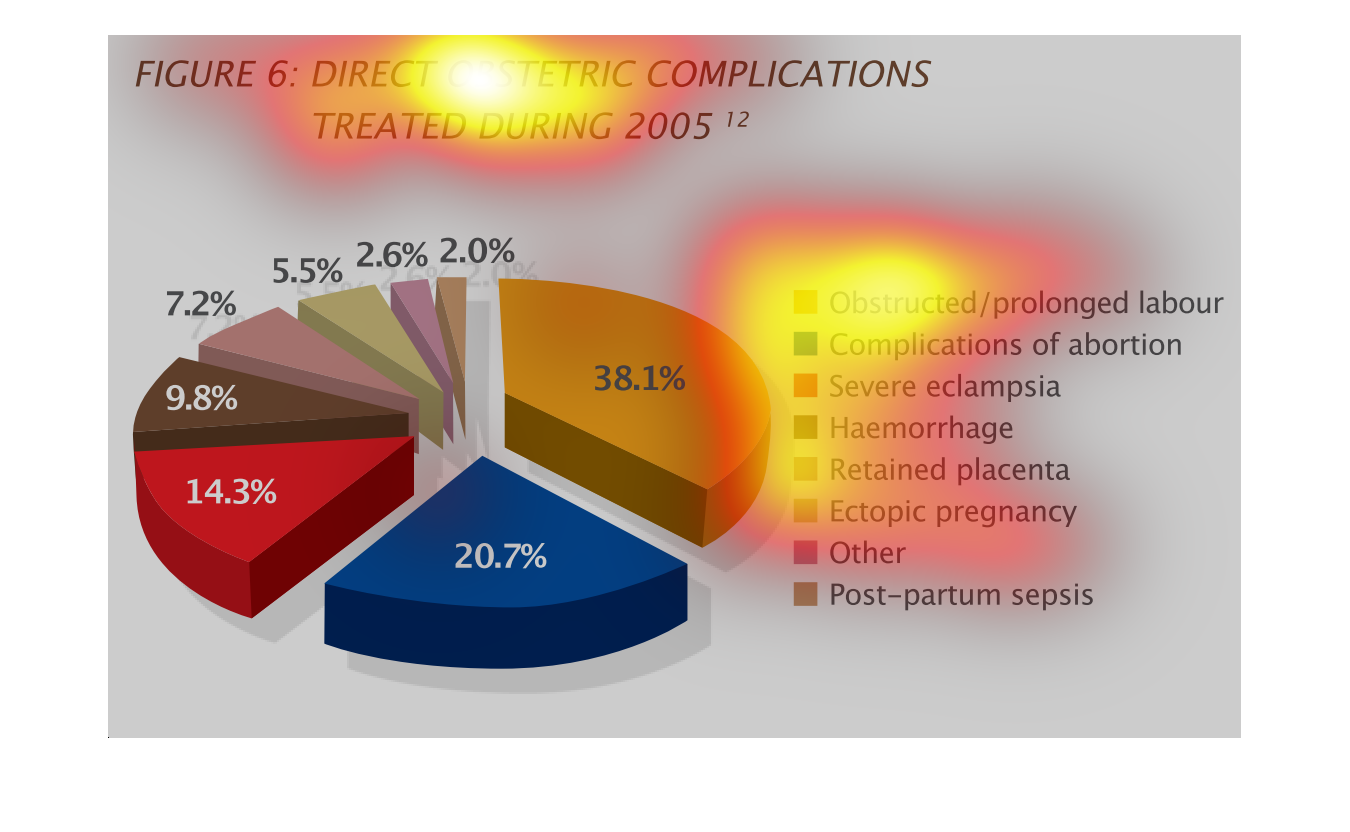
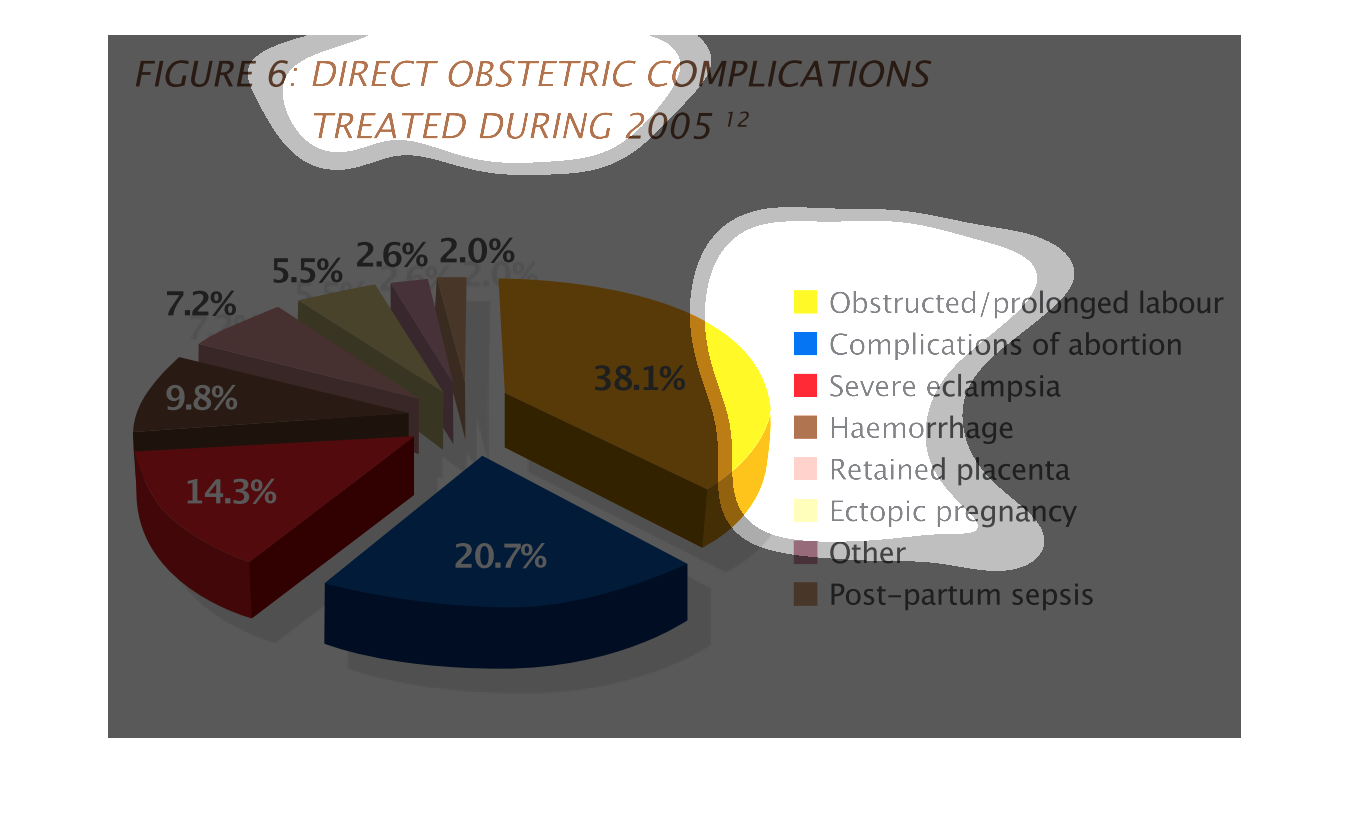
This is a pie graph that depicts a representation of the number of pregnancy complications
treated during the year of 2005. The graph is broken down to represent different complication
types.
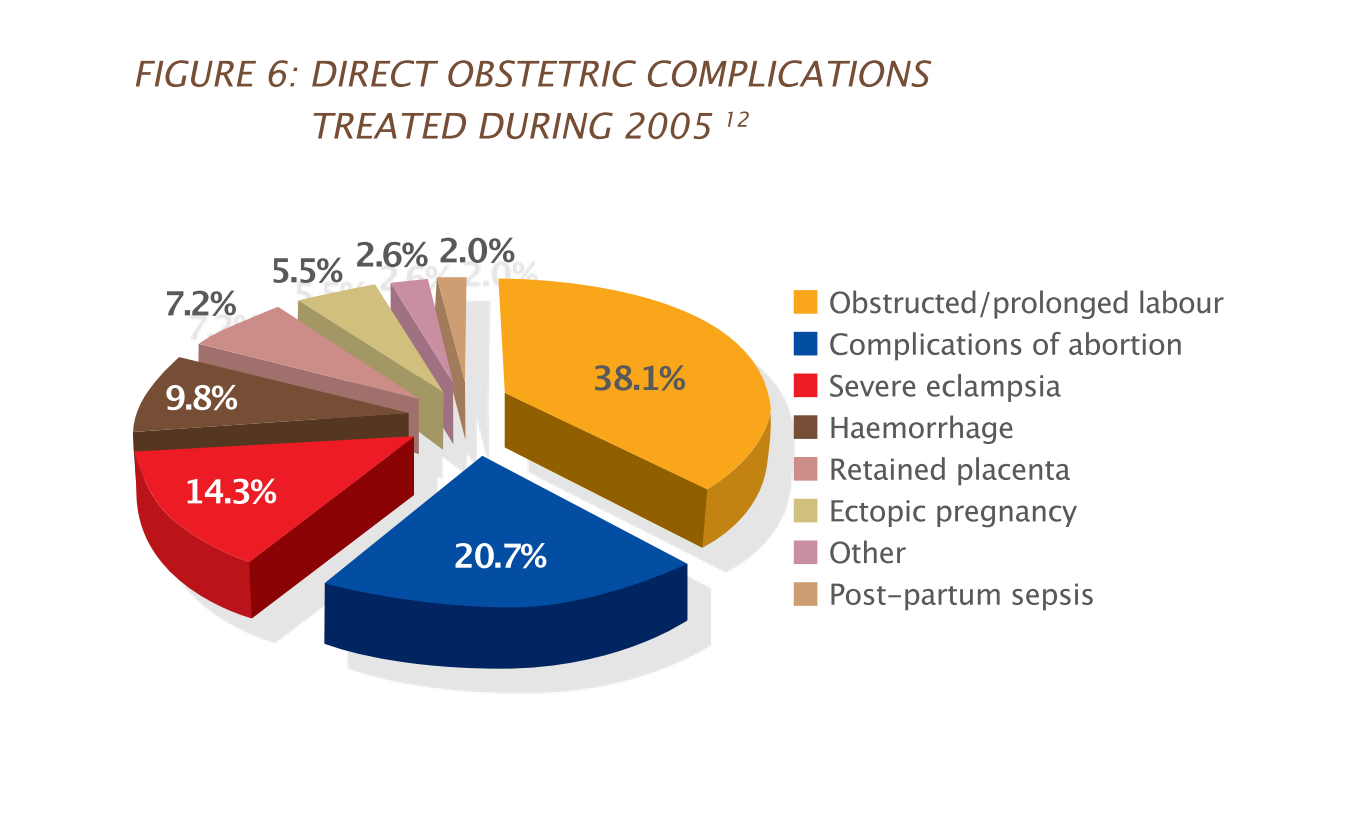
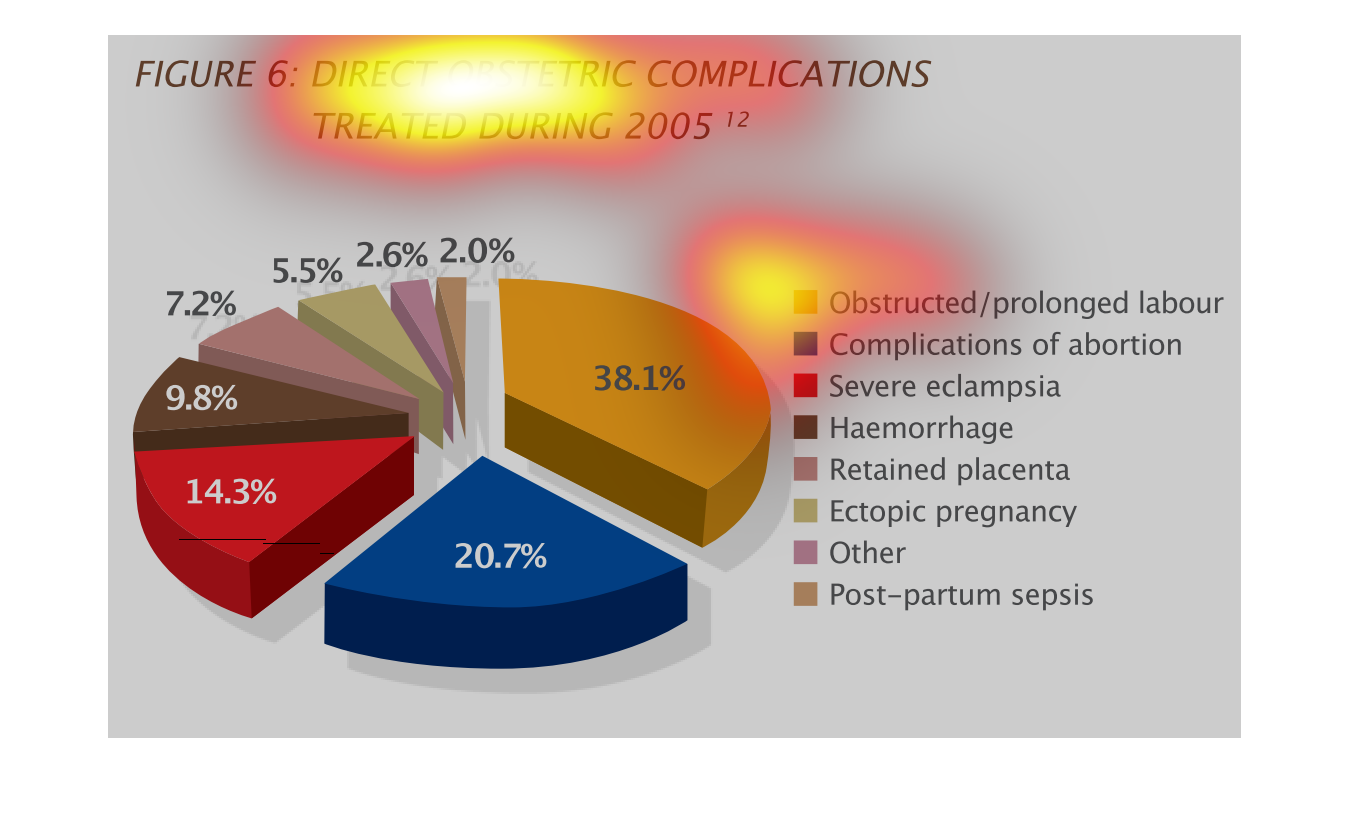
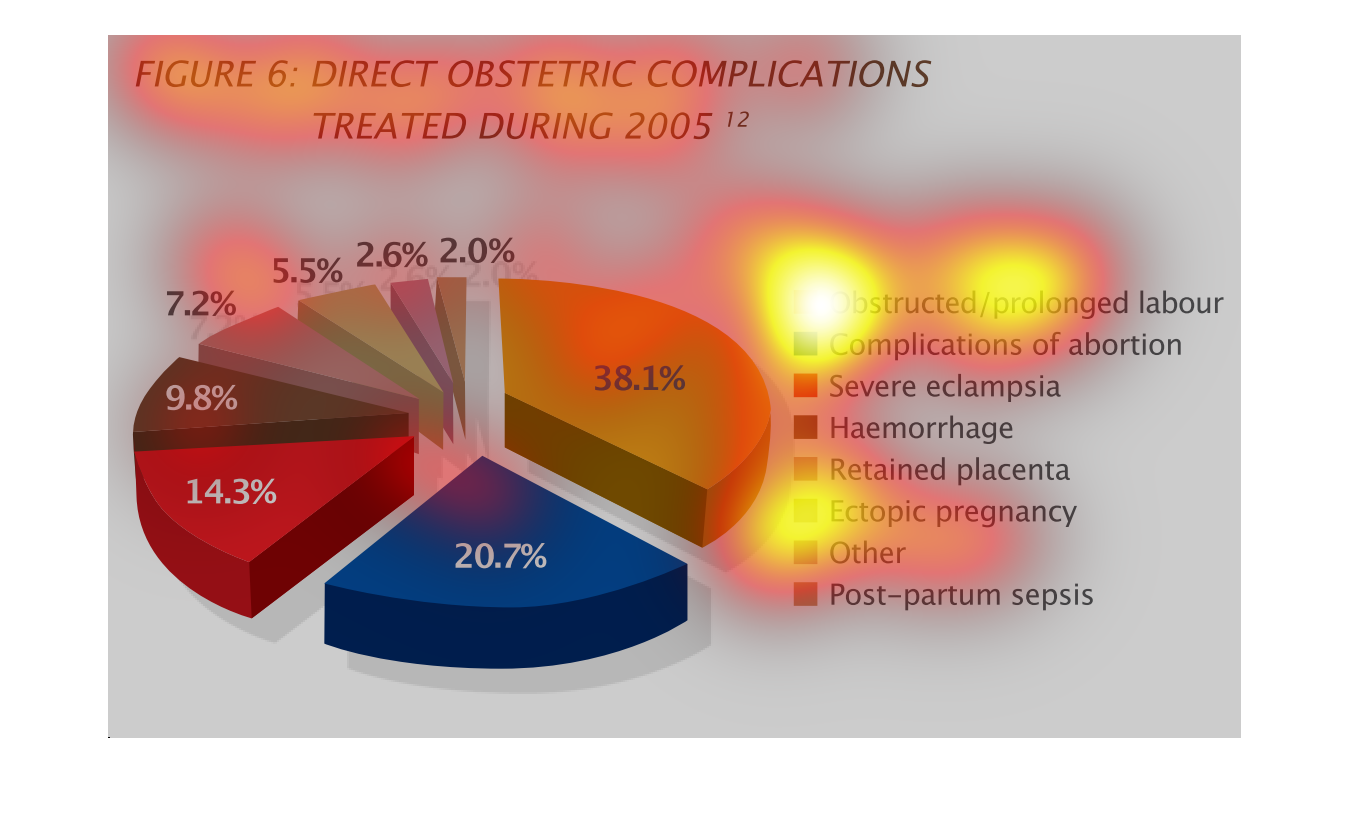
This is a graph of direct obstetric complications treated during 2005. The greatest percentage
was prolonged or obstructed labor, with the second greatest percentage being complications
of abortion.
This pie chart shows the complications from a certain procedure during 2015. The pie chart
is divided into different parts as slices of pies with different colors.
This is a three dimensional pie chart depicting the direct obstetric complications treated
during the year 2005. The largest portion is shown to be obstructed/prolonged labor.
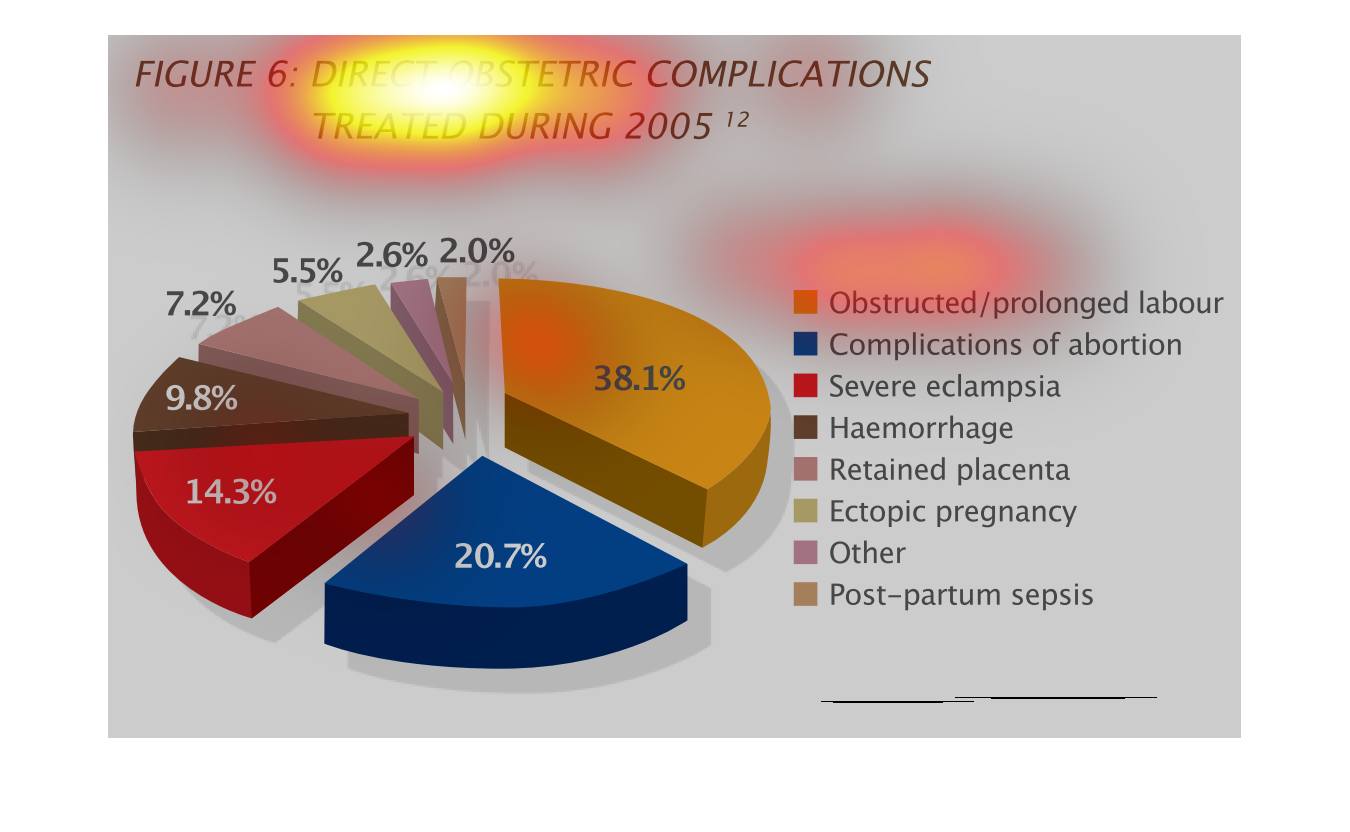
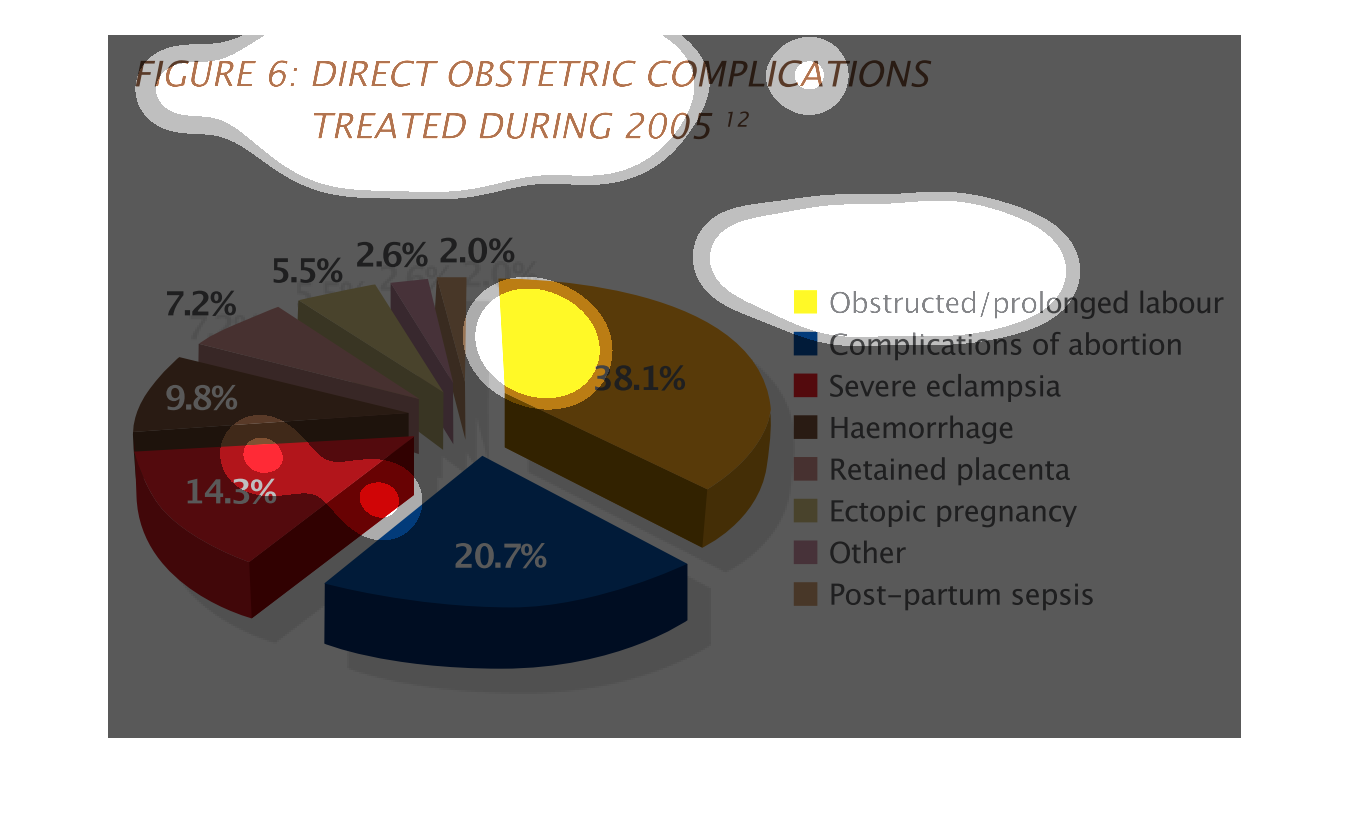
This graph describes the direct obstetric complications that occured in 2005. The most common
cause was obstructed or prolonged labor. The least common cause was Post-Partum Sepsis.
The pie chart shows comlications with obstetrics in the year 2005.  the most common being
prolonged labor and the least common being post partum sepsis.