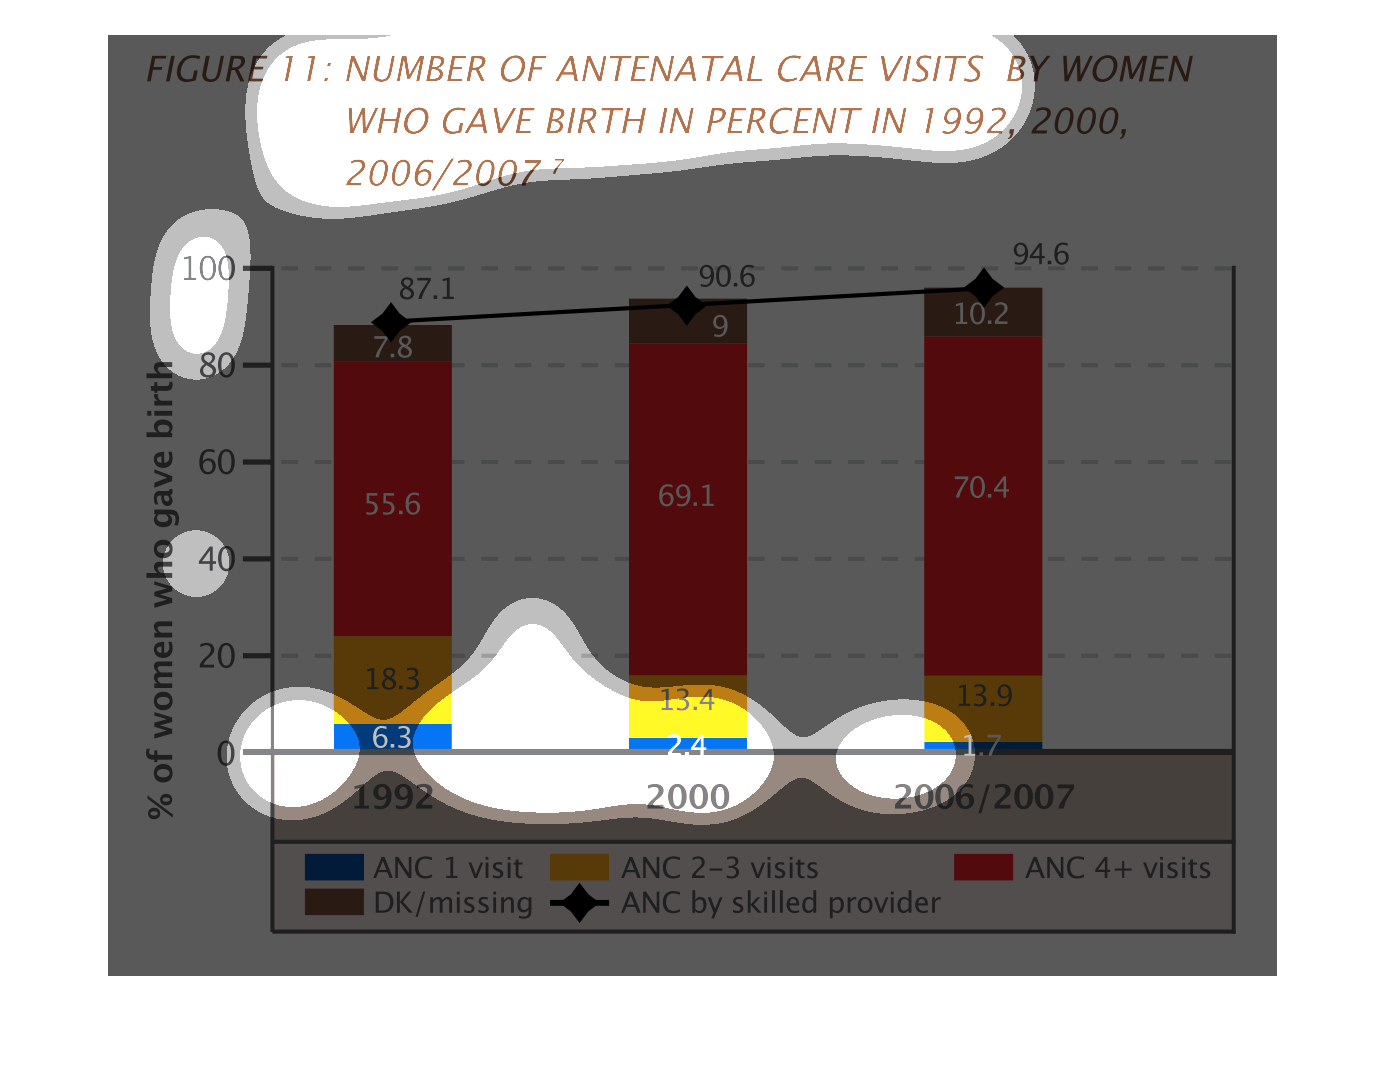
This graph shows number of Antenatal Care Visits by women who gave birth in percent in 1992,
2000, and 2006 and 2007. Red shows the strongest compared to the others.
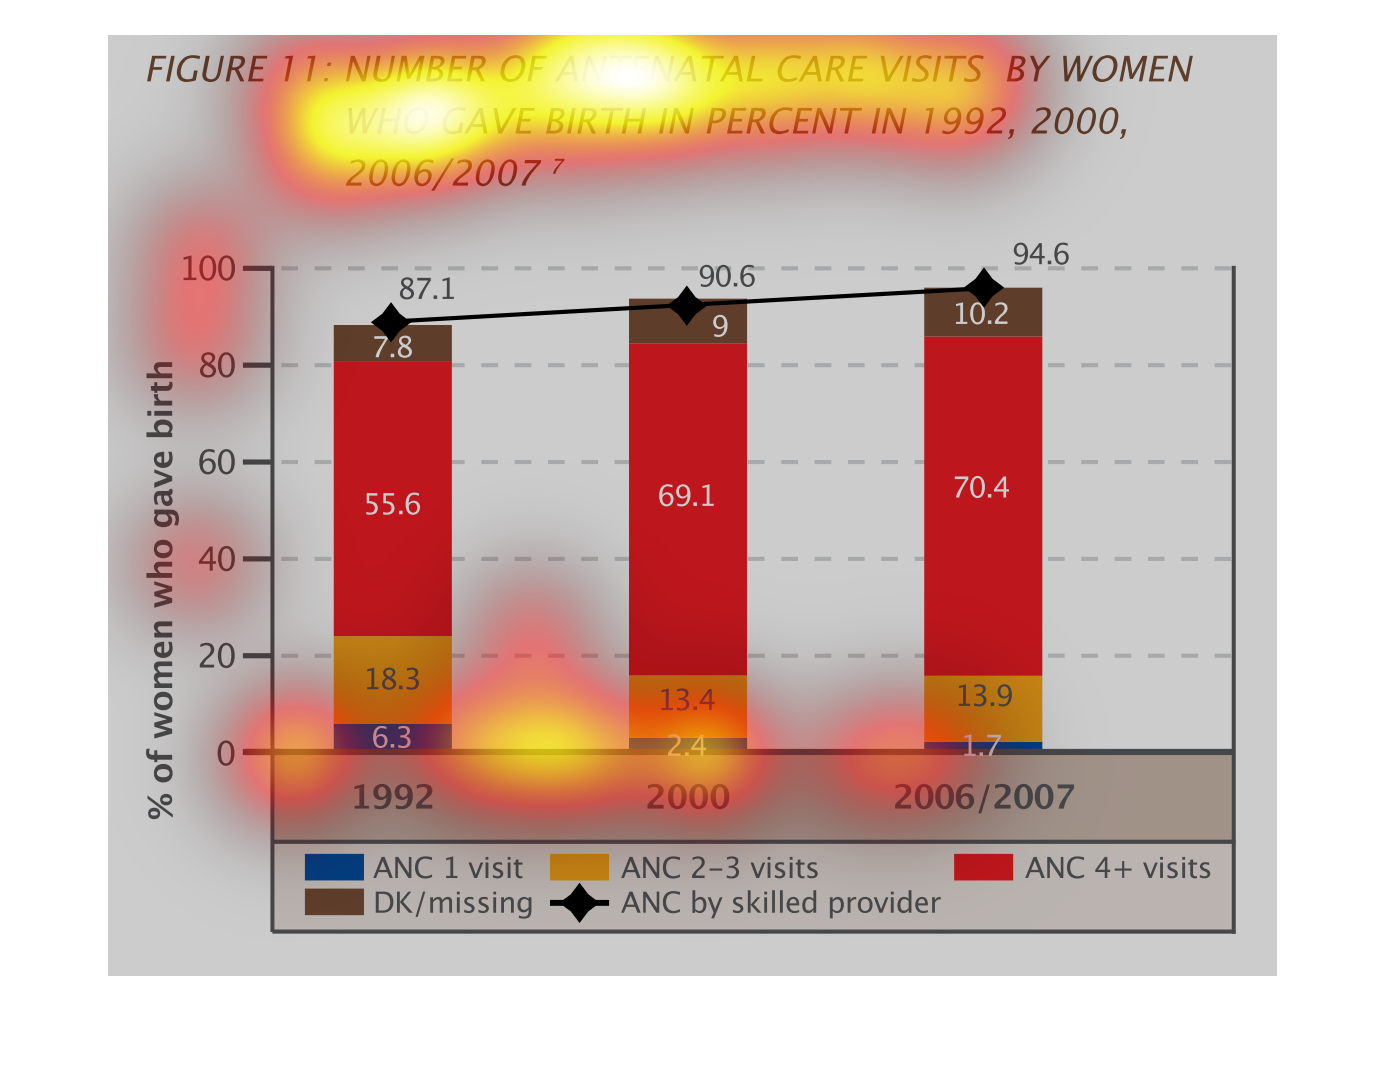
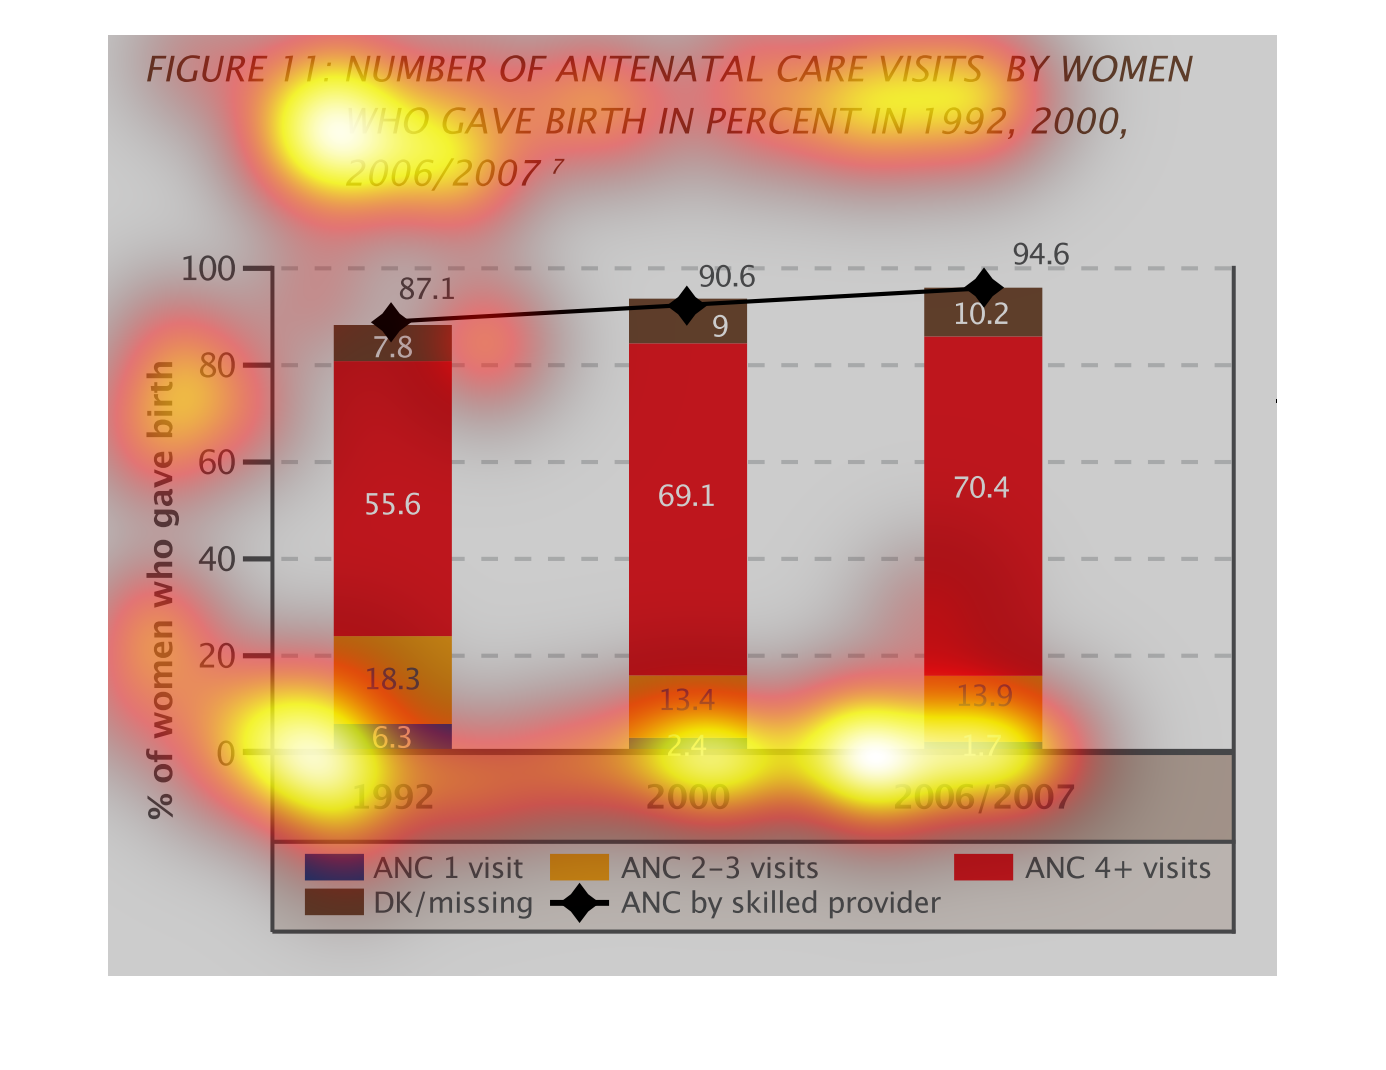
so this is a graph of percentage of women who gave birth between the years 1992 to 2007.
the variable is percentage of women who gave birth and the bottom is a bunch of color coded
things that are difficult to make out one by one.  Looks like there is a lot of red which
means that the ANC had 4 plus visits
This handmade chart shows talks about the number of anti natal visits by women who gave birth.
I have no idea what this means and how to interpret this

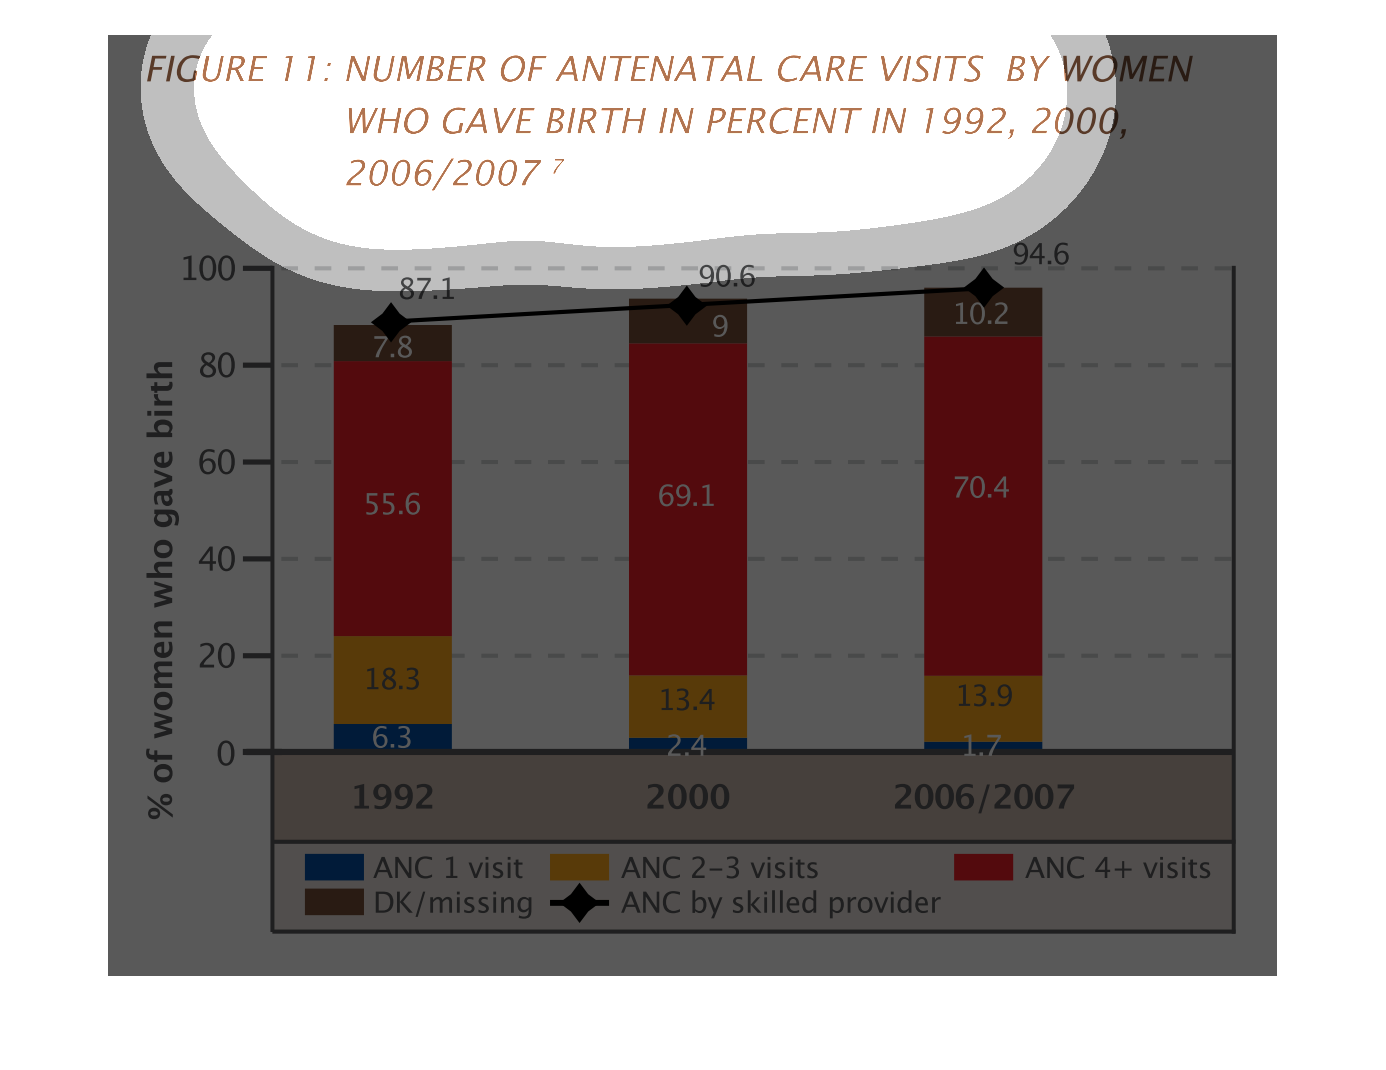
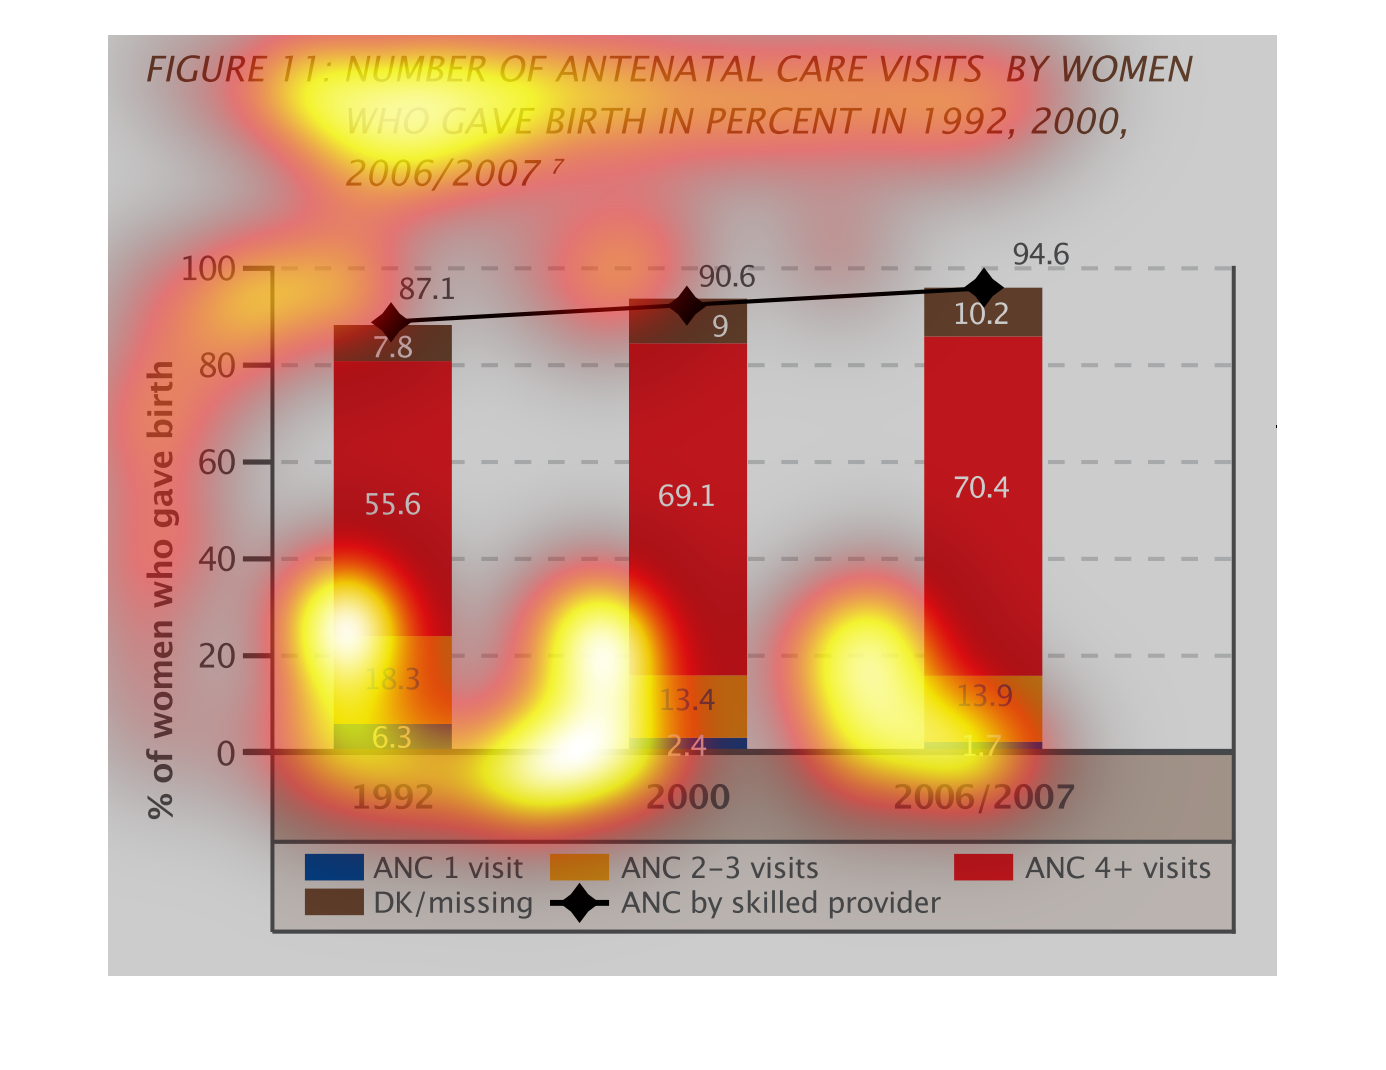
This graph displays data regarding the number antenatal care visits by women who gave birth
in the years: 1992, 2000, 2006, and 2007. The data is displayed as percentages.
The percentage of clinic visits by pregnant women after giving birth has gone up between 1992
and 2007. It has gotten closer to 1, from more like .8, on average.
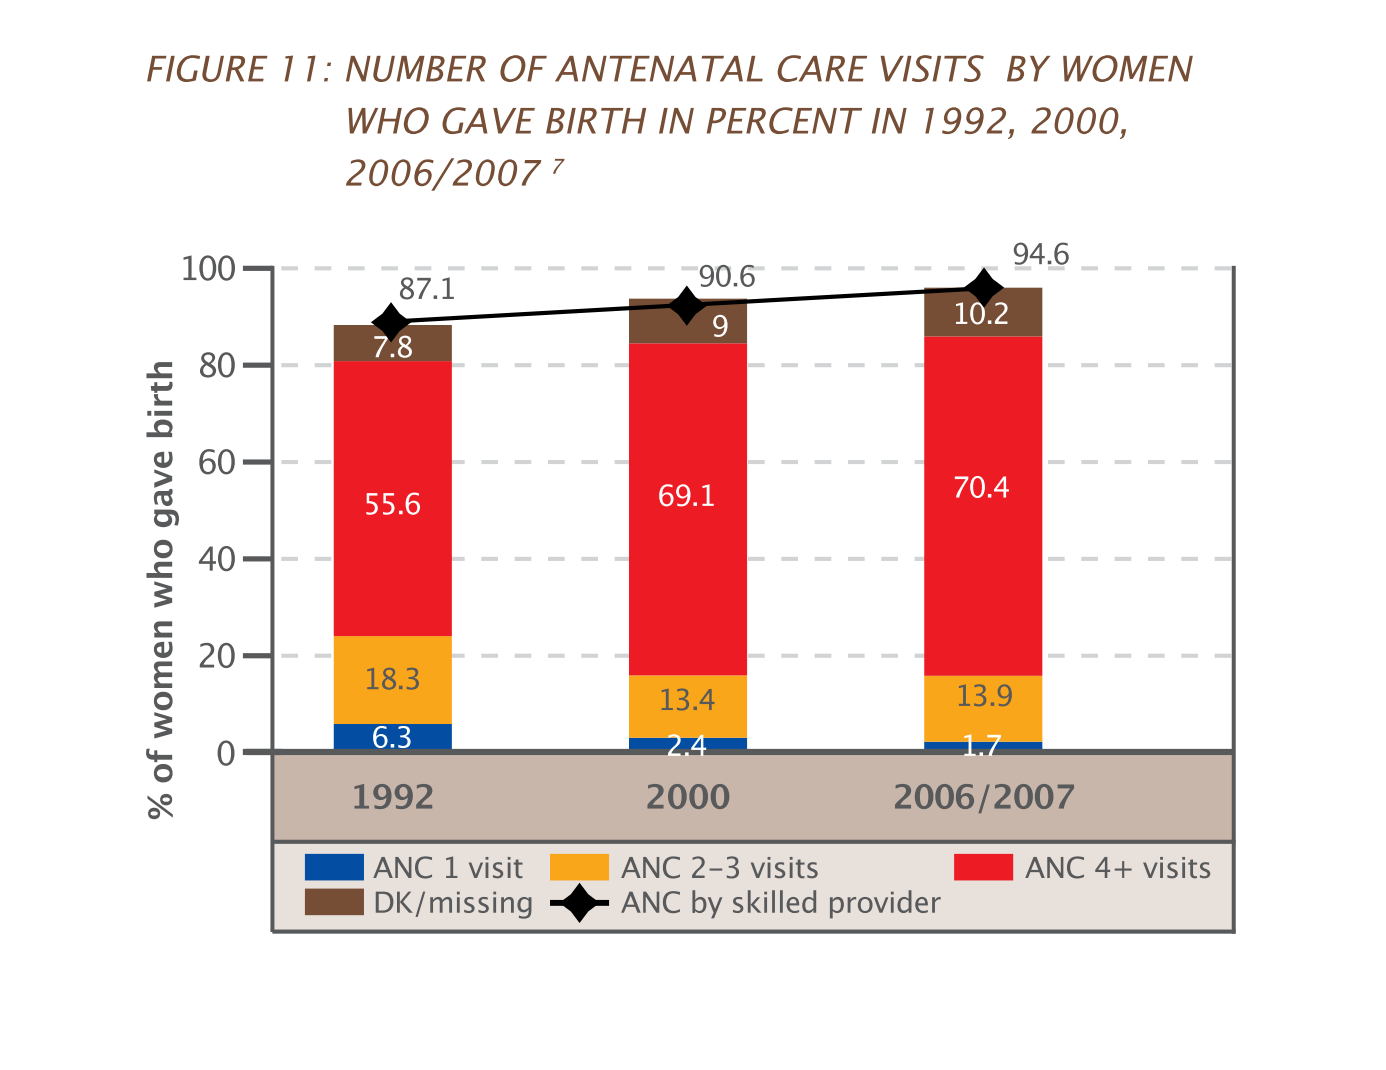
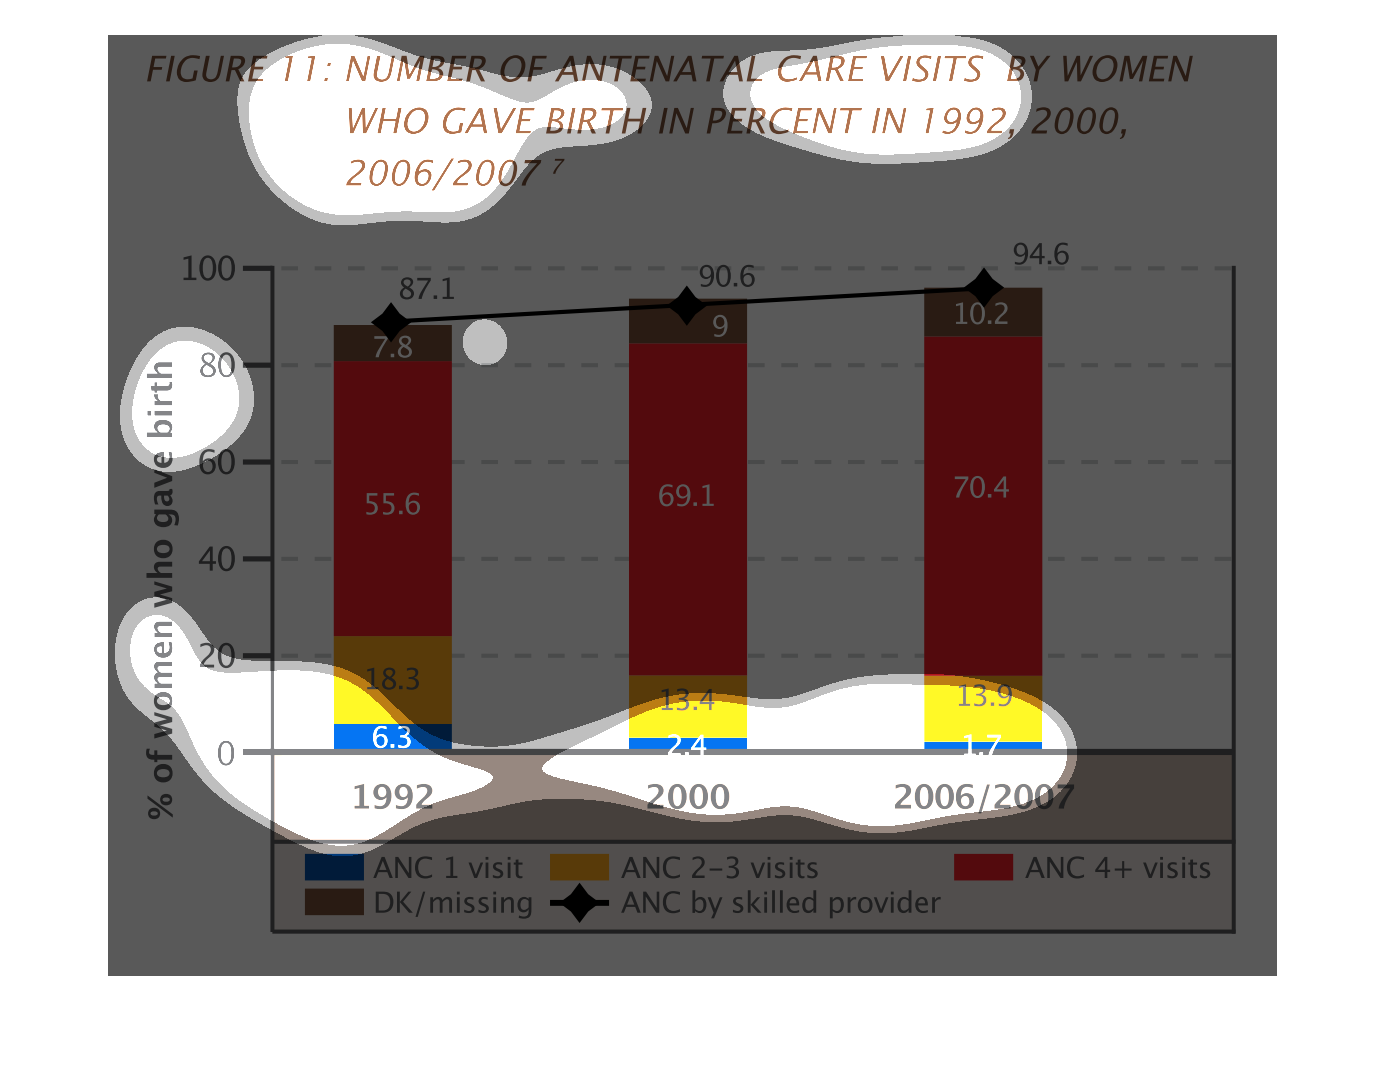
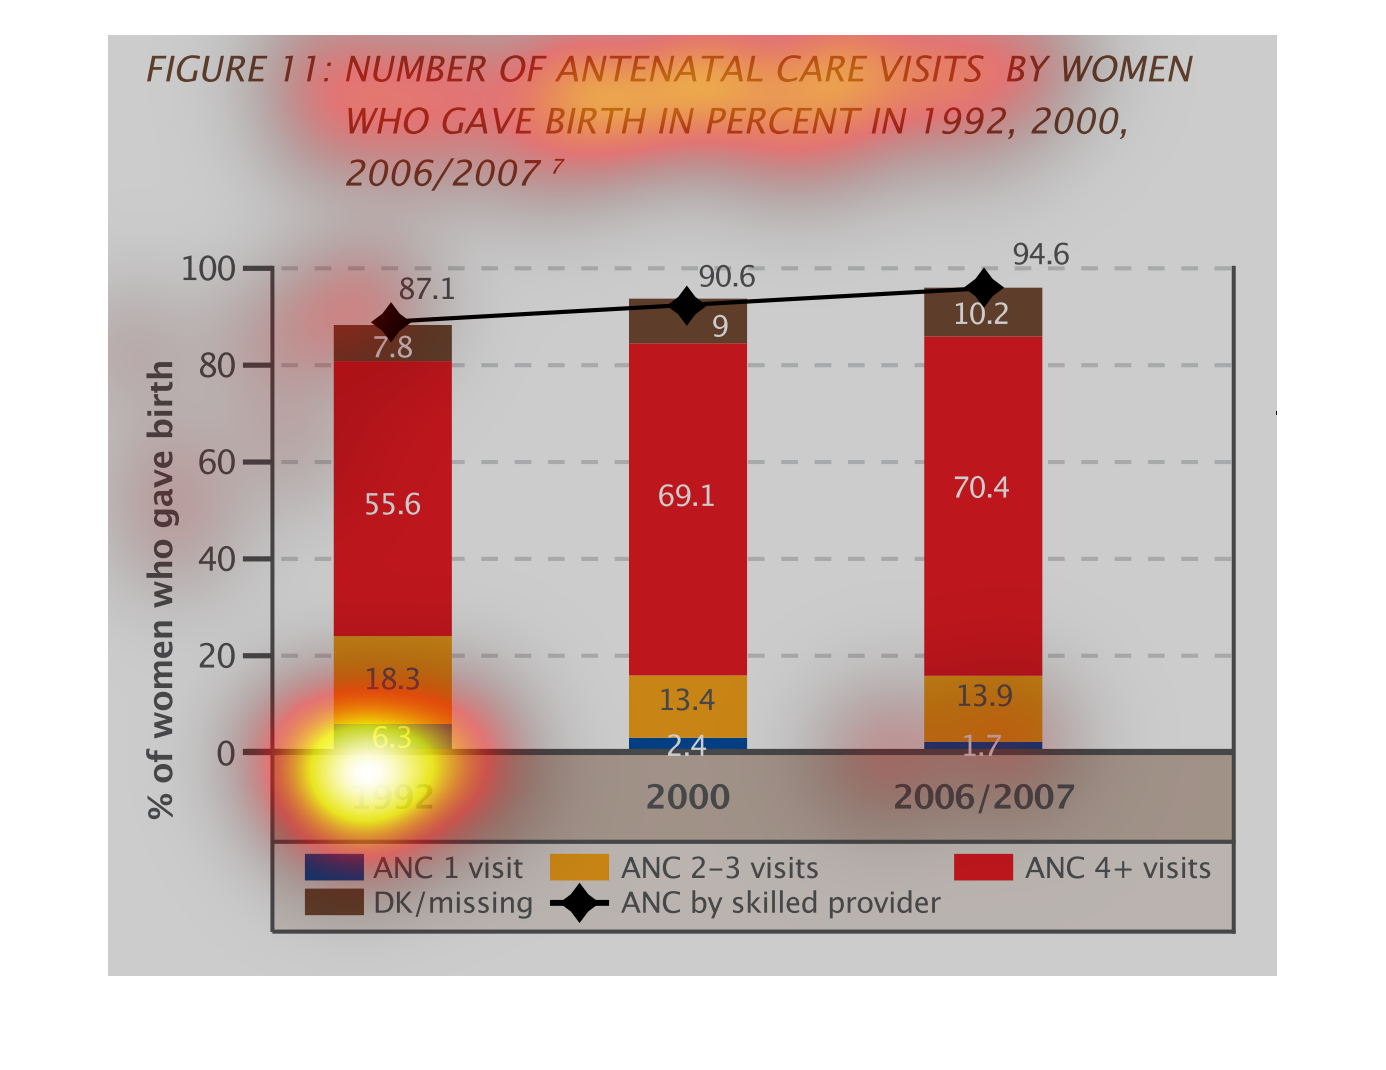
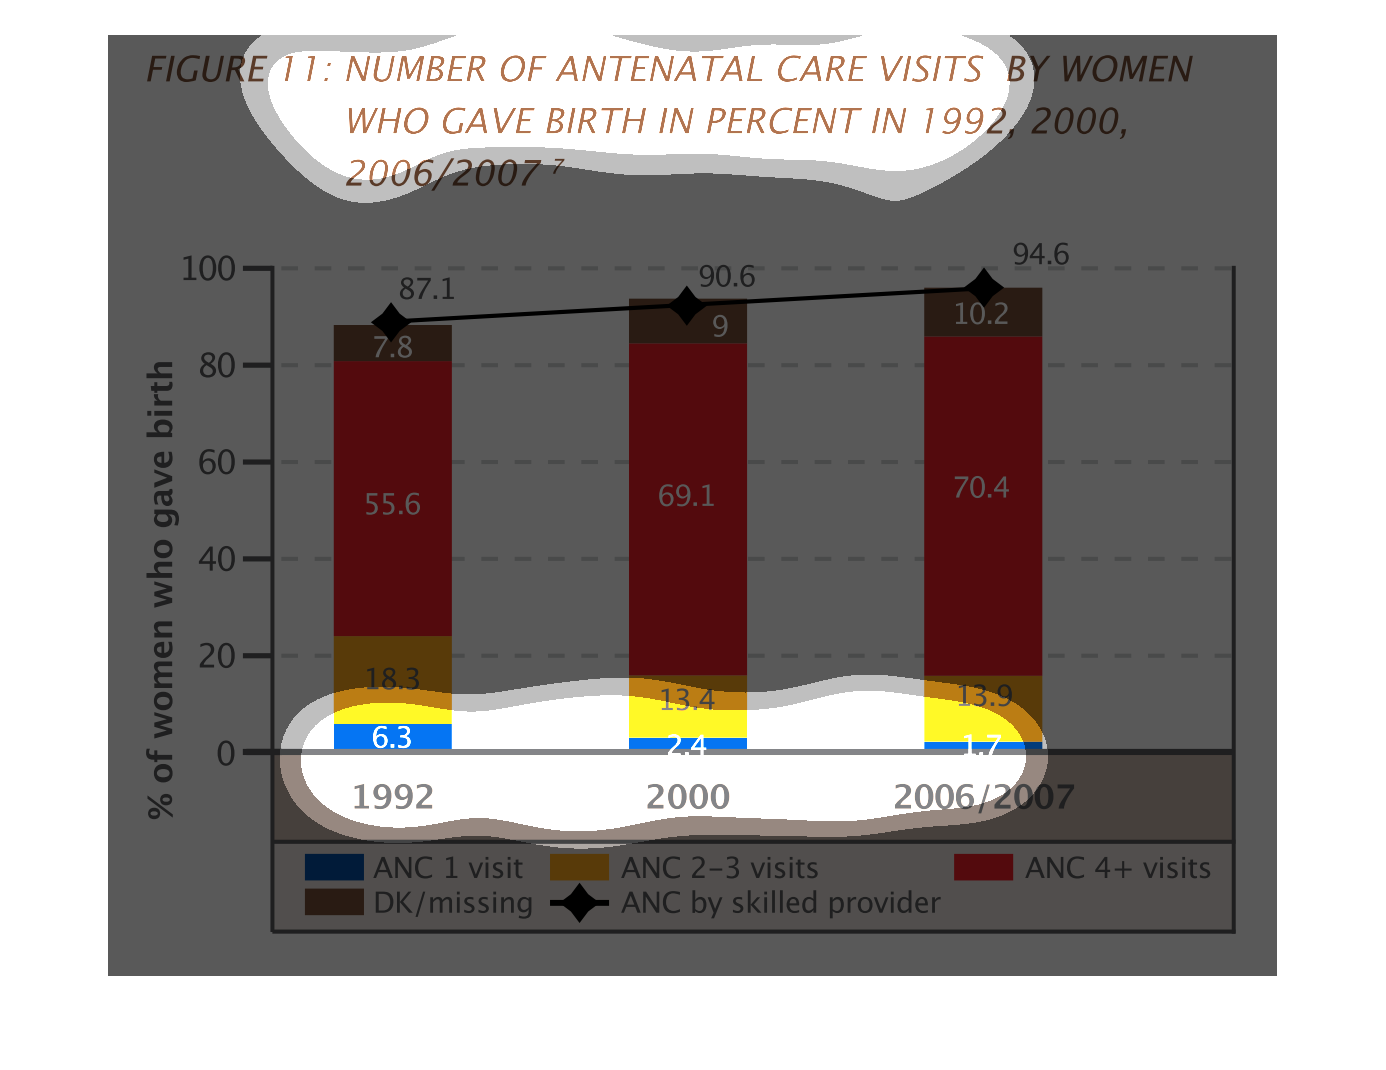
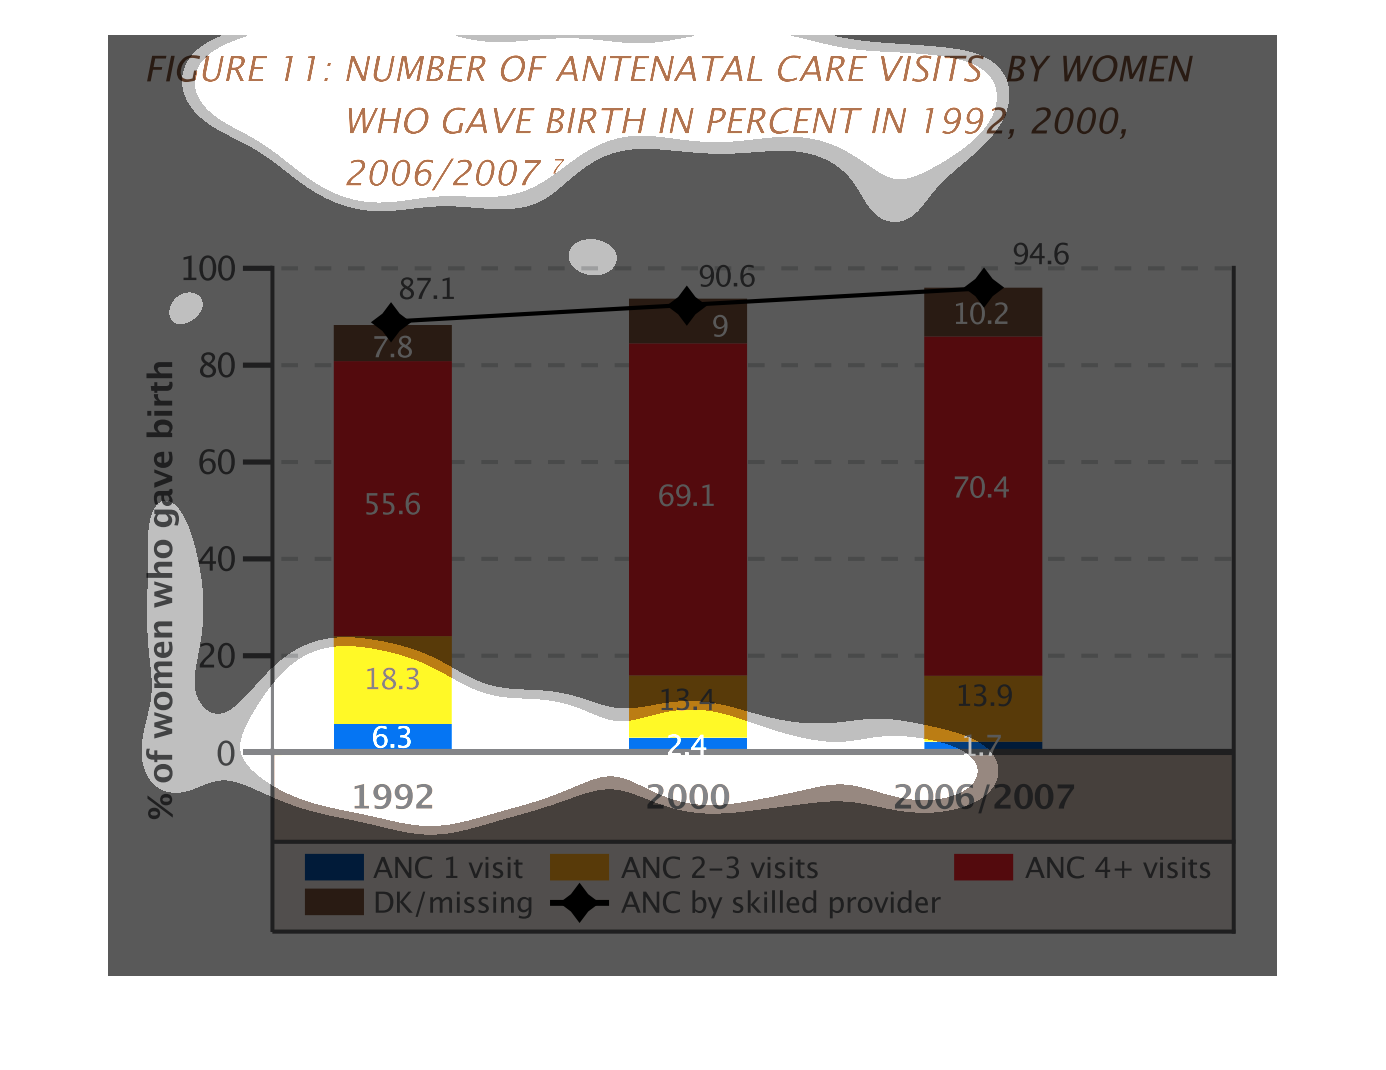
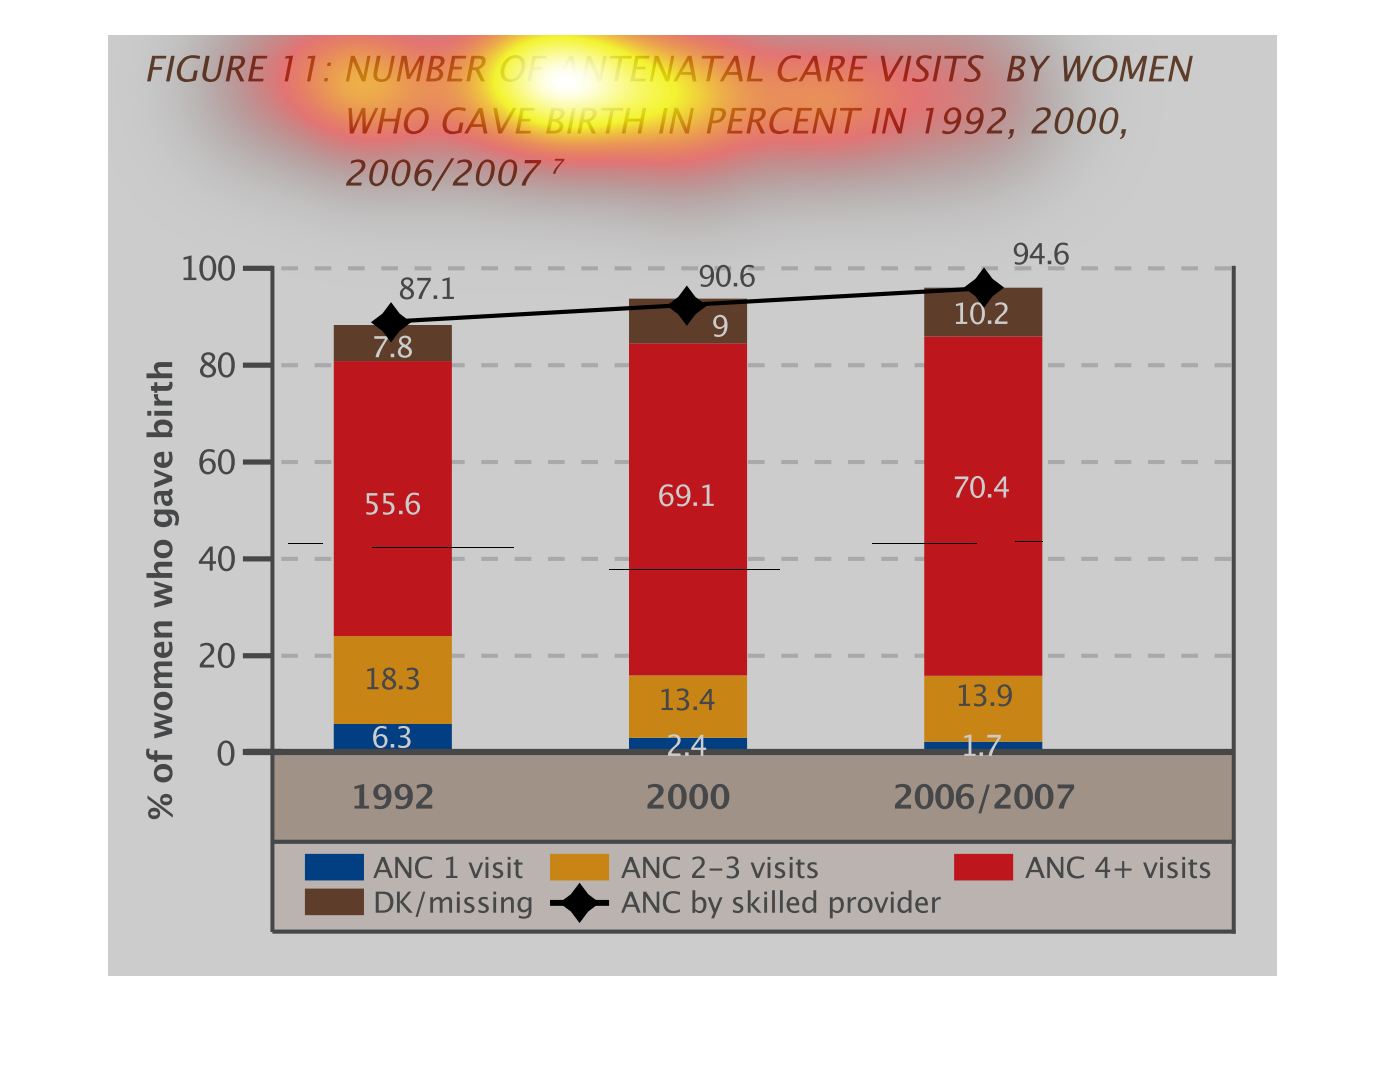
This chart shows the number of antenatel care visits by women who gave birth by percent in
1992, 2000, 2006/2007.  It shows that more woman are going in for multiple visits now, however
the amount of missing data has also gone up slightly.
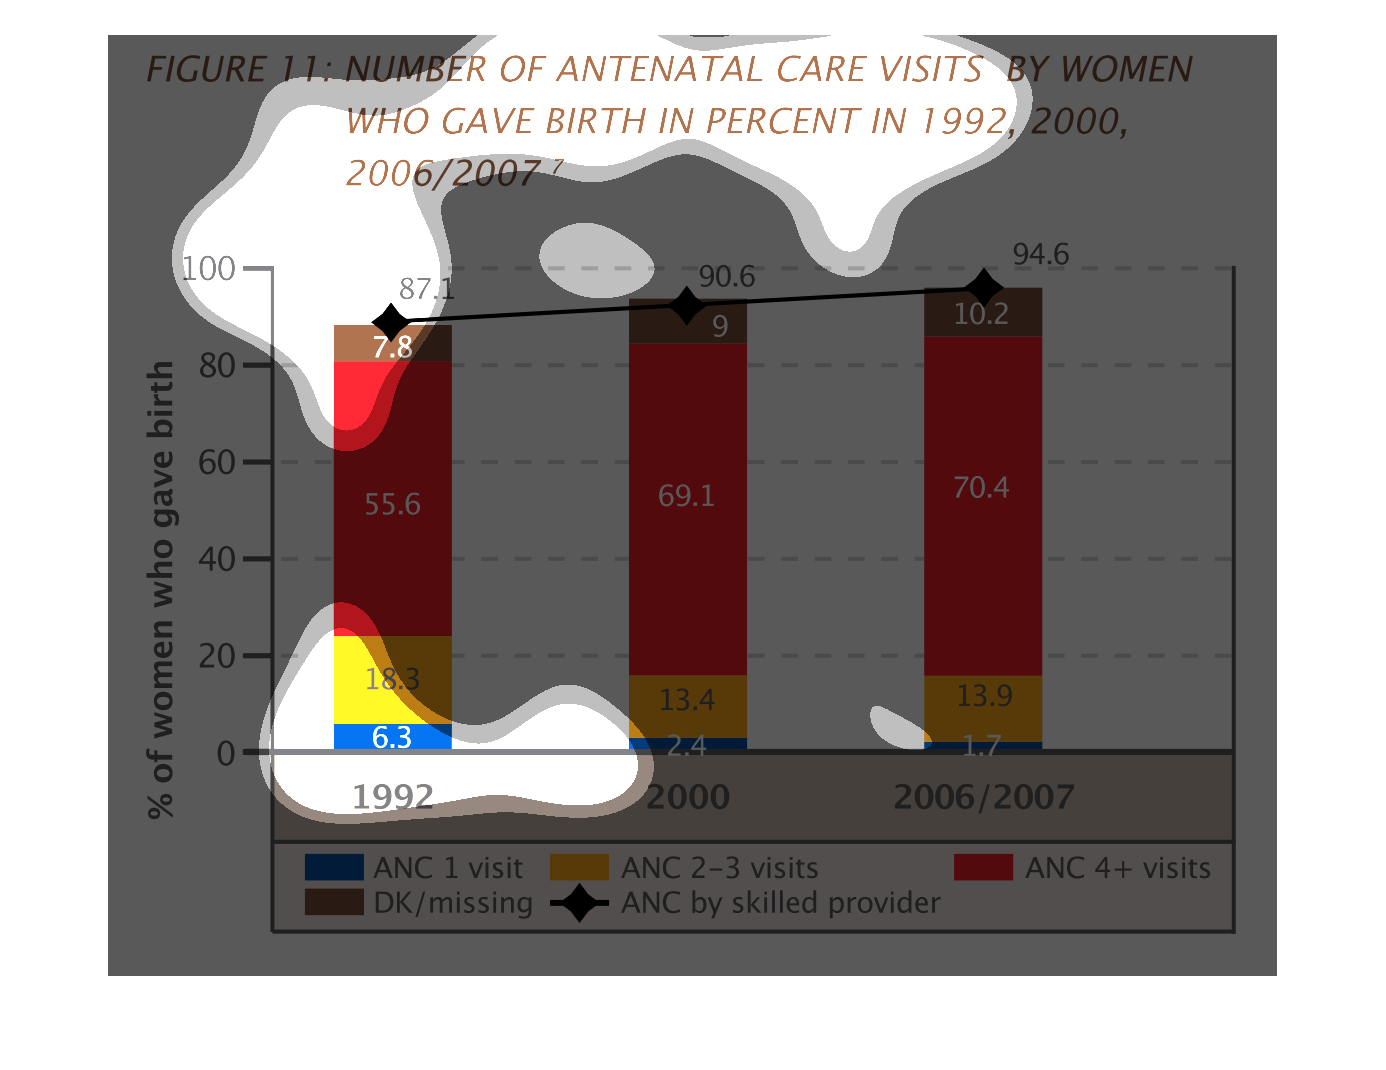
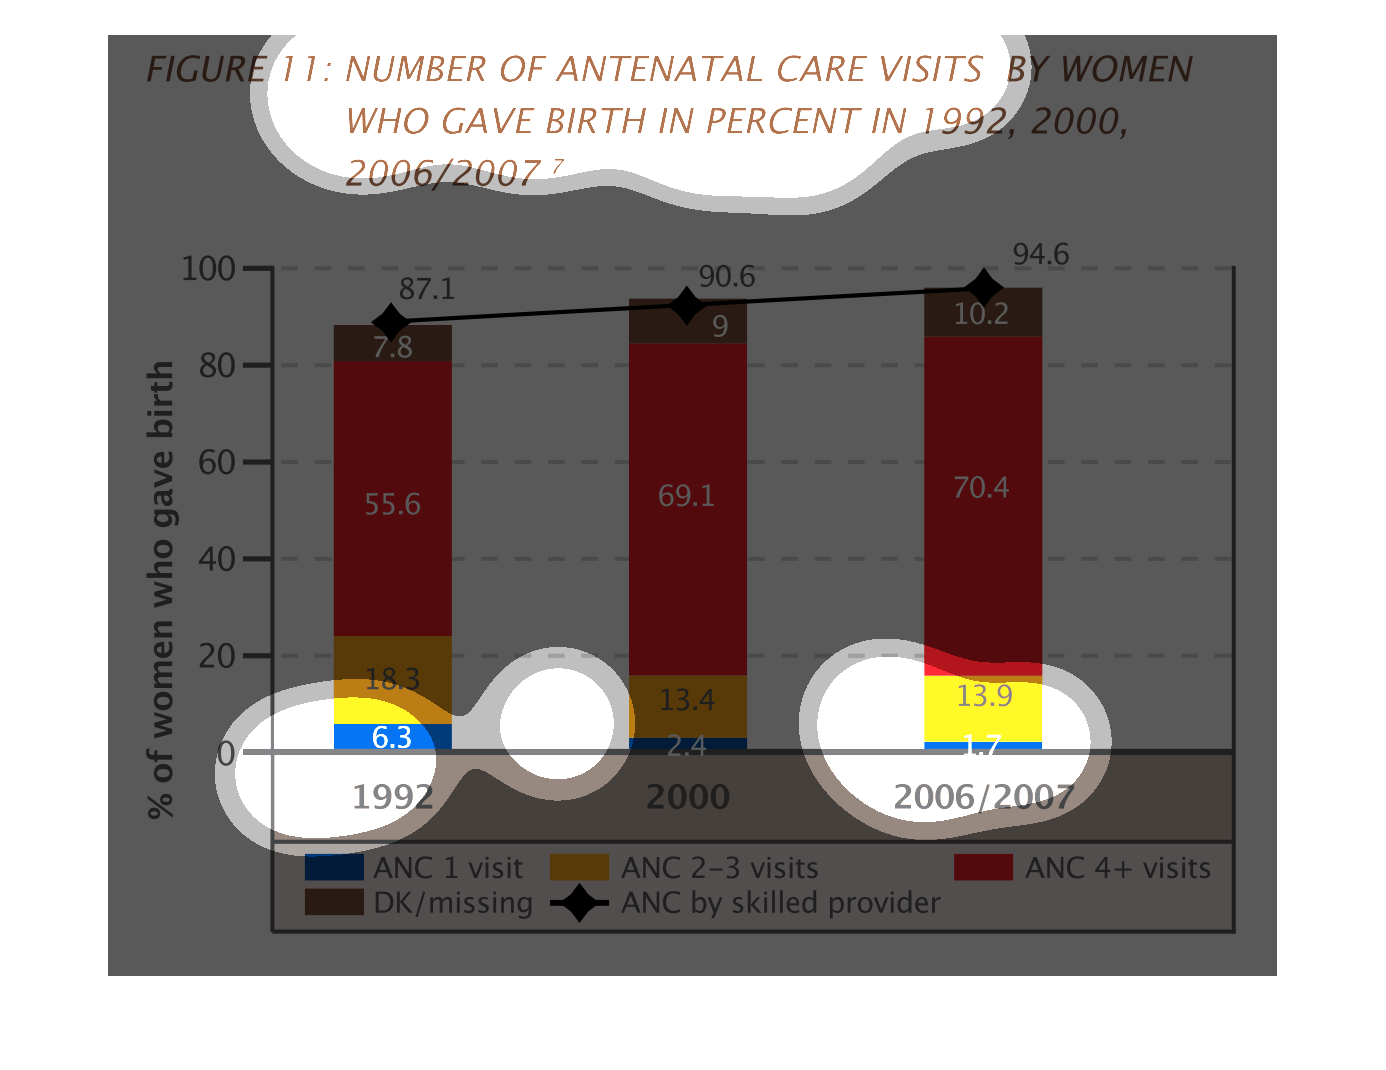
The bar graphs show number of alternative care visited by women who gave birth in percent
in 1992, 2000, 2006/2007. The blue bar represents ANC 1 visit, the brown bar is DK/missing,
 red is ANC 4 + visits
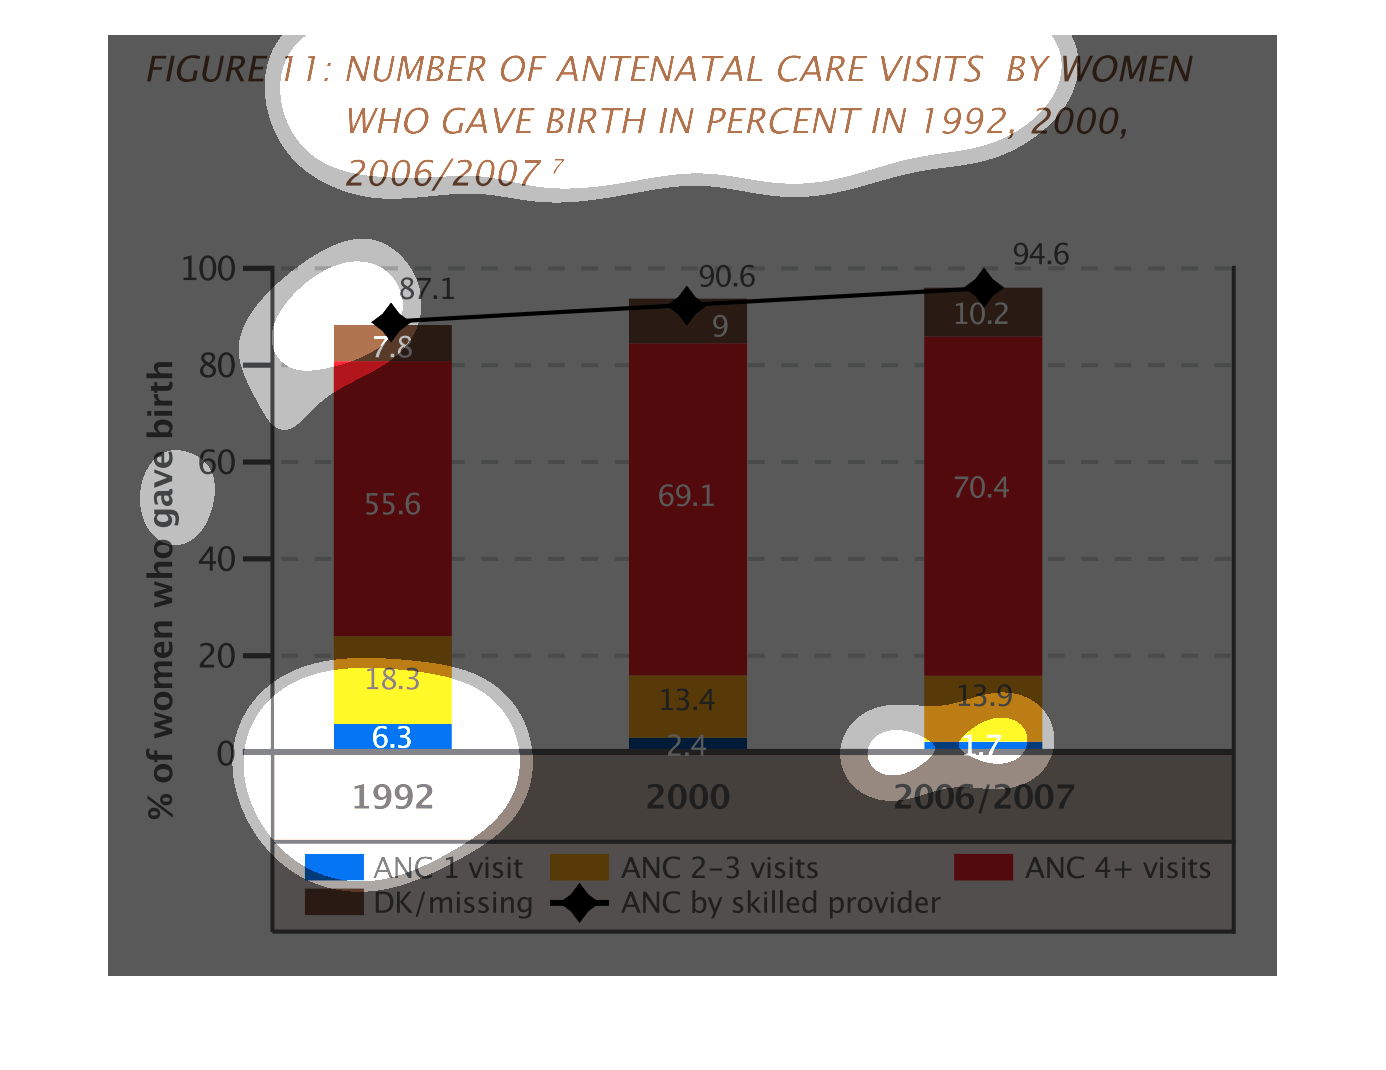
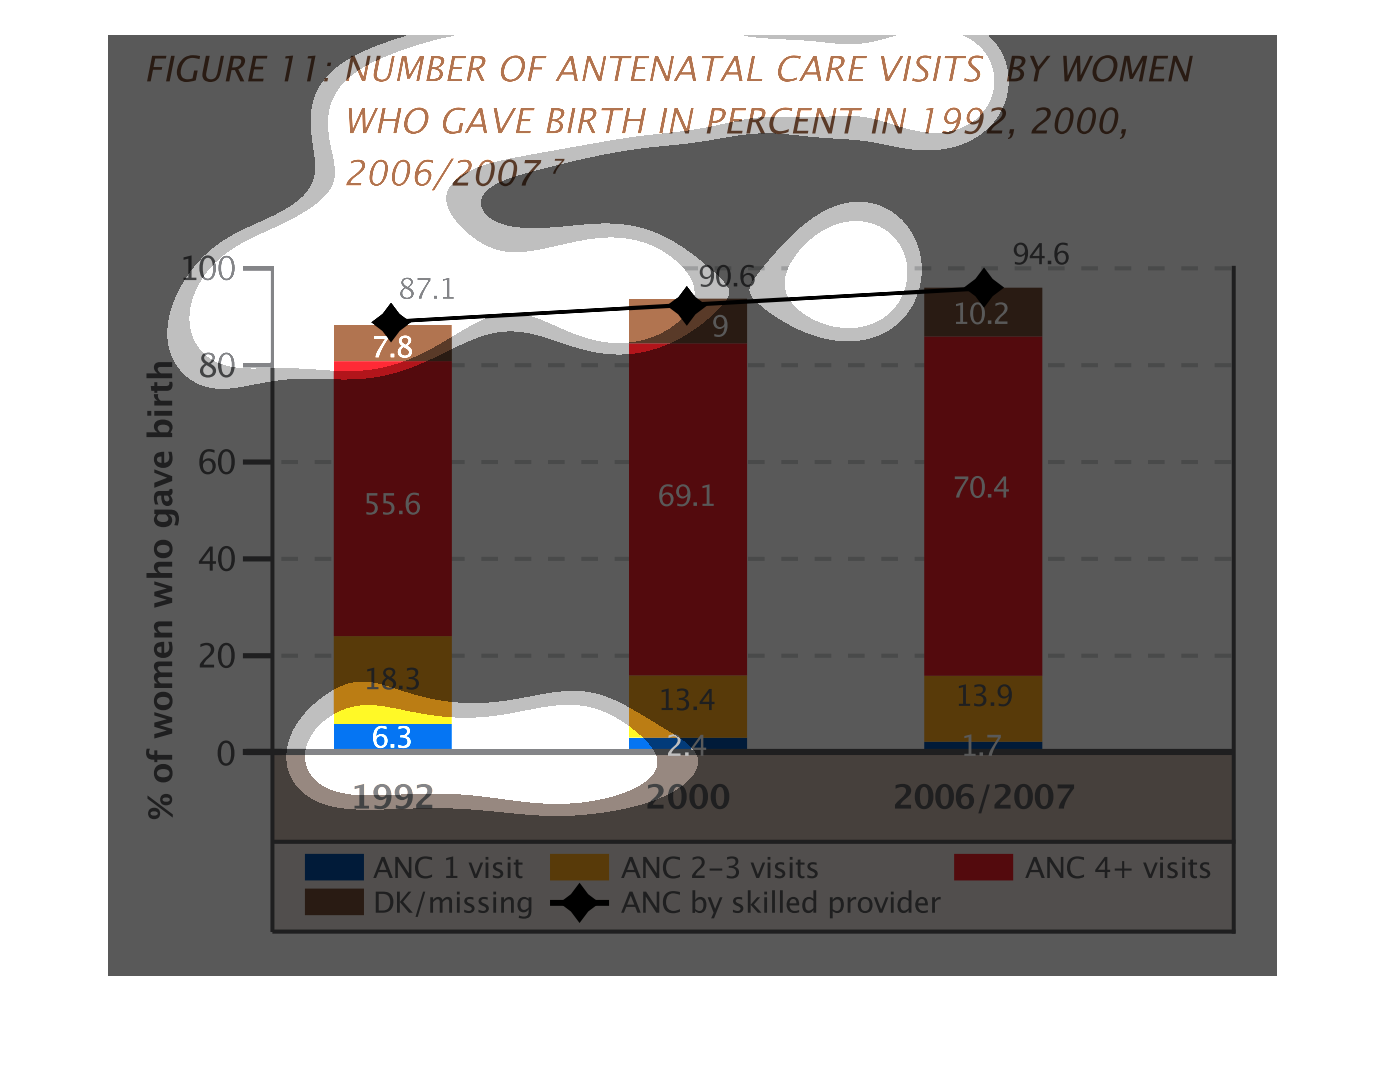
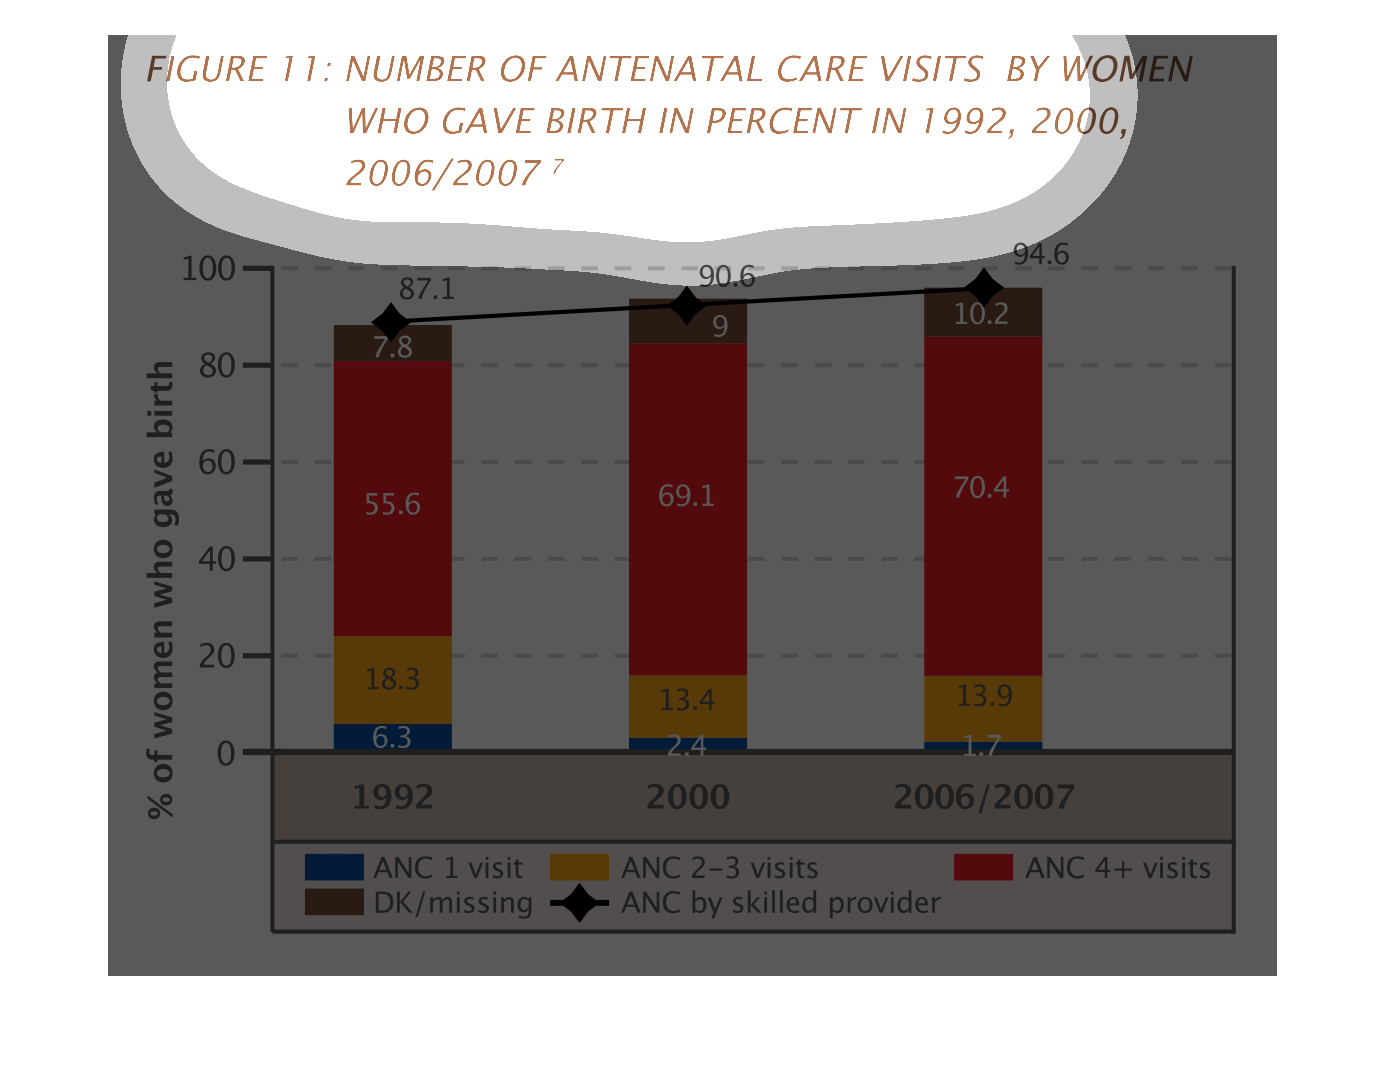
This chart is a graph showcasing the number of antenatal doctor visits women typically had
after giving birth in the years 1992, 2000, and 2006/2007.  The chart classifies women based
on the number of visits they managed that year, from the low number of only one visit to more
than four visits that year.
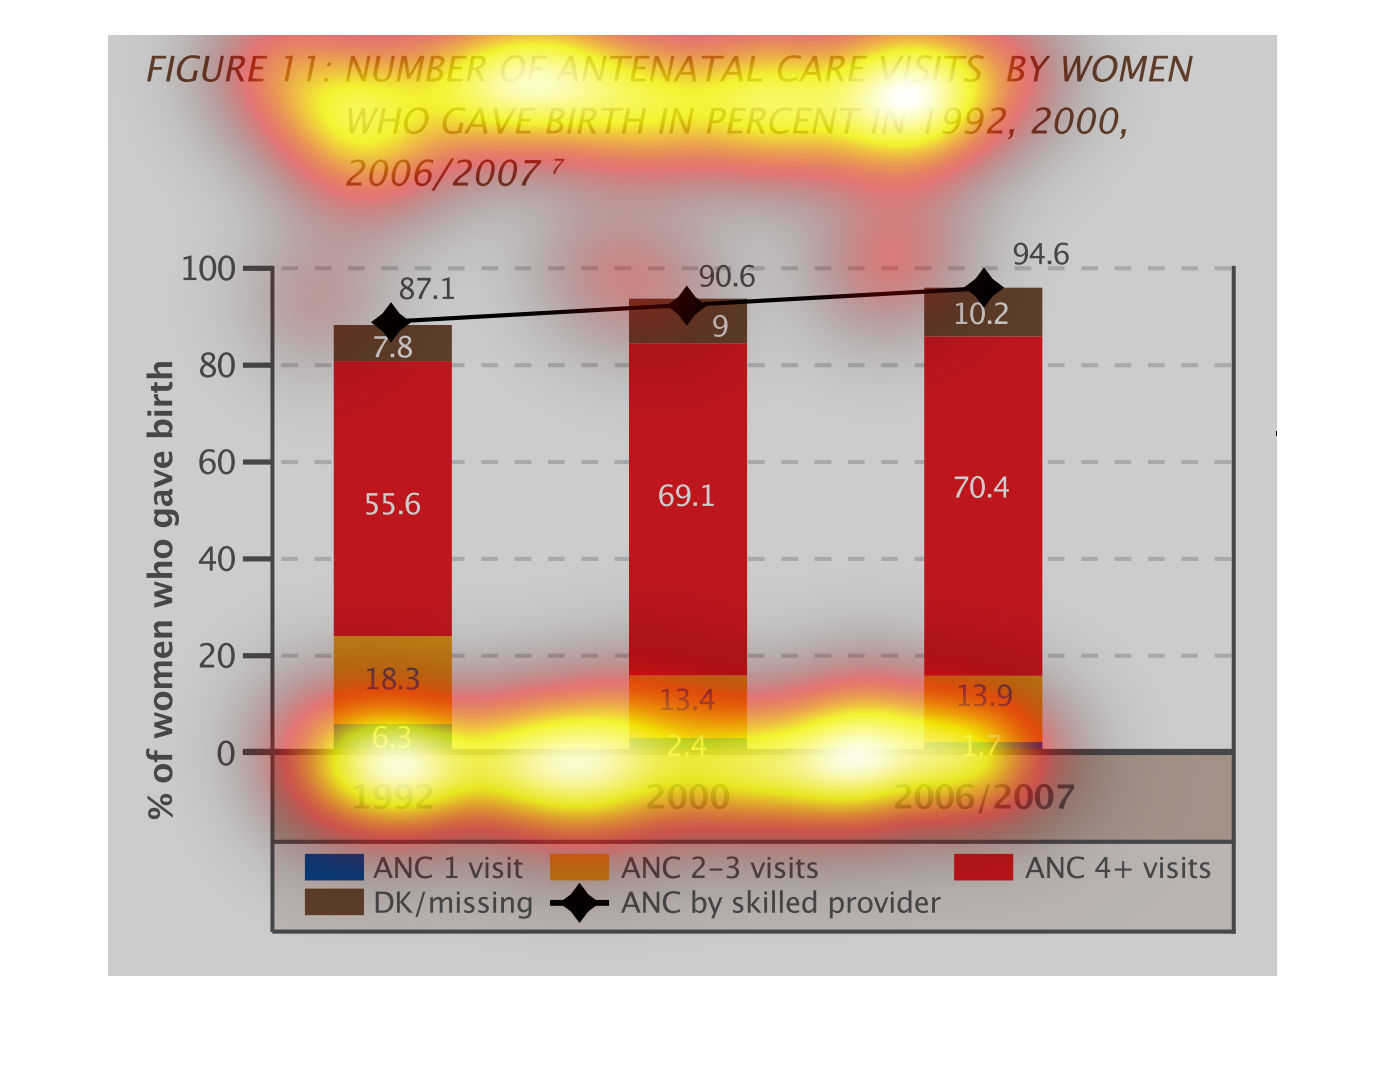
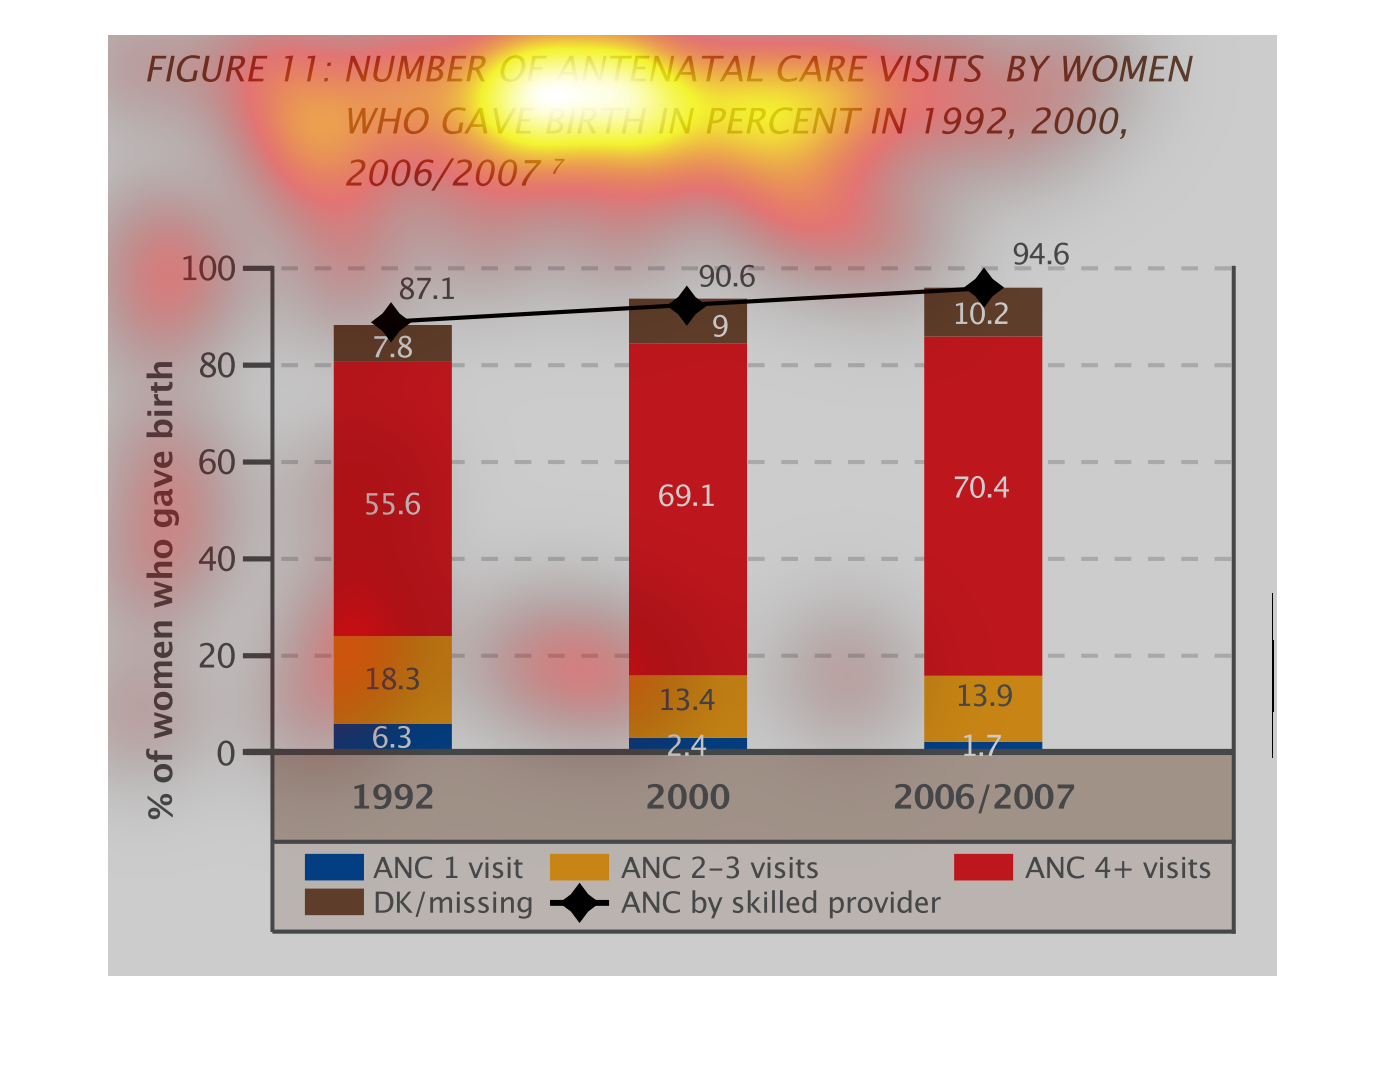
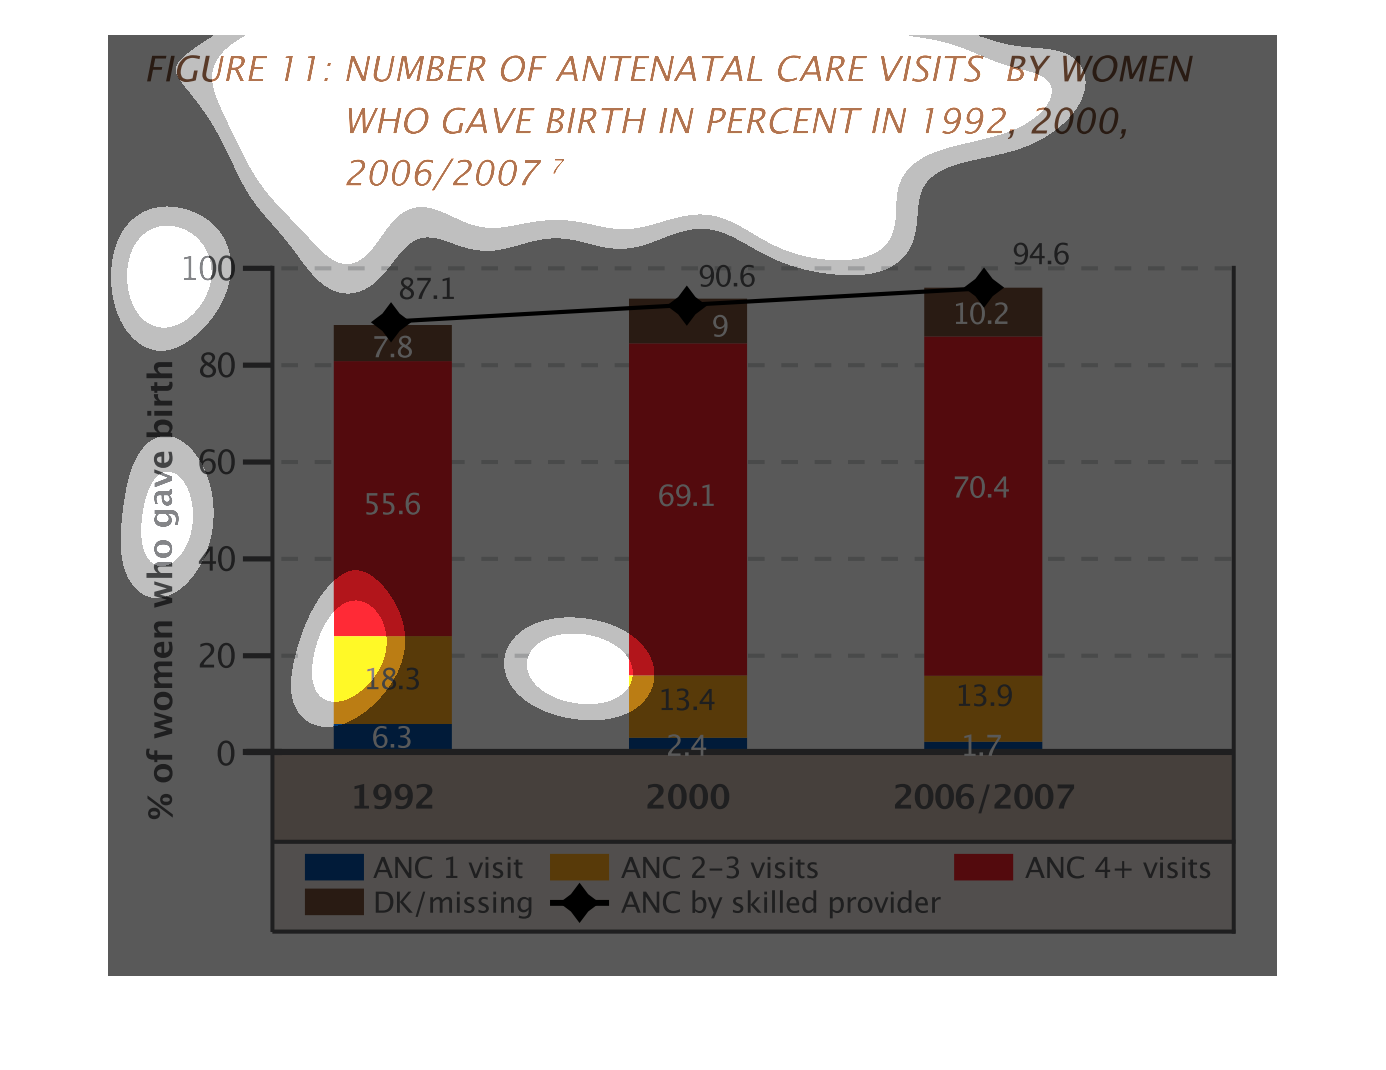
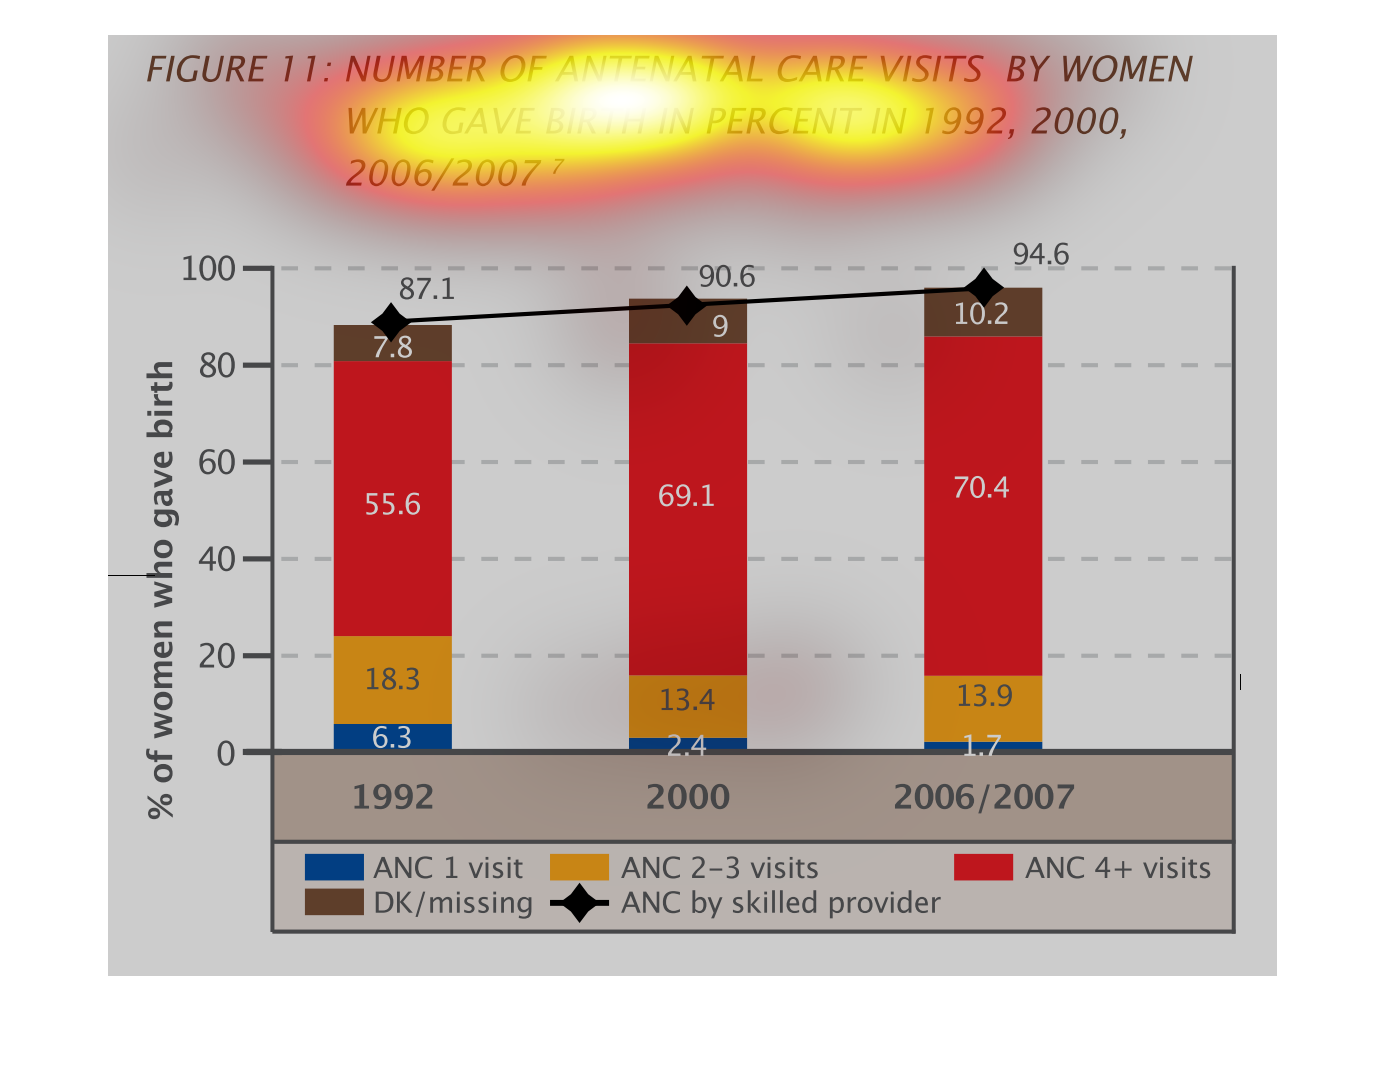
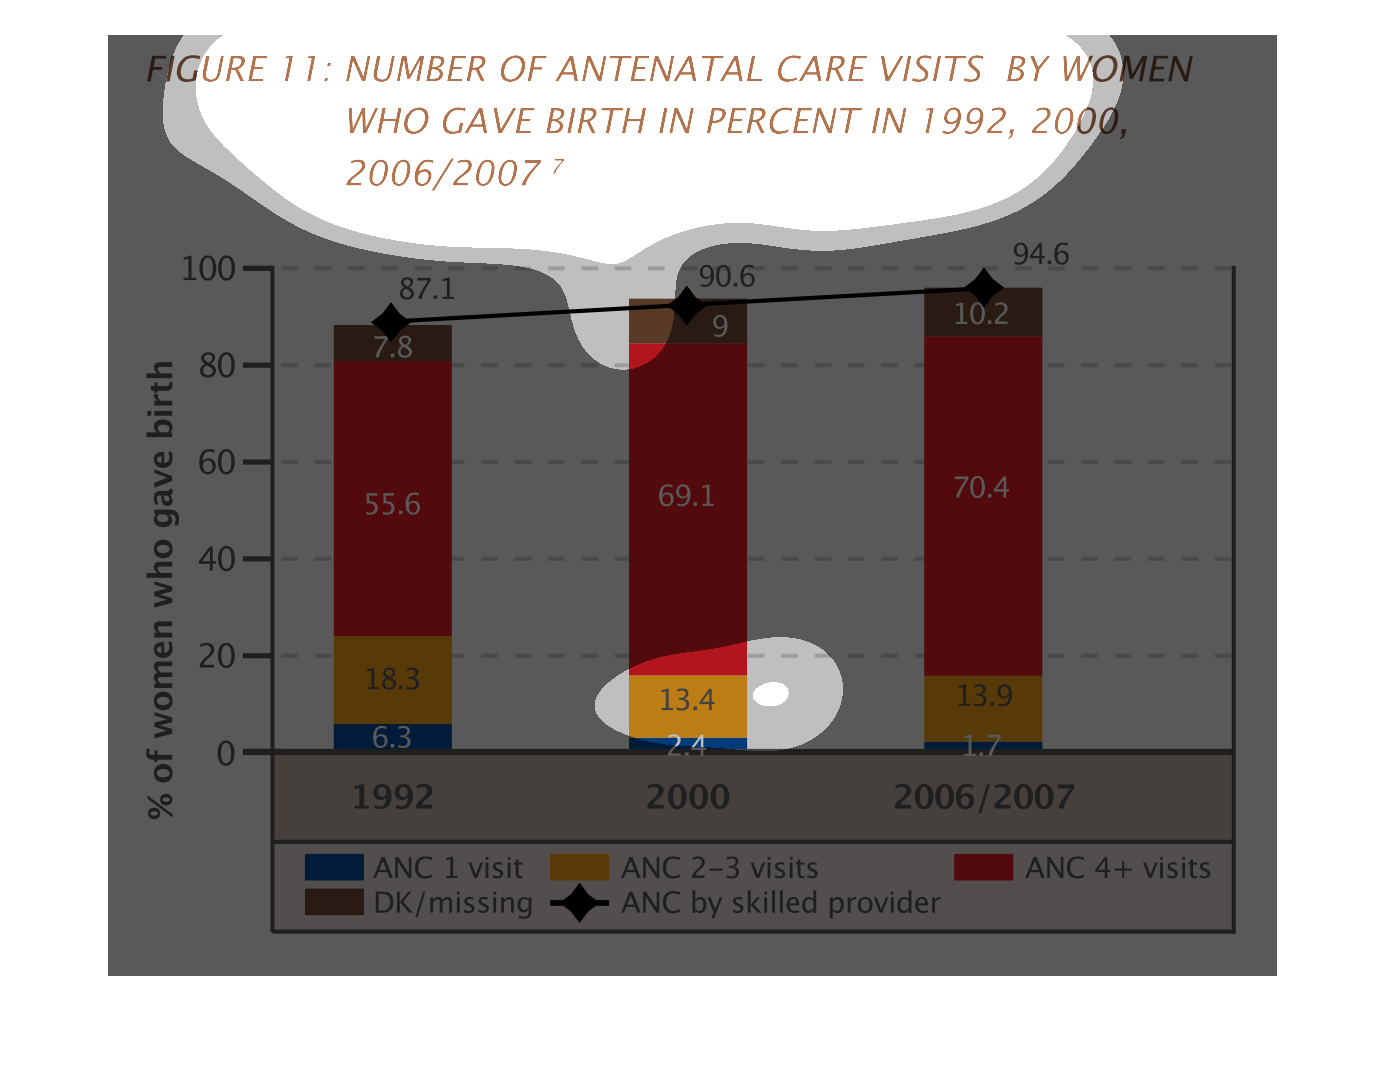
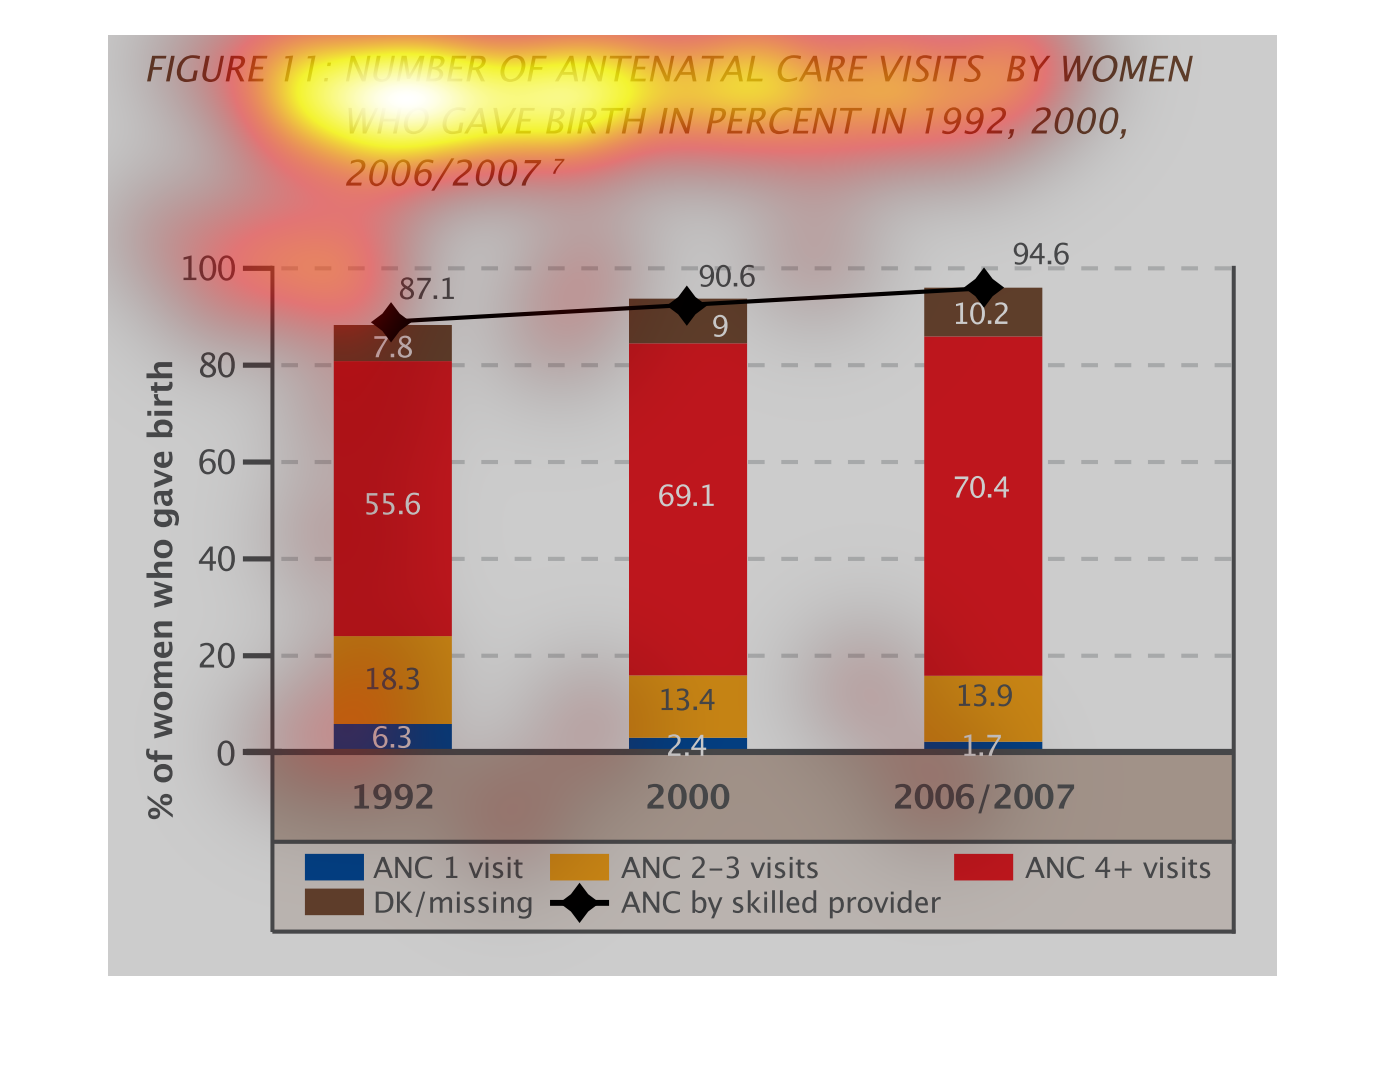
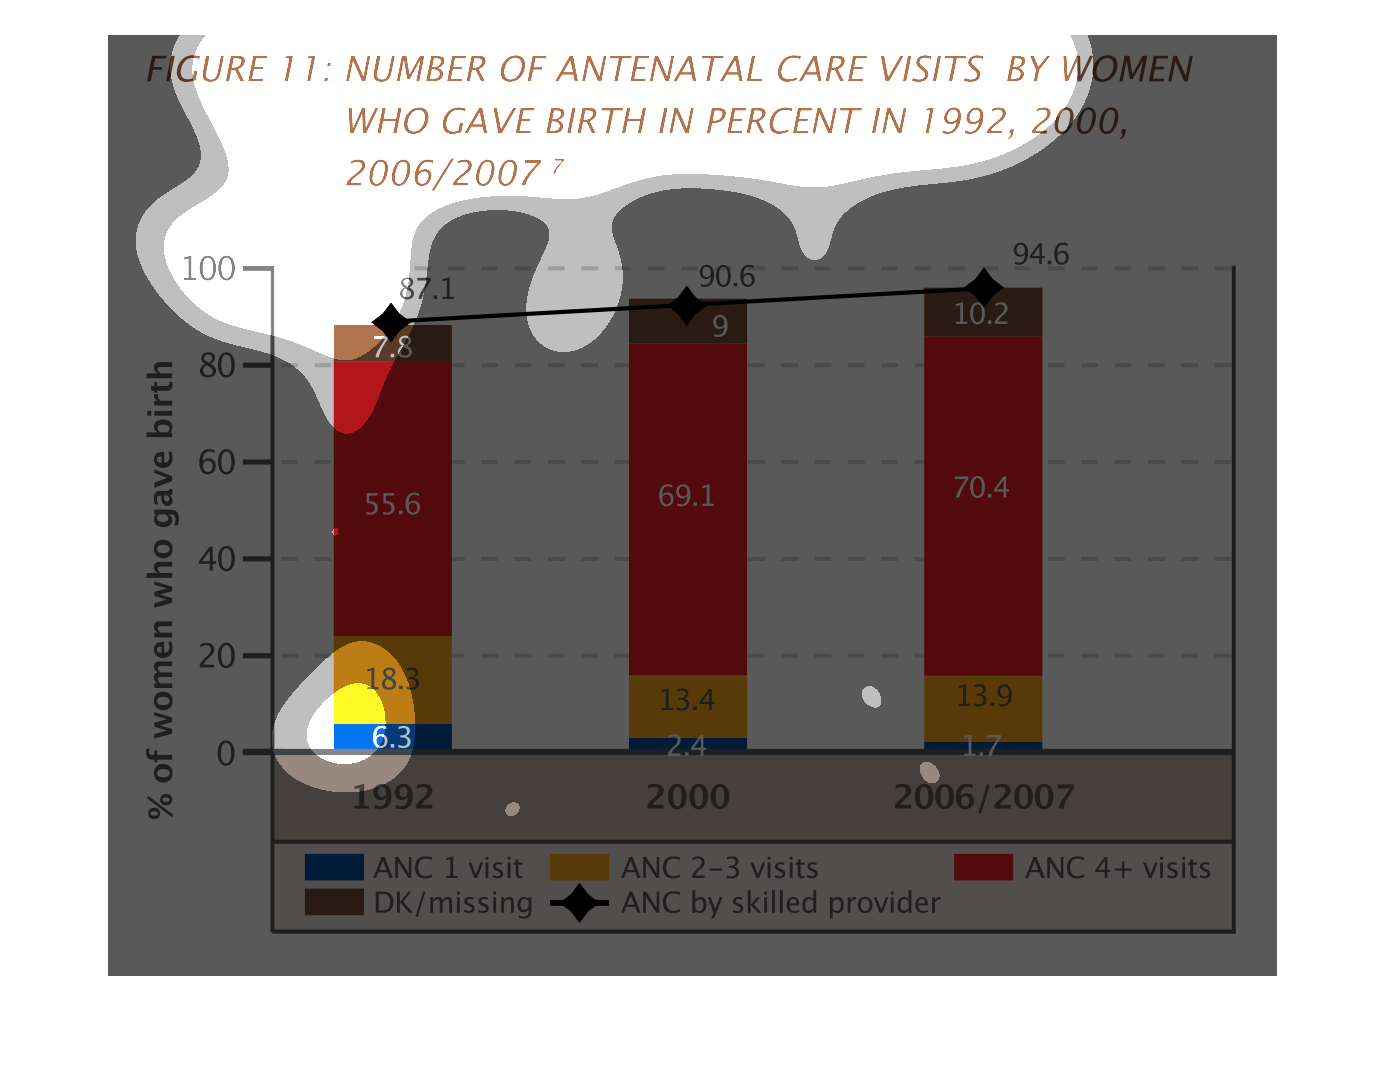
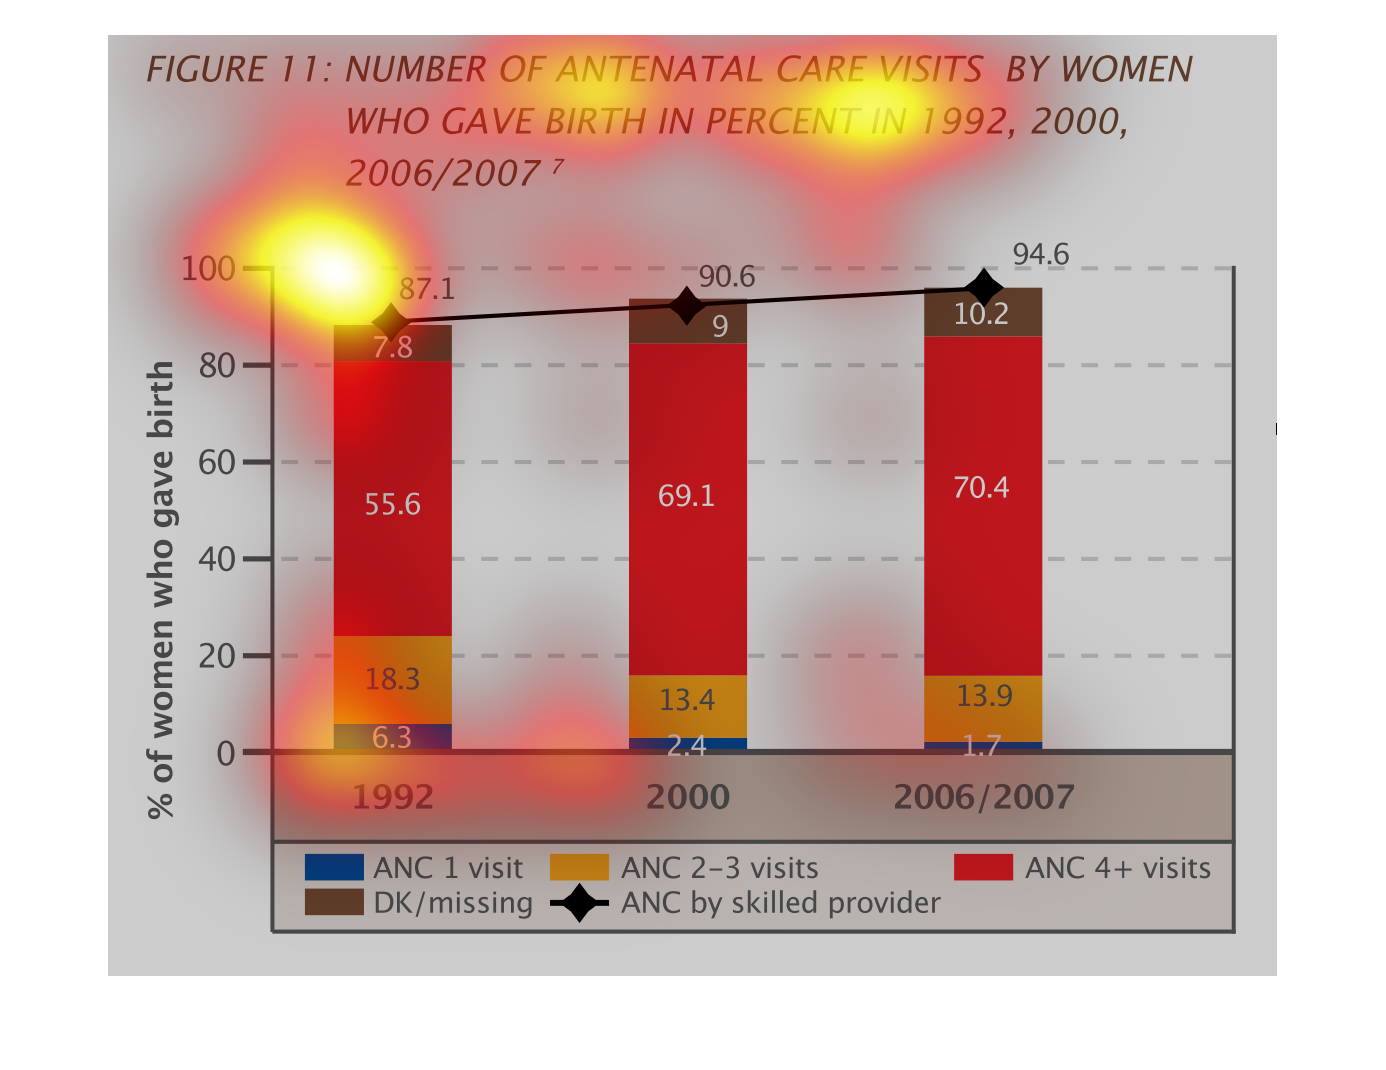
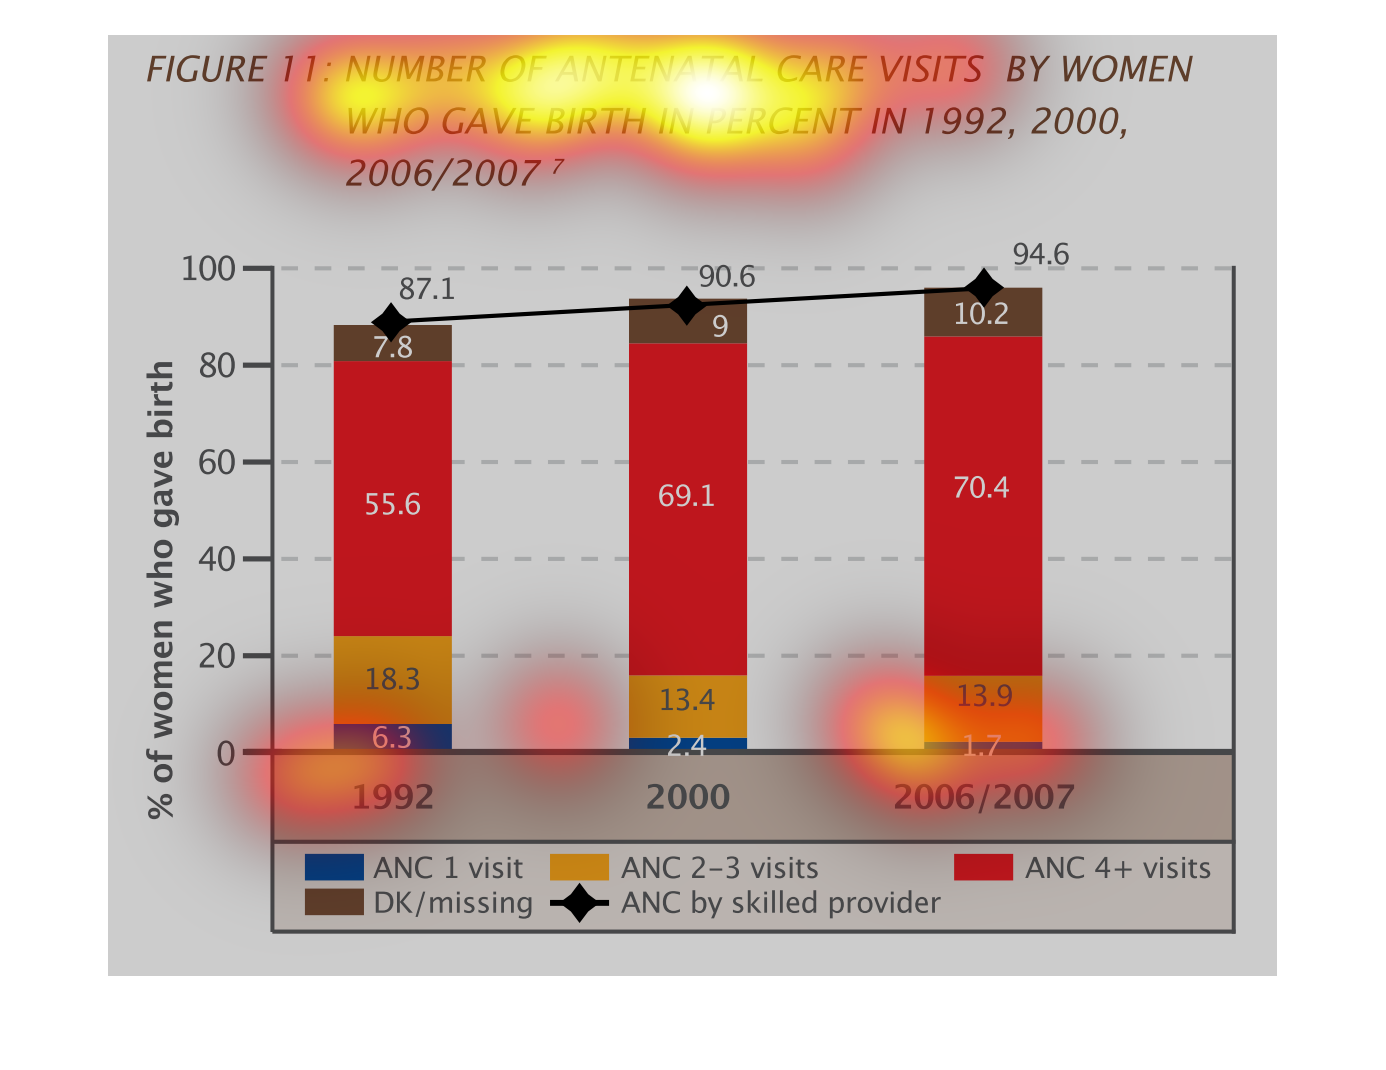
This is a graph showing number of antenatal care visits by women who gave birth in percent
in 1992, 2000, 2006 and 2007. In 1992 7.8 percent of women gave birth, in 2000 9 percent of
women gave birth and in 2006/2007 10.2 percent gave birth. The graph also shows that with
each passing year the number of  ANC visits decreased then increased.
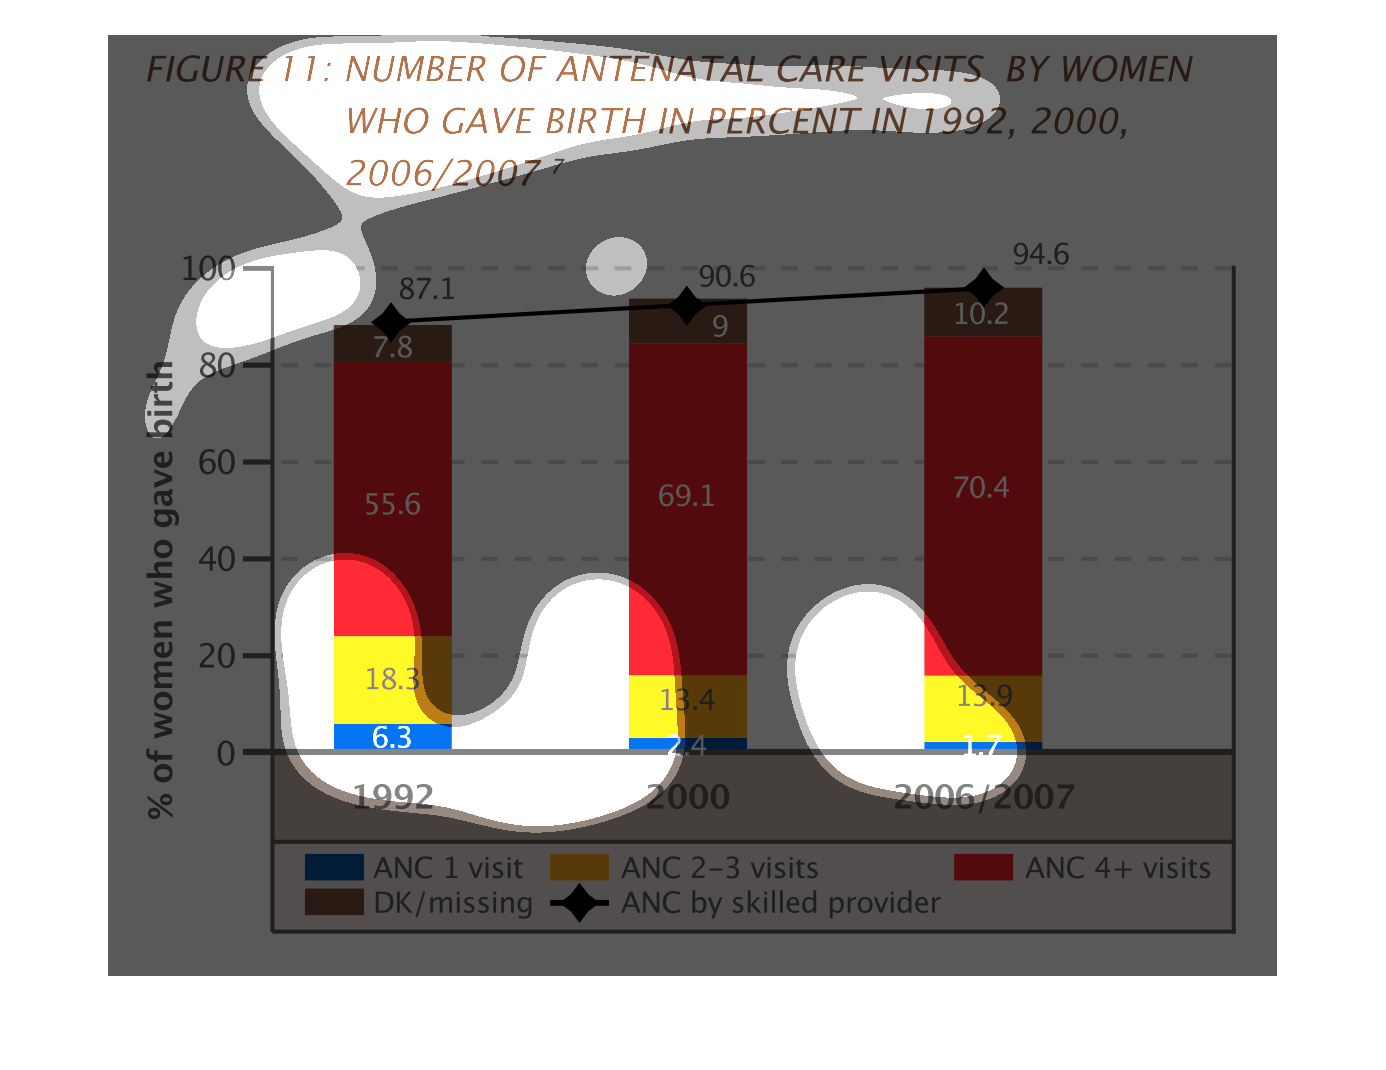
The number of antenatal (after birth) care visits completed by women who gave birth from 1992
to 2007, with values ranging from none to 4 plus visits total.
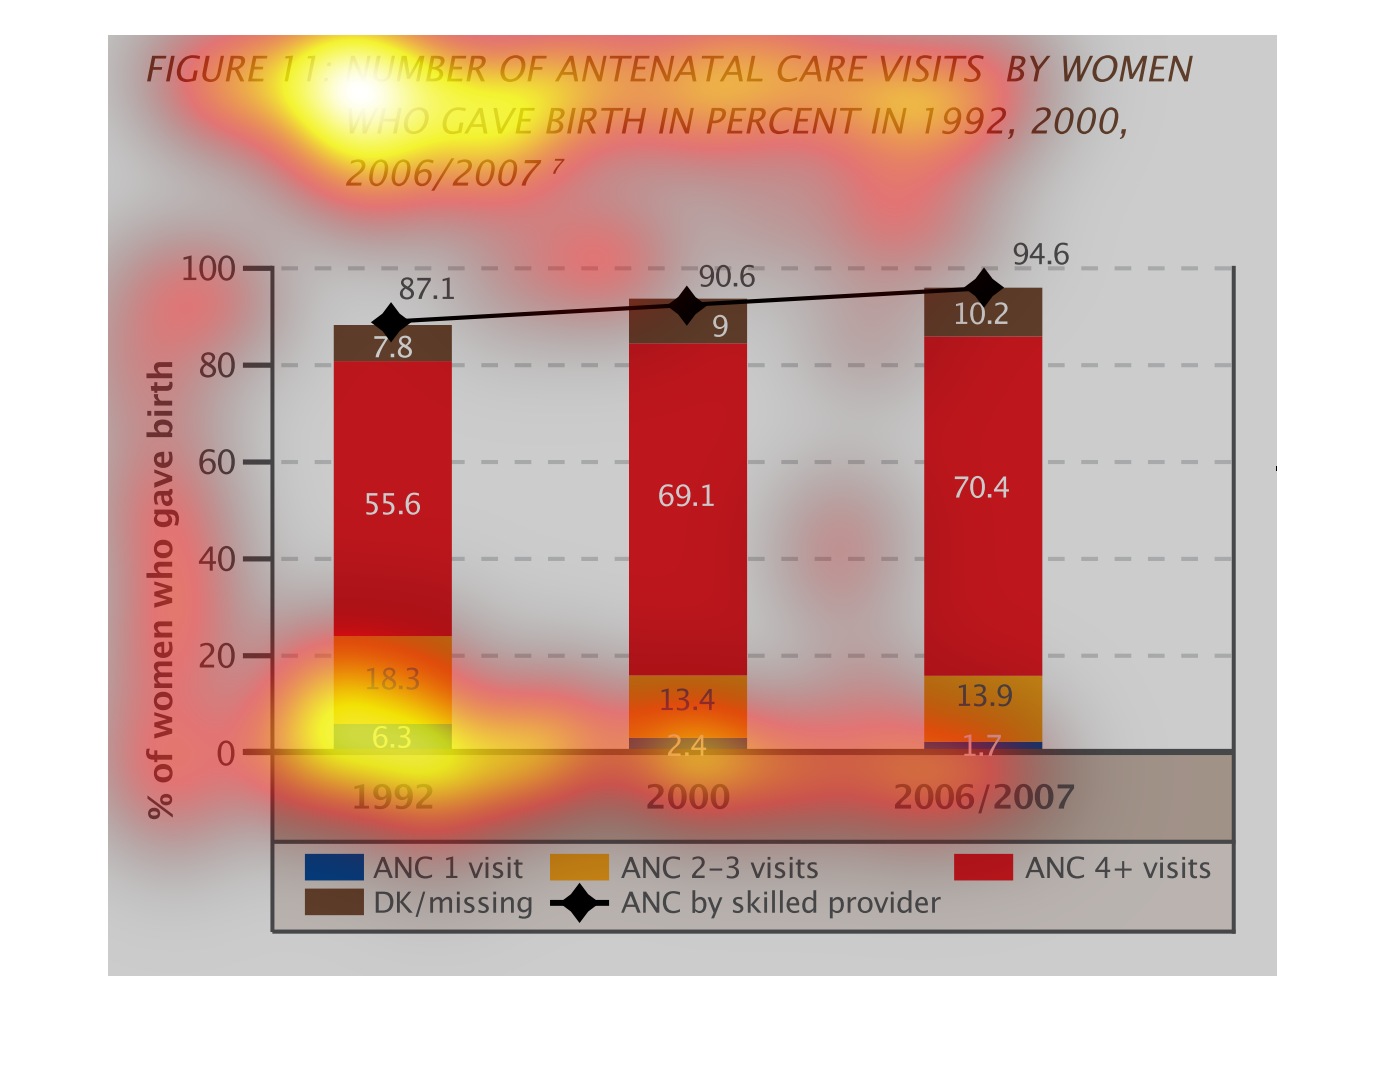
This graph shows the number of antenatal care visits to pregnant women, as a percentage of
population birth rate, in 1992, 2000 and 2006/2007. Total visits rose from 87.1% to 94.6%
over that time period. Exceptional care, defined by 4 or more visits, had a more modest rise.
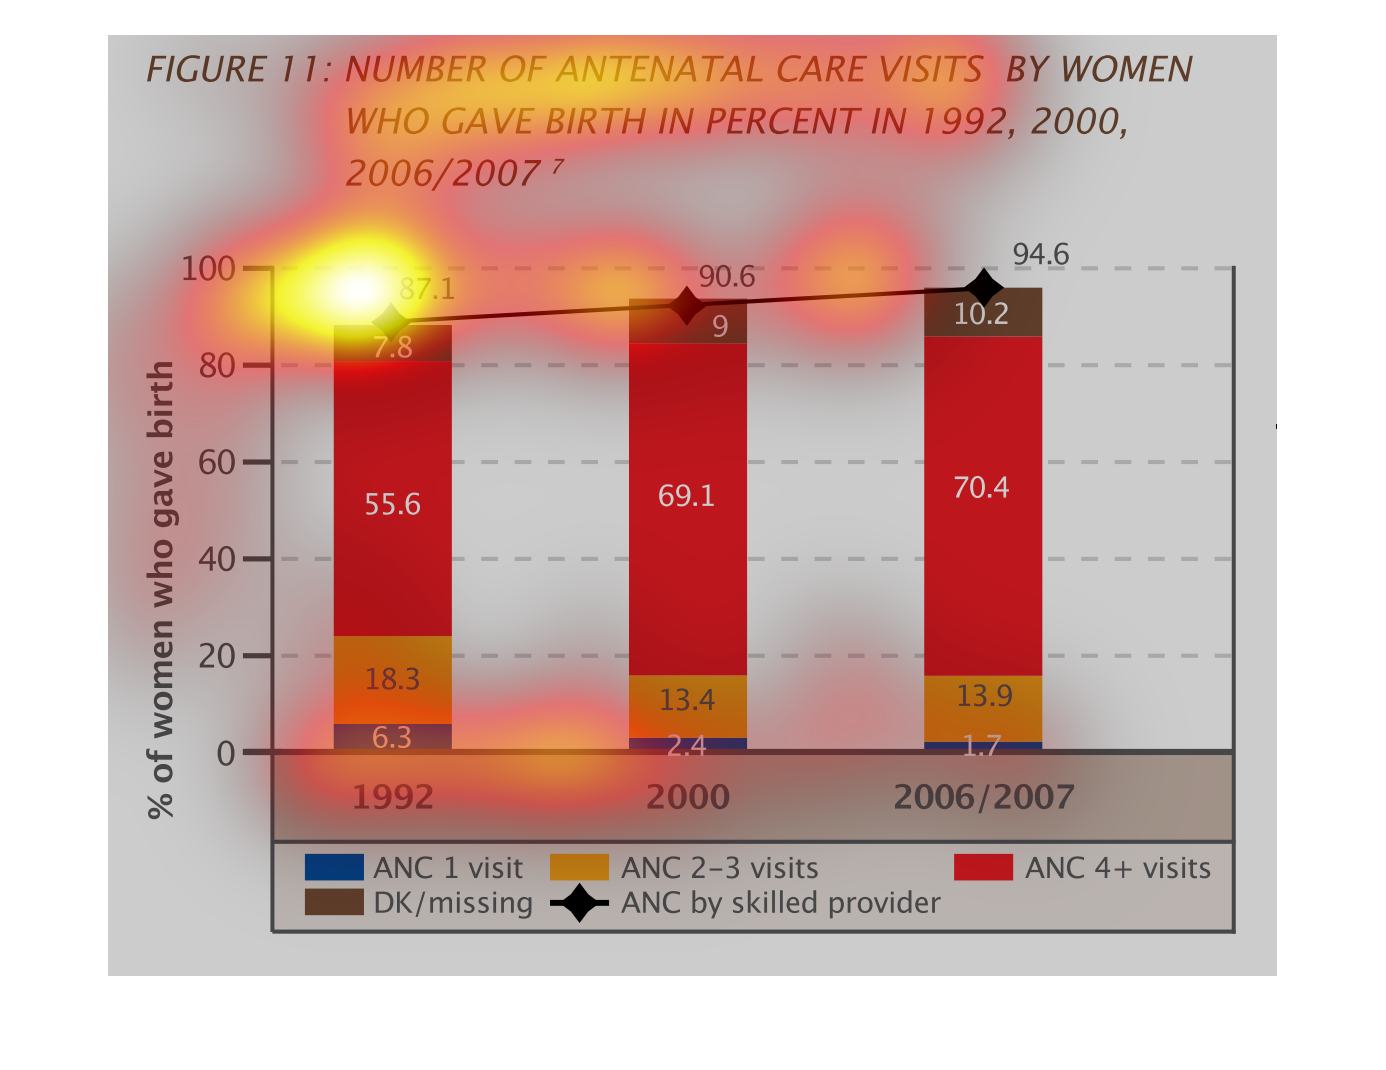
This graph illustrates the number of antenatal care visits by women who gave birth by percent
in 1992, 2000, and 2006/2007.  The largest percentage is ANC+4 visits.
The following charts gives the number of women who sought Antenatal care visits by women who
gave birth in percentage. The data was taken from 1992 and 2000 and shows an upward trend.
The number of antenatal care visits by women who gave birth in percent in the years 1992,
2000, 2006/2007. There is a small increase over time when using this dataset.