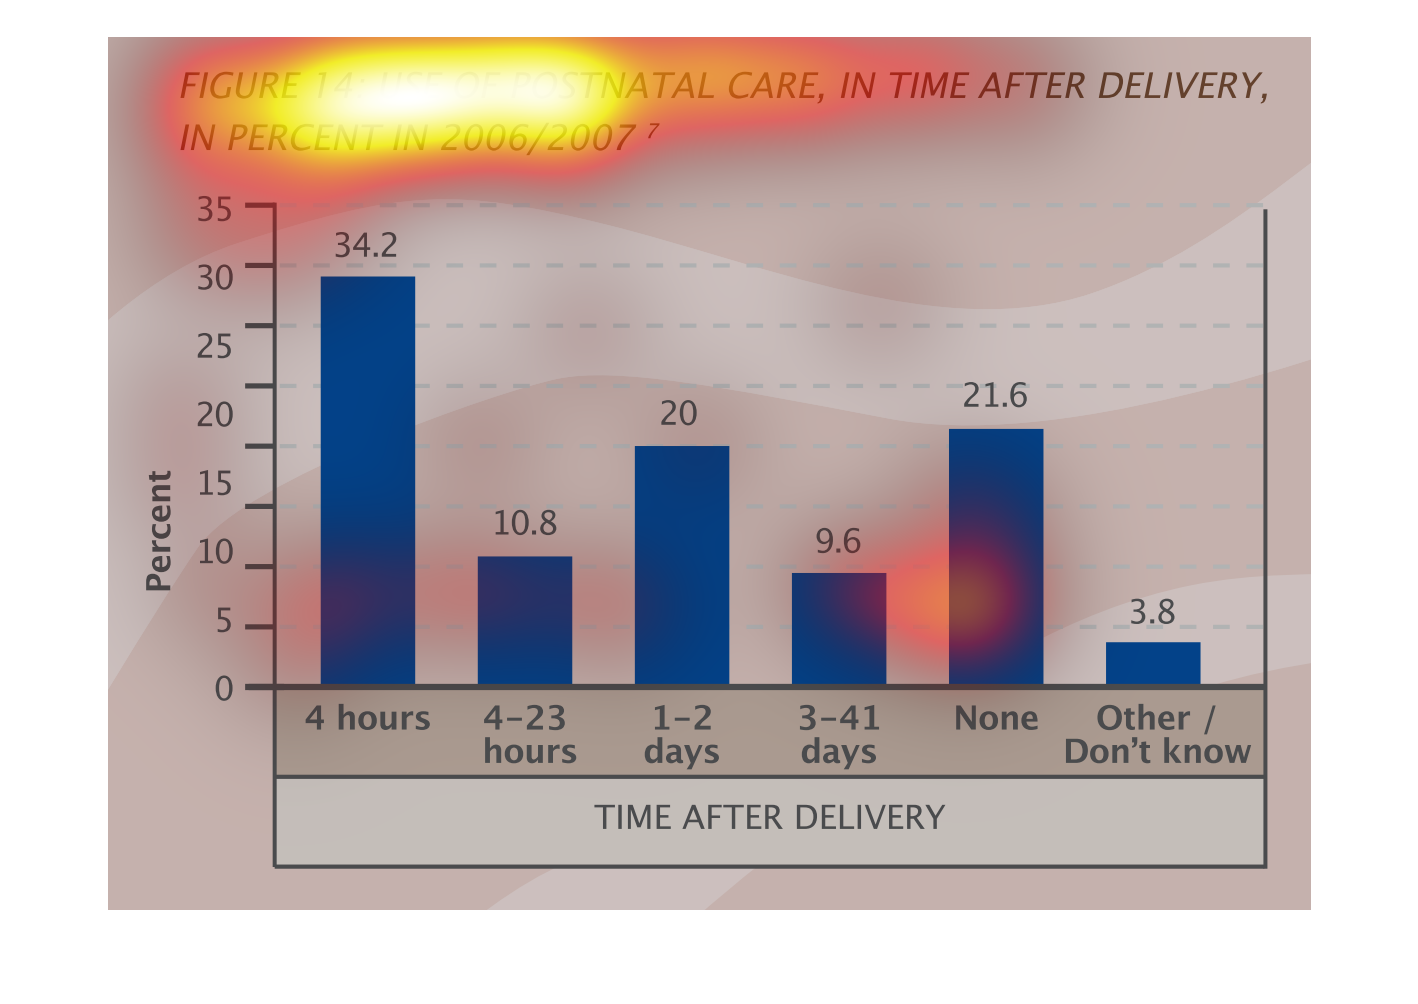
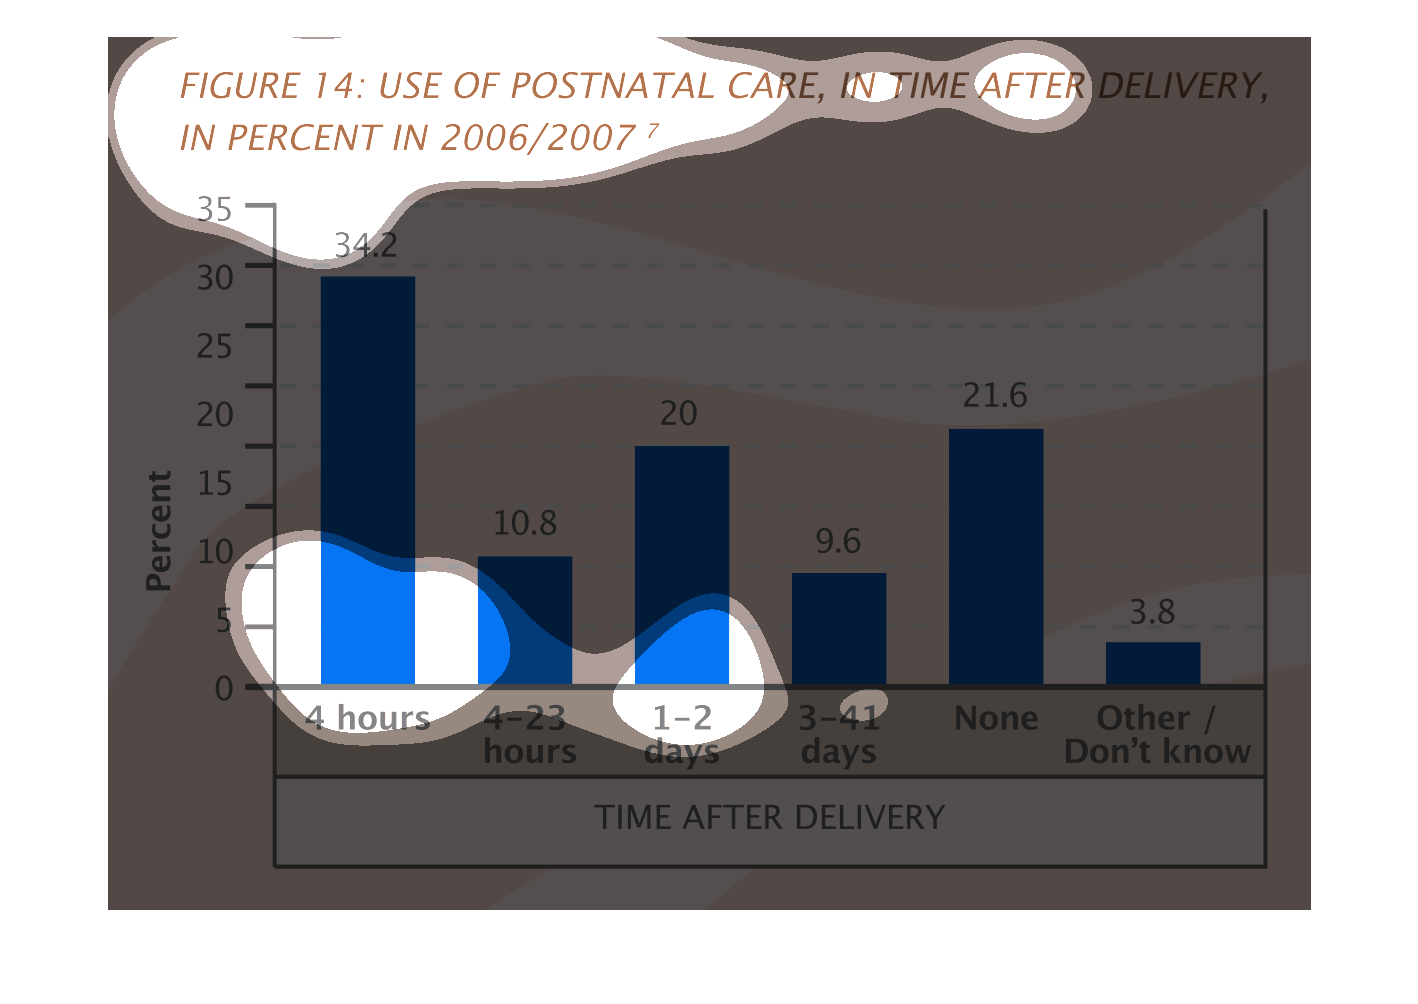
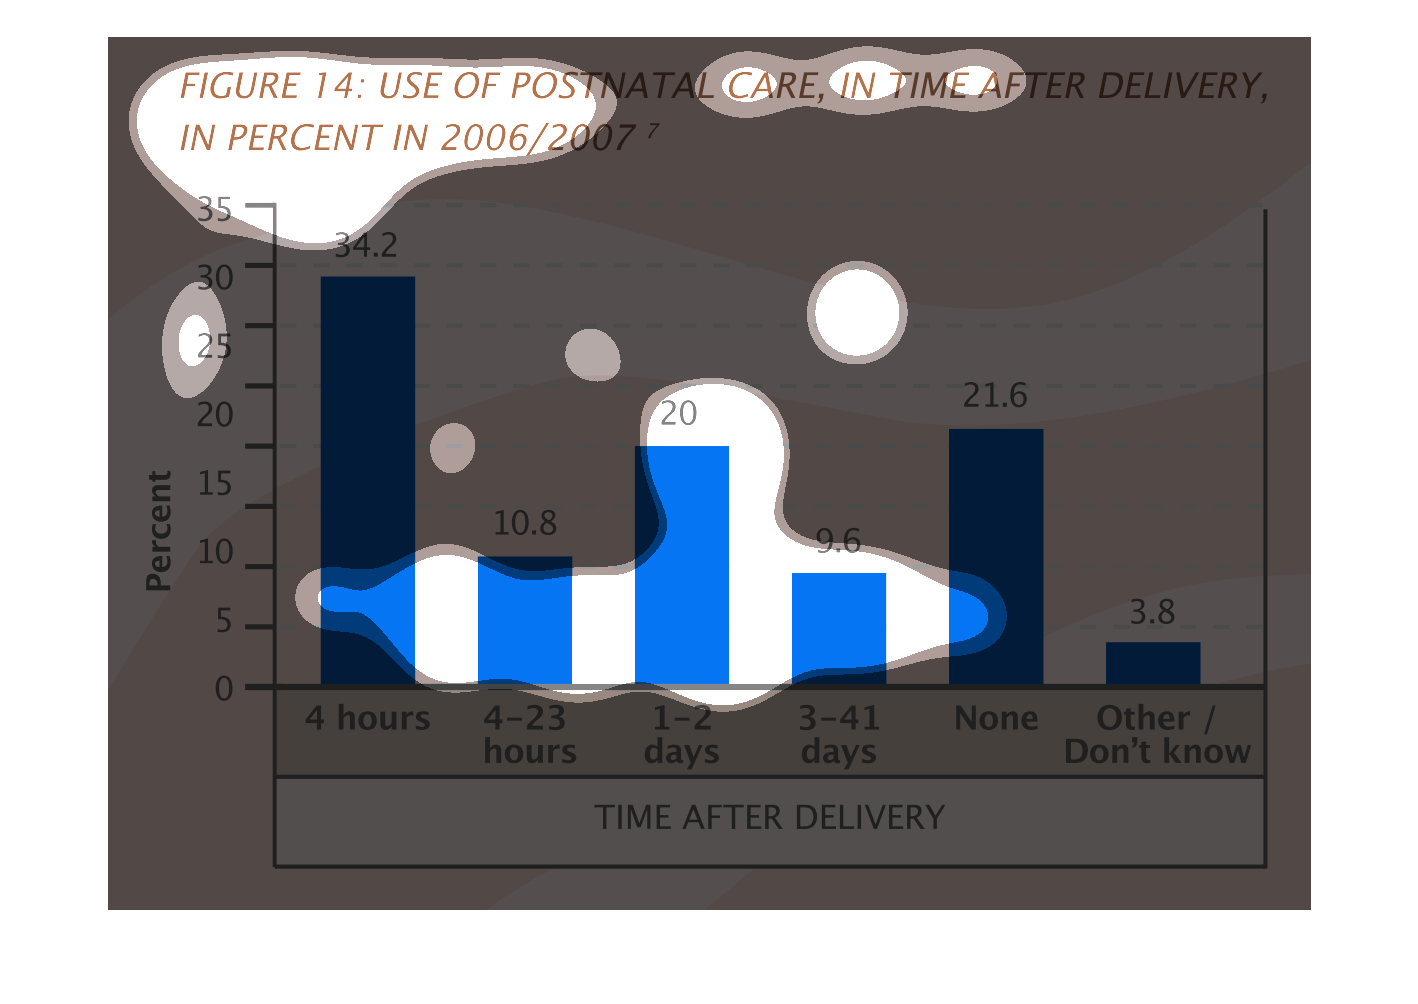
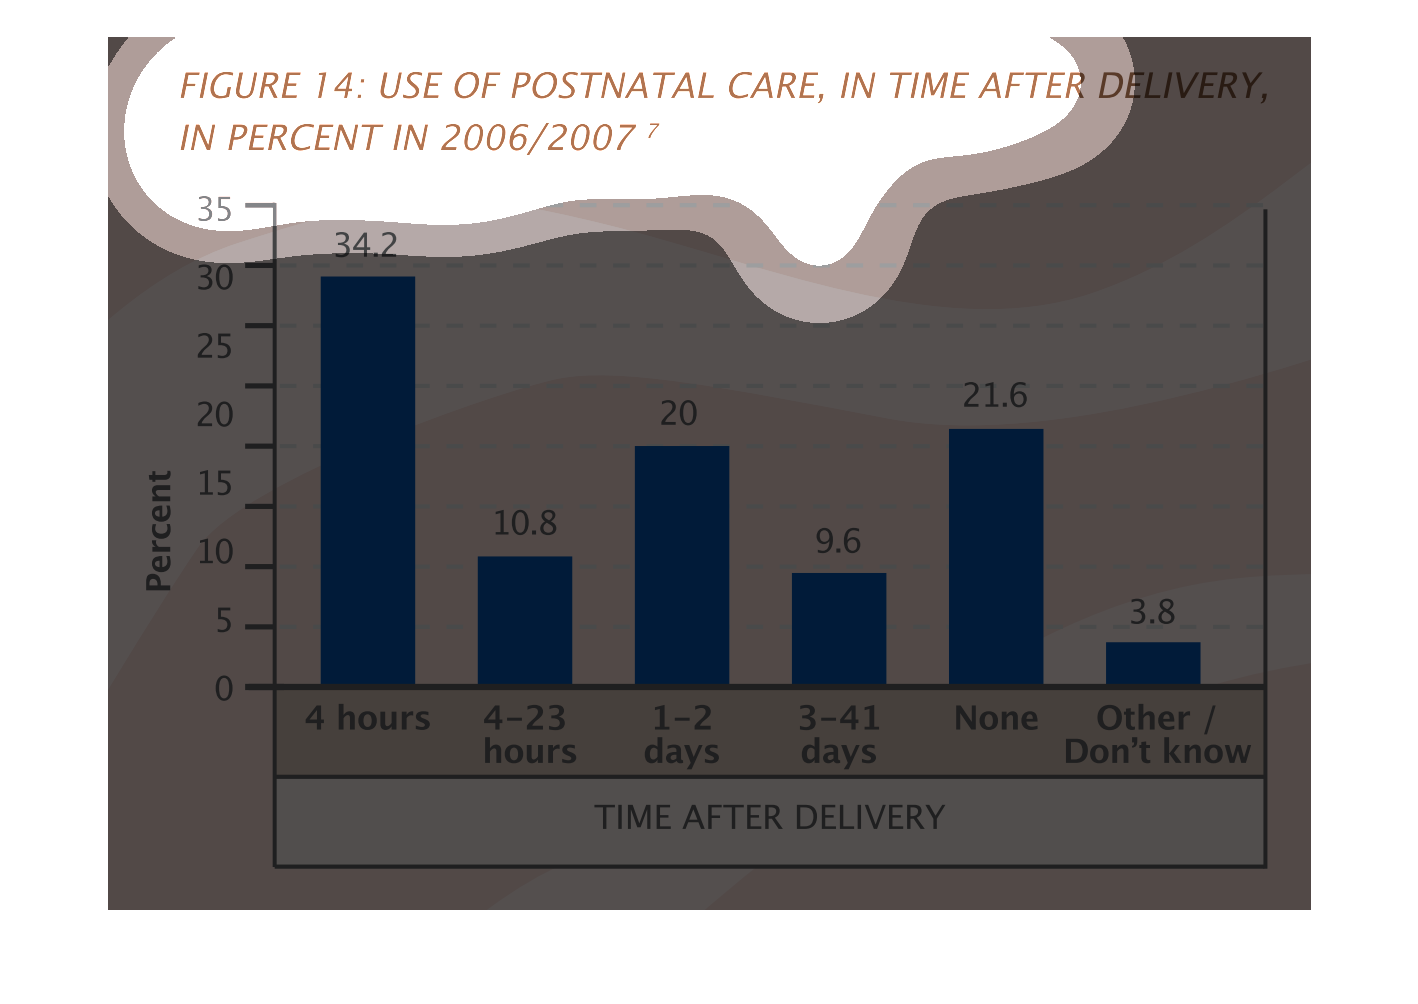
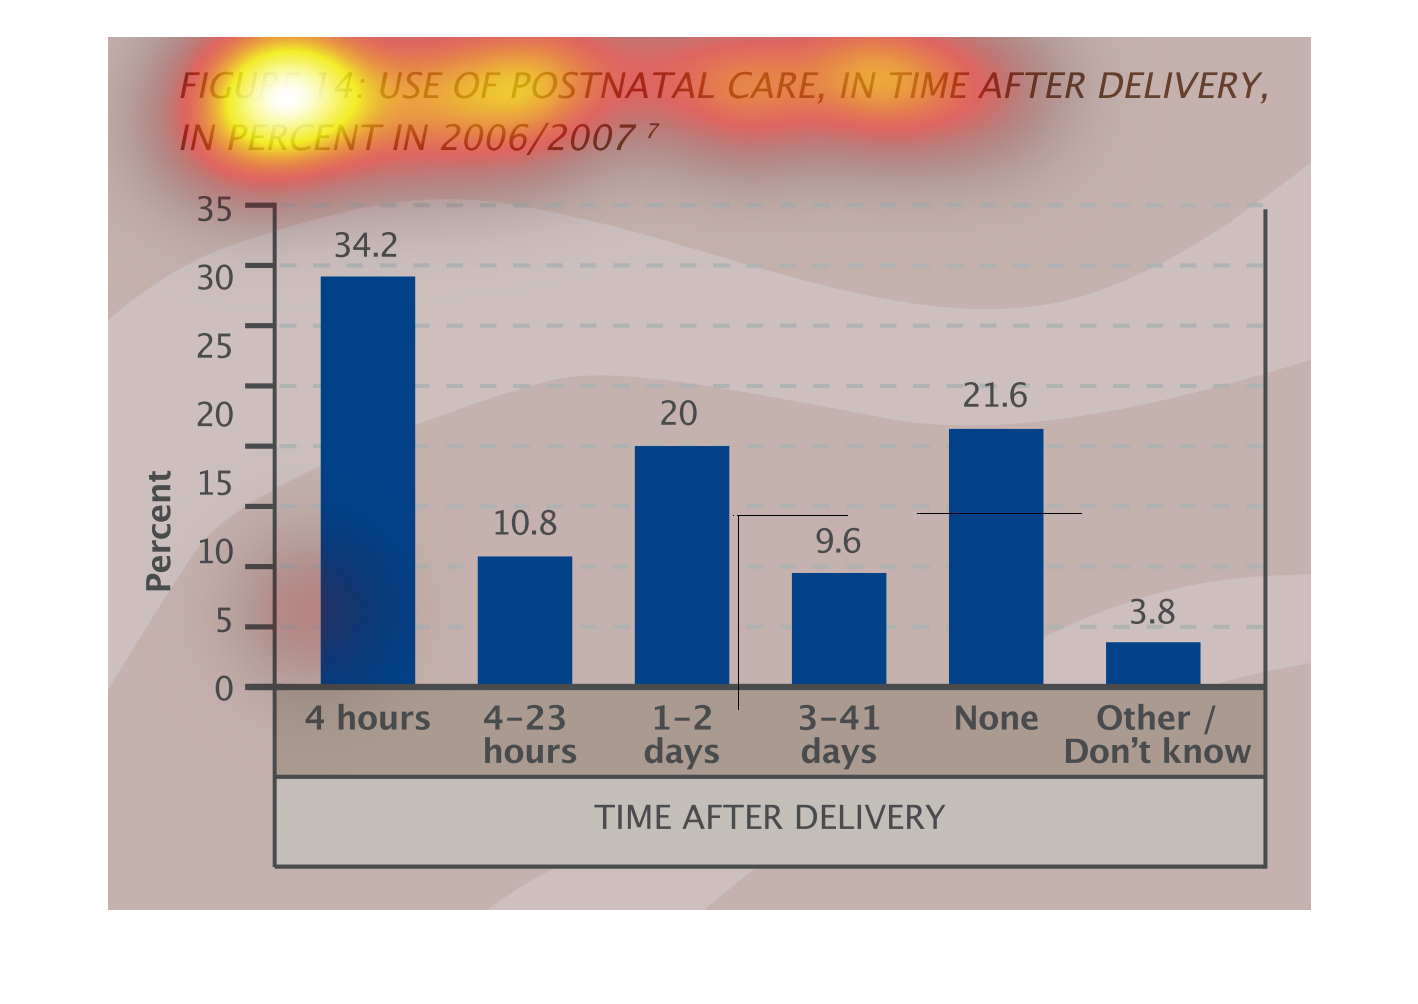
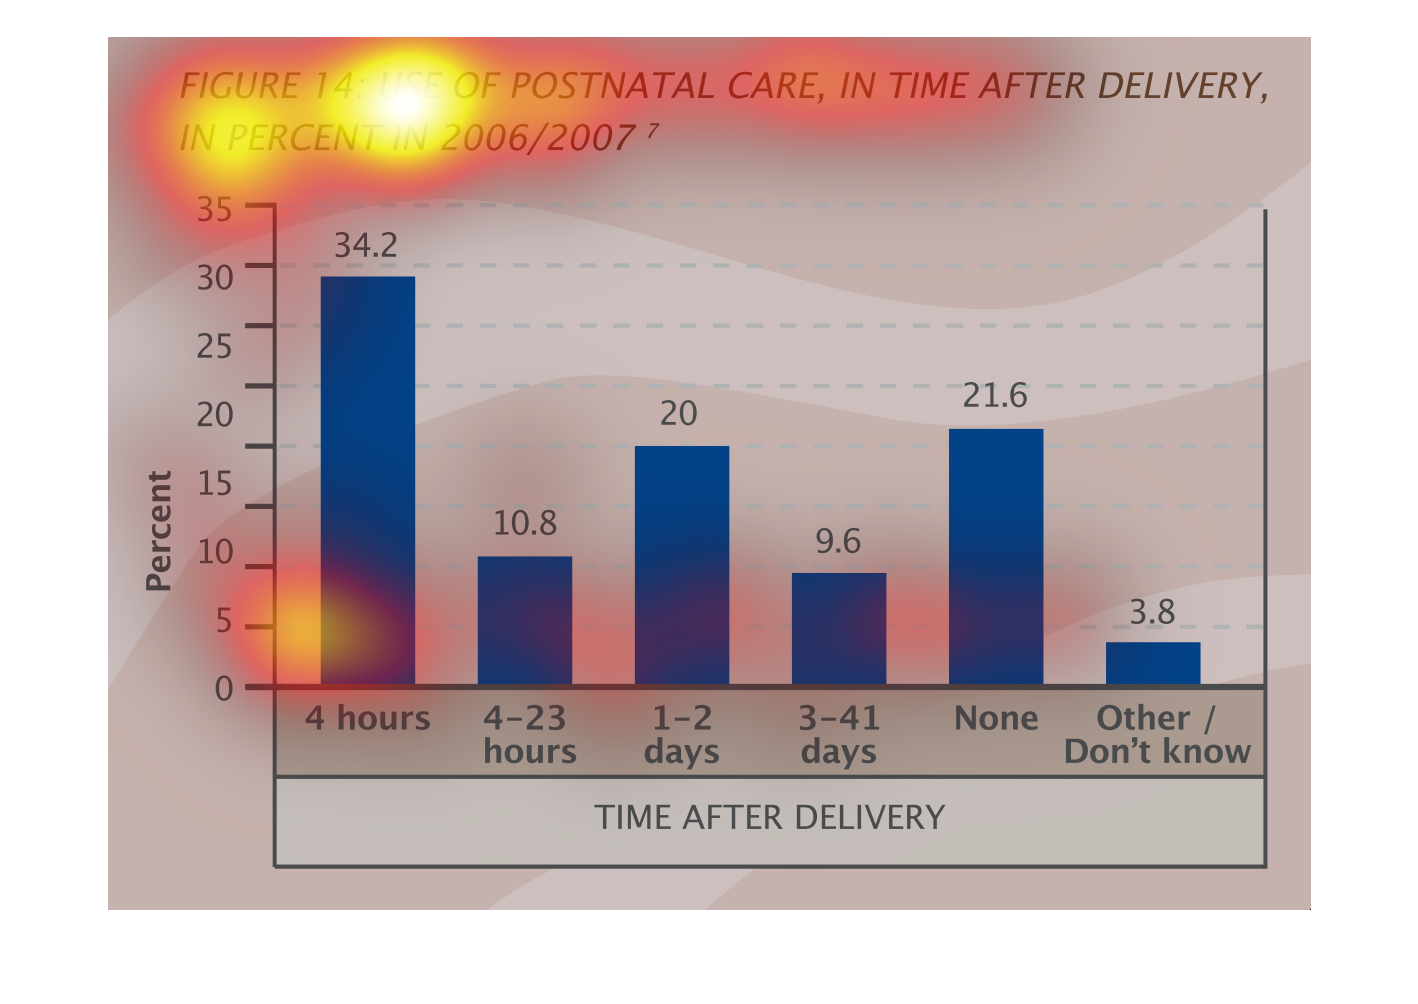
This chart describes the use of postnatal care in the time after delivery in the years of
2006 and 2007.  It shows that the highest use of postnatal care is 34.2 percent and occurs
4 hours after delivery, with the lowest coming in at 9.6% and occurs 3-41 days after delivery.
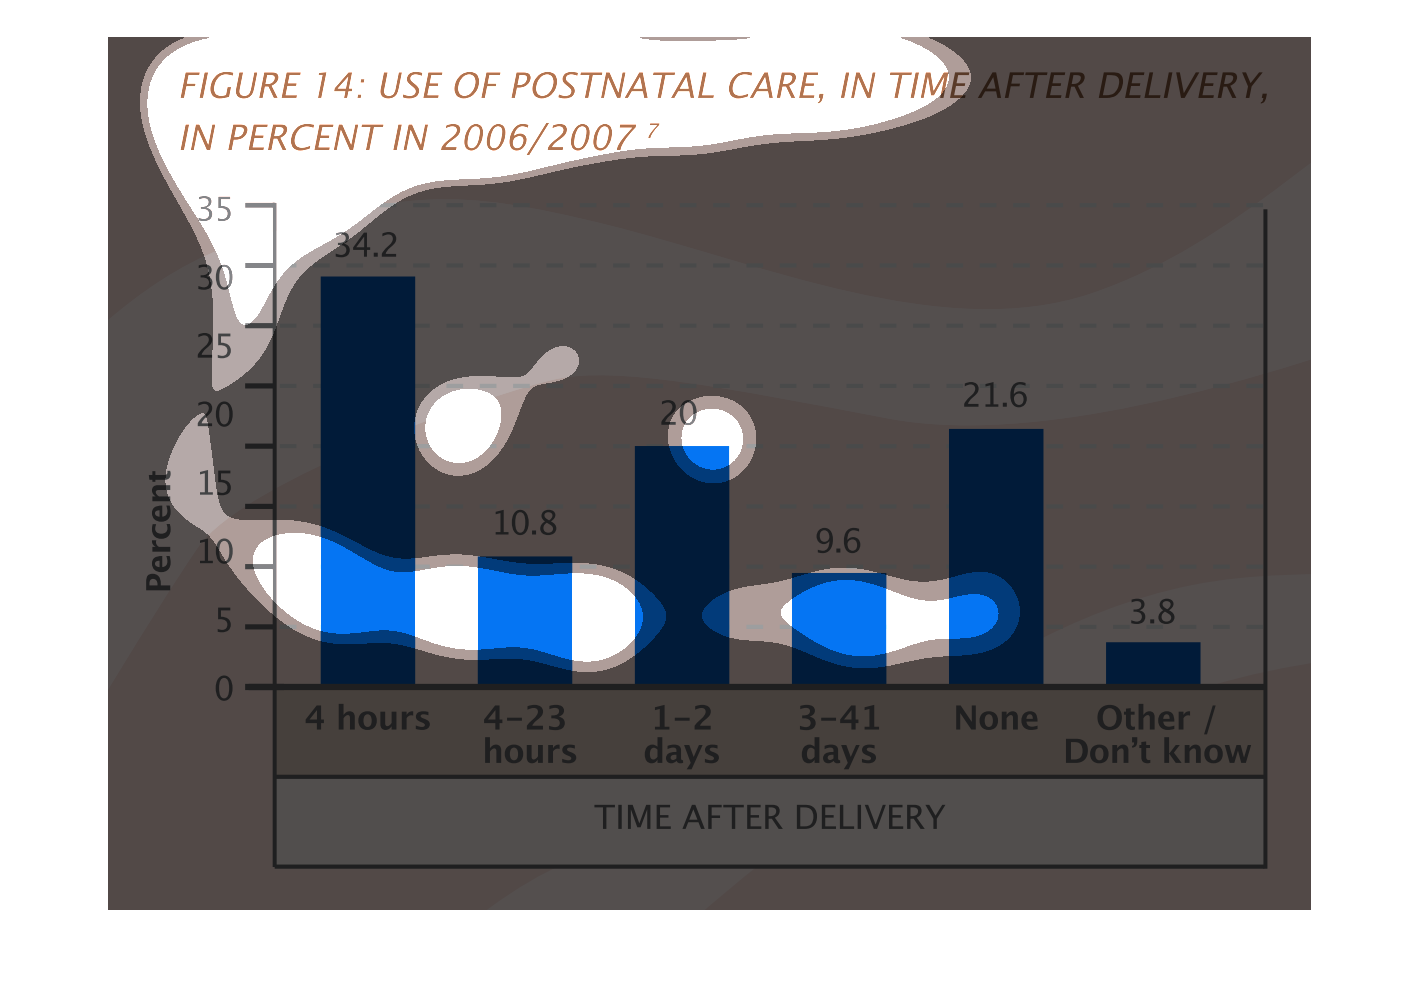
This graph depicts the usage of post natal care in the years 2006/2007 in the form of percentages,
using total time as a variable. Most women do either a small amount of post natal  care or
none at all.
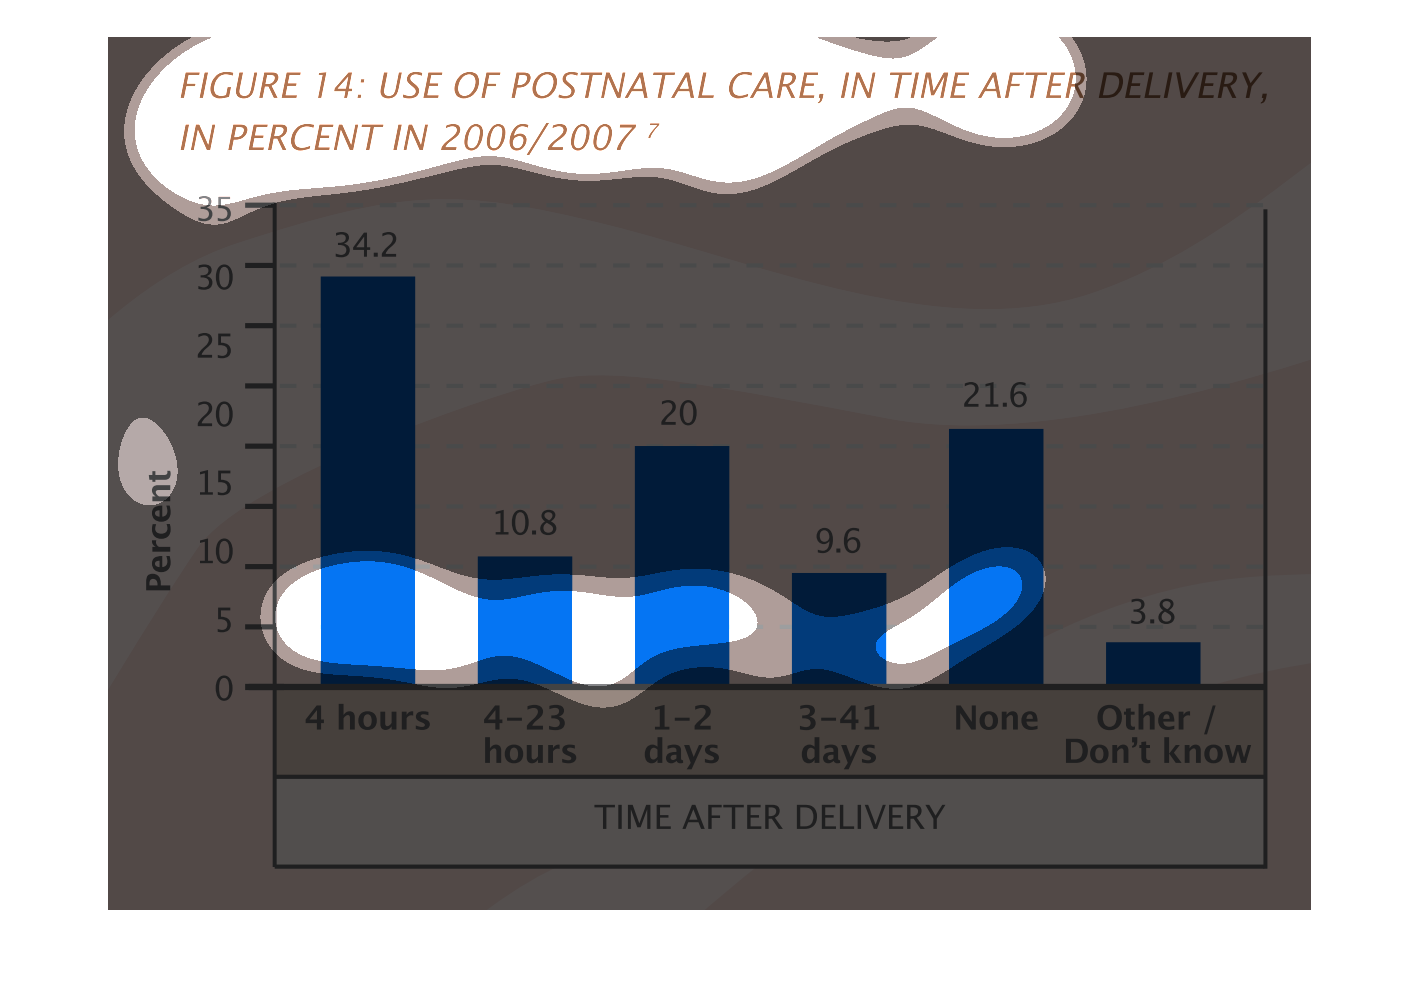
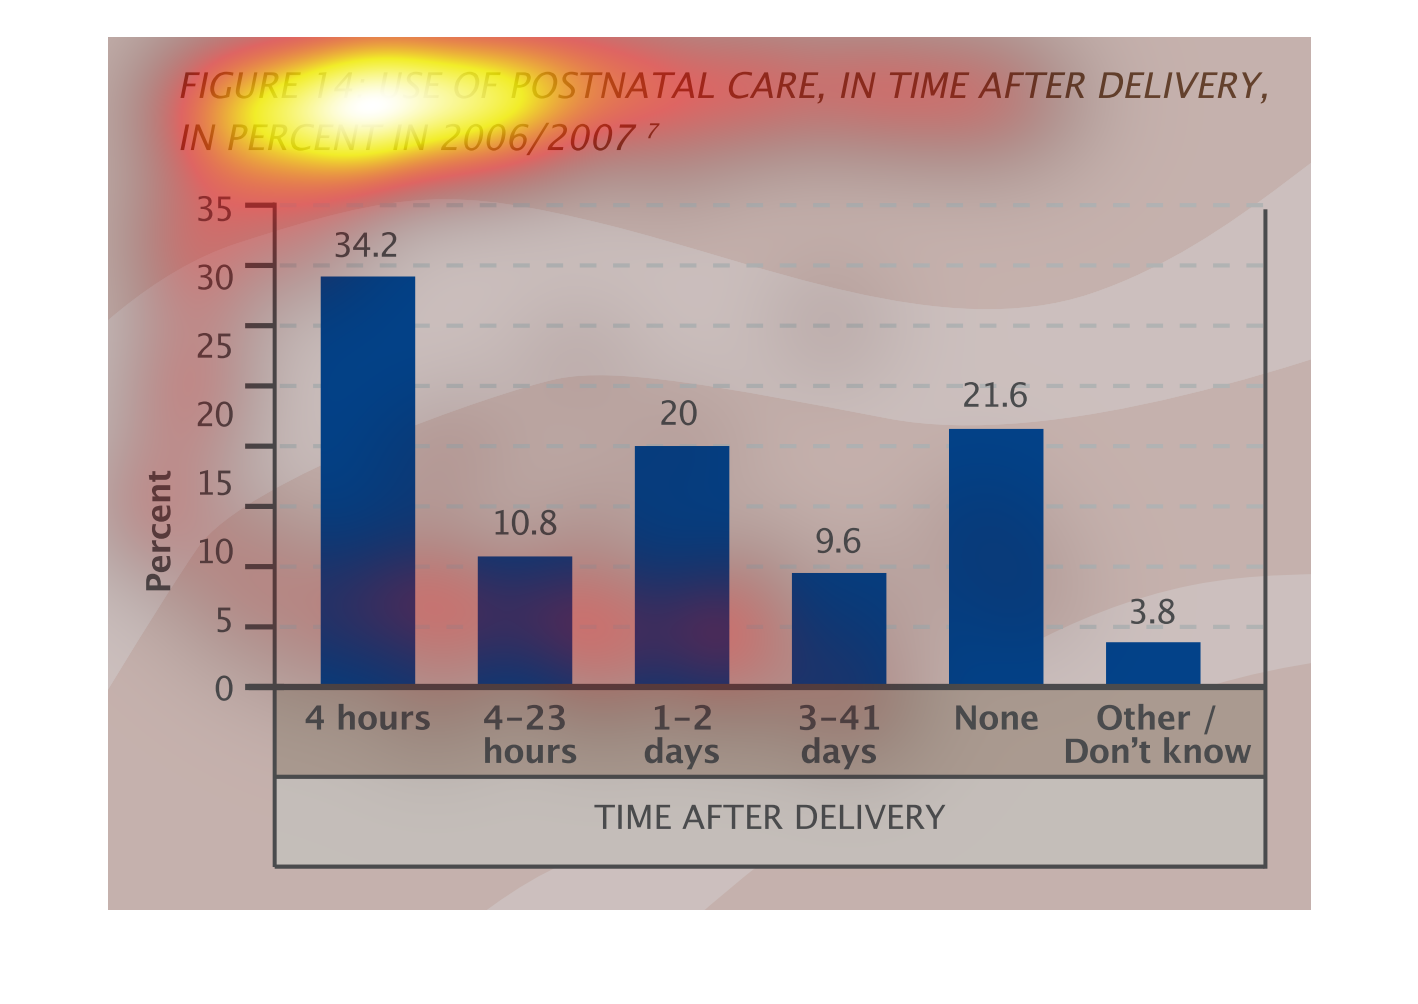
Use of postnatal care in time after delivery in percent during timeframe of 2006/2007. Seems
to fluctuate quite a bit with being really high within 4 hours (34%) of delivery to decreasing
dramatically from 4-23 (10%) hours after delivery then increasing again from 1-2 (20%) days
then decreasing again from 3-41 (9.6%) days.
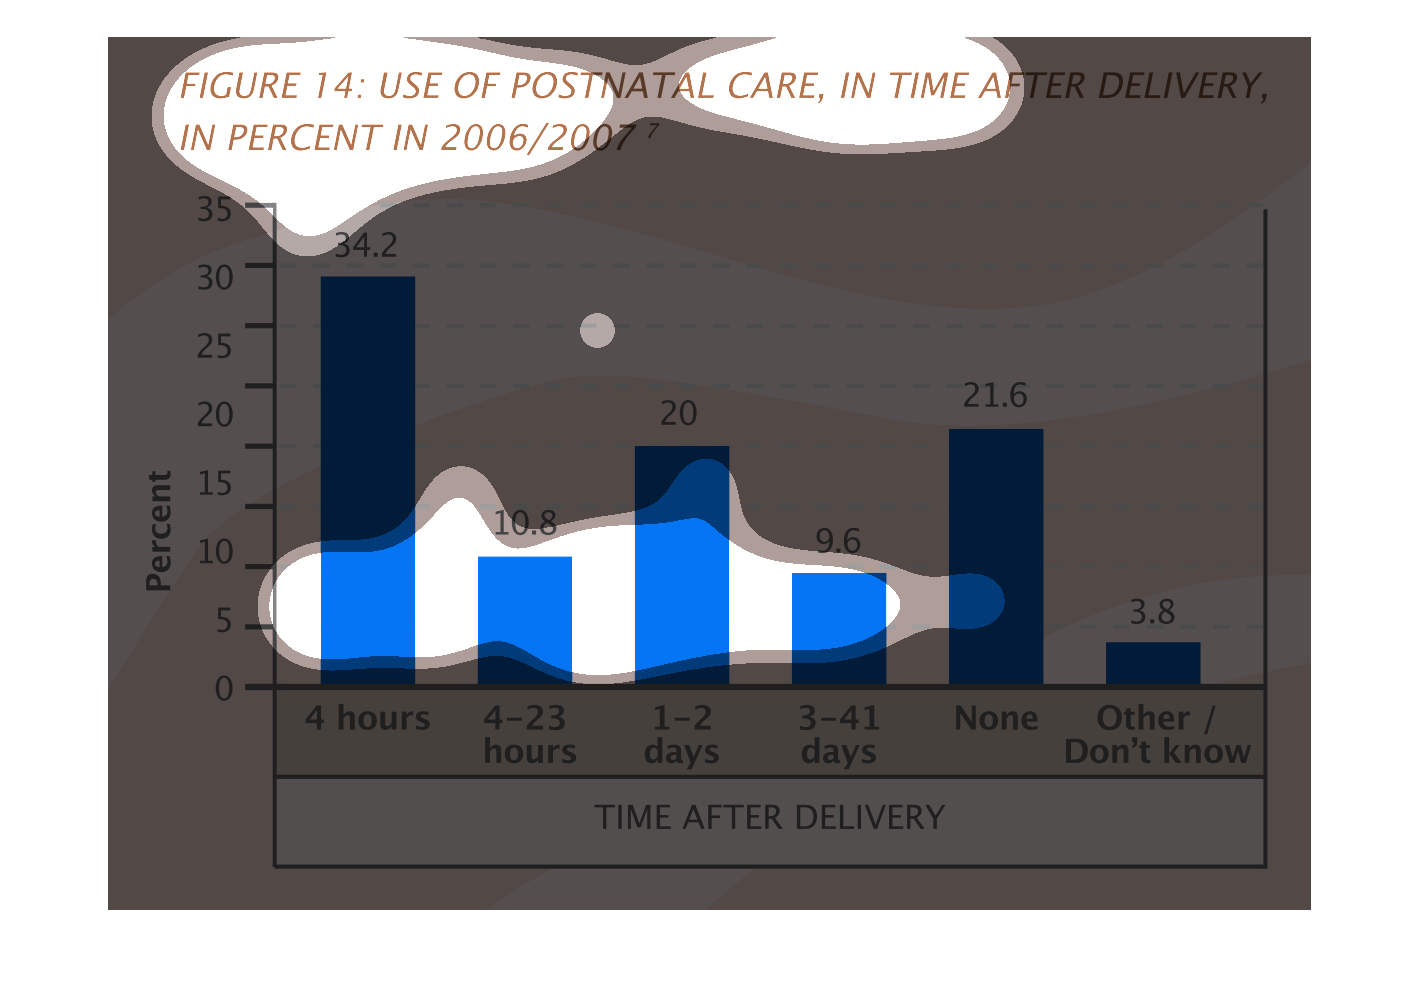
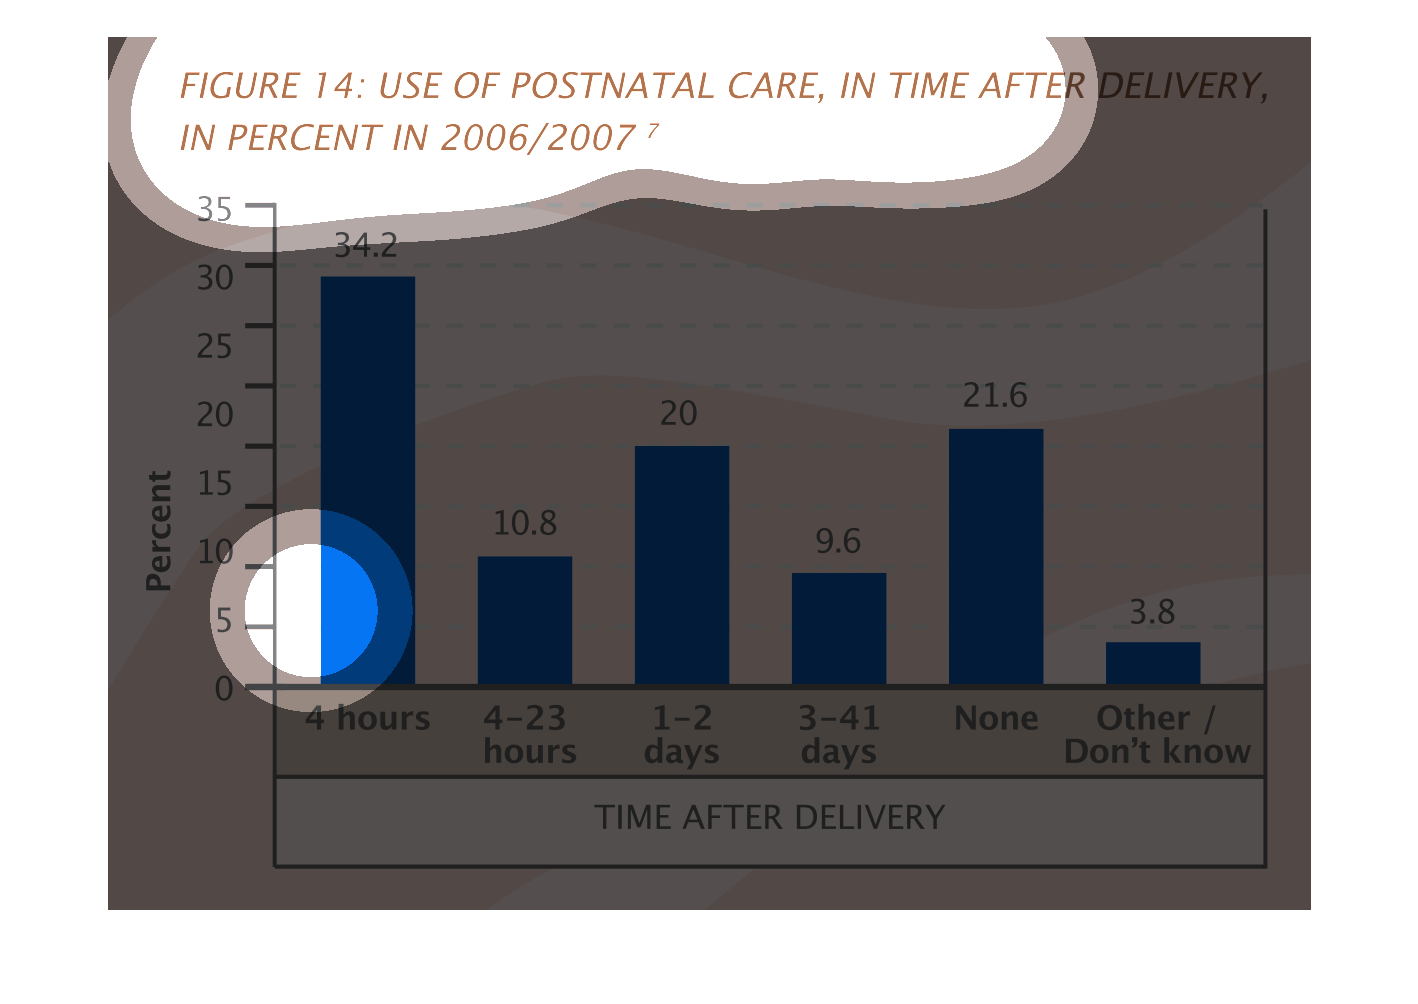
This graph is about the percentage of postnatal care in time after delivery in 2006/2007.
The highest percentage is 34.5% with 4 hours. The next highest is 21.6% having none, followed
by 20% with 1-2 days, 10.8% having 4-23 hours, 9.6% having 3-41 days, and 3.8% being unknown.
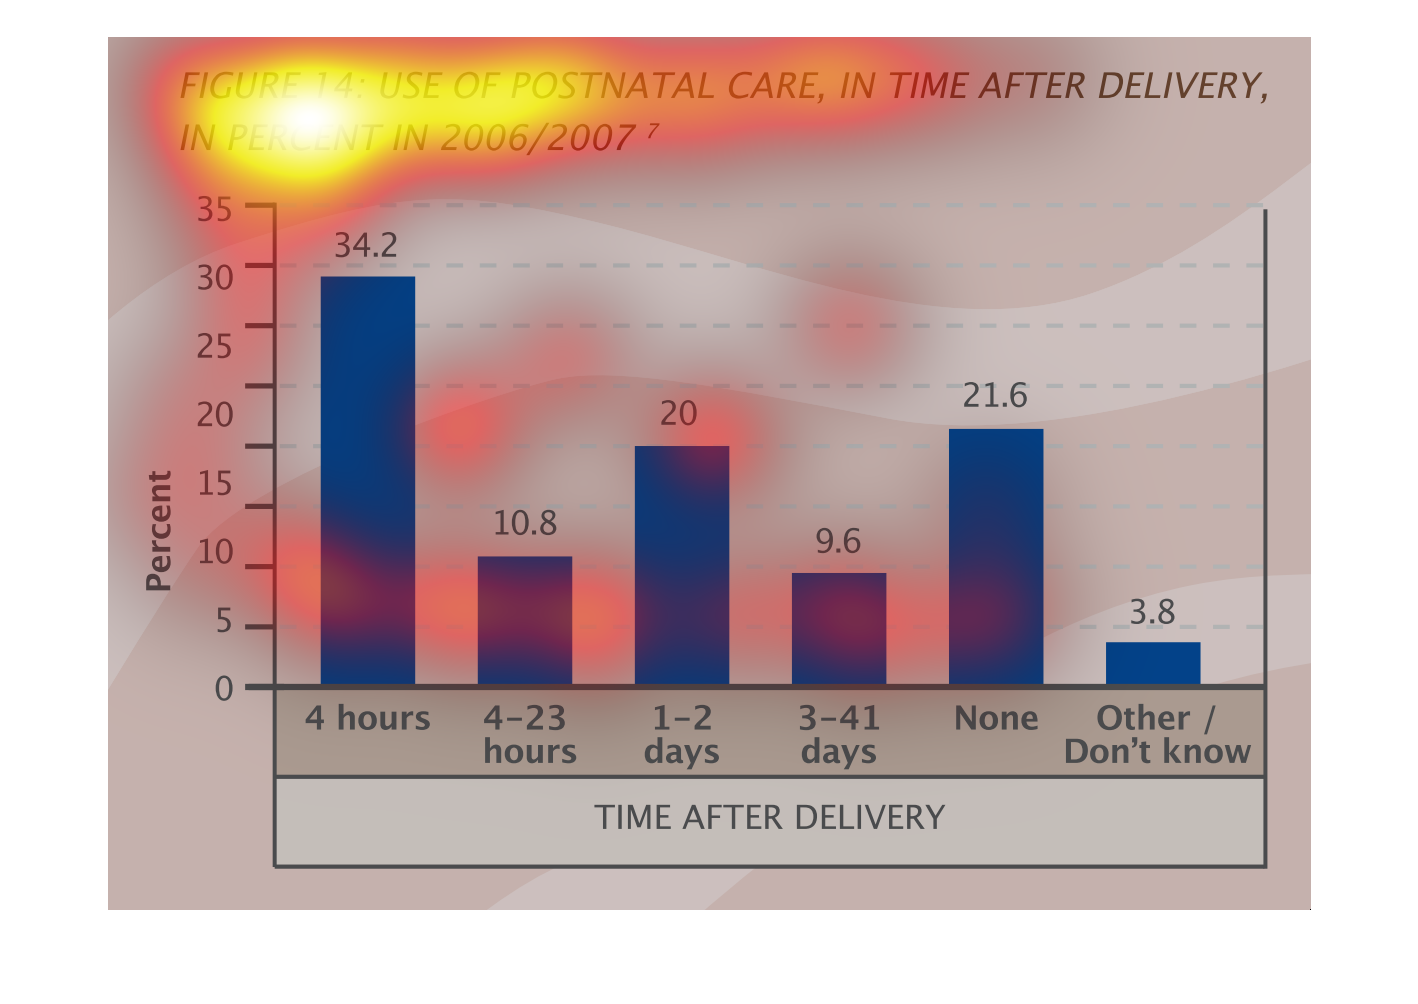
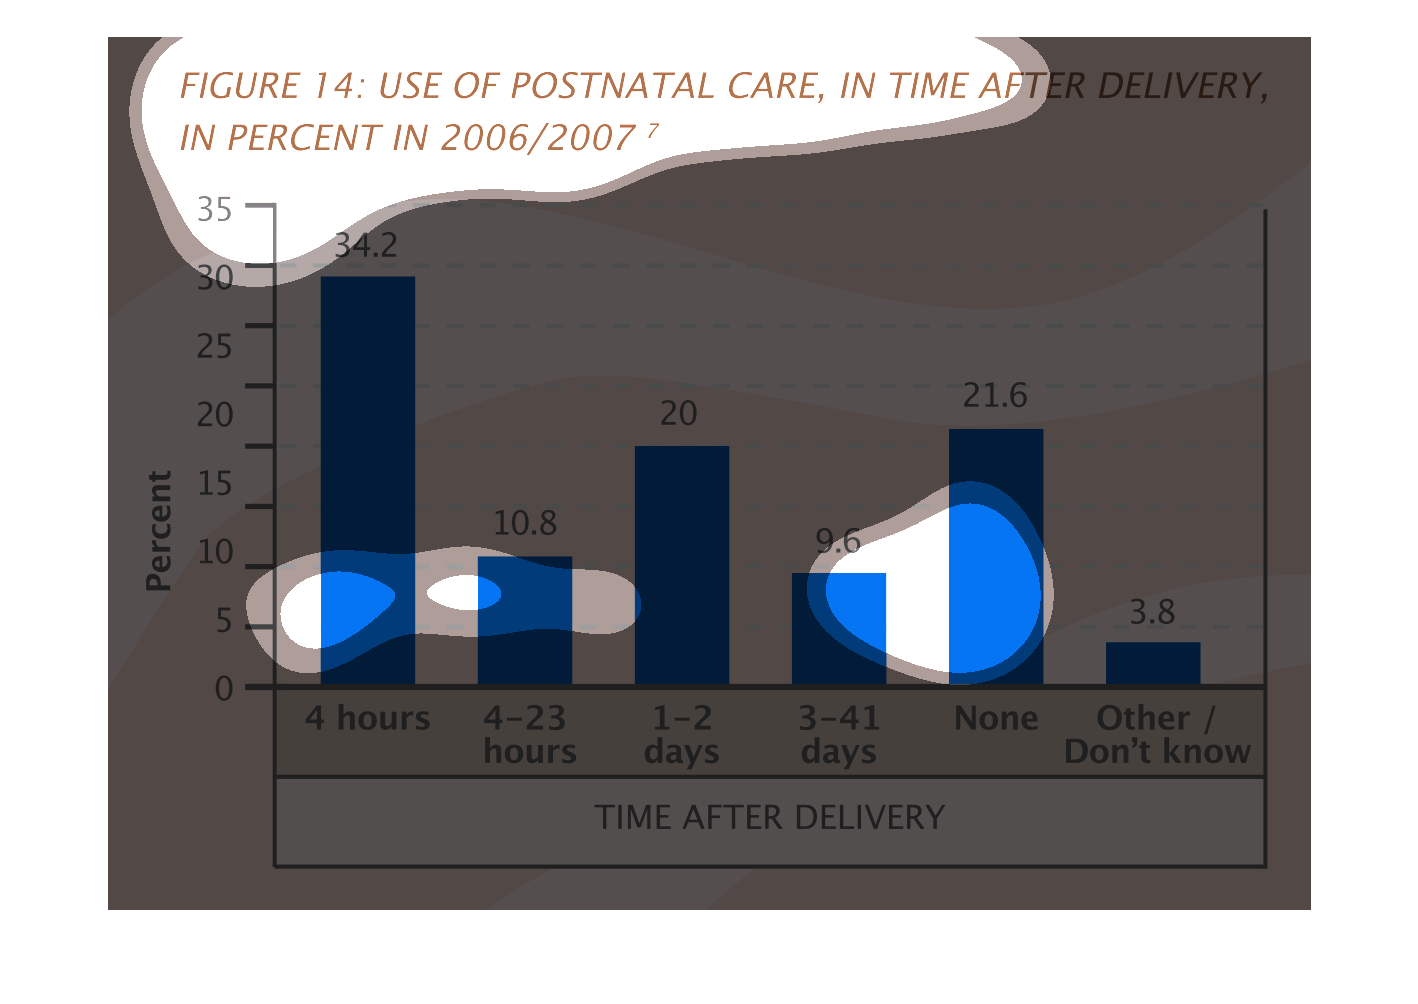
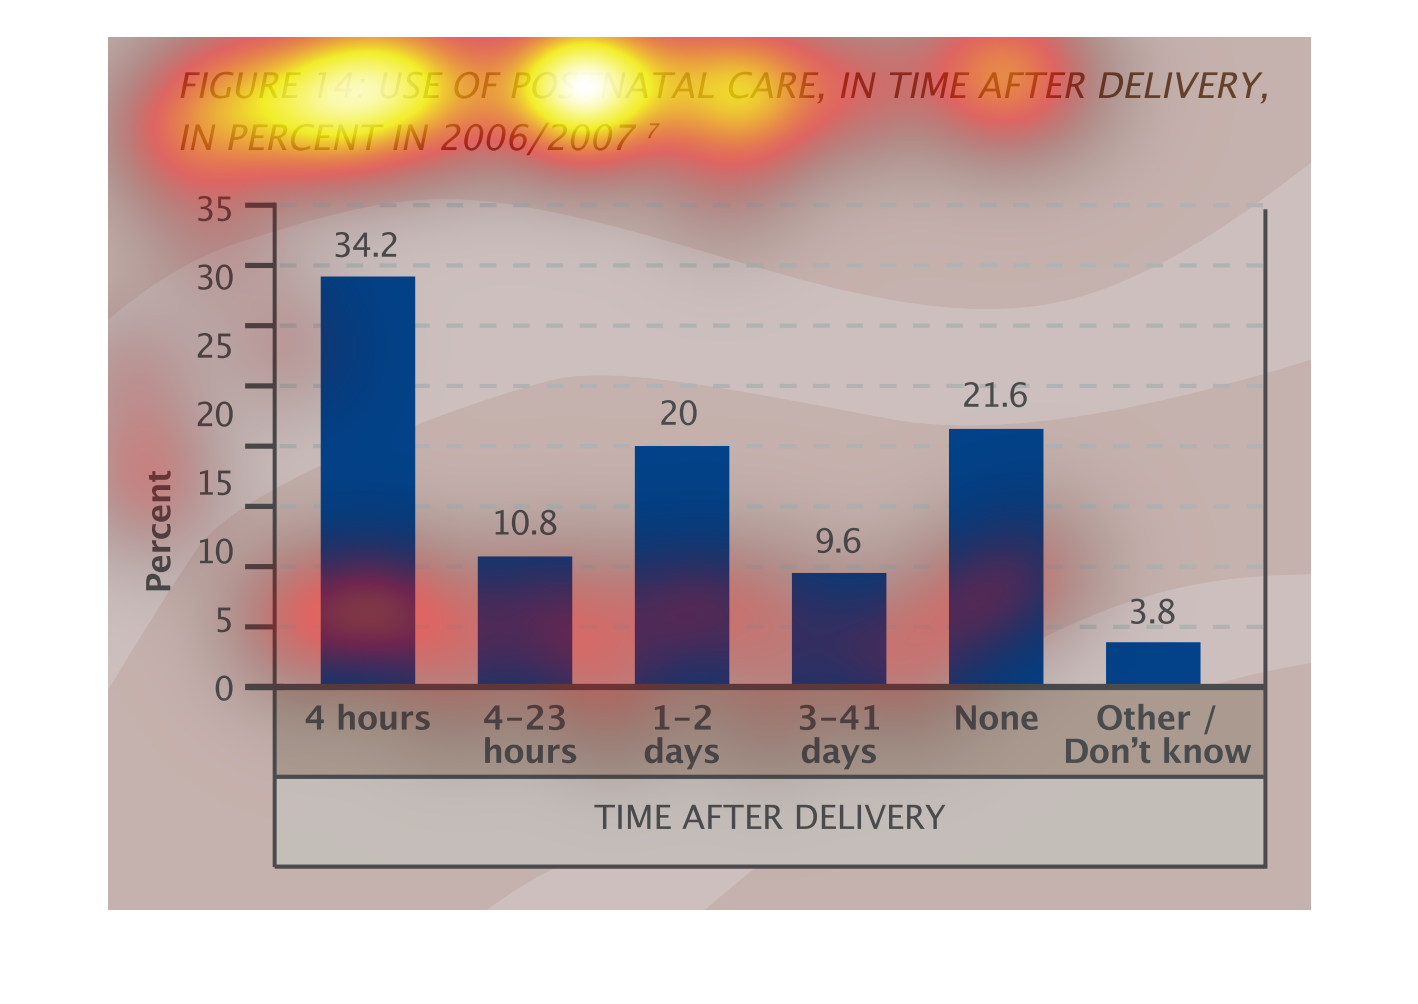
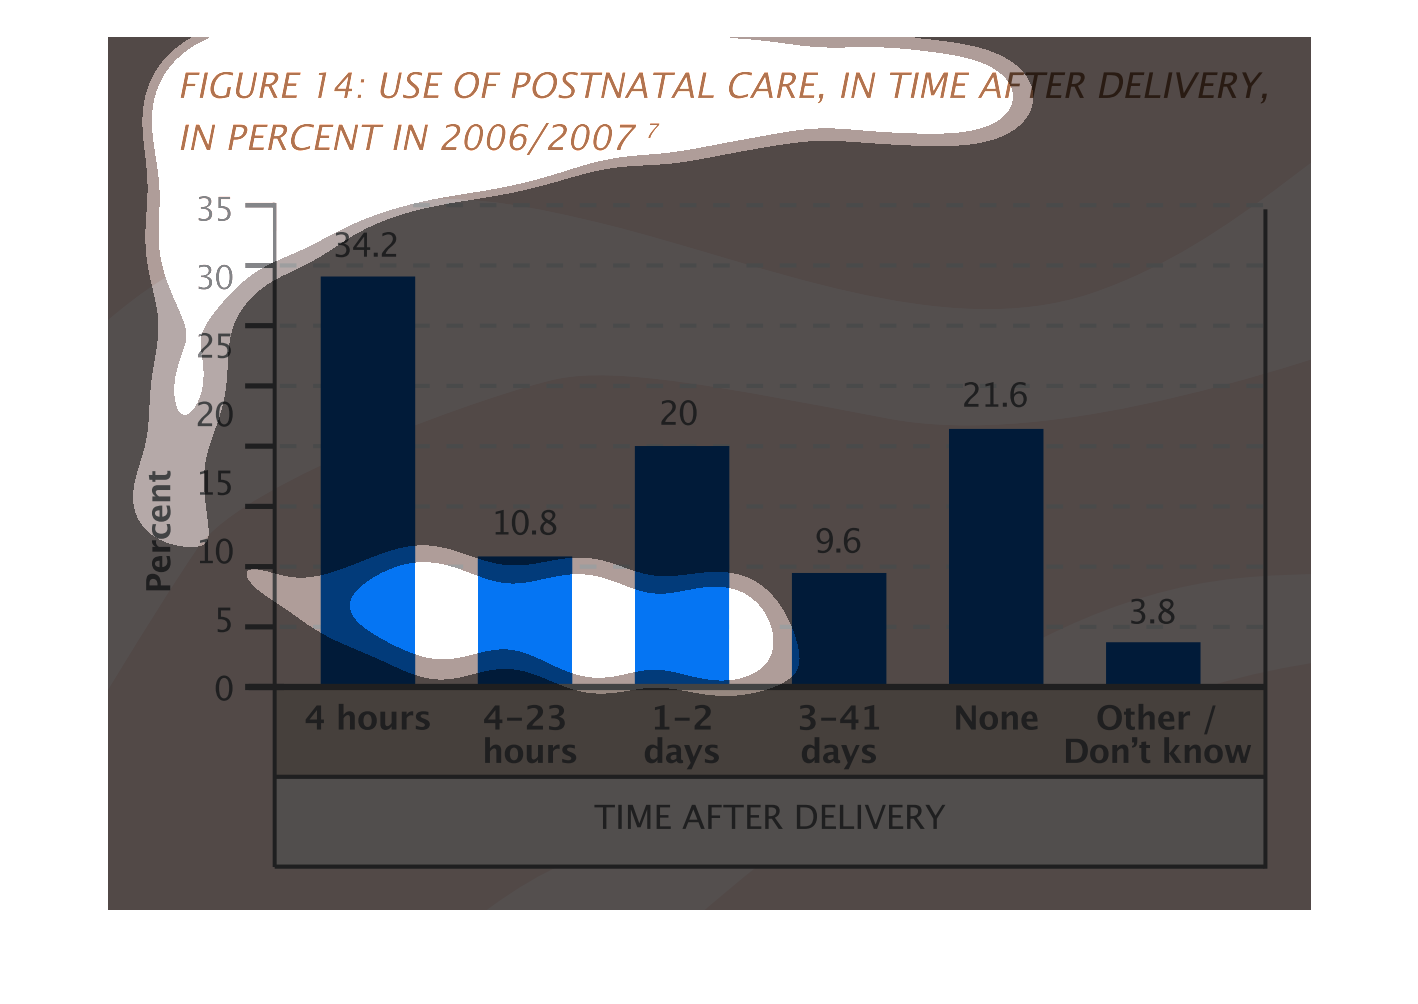
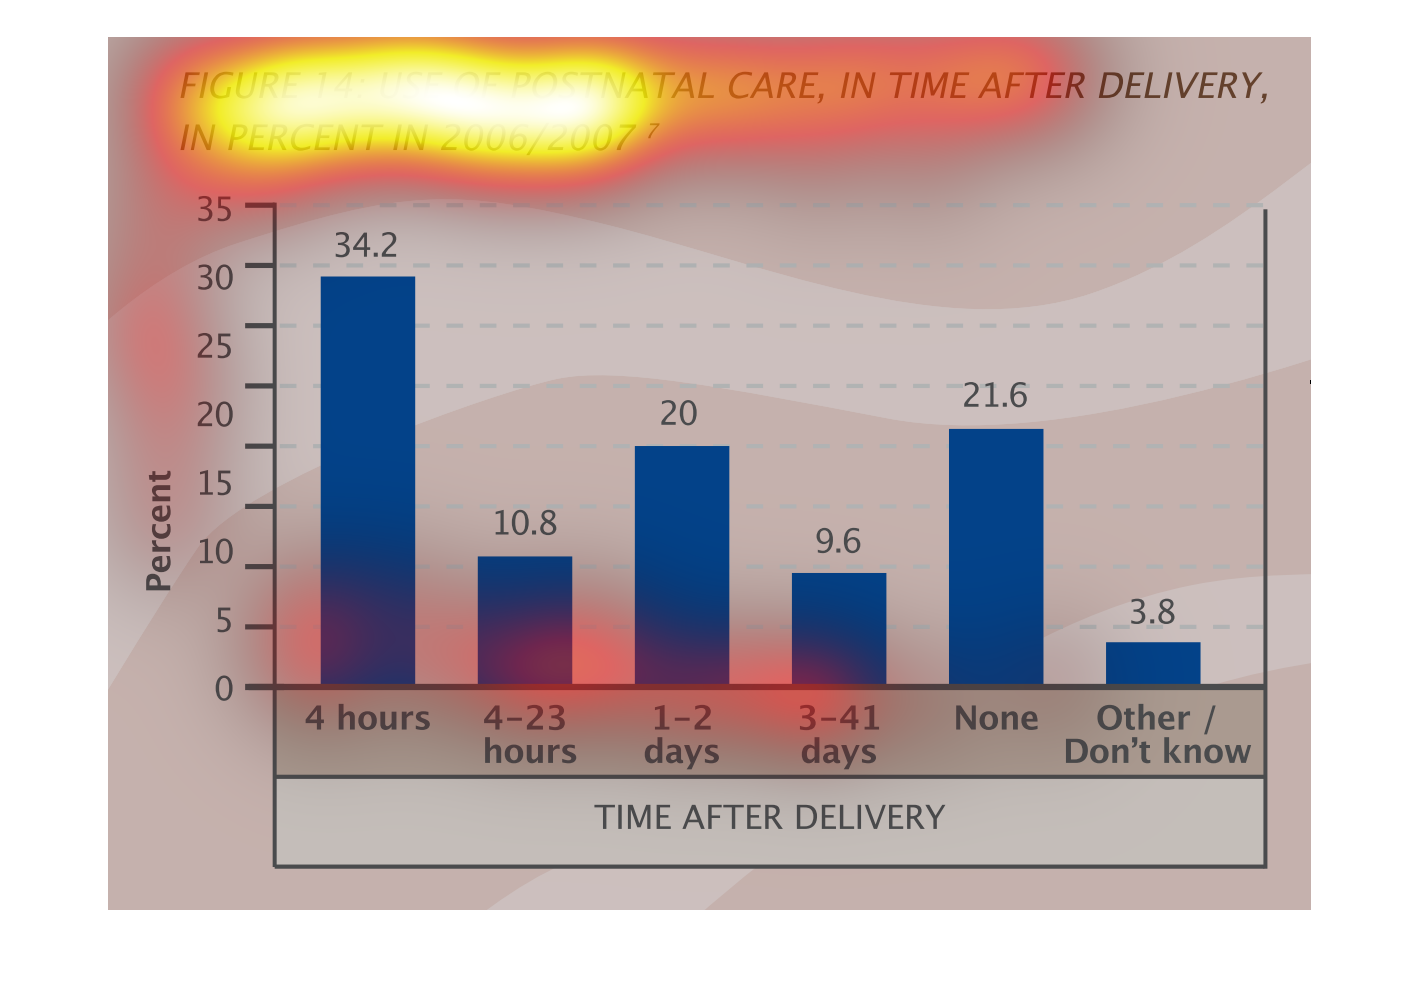
Use of postnatal care, in time after delivery (%) in 2006-2007.  The highest percentage was
within 4 hours of delivery at a rate of 34.2%, the lowest at a rate of 9.6% within 3-41 days.
 Approx. 21.6% received no postnatal care after delivery.
This chart shows the use of post natal care after delivery and the percentage of use as measured
in number of hours used. it does not specify which countries
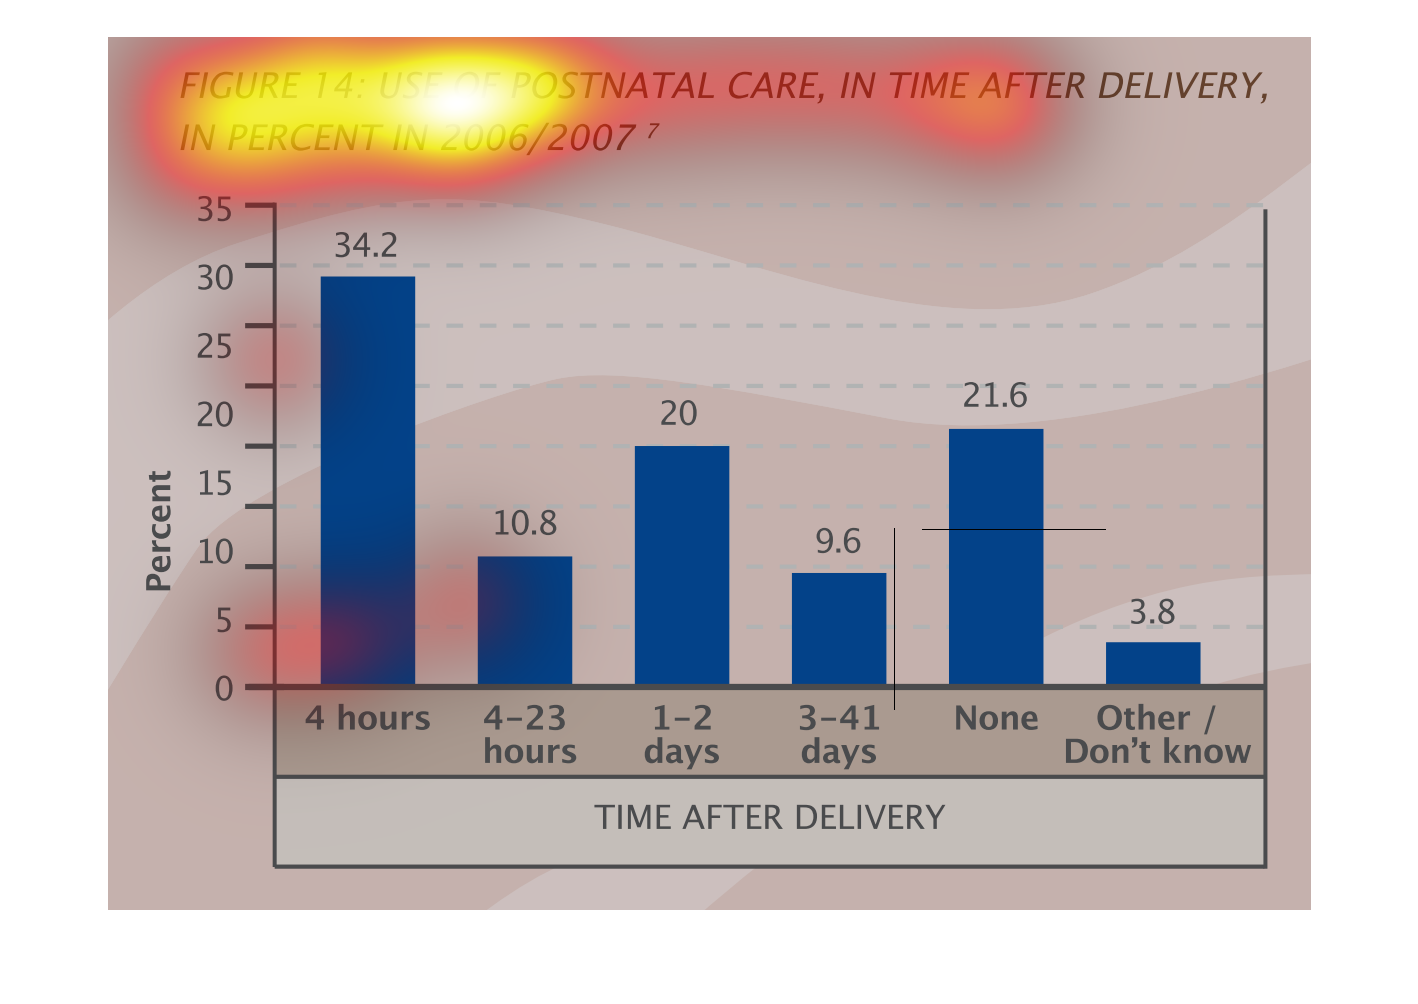
The following chart gives the time of post natal care. It gives it in terms of care after
delivery in percentage. The data was taken from the years of 2006/2007.
This shows the percentage using postnatal care for time groups following delivery. 34.2 percent
used postnatal care for 4 hours after delivery. 10.8 percent used it between 4 to 23 hours.
20 percent used 1-2 days. 9.6 percent used 3-41 days. 21.6 none. 3.8 don't know.
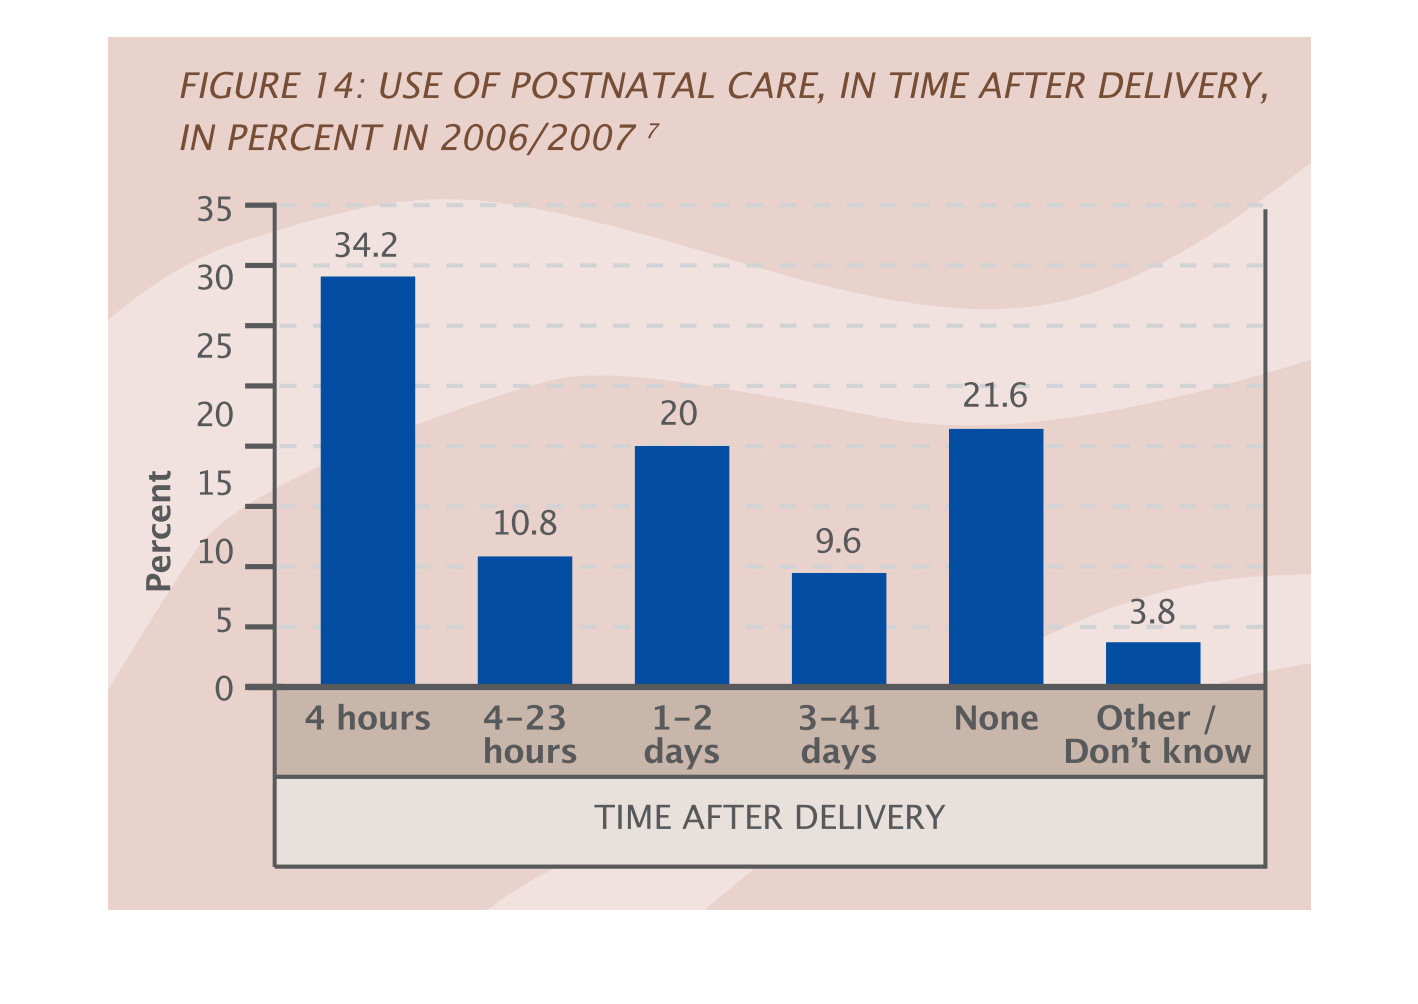
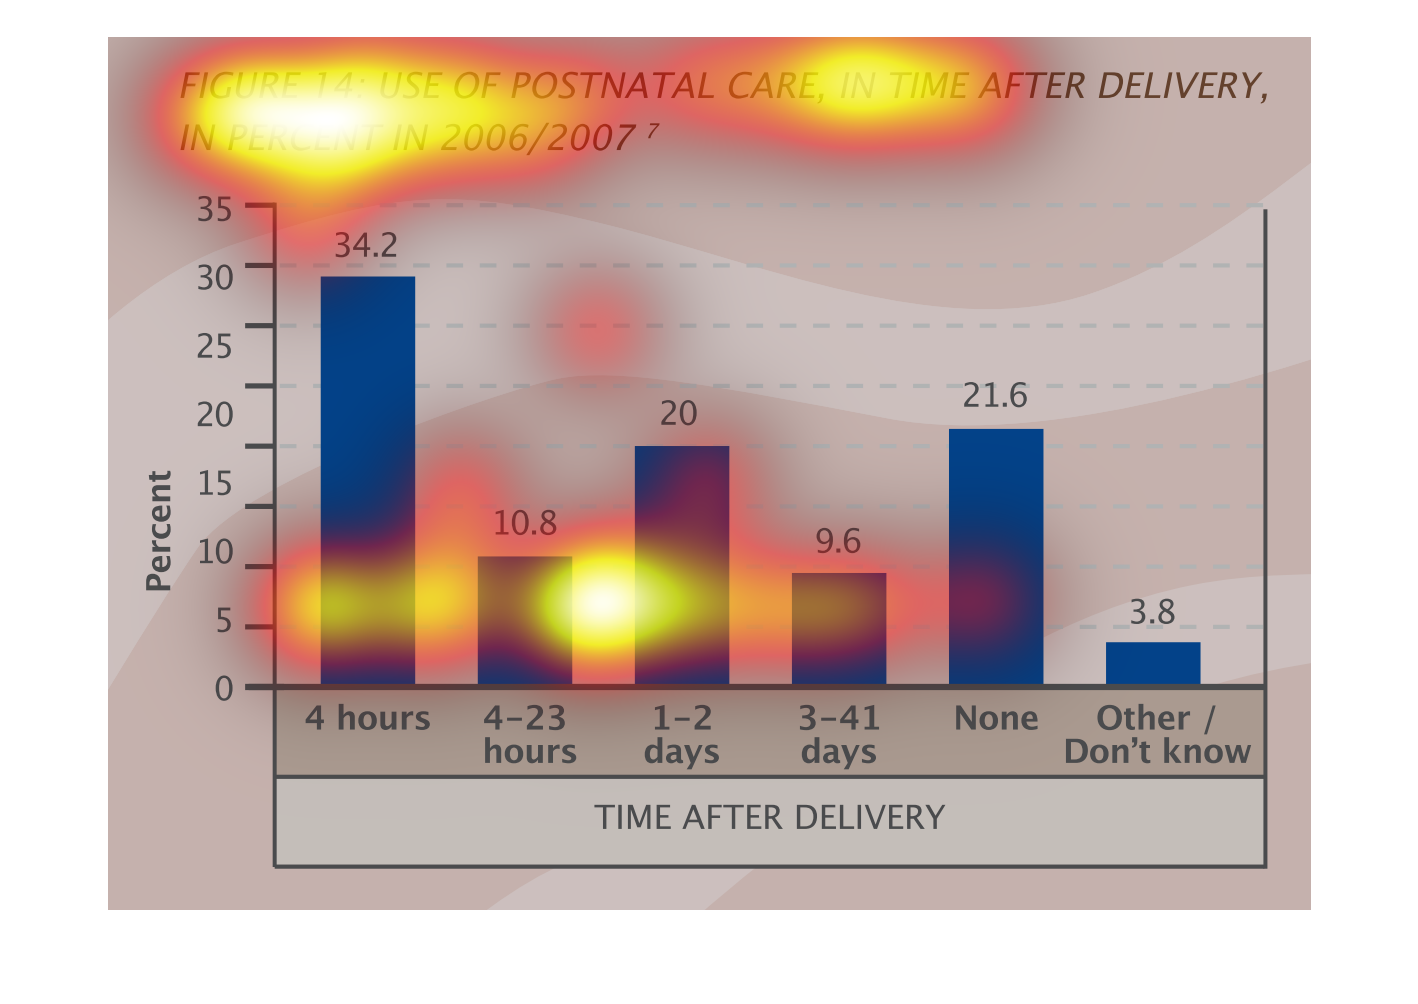
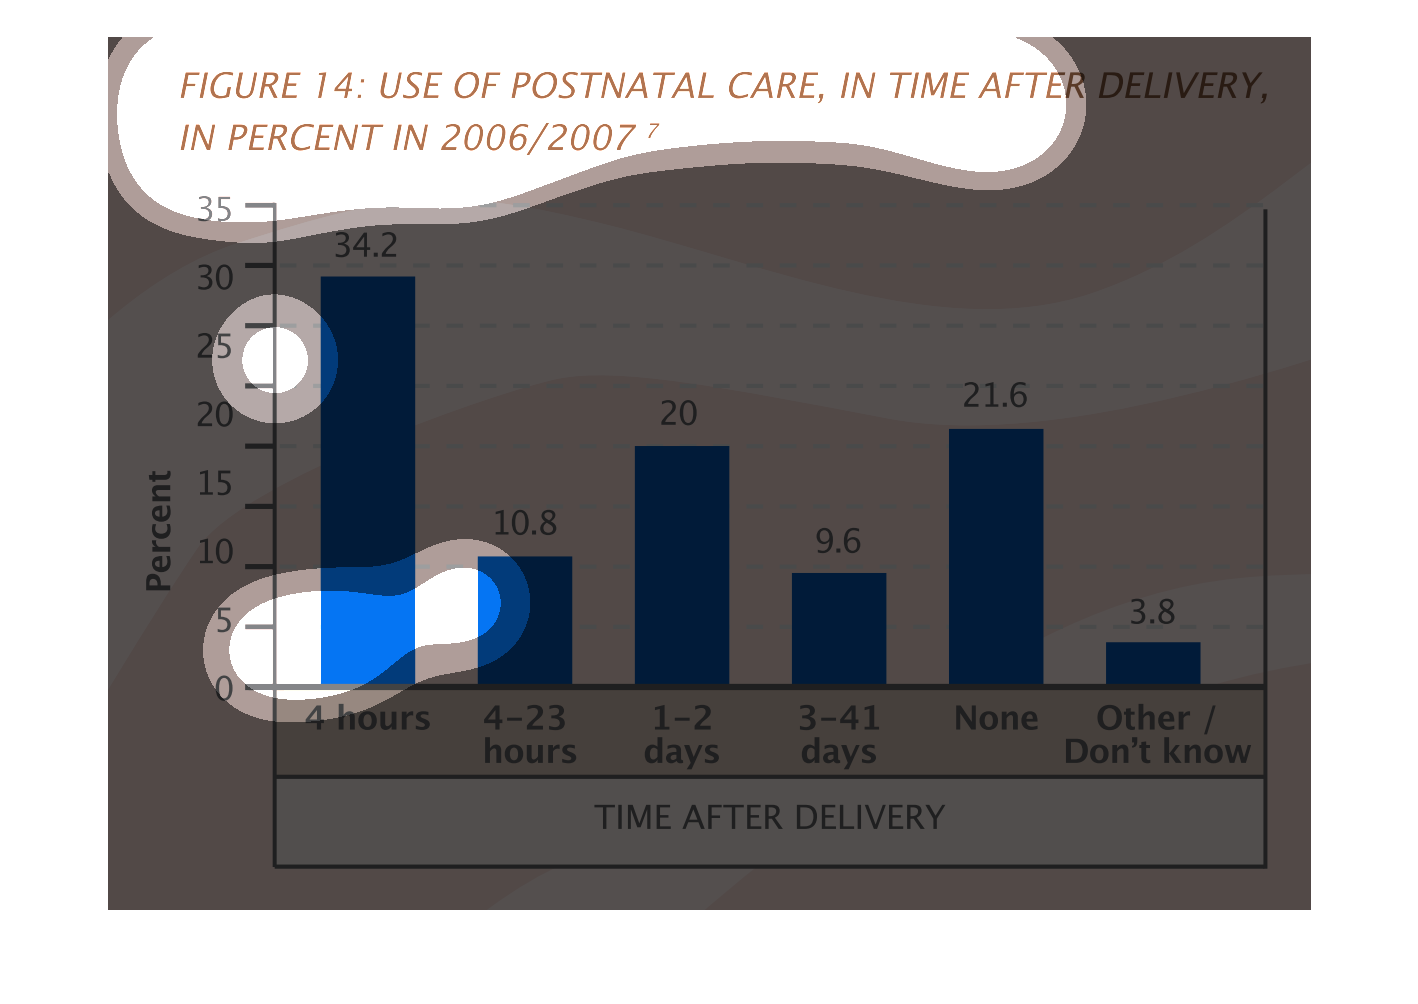
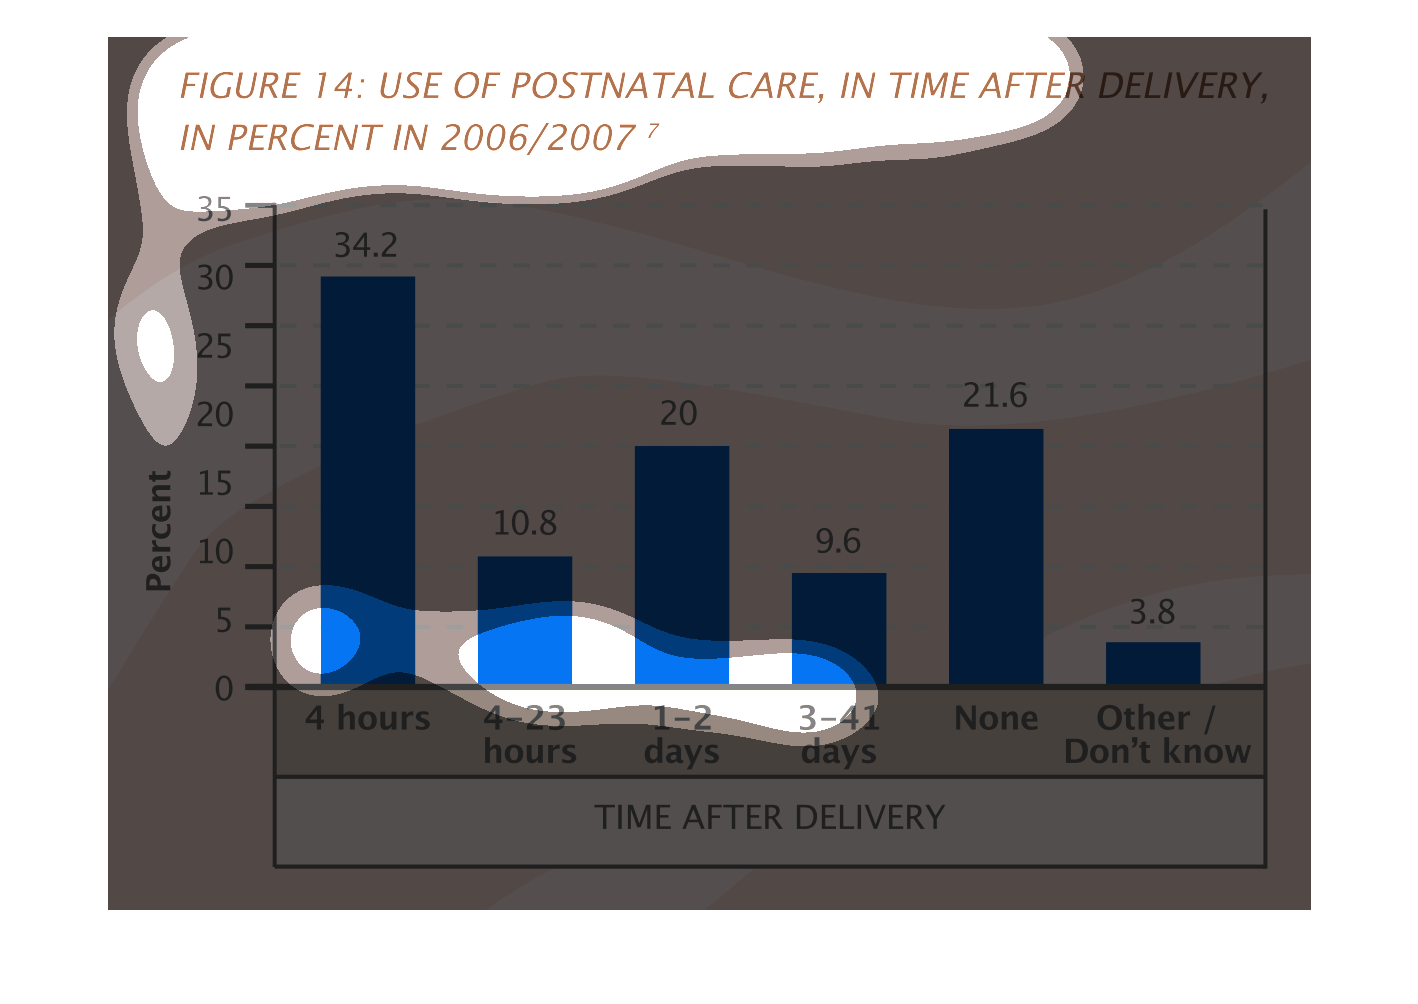
This image is a bar graph that shows the percentages of postnatal care used after delivery
in 2006/2007.  Percentages are listed on the left side of the graph.  Time after delivery
is broken into segments and each segment is given a bar.  For example, 4 hours has a bar,
4-23 hours has a bar etc. up to 3-41 days as well as none and don't know.  The bars are then
raised to show the percentages that apply to each time frame.
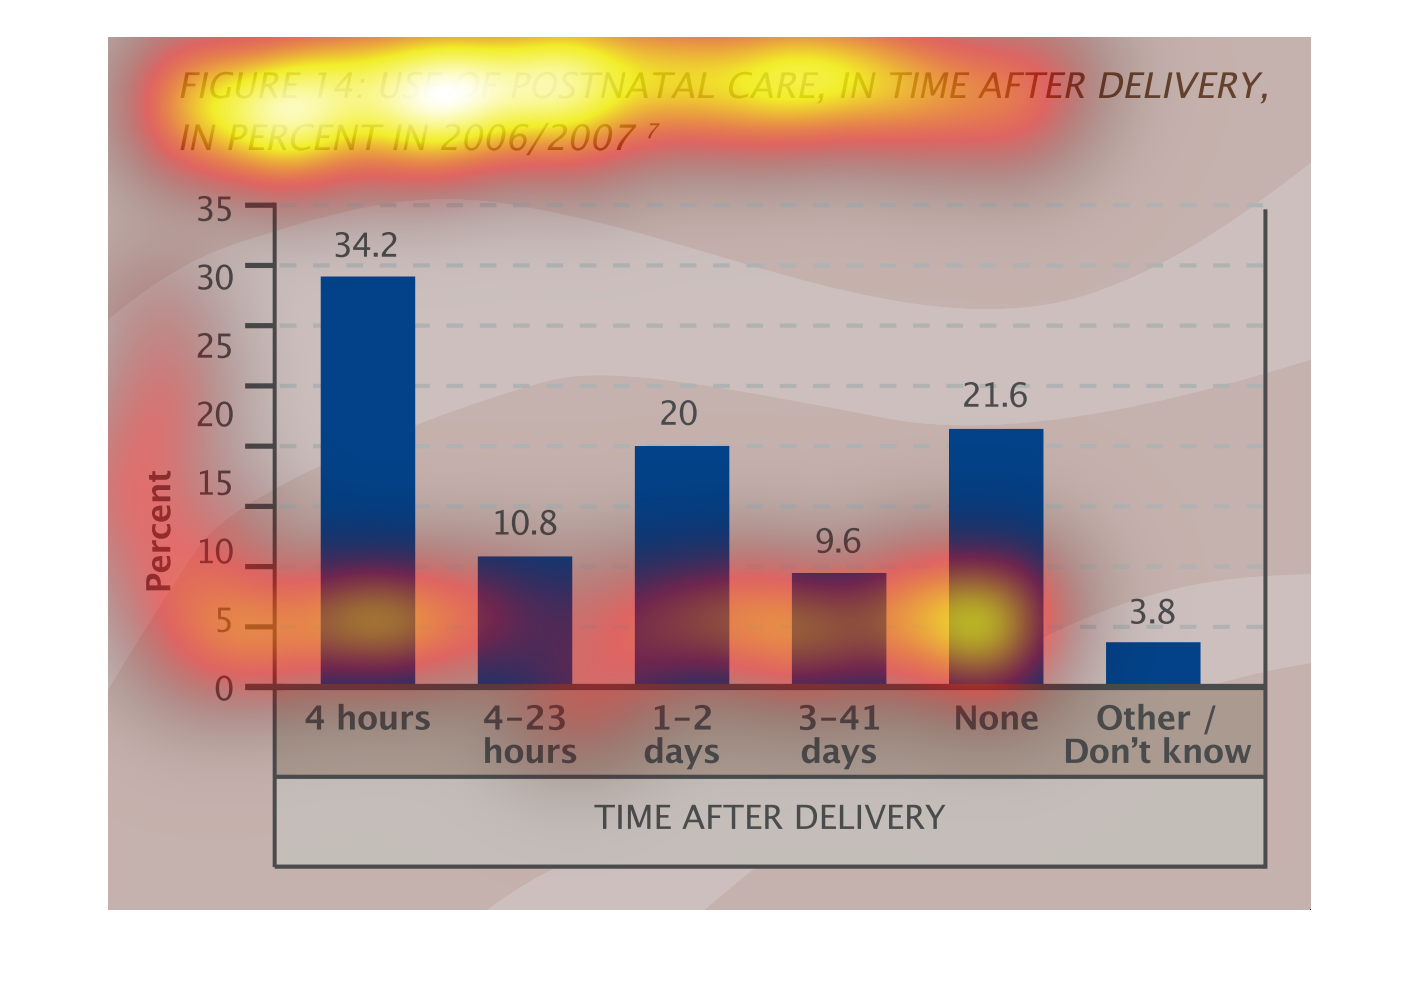

This chart describes use of postnatal care, in time after delivery in percent, for the year
2006/2007. The highest spike on the chart occurs for the category of 4 hours.
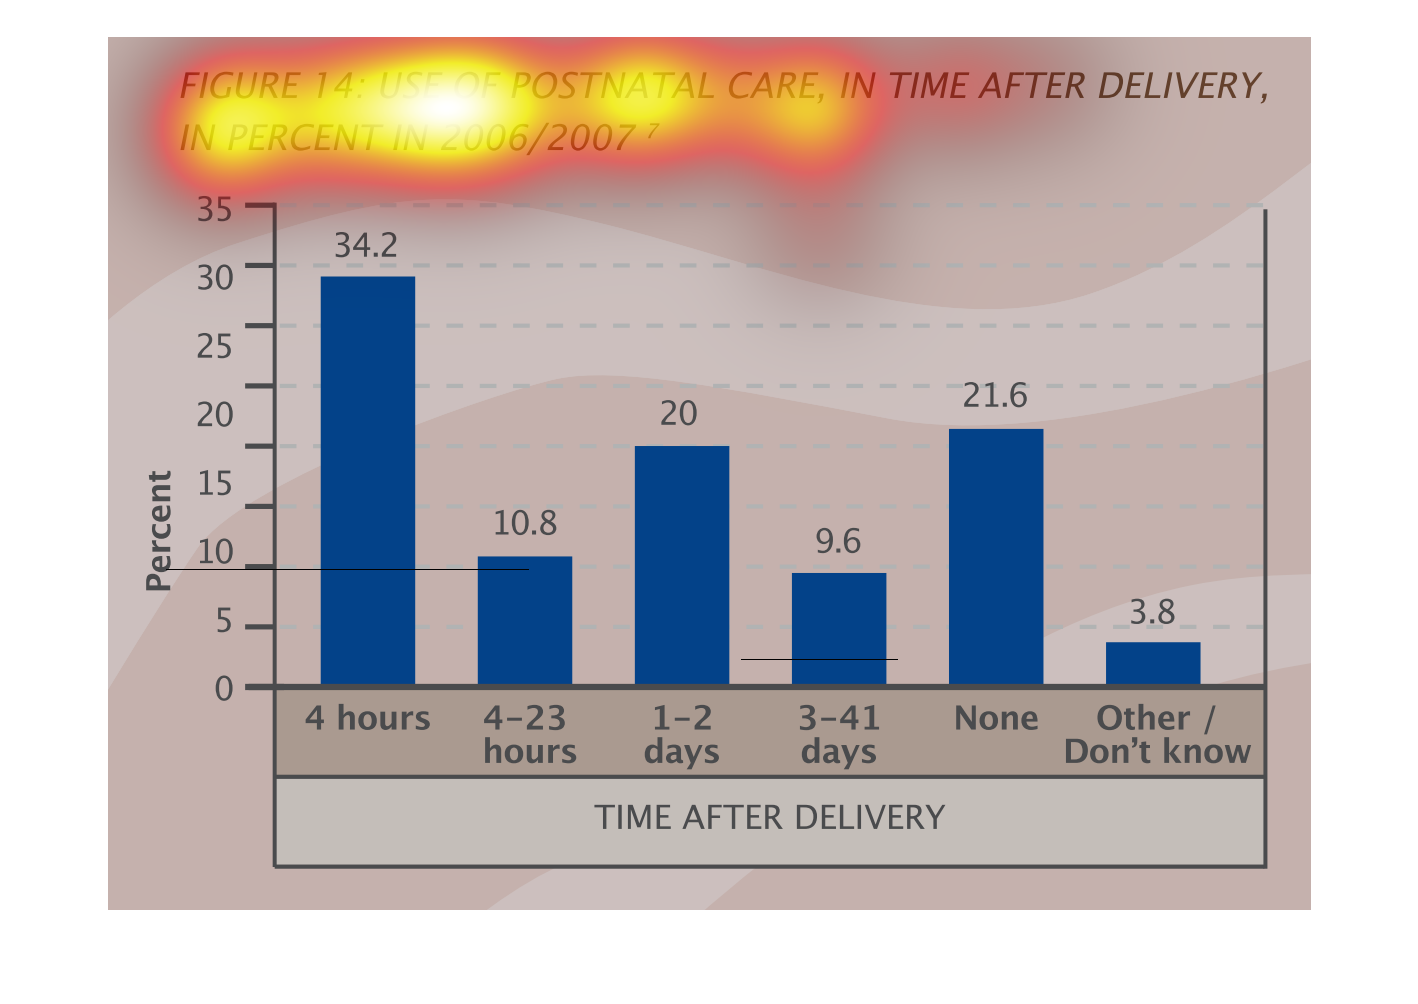
This chart shows the percent of  postnatal care after birth in 2006/2007. The chart shows
the time after birth that postnatal care occured and the percent of postnatal care that happened
during that time frame.
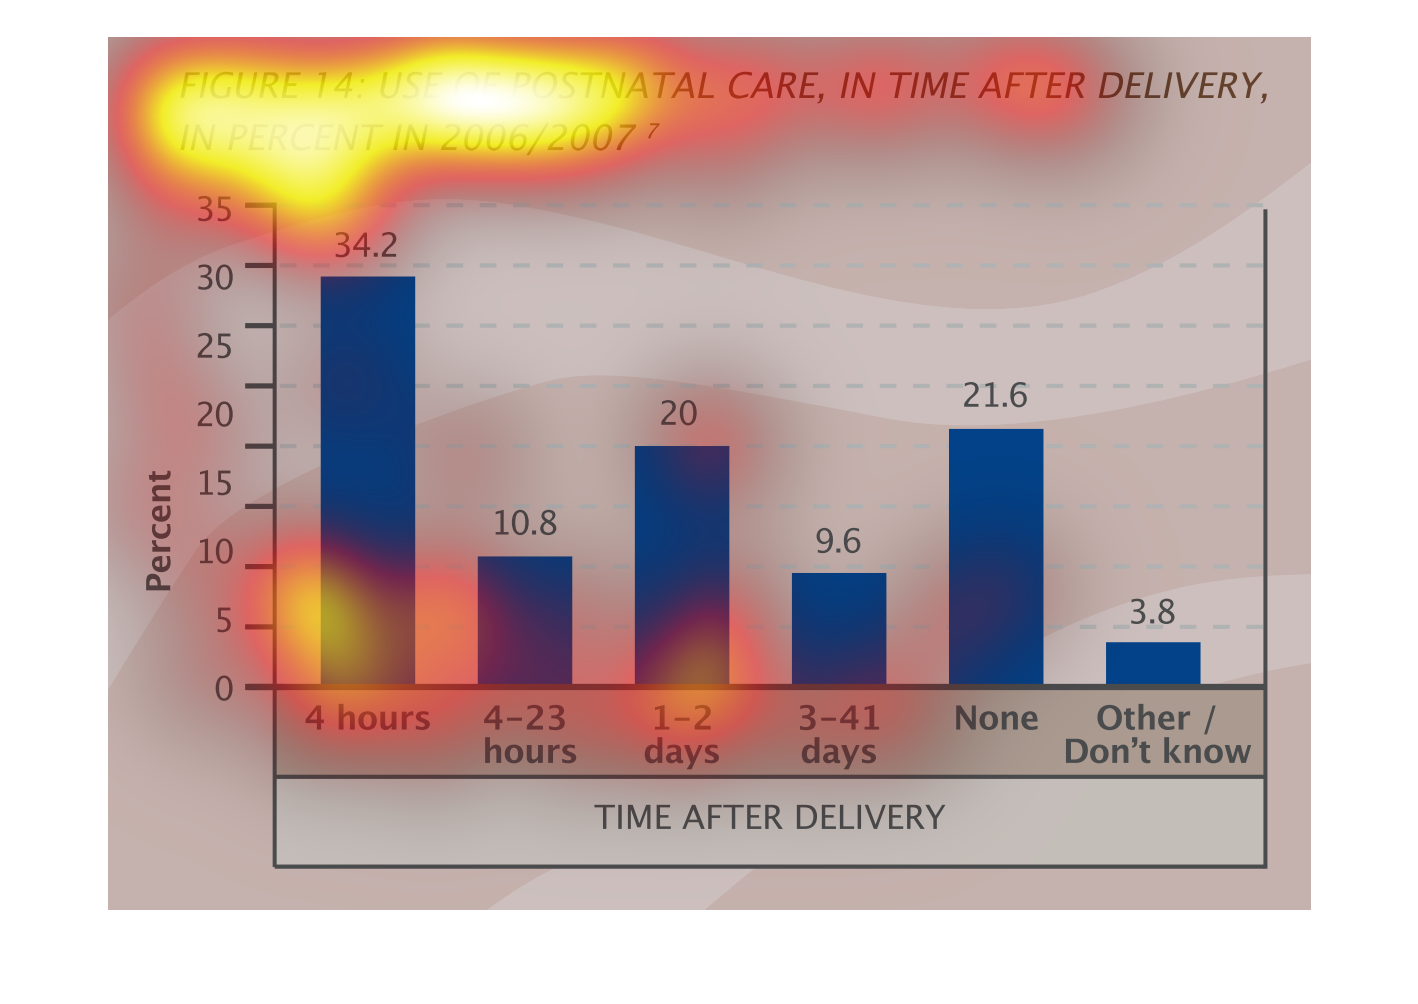
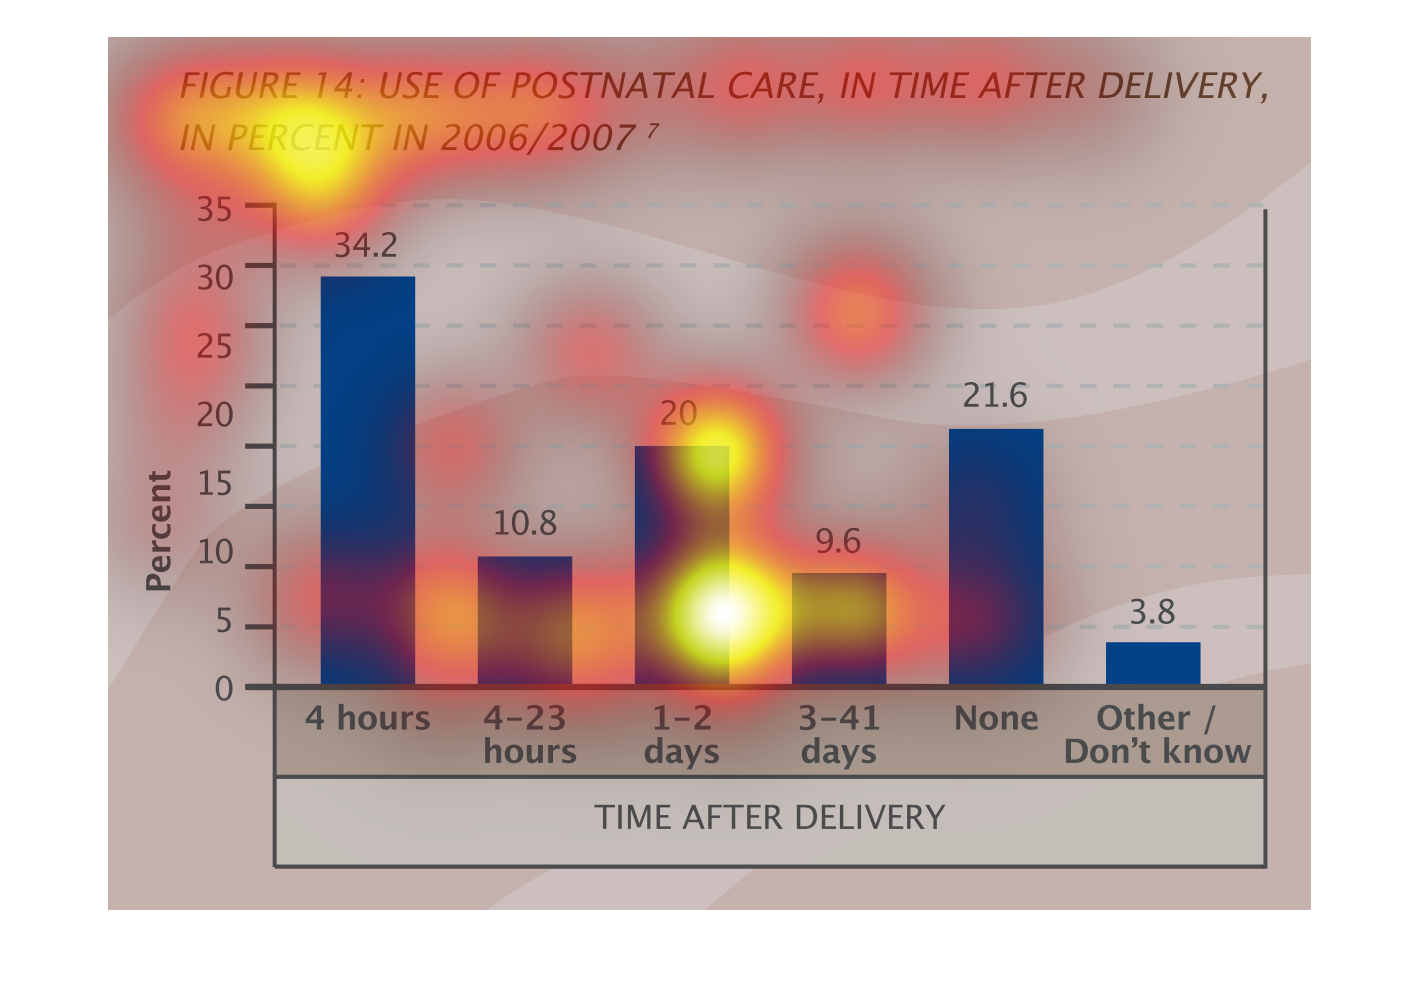
The graph depicts, use of postnatal care, in time(hours) after delivery in percent 2006/2007.
The majority of women in the study, received postnatal care with in the first 4 hours of birth.
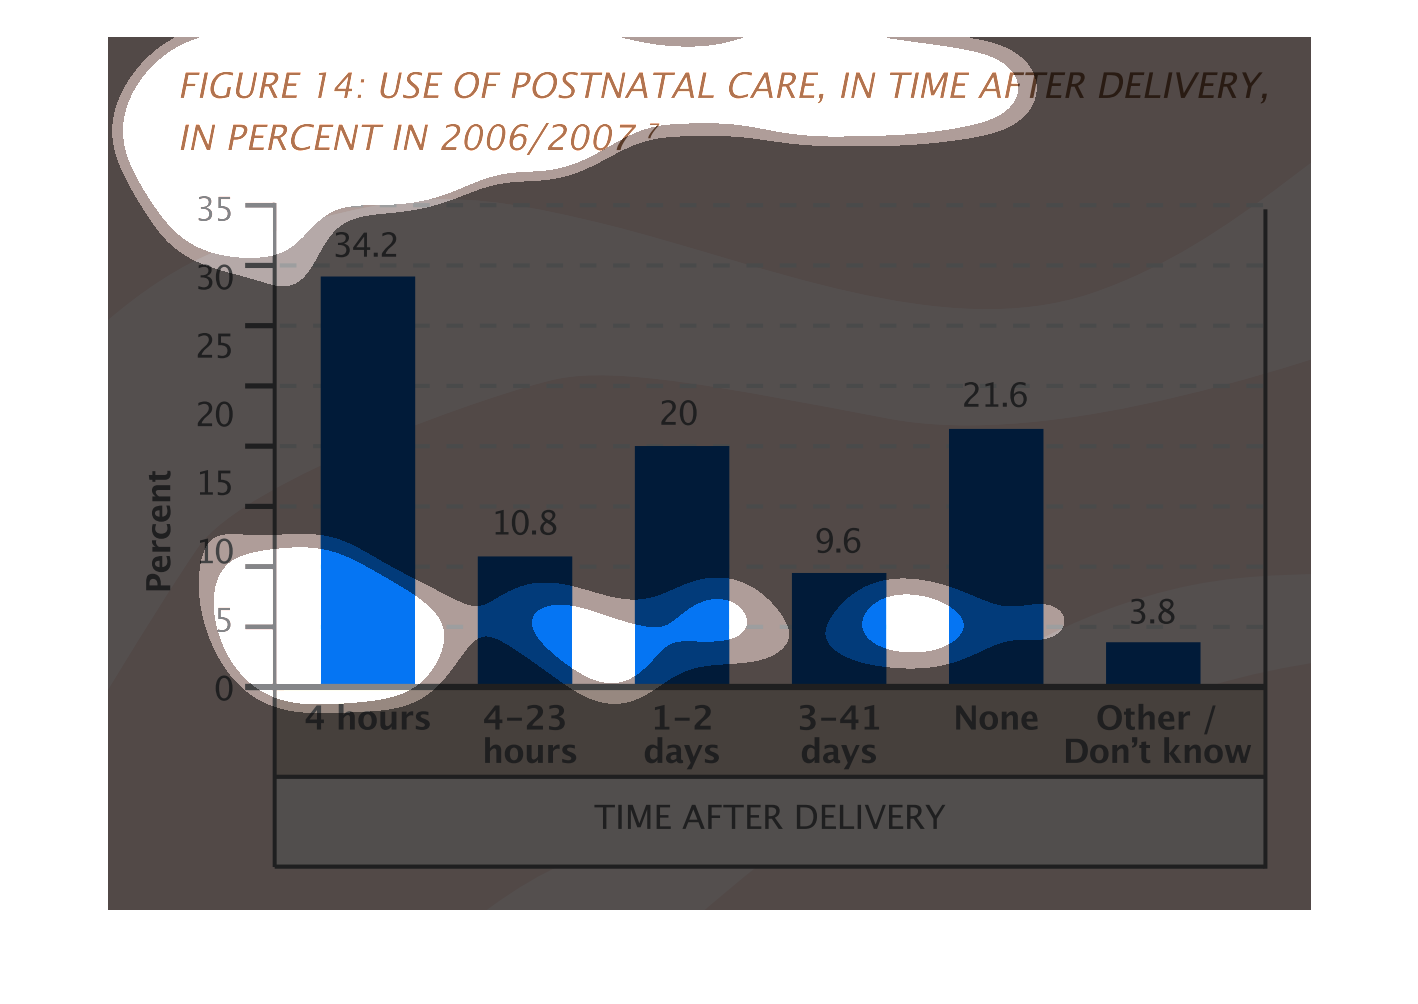
The graph describes the use of postnatial care after delivery in percentage in 2006/2007.The
largest portion is women 34.2 used 4 hours. The smallest portion of women used a time not
described in the graph or they did not know