This chart describes use of postnatal care as per education level, in percent. Categories
on the chart include no education, incomplete primary, and complete primary.
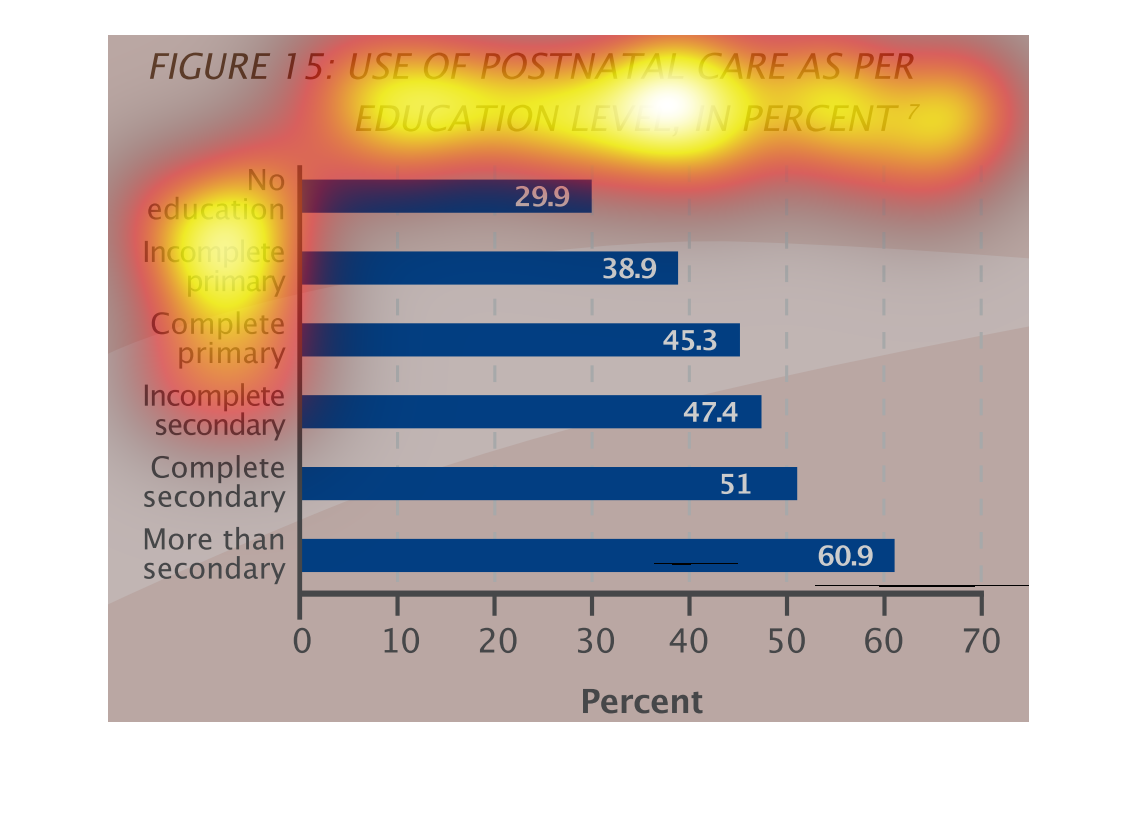
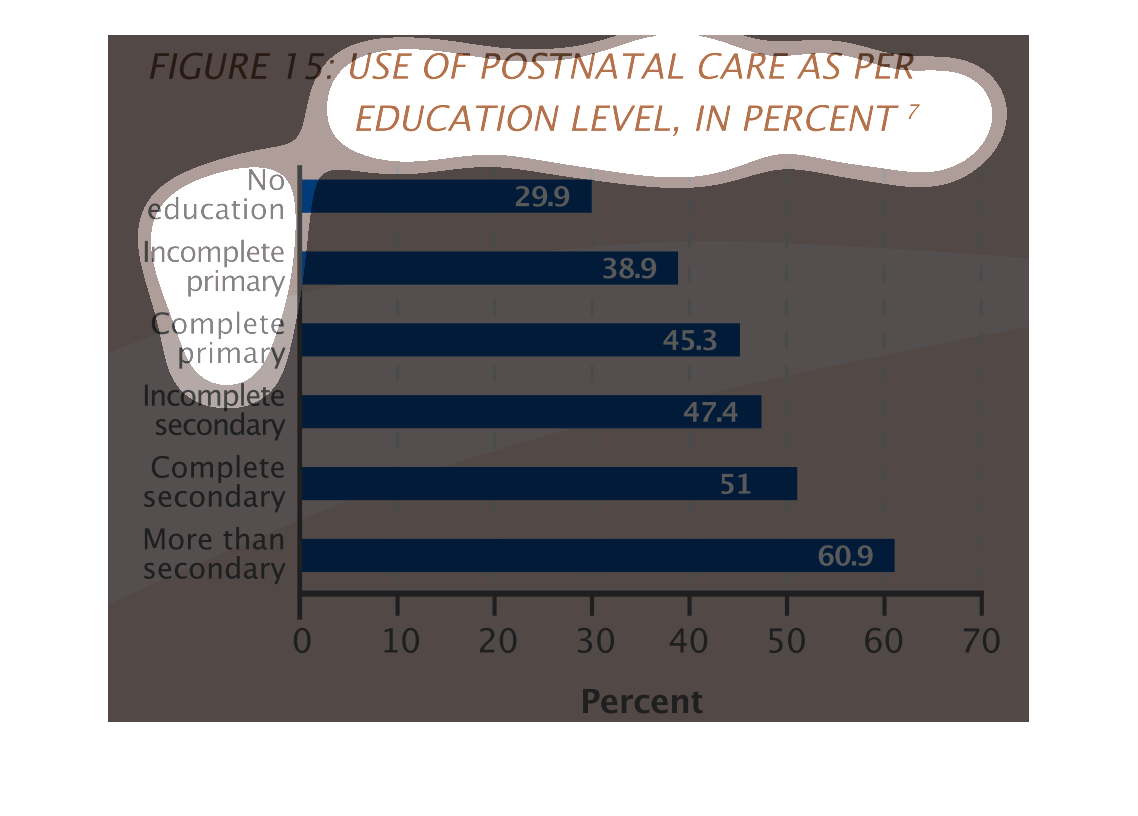
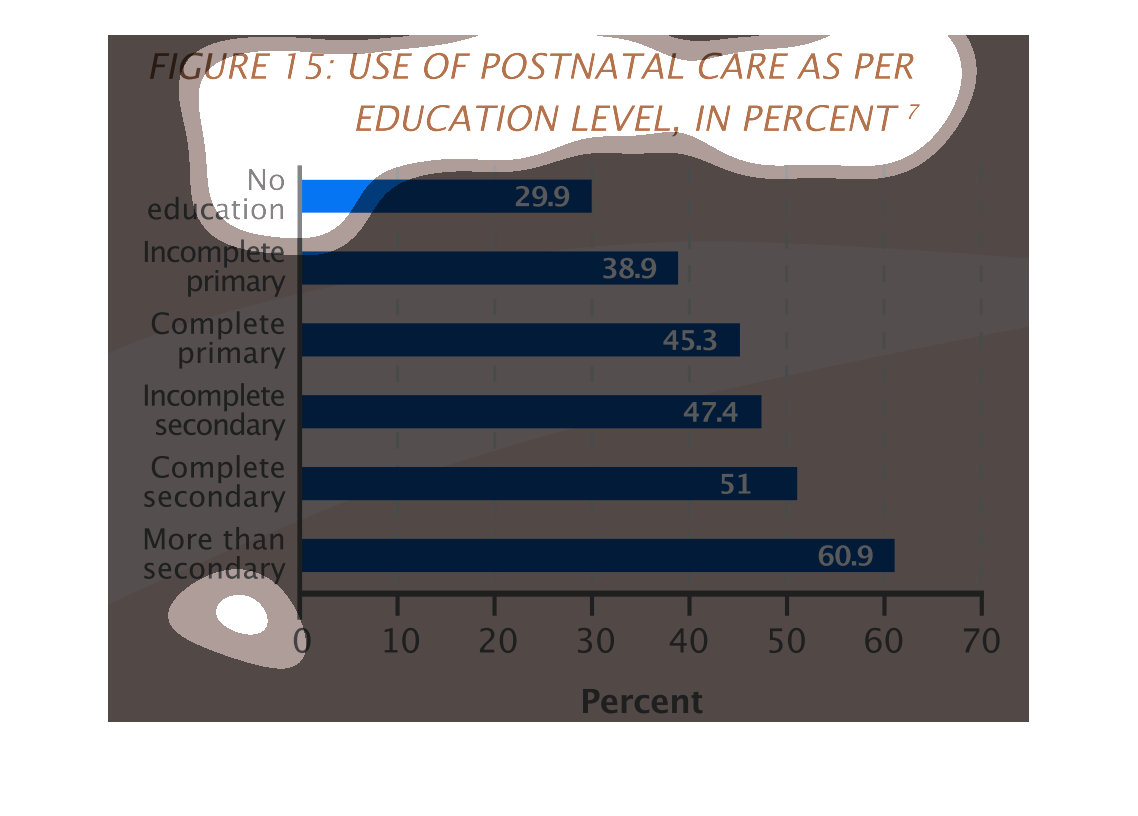
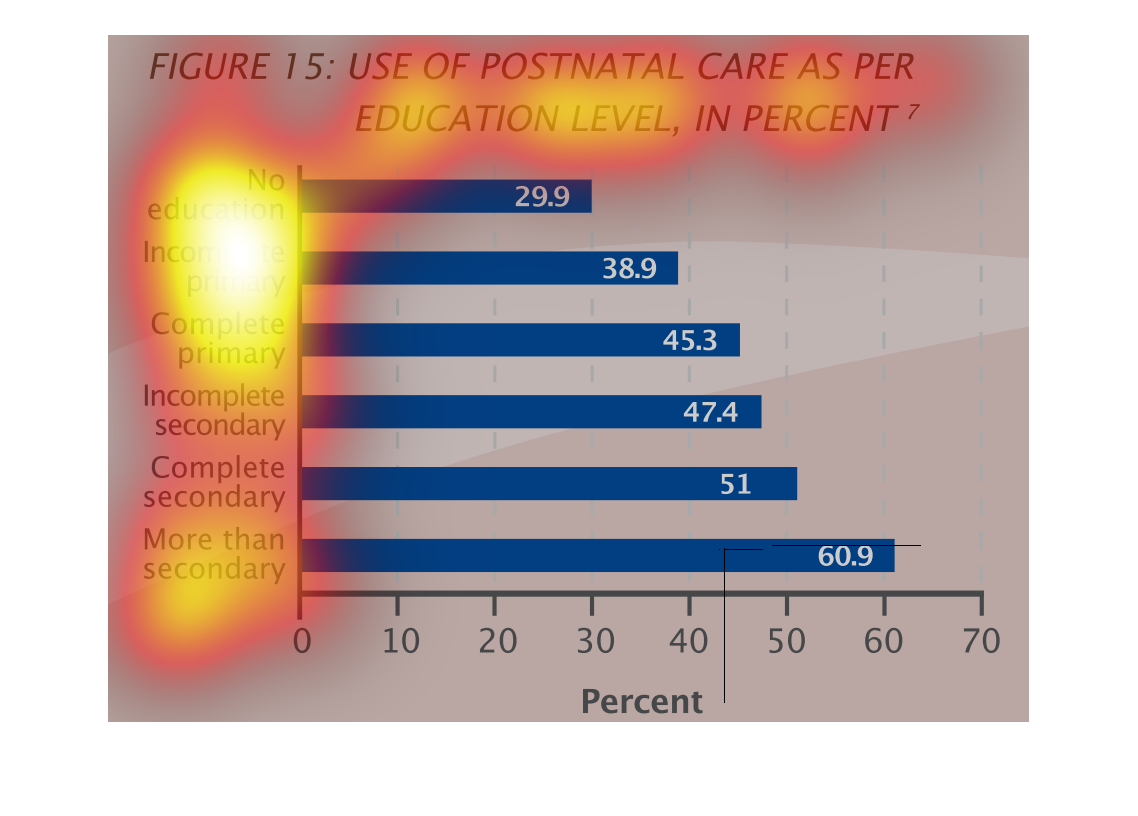
Figure 15 shows use of postnatal care as per education level, in percent. This blue bar graph
shows that postnatal care increases with increased education level.
Percent postnatal care per education level depicted in this bar chart showing the lowest percentage
(29.9) for no education, and the highest percentage (60.9) for more than secondary education.
 There are 6 categories, from no education to more than secondary education.
This is a series of bar graphs depicting the use of postnatal care as per education level
as a percentage. The group with the highest usage is from those with more than secondary education.
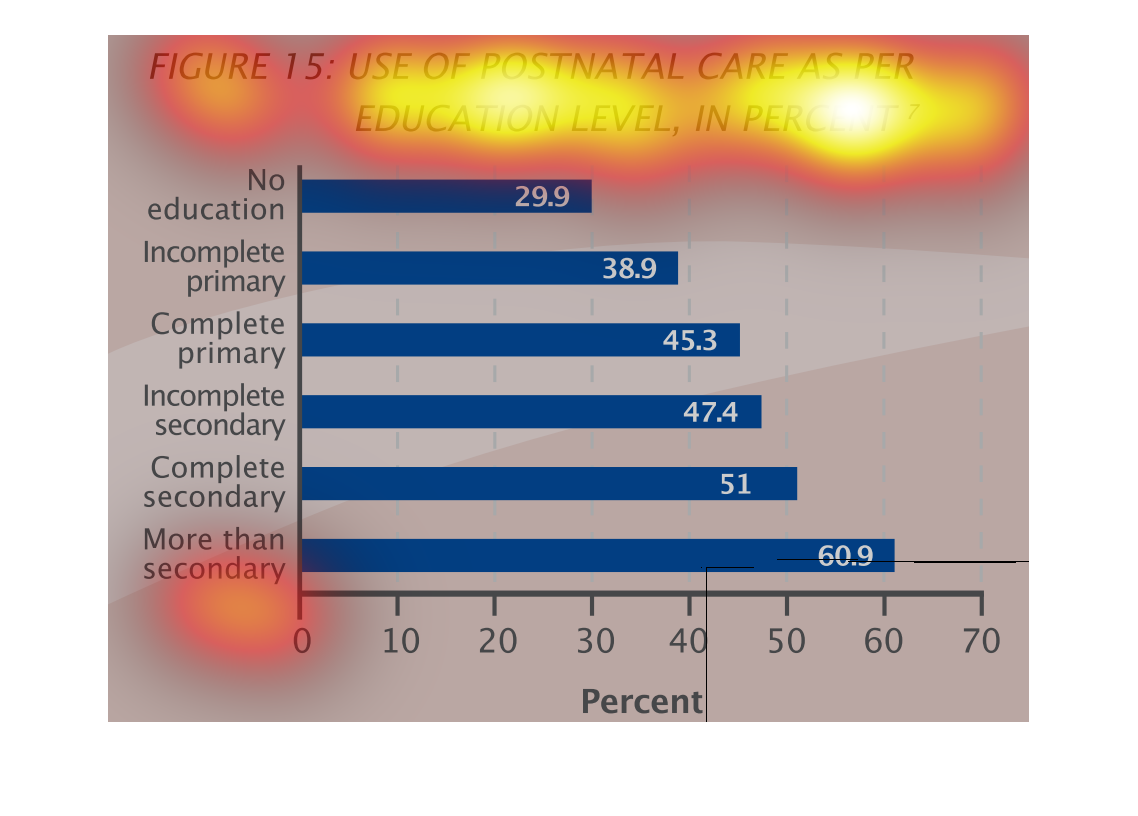
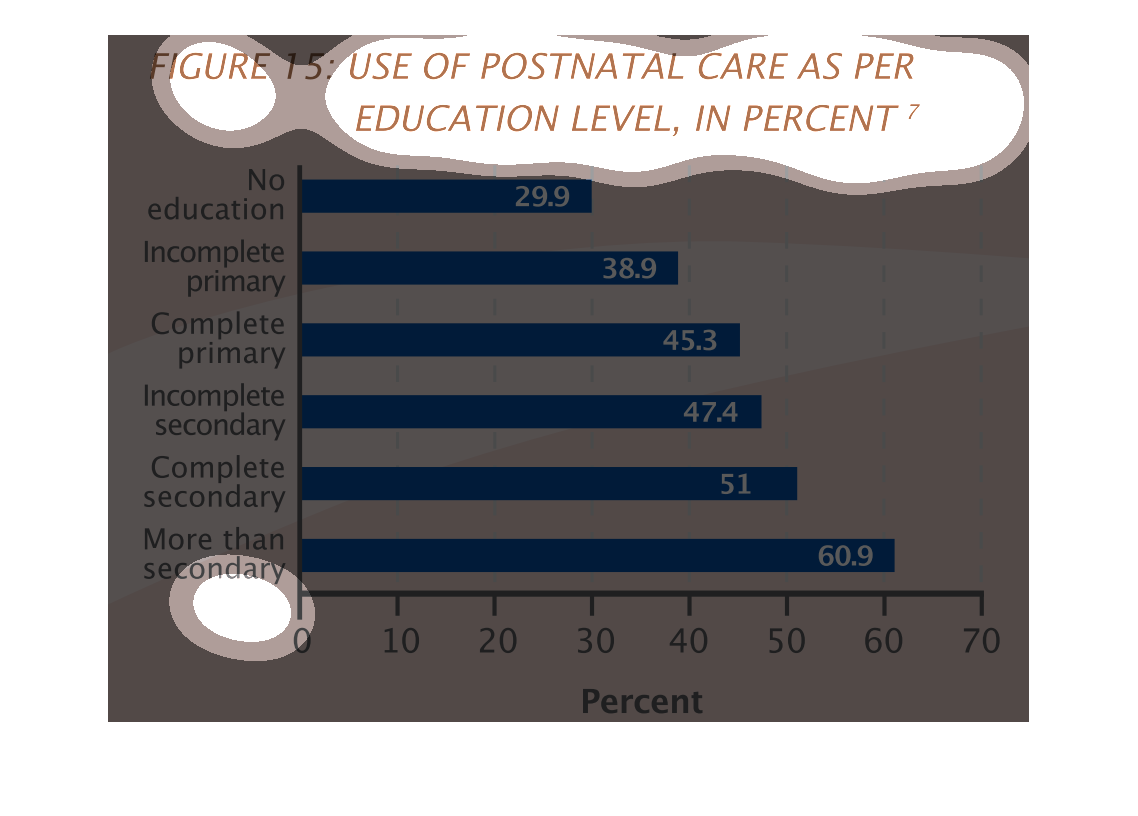
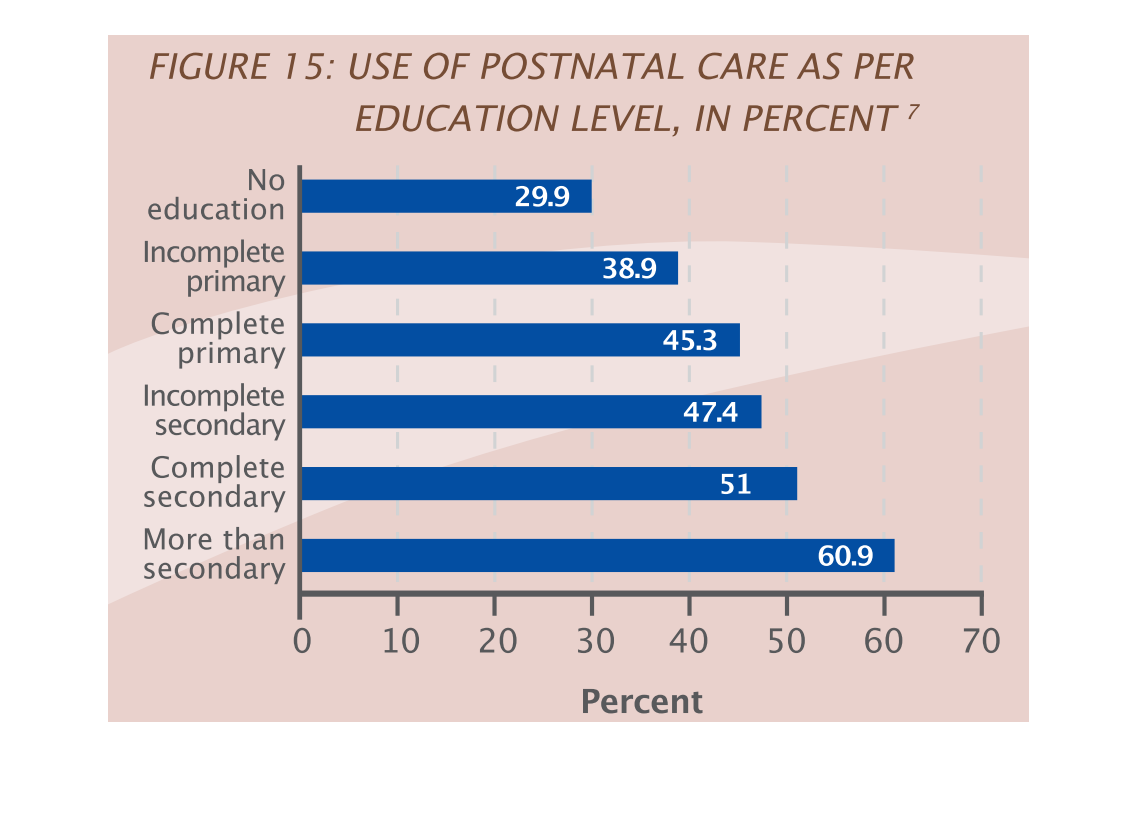
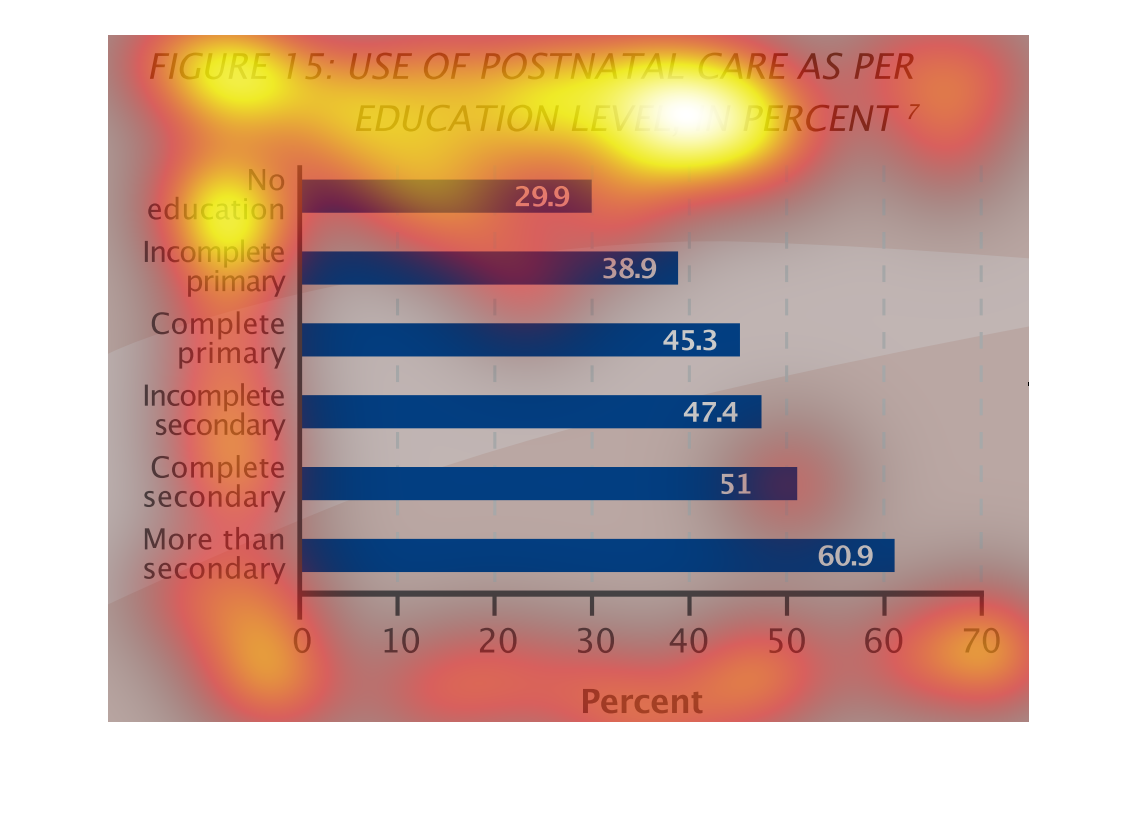
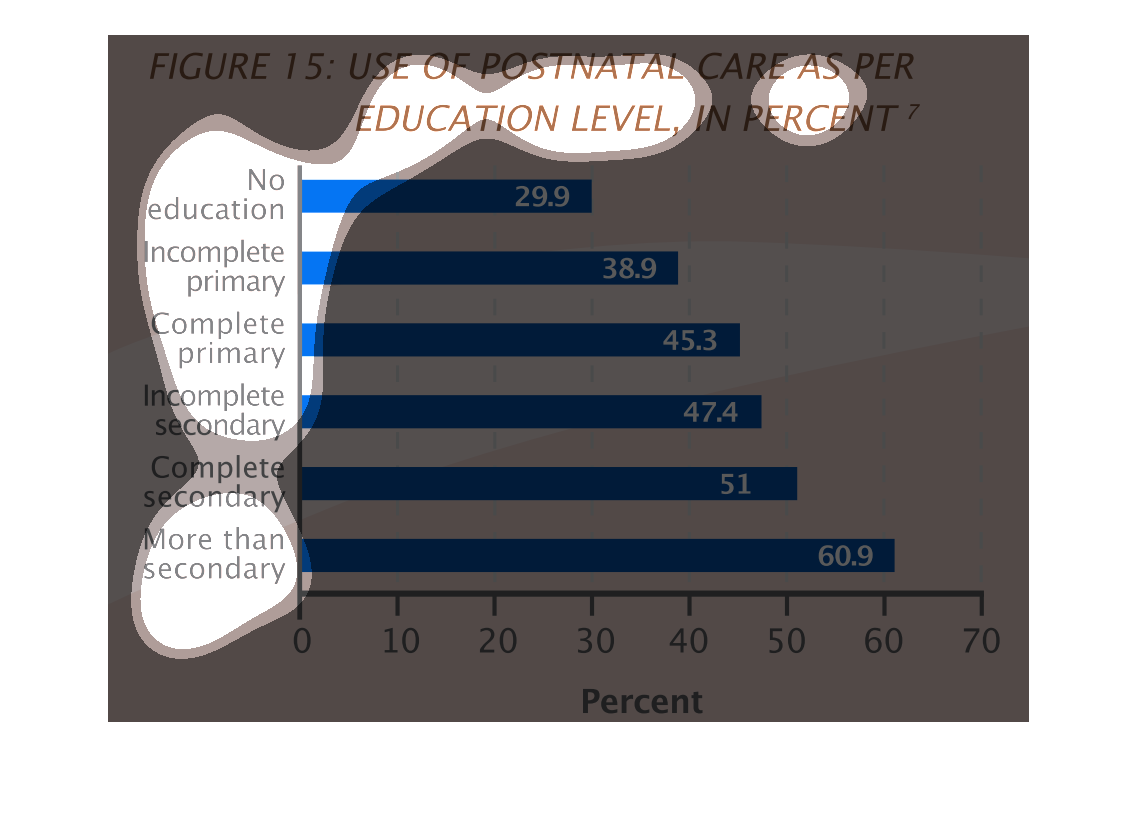
Figure 15 shows use of postnatal care per education level in percent. The bar graph shows
that postnatal care increases as education level increases. There is only approximately 30%
care with no education and nearly 61% with more secondary education.
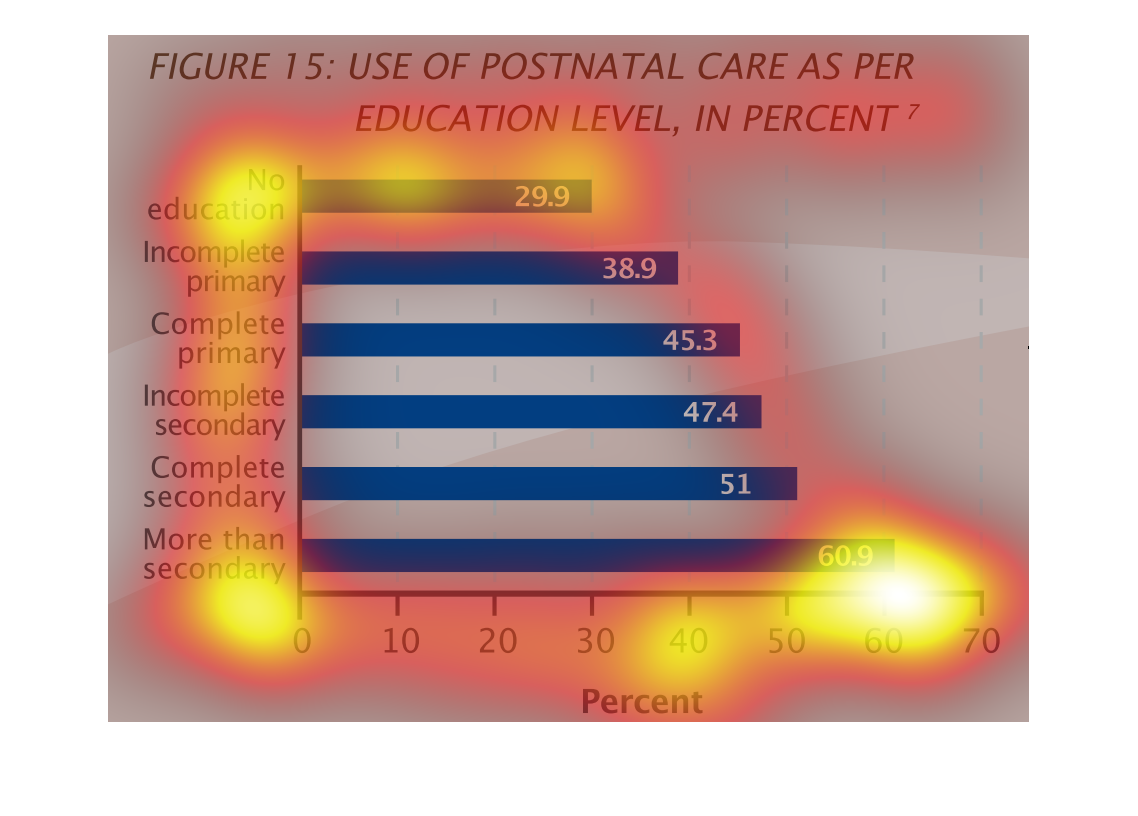
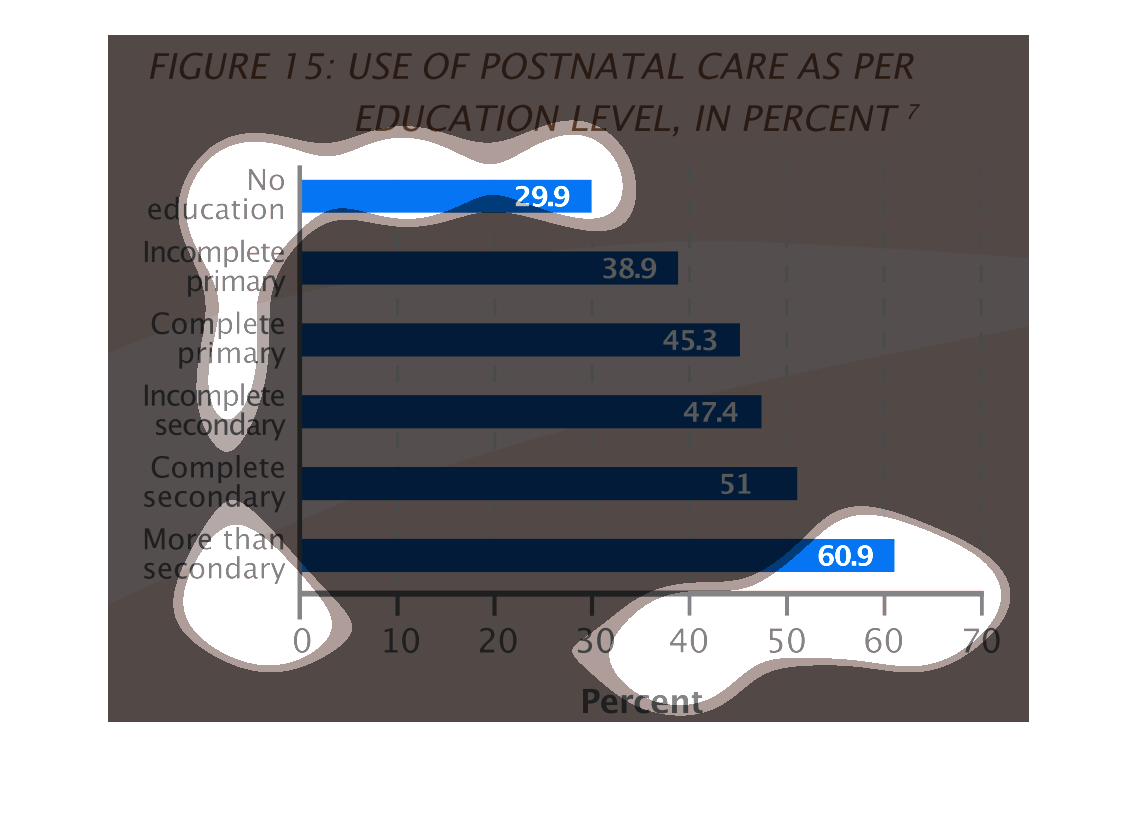
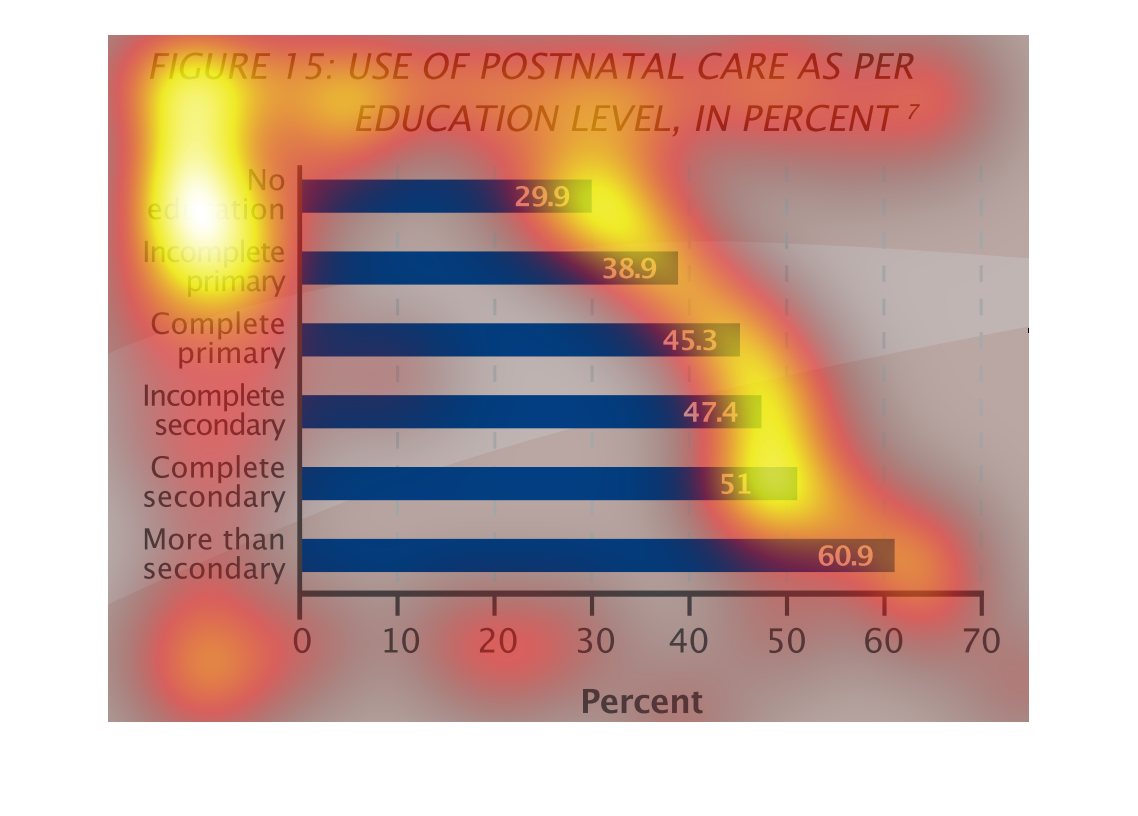
figure 15: use of postnatal care as per education level in percent. Y axis shows education
level, X axis shows percentage 0-70. A direct obvious correlation is seen between higher education
and higher percentage
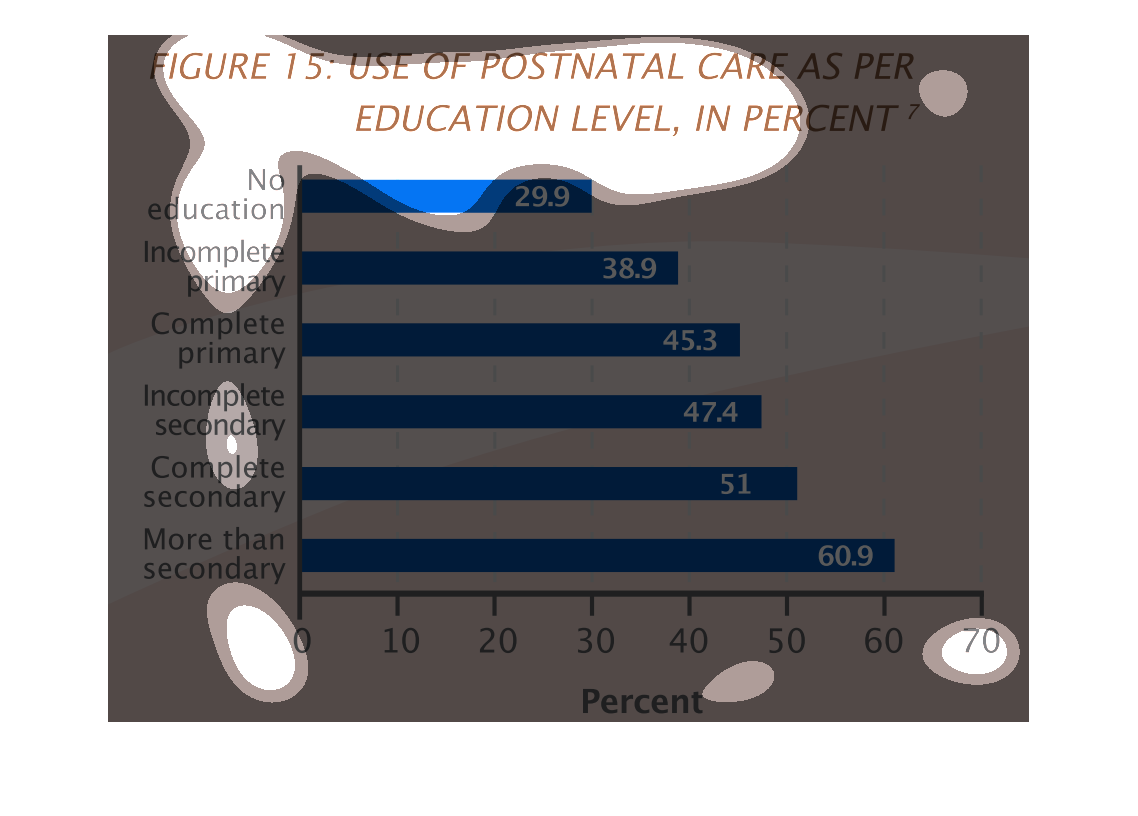
This chart describes the level of postnatal education care in comparison with education. This
chart shows that the higher ones educational level is the higher the percentage.
This chart describes use of postnatal care as per education level, in percent. Categories
on the chart include no education, incomplete primary, and complete primary.
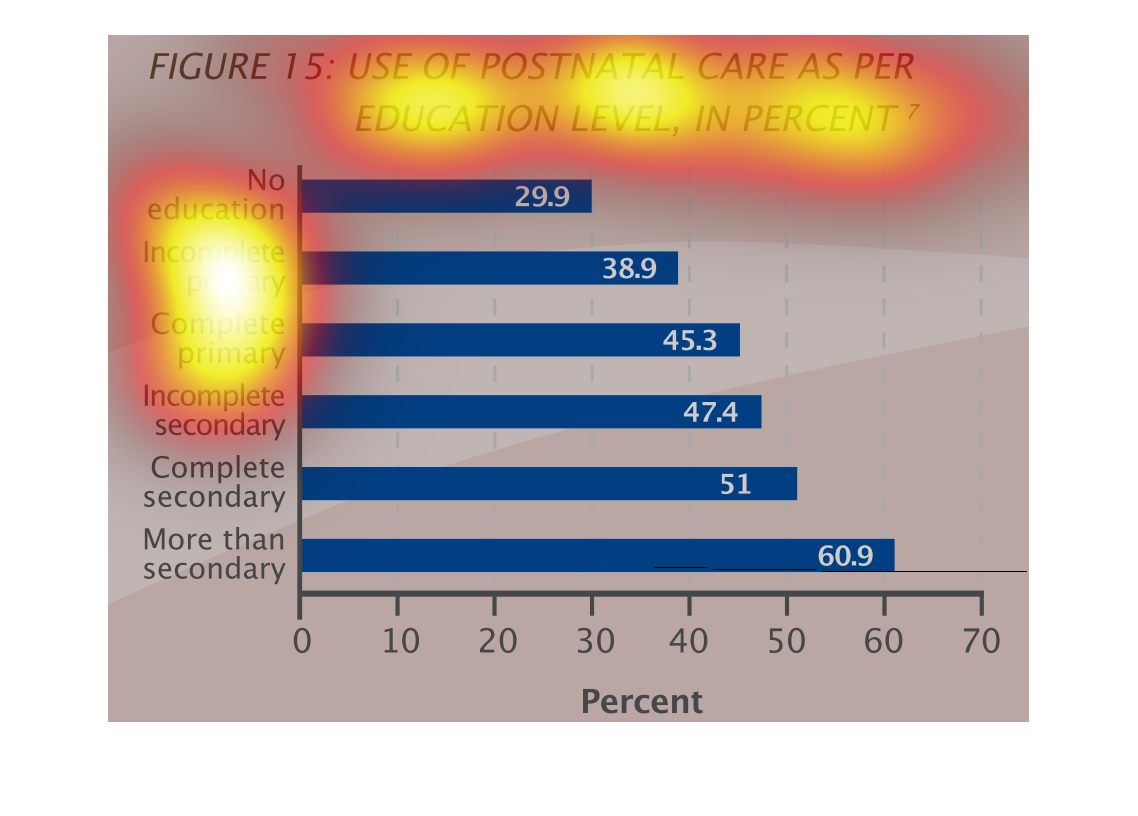
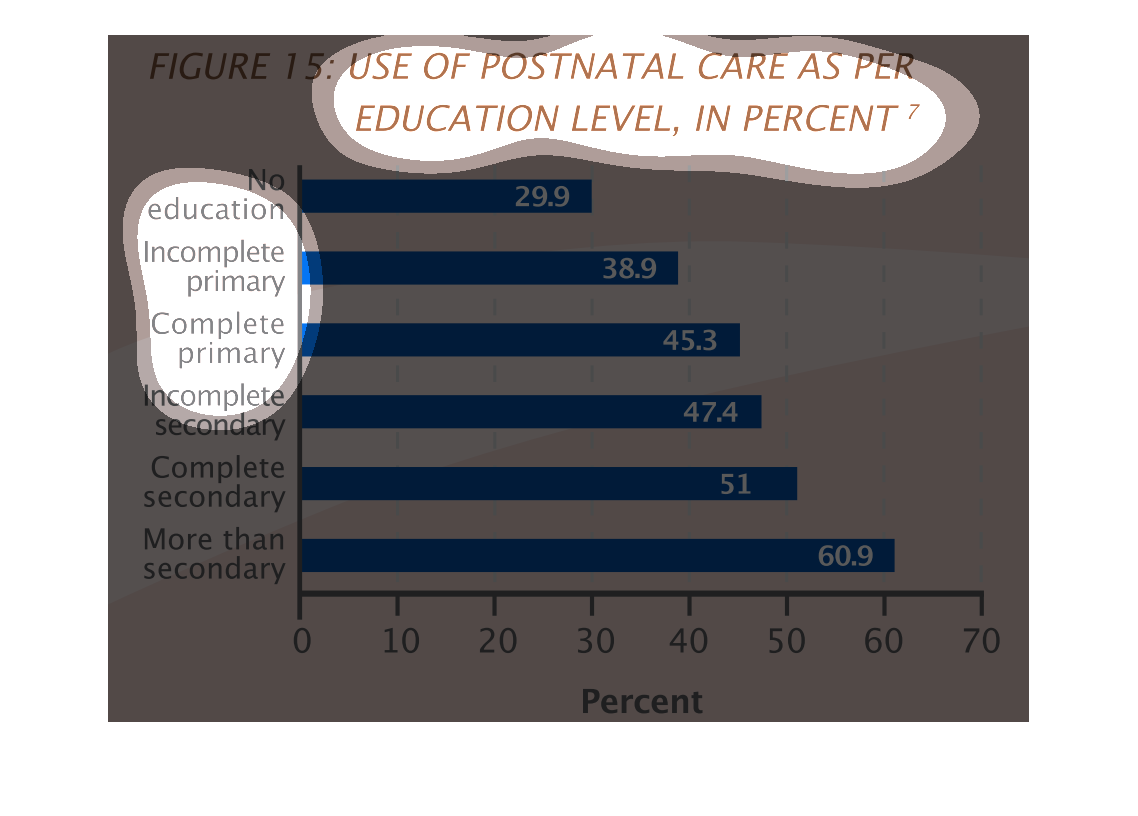
Chart showing the use of postnatal care as per education level in percent. From no education
up to more than secondary education and several categories in between.
This handmade chart shows the percent of people who use post natal care as it relates to the
educational attainment. Other than that It makes no sense.
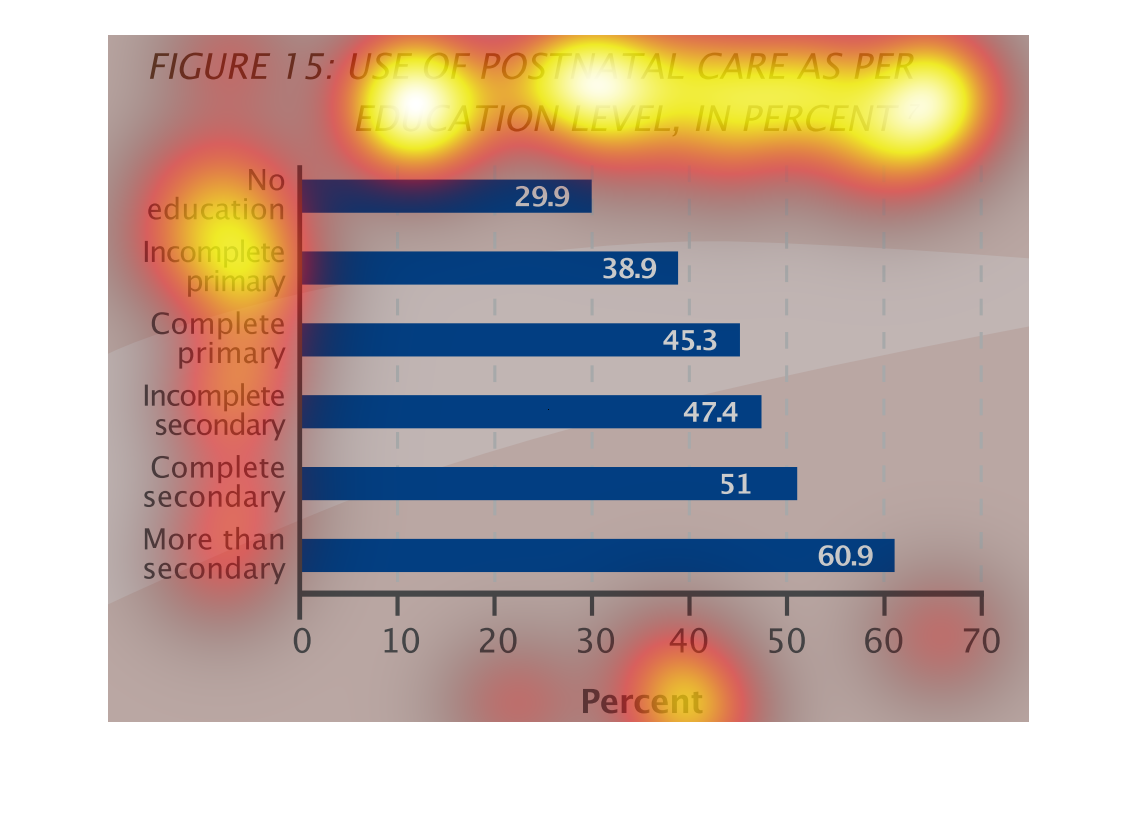
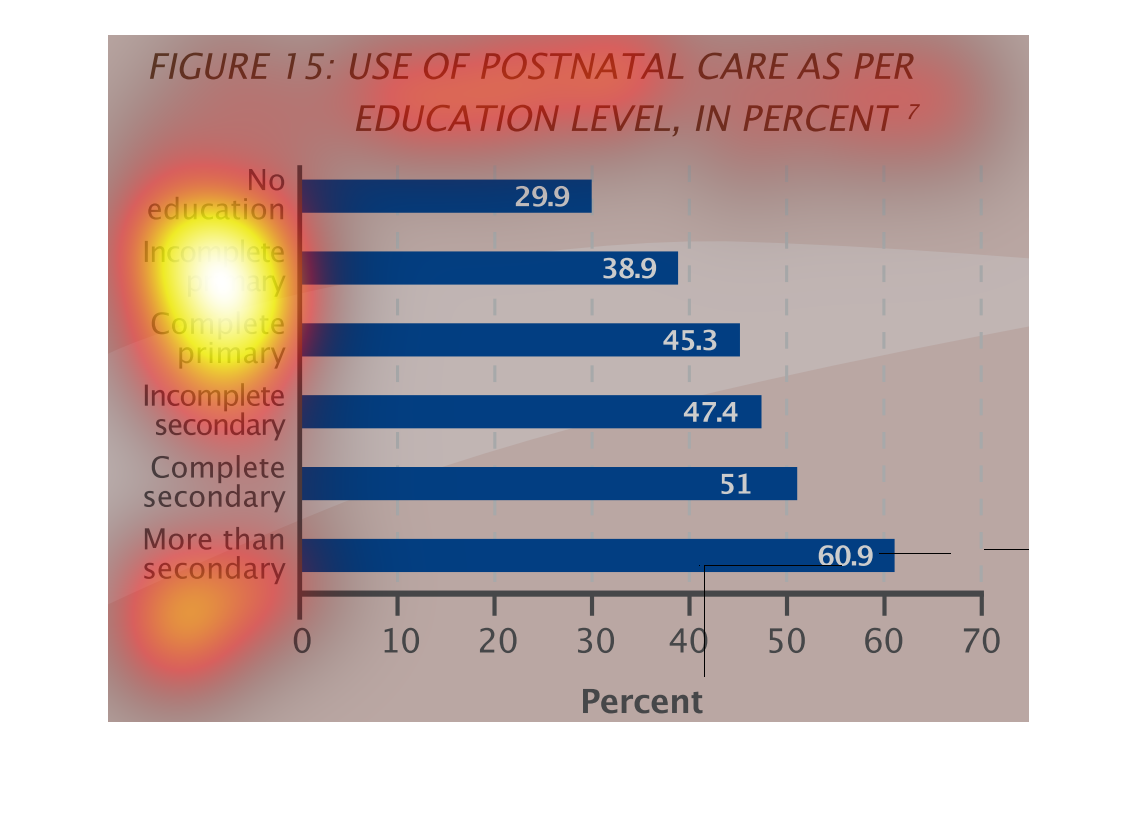
This graph depicts the use of postnatal care in relation to the level of education in percent.
A steady increase in percent care is seen as the level of education increases.
The chart shows the level of postnatal care based on education level. The levels that had
the lease postnatal care were no education and the areas that had the highest postnatal care
were those with more than secondary education.
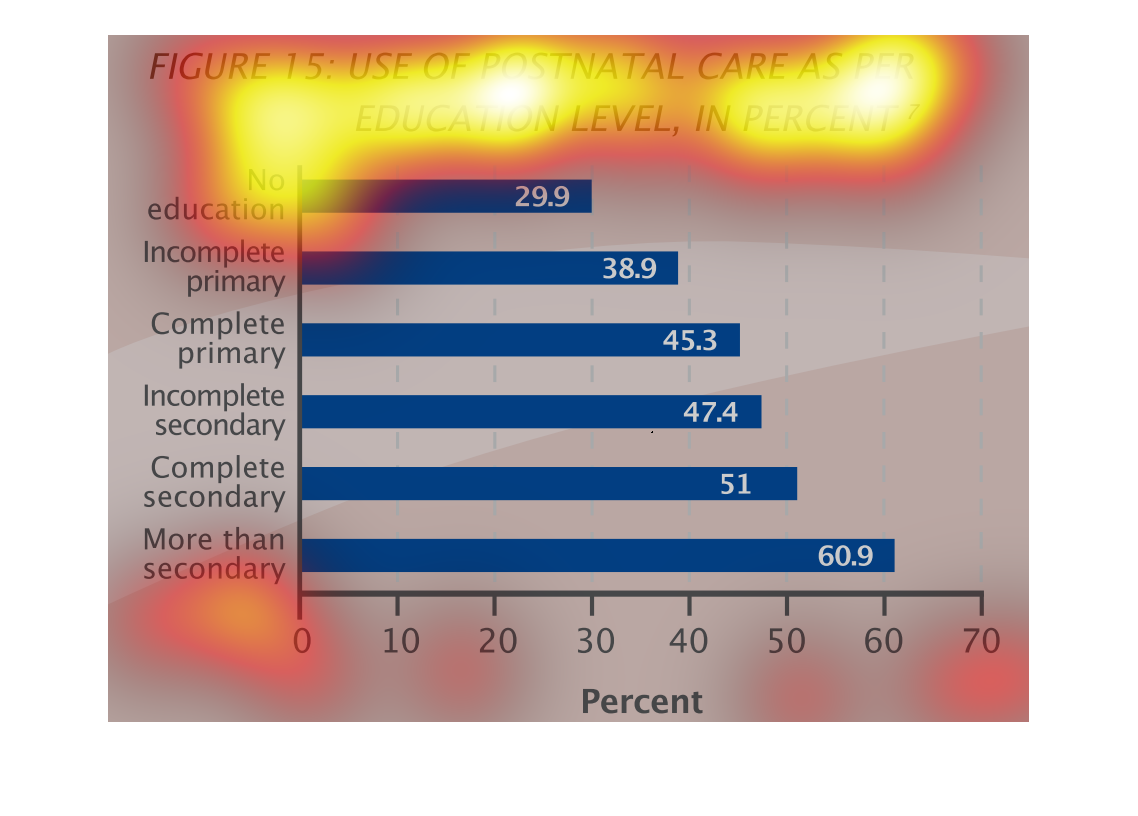
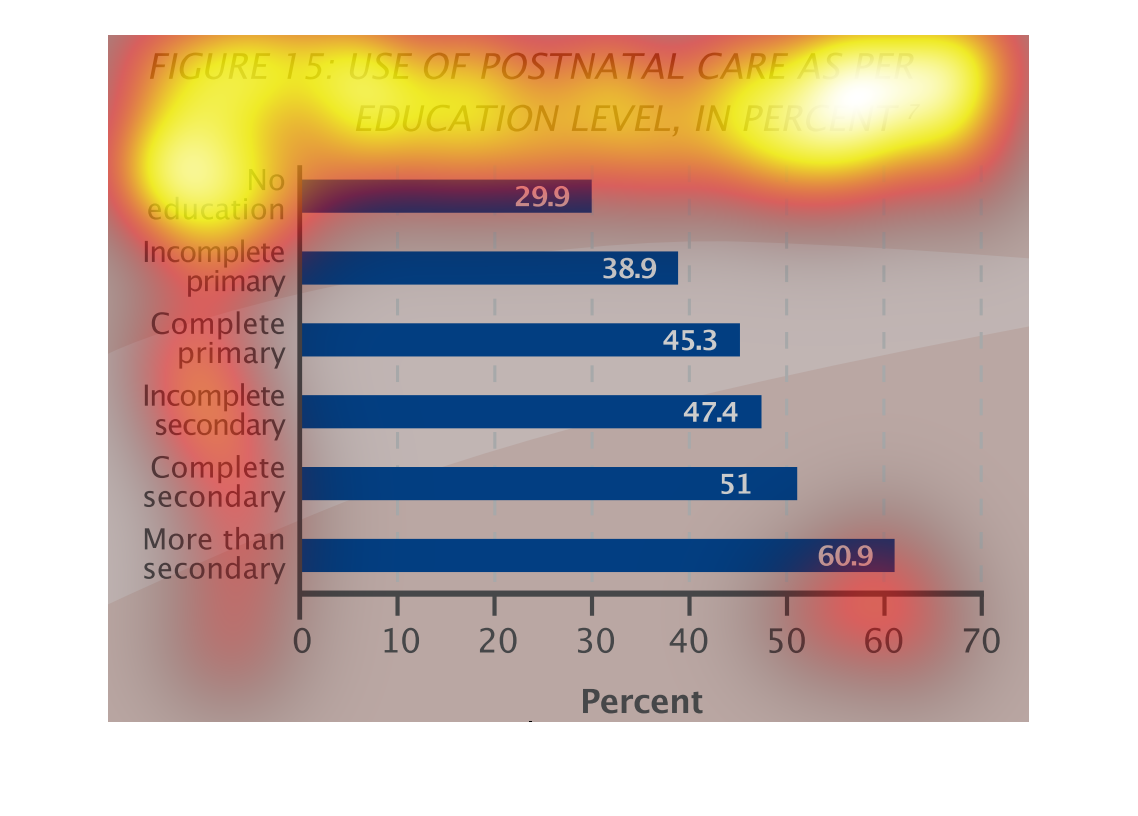
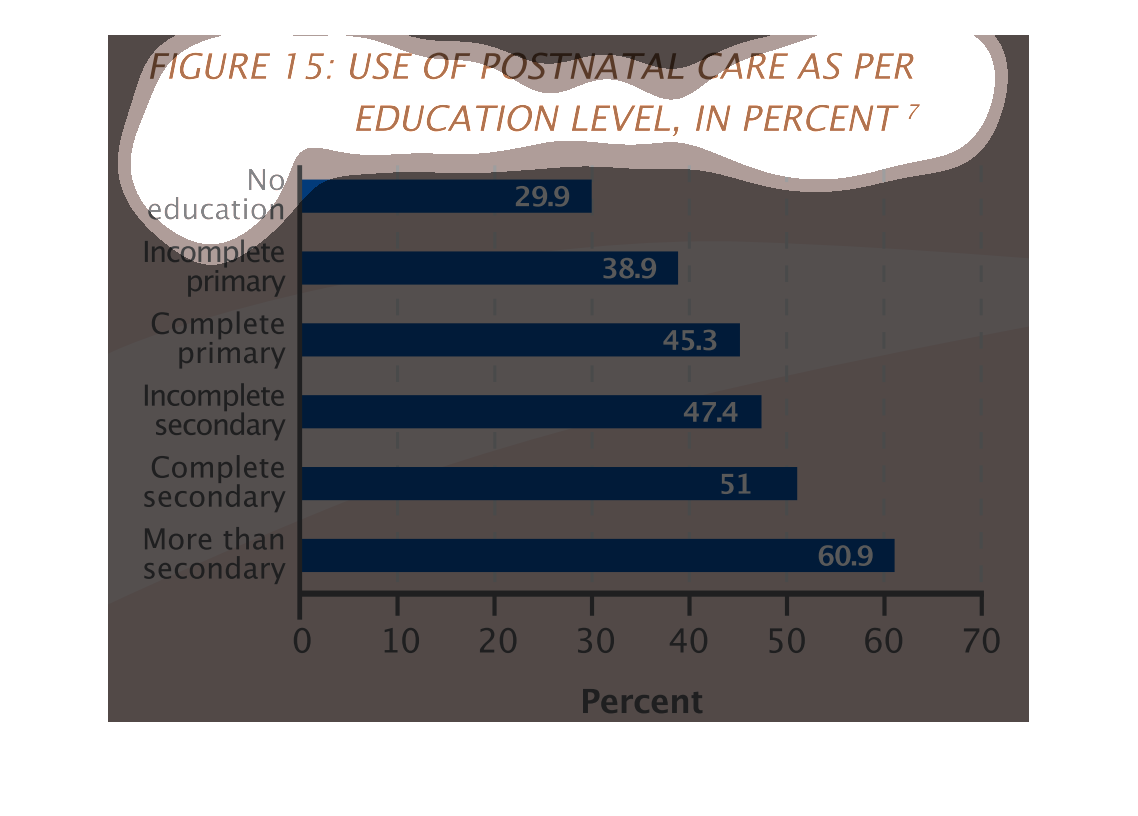
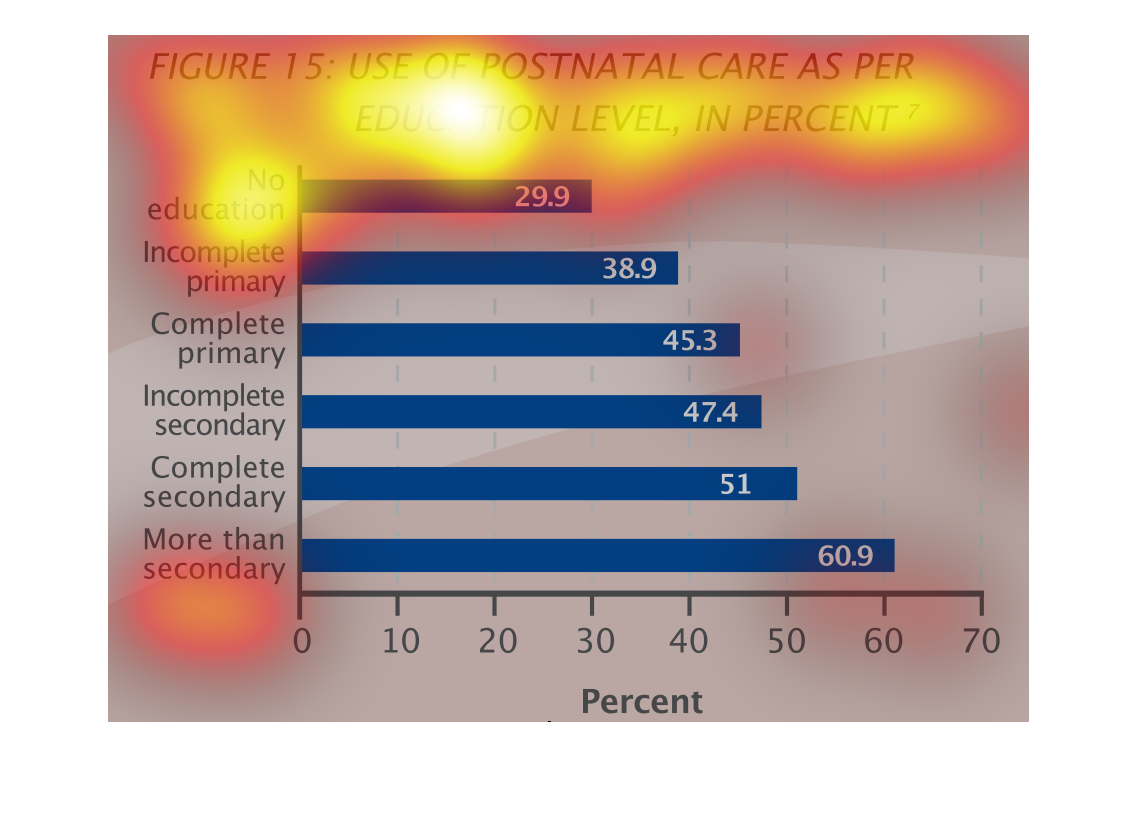
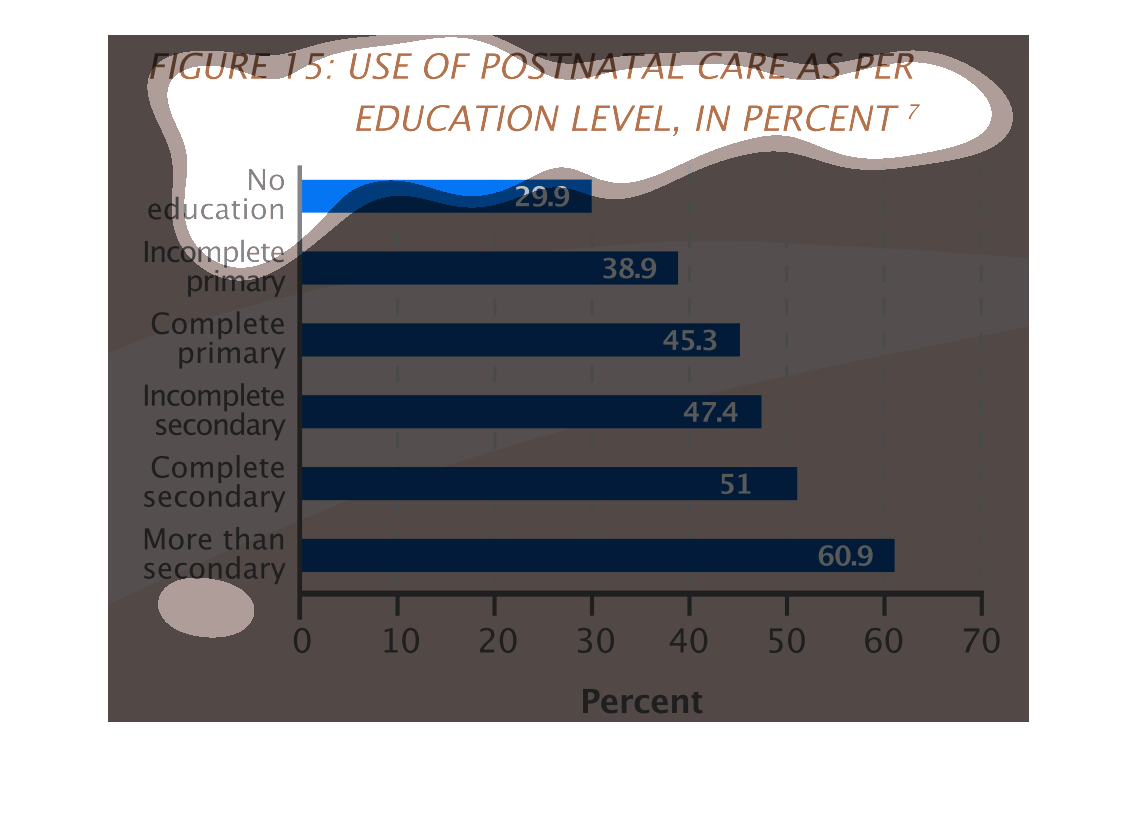
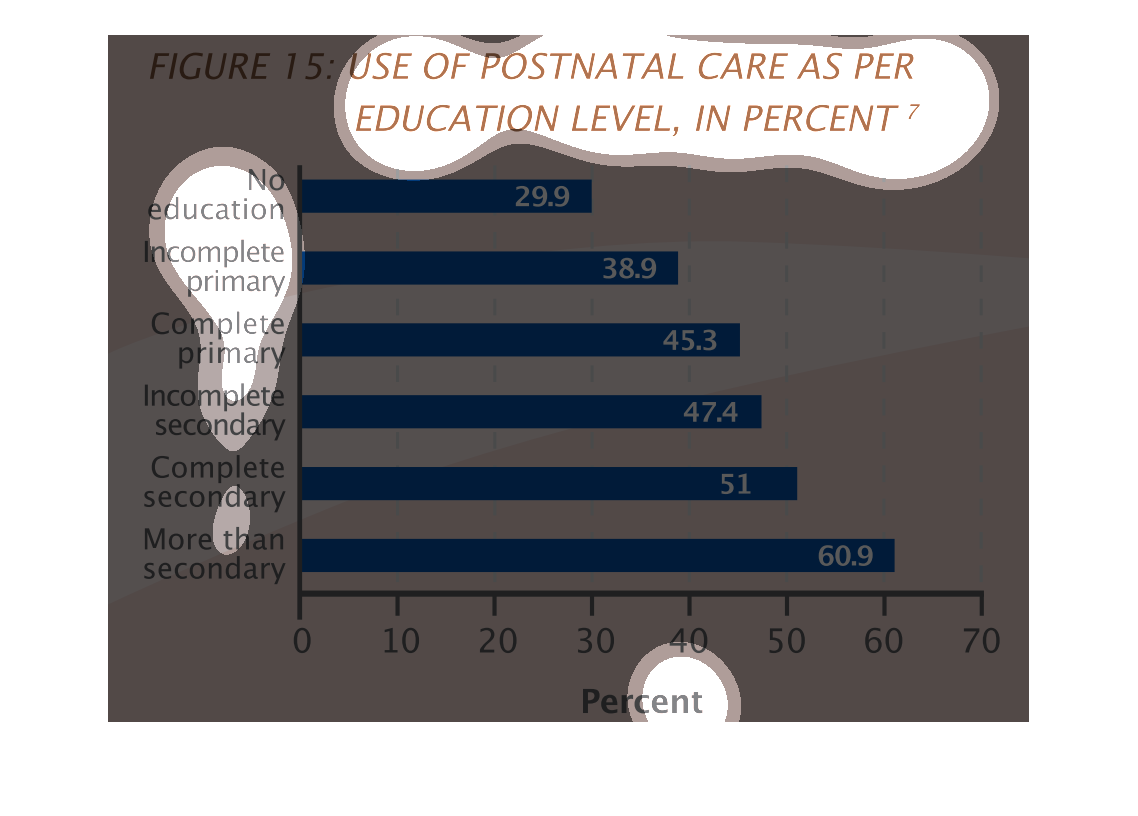
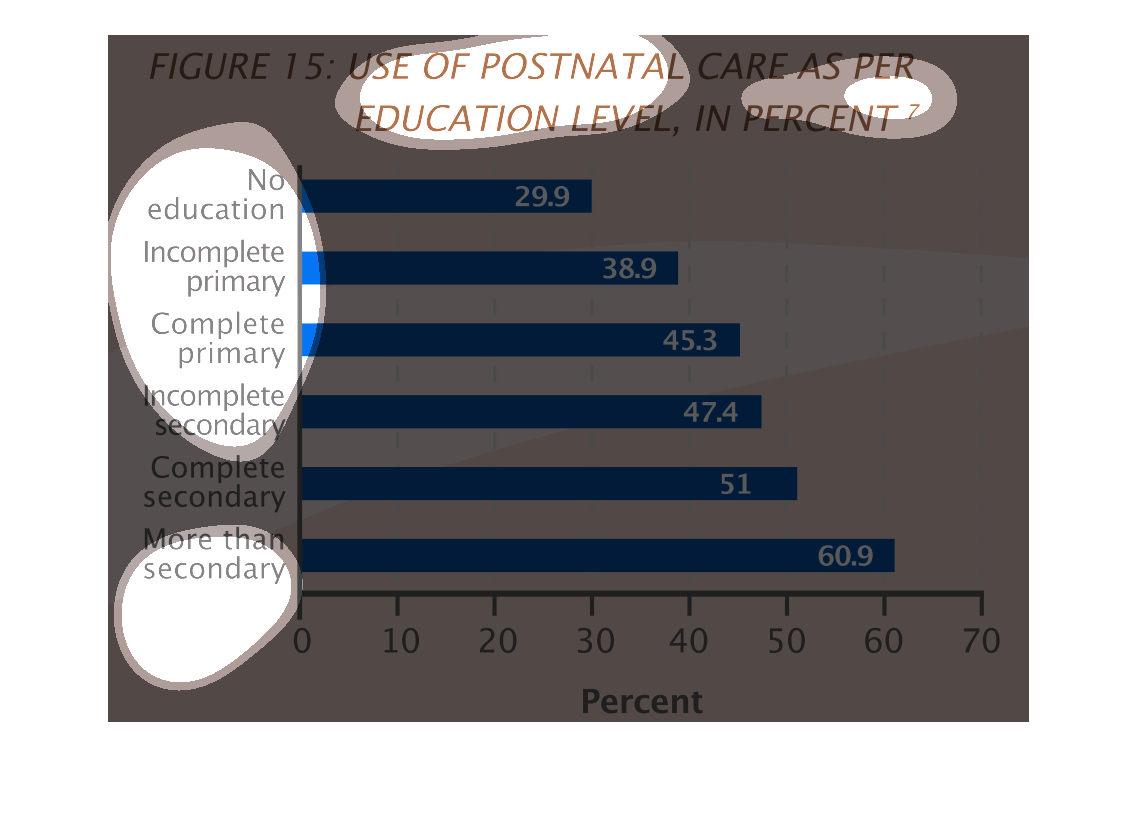
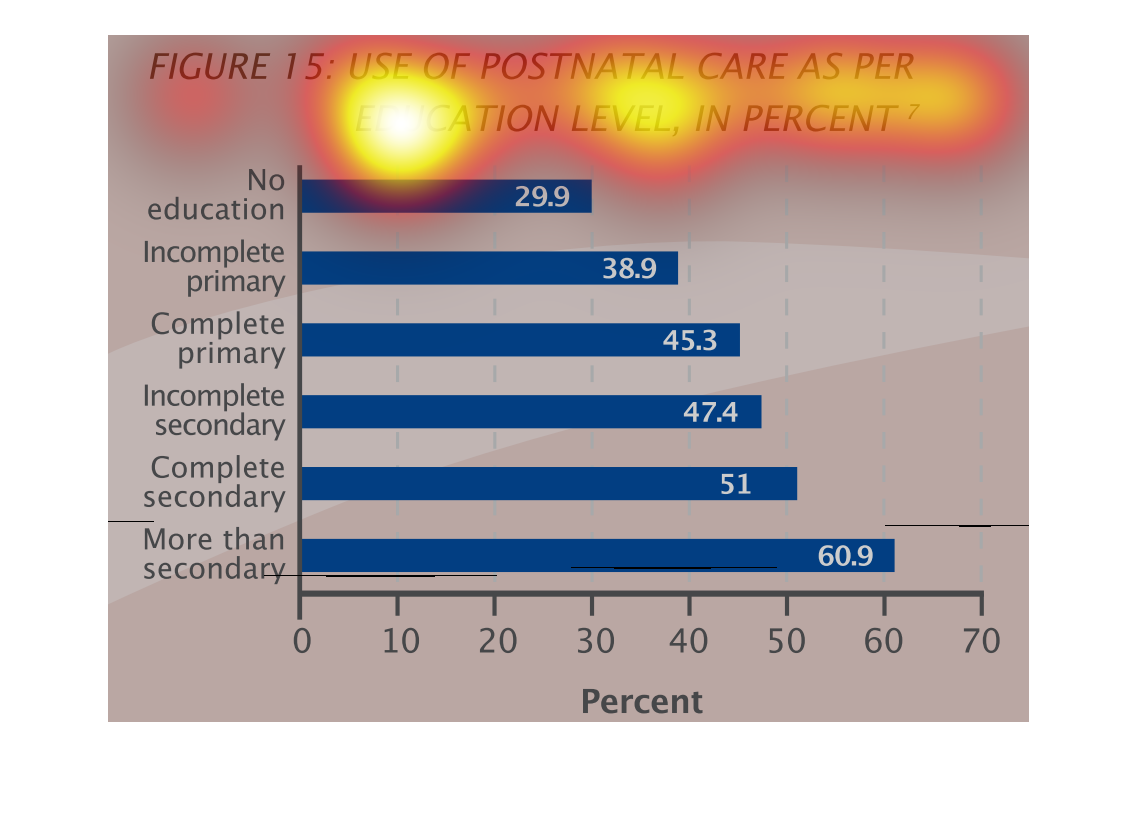
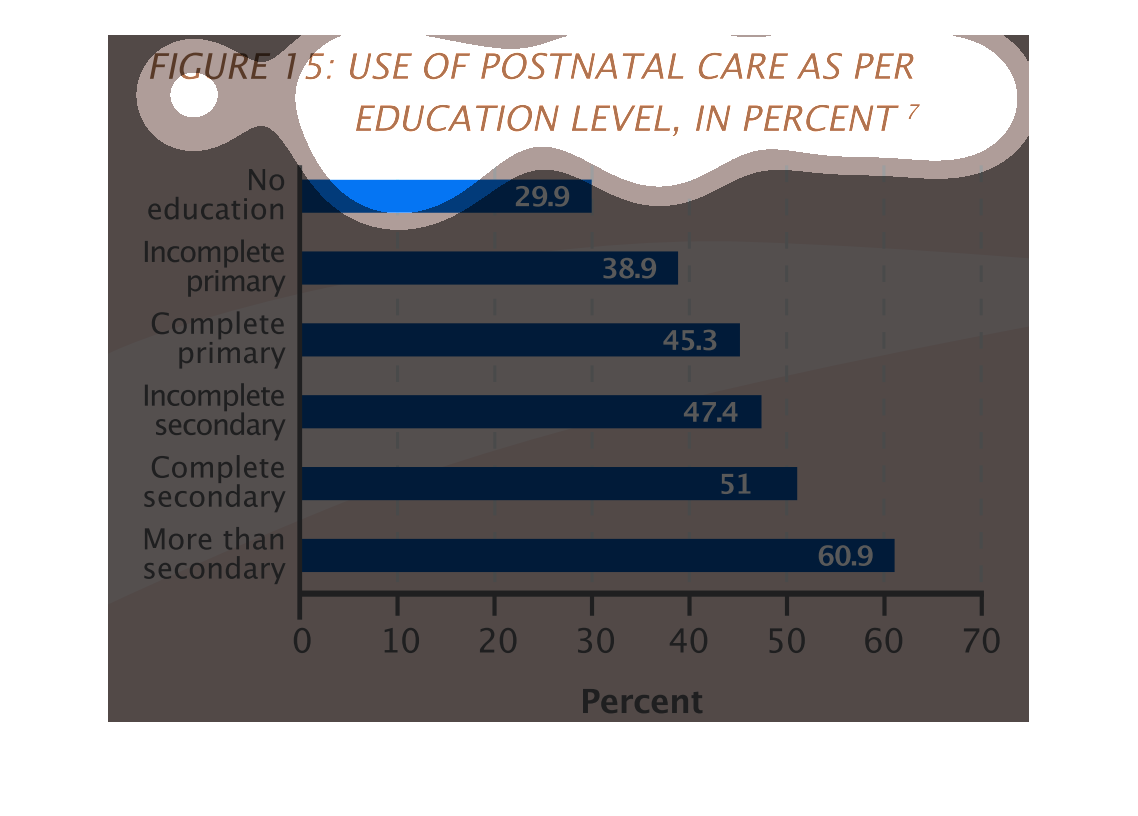
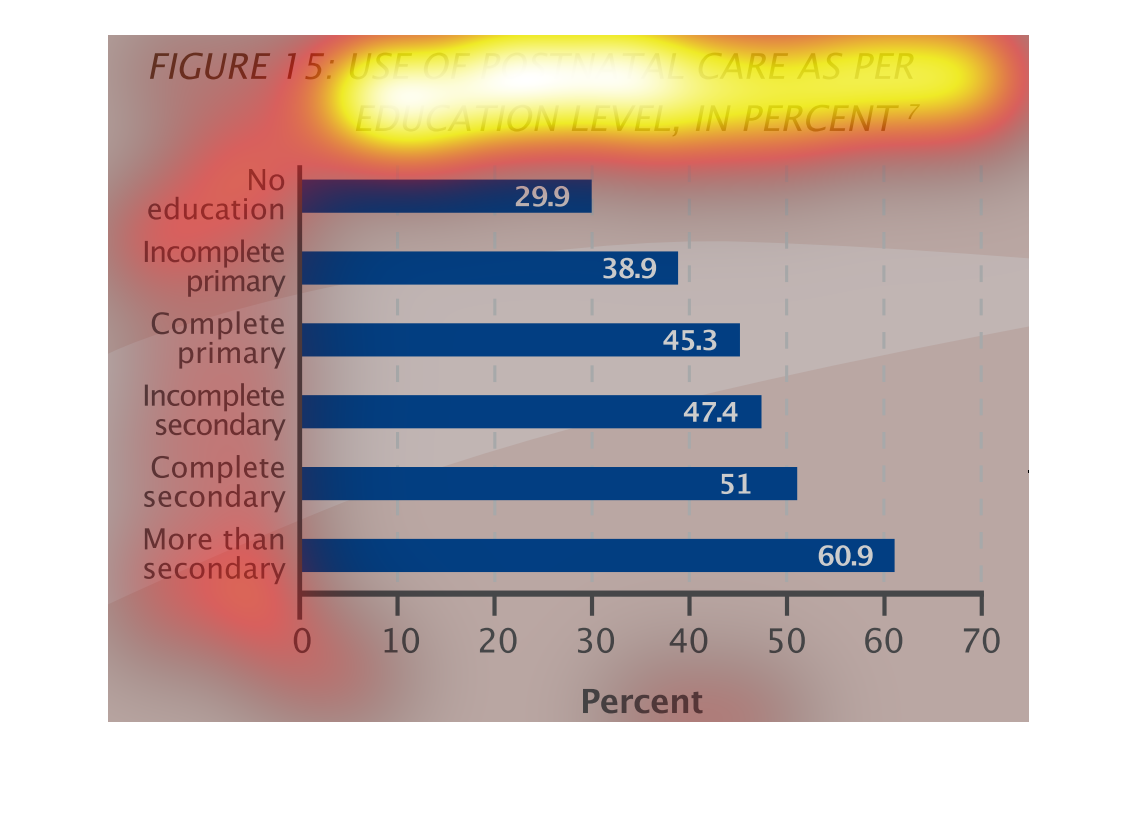
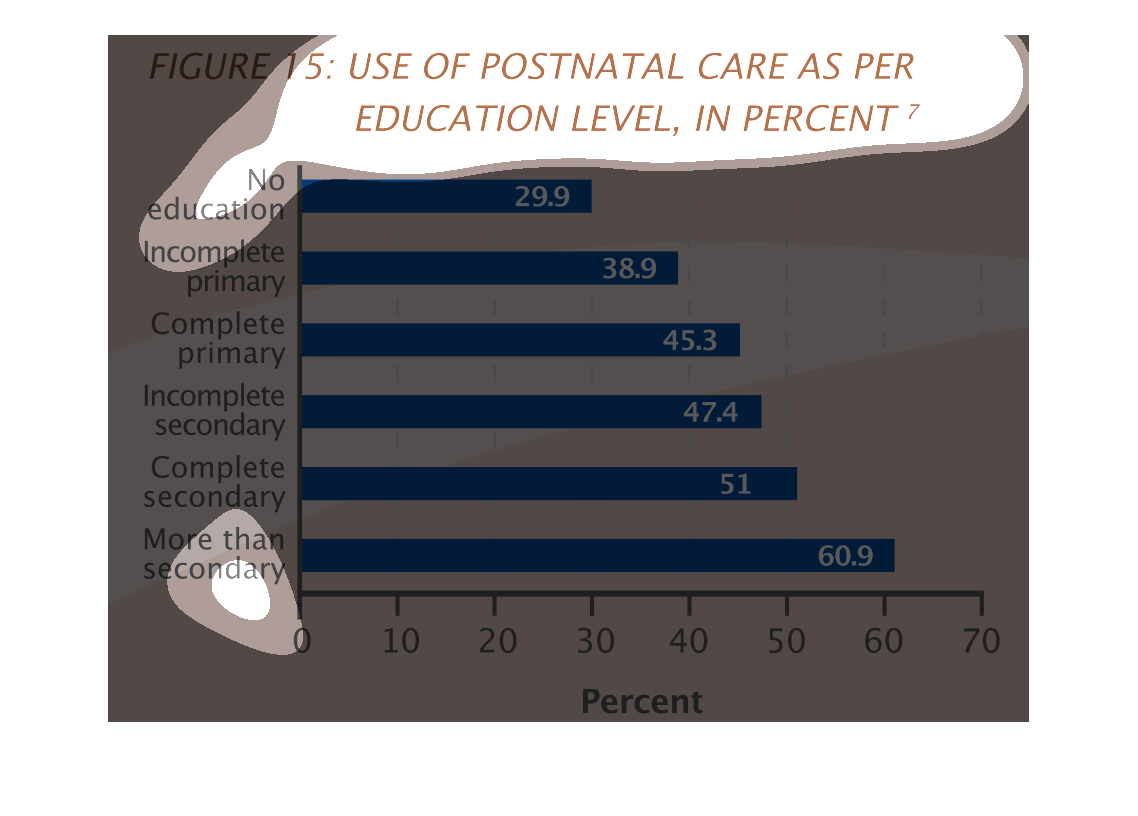
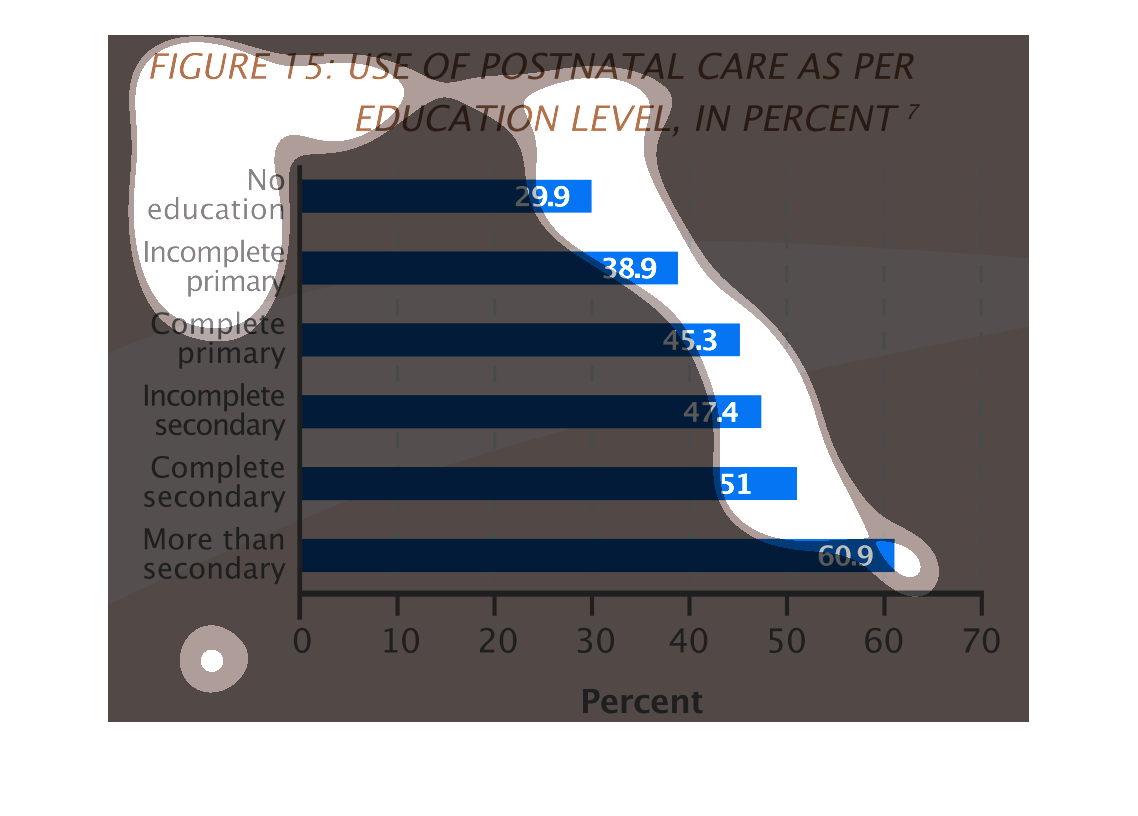
The heading of this image is "Figure 15: Use of Postnatal Care as per Education Level, in
Percent". Education categories include "No education", "Incomplete primary", "Complete primary",
"Incomplete secondary", "Complete secondary", and "More than secondary". It appears that as
education level increased, postnatal care increased. Twenty nine point 9 percent of individuals
with no education used postnatal care, compared with 38.9% with incomplete primary, 45.3%
complete primary,  47.4% incomplete secondary, 51% complete secondary, and 60.9% more than
secondary.
This is a bar graph measuring the use of prenatal care per education level.  One side of the
chart measures from "no education" to "more than secondary".  The other measure on the graph
measures numbers in increments of 10.