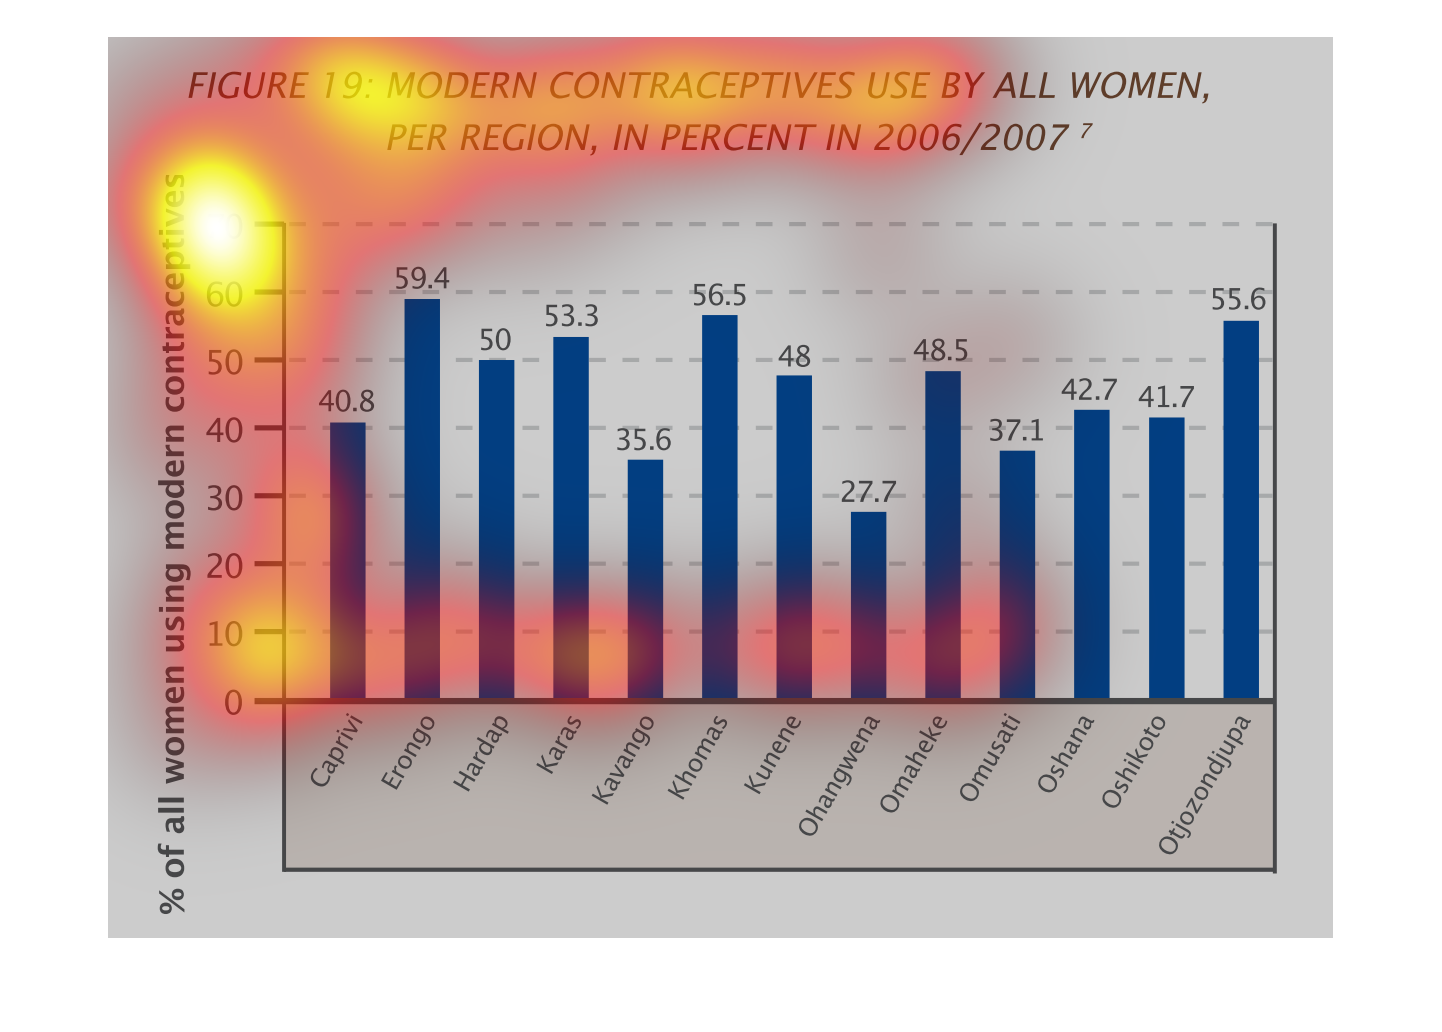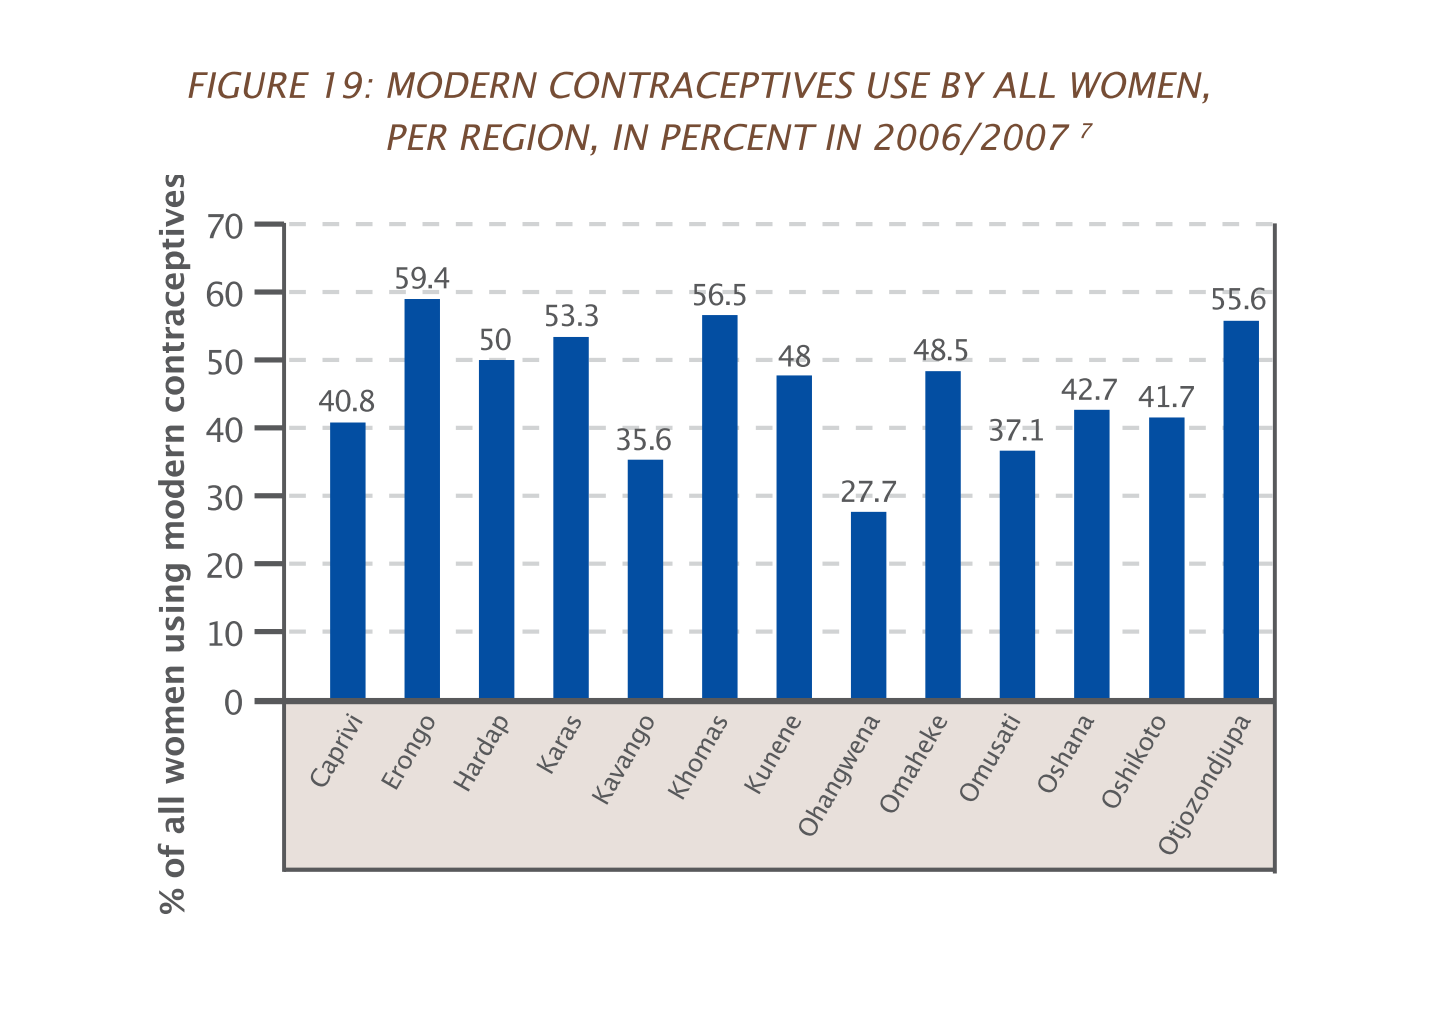
The figure presented is titled figure 19: modern contraceptive use by all women, per region,
in percent, in 2006/2007.  The figure is a representation of contraceptive use.
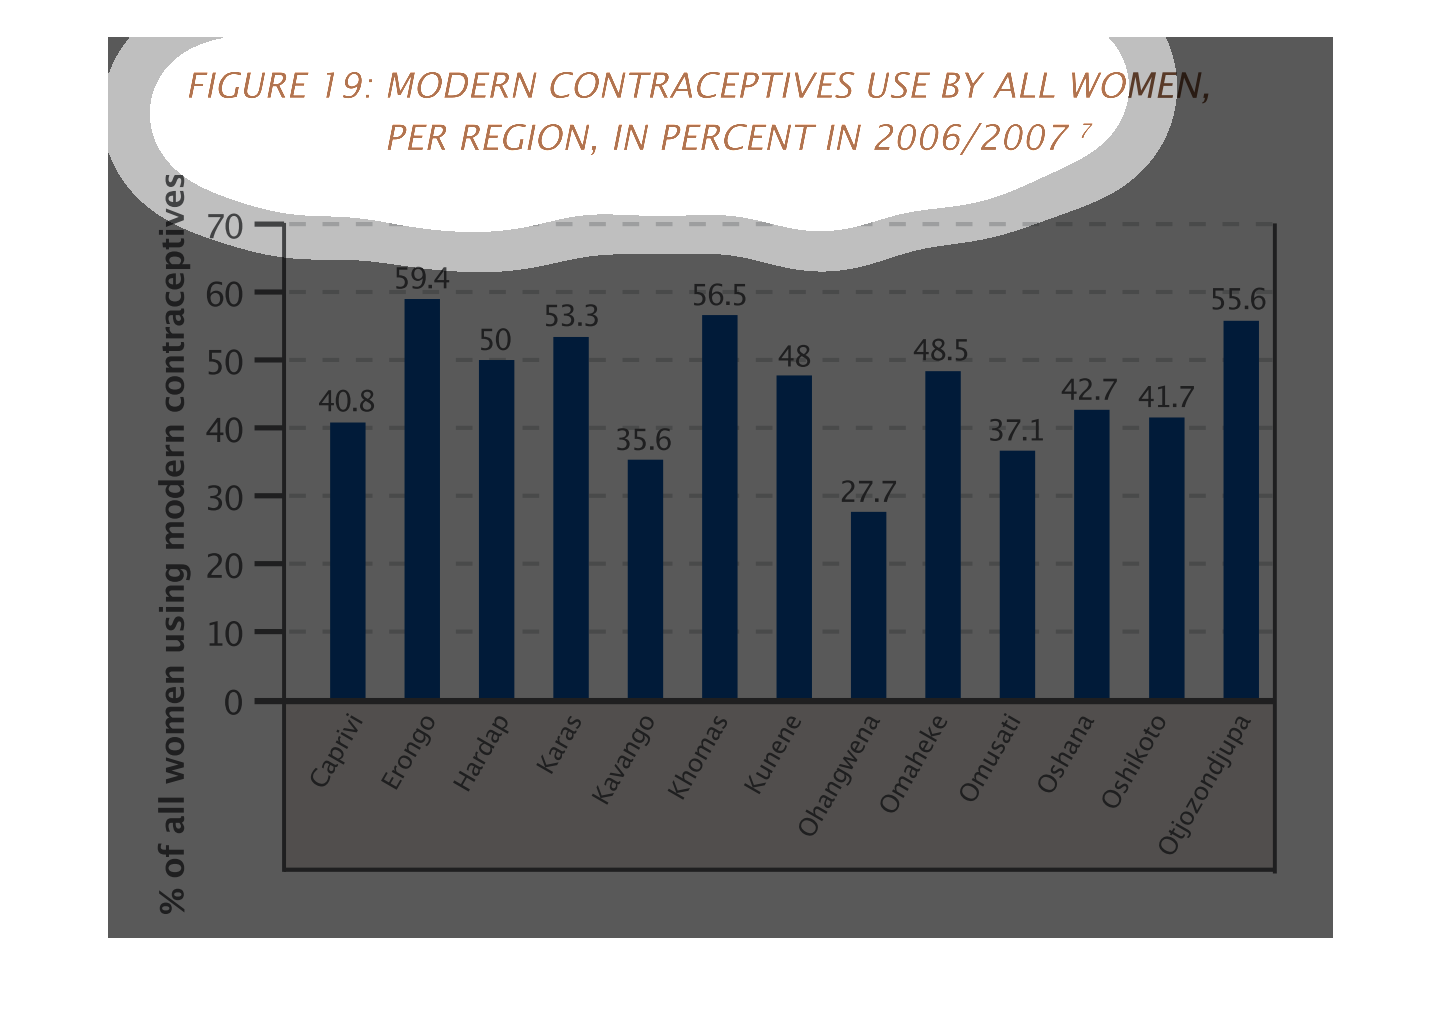
figure 19: modern contraceptives use by all women per region, in percent in 2006/2007. Y axis
shows percentage 0-70. X axis shows remote african regions
This image or figure shows or depicts in statistical bar graph format the data for modern
contraceptives use by all women per region in percent for years 2006/2007.
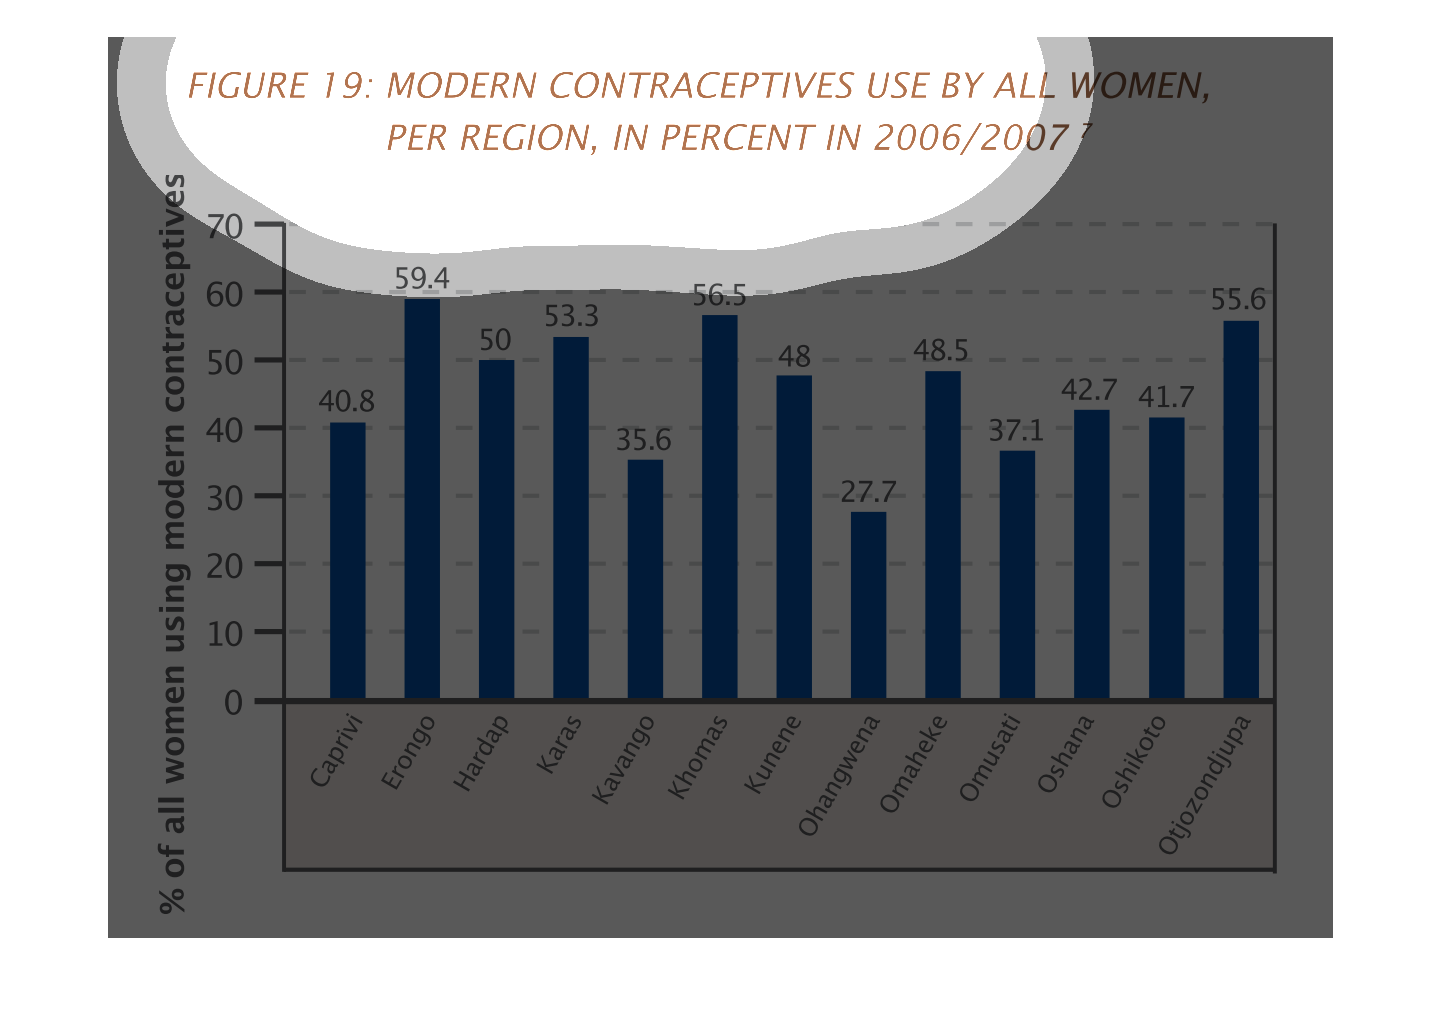
This is a graph of modern contraceptive use by all women per region. The highest range is
about 59.4 percent while the lowest range is around 27.7 percent.
Modern contreceptives used by men and womenby region and paercent in 2006, 2007. The graph
is the percentage by region. The bar graph is blue and the background is white.
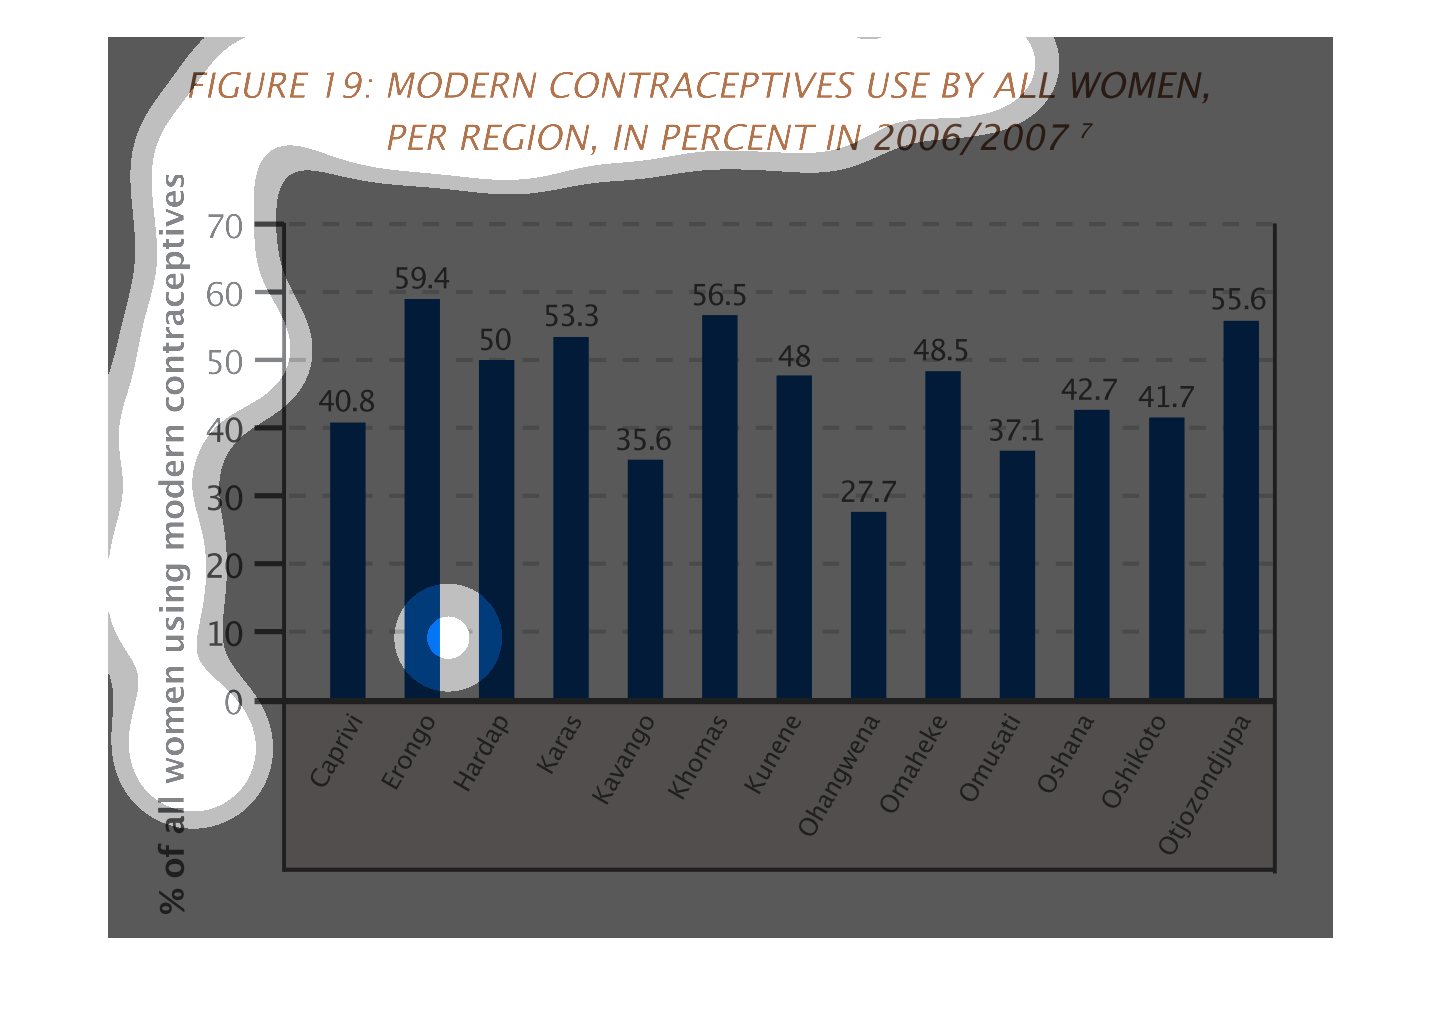
This chart describes about % of woman using modern contraceptives. It shows the data per region.
Erongo possess the top most place. Ohangwena is at least place.
This graph shows modern contraceptives used by women per region in 2006 and 2007. The y axis
gives the percentages of women using the contraceptives per each region.
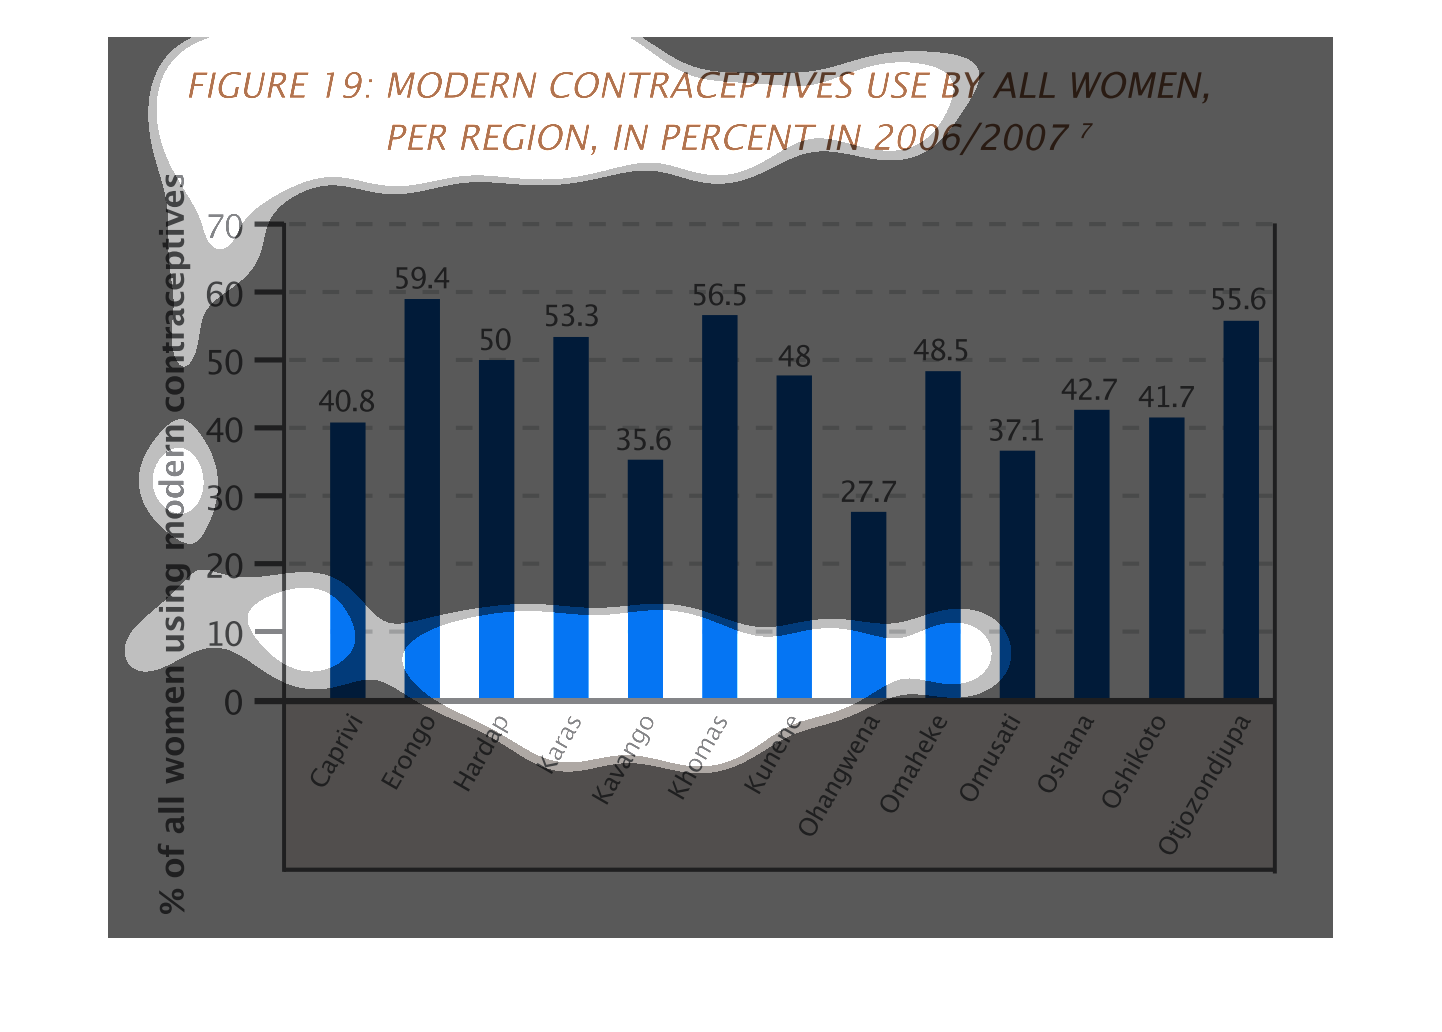
This chart describes modern contraceptives use by all women, per region, in percent in the
year 2006/2007. Regions on the chart include Caprivi and Erongo.
The figure presented is titled Modern contraceptives use by all women,  per region, in percent
in 2006/2007.  It shows the percentage of contraceptive use in different regions.
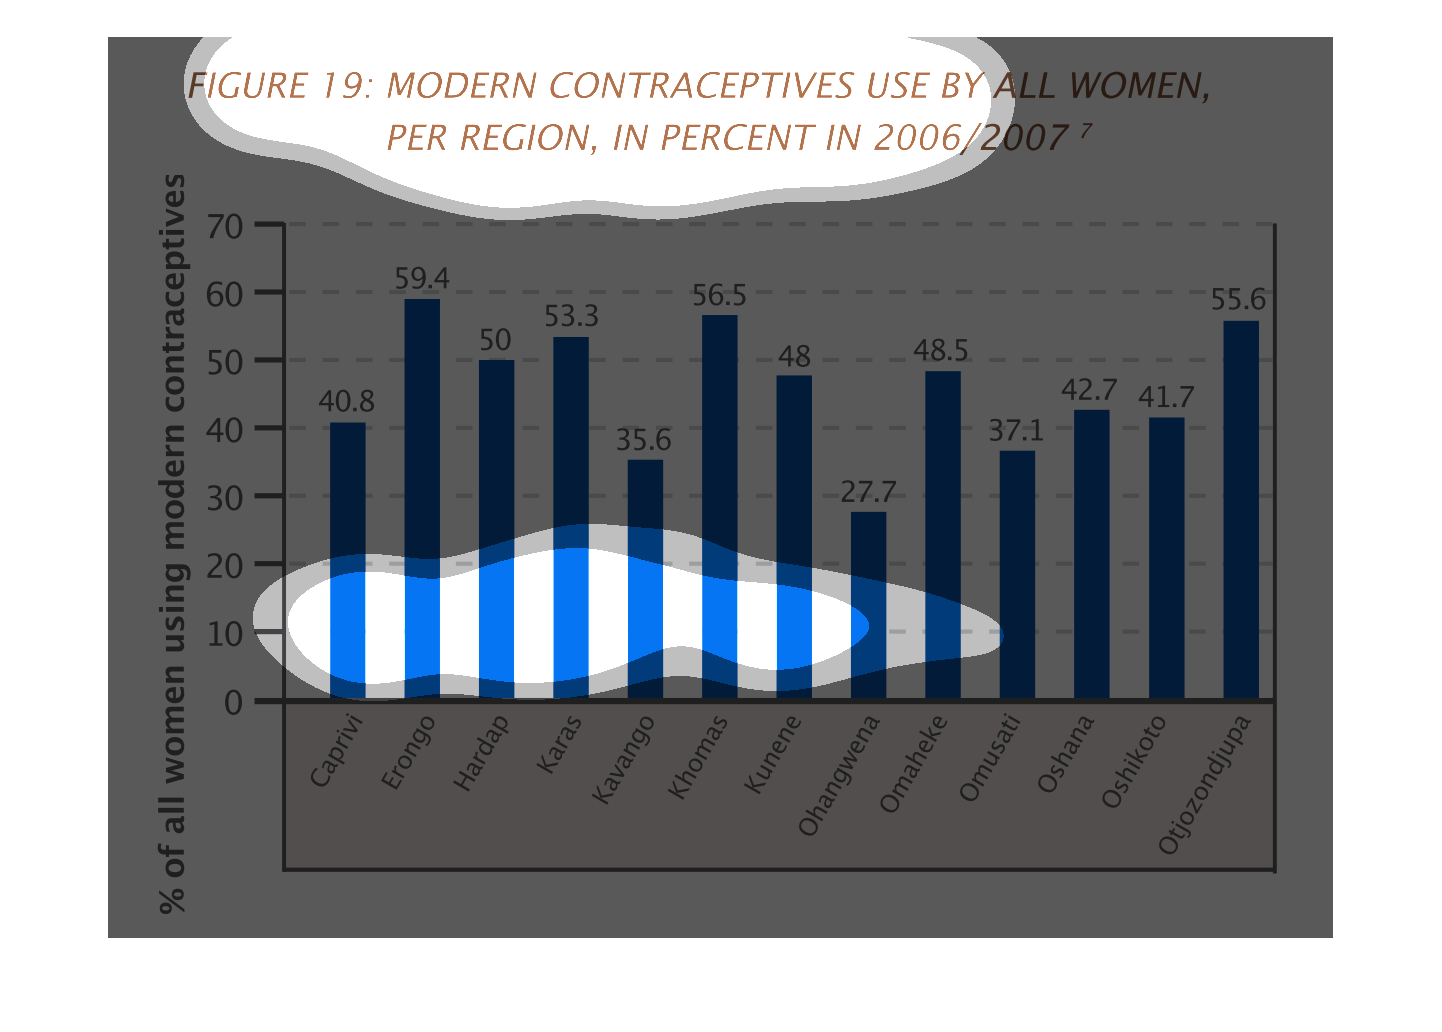
This chart shows modern contraceptives use by all women per region in percent in 2006/2007.
All of the regions seem to be focused around Namibia. The highest percentage of women who
use modern contraceptives in the areas listed come from Erongo, with a total of 59.4% usage.
This graph illustrates modern contraceptive use by women per region in 2006/2007.  The percentage
of women using contraceptive  range from 40-70%/ in these areas.
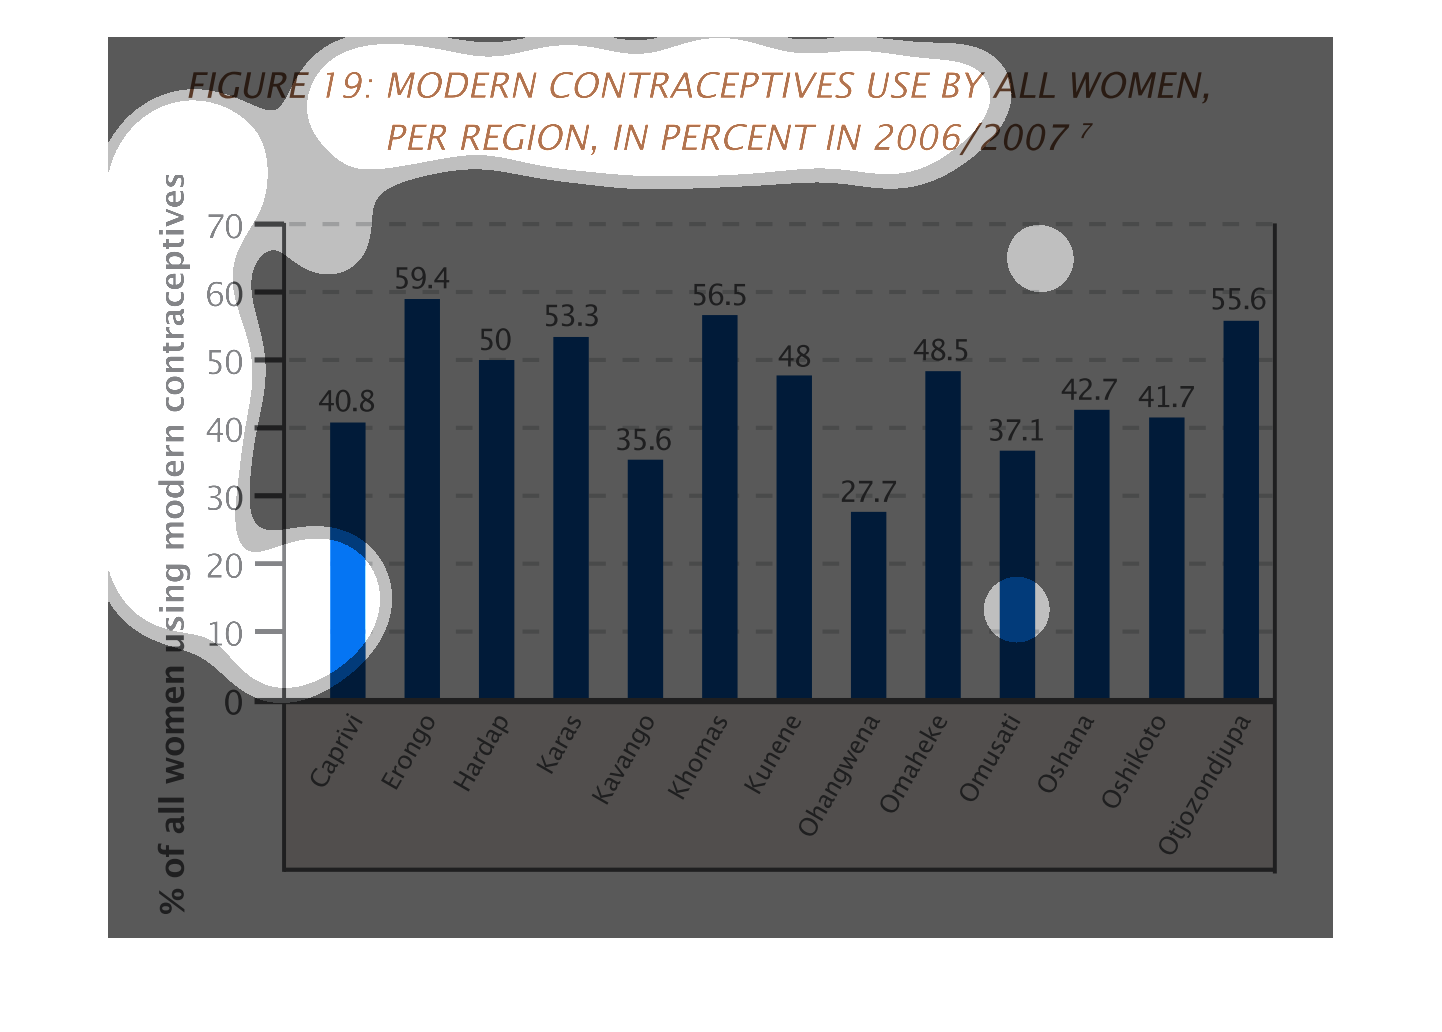
This chart is about modern contraceptive usage by all women for 2006/2007. Erongo appears
to have the most women using contraceptives with a figure or 59.4 %
This figure describes the use of contraceptives by women per region, by percent in the years
2006 and 2007. However, it seems that it is describing only a small subset of women in certain
areas, not the entire world as the title of the figure would suggest.