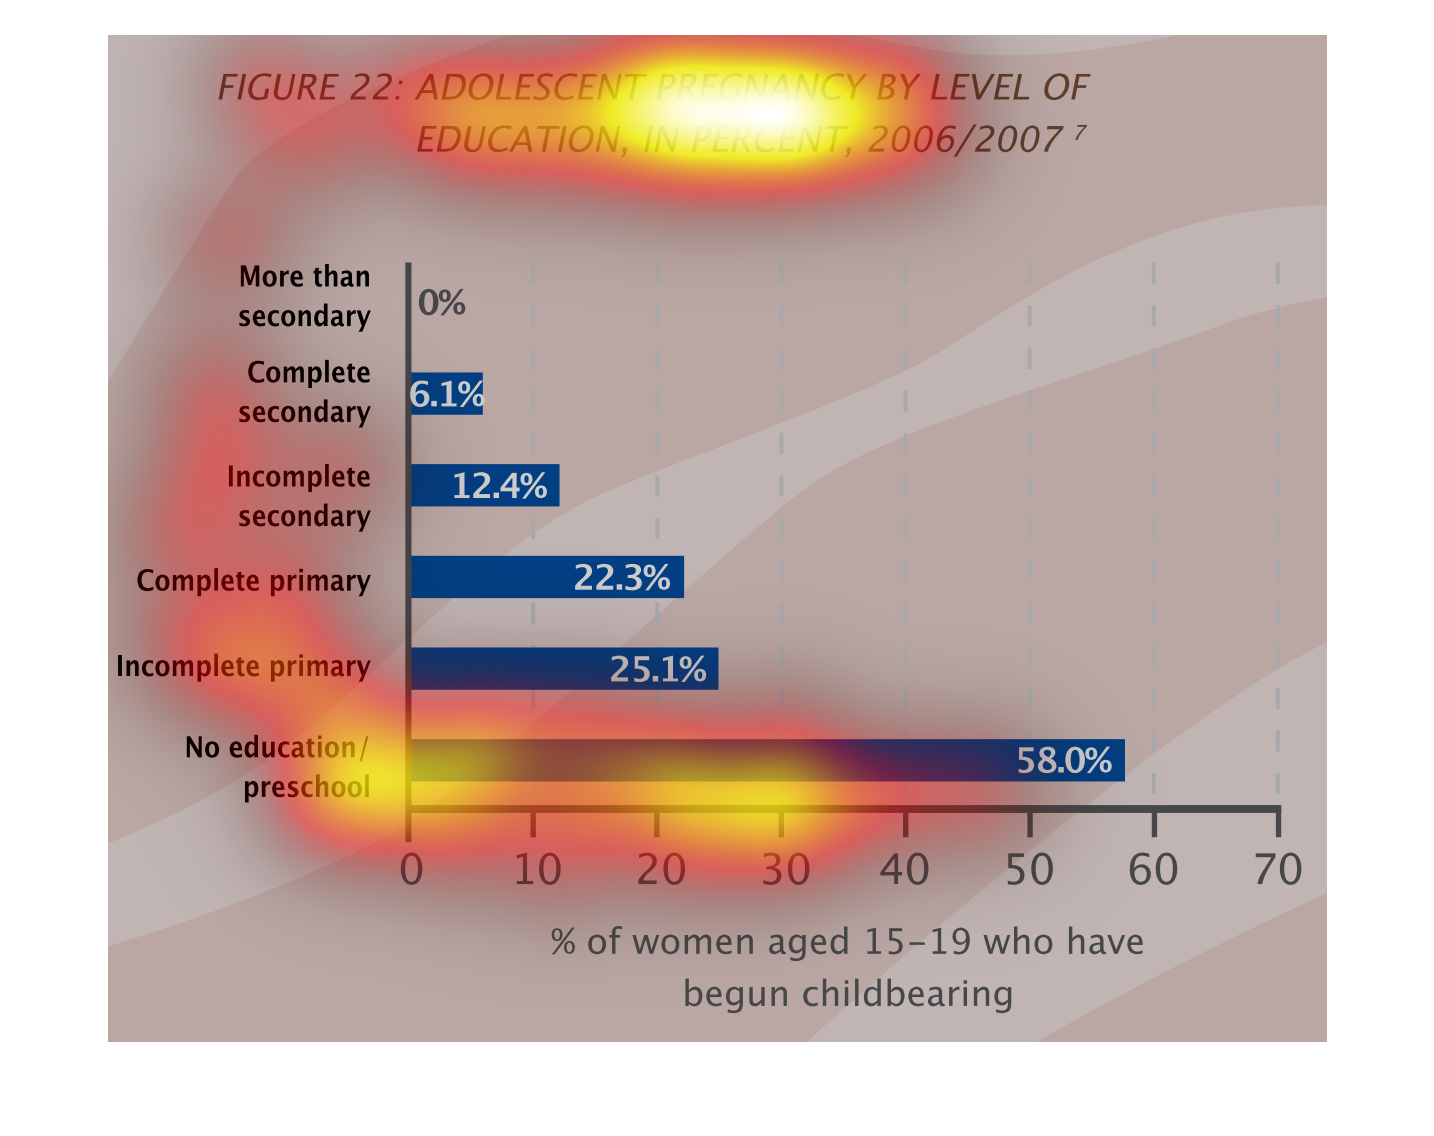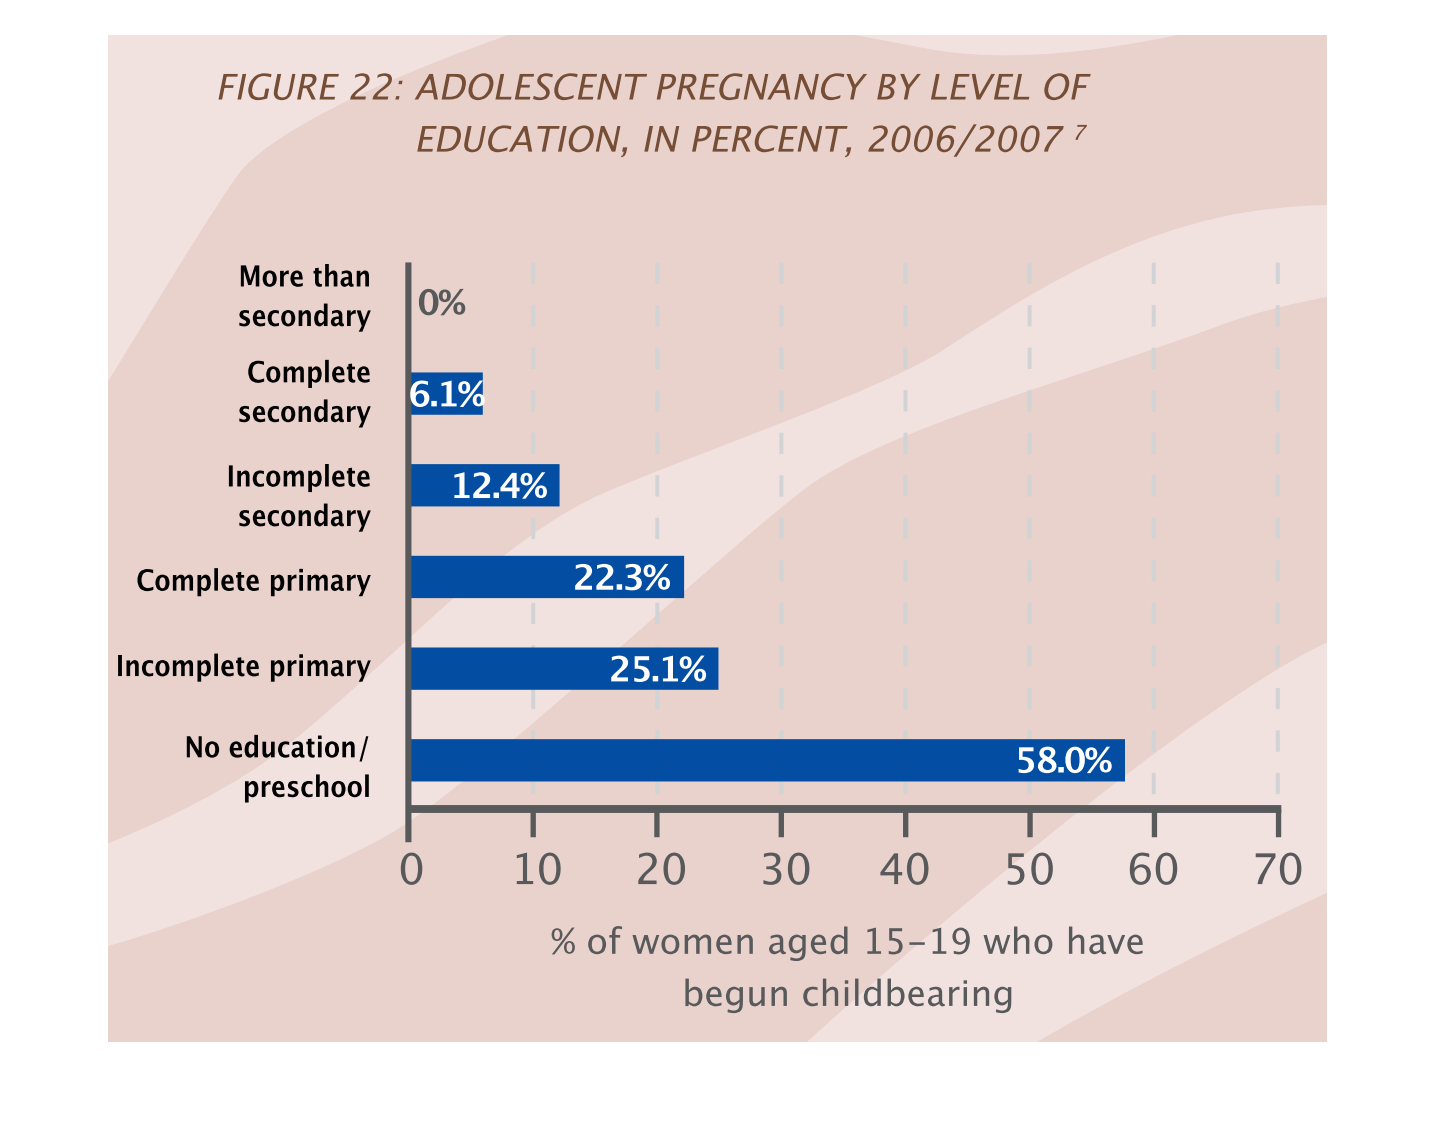
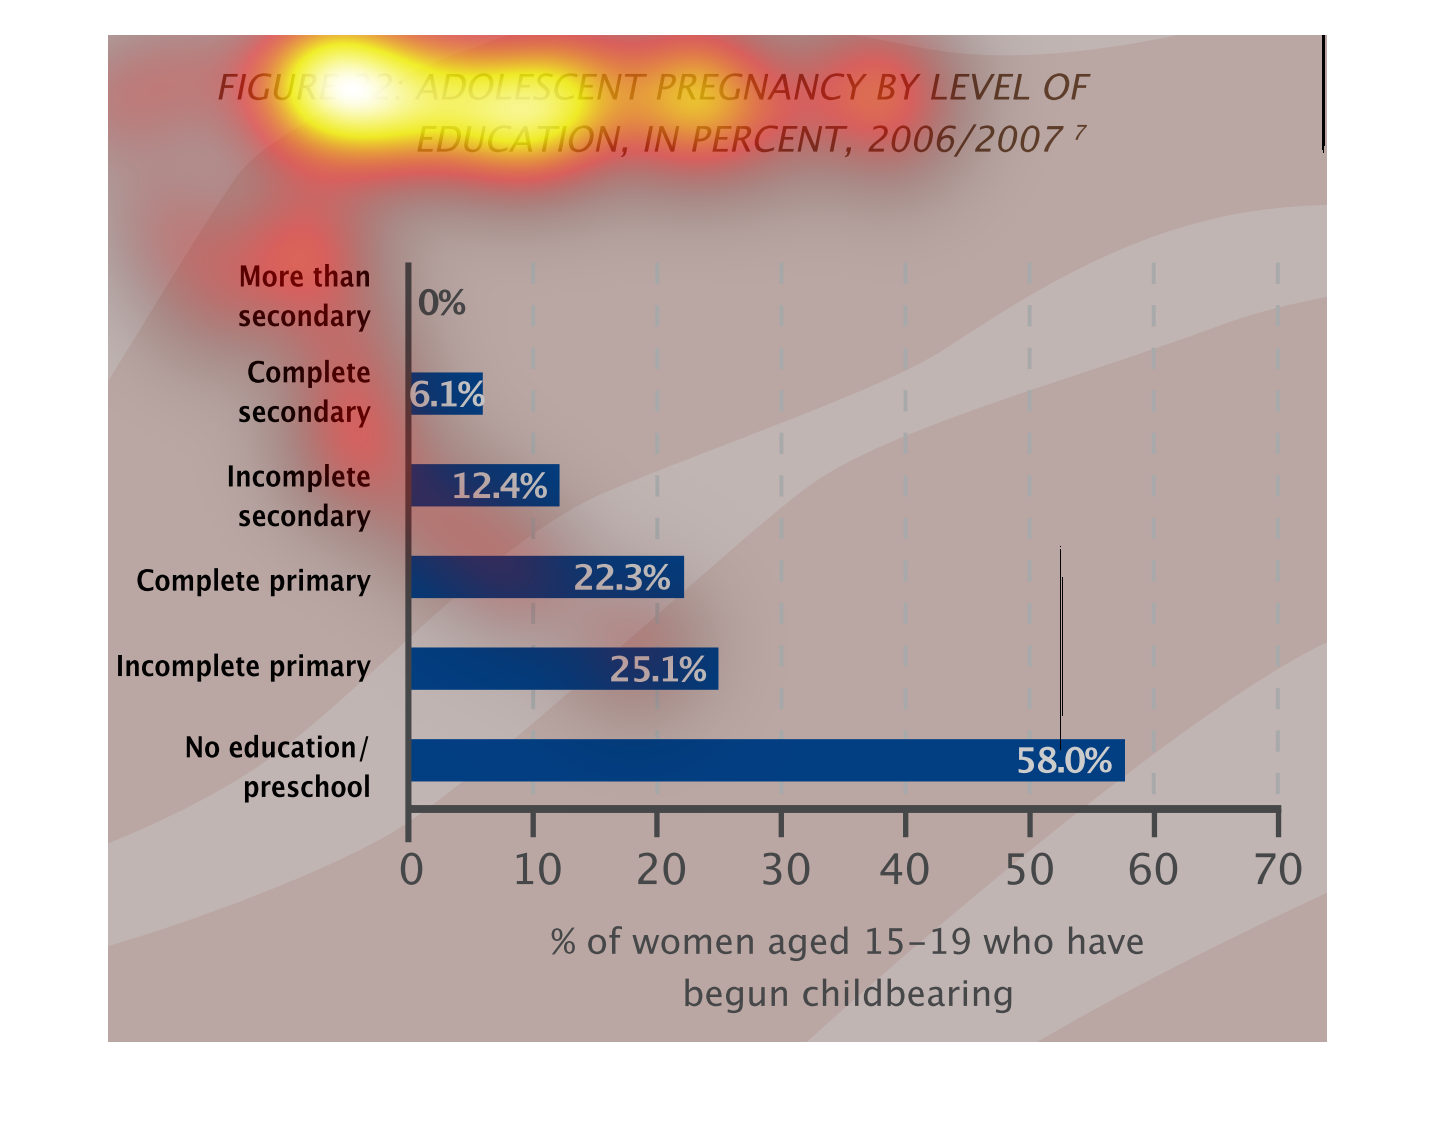
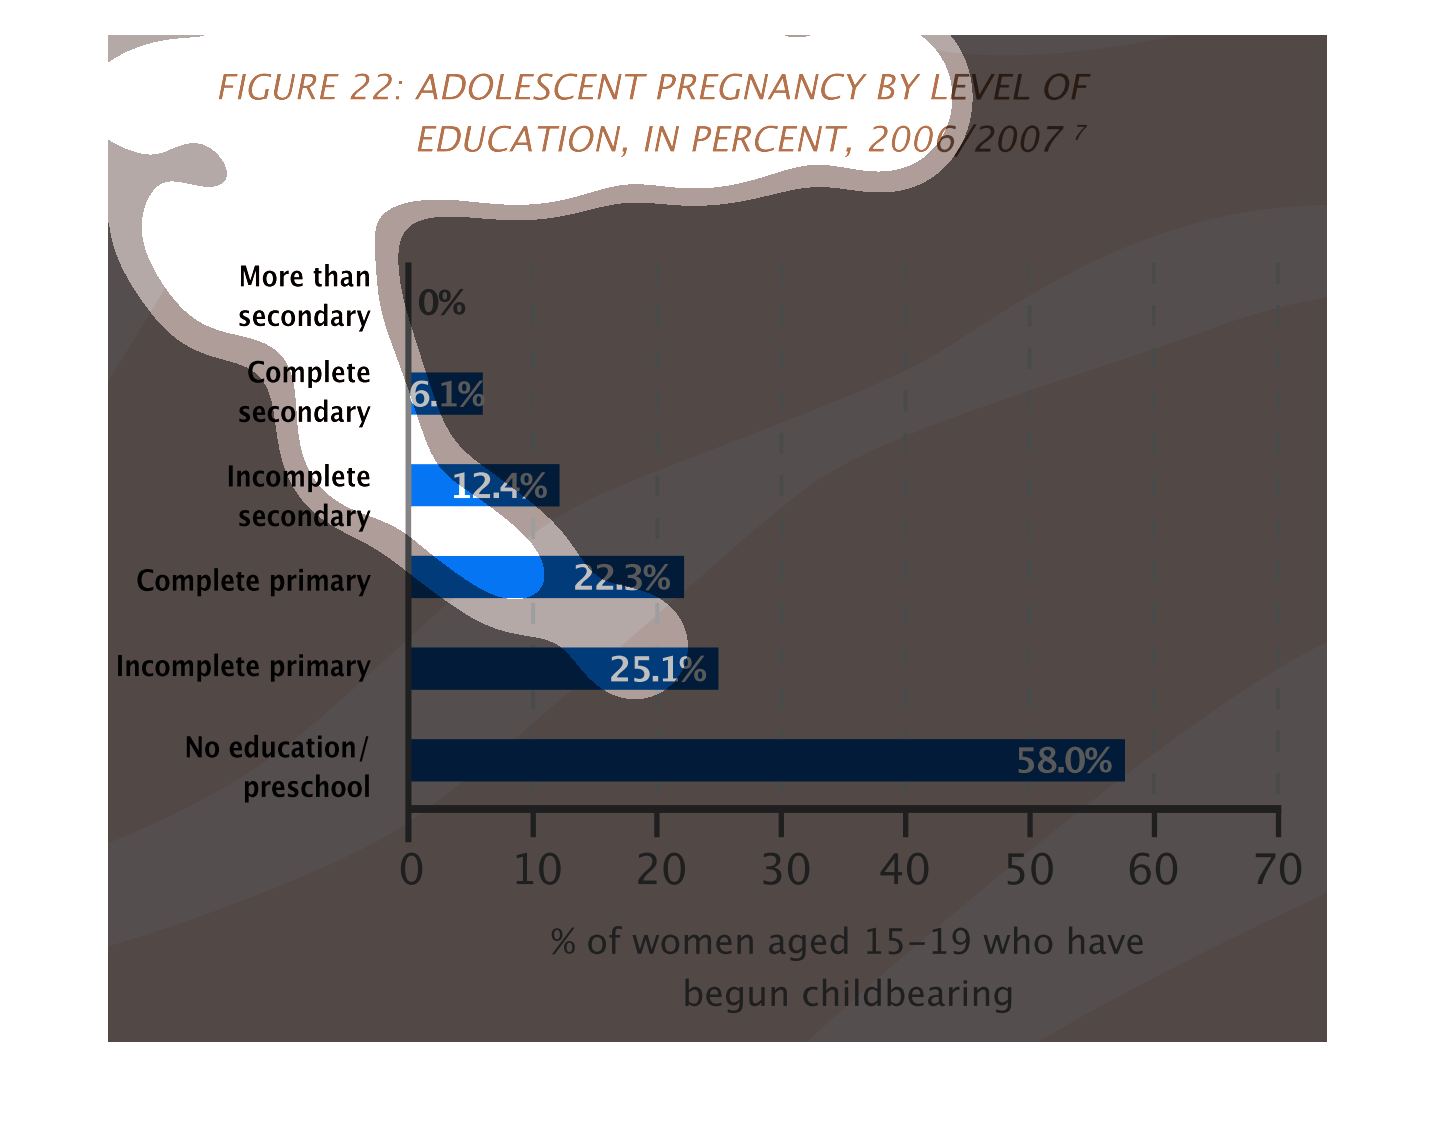
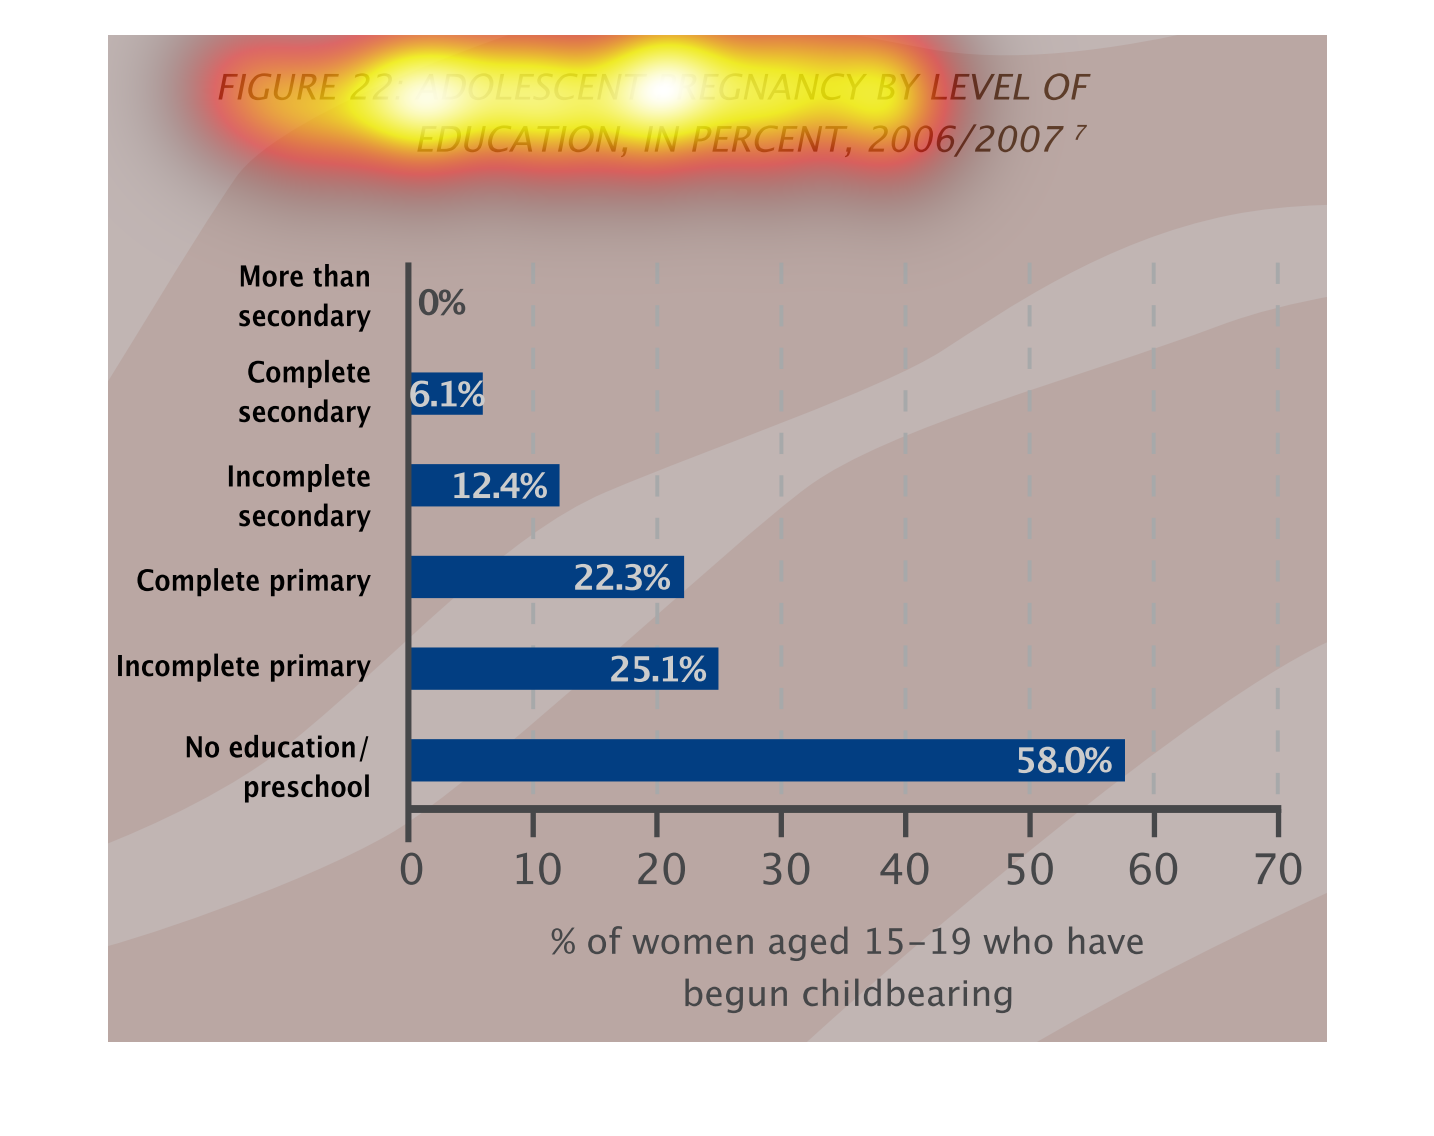
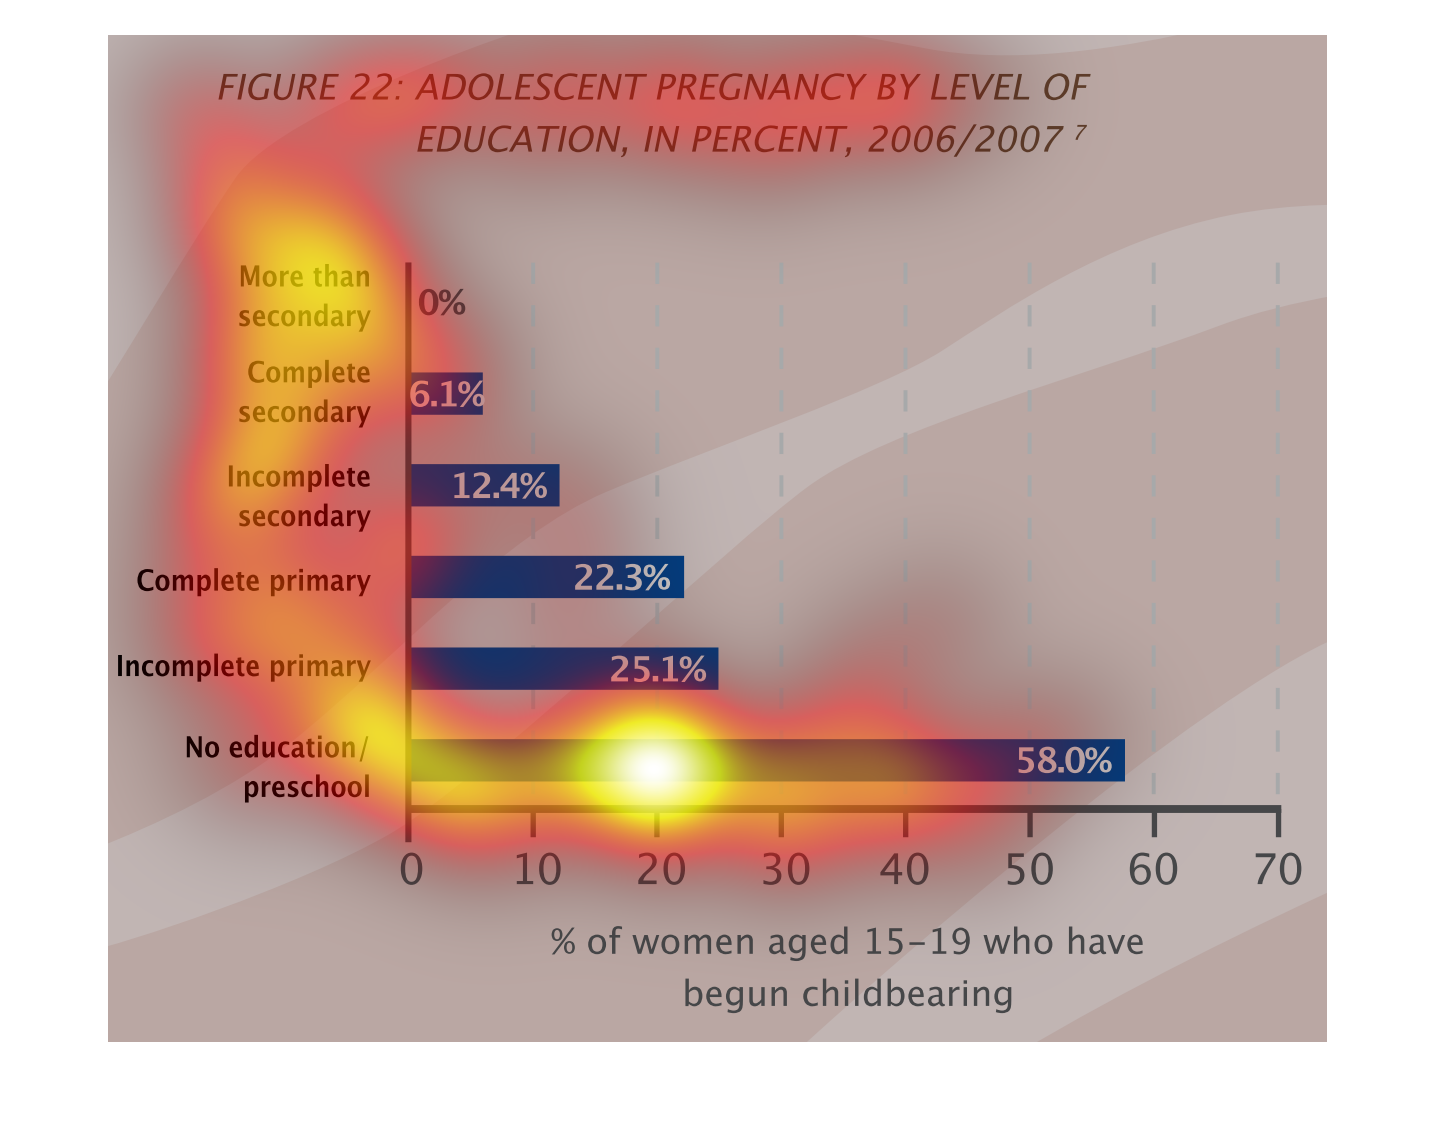
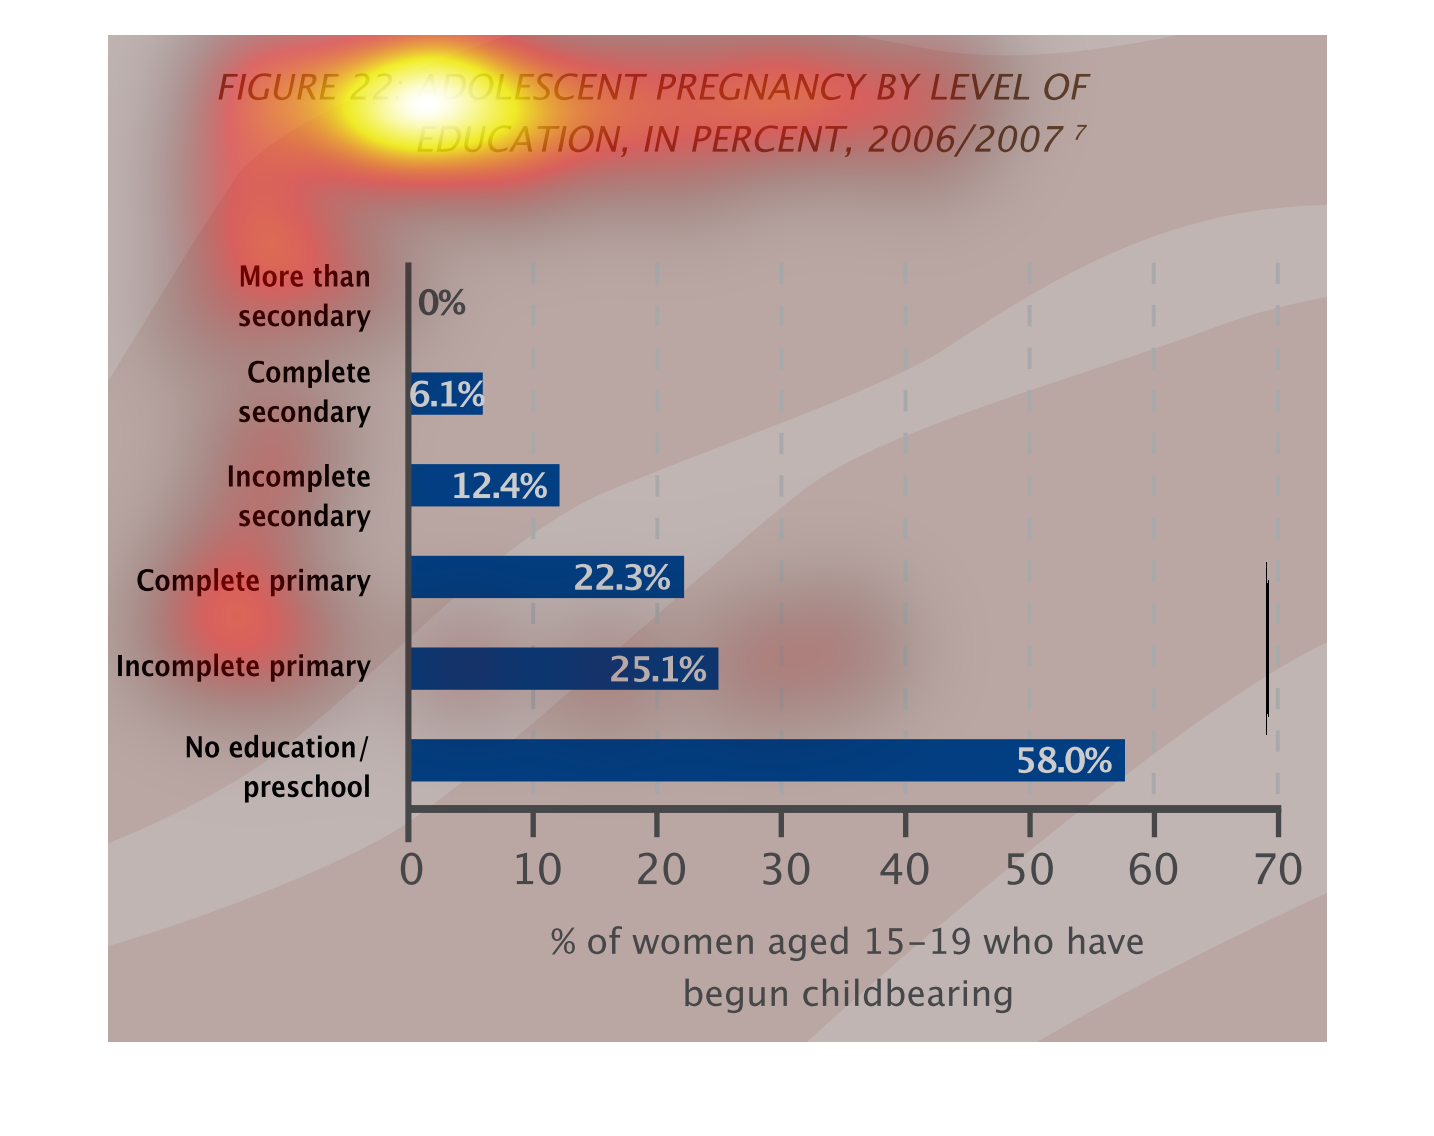
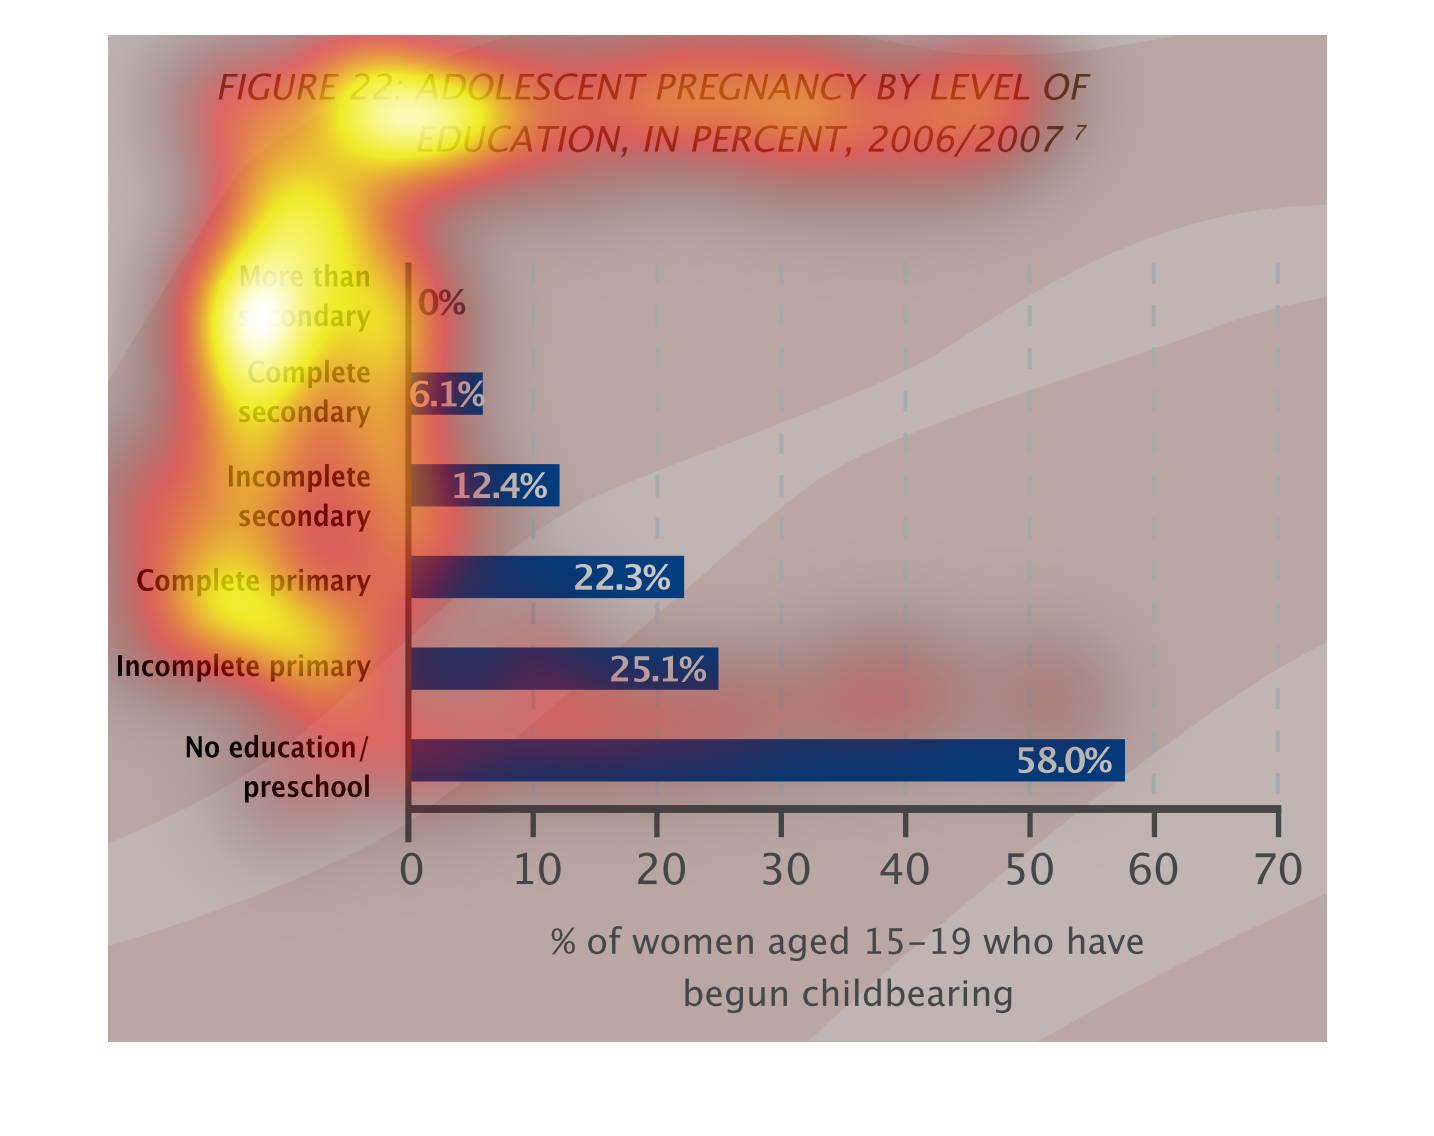
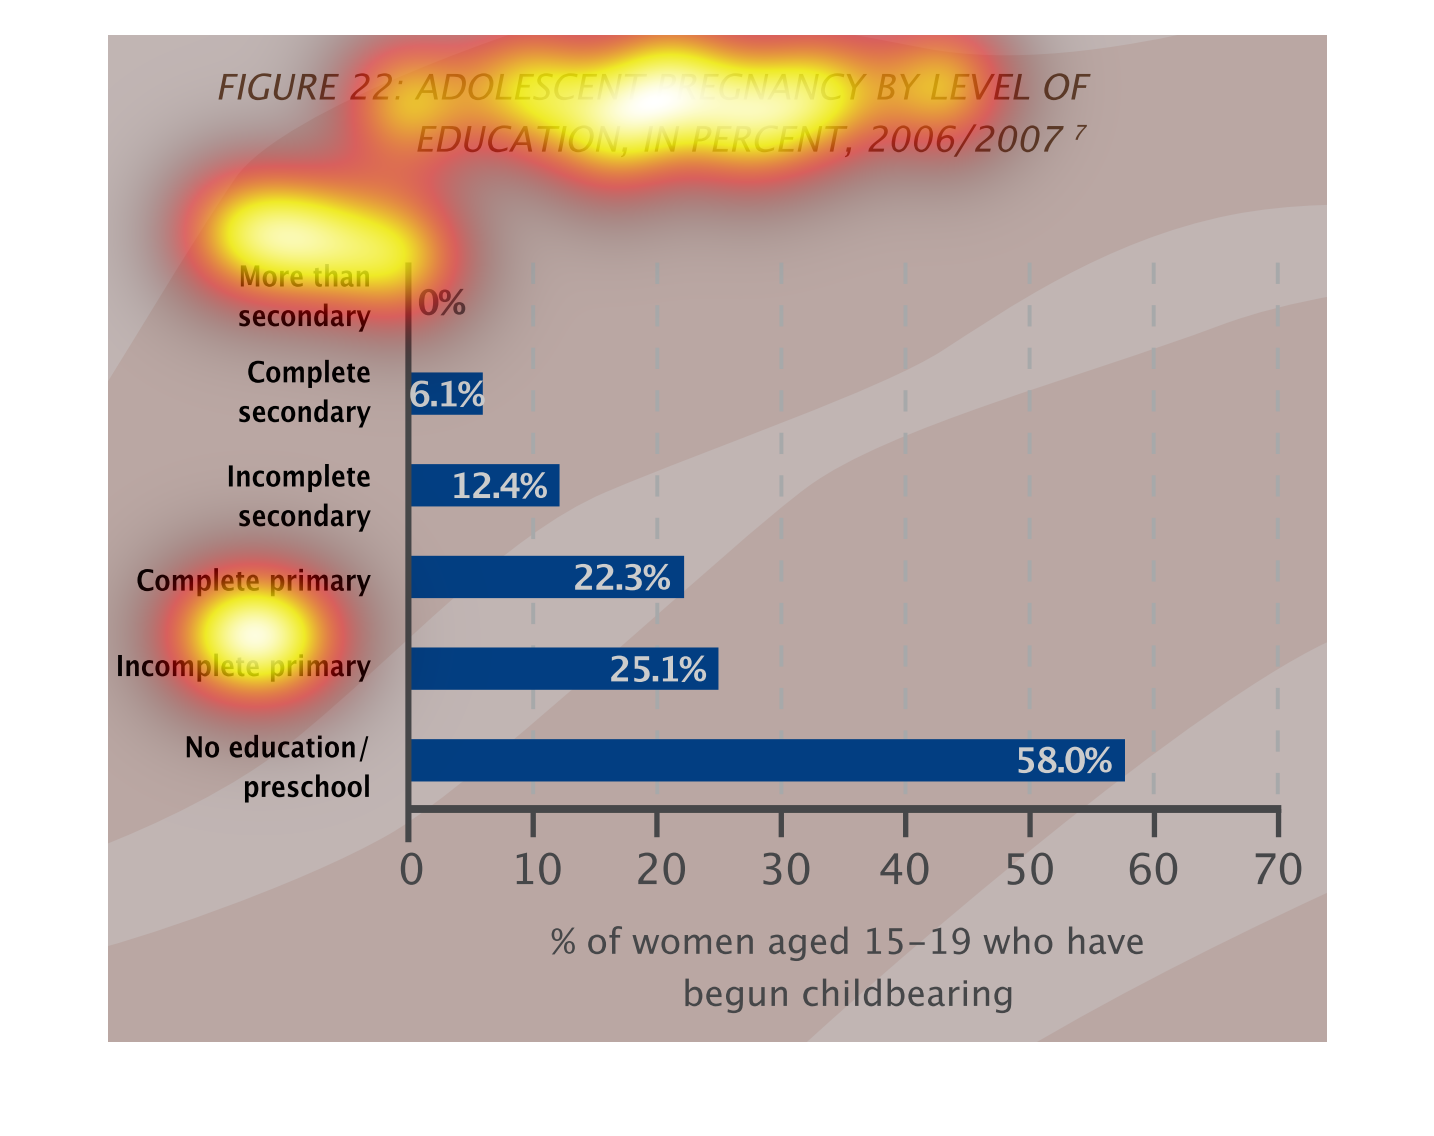
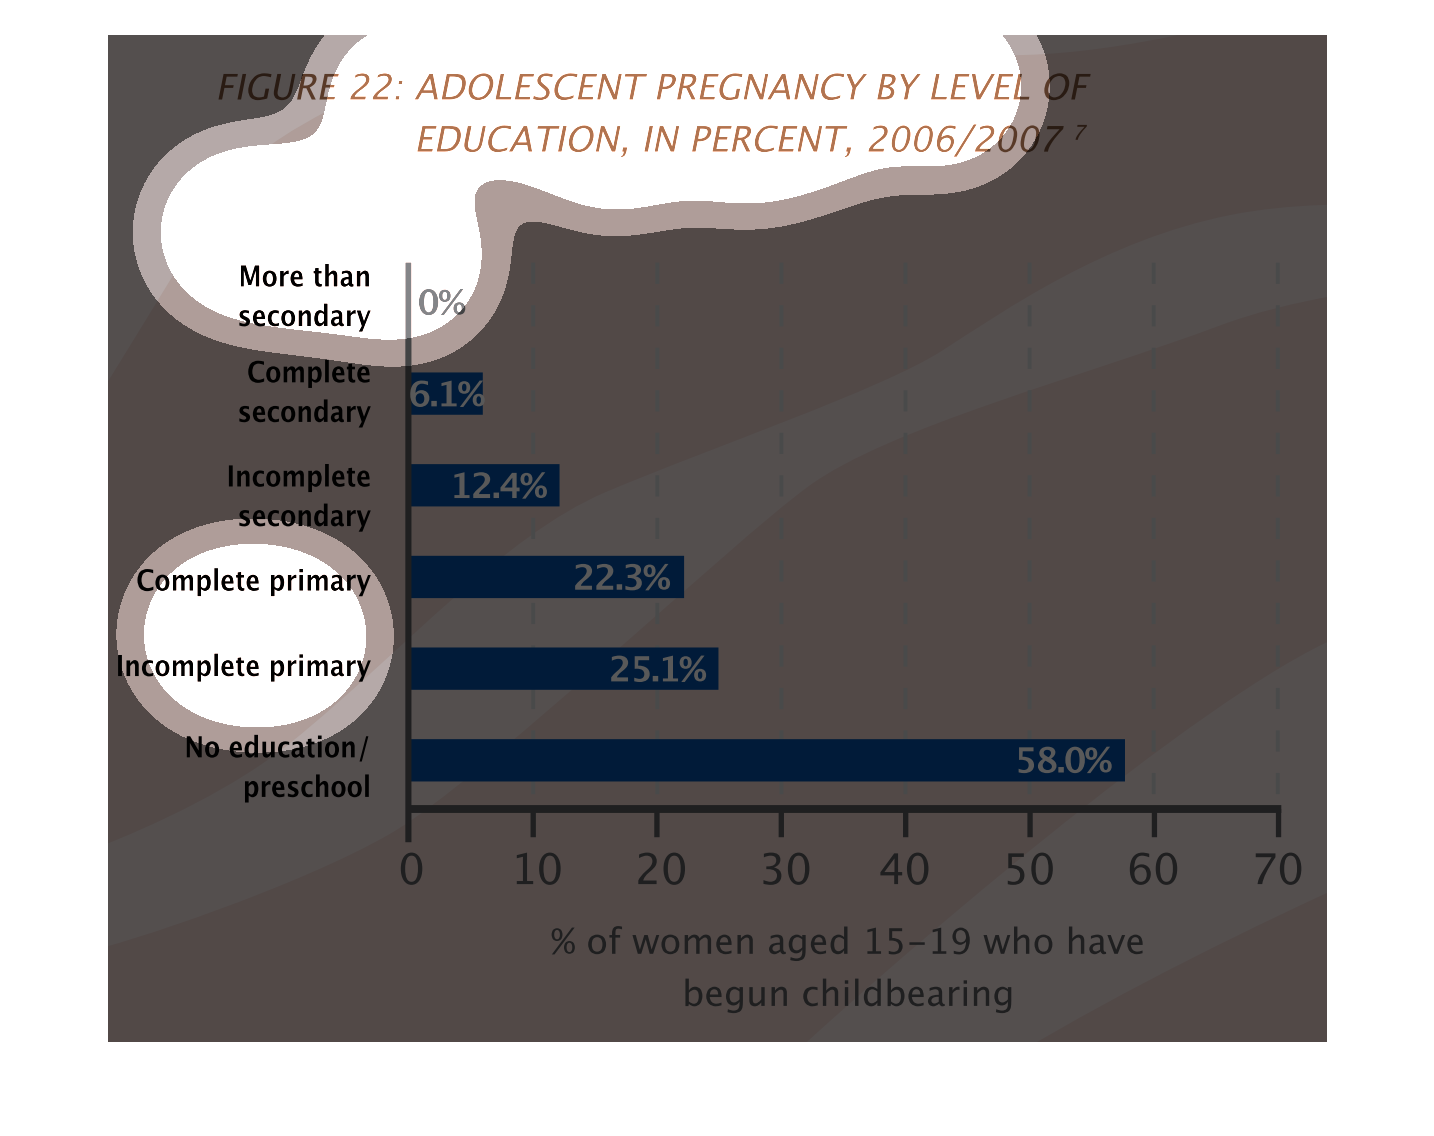
The figure presented is titled adolescent pregnancy by  level of education, in percent, 2006/2007.
 It shows pregnancy rates based on levels of education.
This is a graph that shows the levels of adolescent pregnancies by level of education. It
shows this inform of a percentage. It covers the years 2006 and 2007.
This chart describes adolescent pregnancy by level of education, in percent , for the year
2006/2007. Categories include more than secondary, and complete secondary.
Adolescent pregnancy (begun during ages 15-19) negatively correlates with the amount of school
completed. The data was taken during the 2006/2007 school year.
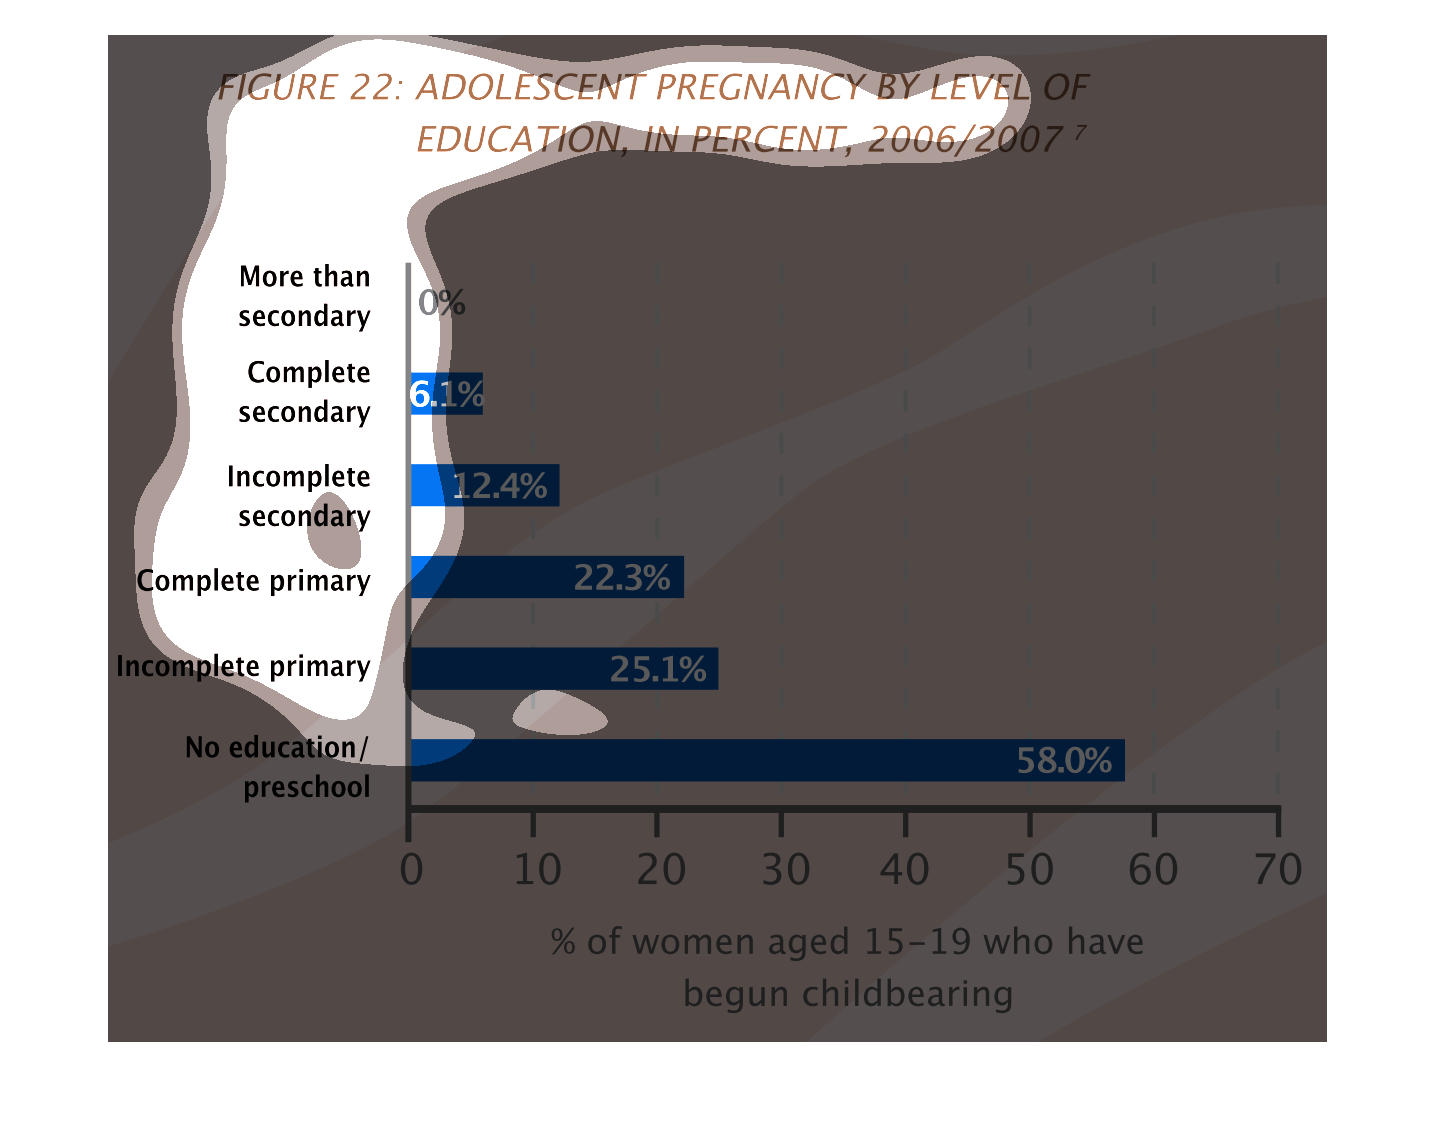
This chart shows adolecent pregnancy by level of education 2006/2007. People who have the
least amount of education are more likely to get pregnant at a young age.
This is a graph of adolescent pregnancy by level of education. The rate of adolescent pregnancy
goes down as the level of education obtained increases.
The following chart gives the level of education of adolescent women aged 15-19 who have had
a child. It shows that 0% have completed more than a secondary education.
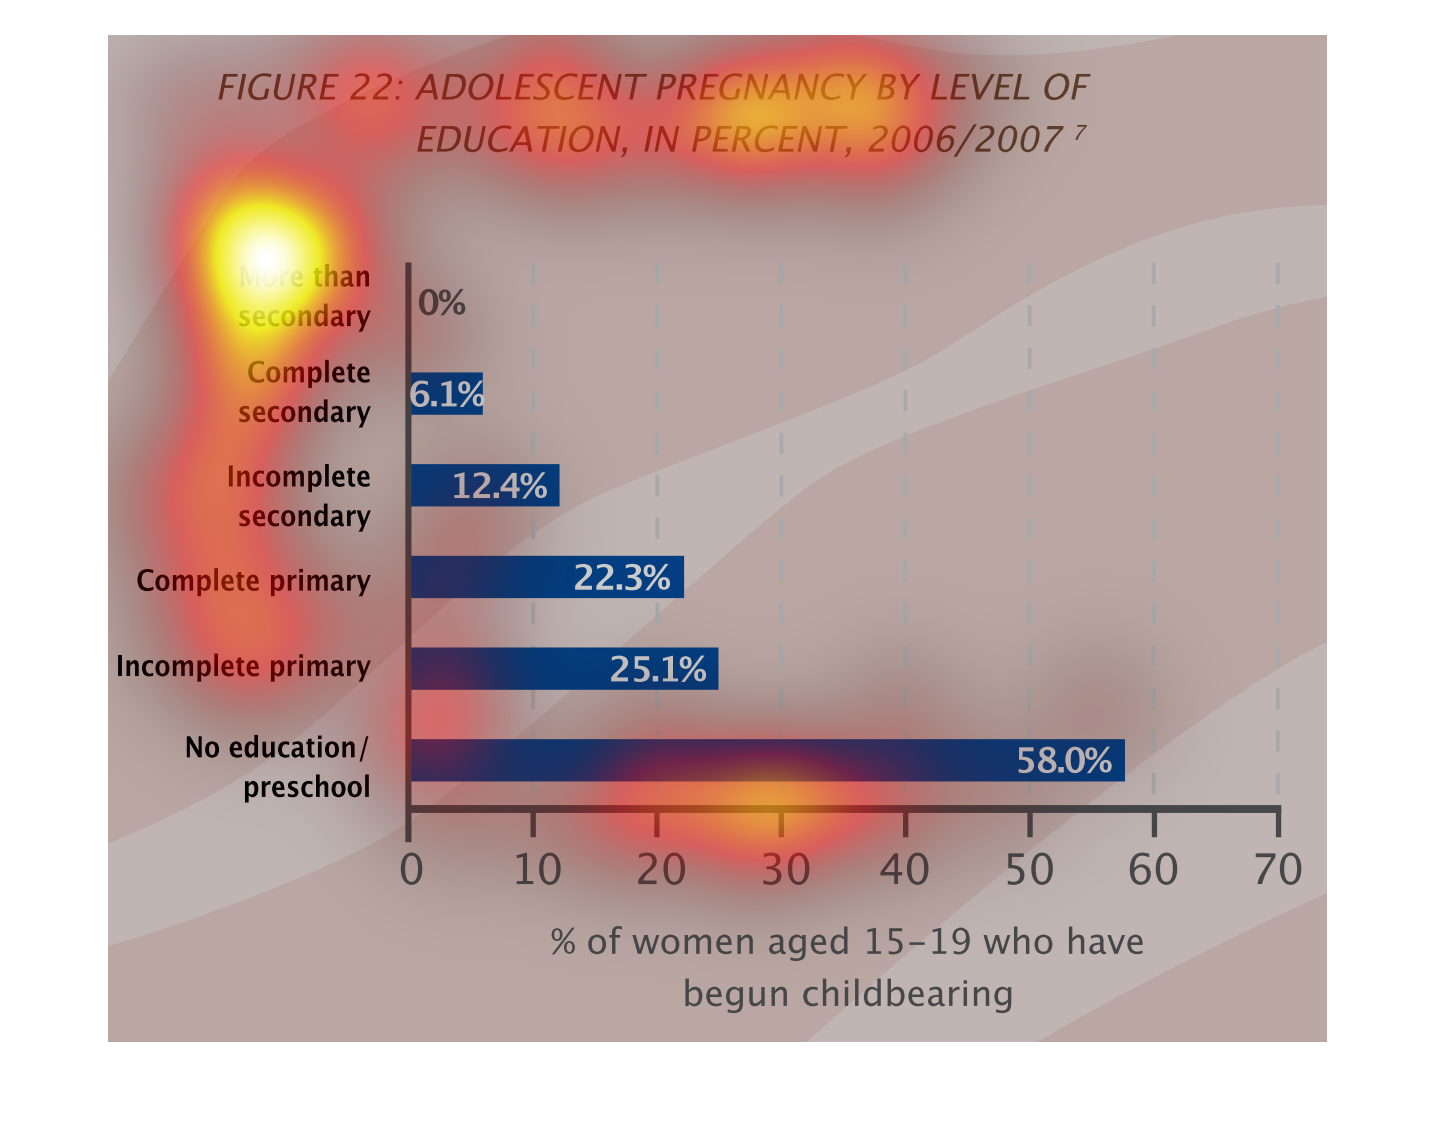
This is a bar graph which is showing adolescent pregnancy statistics by level of education.
 This is depicted in percentages and covers the years 2006/2007.  The largest percentage is
for the group of  no eduction/preschool.
This bar chart lists the percentage of adolescent (age 15 - 19) pregnancy in 2006 and 2007,
delimited by education (varying from No education to more than secondary education)
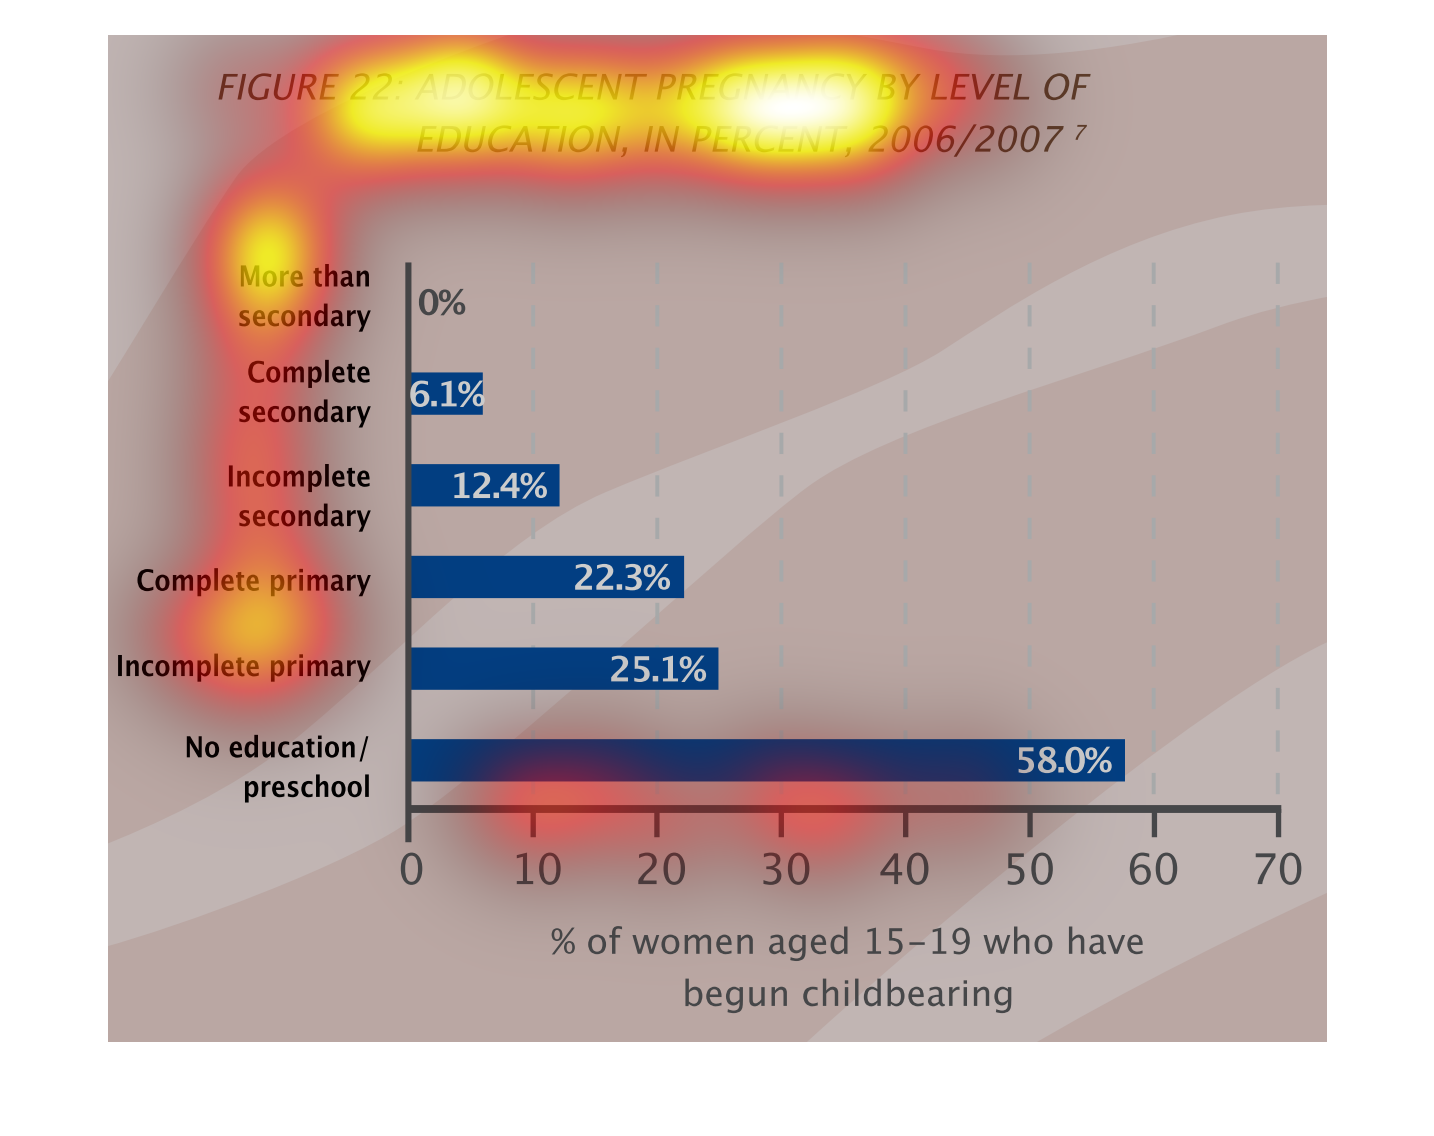
The chart aims to reflect birth rates against the ages/schooling of the females involved in
the study.  It appears to show that the more education a woman attains, the less likely she
is to have children.
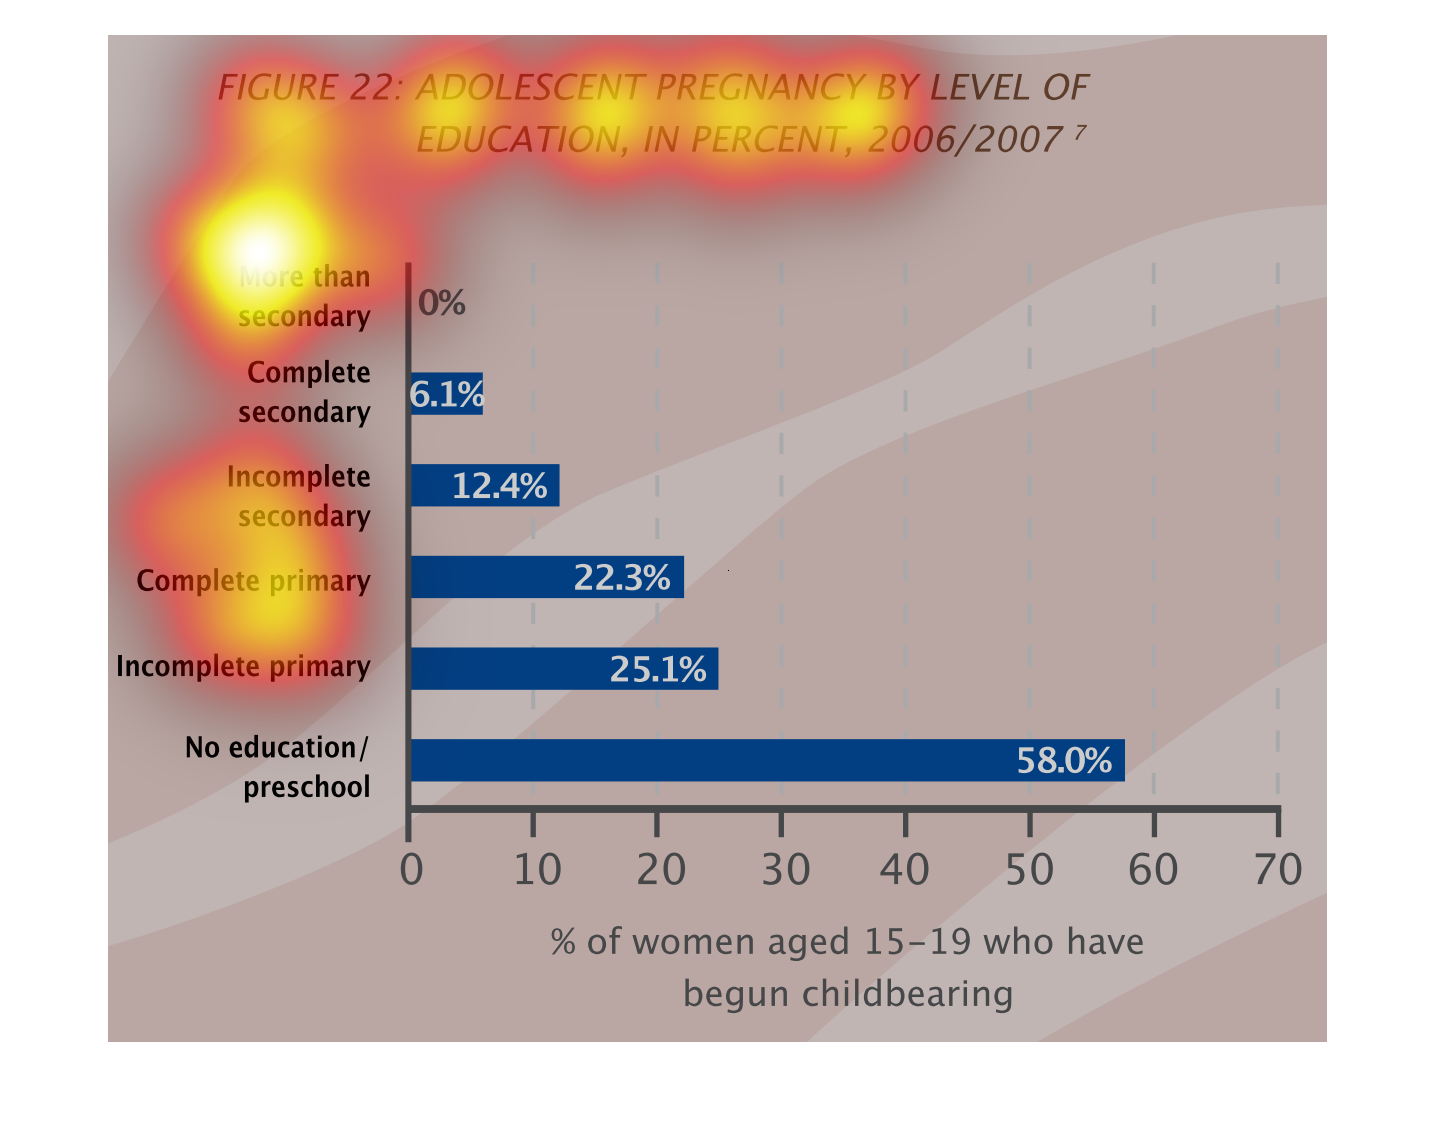
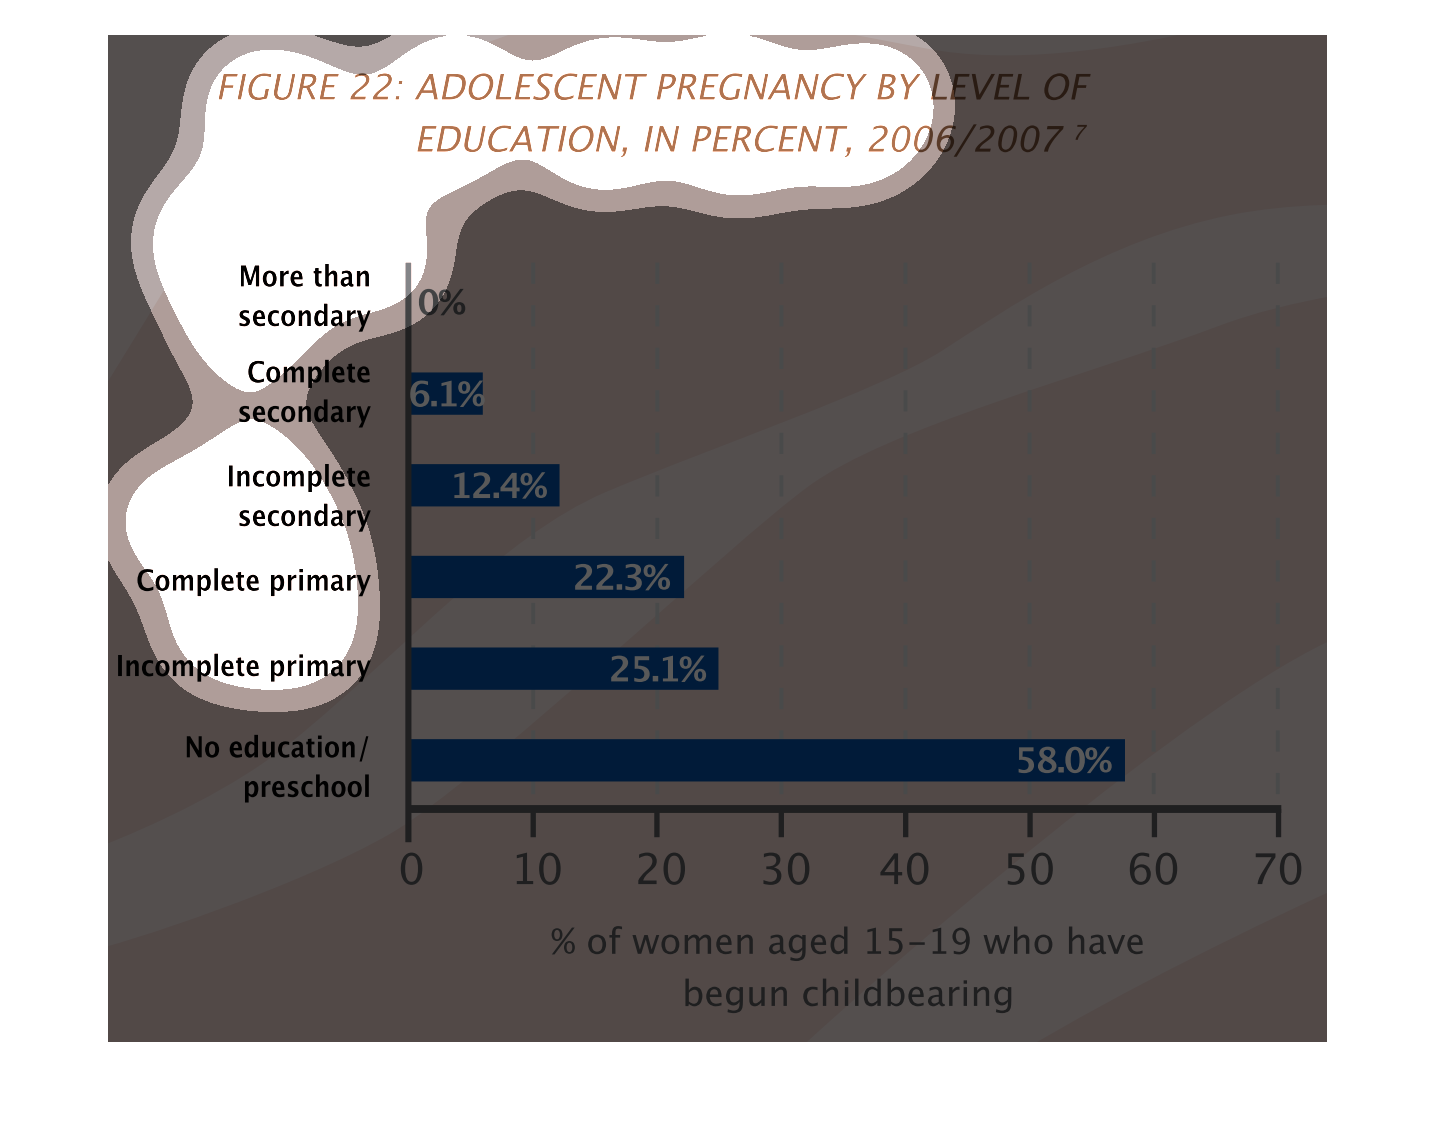
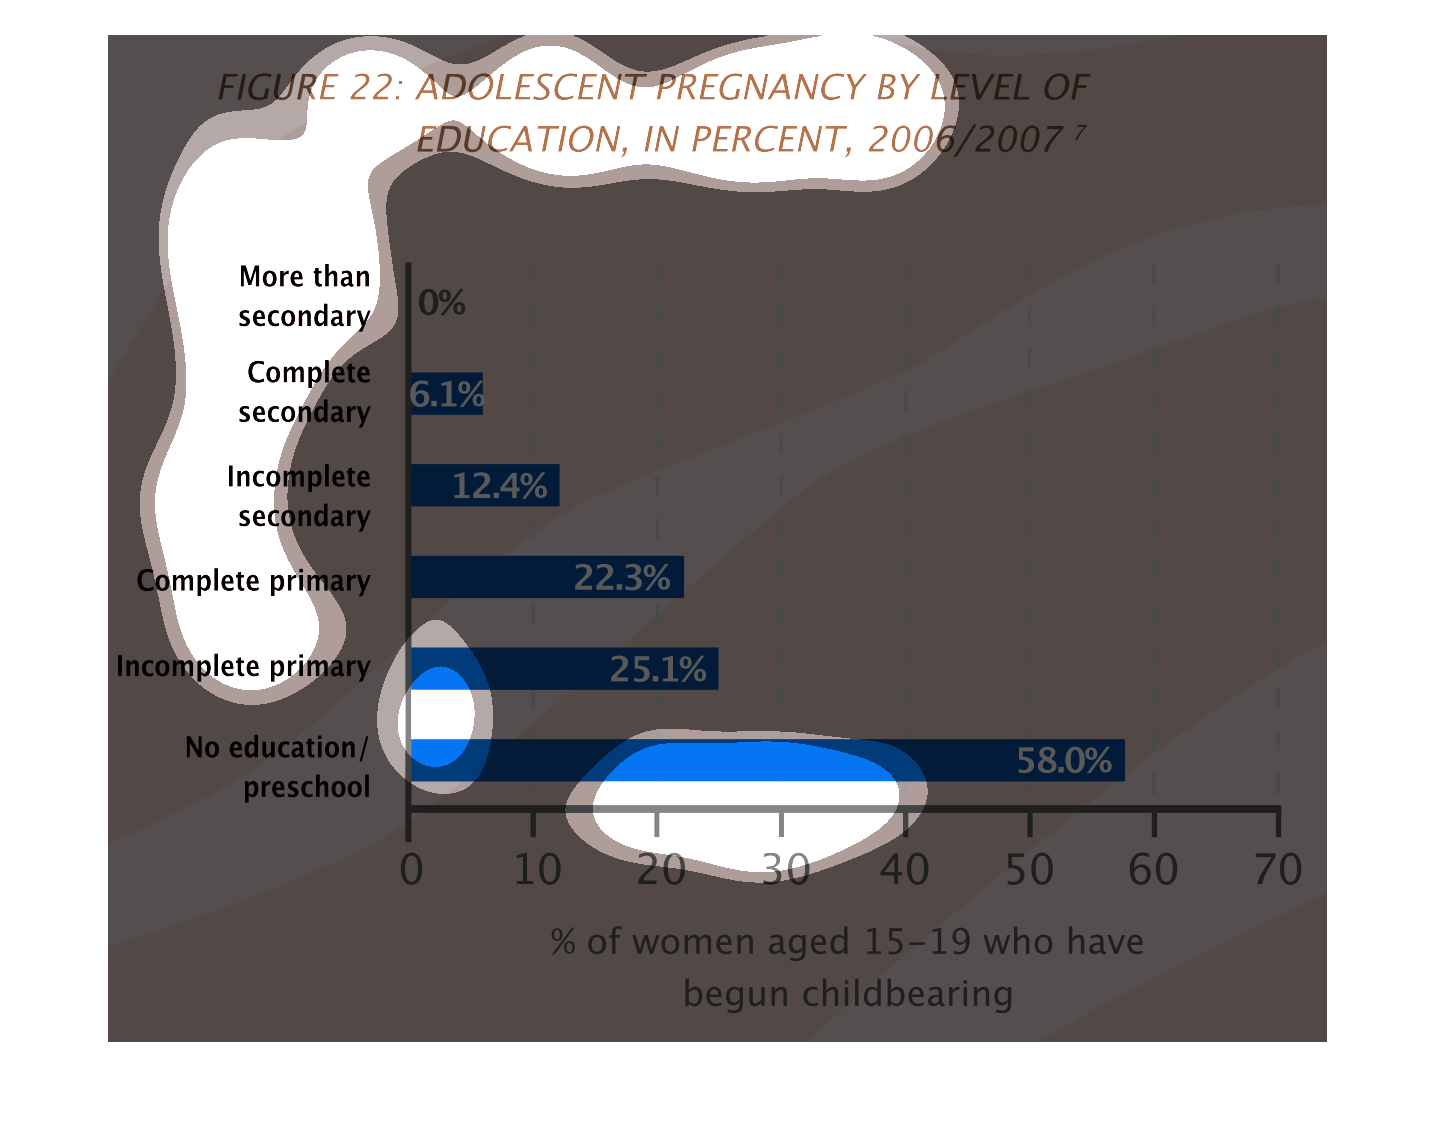
Figure 22 describes adolescent pregnancy by education levels in 2006 and 2007. The adolescent
sample are females from age 15 -19. The education levels range from no education to post-secondary.
The general trend is that as education increases the rate of adolescent pregnancy decreases.
The bulk of the pregnant adolescents have only preschool or no education.
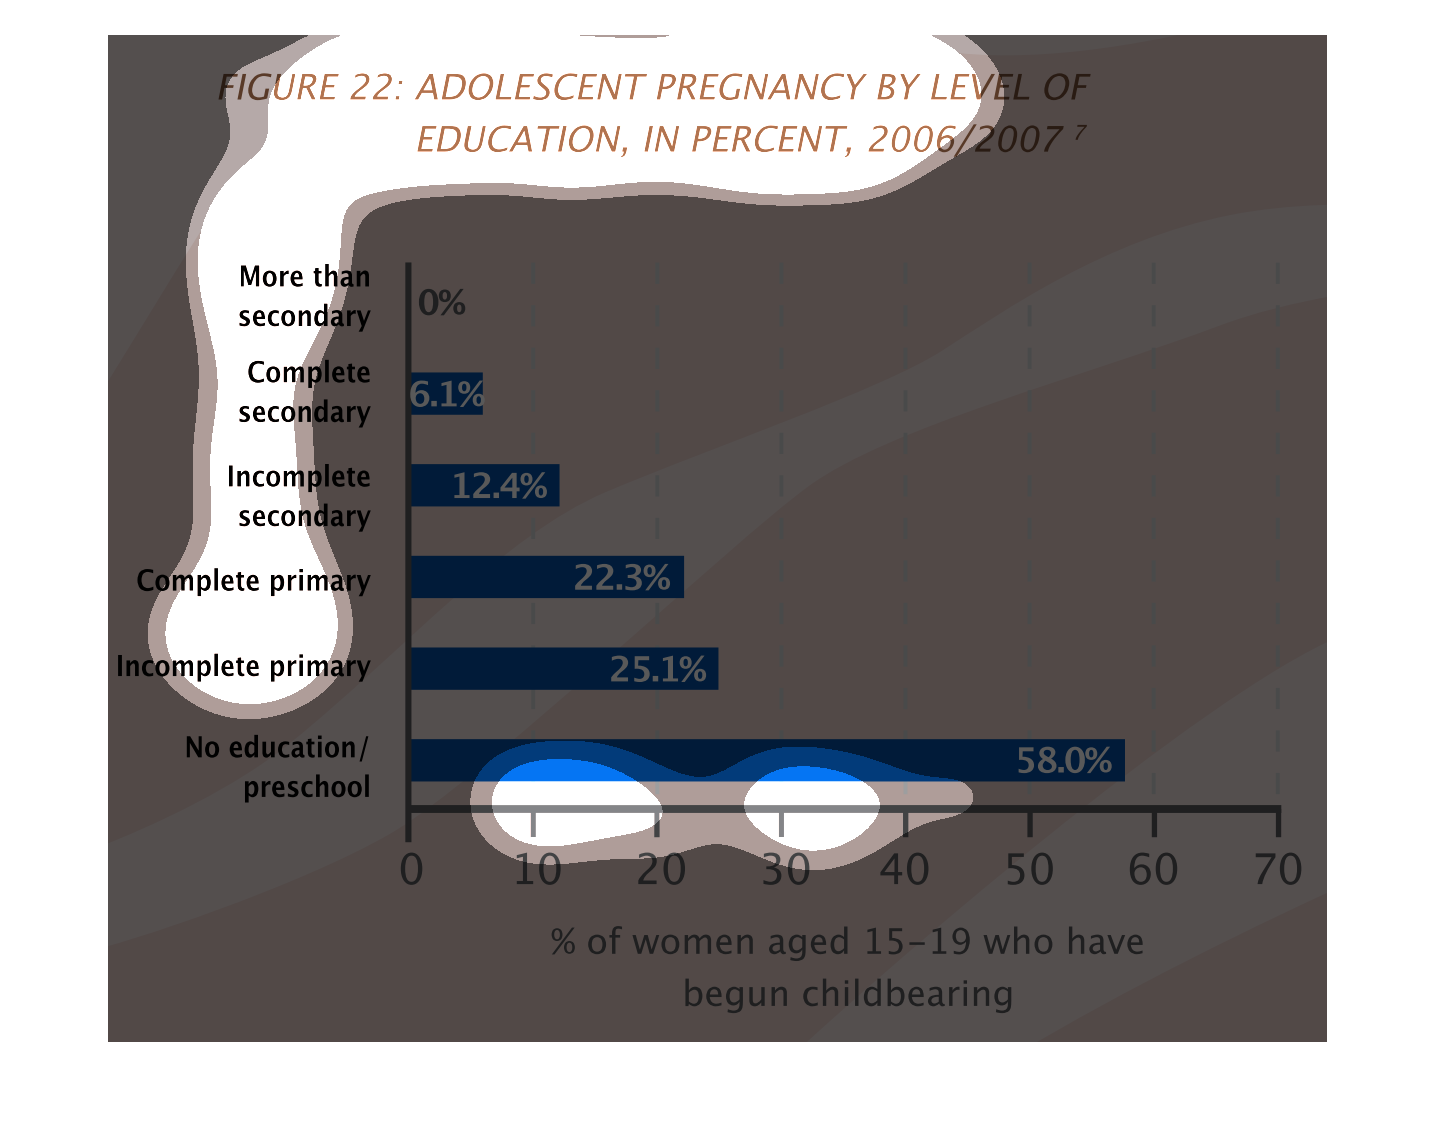
This graph illustrates adolescent rate of pregnancy compared to education in 2006.2007.  No
education has the highest form of pregnancy while secondary education has no percentage of
pregnancy.
This image shows a bar graph which depicts the percentages of adolescent pregnancies (ages
15-19) by level of education in 2006/2007.  Different education levels are listed along the
left hand side of the graph.  Percentages are listed along the bottom.  Bars are then drawn
to show the percentages for each education level.