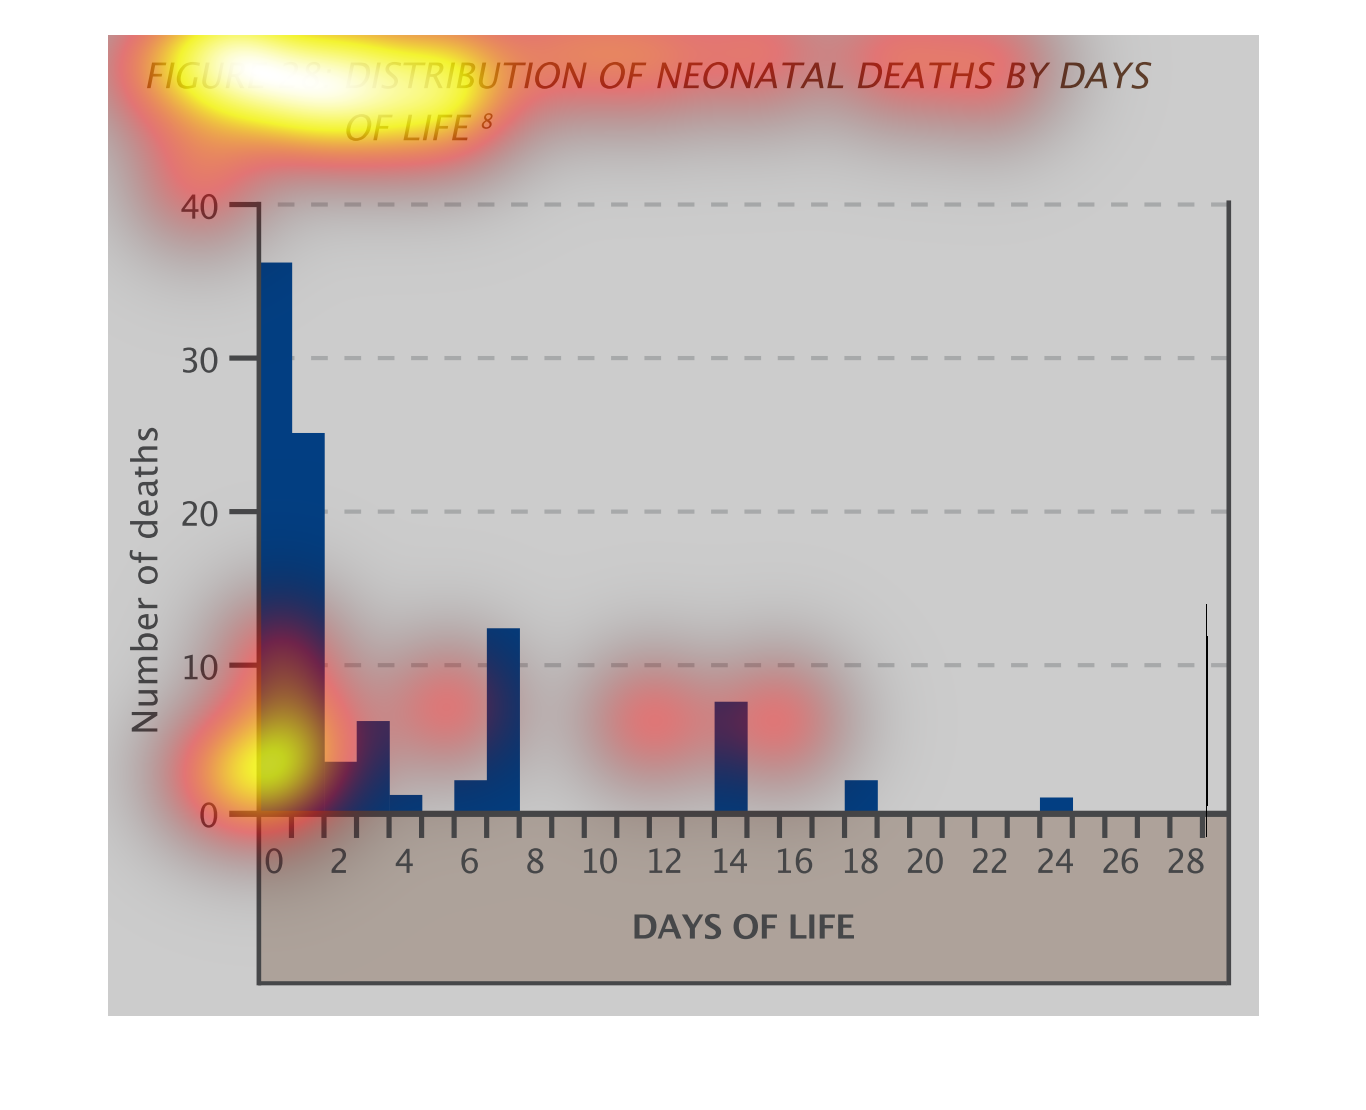
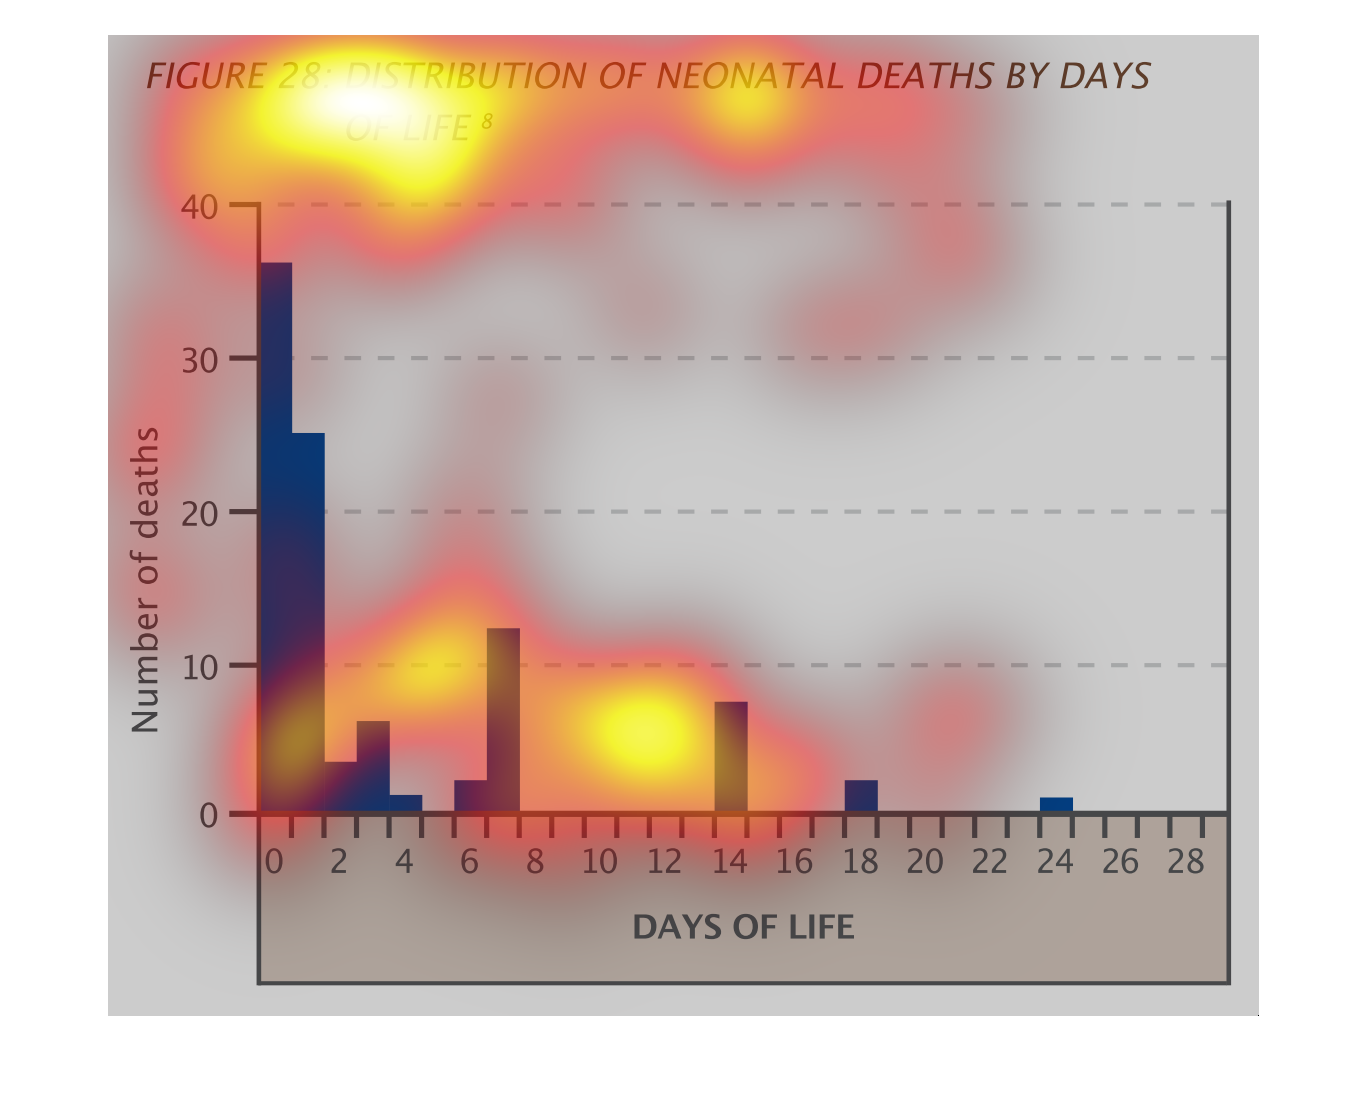
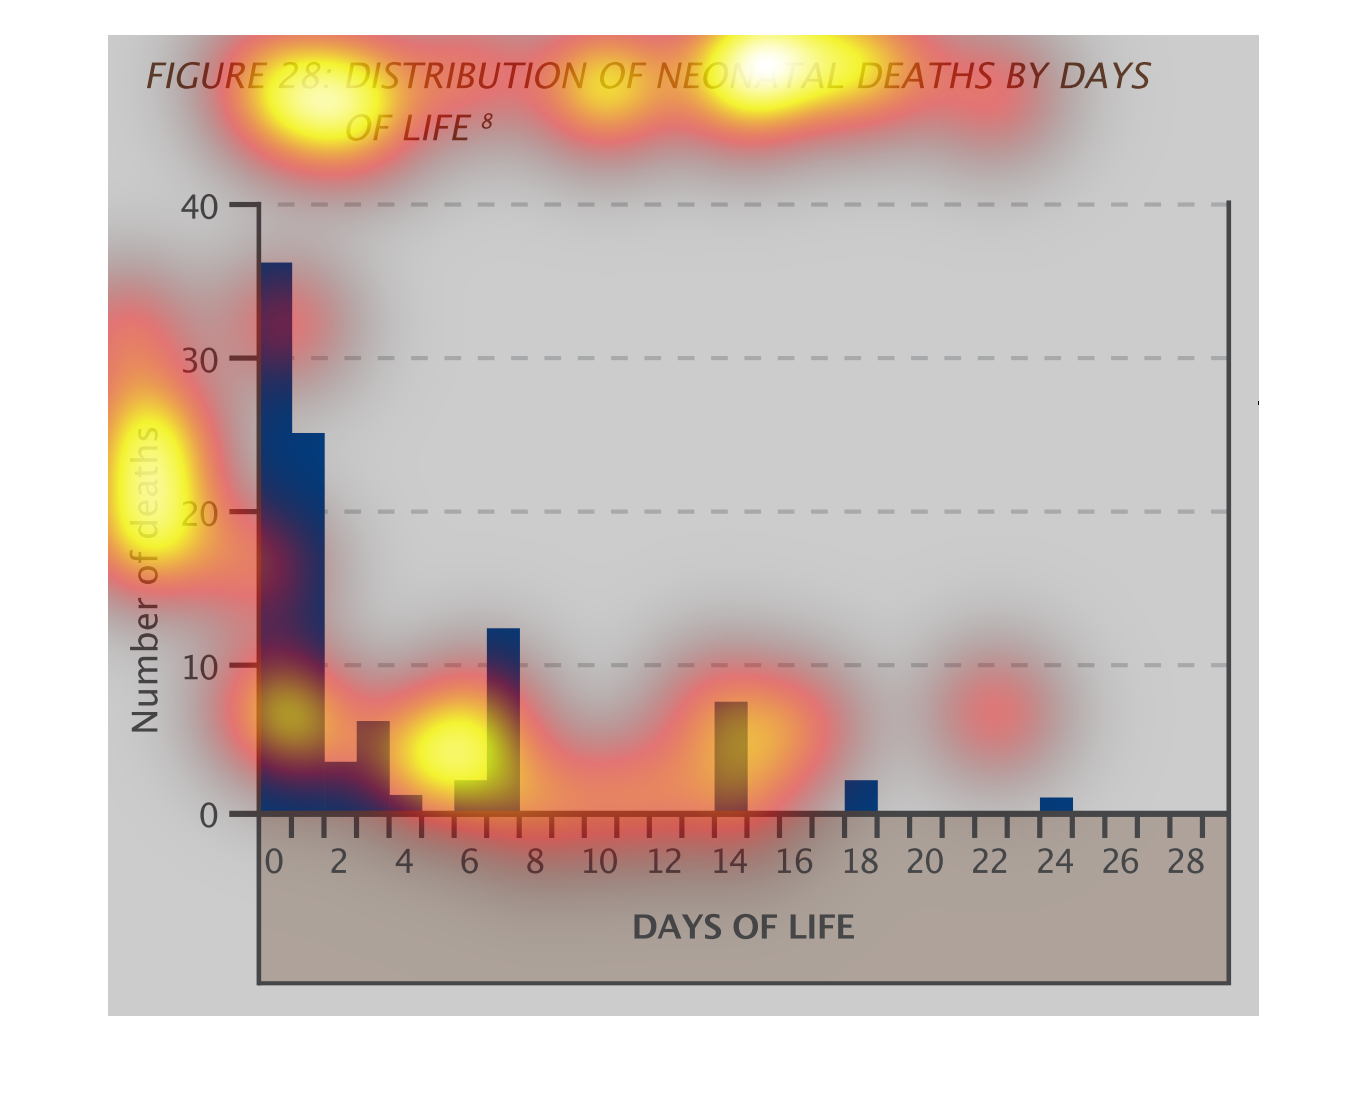
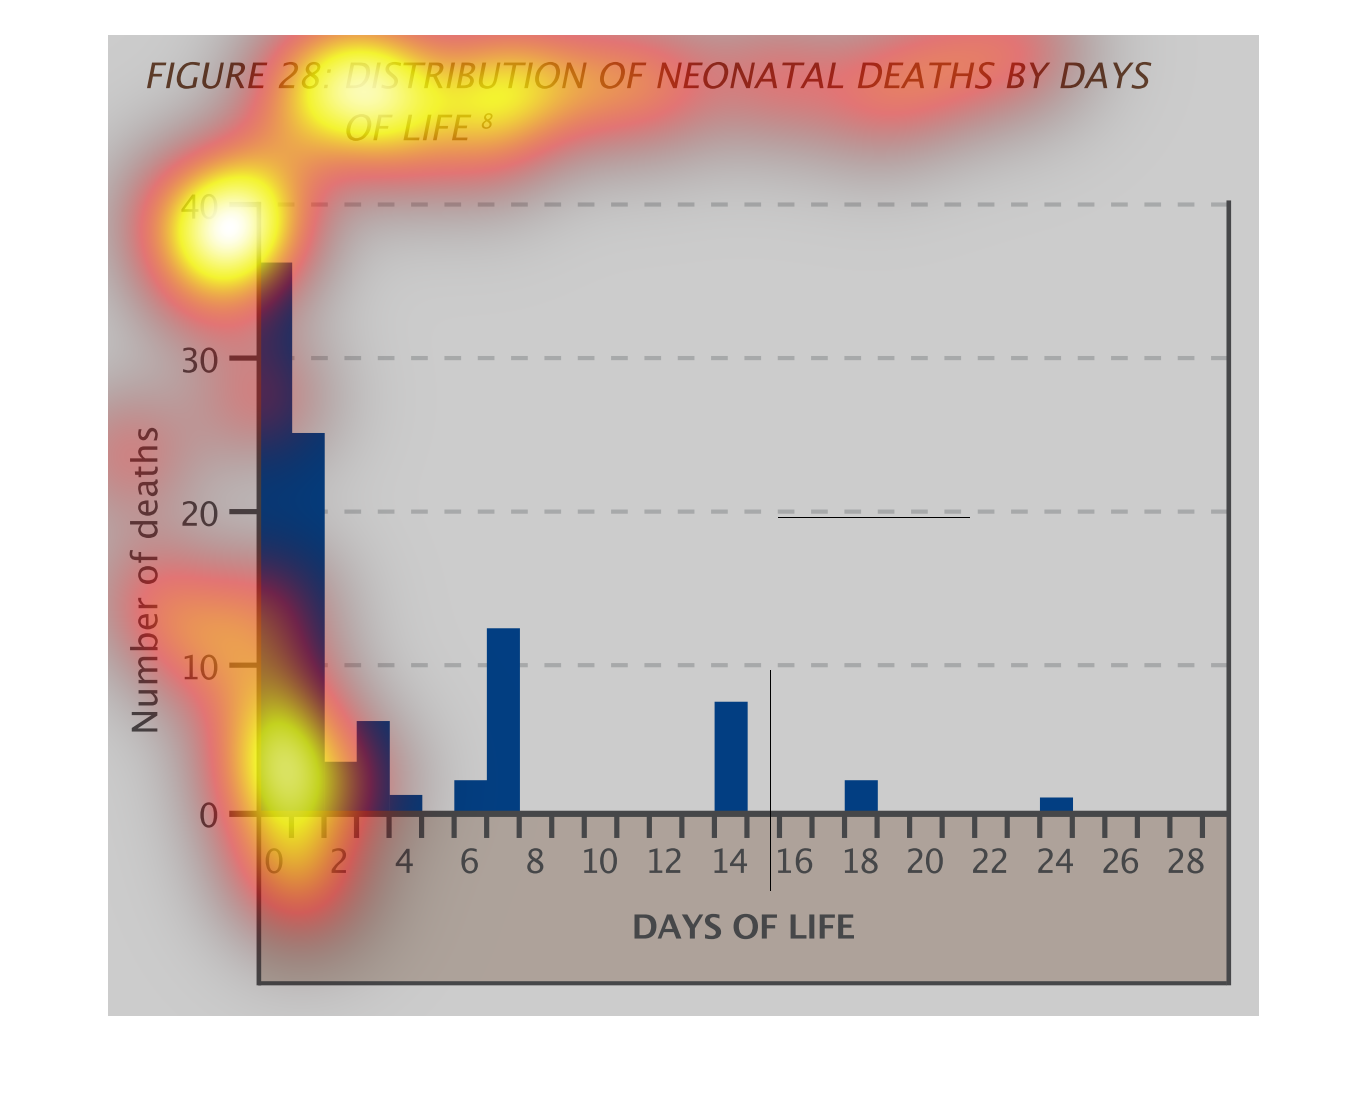
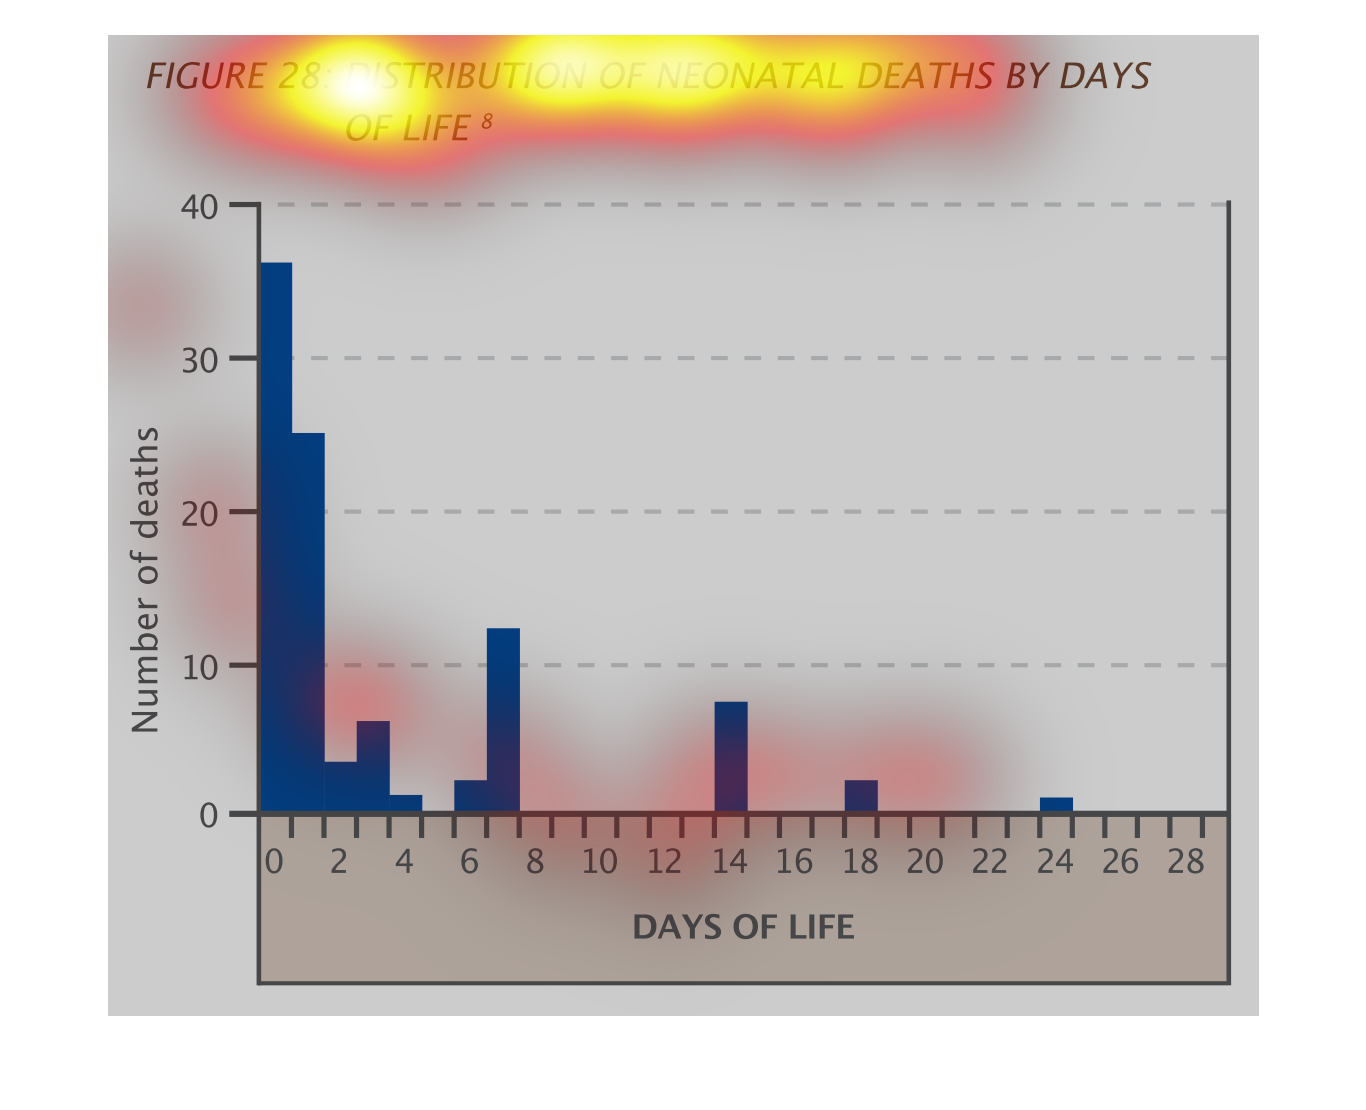
This graph is a representation of Distribution of Neonatal Deaths by Days of Life.  On average,
the number of neonatal deaths decreases as the number of days of life increases.
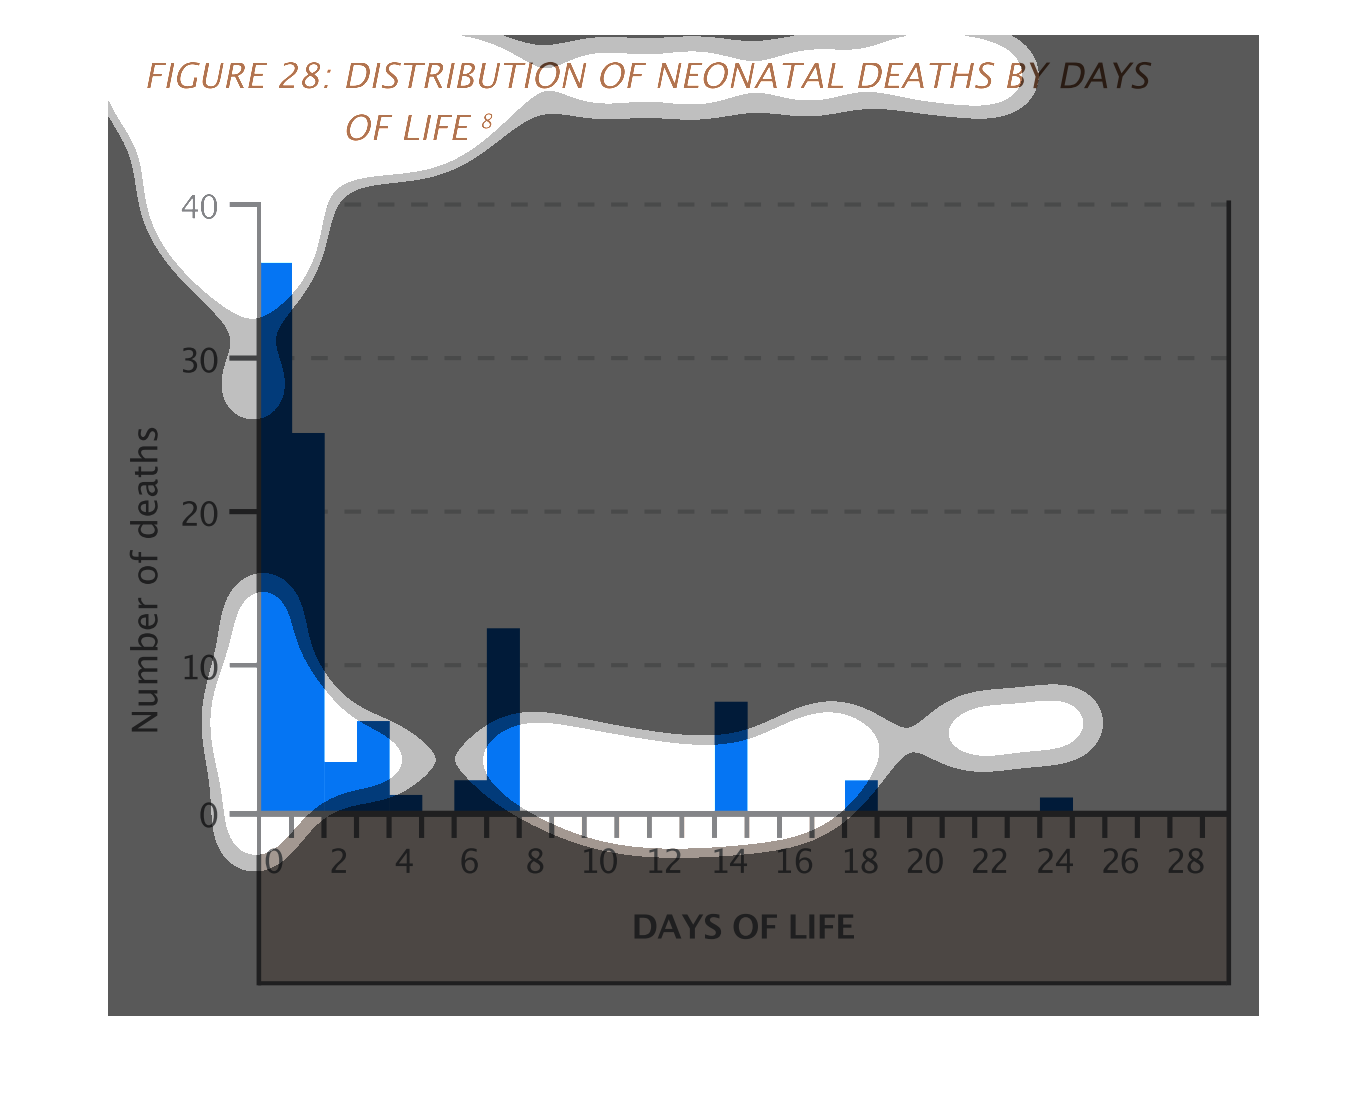
This graph illustrates a distribution of neonatal deaths by days of life.  The number of deaths
axis goes from zero to 40 and the days of life goes from 0 to 28.
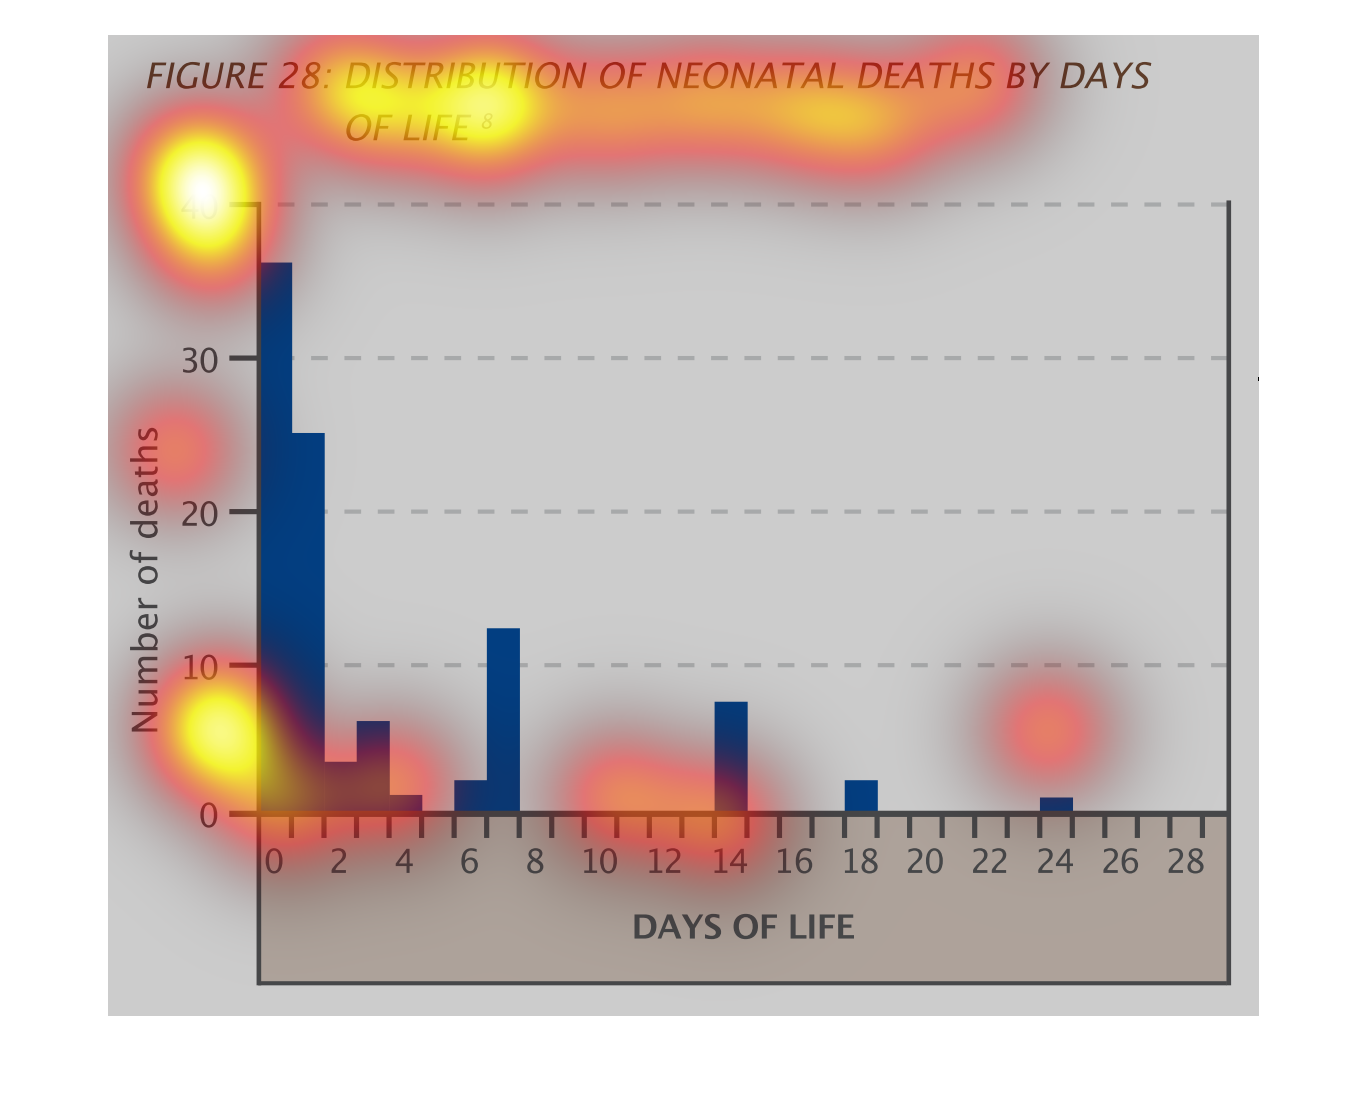
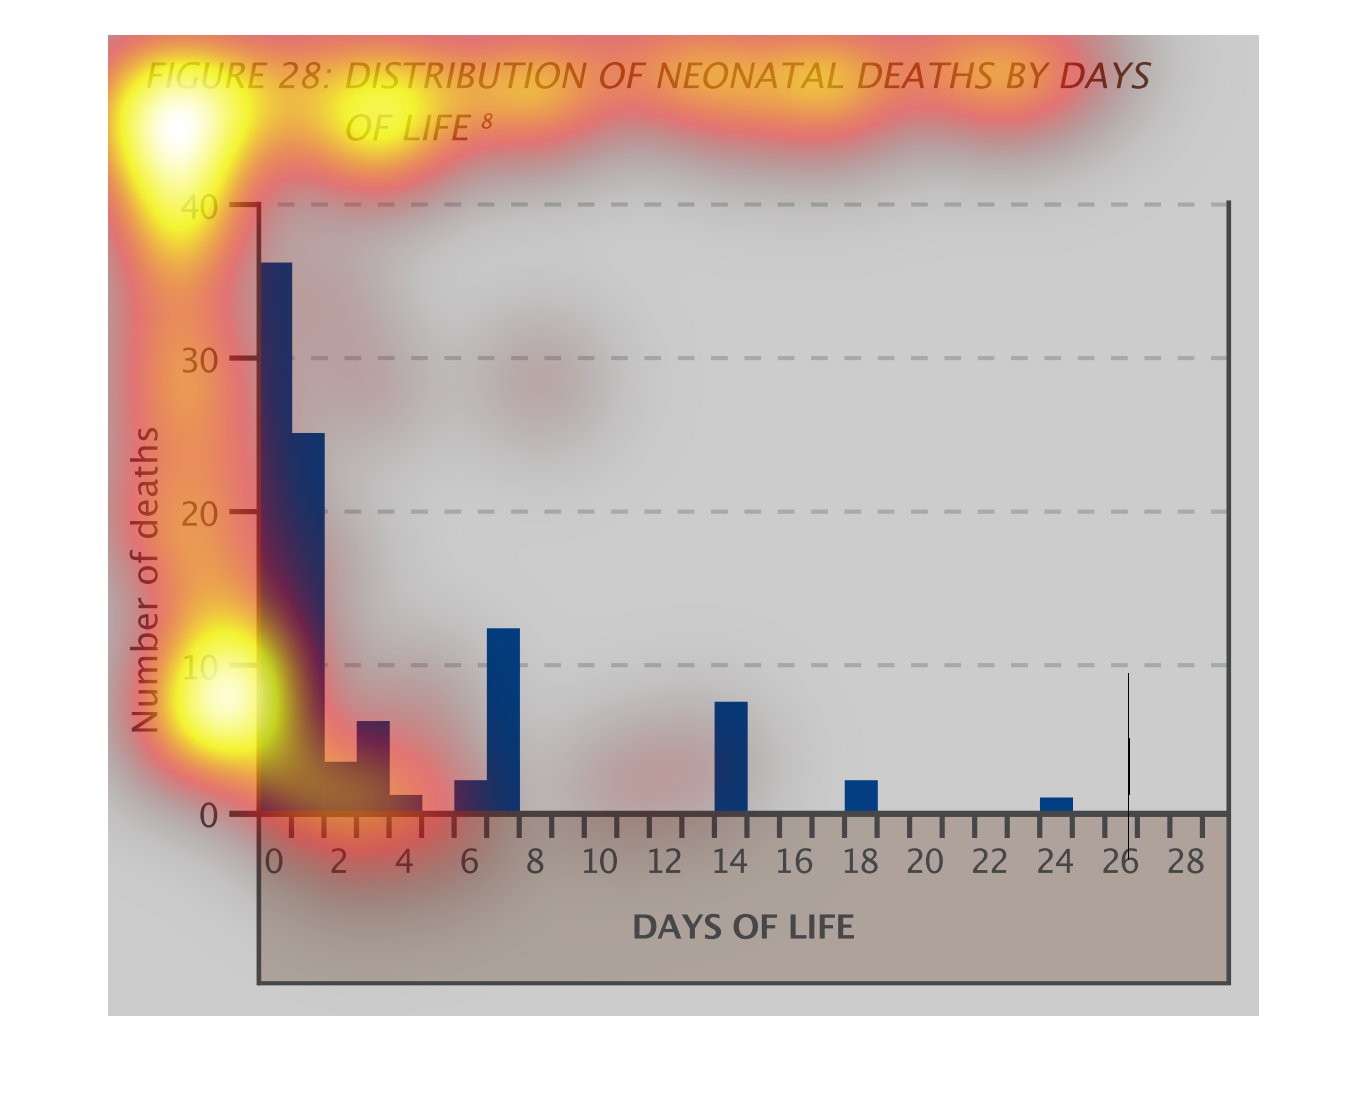
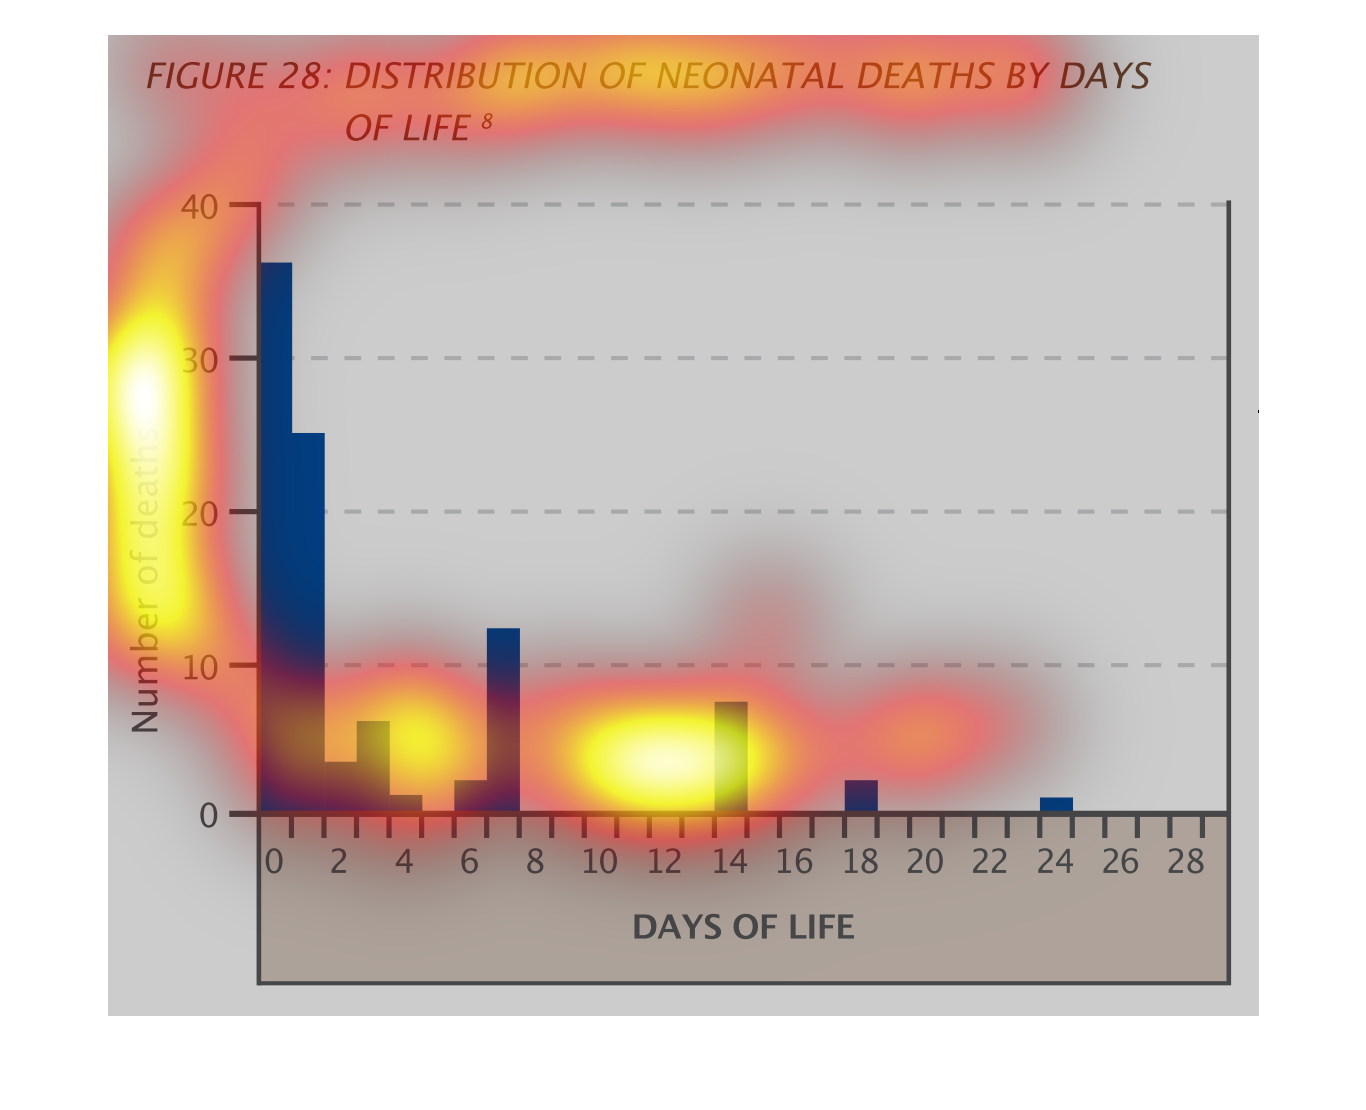
This chart shows the Distribution of Neonatal Deaths by Days of Life.  According to this chart,
the longer a neonatal baby lives, the lower possibility of death may be.

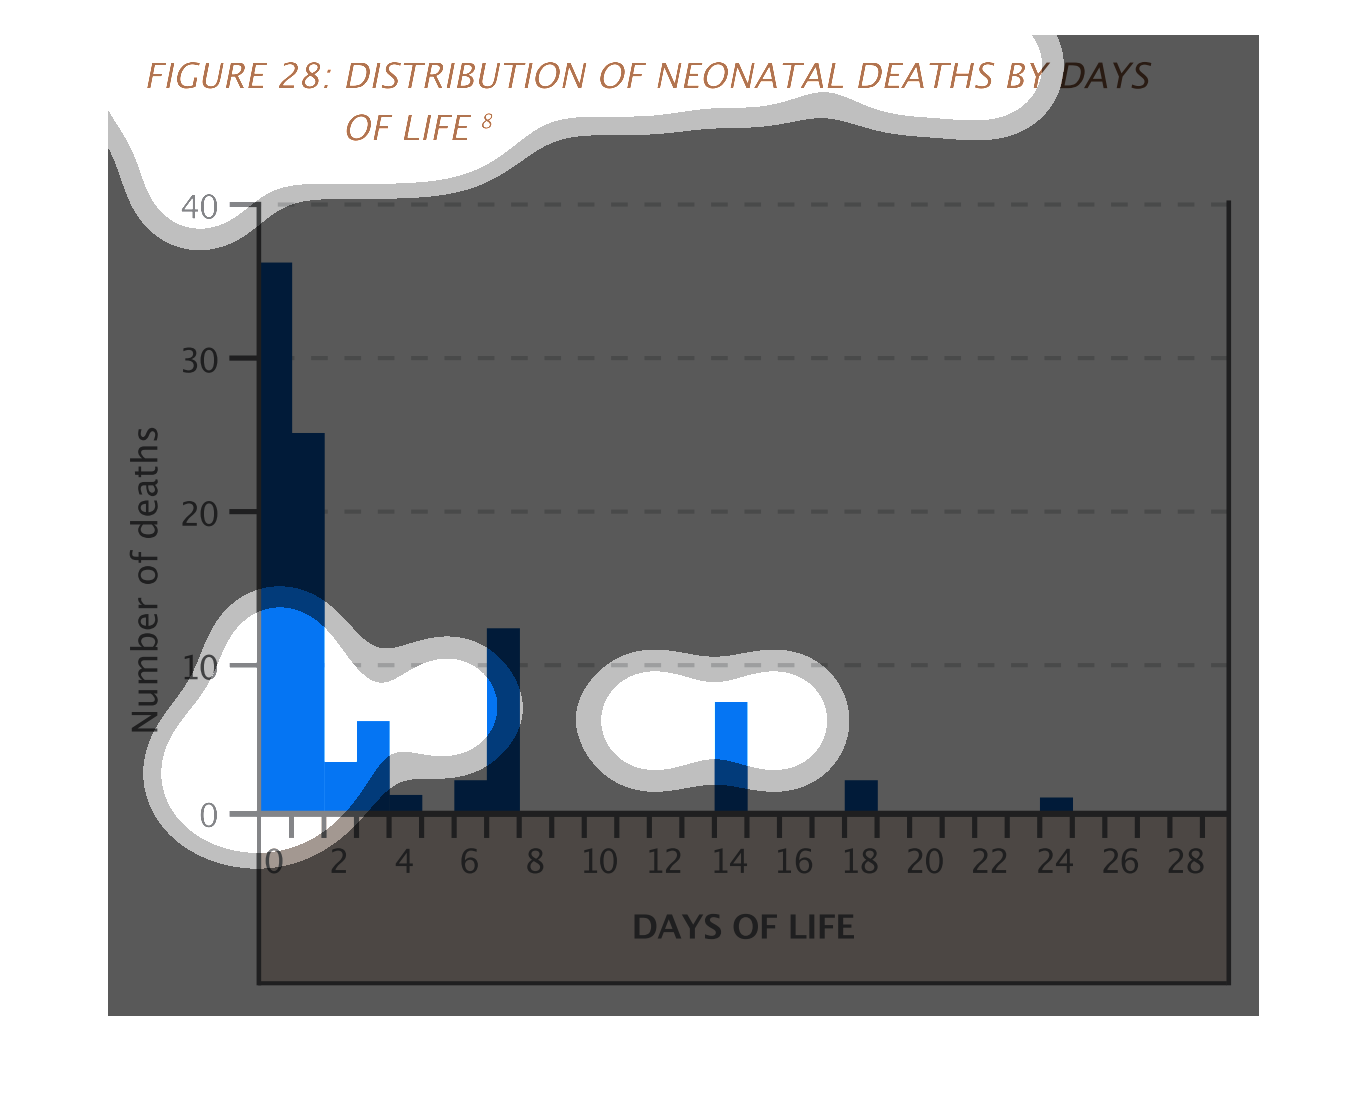
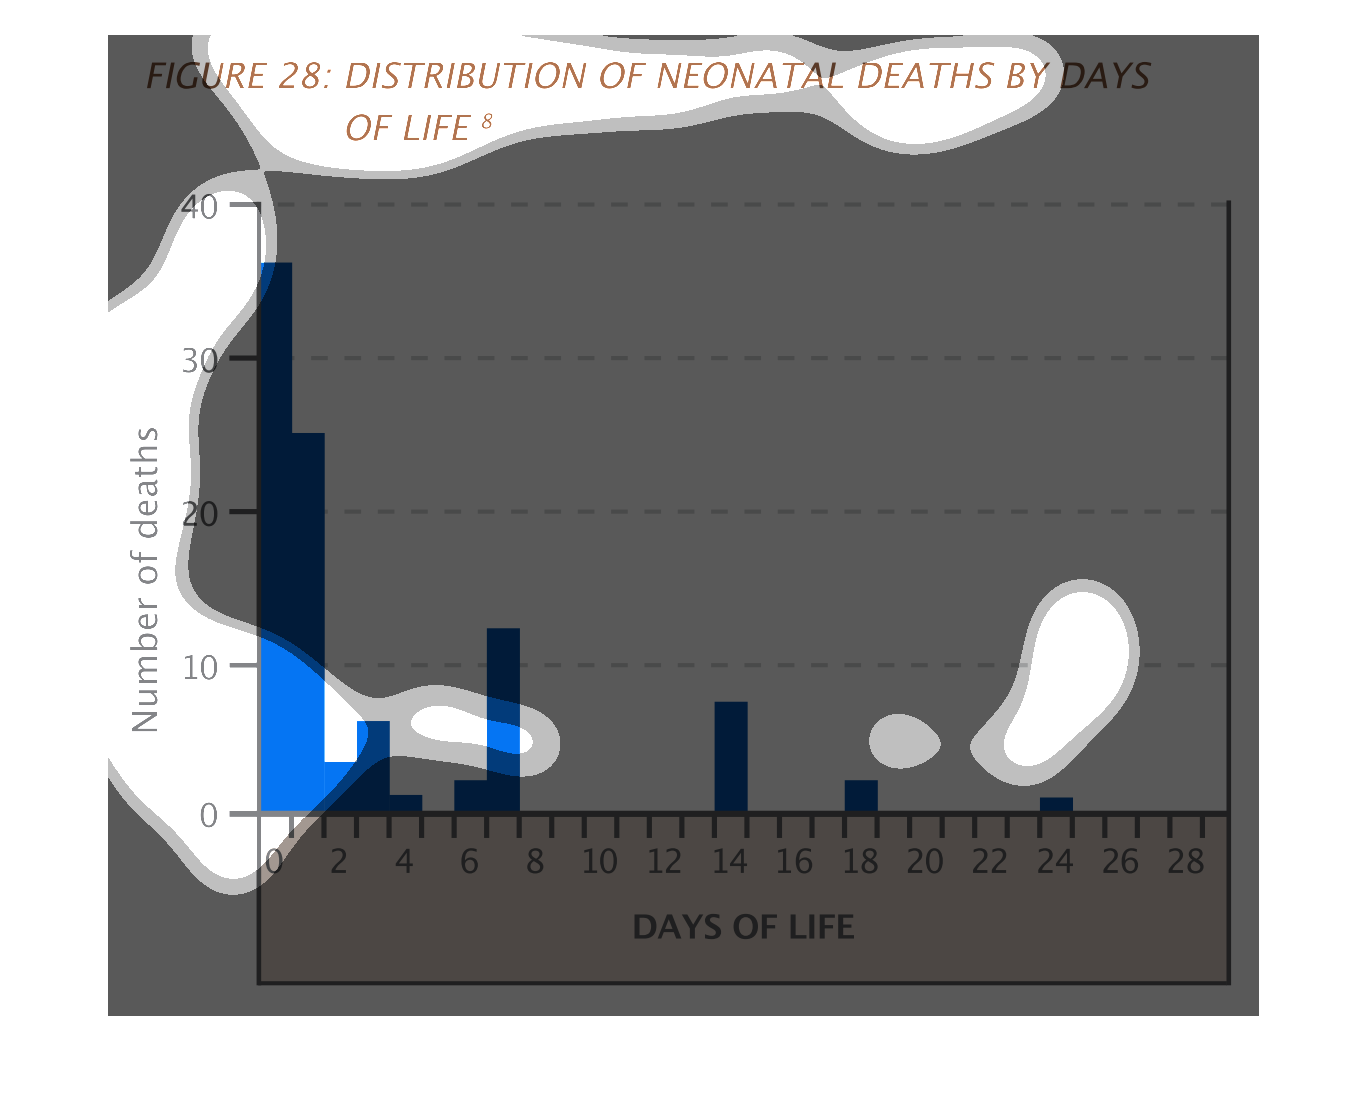
This image or figure shows or depicts in bar graph statistical format the distribution of
neonatal deaths by days of life. The longer of days of life they live shows a dramatic decrease
in these types of deaths.
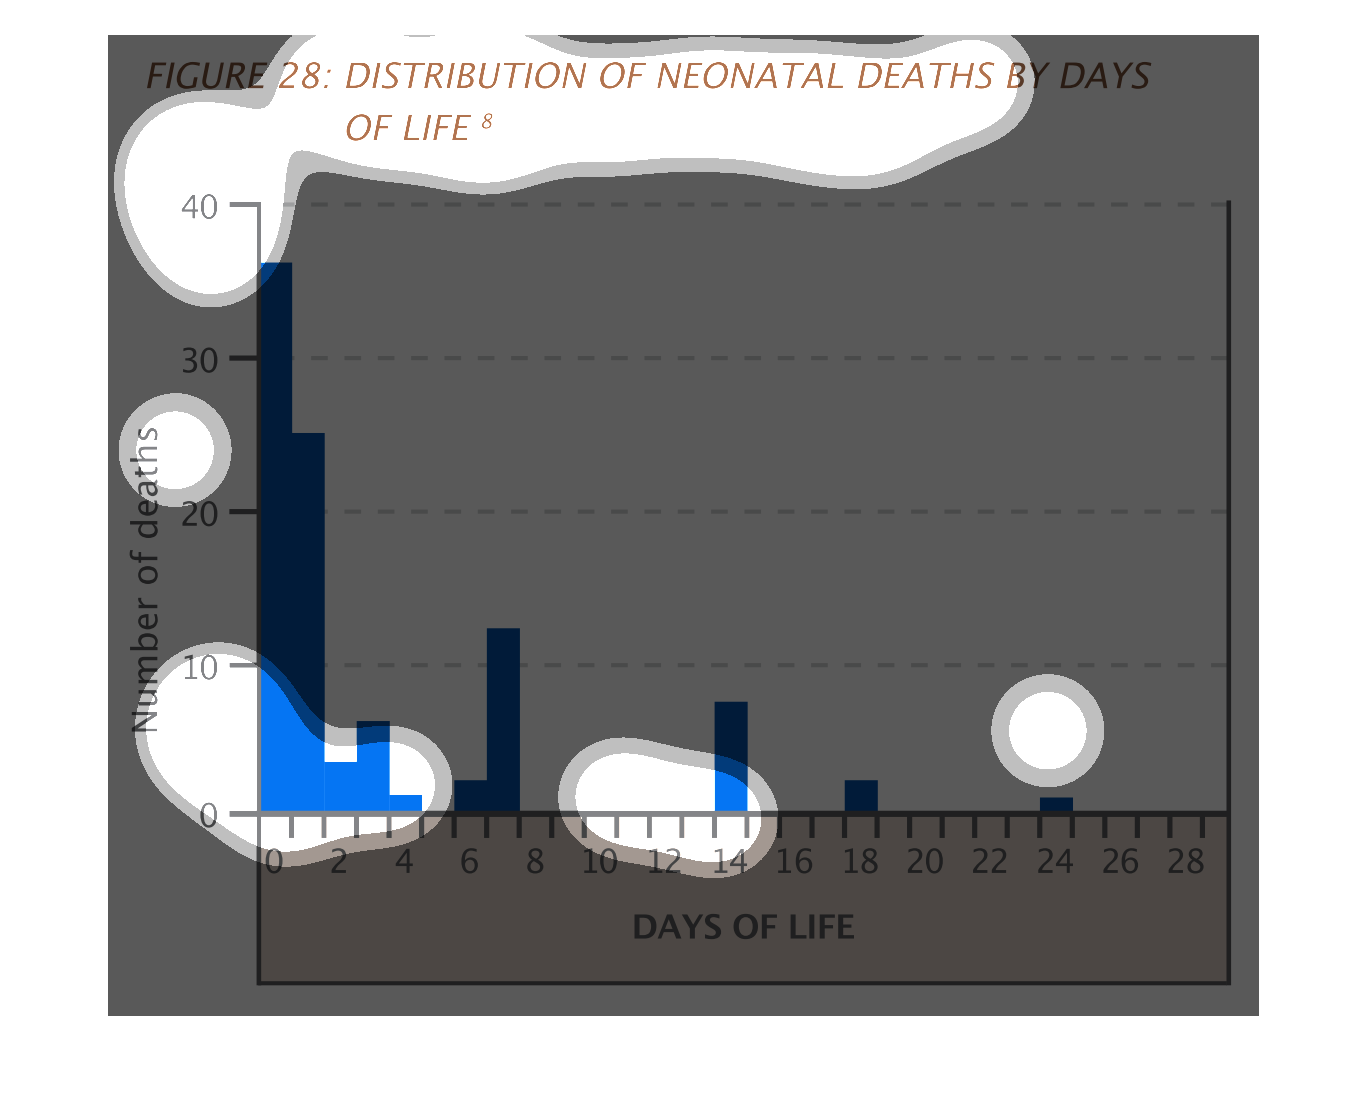
The image within the graph seems to deal with the correlation between the the number of deaths
within a non-disclosed area and the total number of days those person lived.
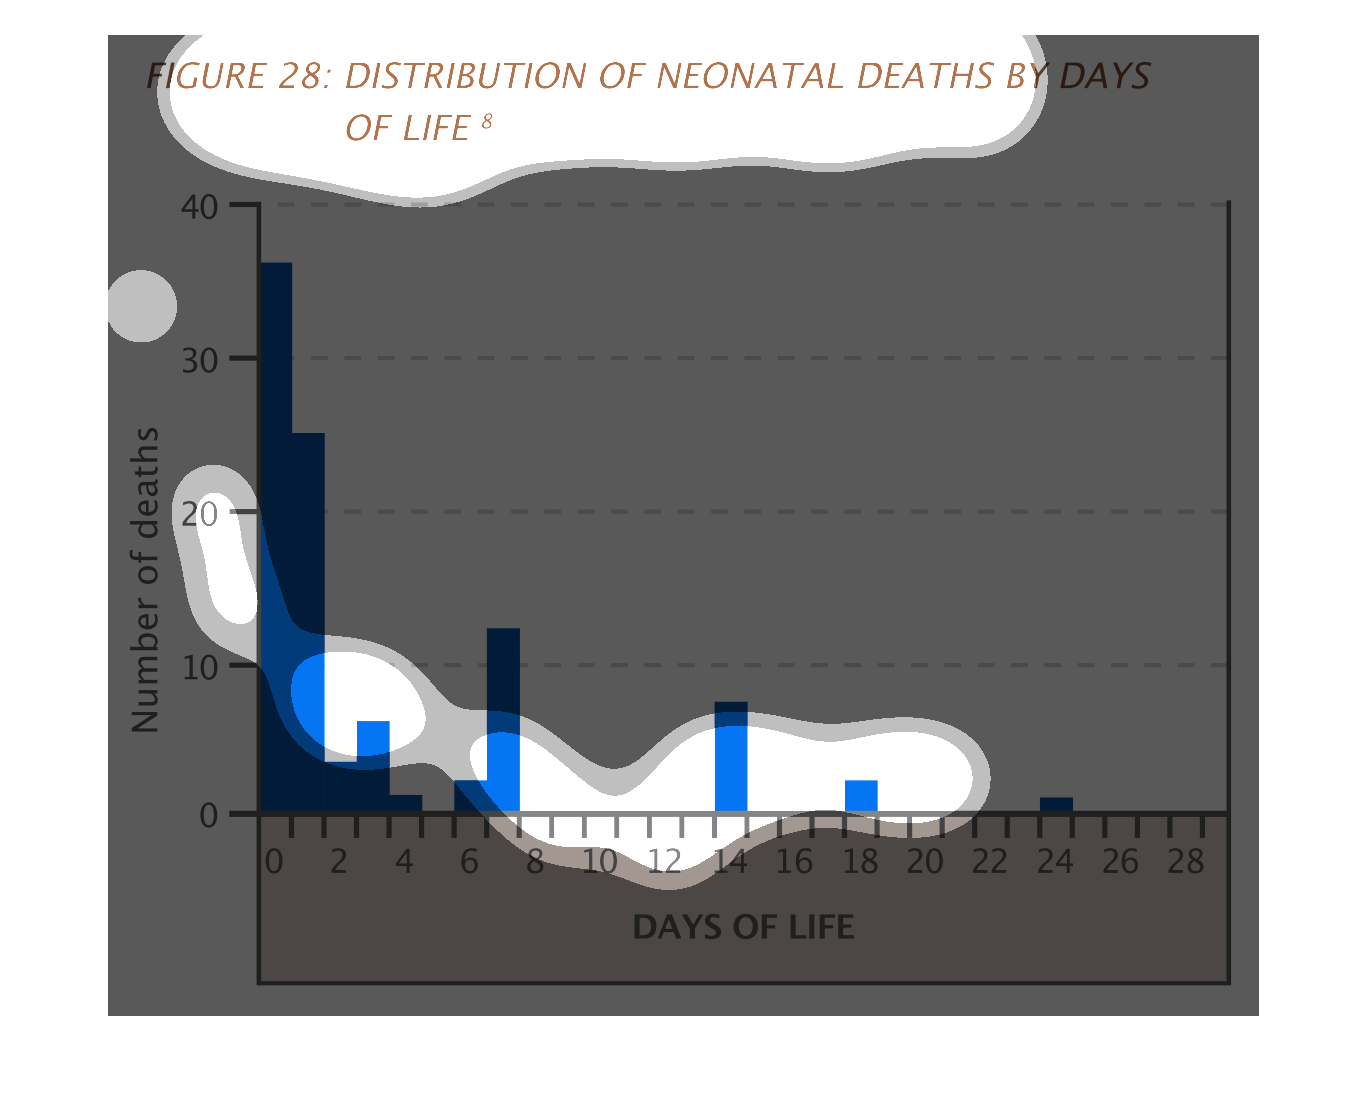
The image shows the death rate of neonatal births. The image shows that there is a much higher
likelihood of a death occurring in the first week of life than the following weeks.
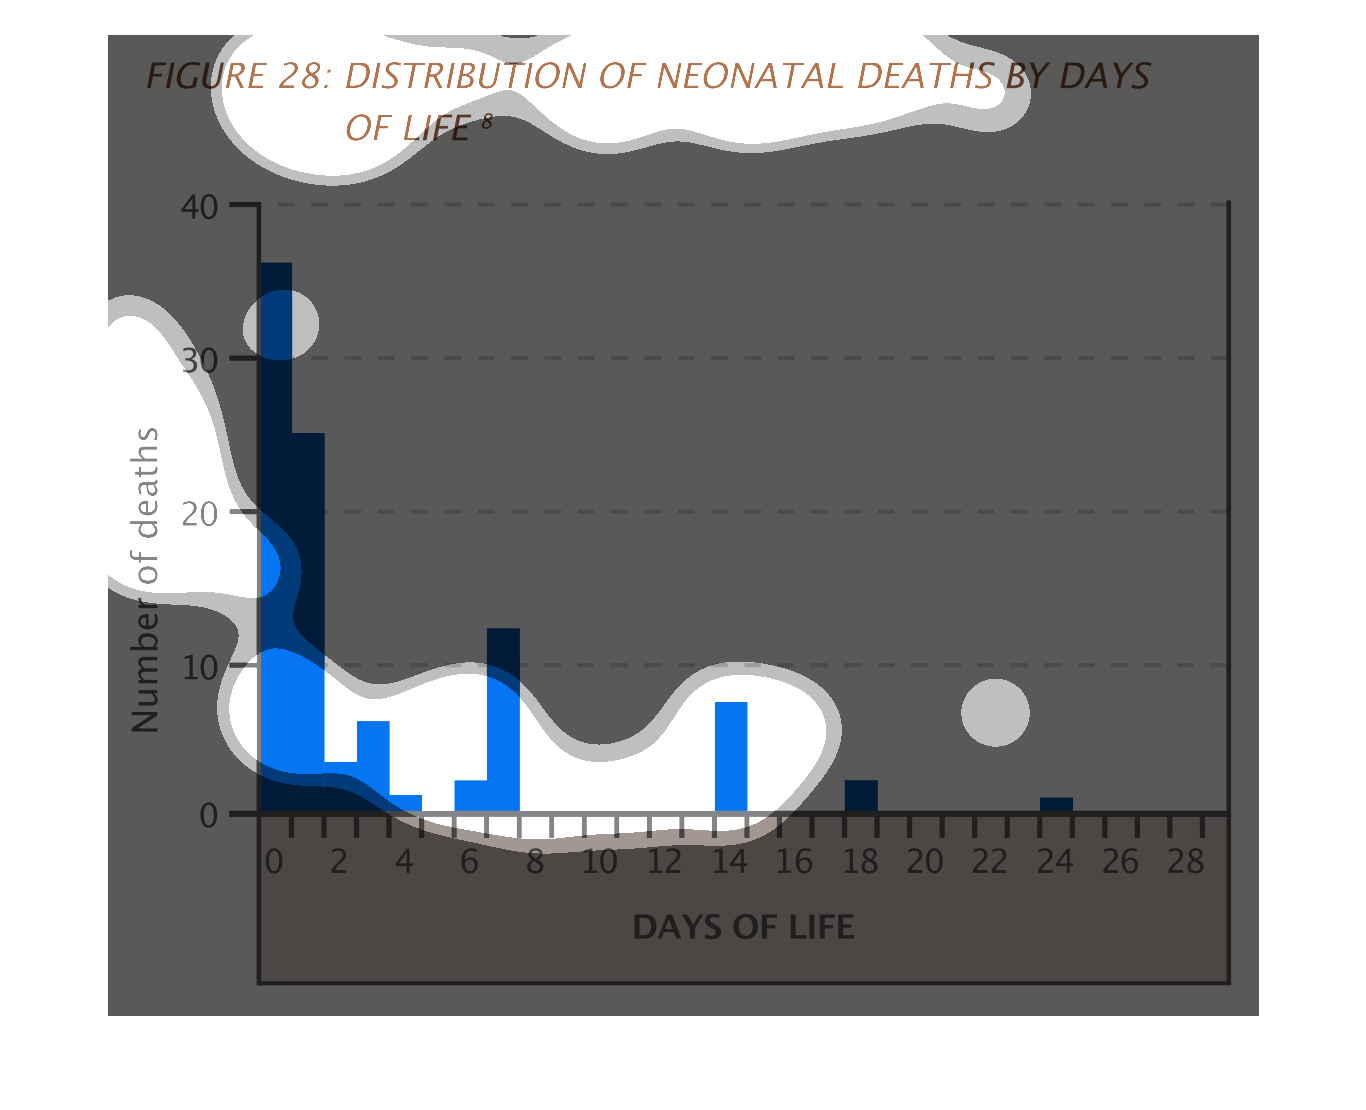
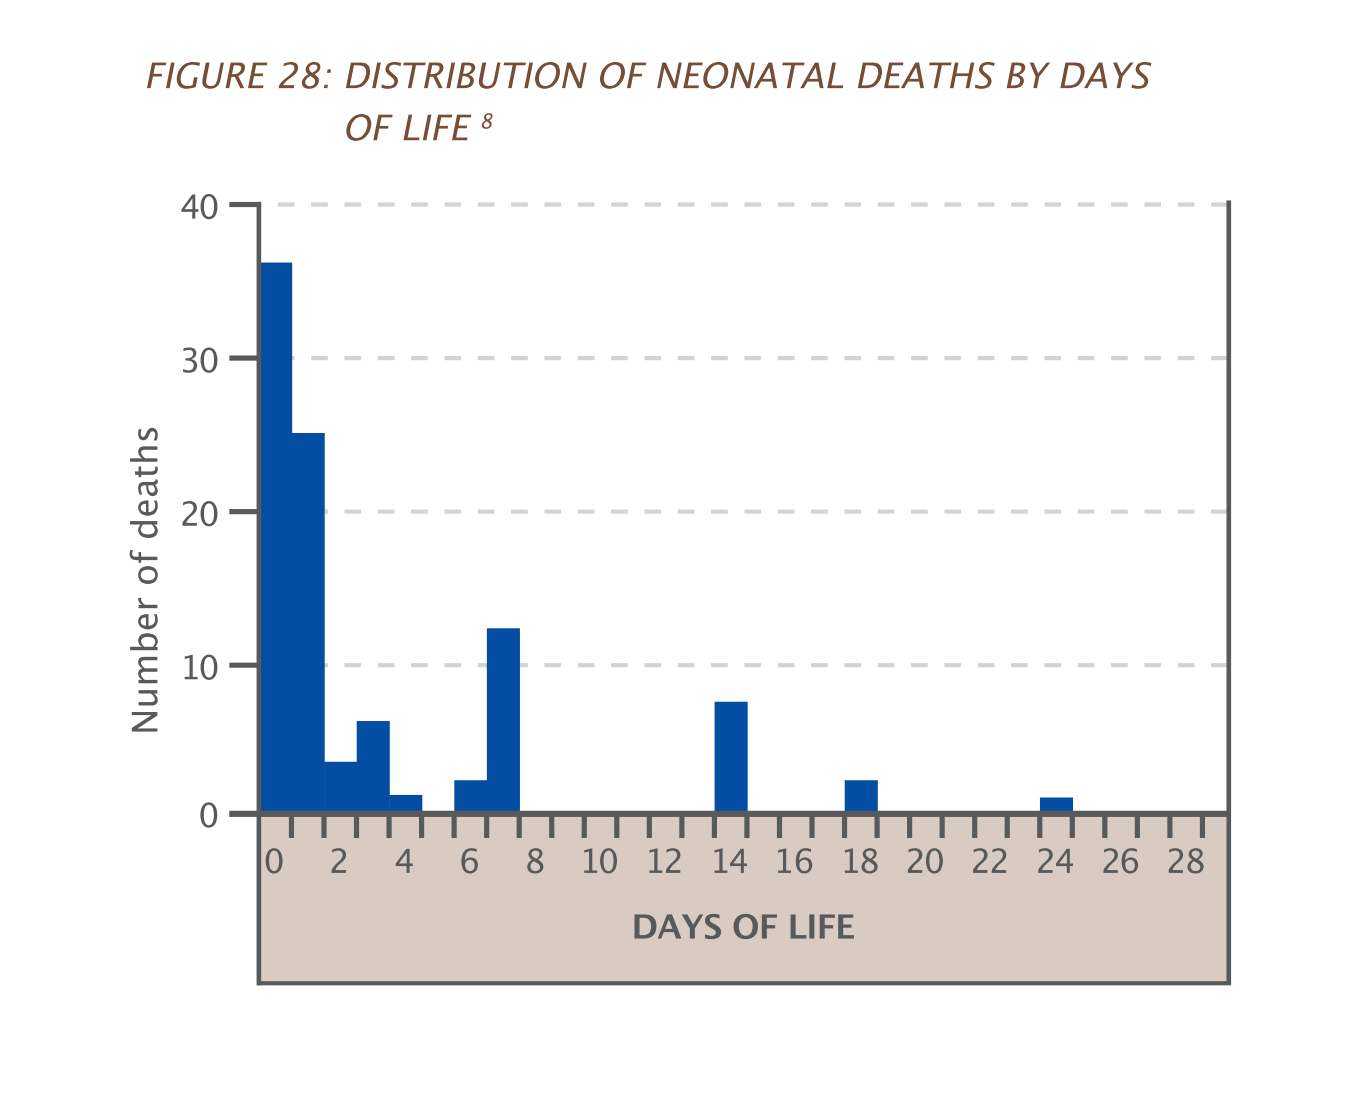
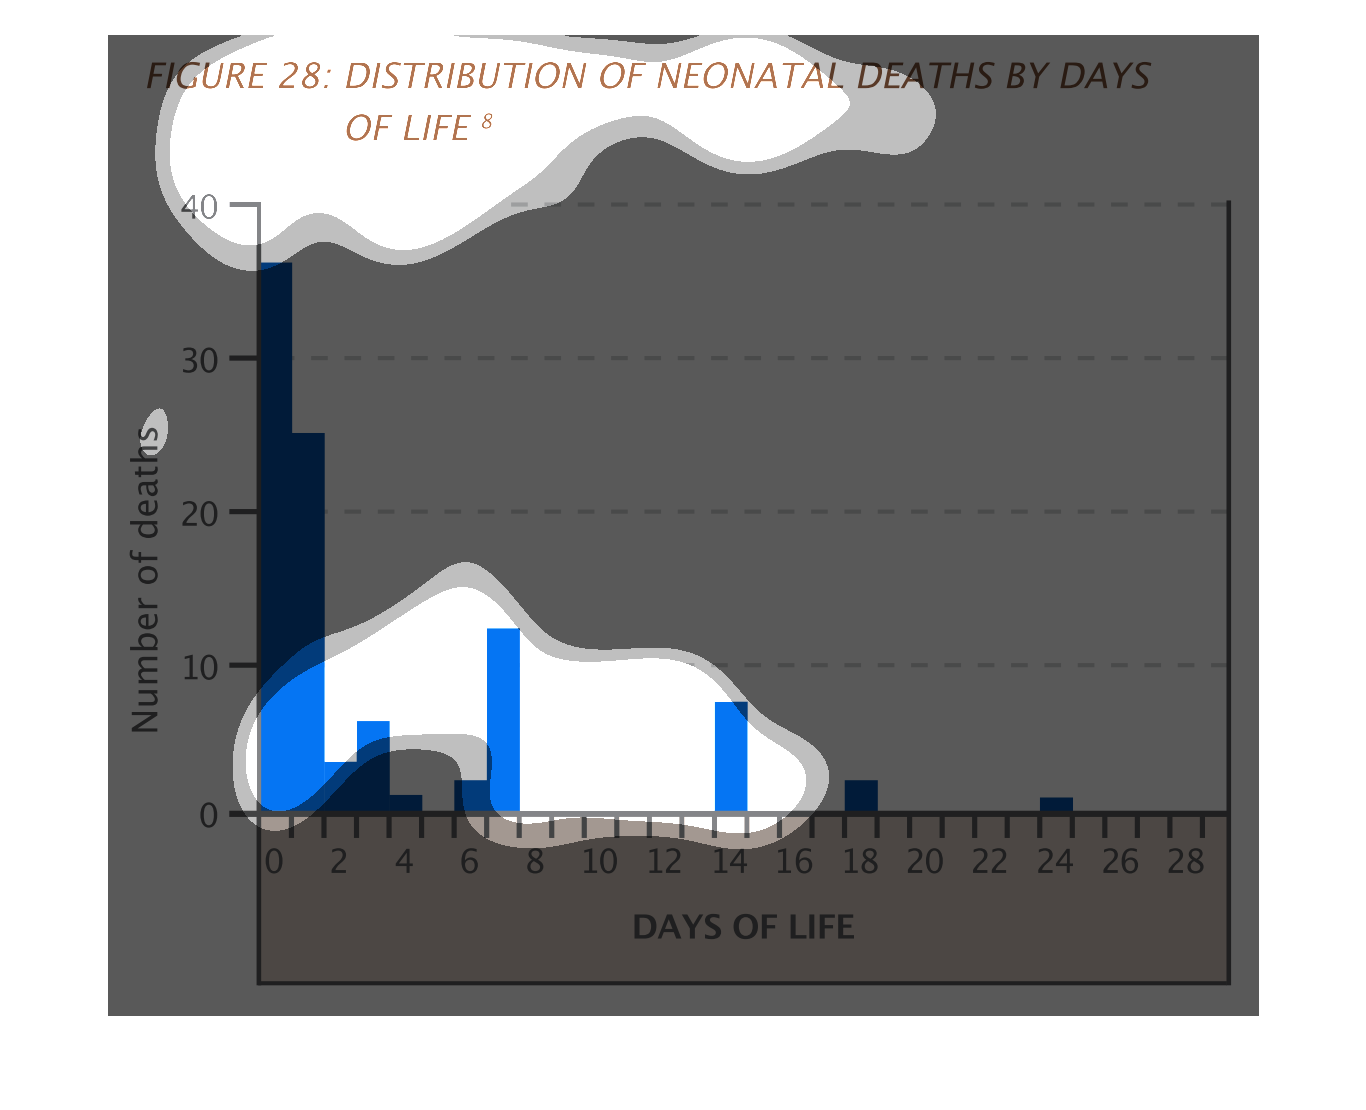
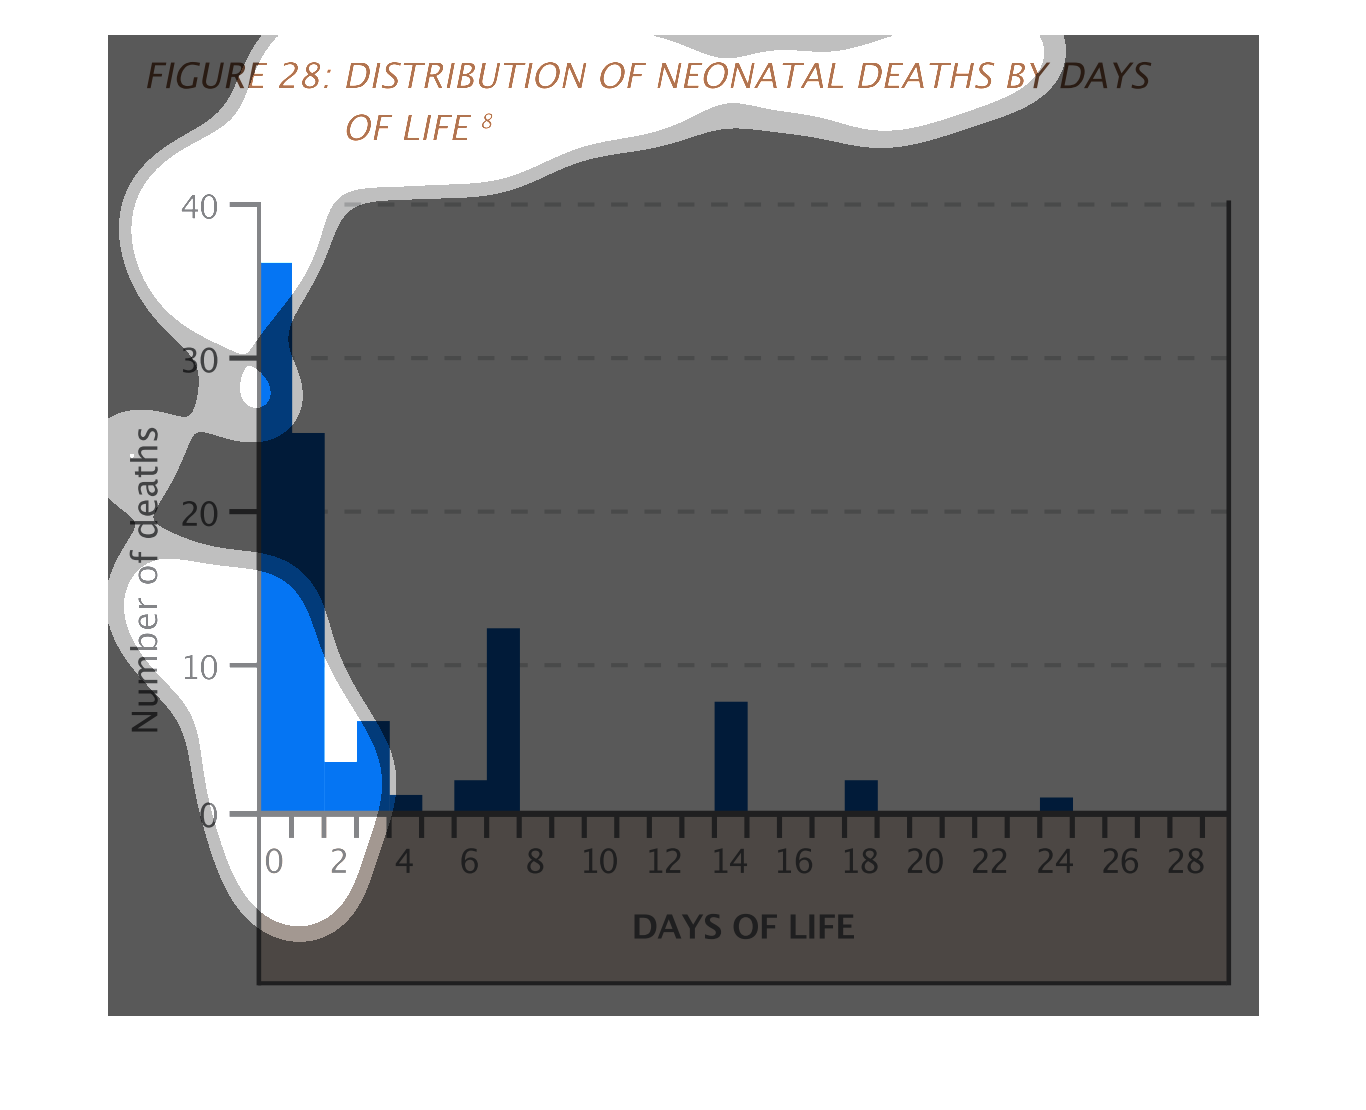
This is a bar graph it shows, the figure 28: distribution of neonatal deaths by days. It goes
all the way up to 40 and is in the colors blue and a pinkish brownish color.
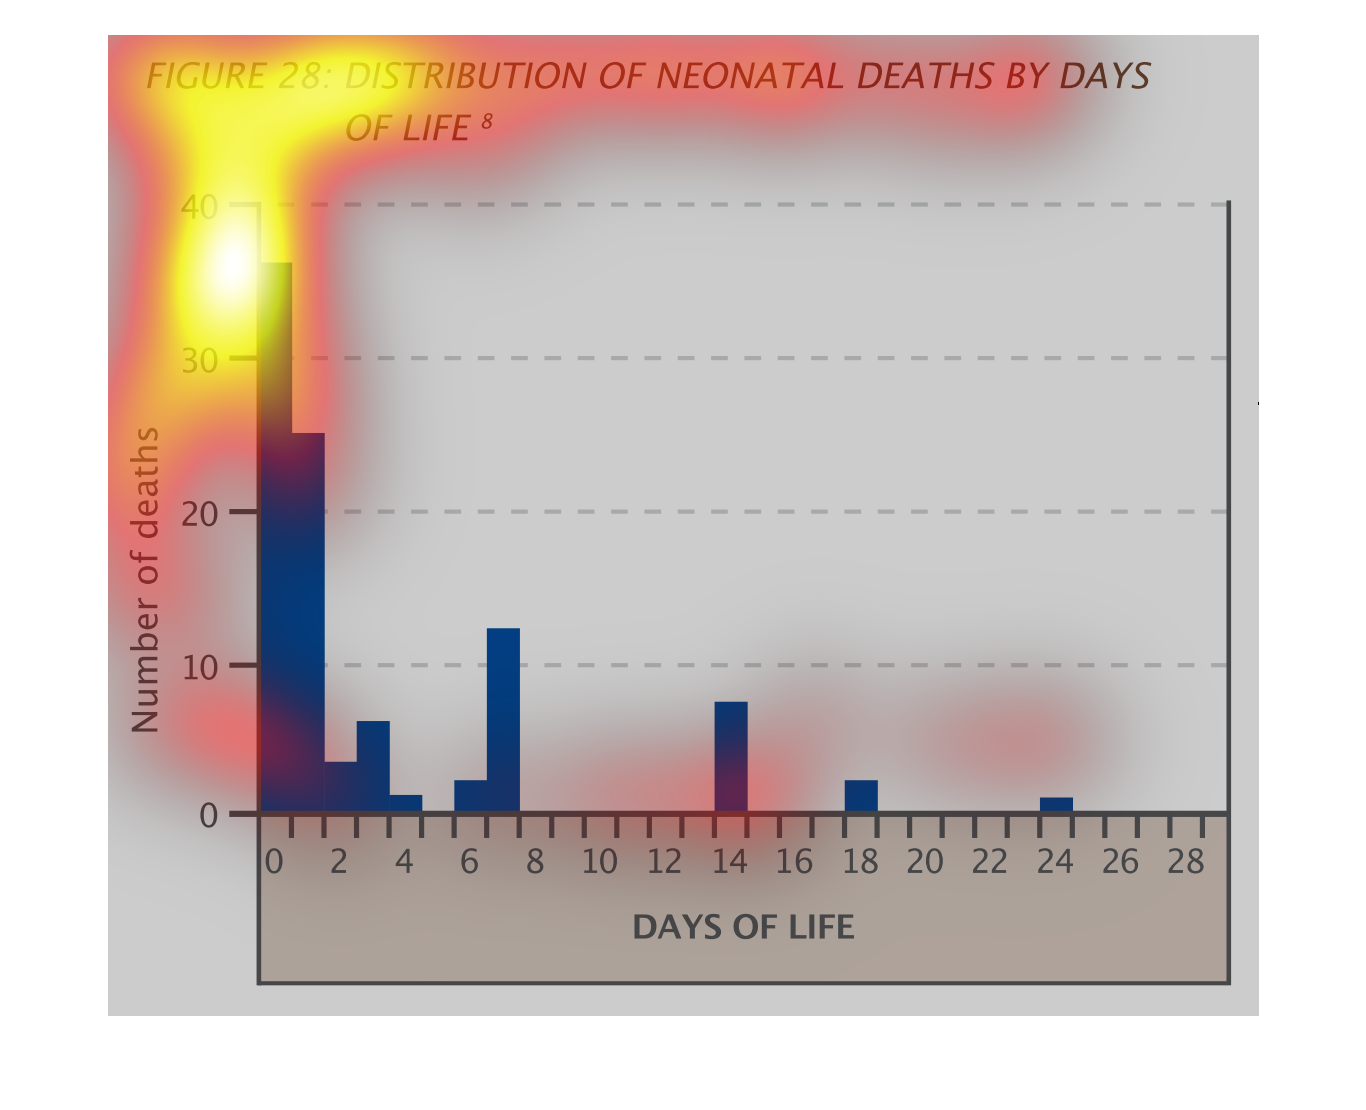
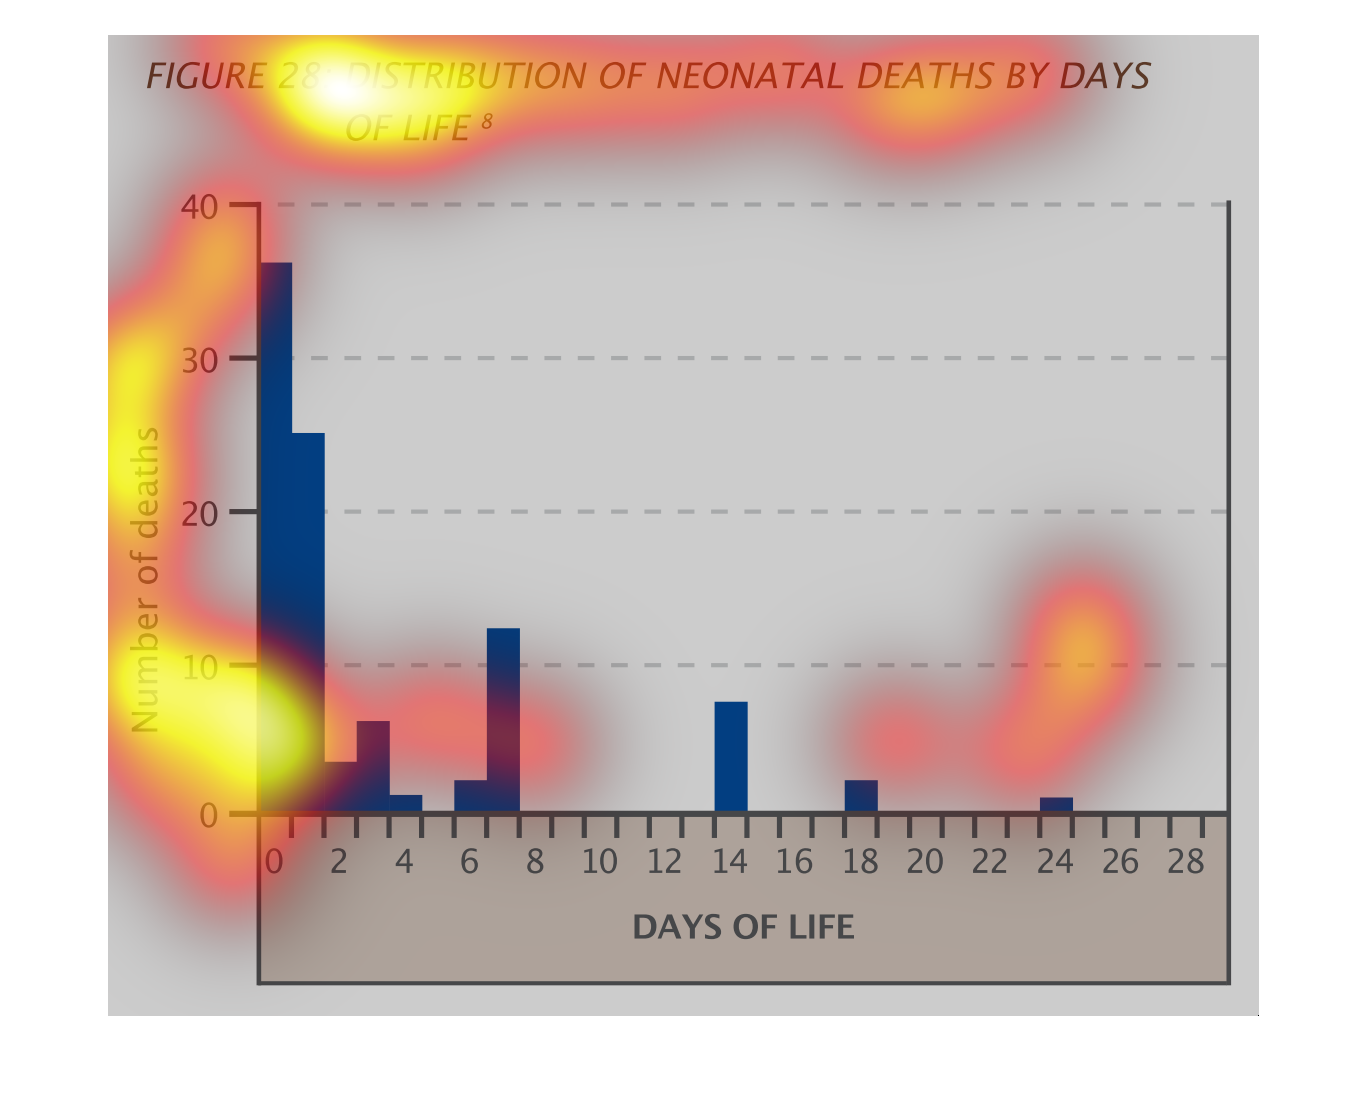
This chart describes distribution of neonatal deaths by days of life. The highest spike on
the chart comes in close to the forty neonatal deaths point.
Distribution of Neonatal deaths by days of life.  This graph shows how many neonatal deaths
occurred and at what age of life they occurred.  More deaths occurred early on in their days
of life.
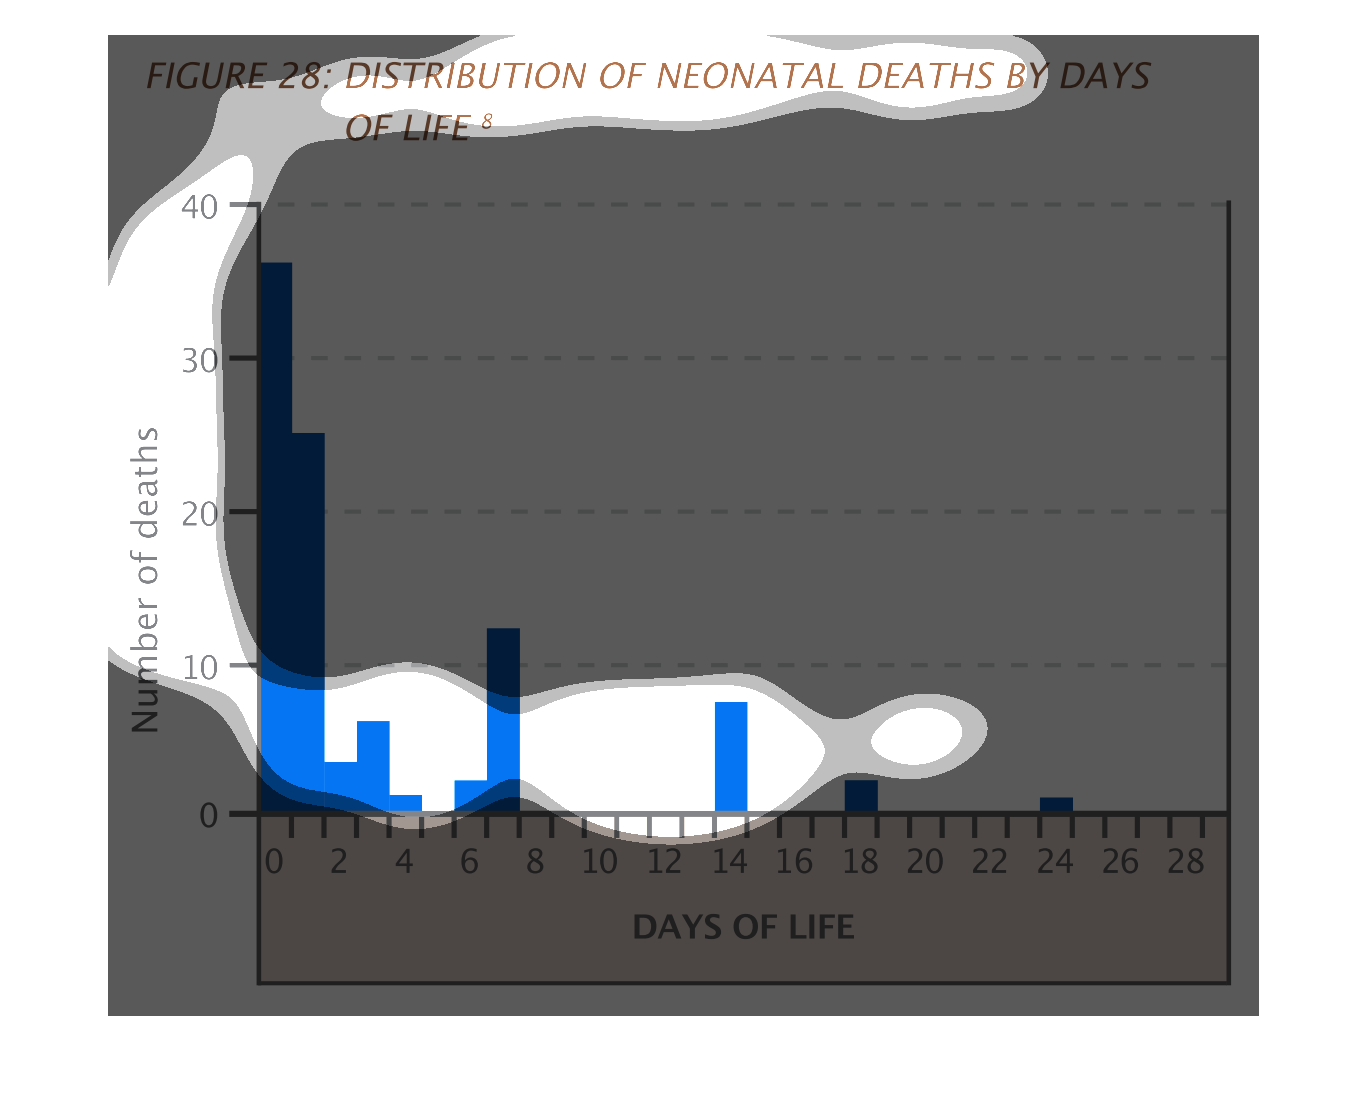
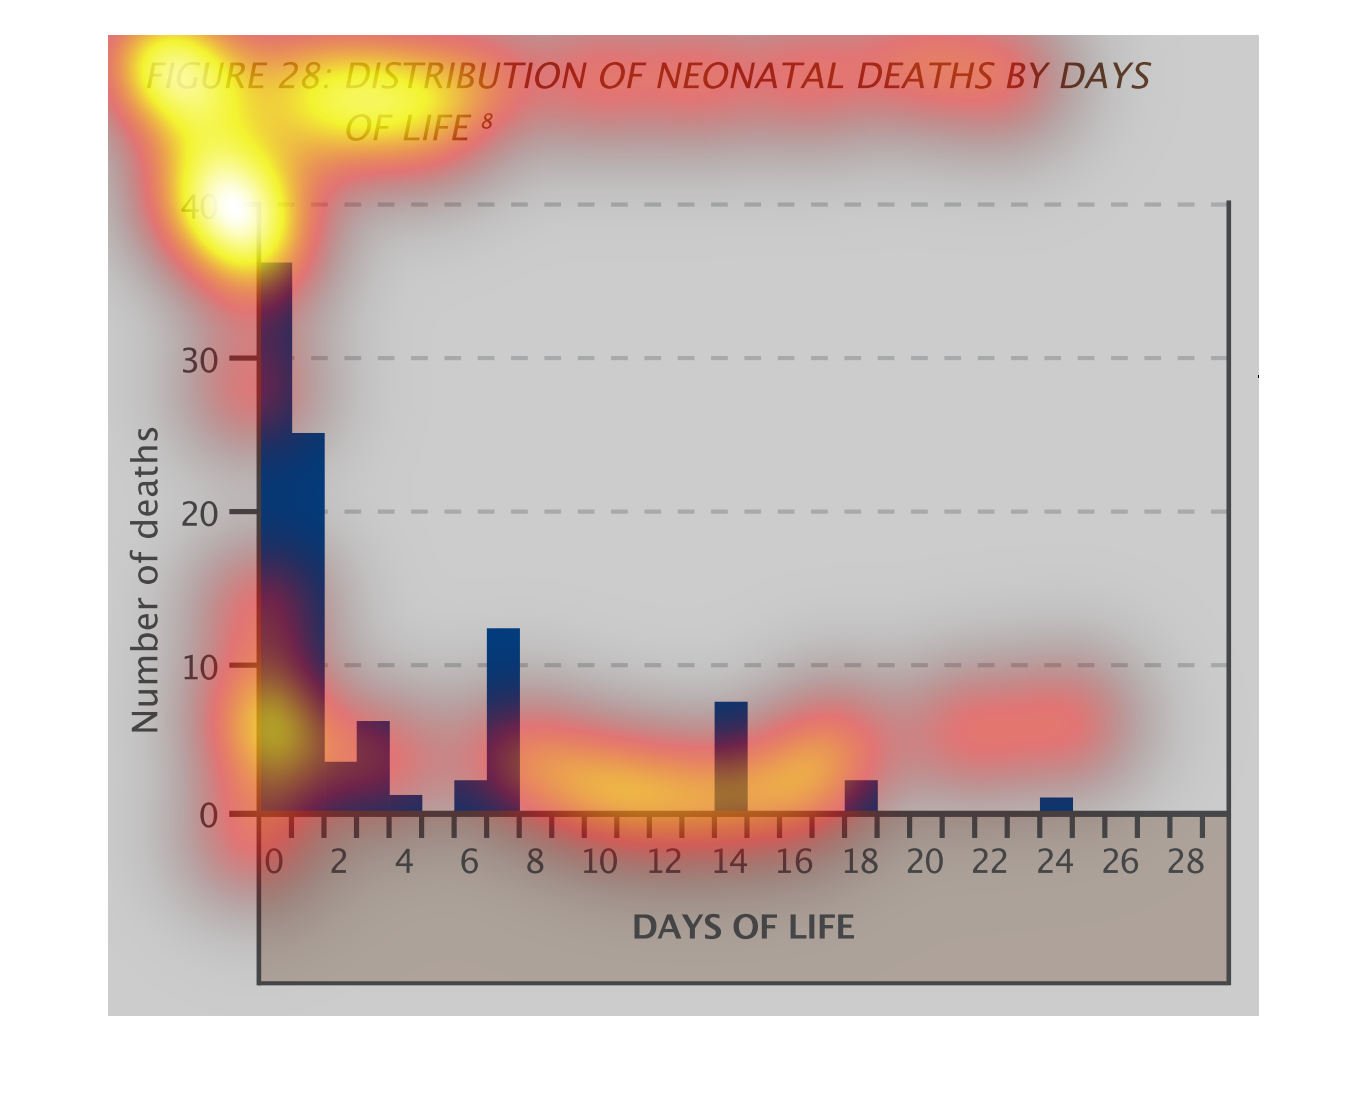
This handmade chart shows the distribution of neonatal deaths as measured in number of days.
It shows it is most at risk right after birth then drops significantly
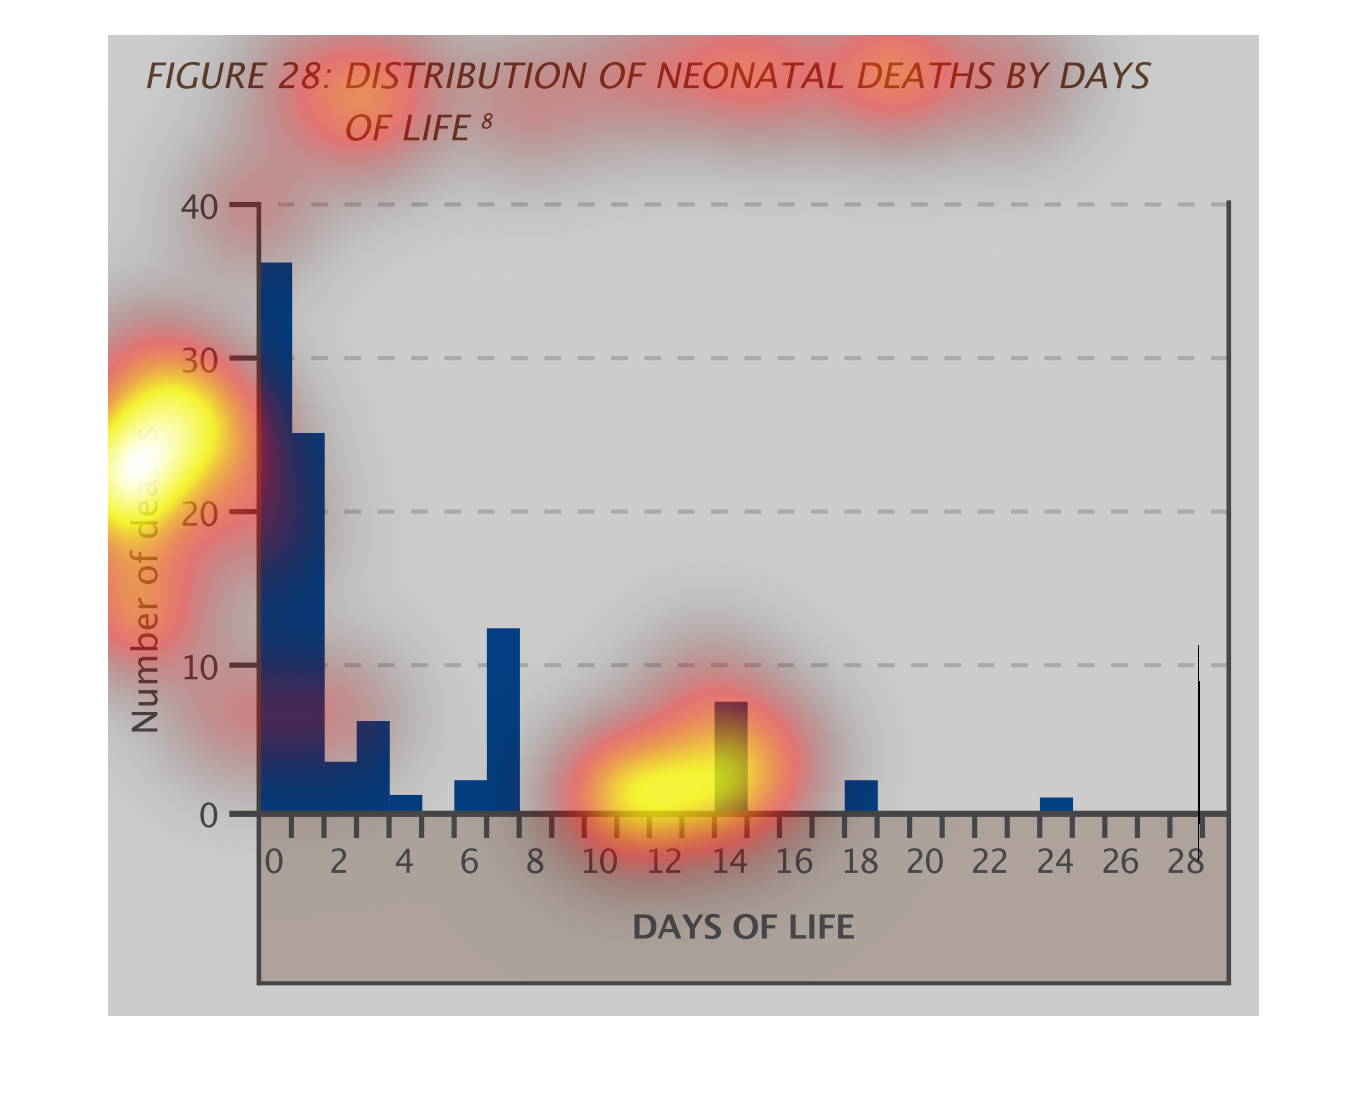
This chart describes distribution of neonatal deaths by days of life. The highest number of
deaths on the chart is approaching the number 40 deaths by days of life.
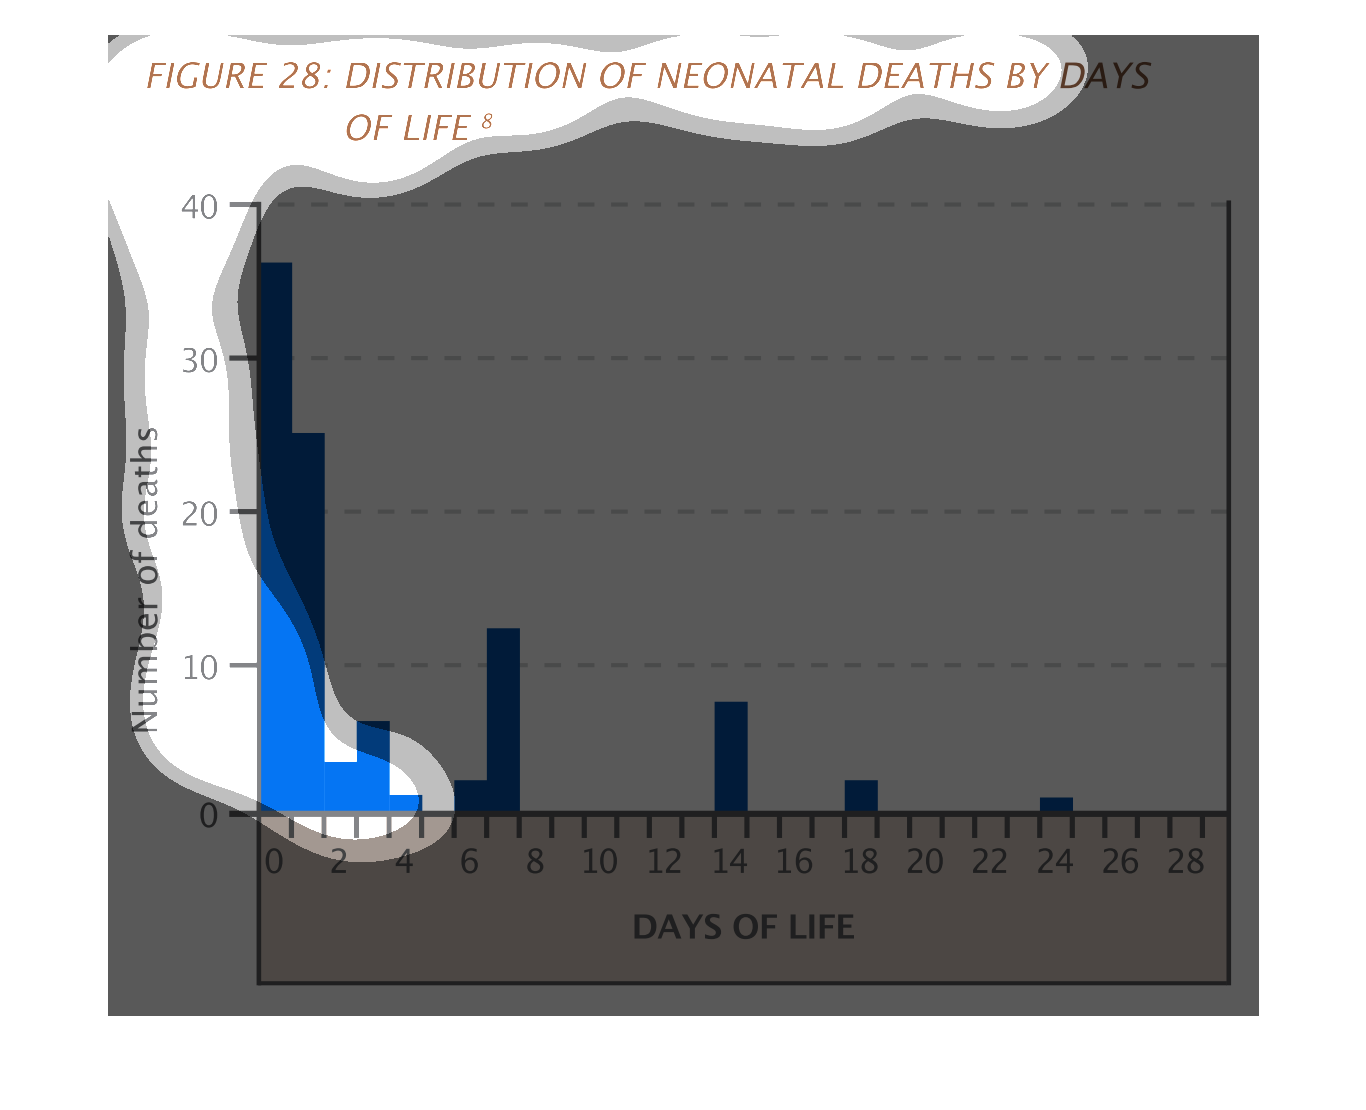
The chart shows the distribution of neonatal deaths by days of life.  Most deaths occur in
the first few days of life, with the first day of life proving to be the most fatal.
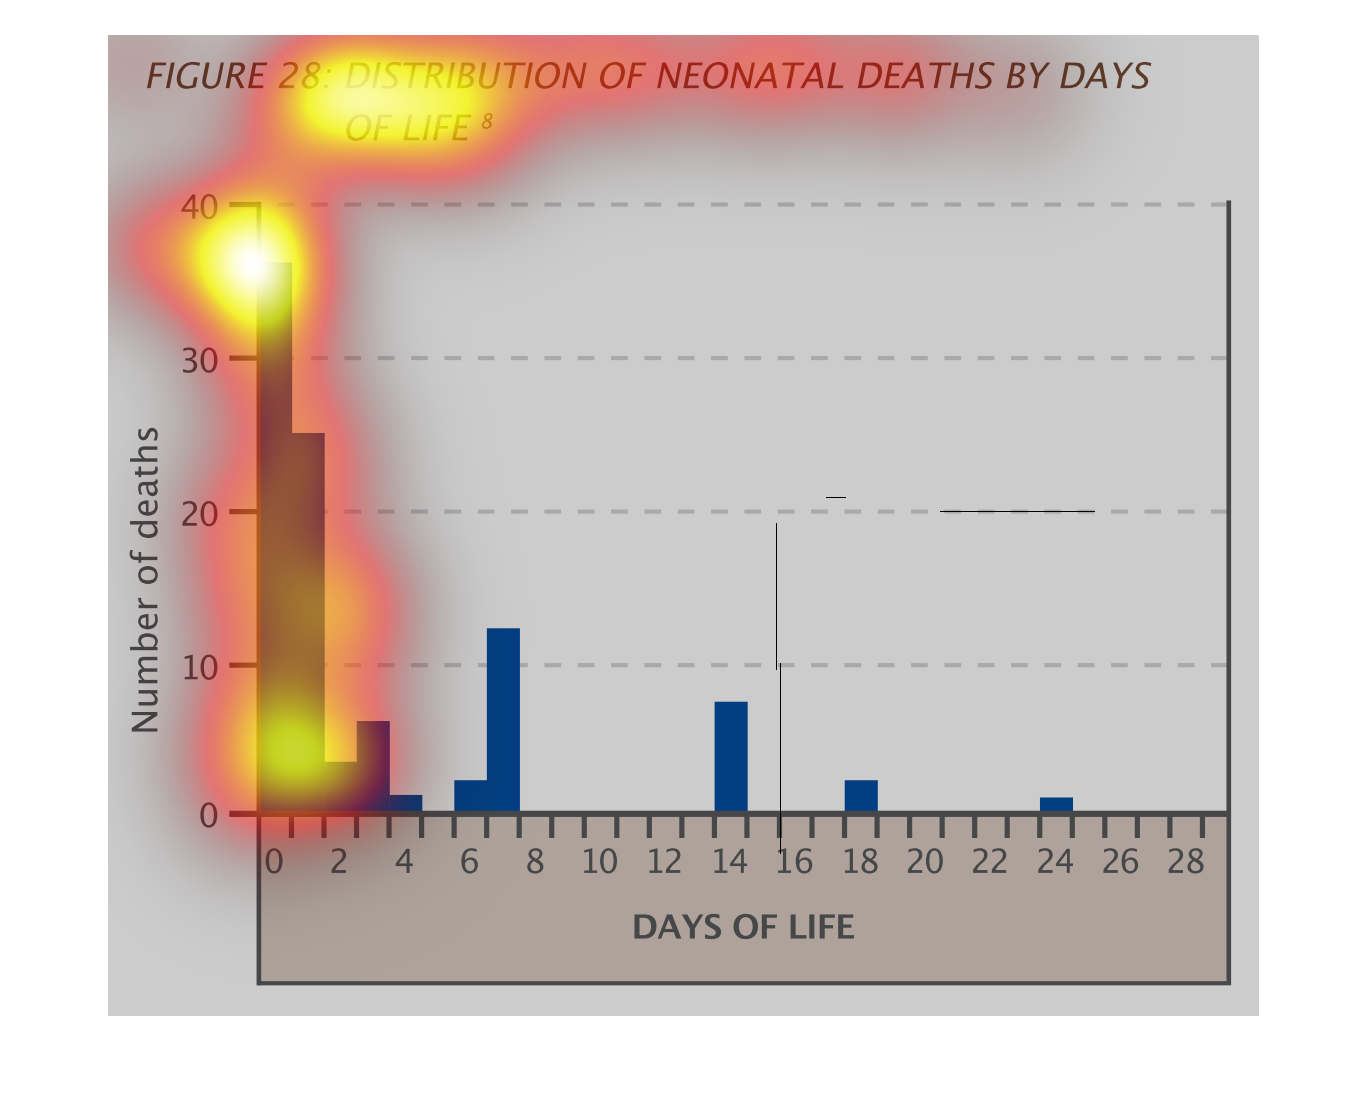
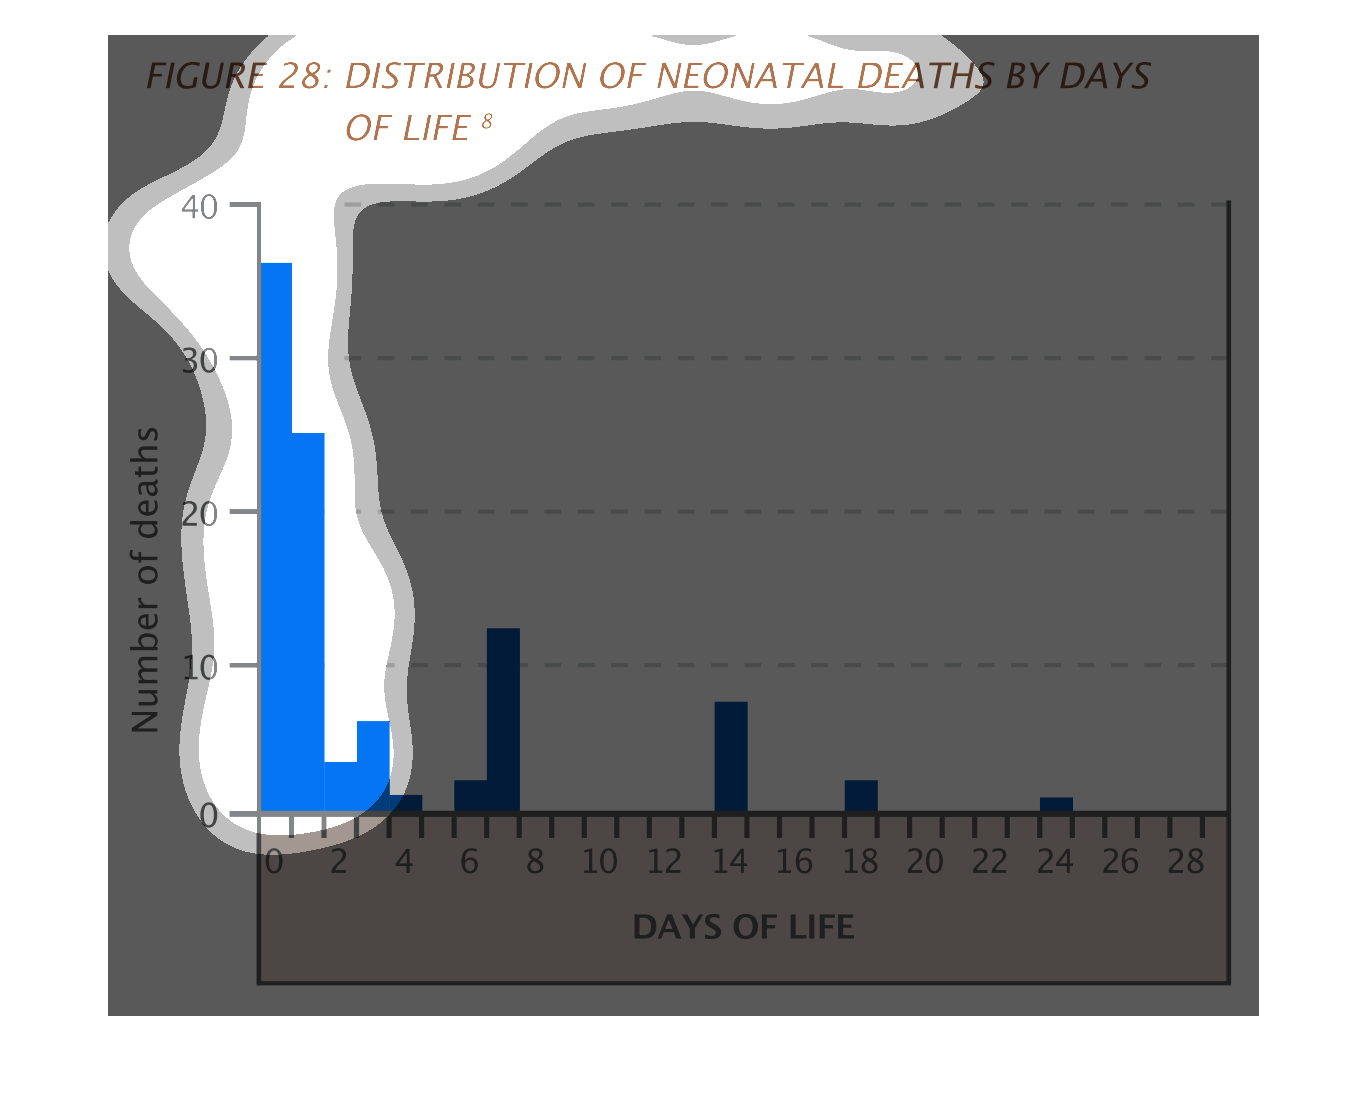
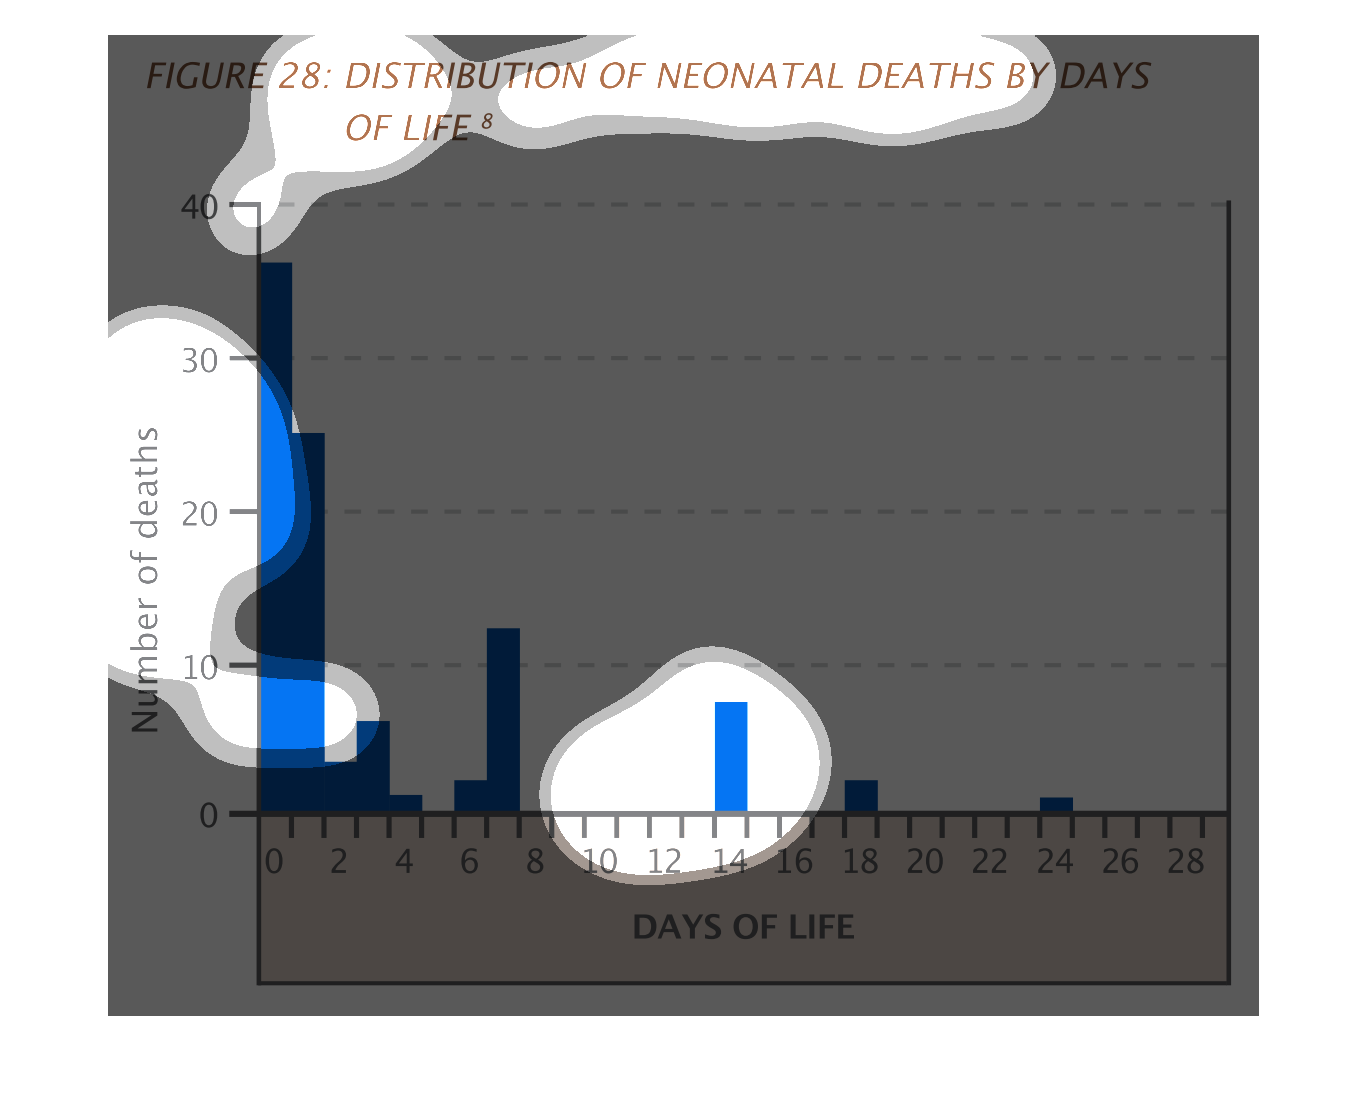
This figure demonstrates the distribution of neonatal deaths by days. Most neonatal deaths
take place between zero and two days; the number of deaths tapers off as time goes on.