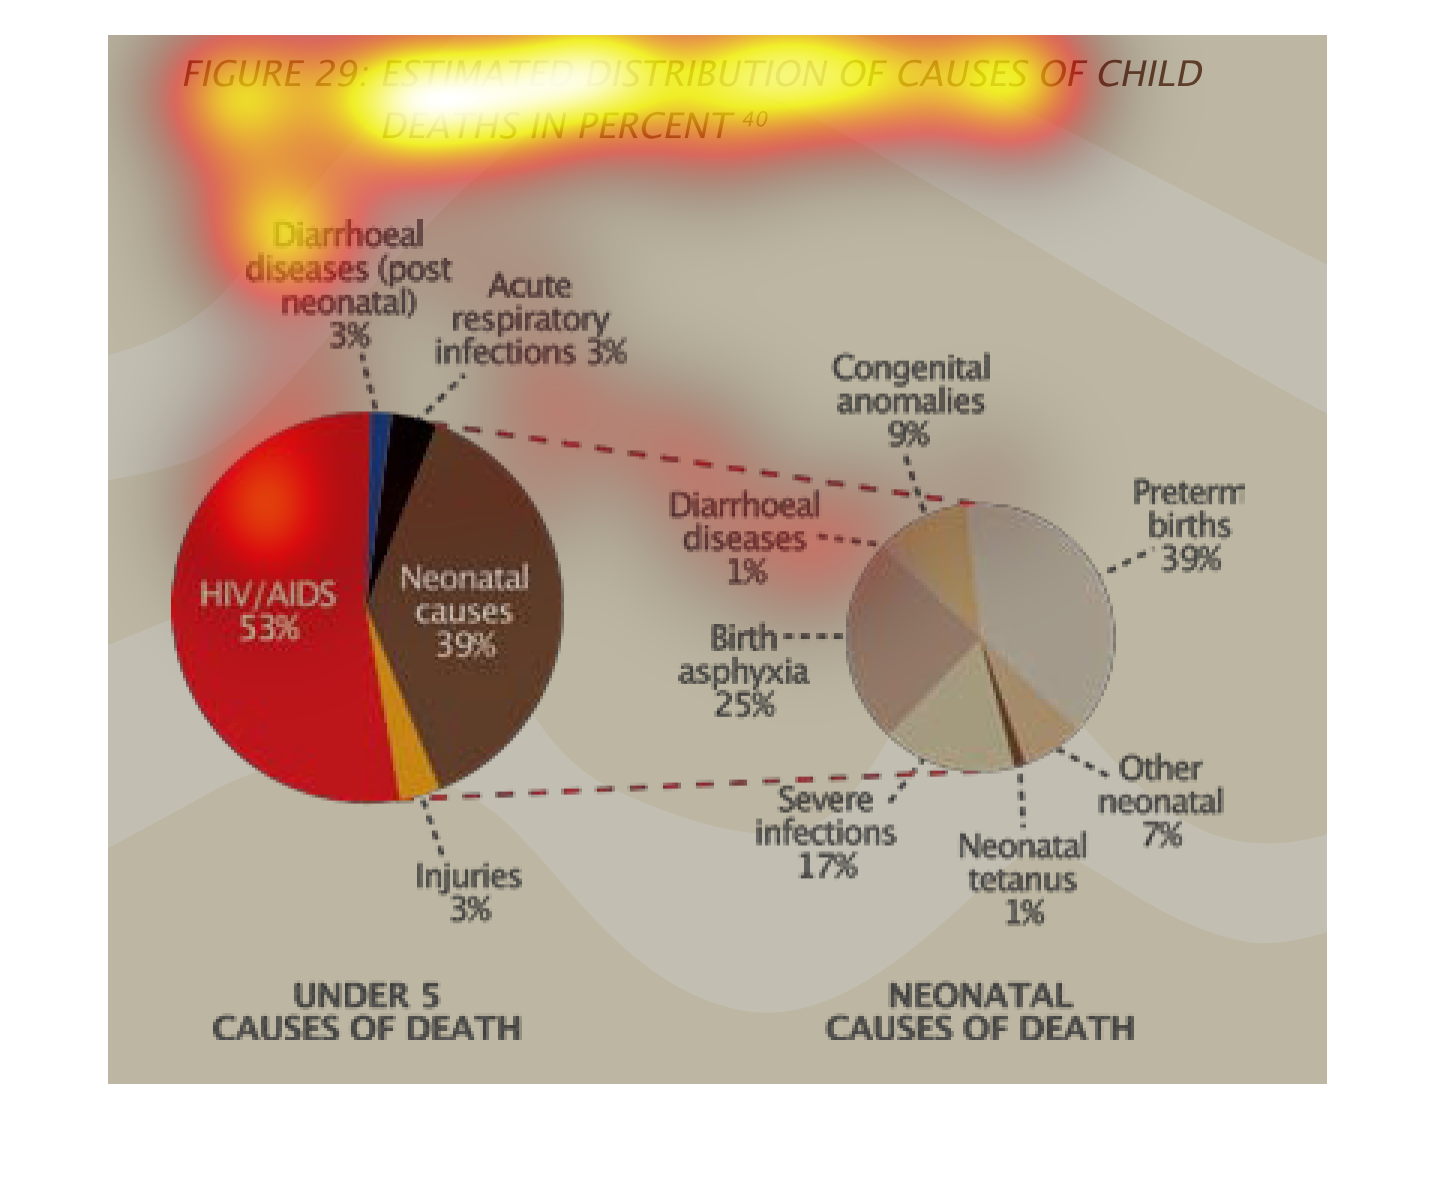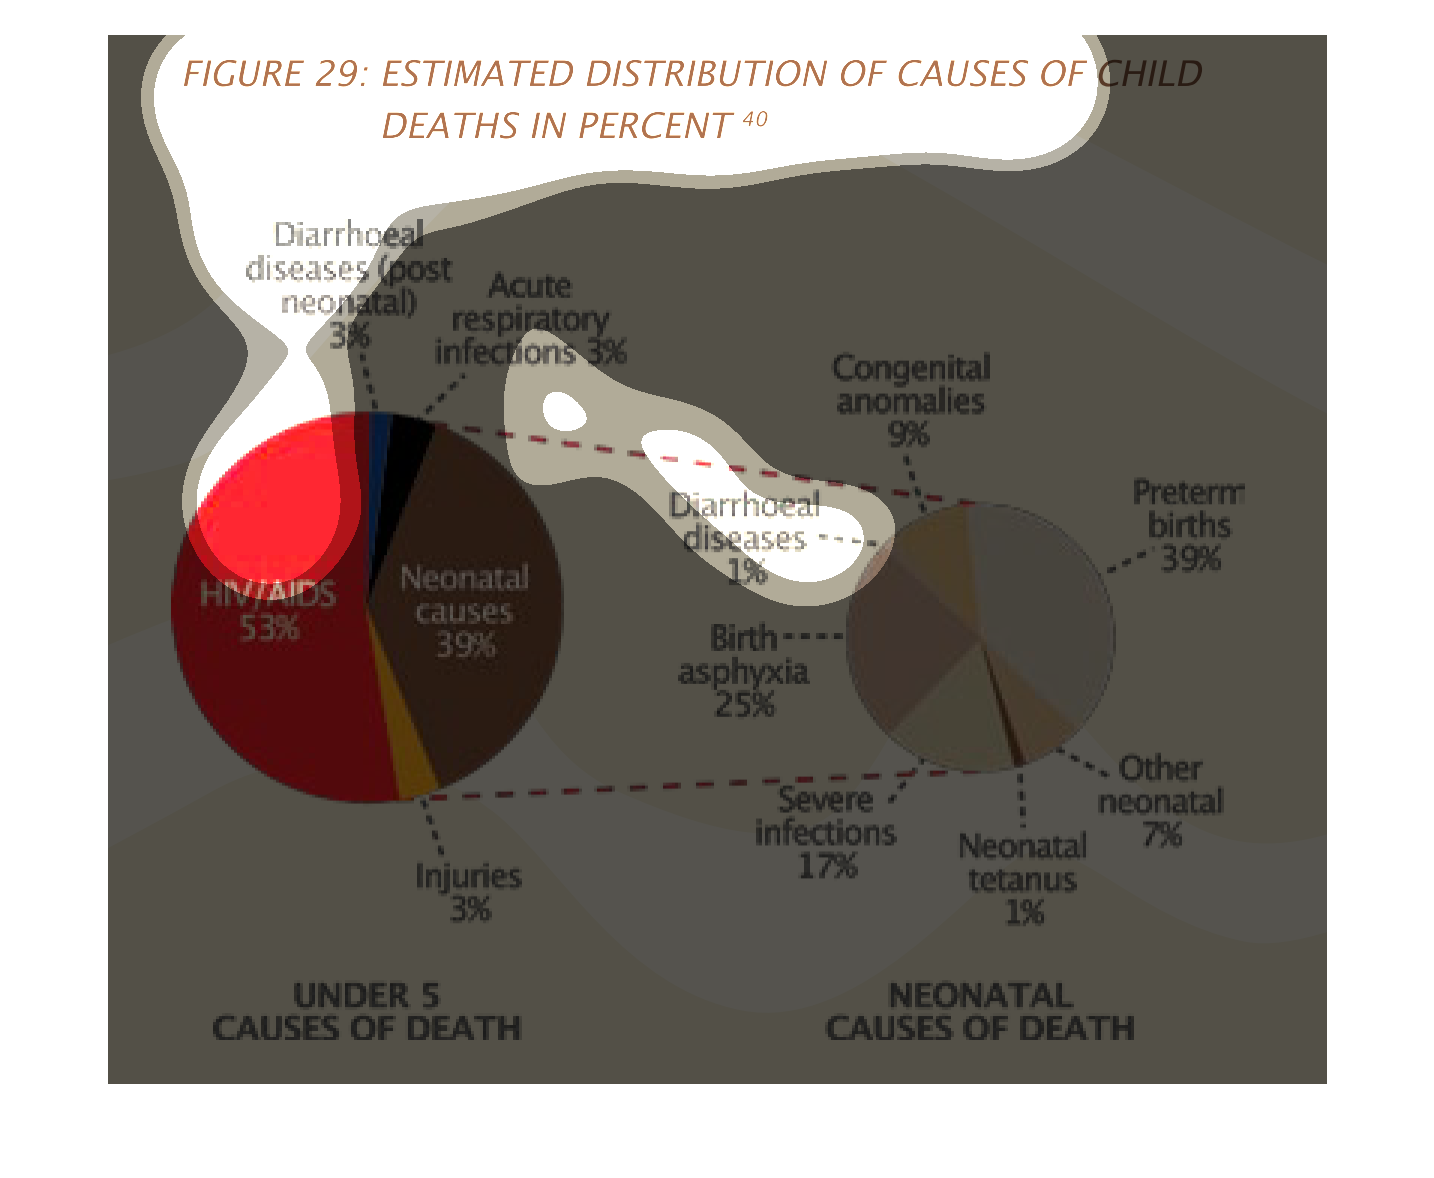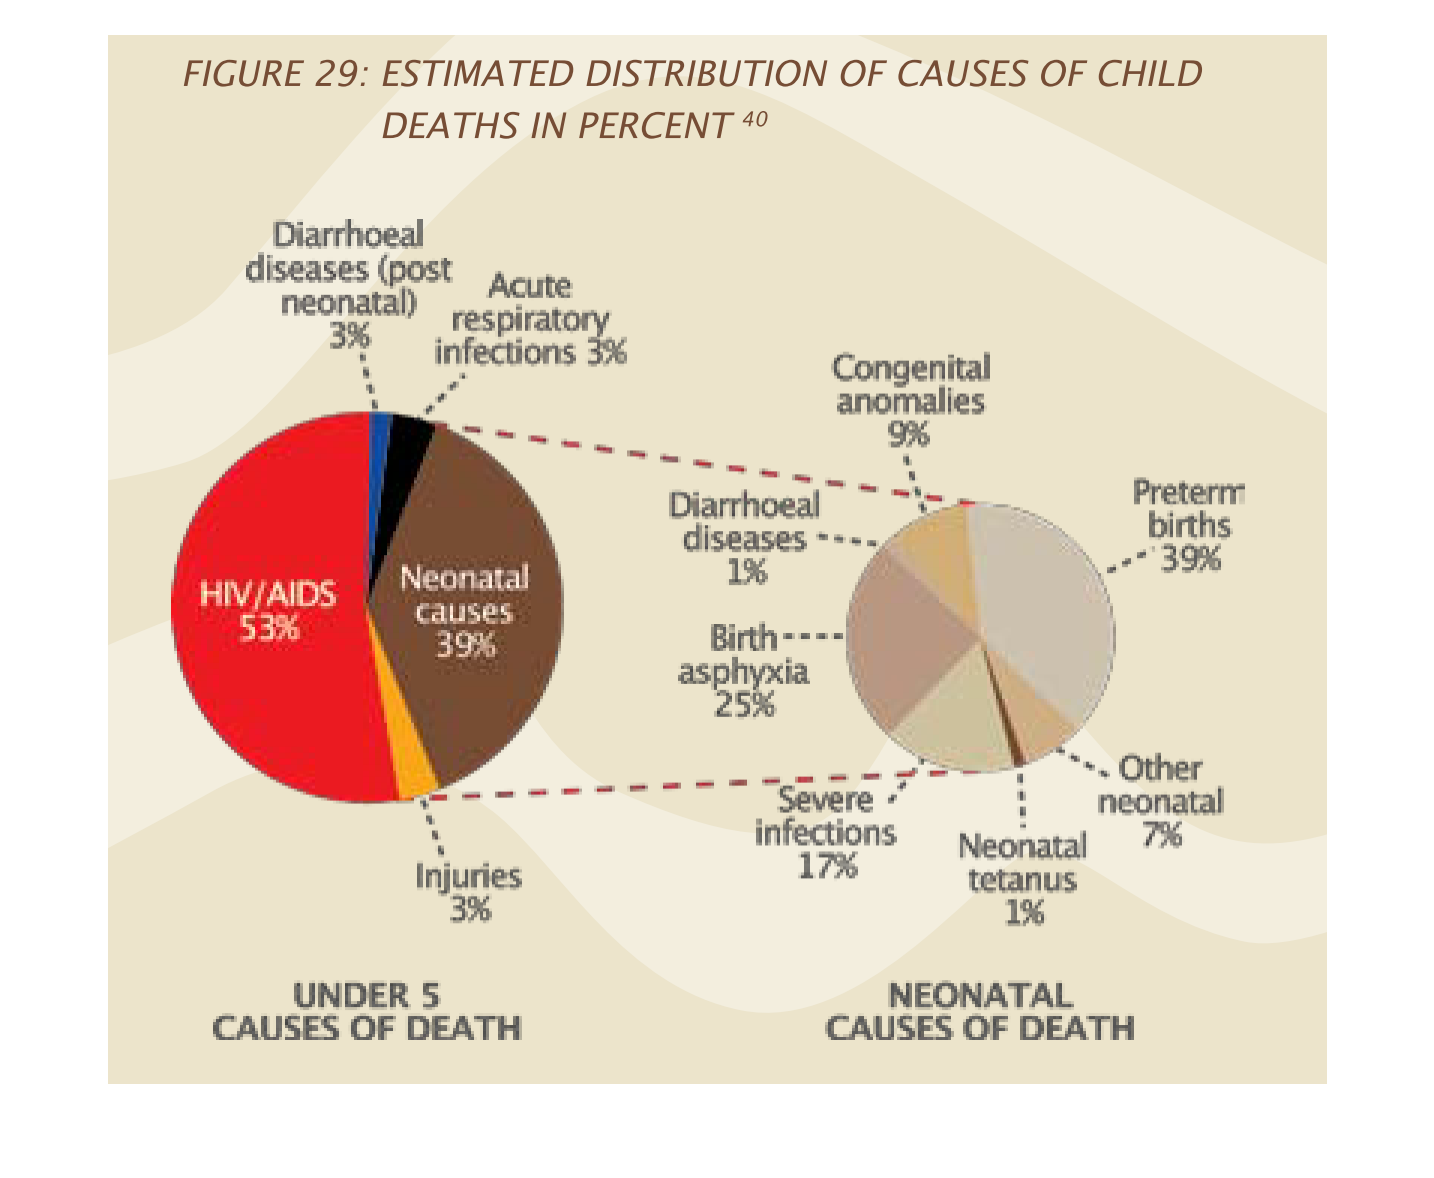
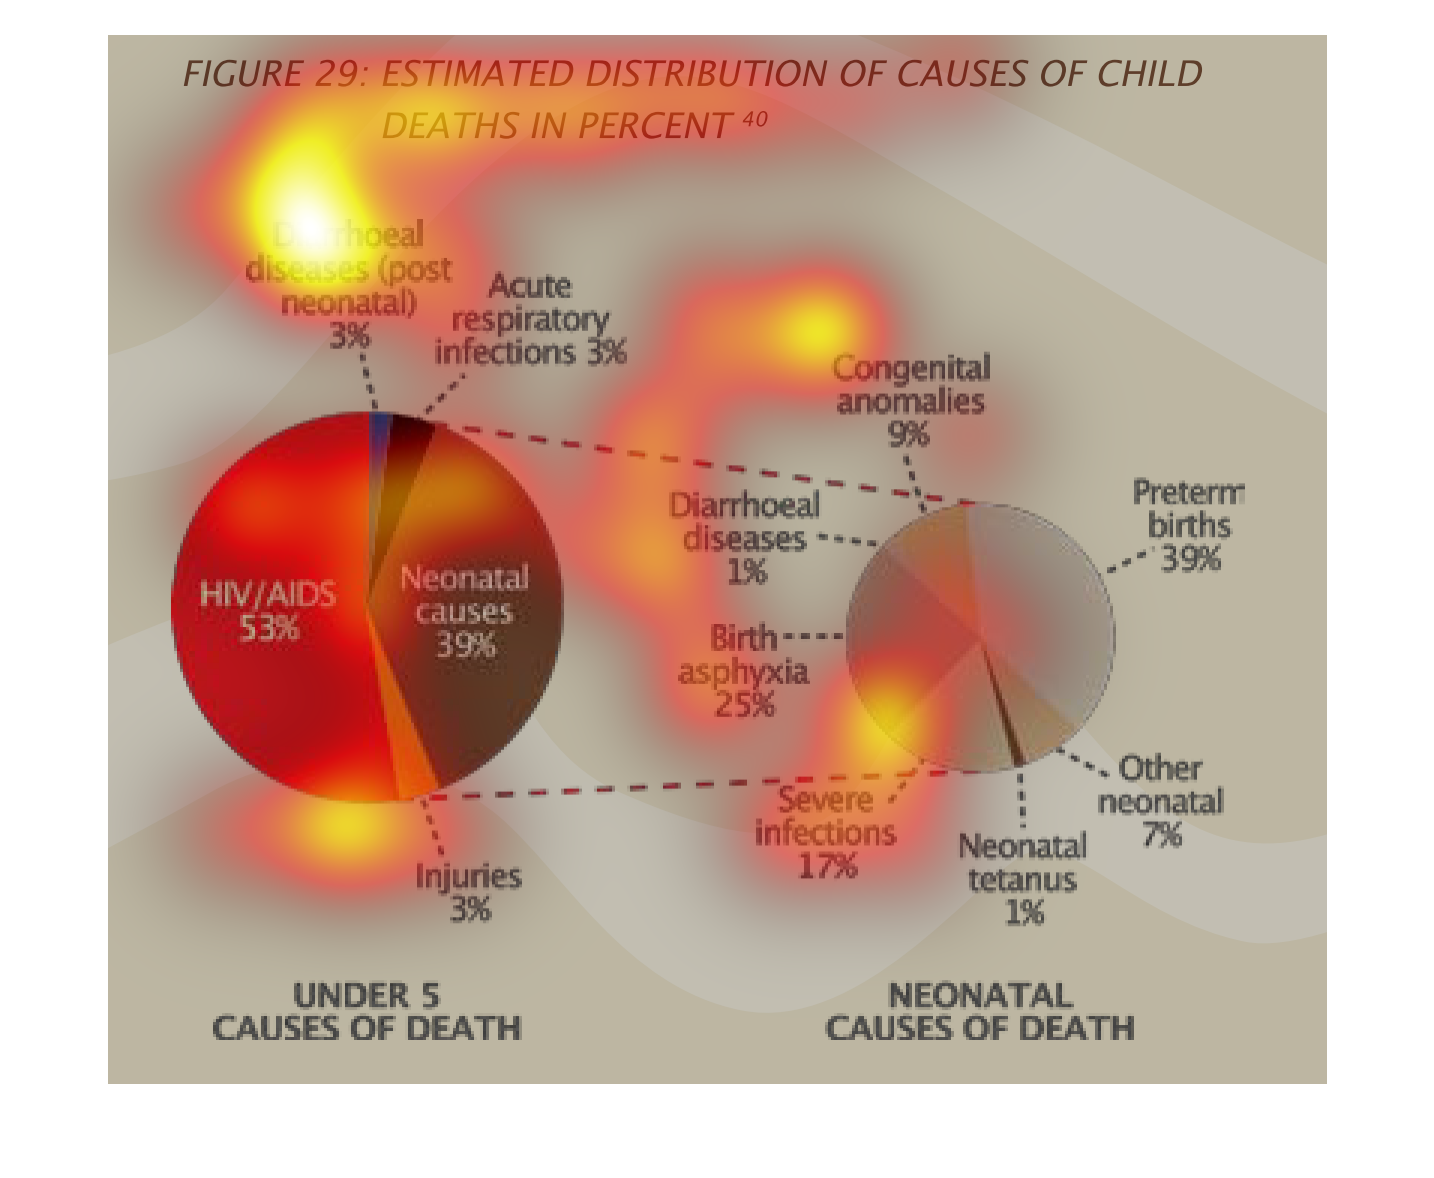
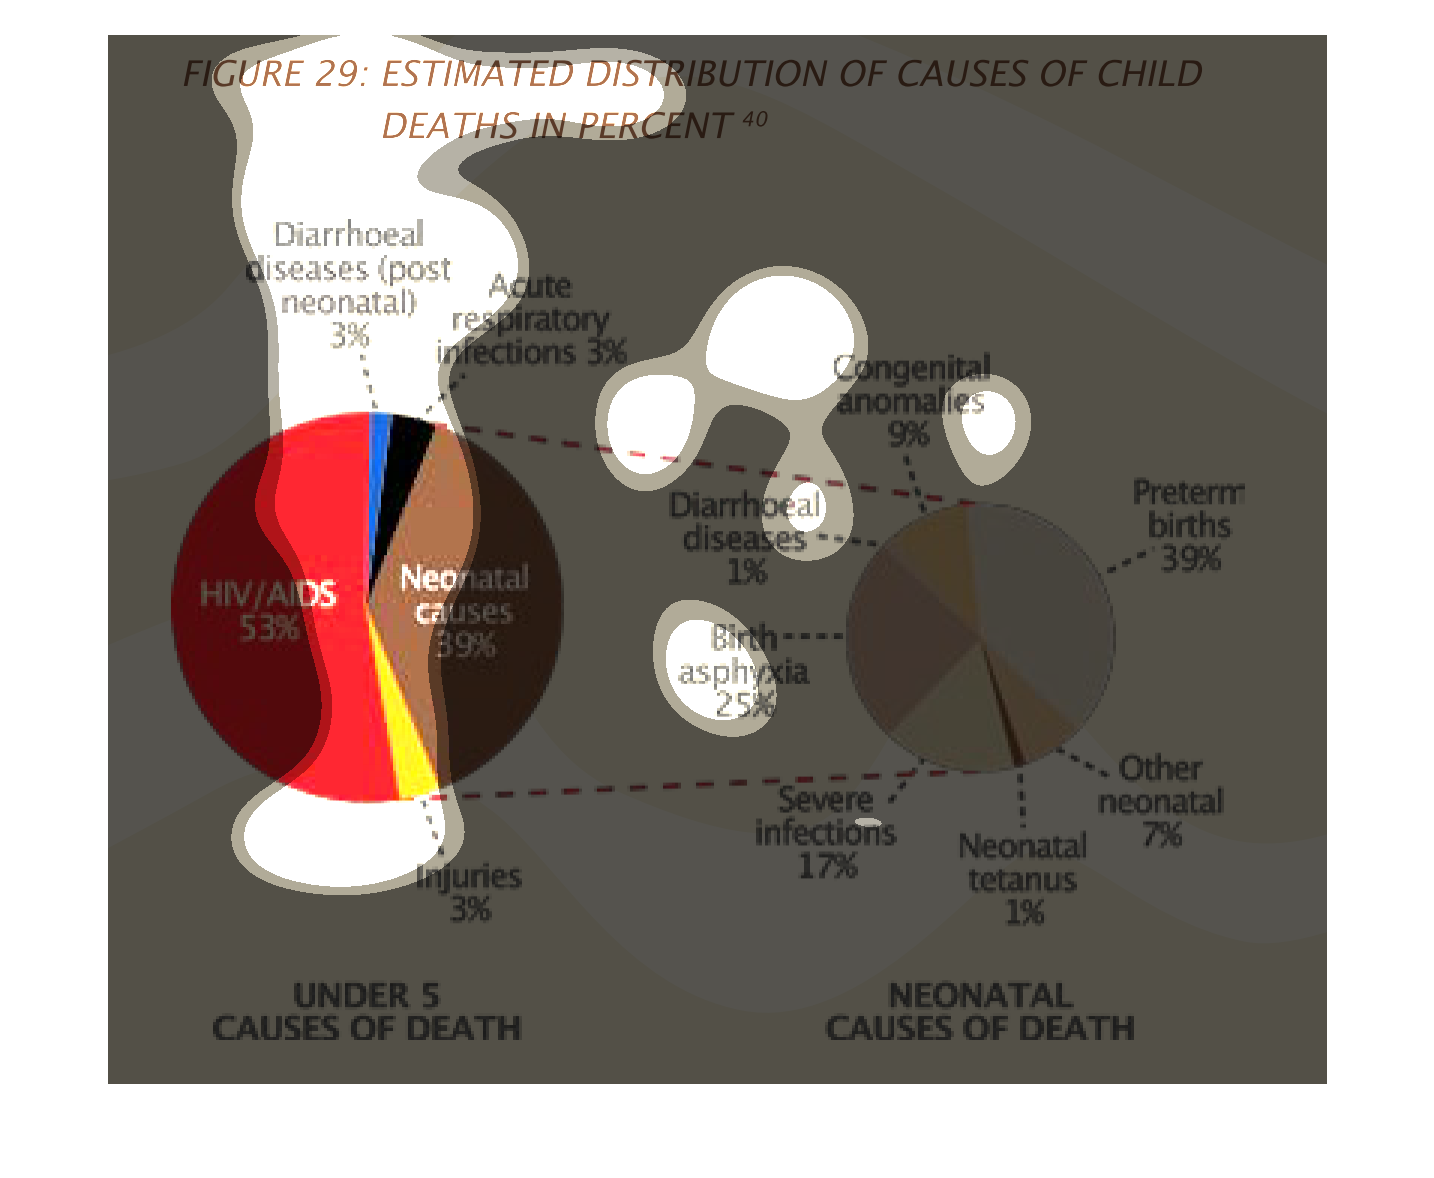
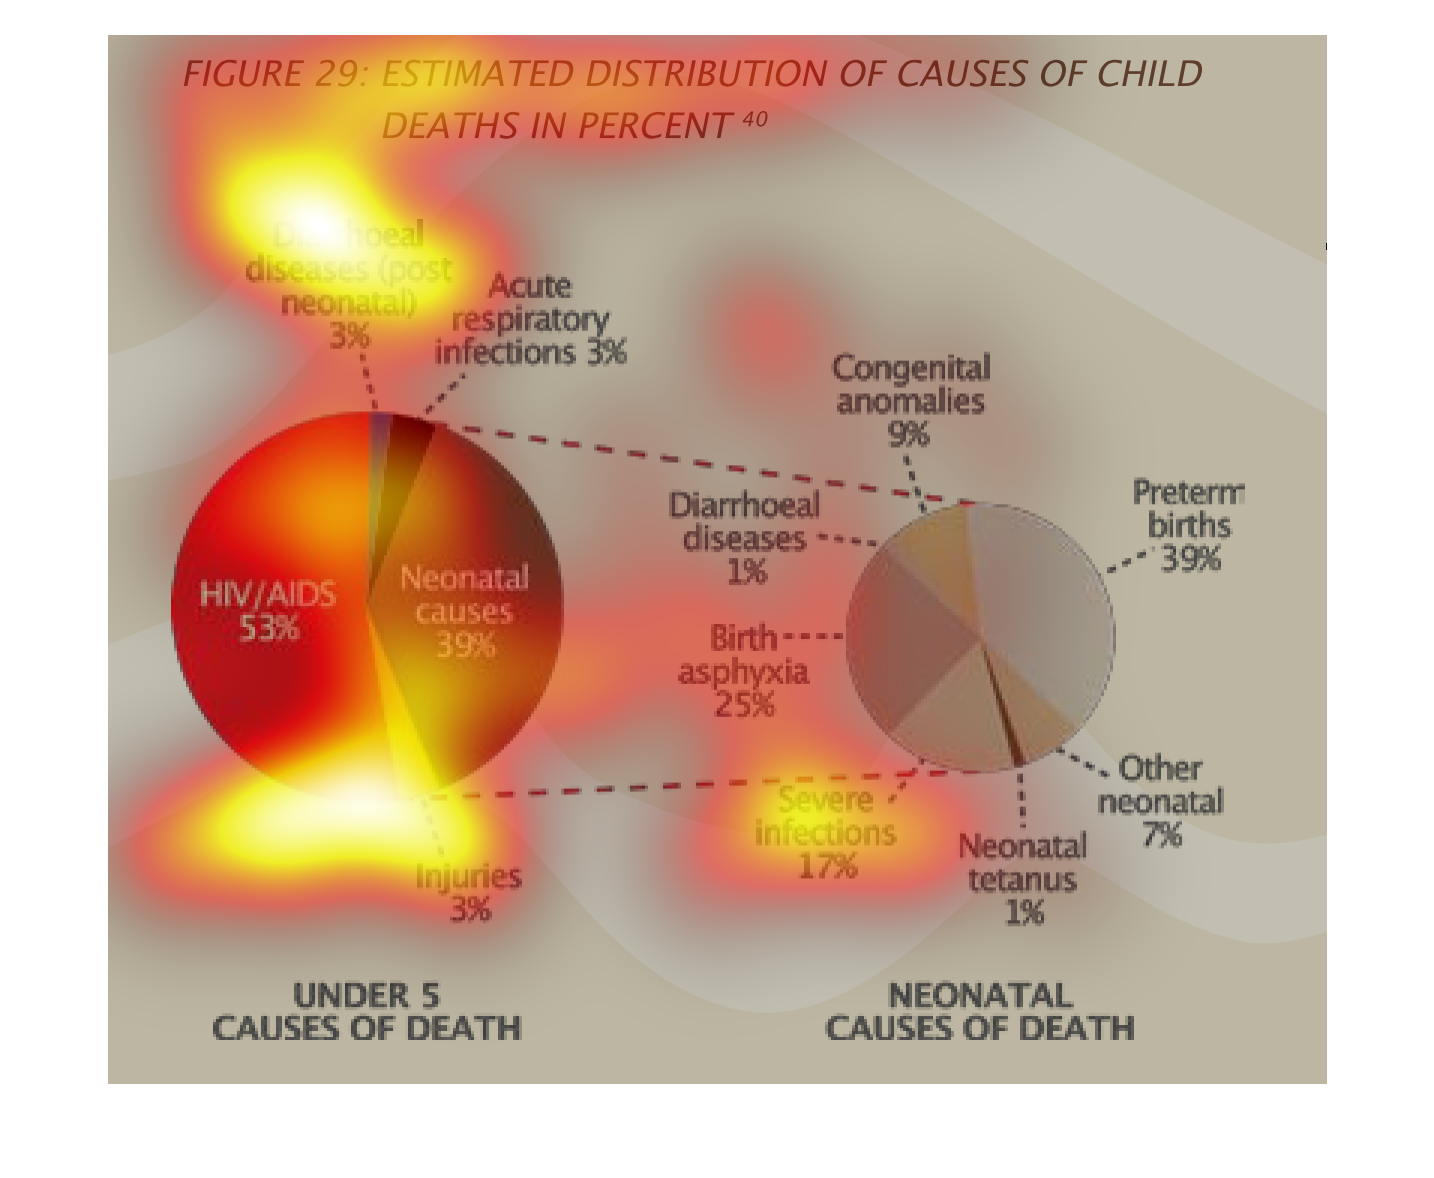
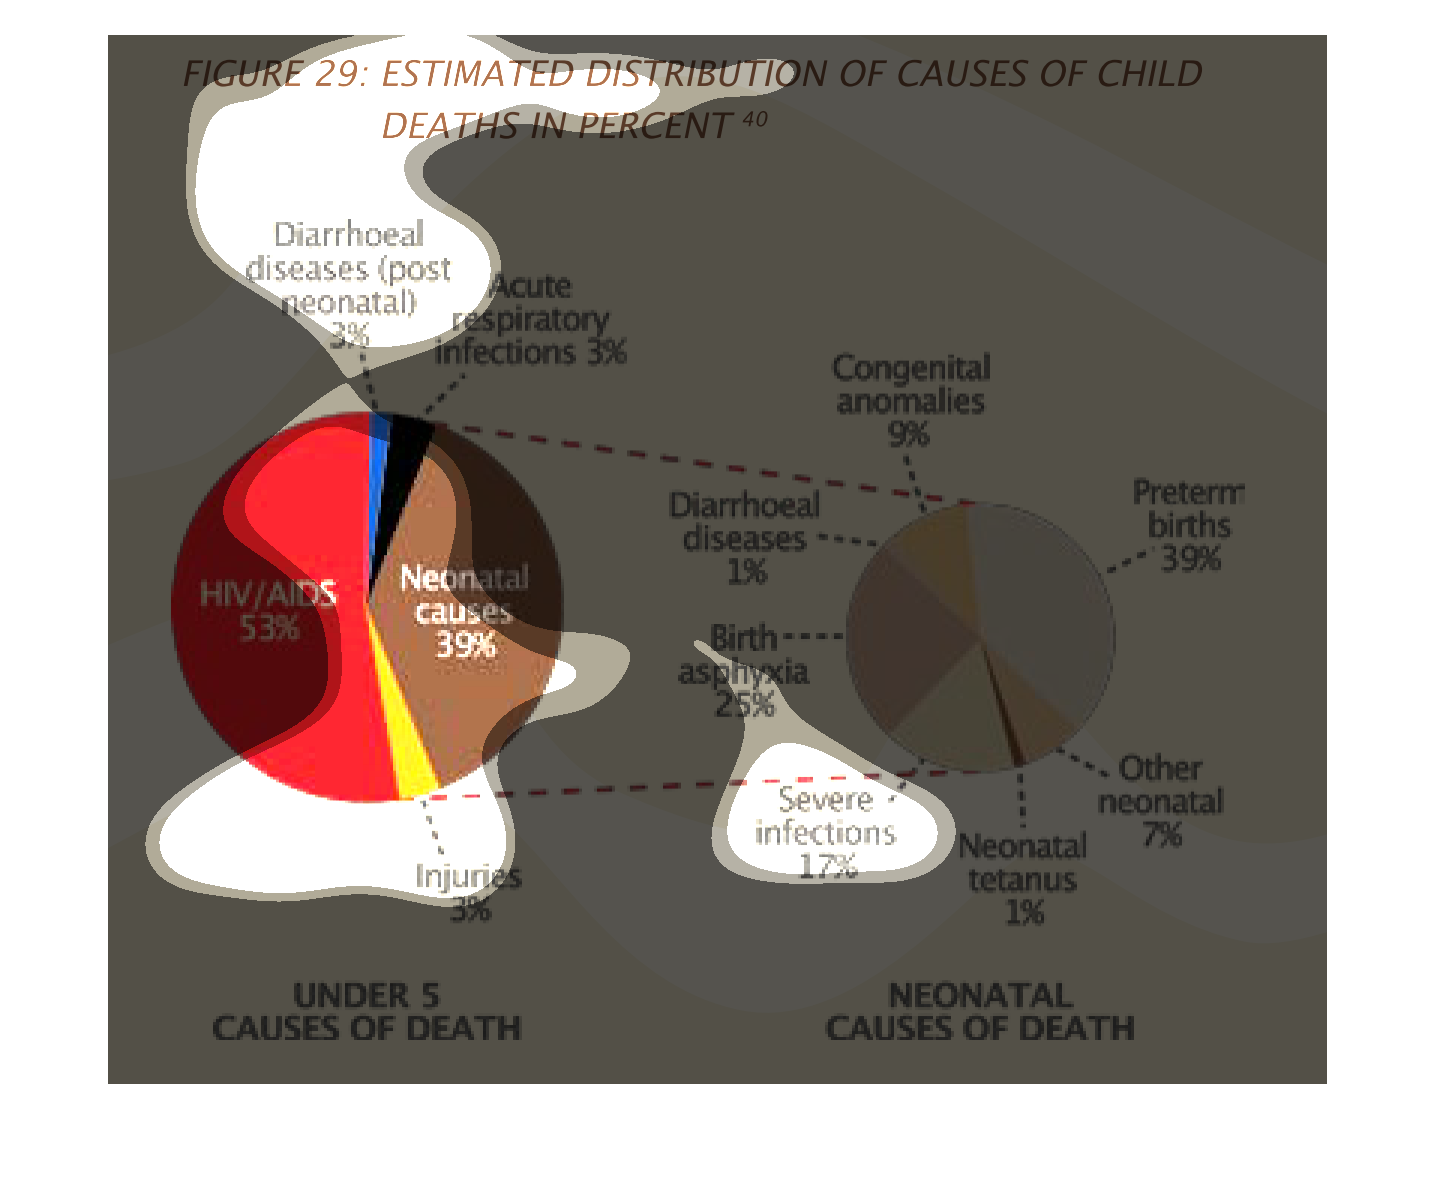
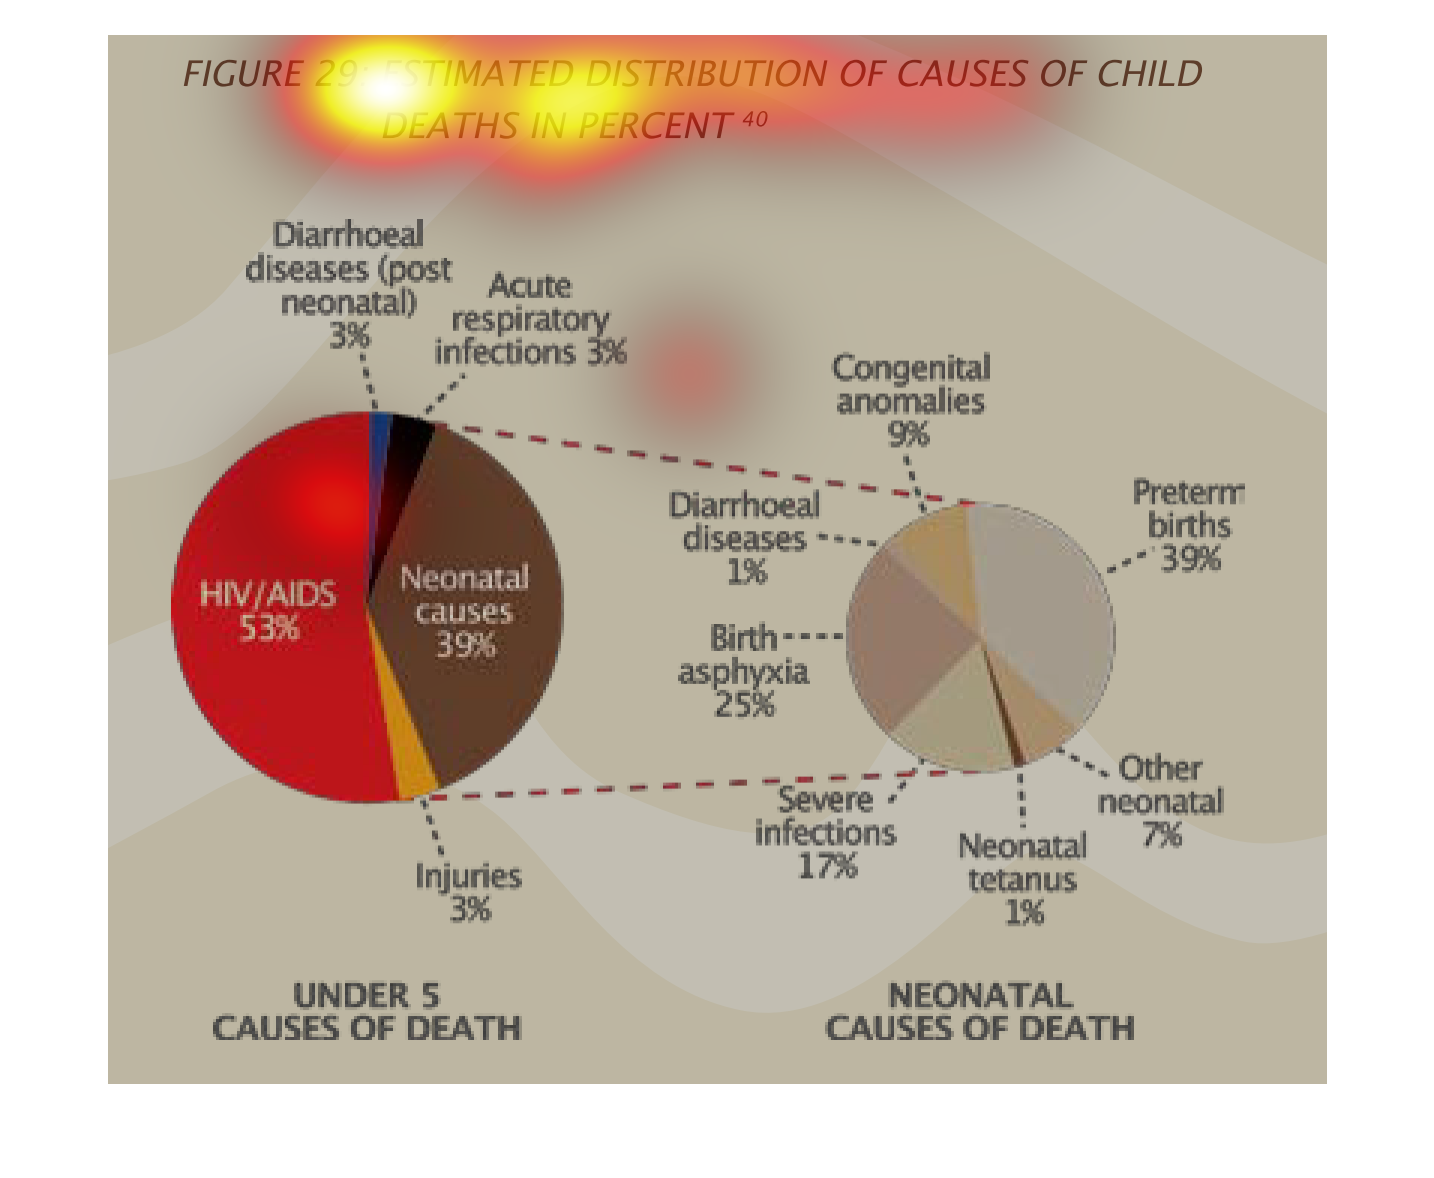
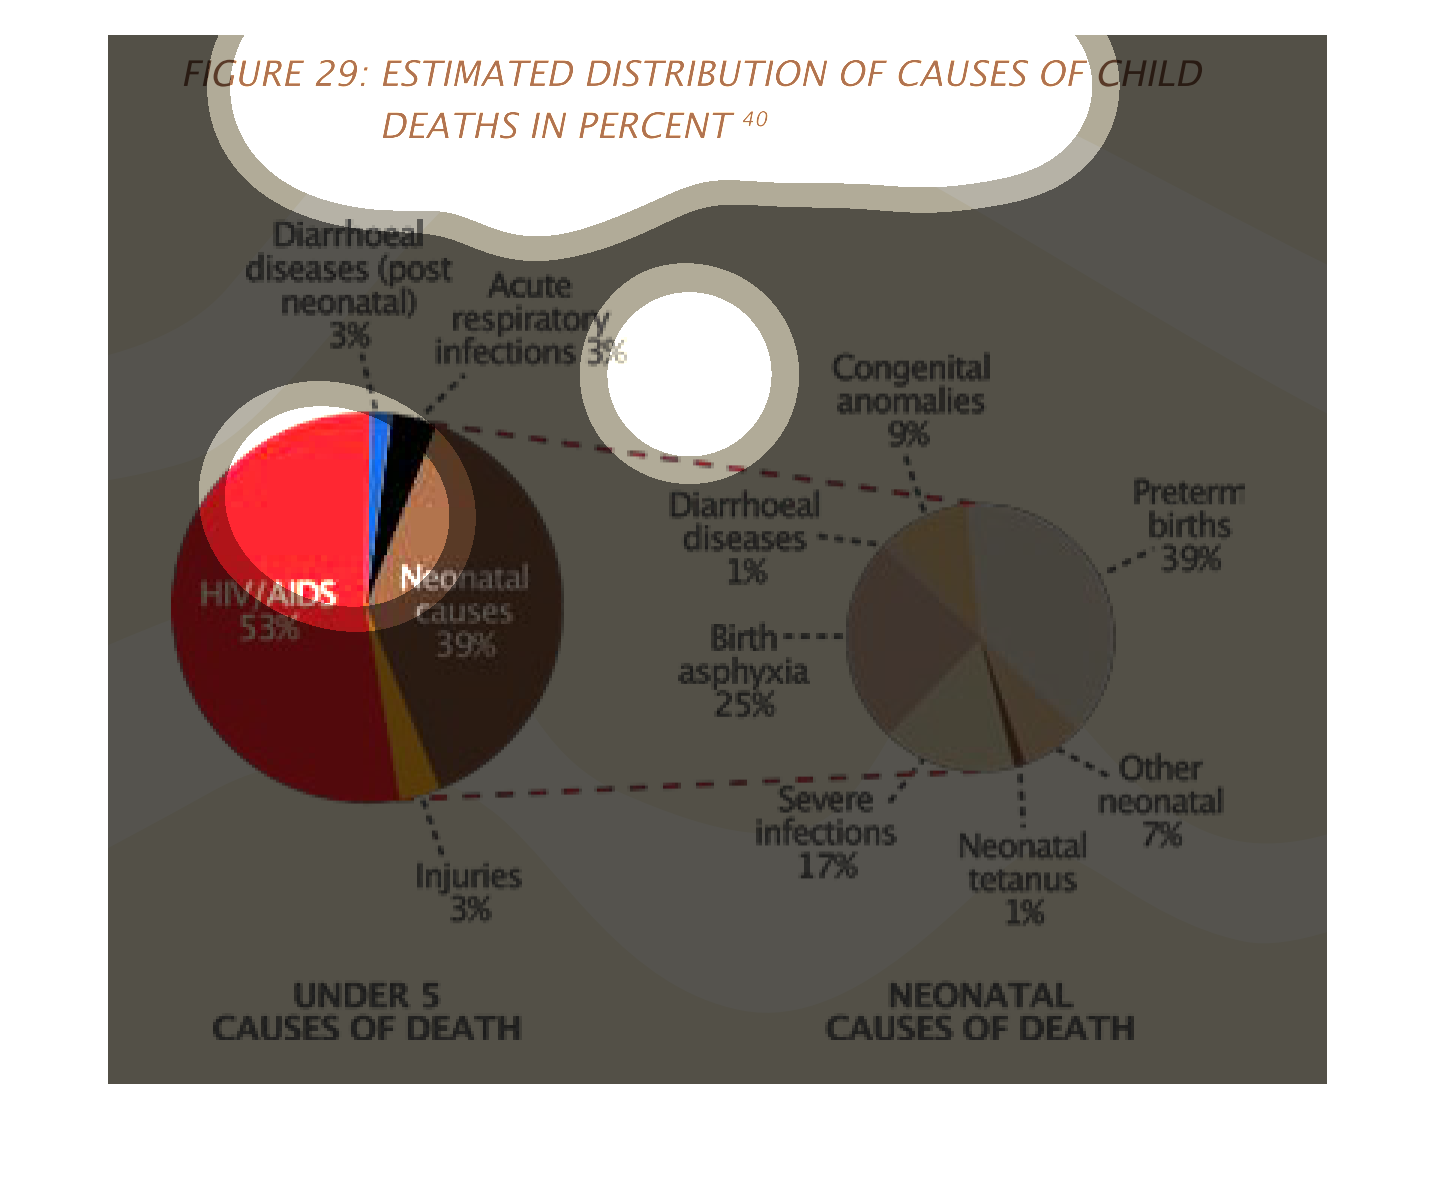
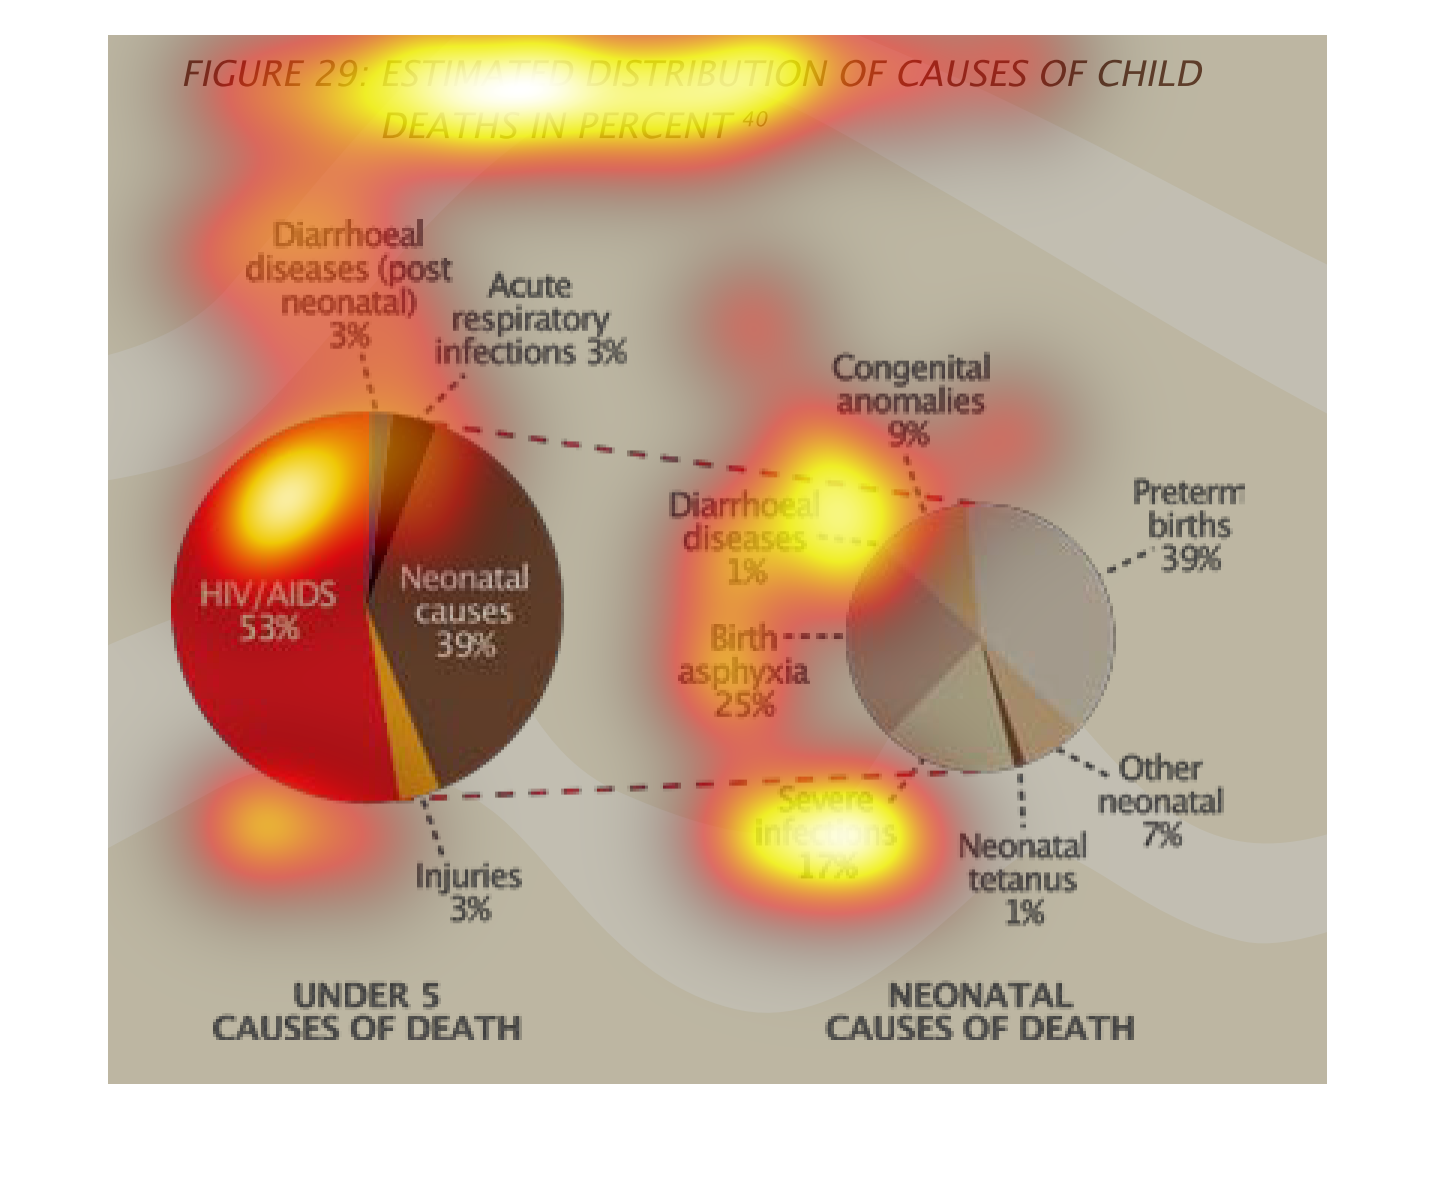
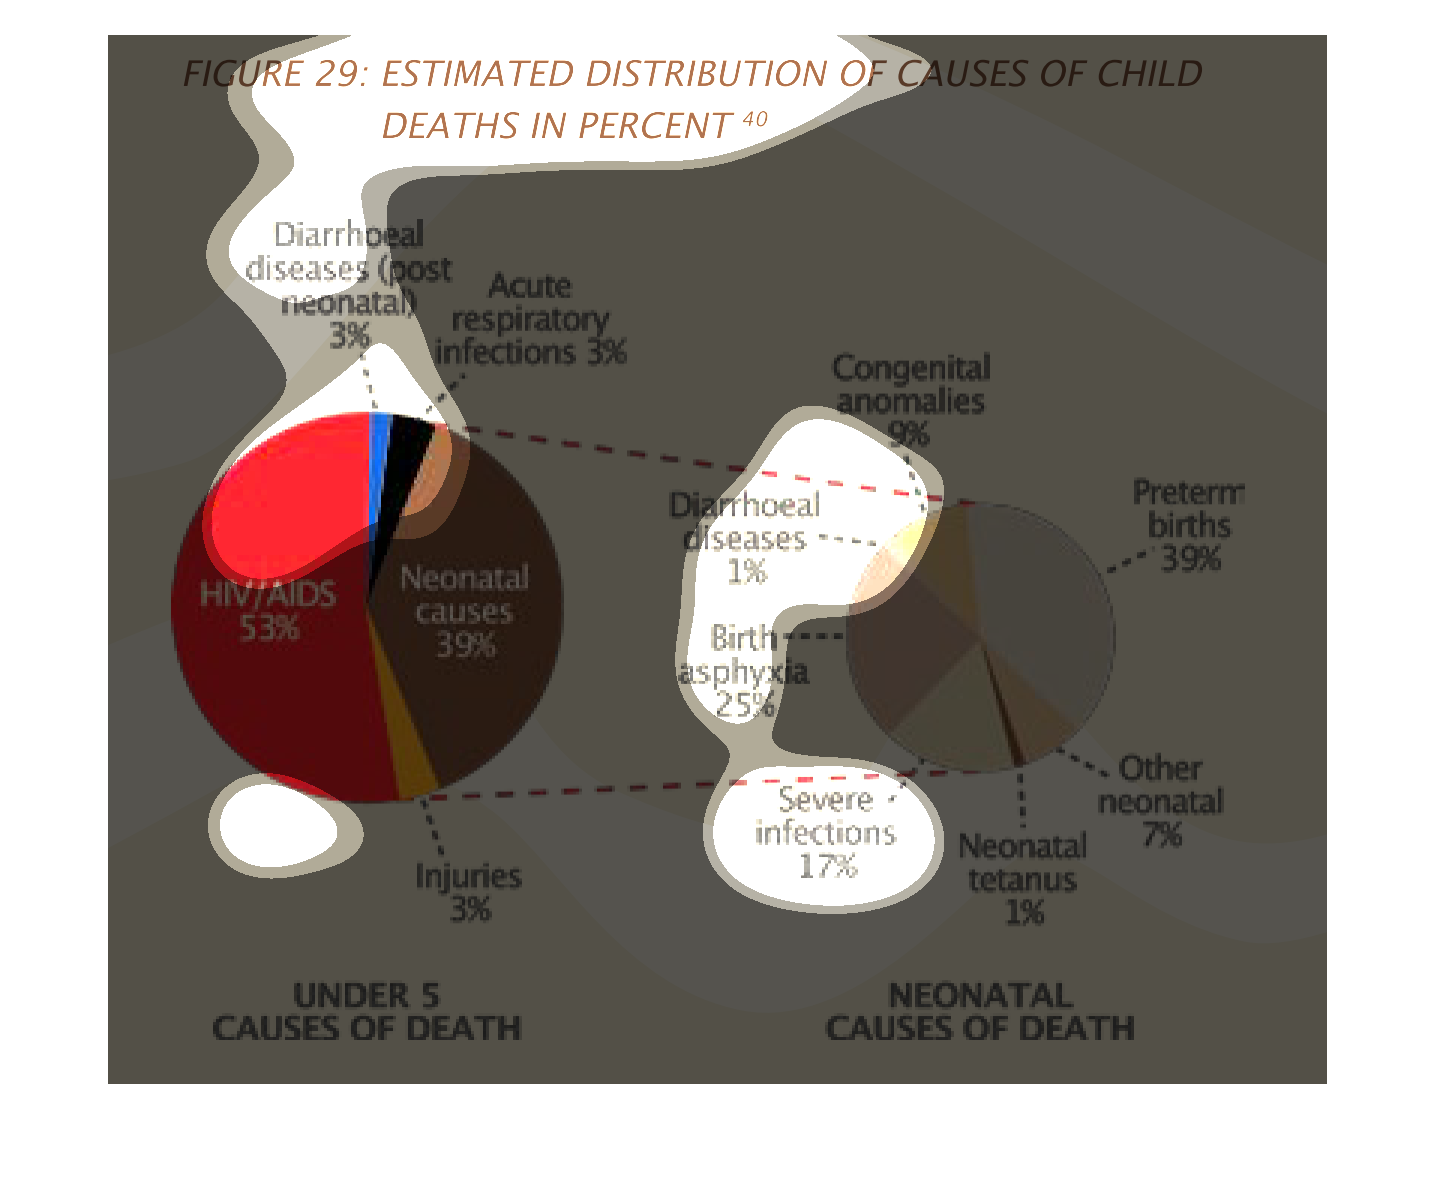
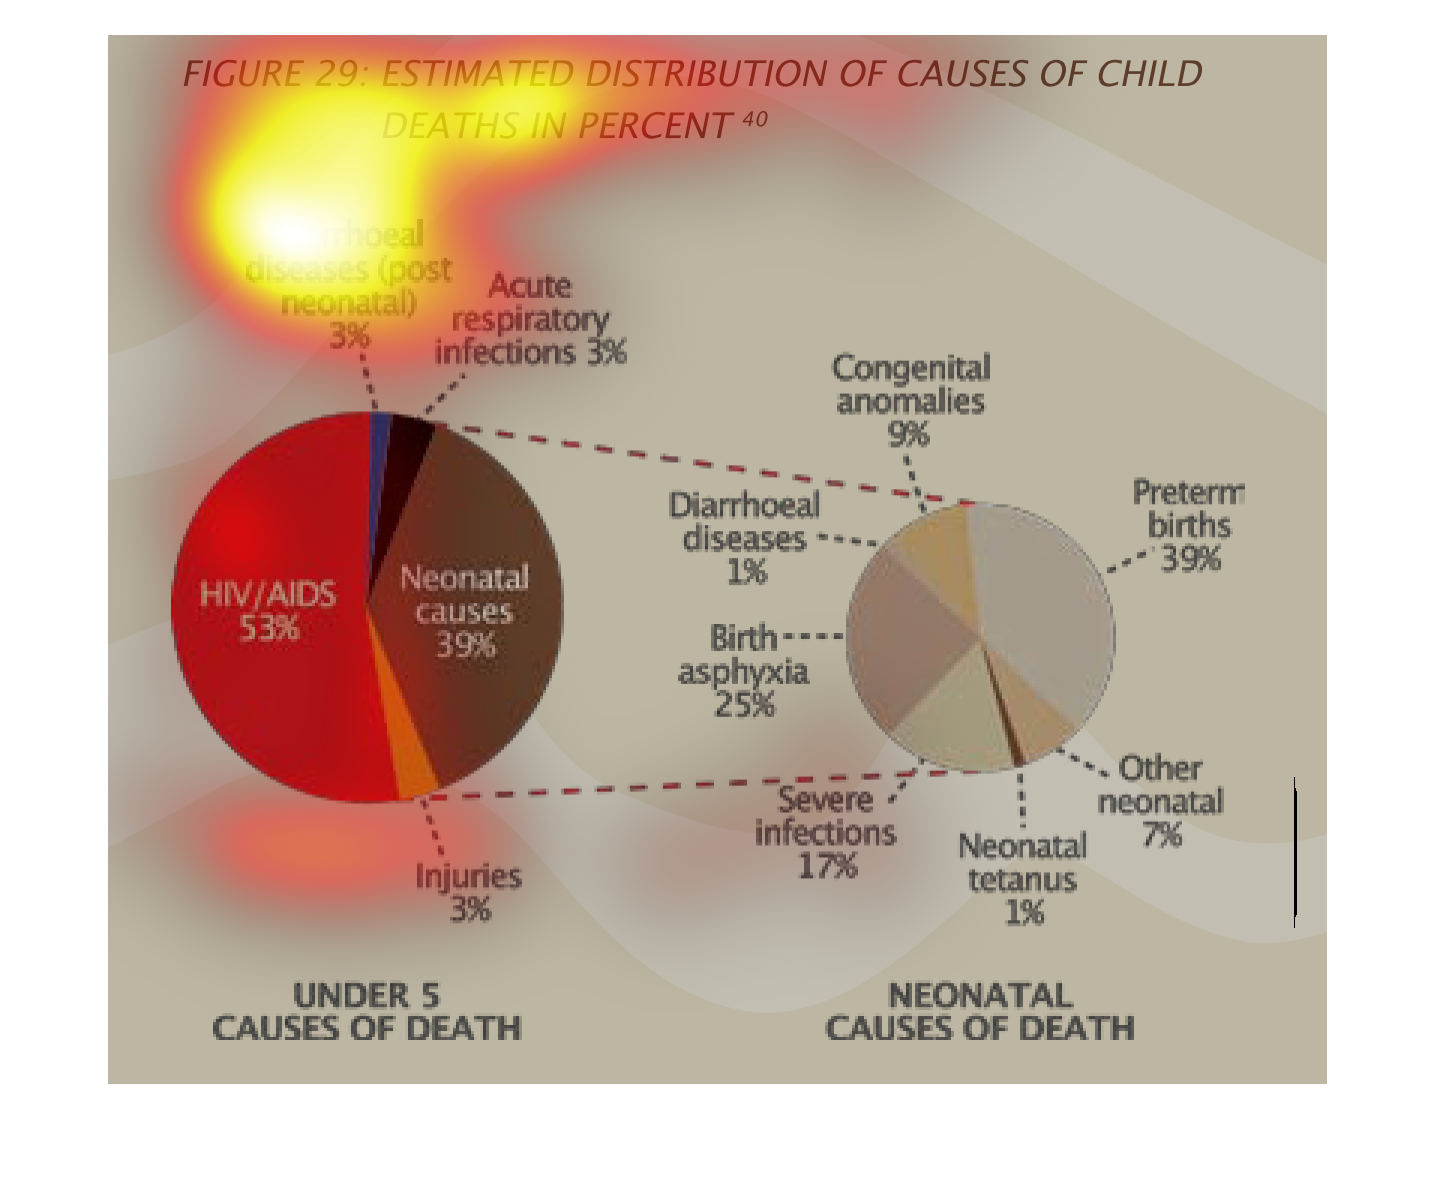
This plot shows the estimated causes of child deaths, broken down by percentage. For children
under 5, HIV/AIDS causes the majority of deaths, neonatal and diarrhoeal diseases following.
Neonatal causes of death include premature birth, infections, and birth-related difficulties.
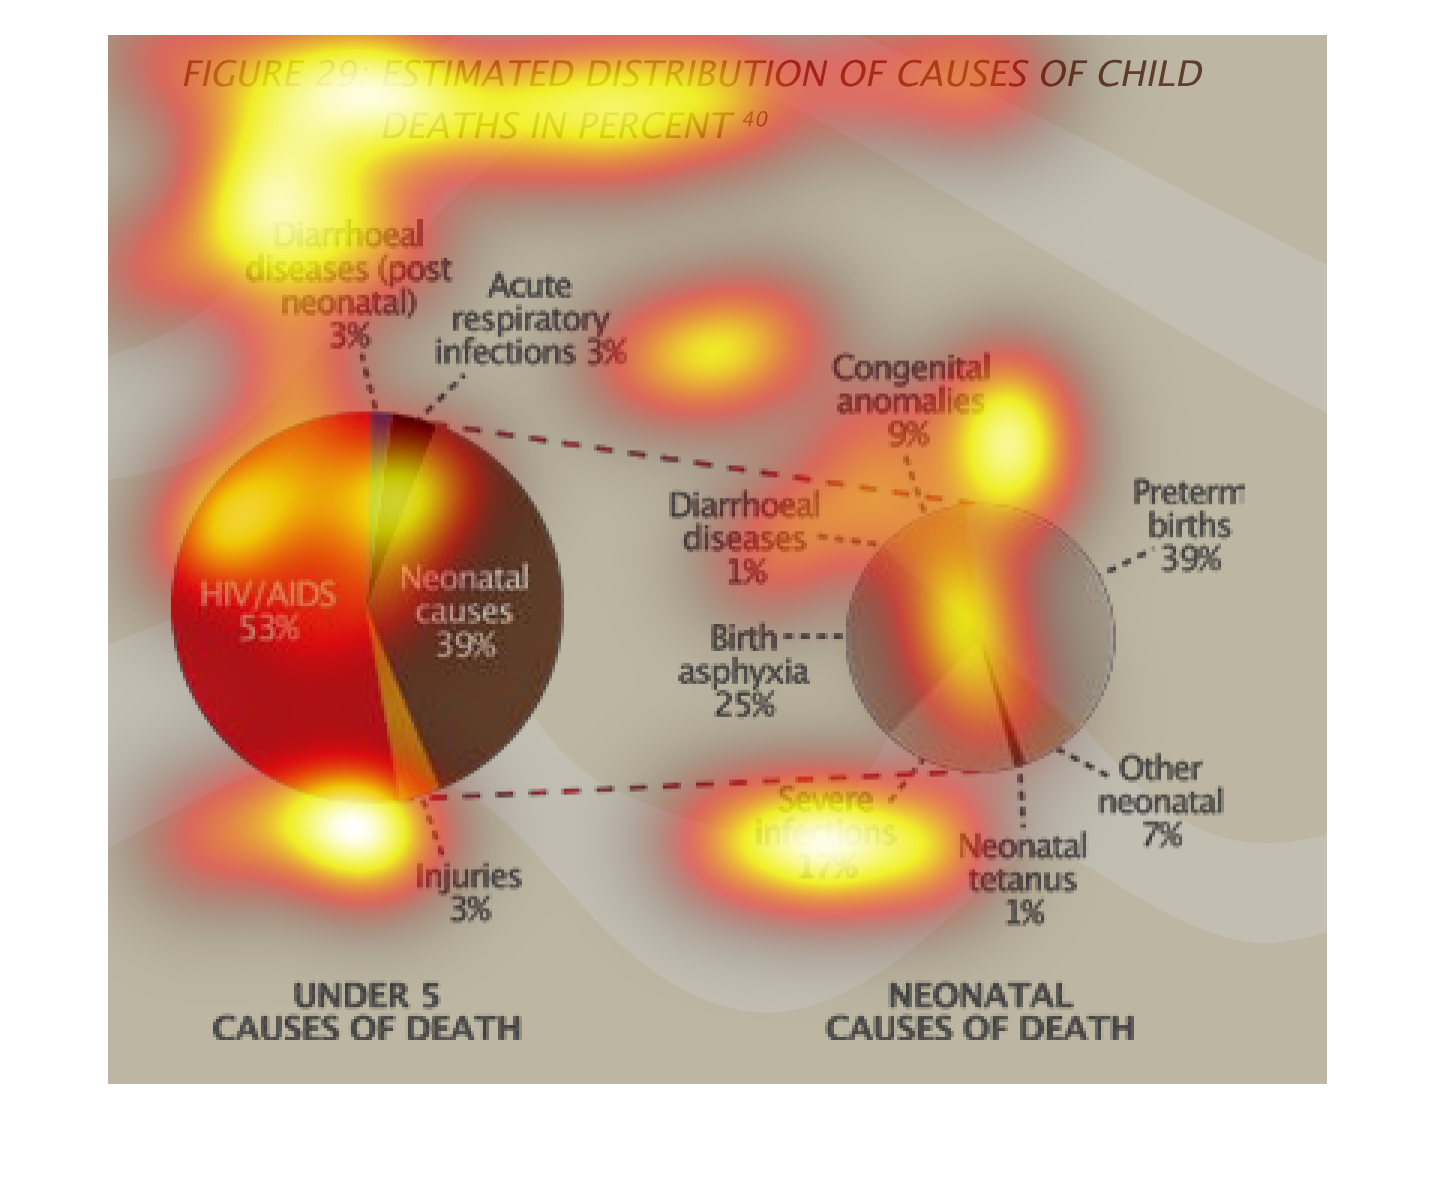
The figure presented is titled  figure 29: estimated distribution of child deaths in percent.
 The figure is literally a representation of the distribution of child deaths.
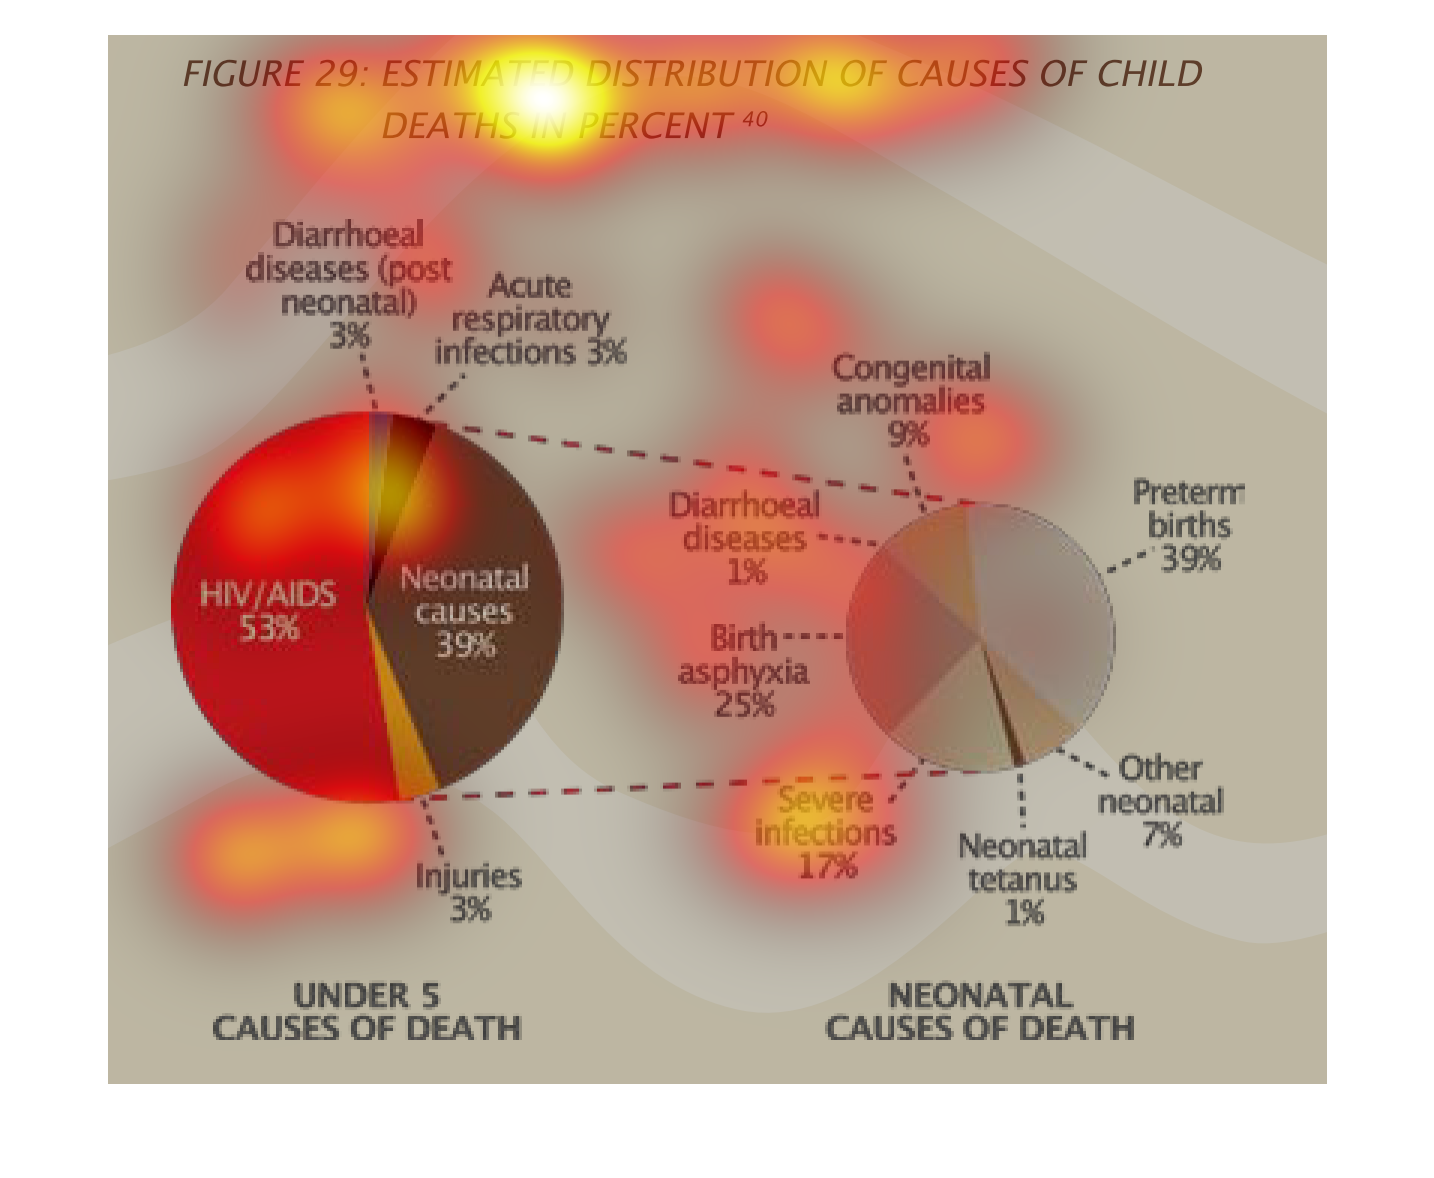
These charts show the relative causes of childhood mortality around the world. AIDS accounts
for more than half of total cases of premature death, while poor neonatal care and infections
account for a large number as well.
This is a graph of the estimated distribution of causes of child deaths in percentage. HIV
and AIDS are the leading cause of death, causing 53 percent of global deaths. The next most
common cause is neonatal causes at 39 percent..
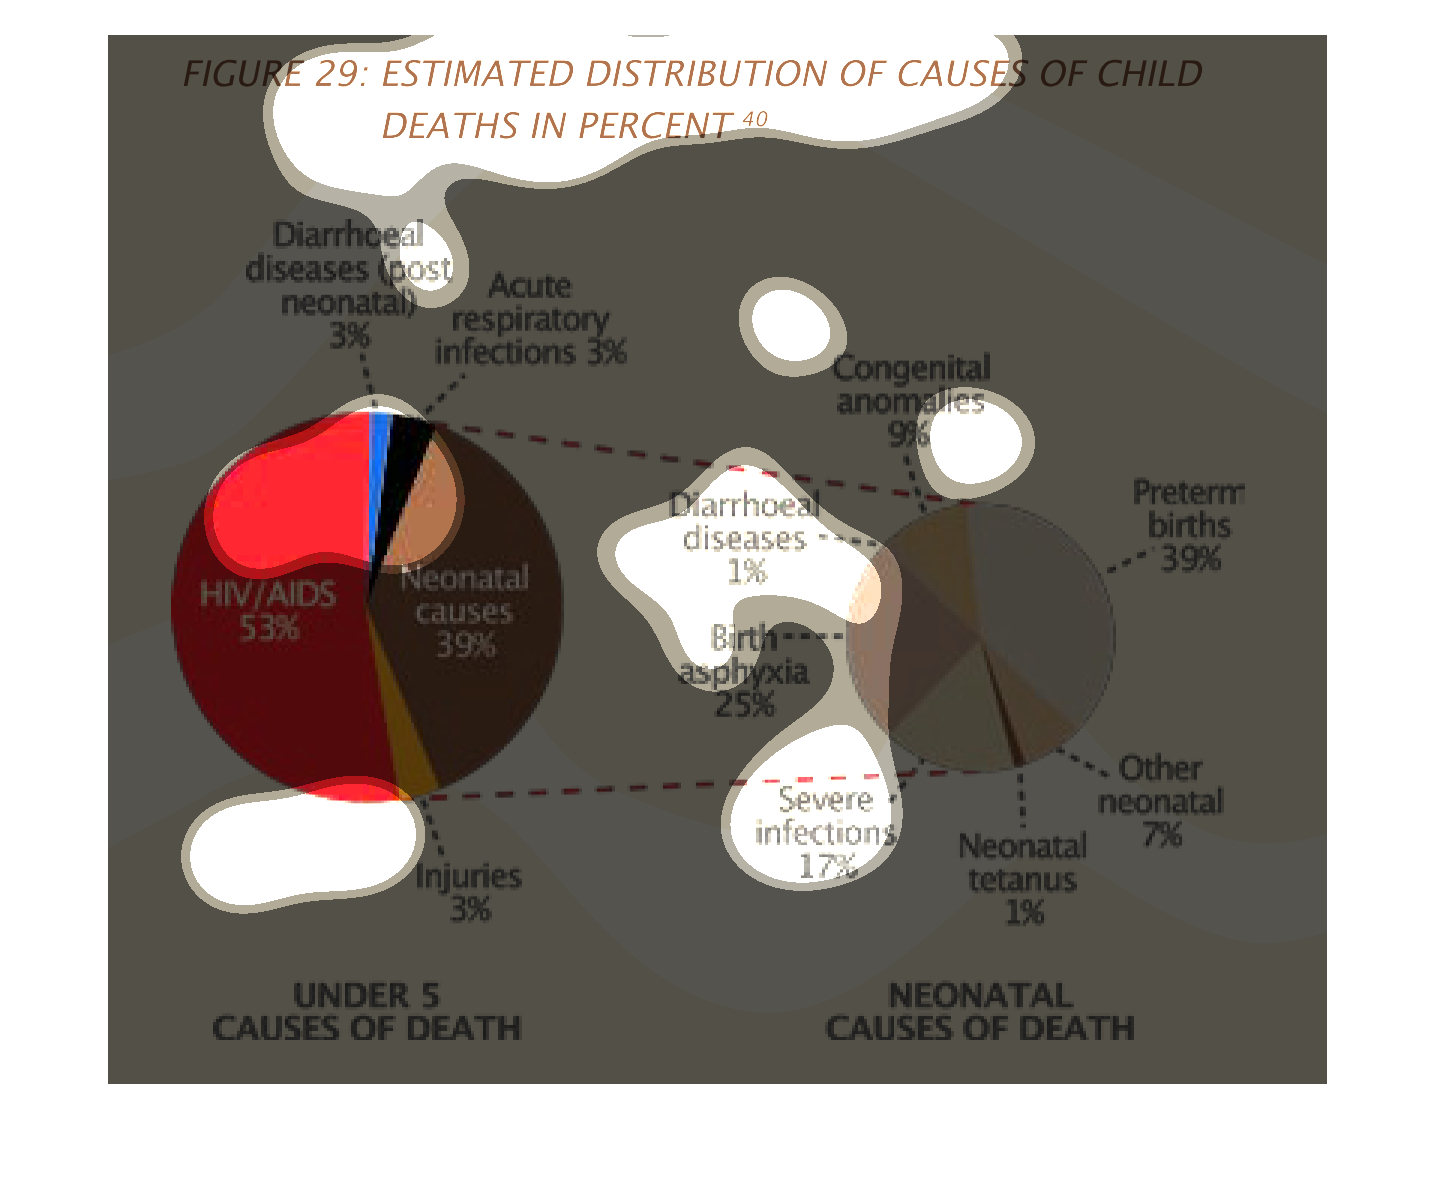
This chart shows the estimated causes of death in children. Largely HIV/AIDS account for the
majority of child deaths, along with neonatal causes. Among neonatal deaths, premature birth
is the leading cause of death.
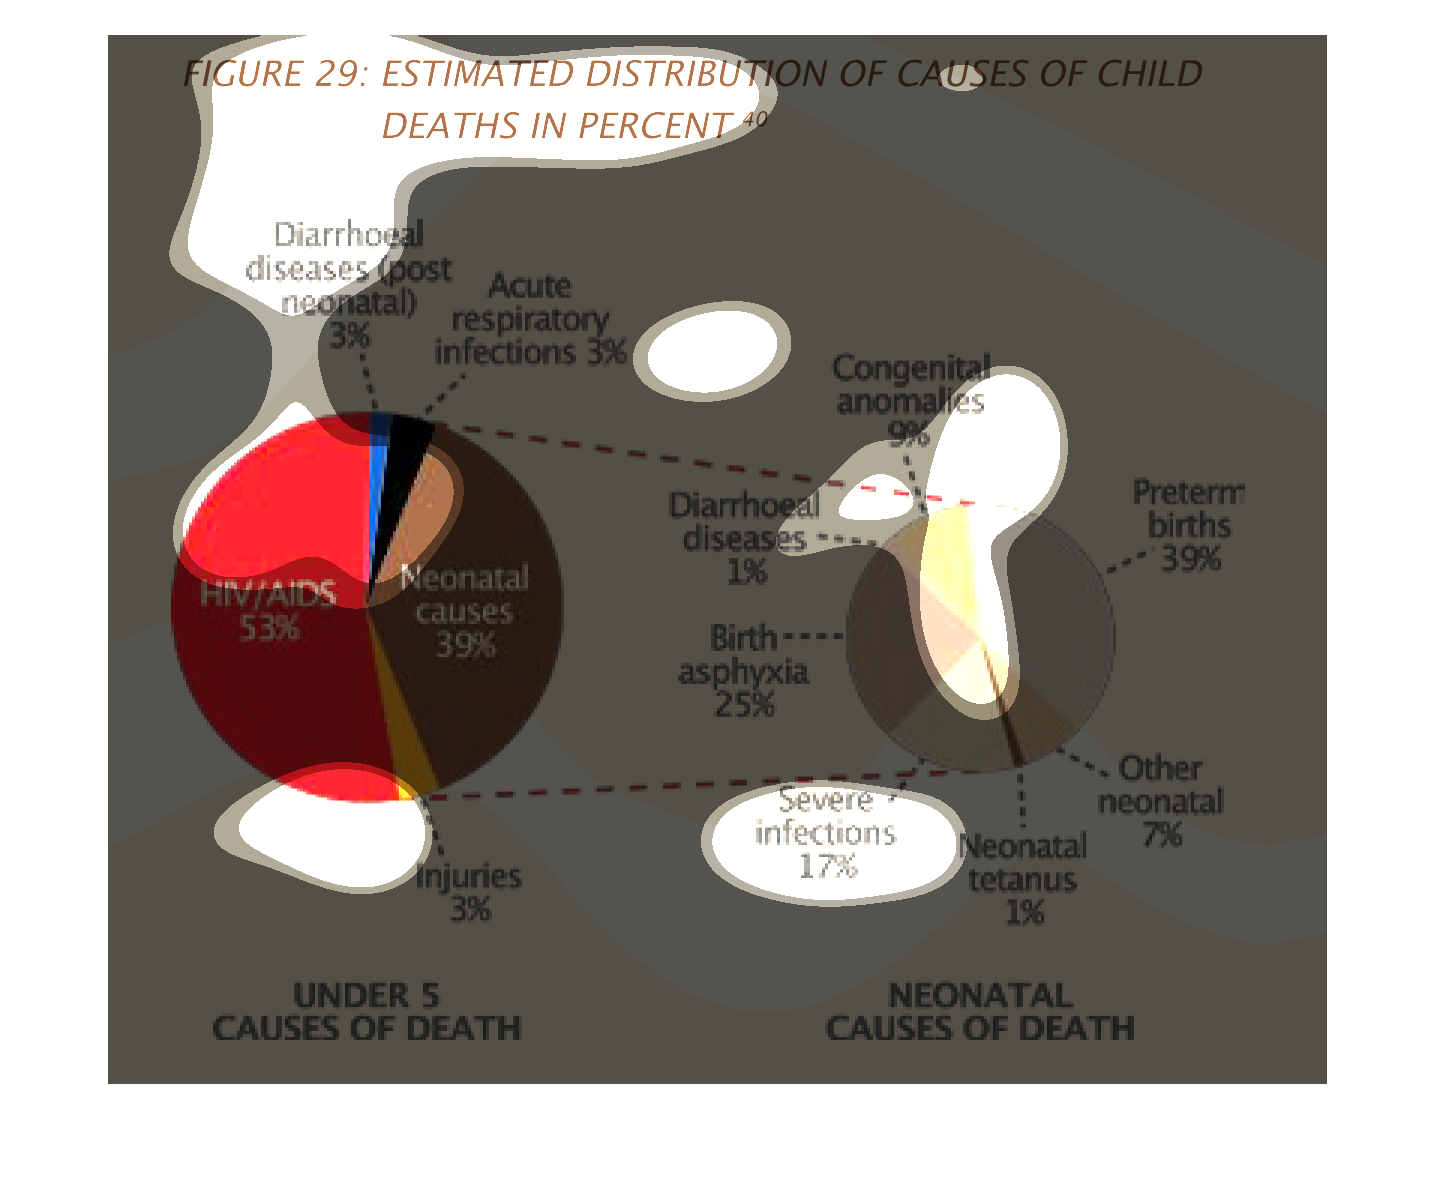
This pie chart shows the estimated distribution of causes of child death.  In the under 5
years causes of death, the number one cause is HIV/AIDS.  In neonatal causes of death, the
number one is preterm births.
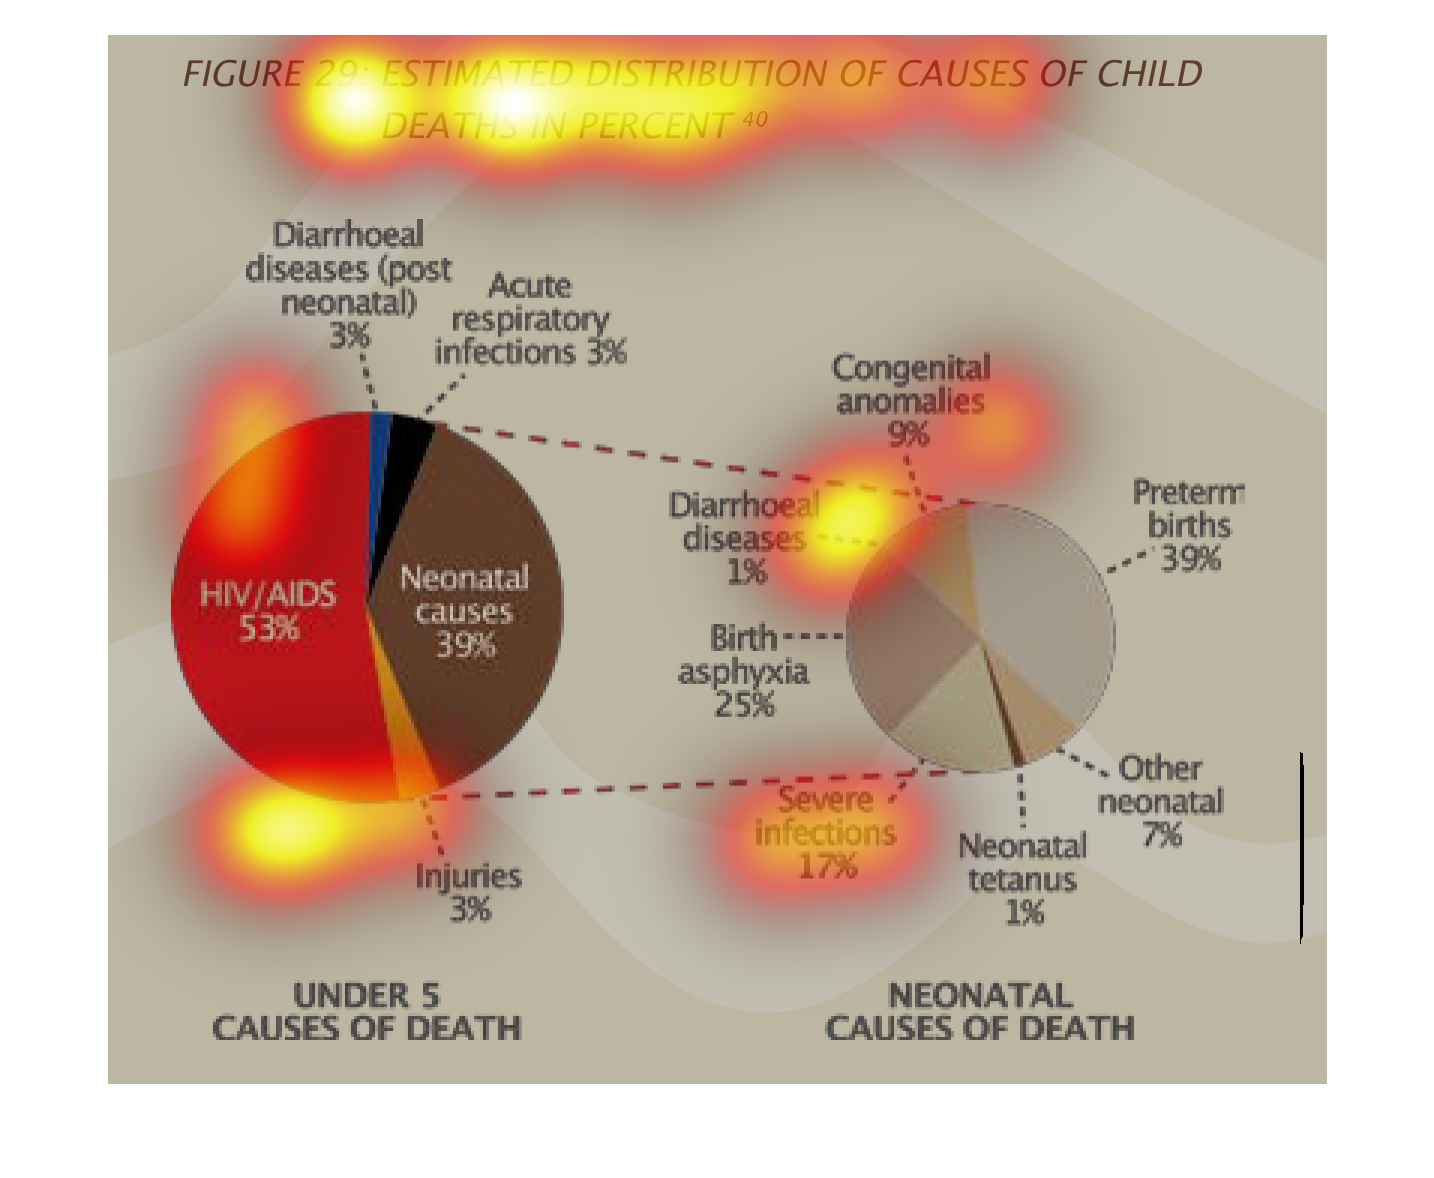
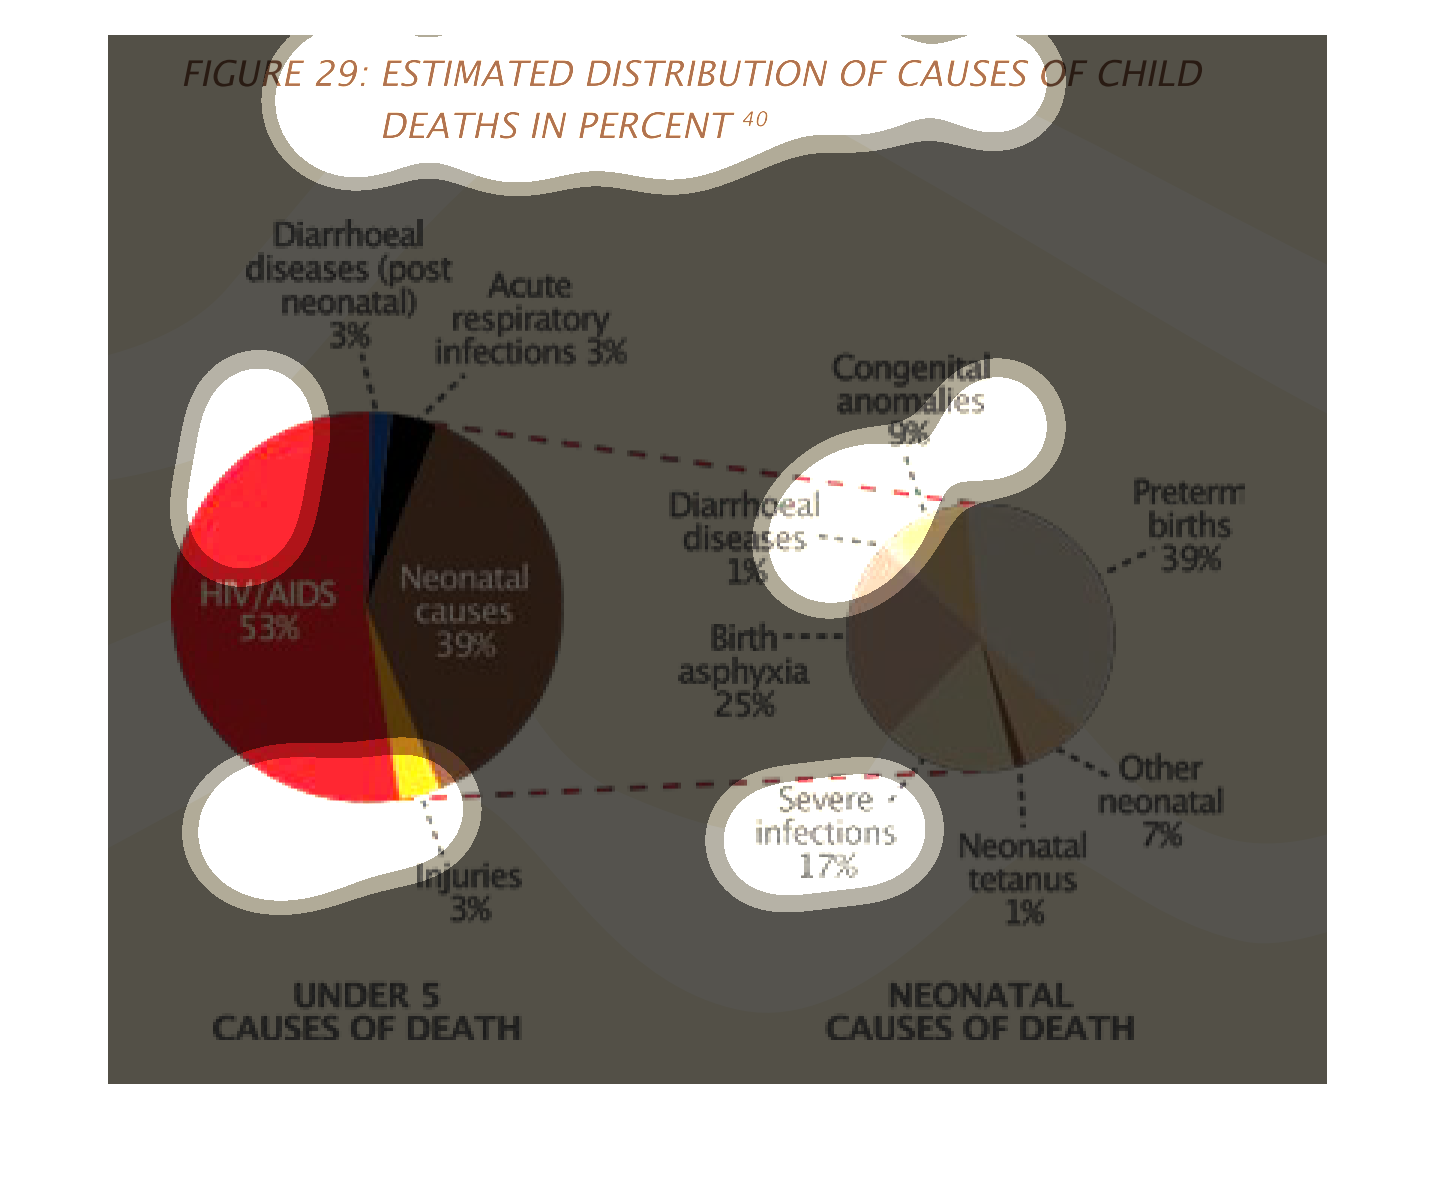
This chart describes about causes of child death in percentage. The different causes and it's
percentage is clearly mentioned in the chart.  HIV/AIDS 53%, Neonatal Causes 39%, Injuries
3%, Respiratory infections 3% and Diarrhoeal diseases 3%.
This chart describes estimated distribution of causes of child deaths in percent. Different
categories on the chart are represented by different colors.
This handmade chart shows shows the number of causes of death in children. Other than that
it is pretty dense and hard to read and ascertain what is going on
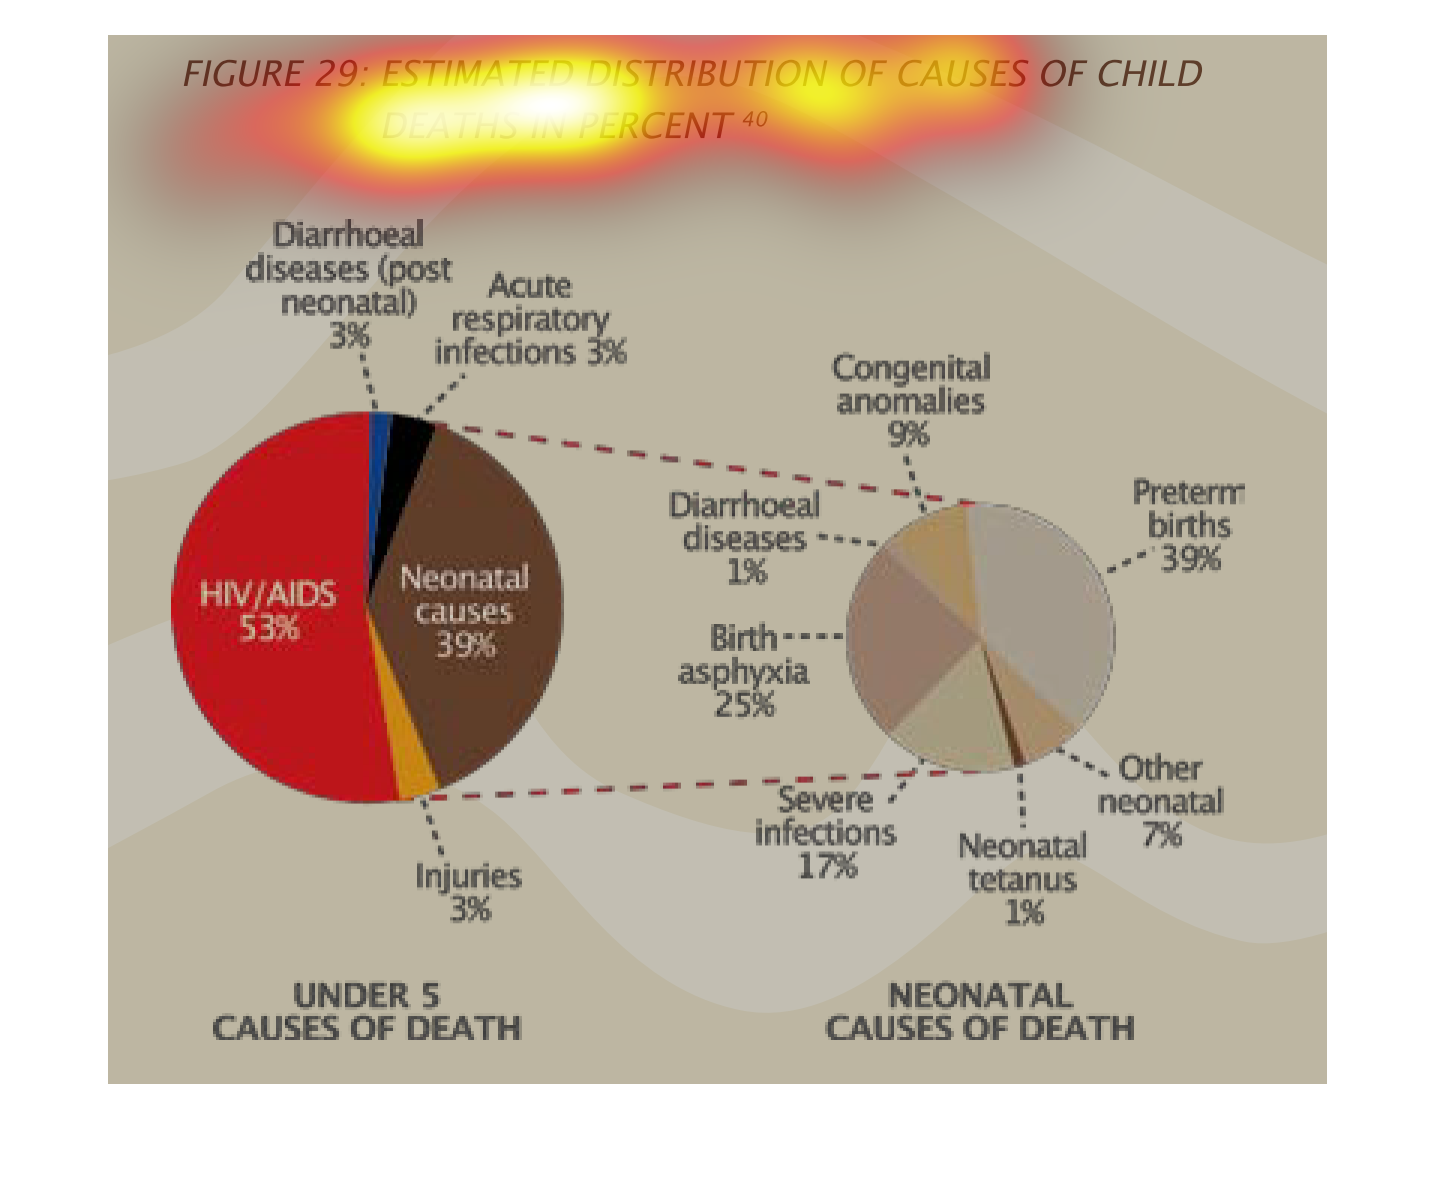
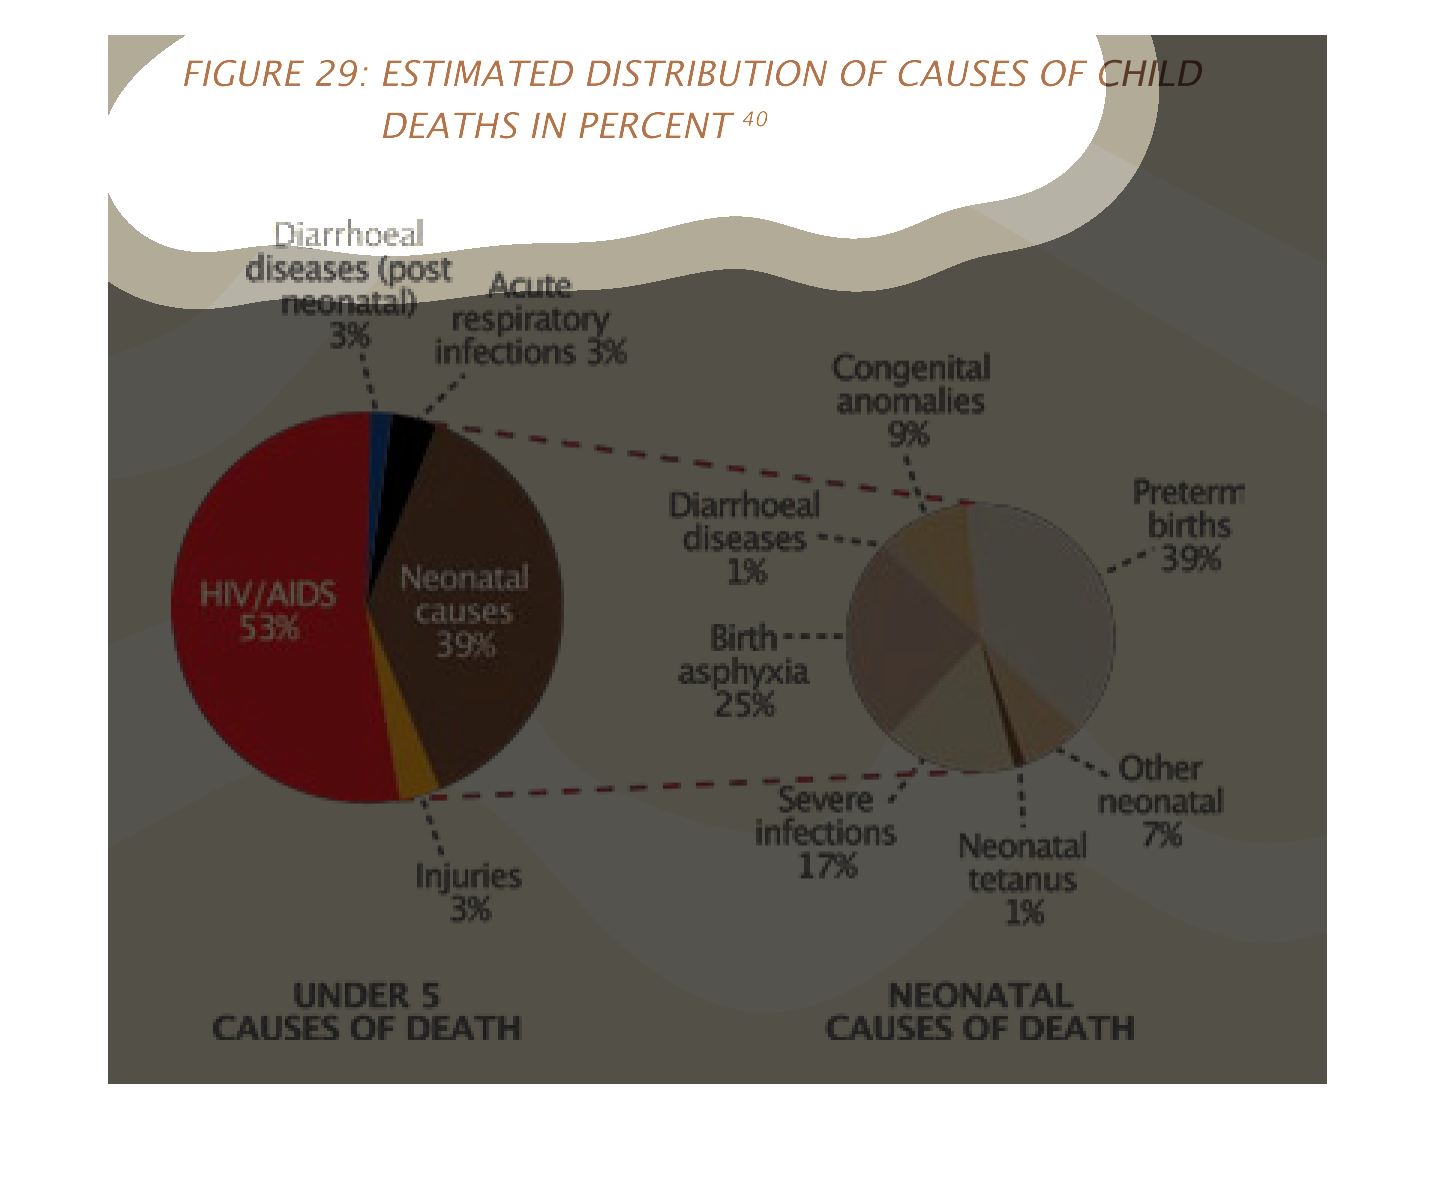
Figure 29 shows the estimated distribution of causes of child deaths in percent. Leading cause
of death under 5 is HIV/AIDS. Leading cause of neonatal deaths is preterm births.
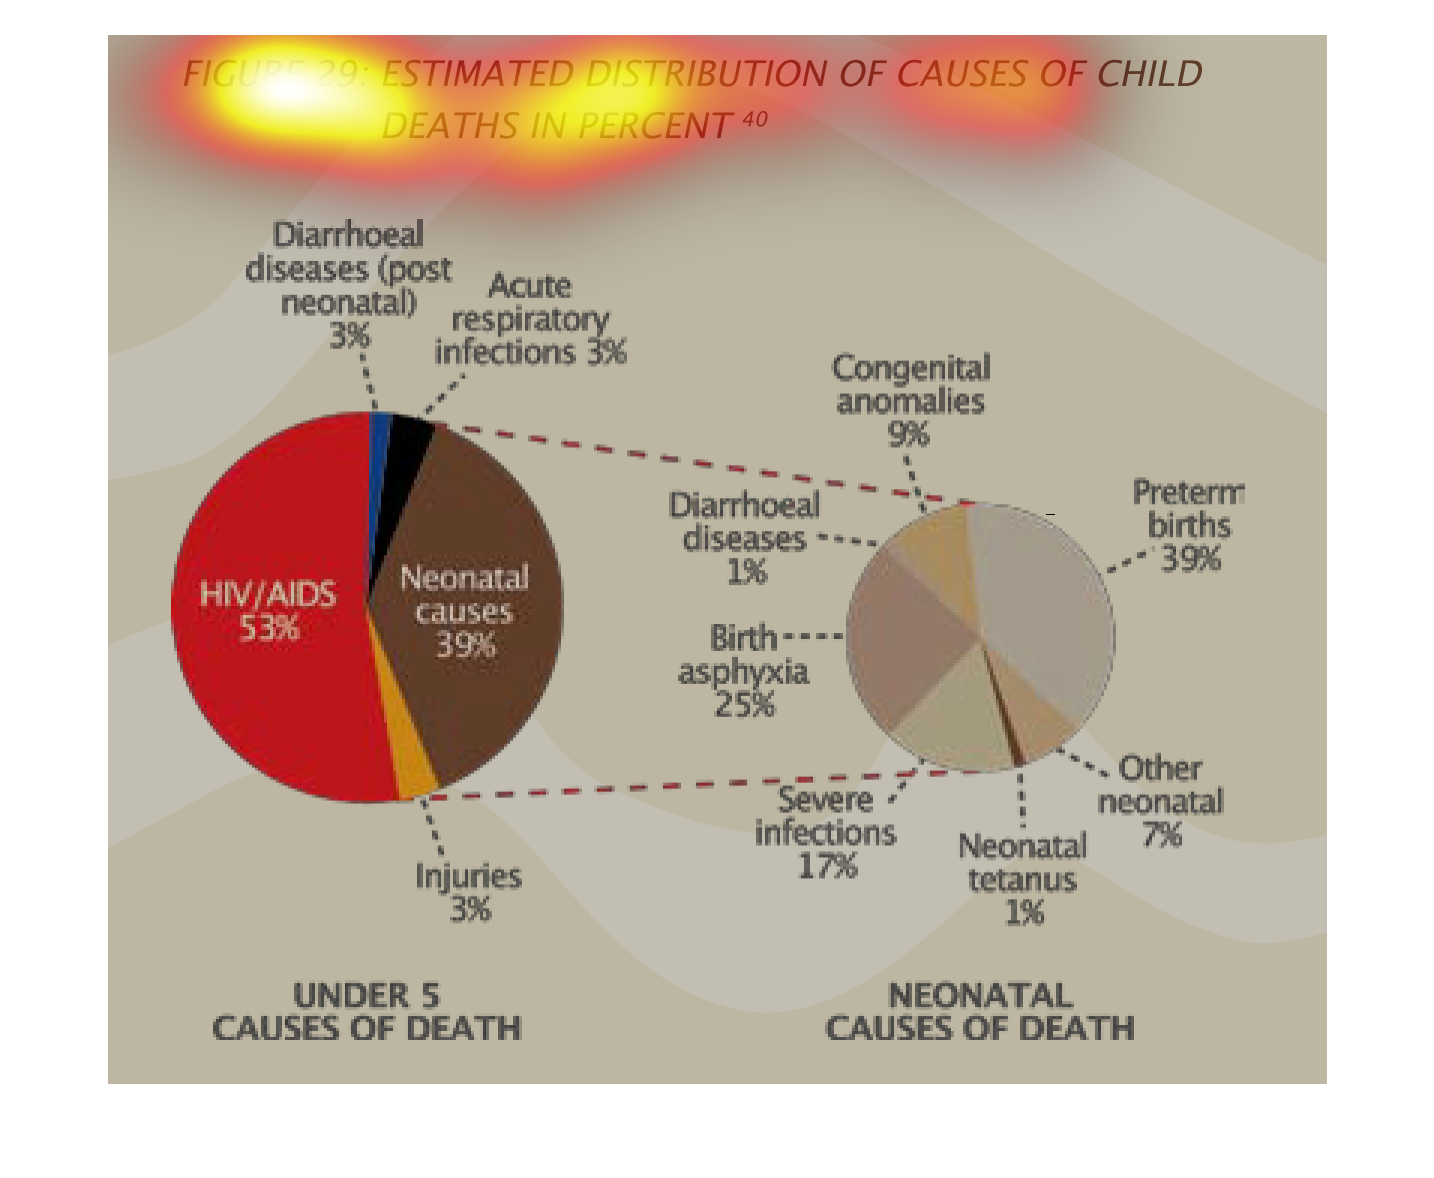
This pie chart shows the estimated distribution of causes of child deaths in percentages.
The charts are divided into two categories, the first is 'Under Five Causes of Death,' and
the other is, 'Neonatal Causes of Death.' For the first category, HIV/AIDS is the largest
cause, being at 53% while for the second category, the largest cause is preterm births at
39%
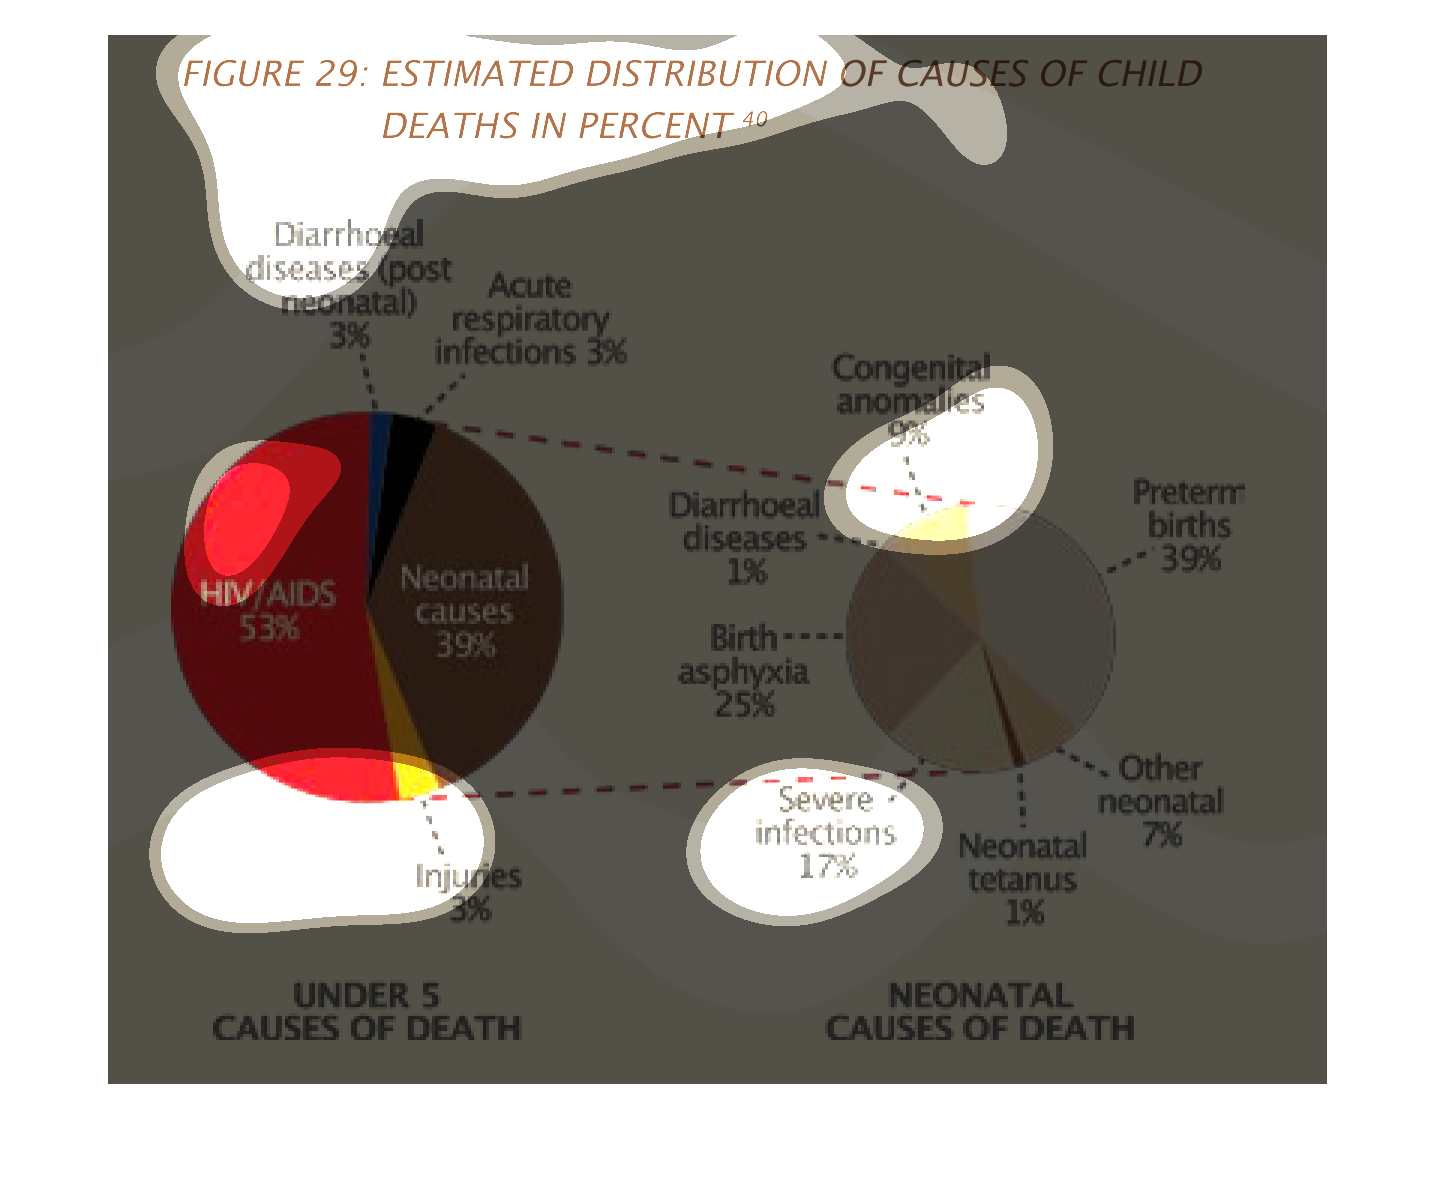
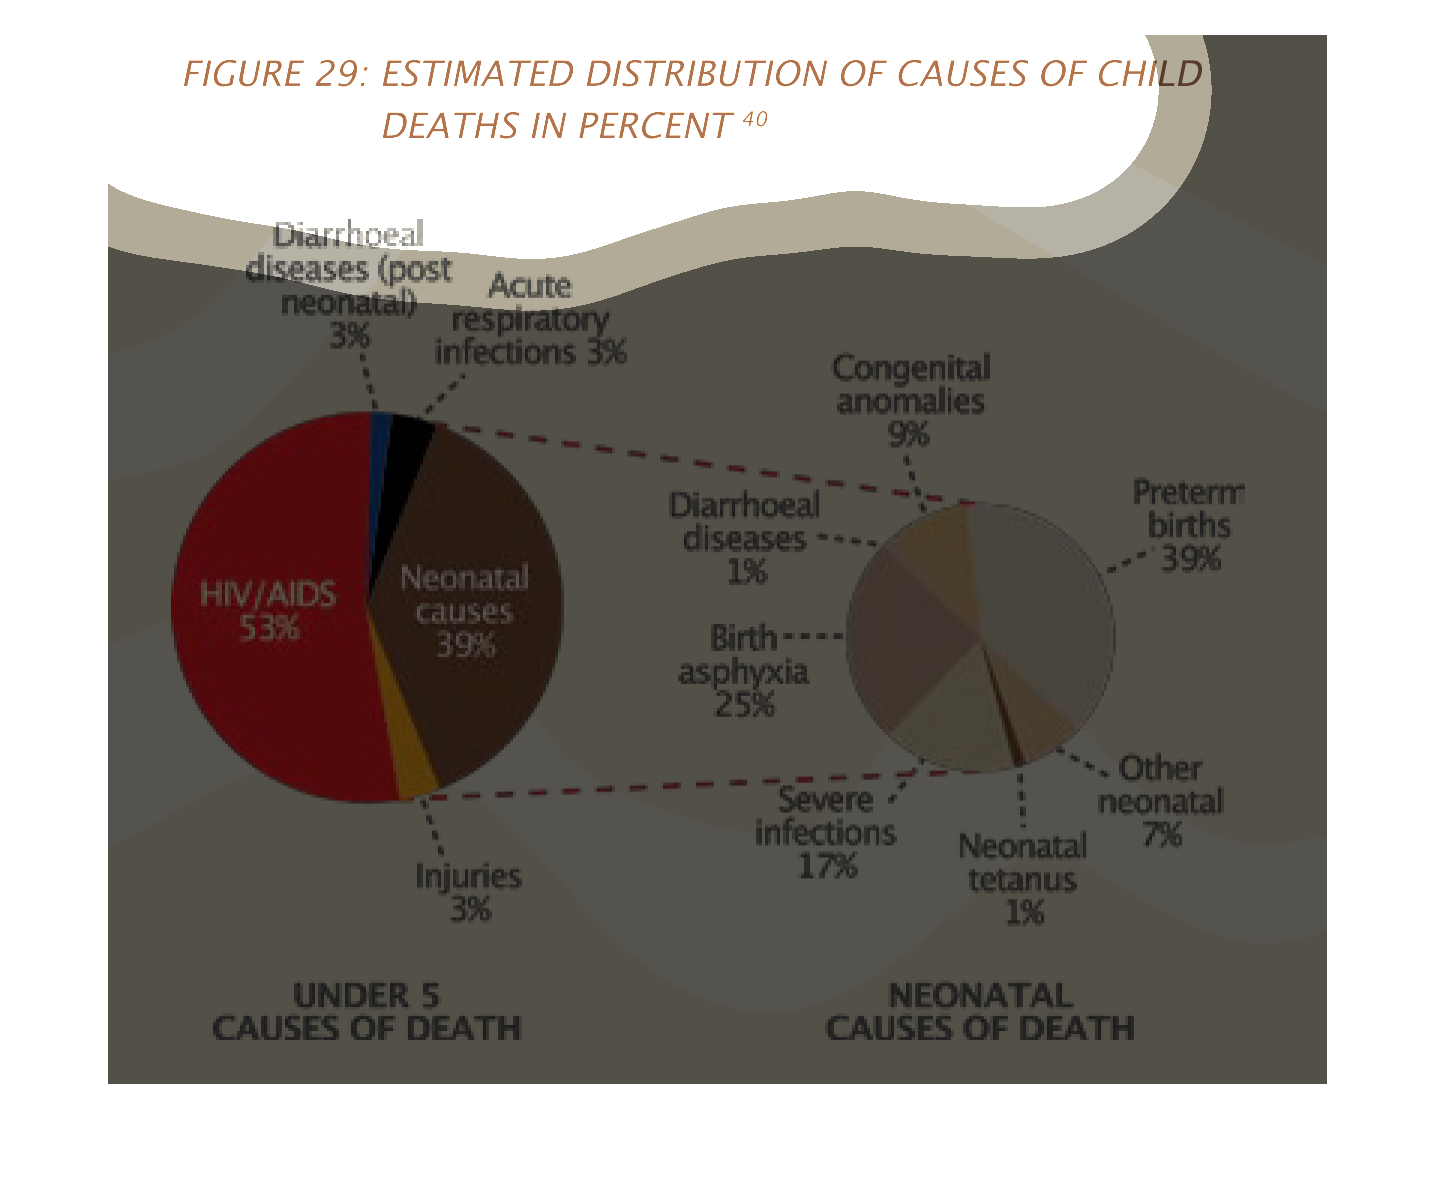
figure 29: estimated distribution of causes of child death in percent. two pie graphs are
shown, one is under five years old death and the other is neonatal causes of death. Aids and
premature birth complications are an astounding majority in the respective graphs
This chart is the estimated distribution of causes of child deaths. 53 percent is HIV/Aids.
39 percent is neonatal problems. 3 percent is injury to the child. 3 percent breathing infections.
And 3 percent is diarrhoeal disease.

This is an informational image regarding estimated distribution causes of child deaths in
percent. There are two pie charts both labeled with multiple causes of child deaths.