This handmade chart shows the effective coverage of children under five for what I think is
health concerns. It is not clear what this chart is supposed to show
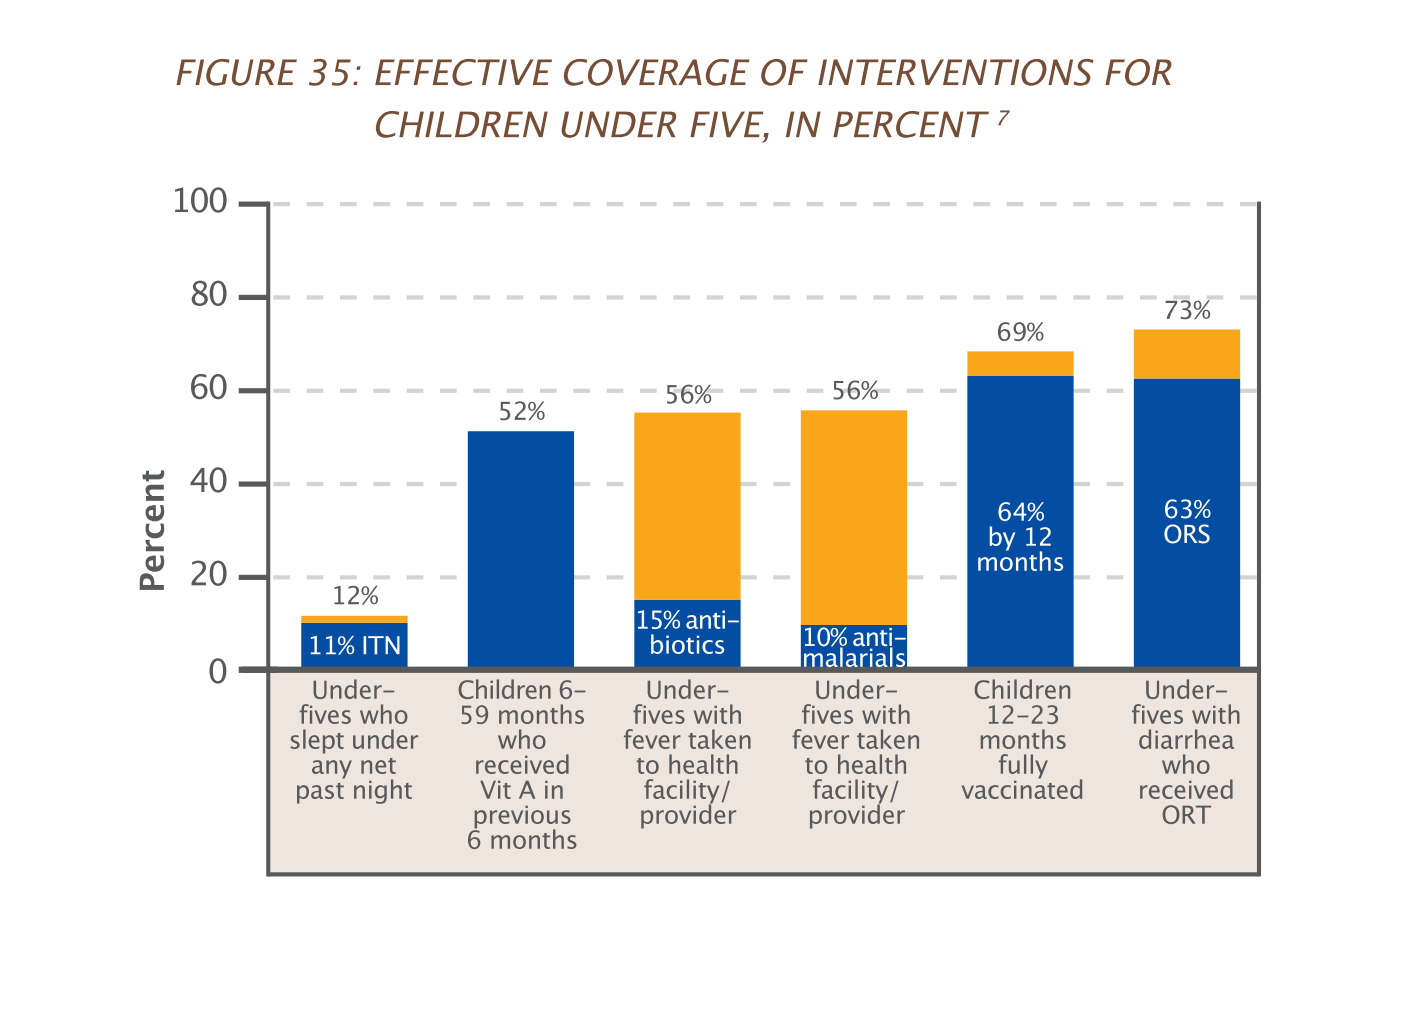
This is a series of bar graphs depicting effective coverage of interventions for children
under the age of five by percentage separated into several metrics.
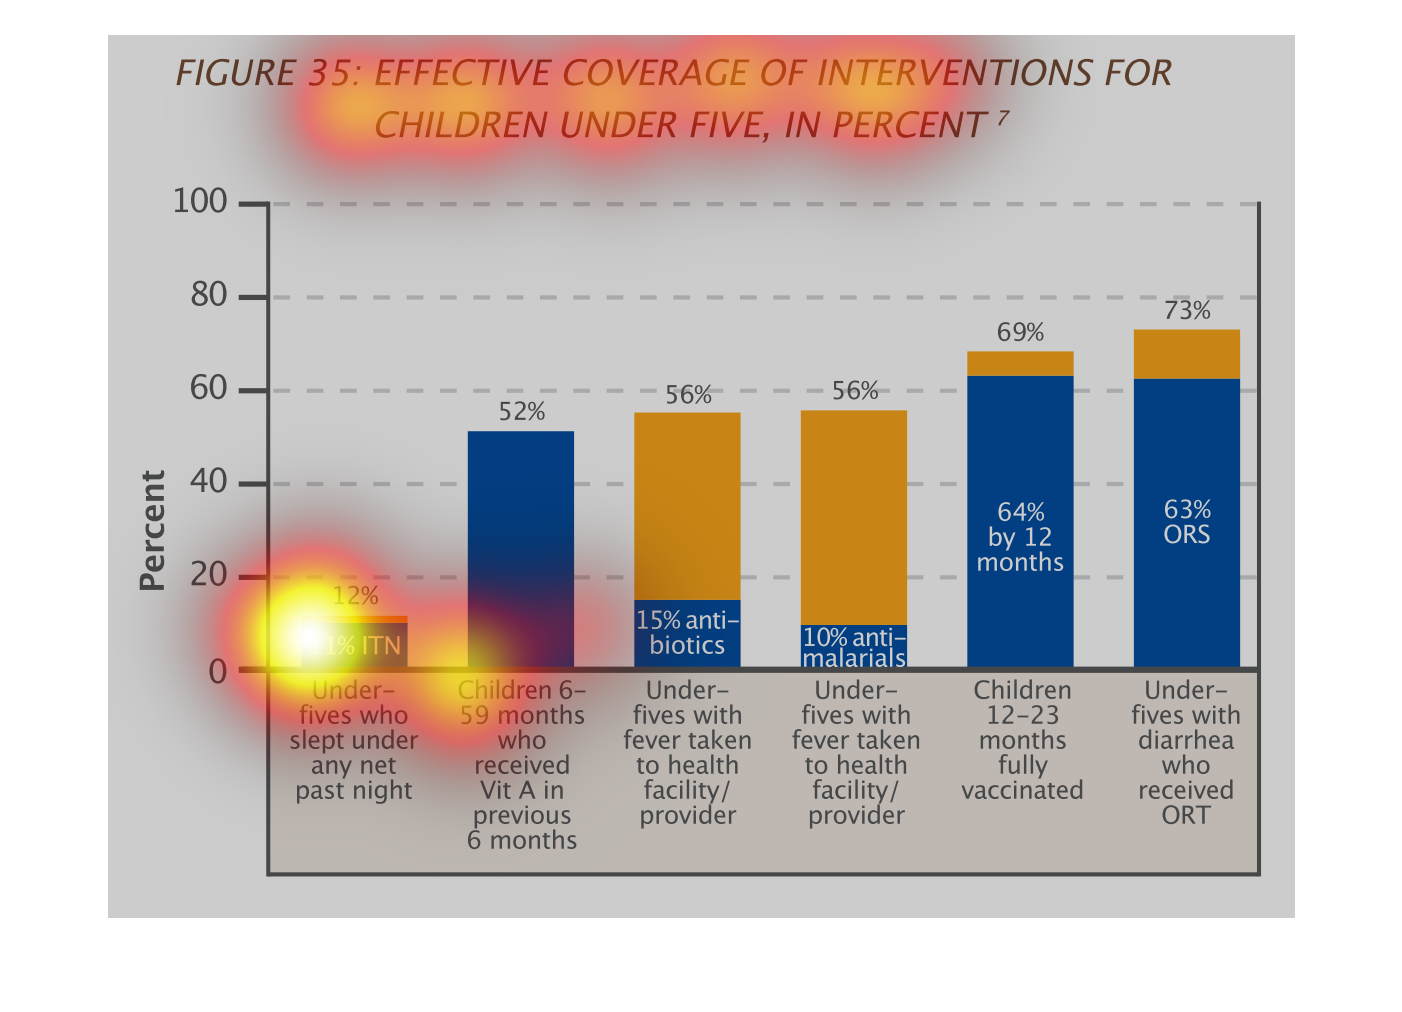
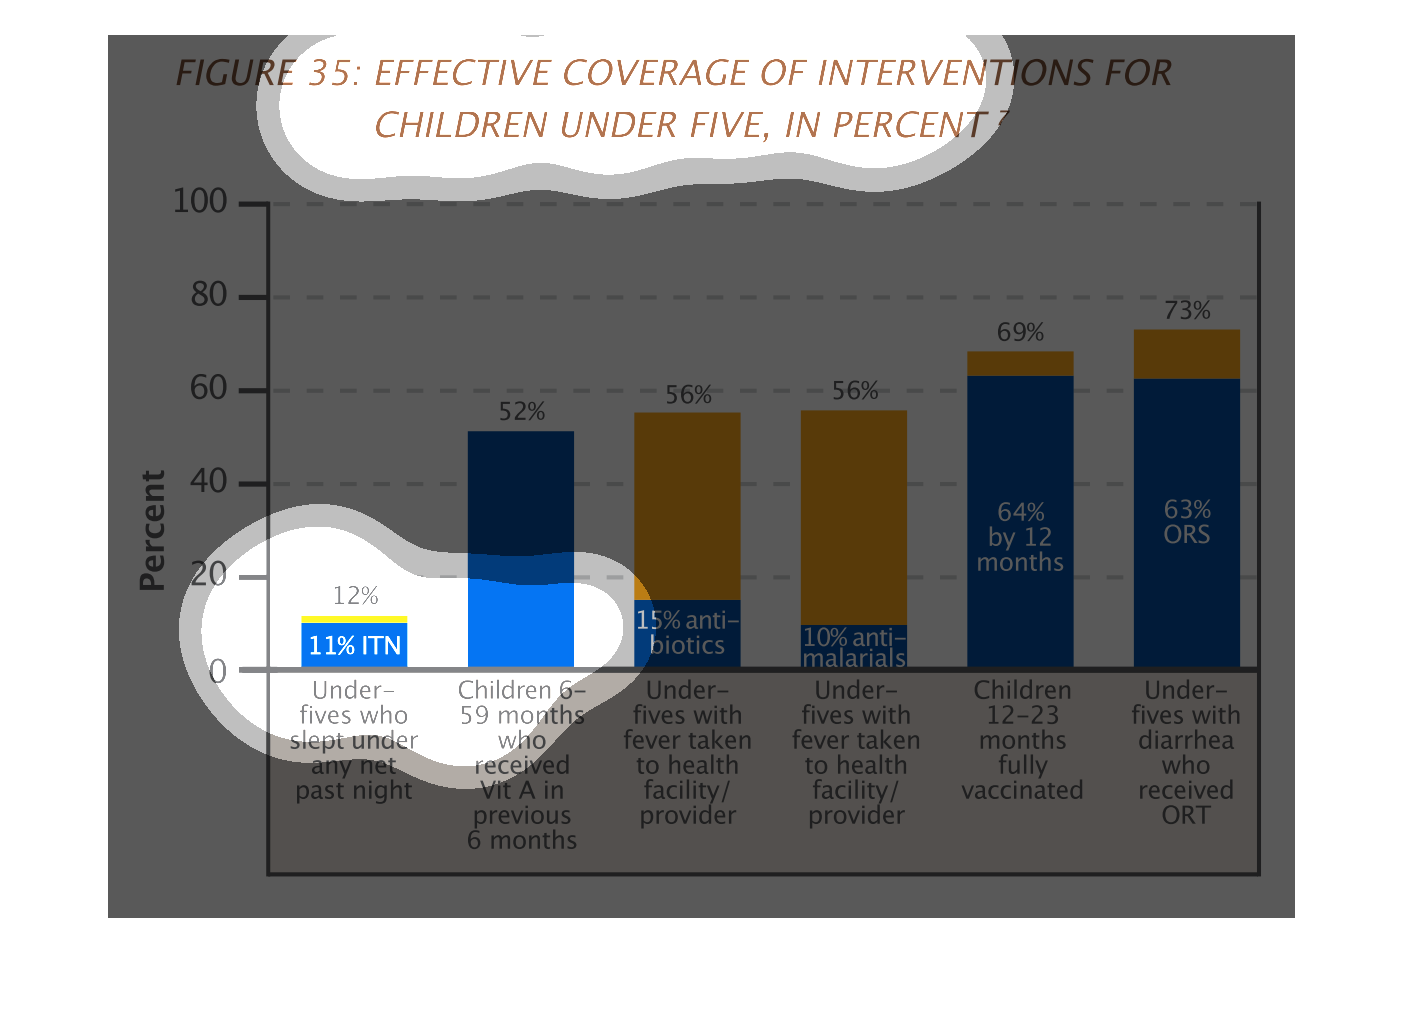
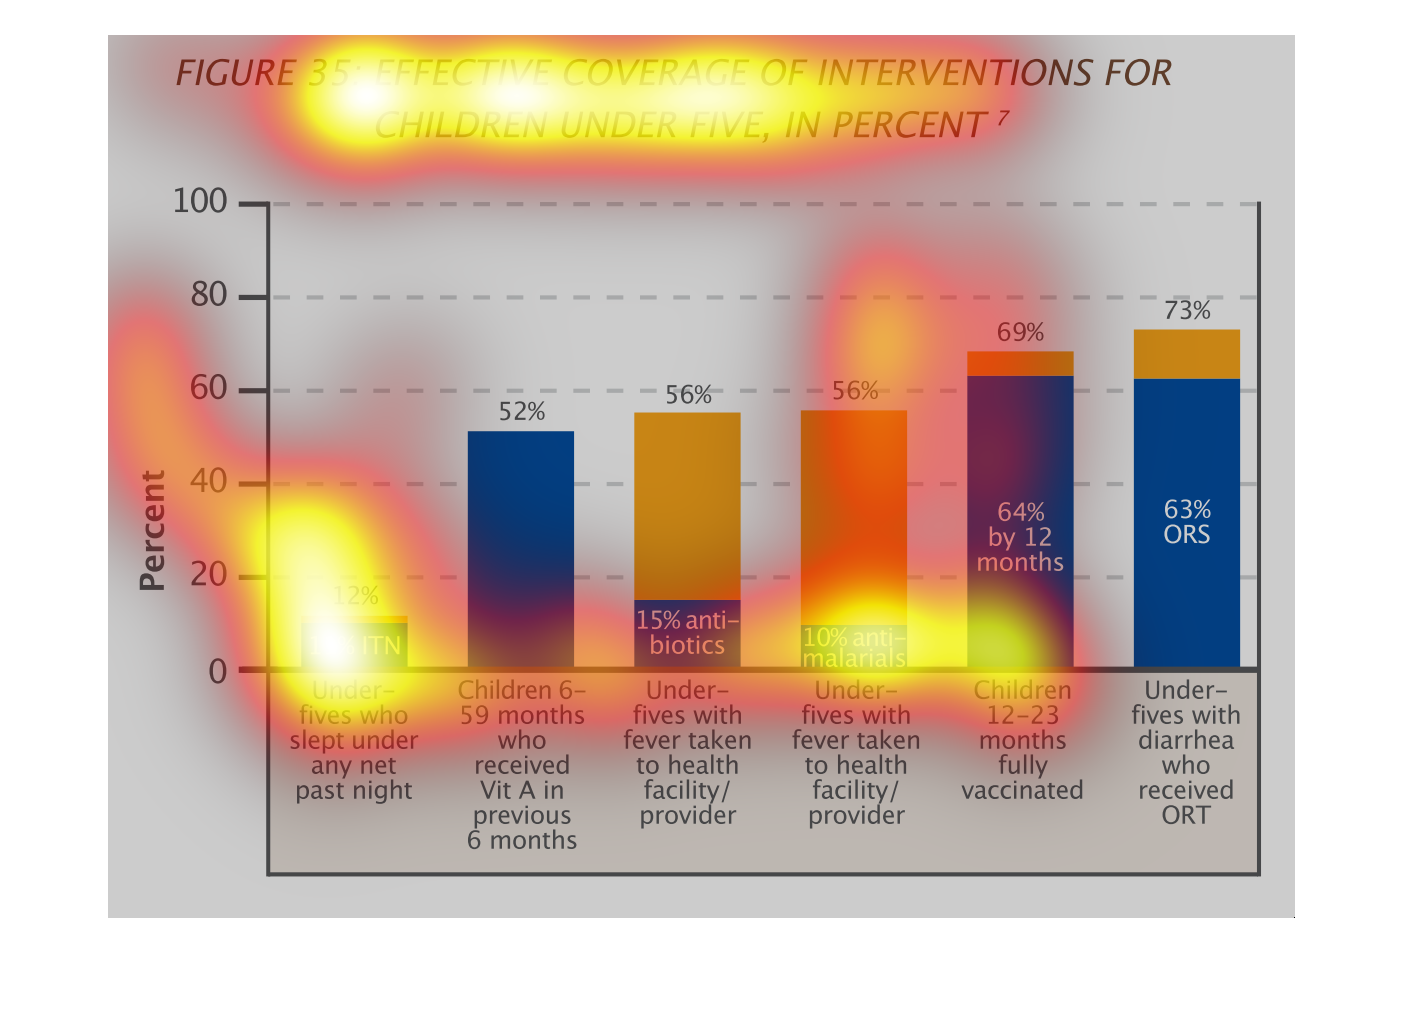
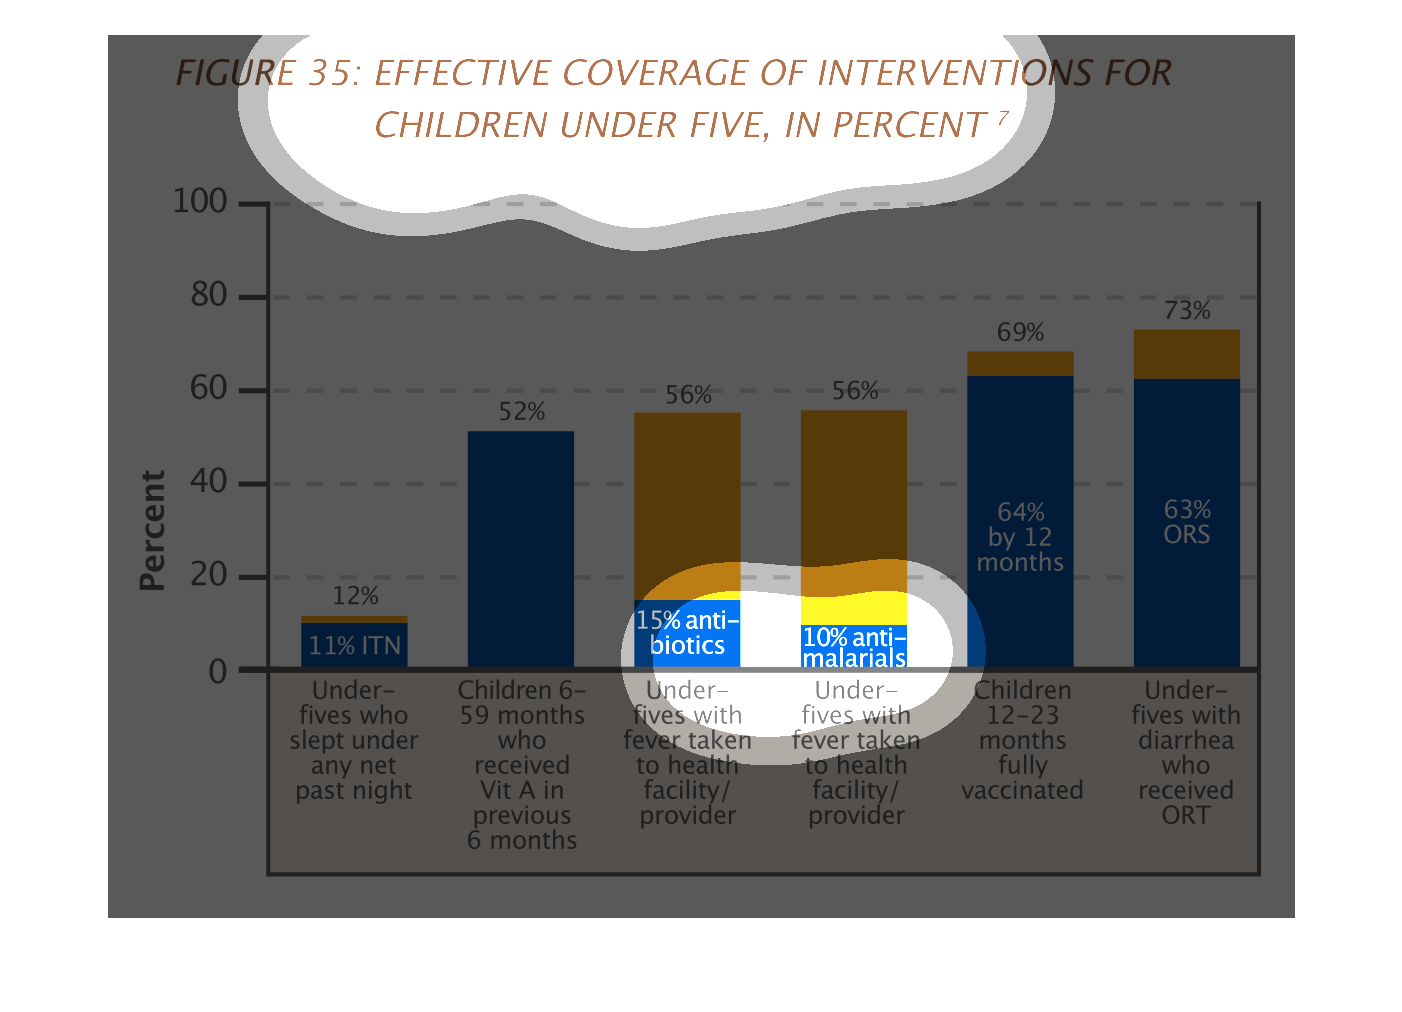
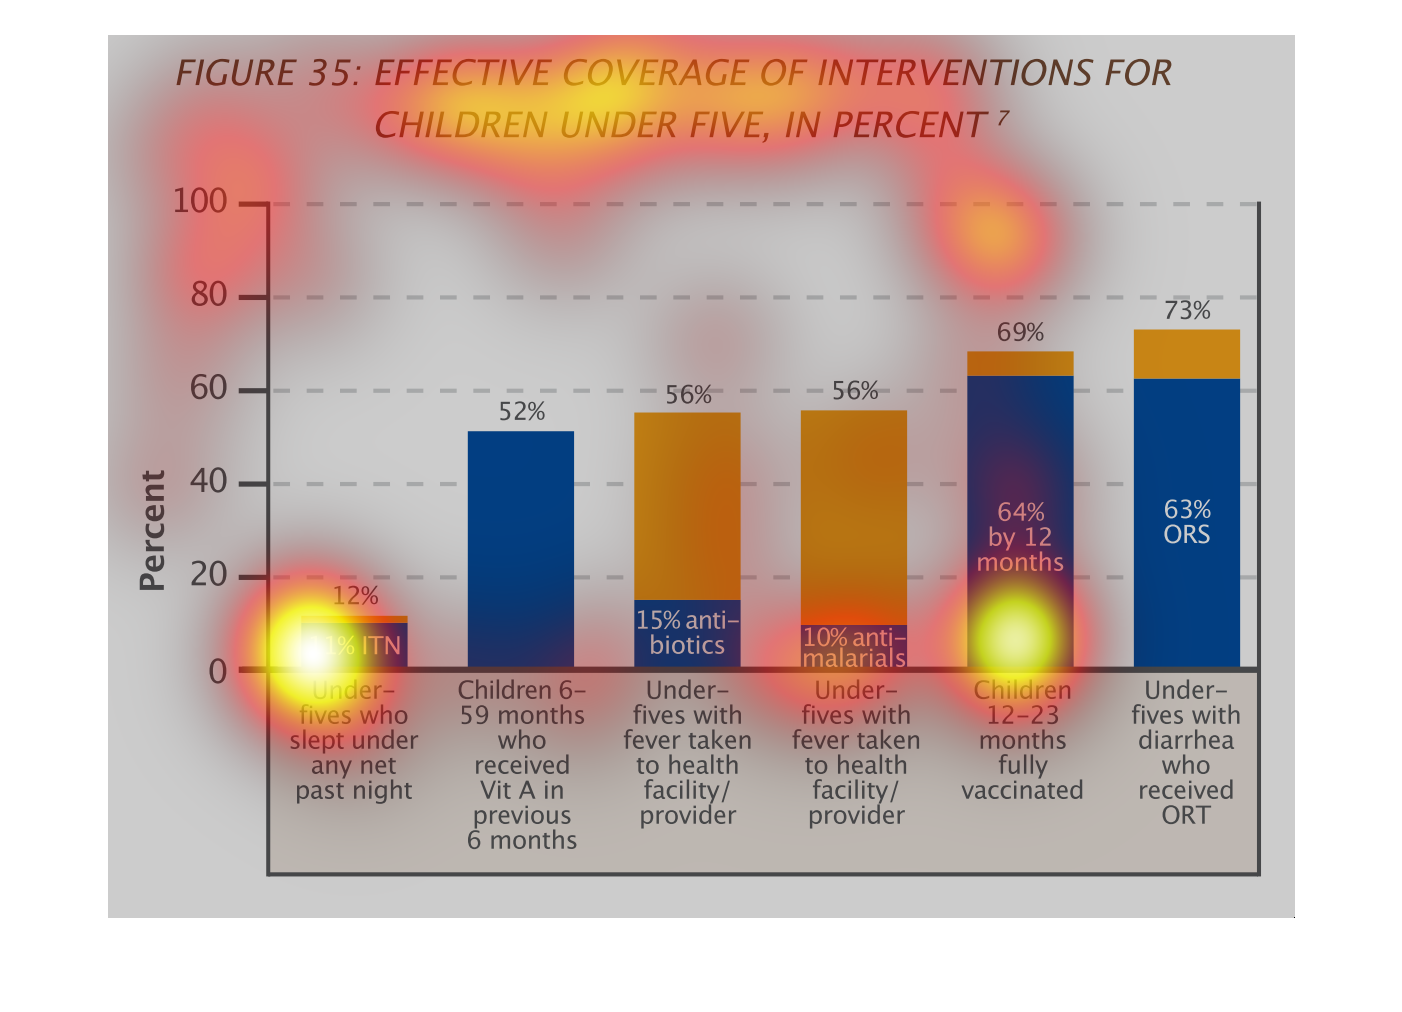
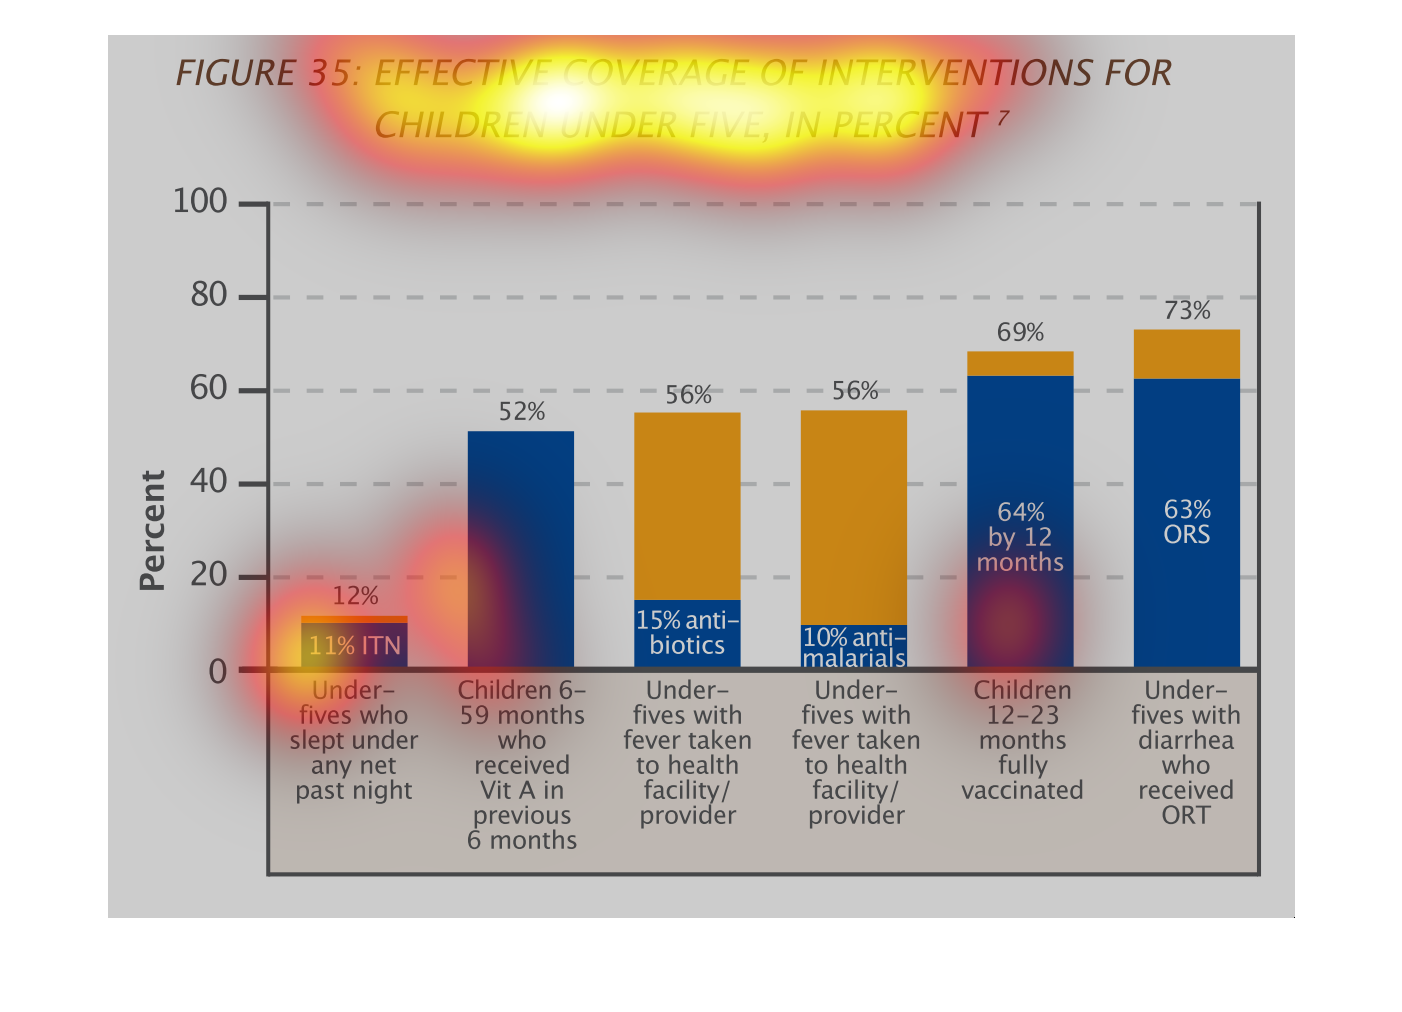
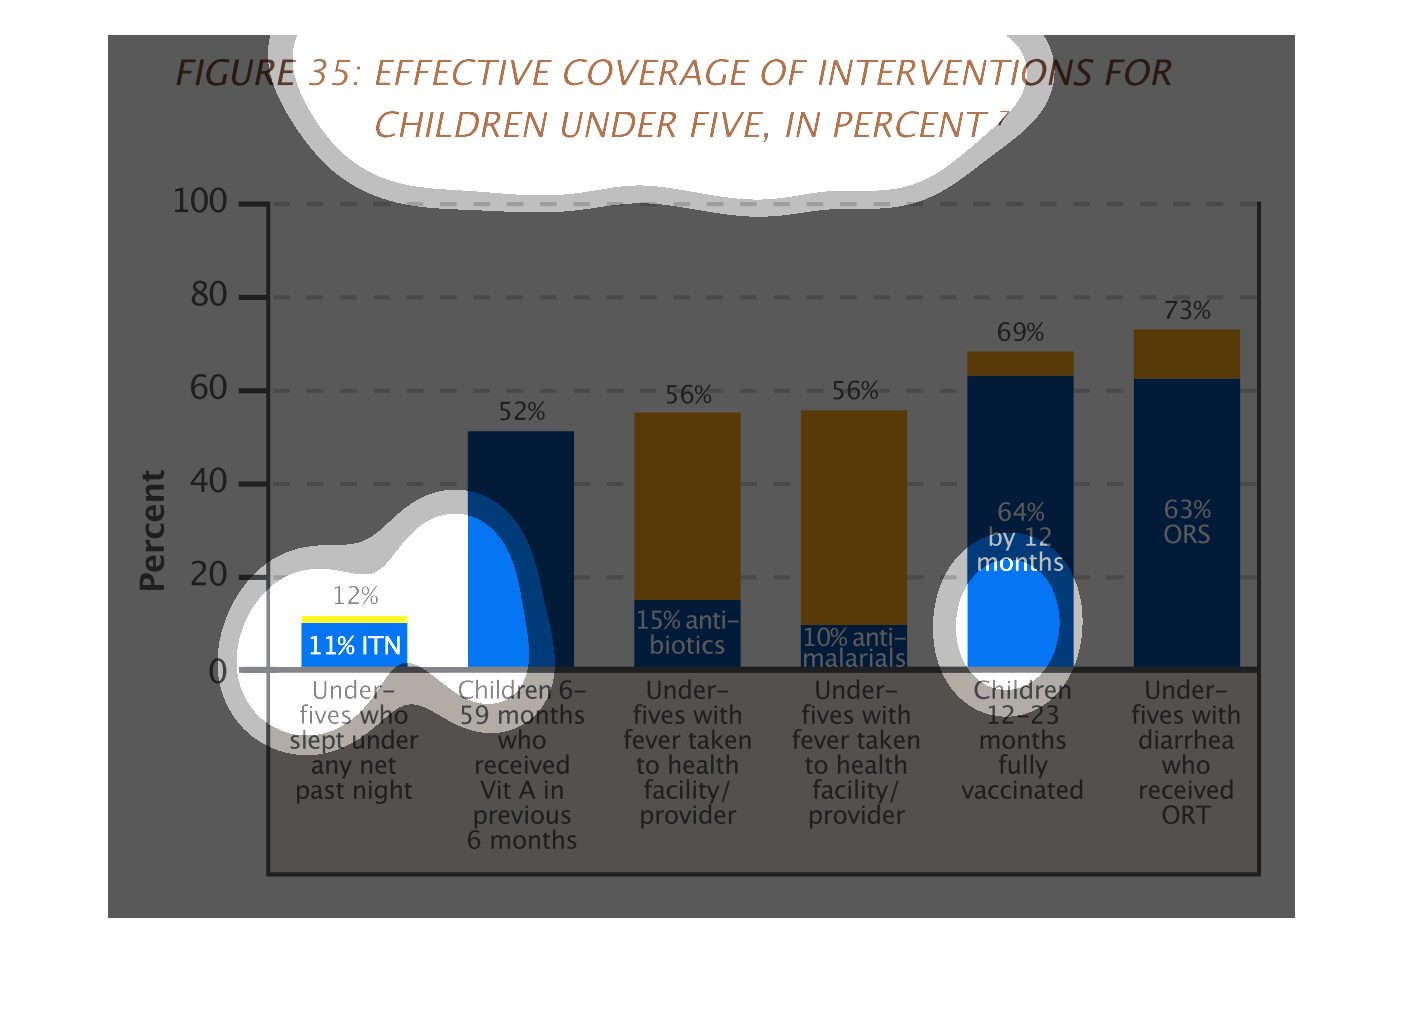
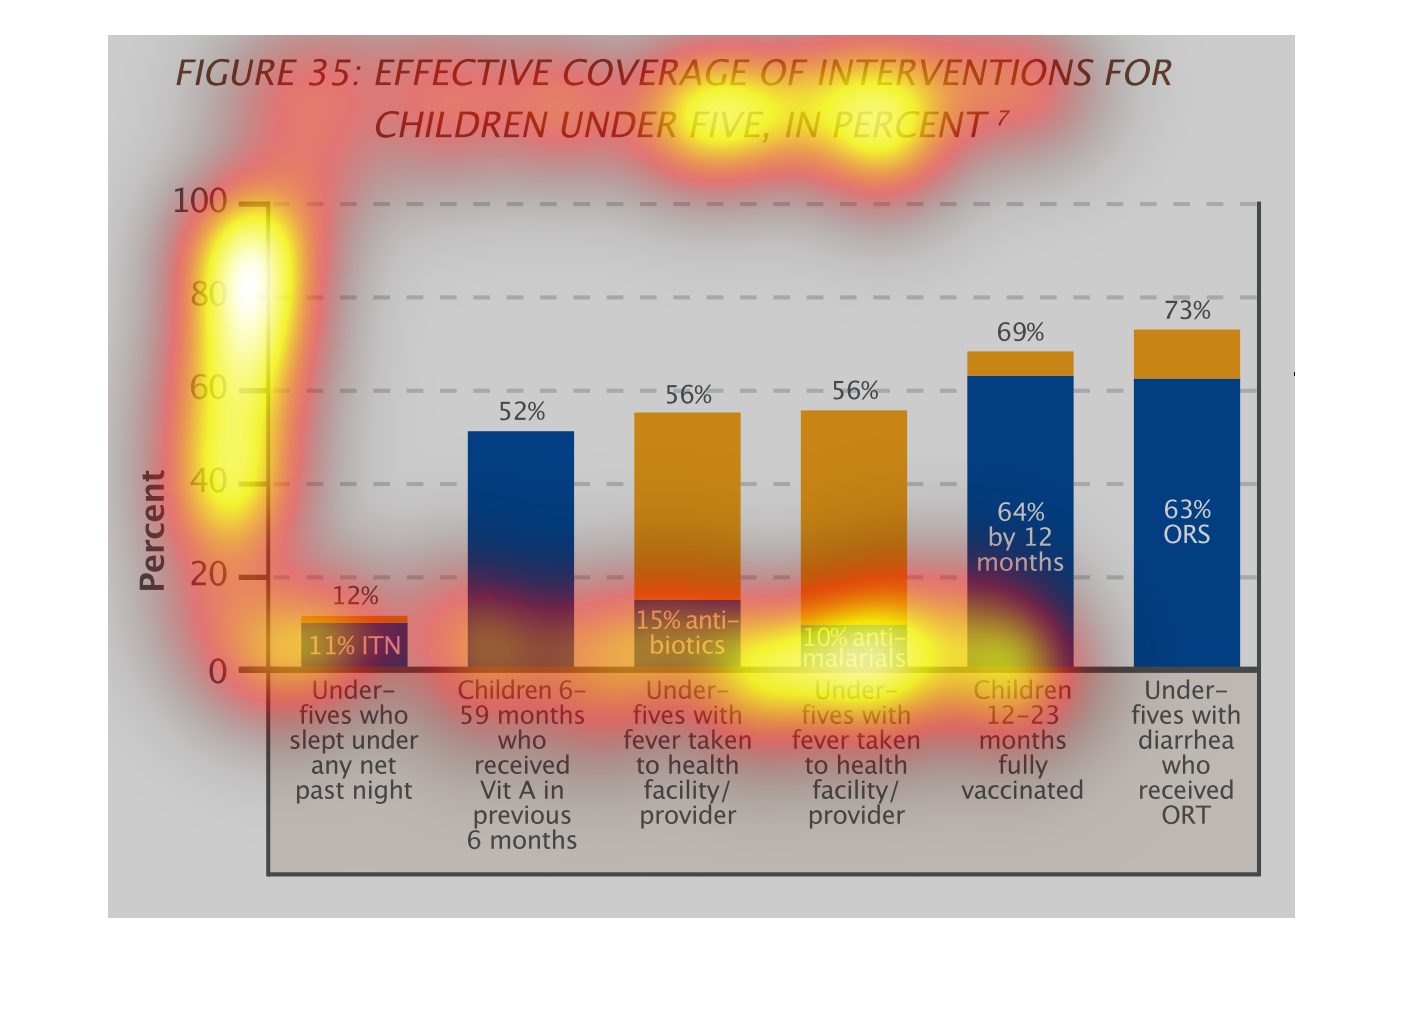
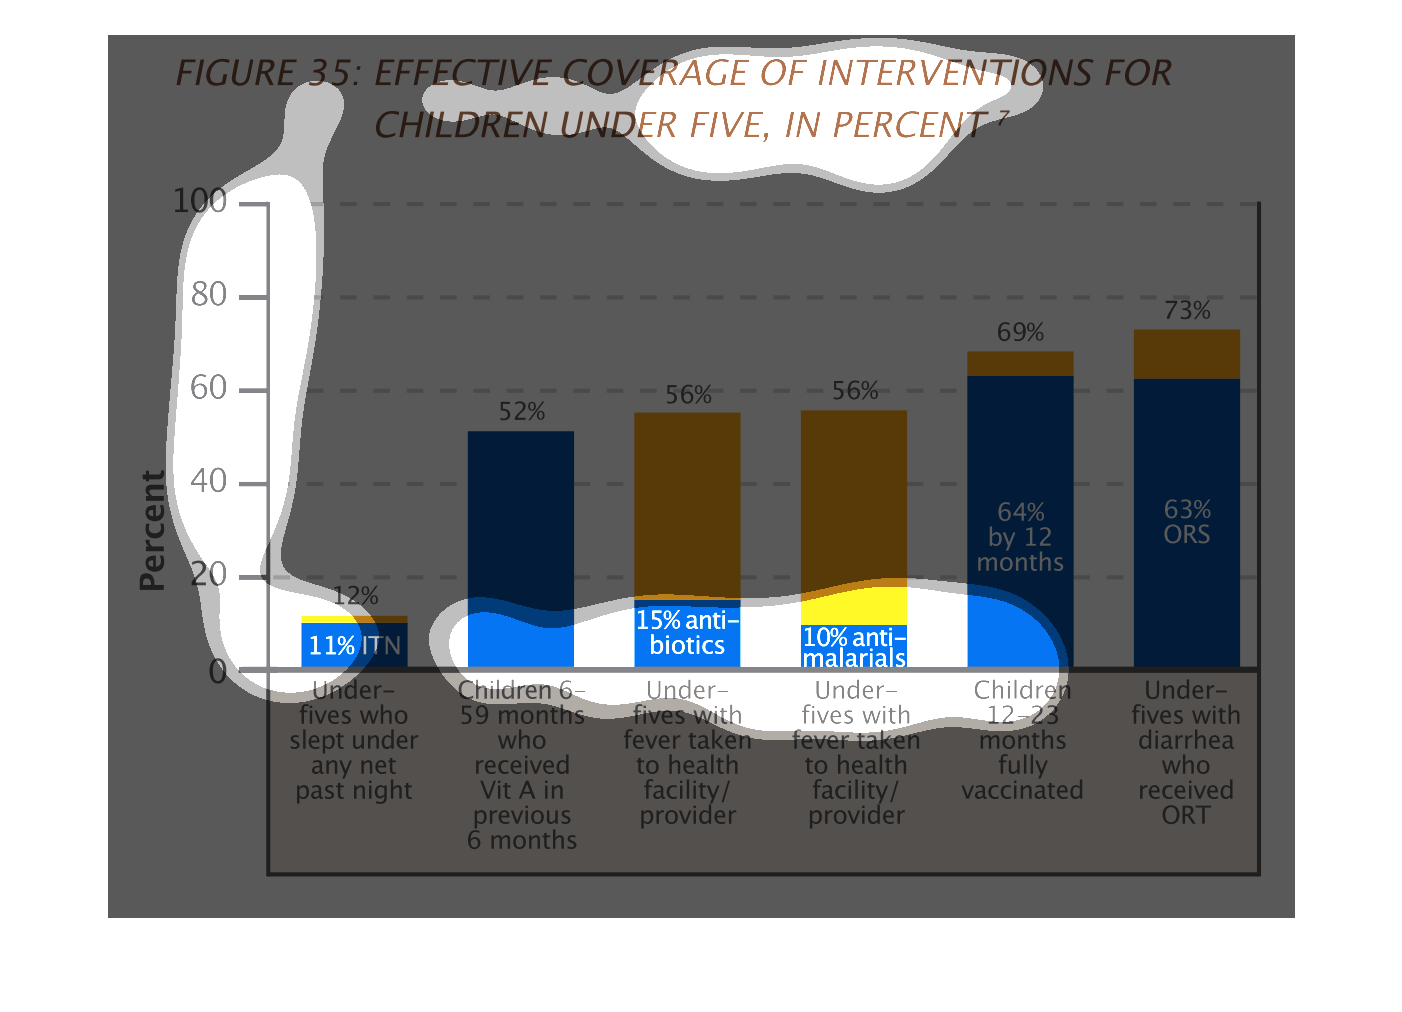
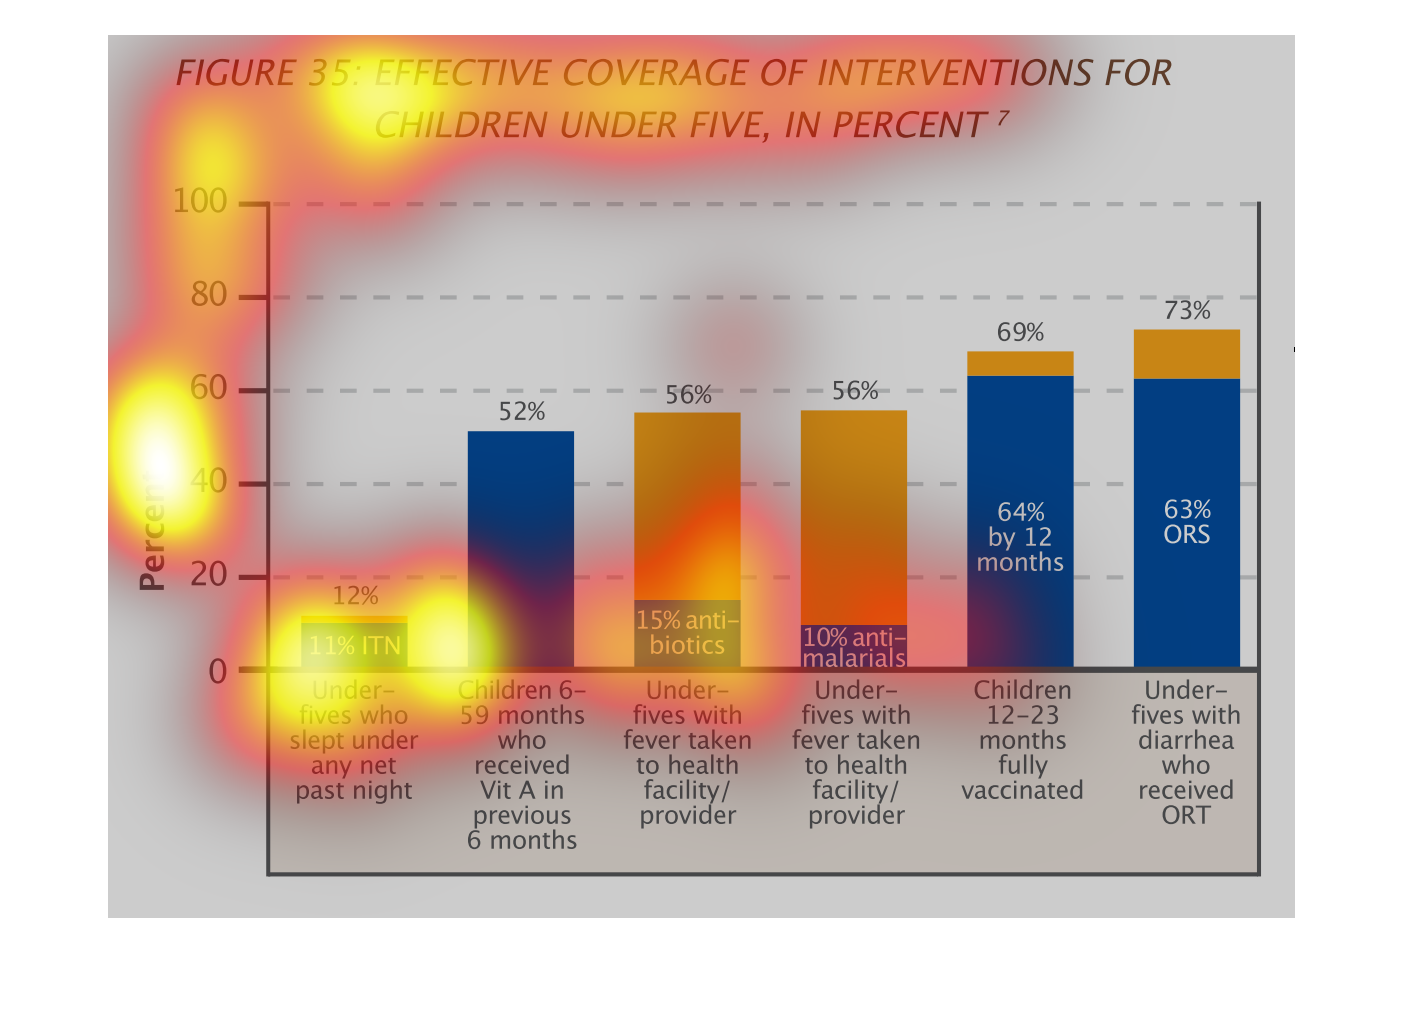
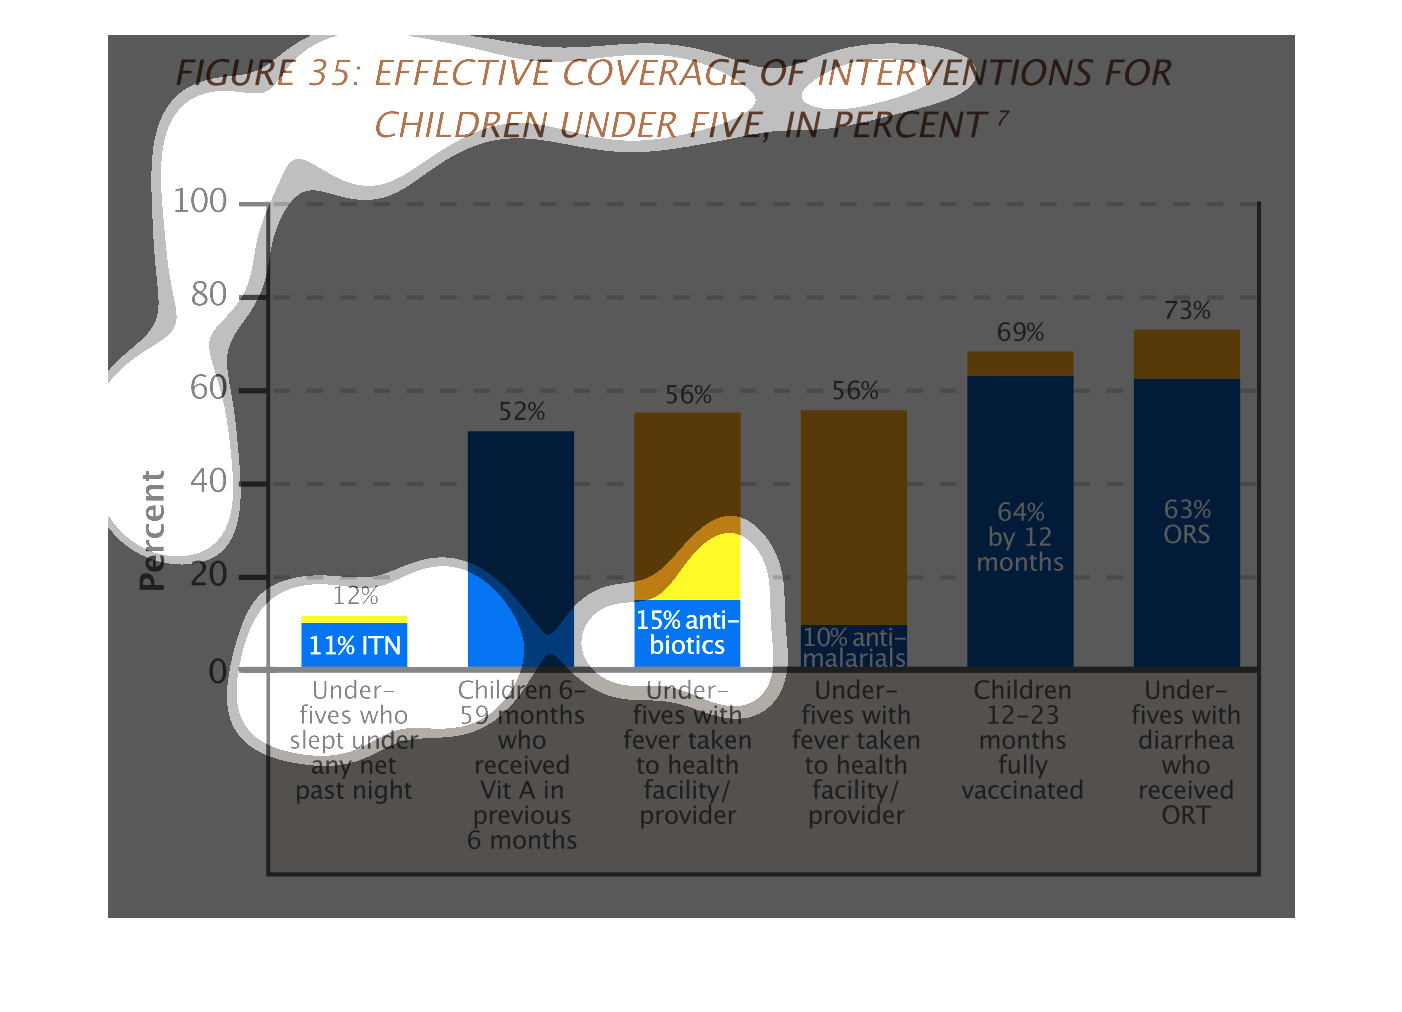
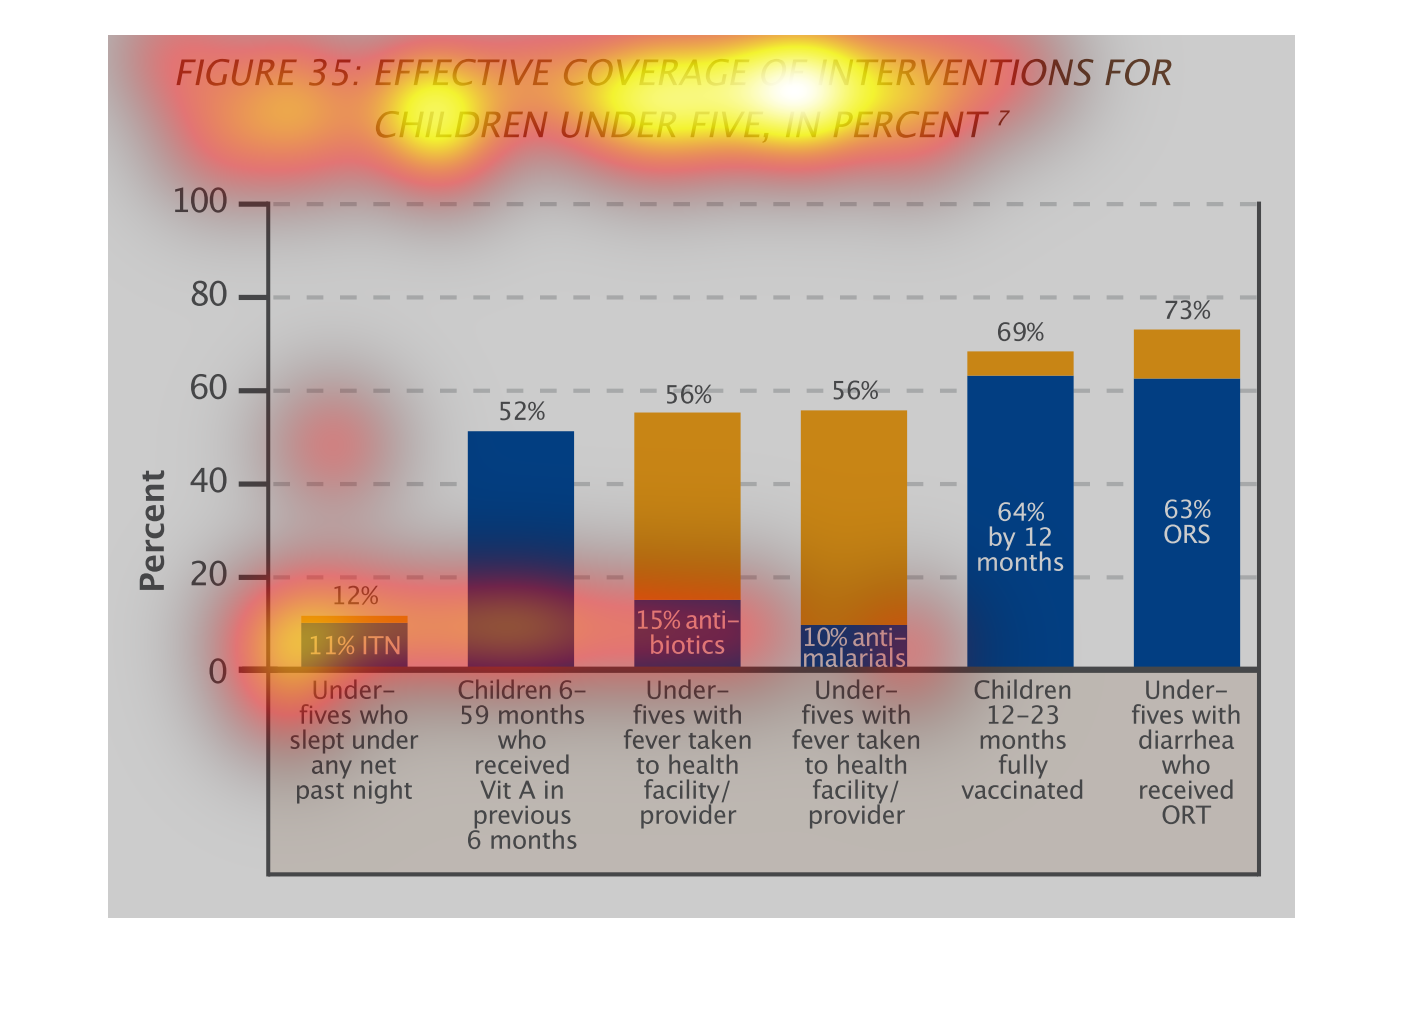
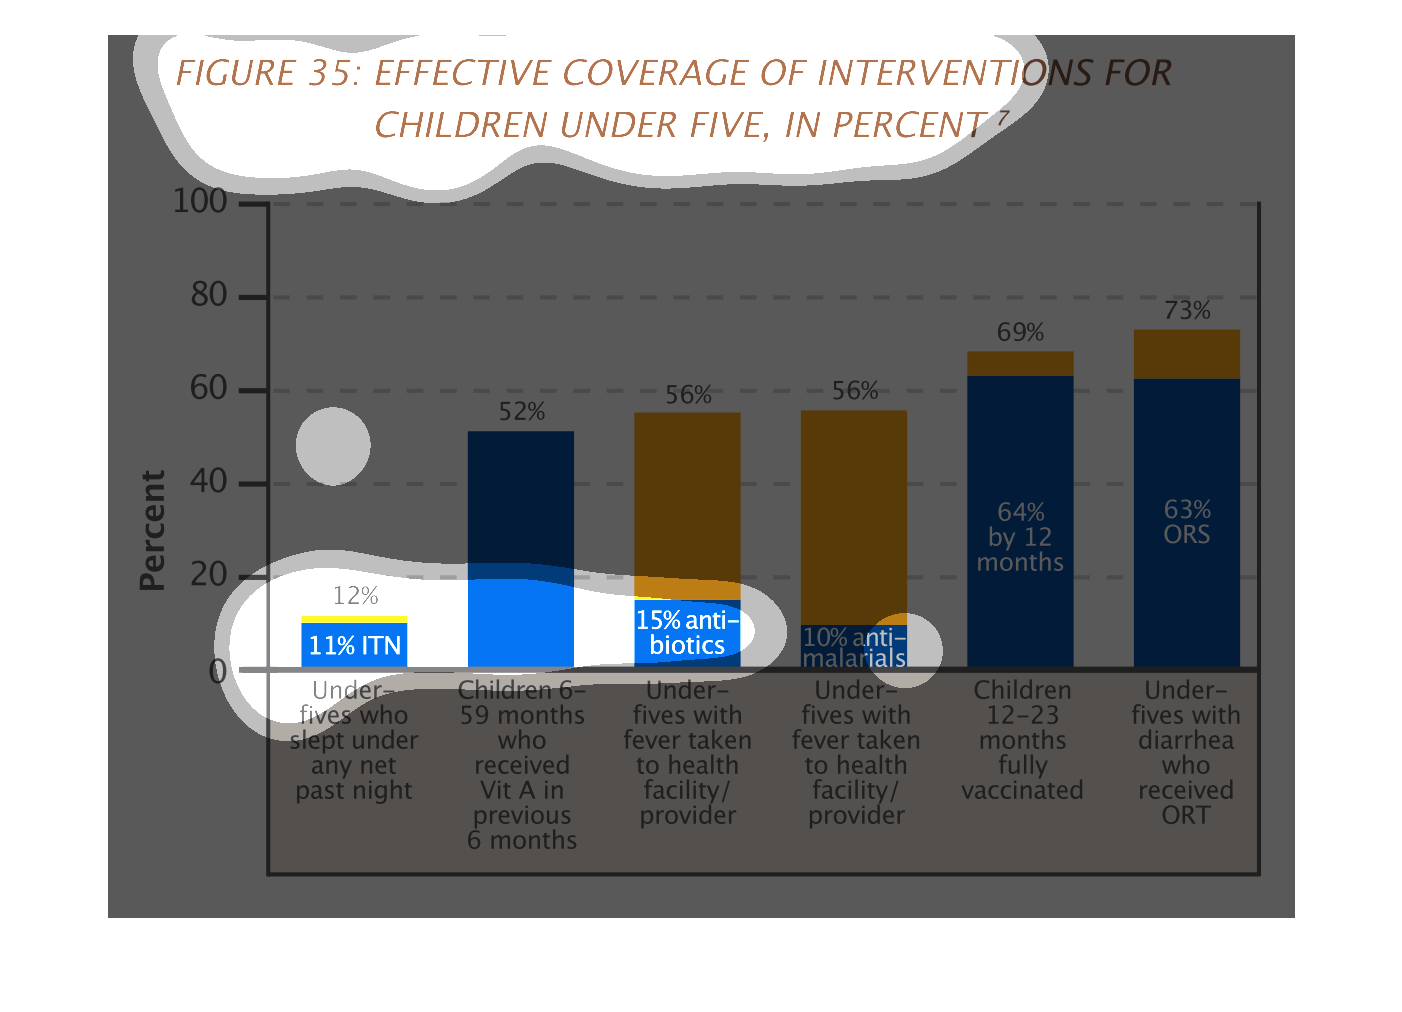
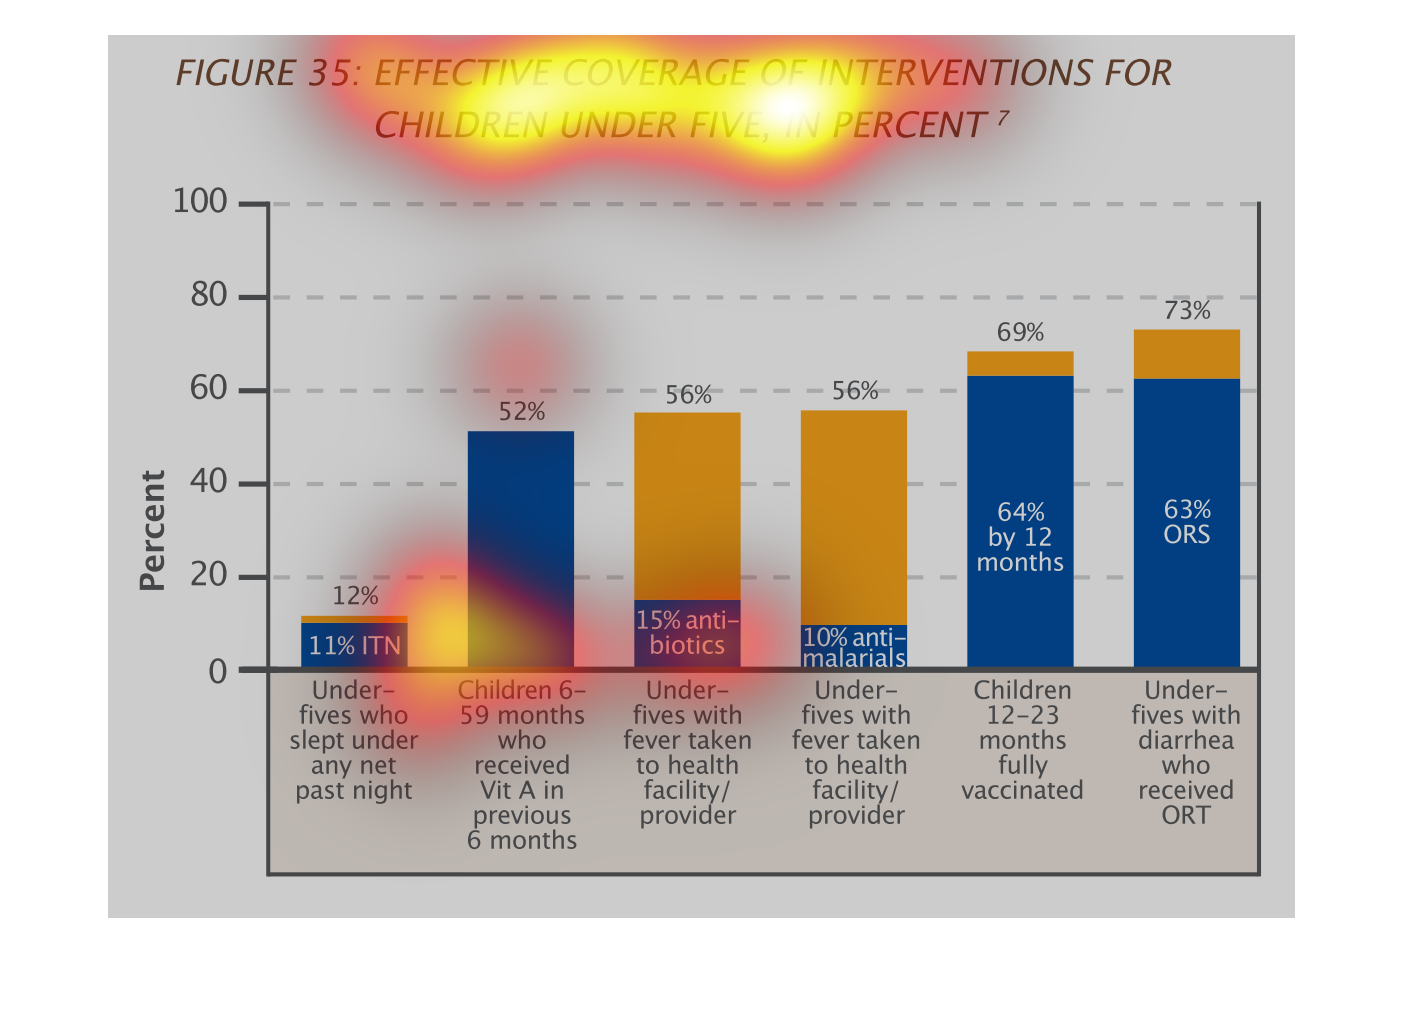
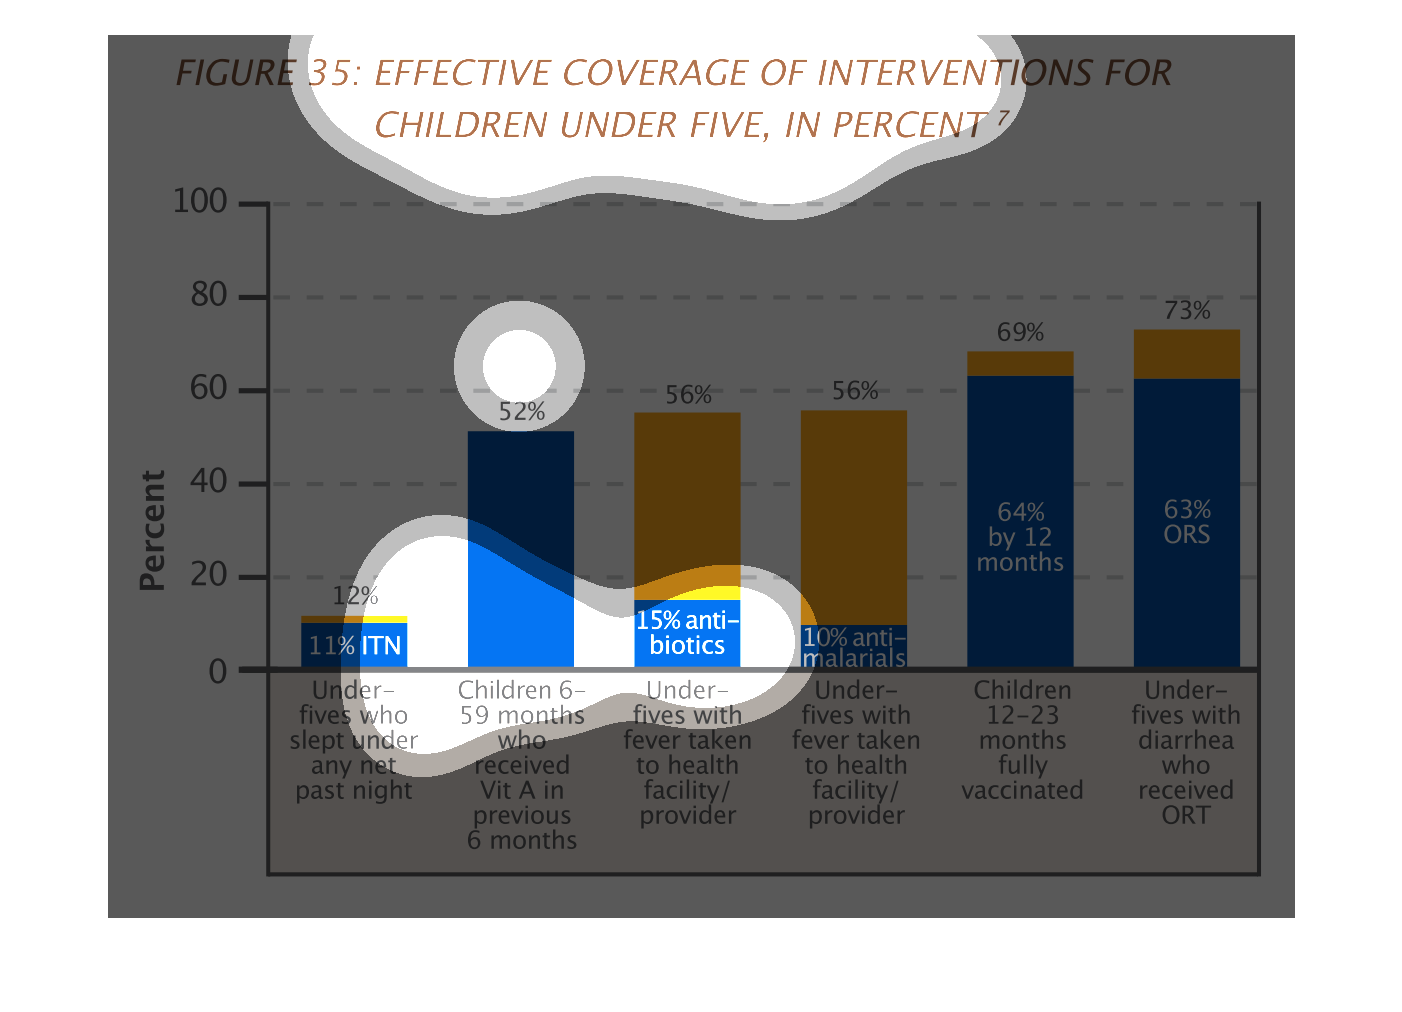
This graph evaluates effective coverage of interventions for children under five, in percent.
Under fives with diarrhea who received ORT has the biggest percentage of just under 73%

This chart describes effective coverage of interventions for children under five years of
age in percent. Categories include under-fives who slept under any net past night.
The chart describes what is he effective coverage for children under five. It has the percent
covered contrasted with conditions such as whether children have been vaccinated.
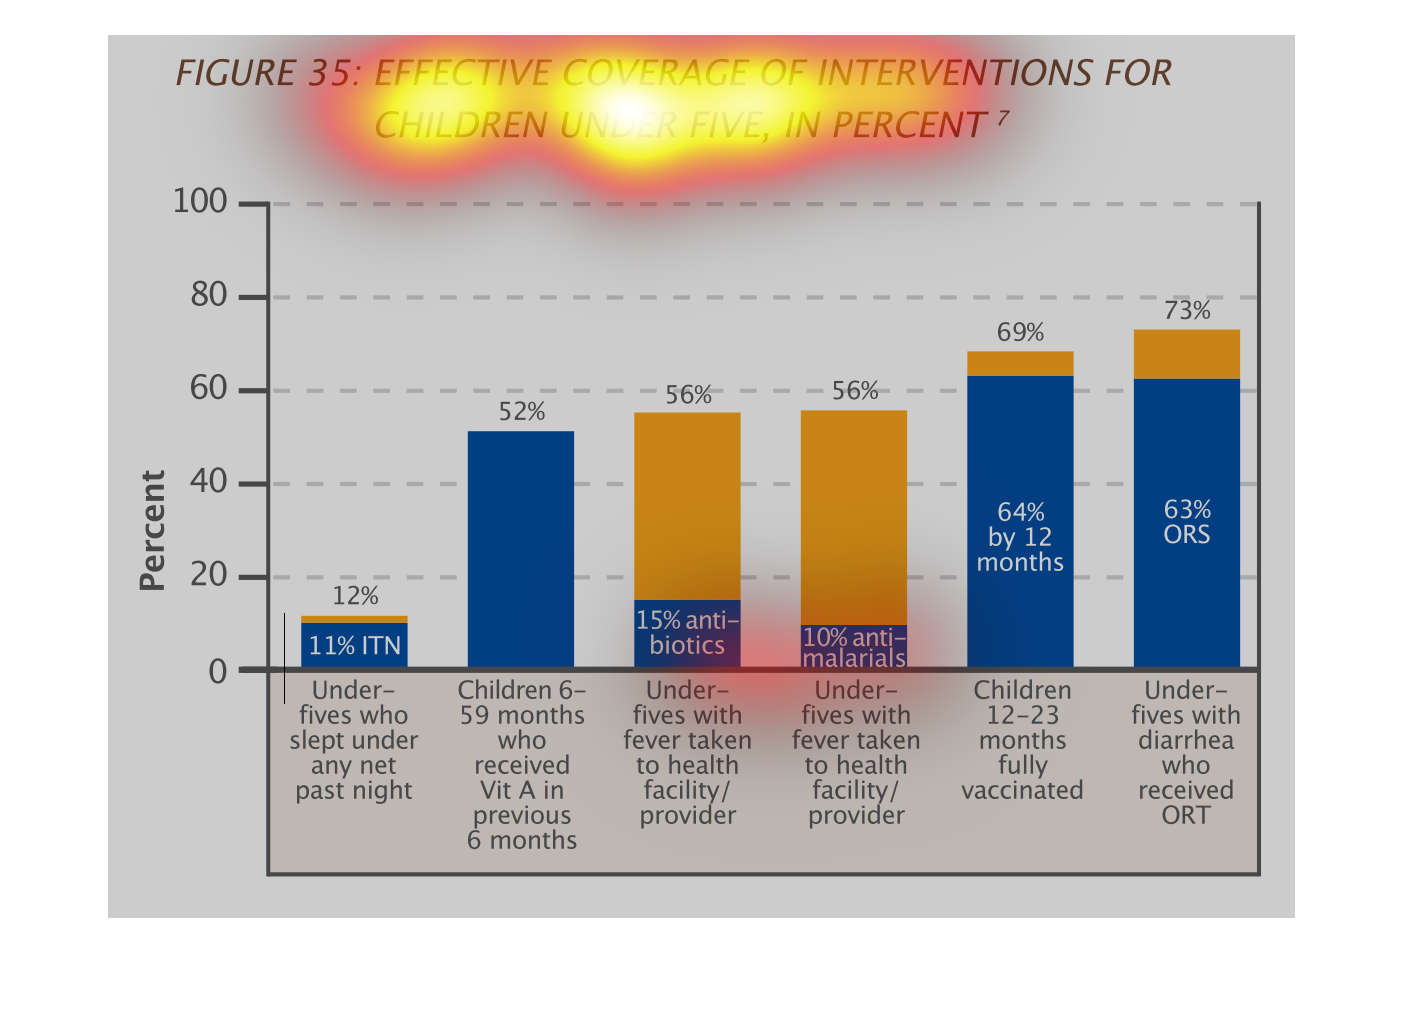
This is a graph of the effective coverage of interventions for children under 5 in percent.
 The highest percent were children that were fully vaccinated.
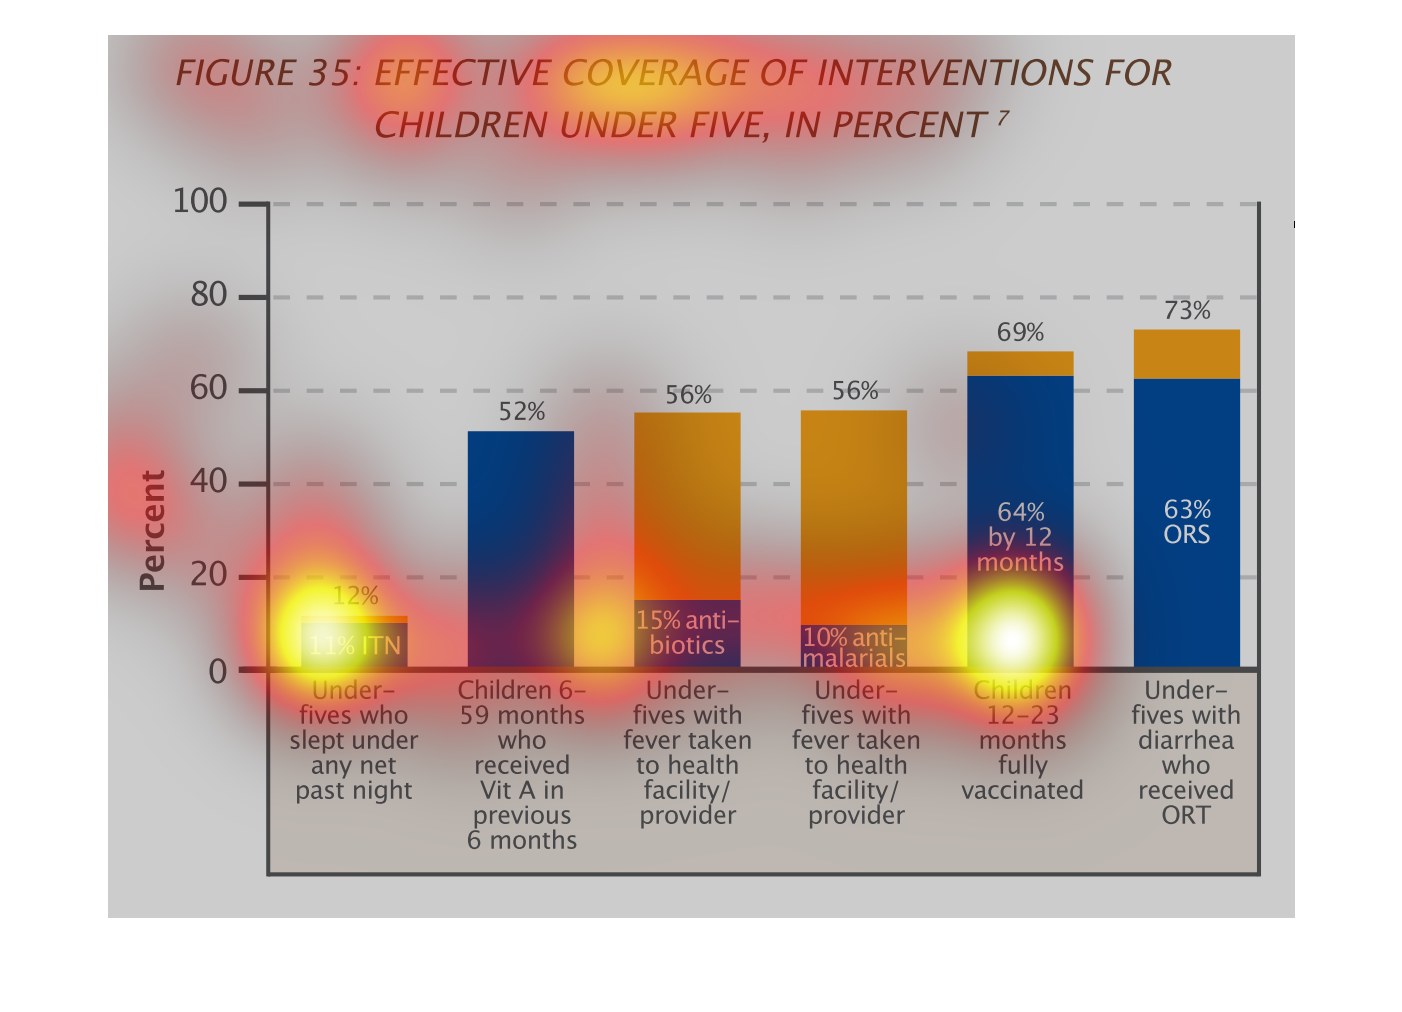
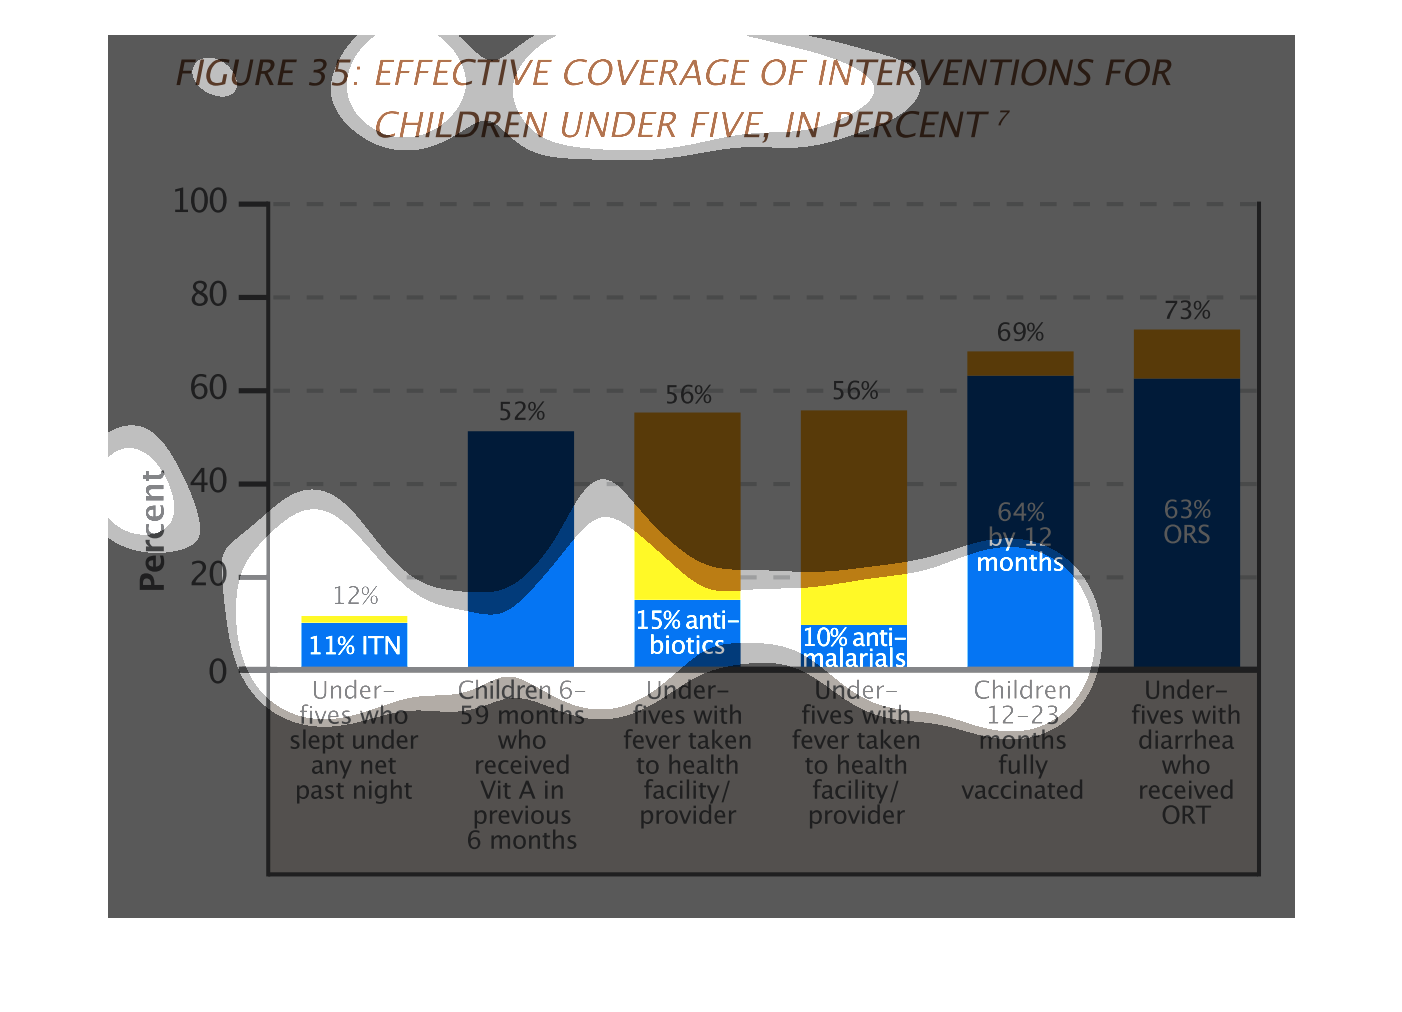
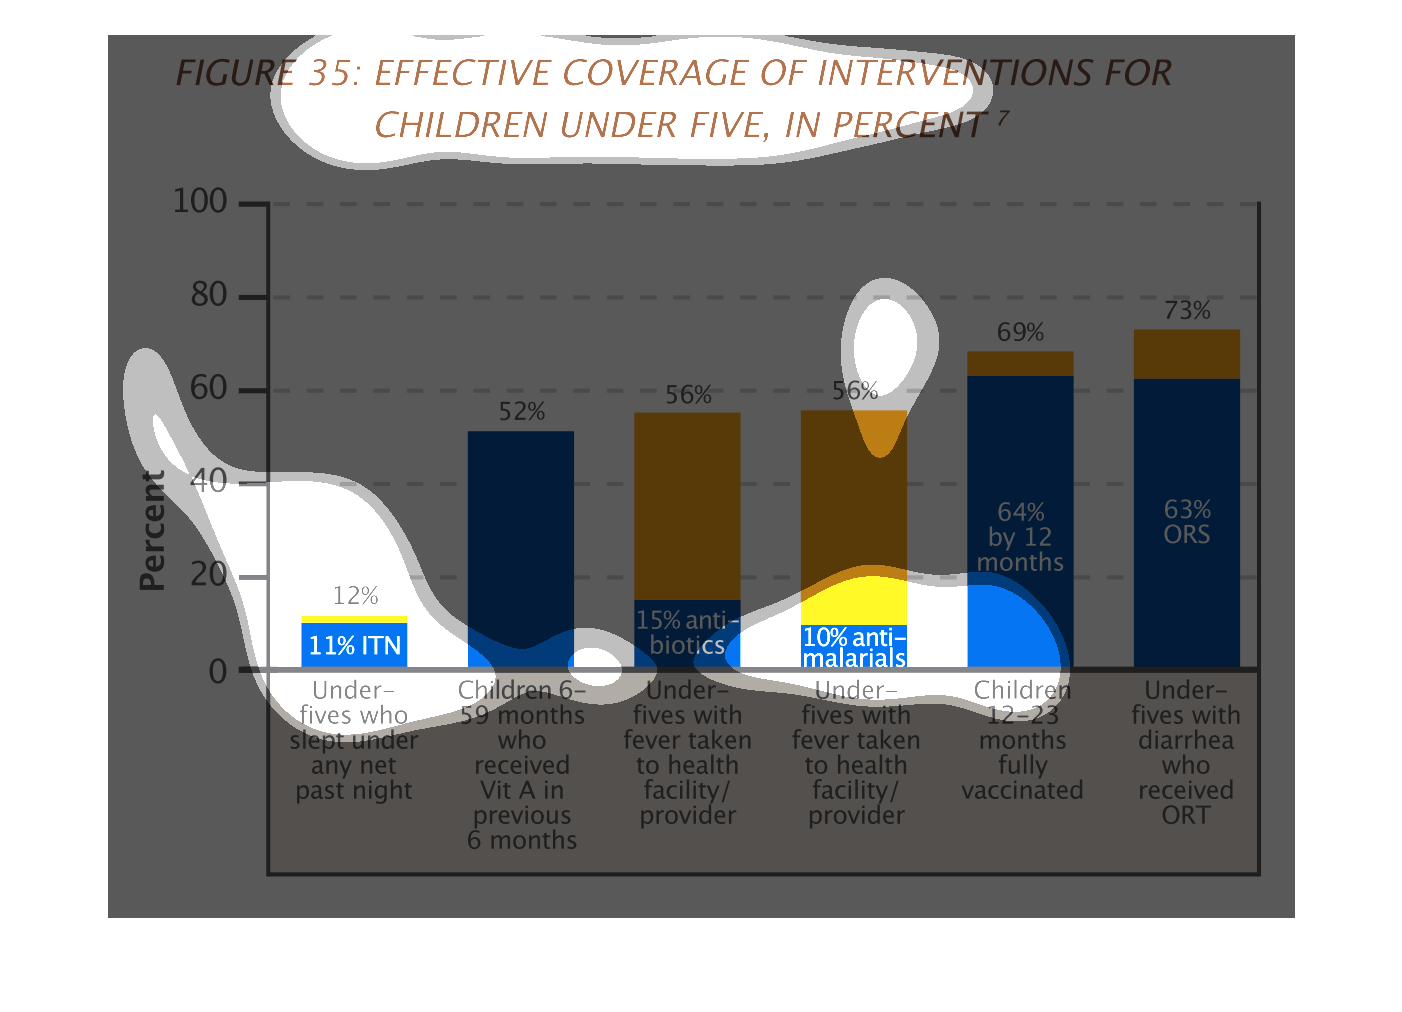
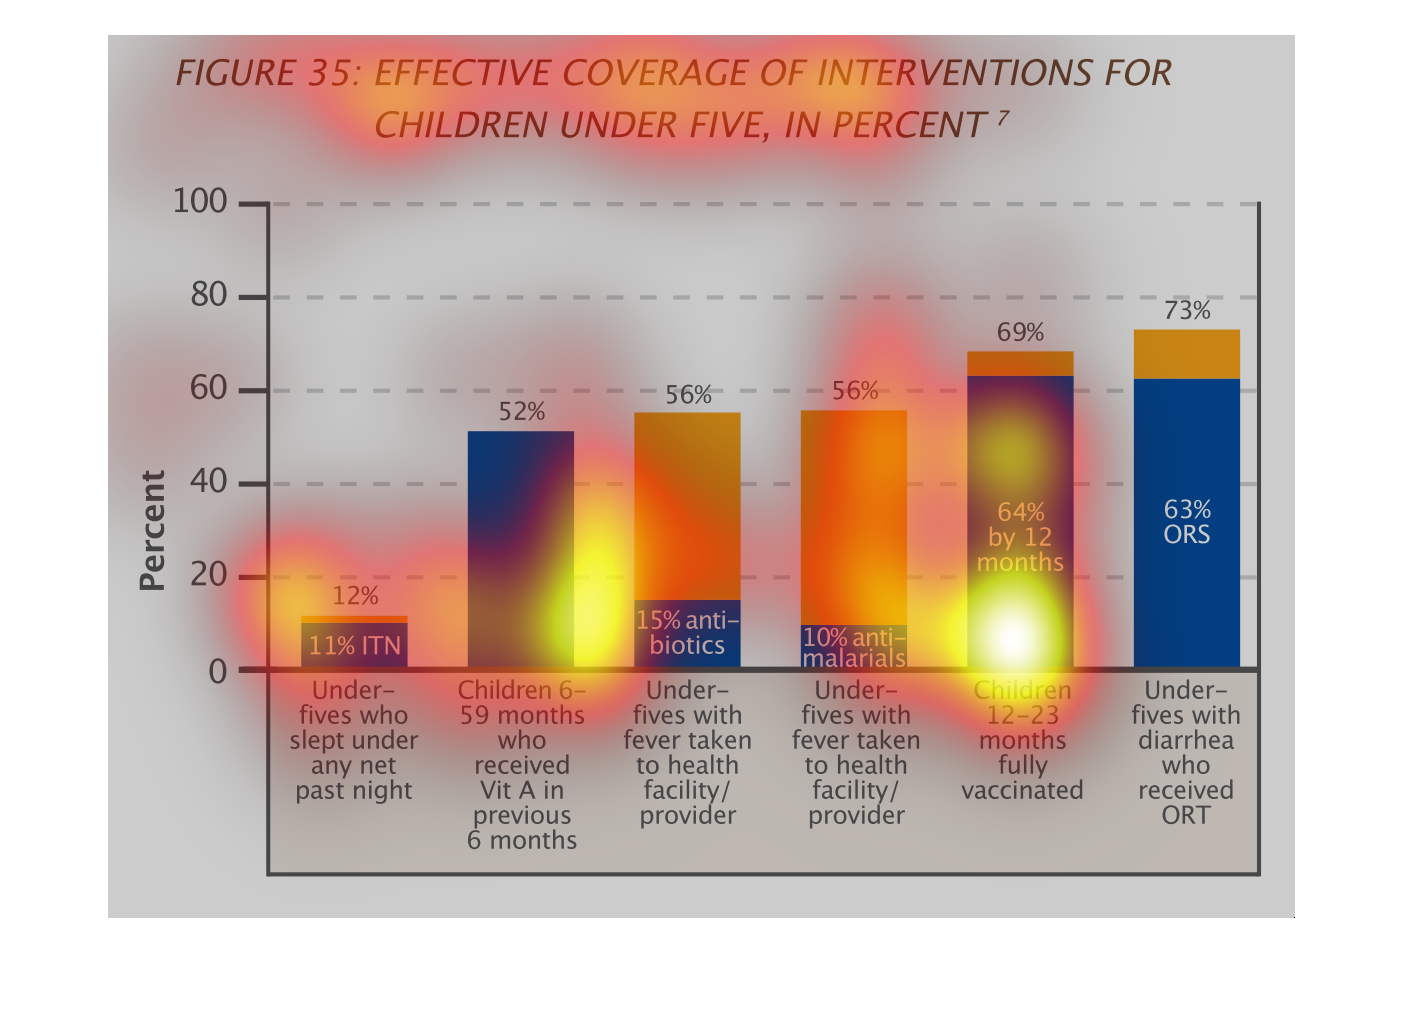
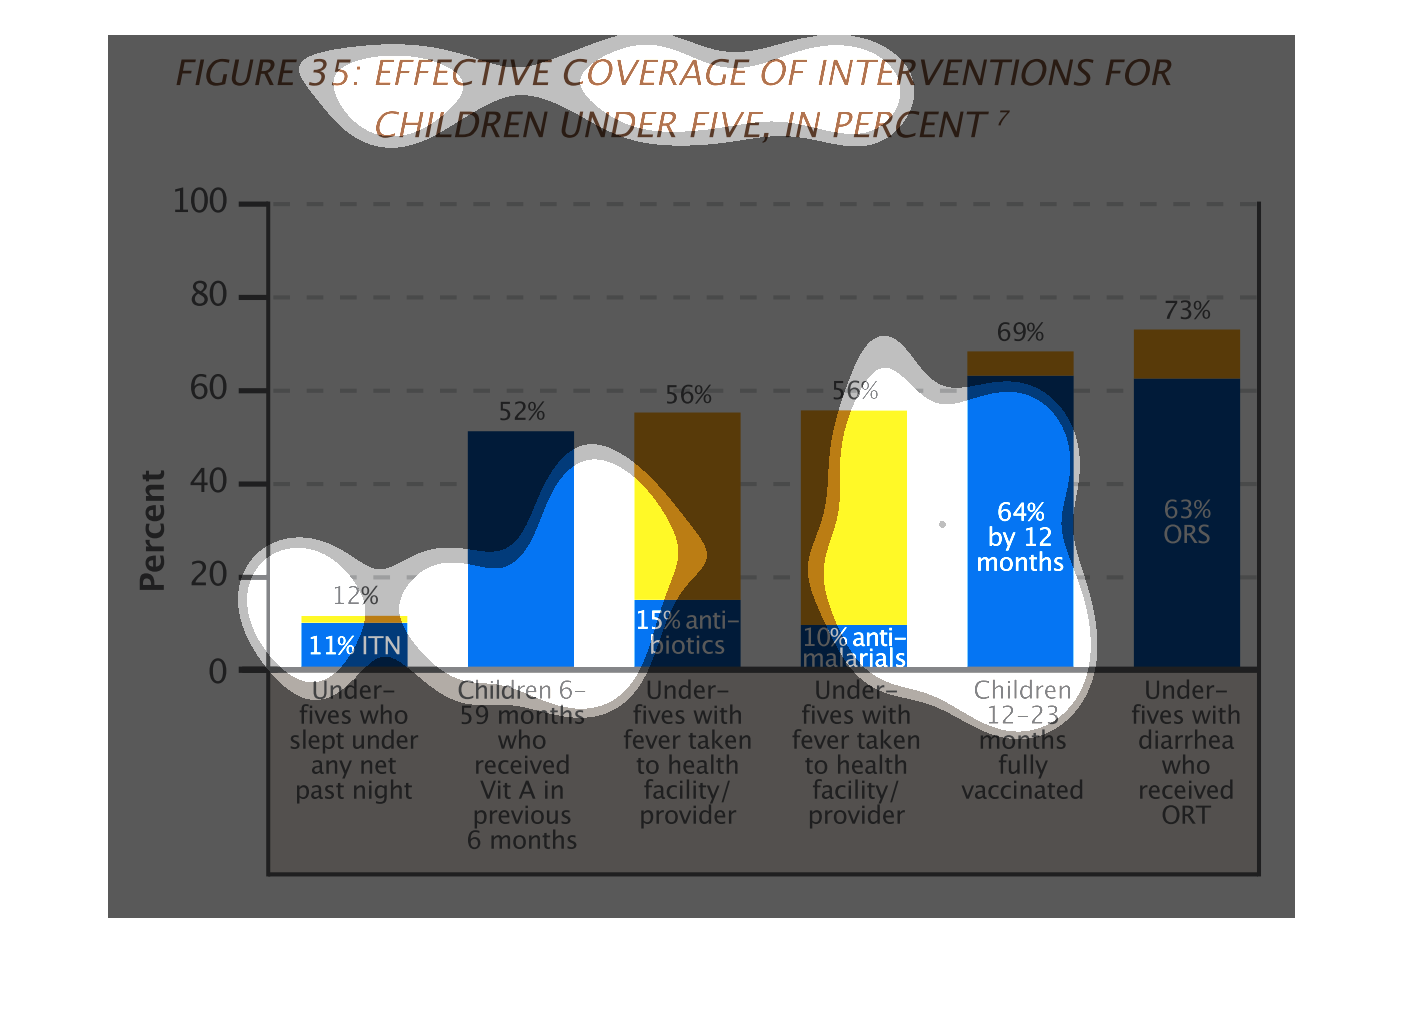
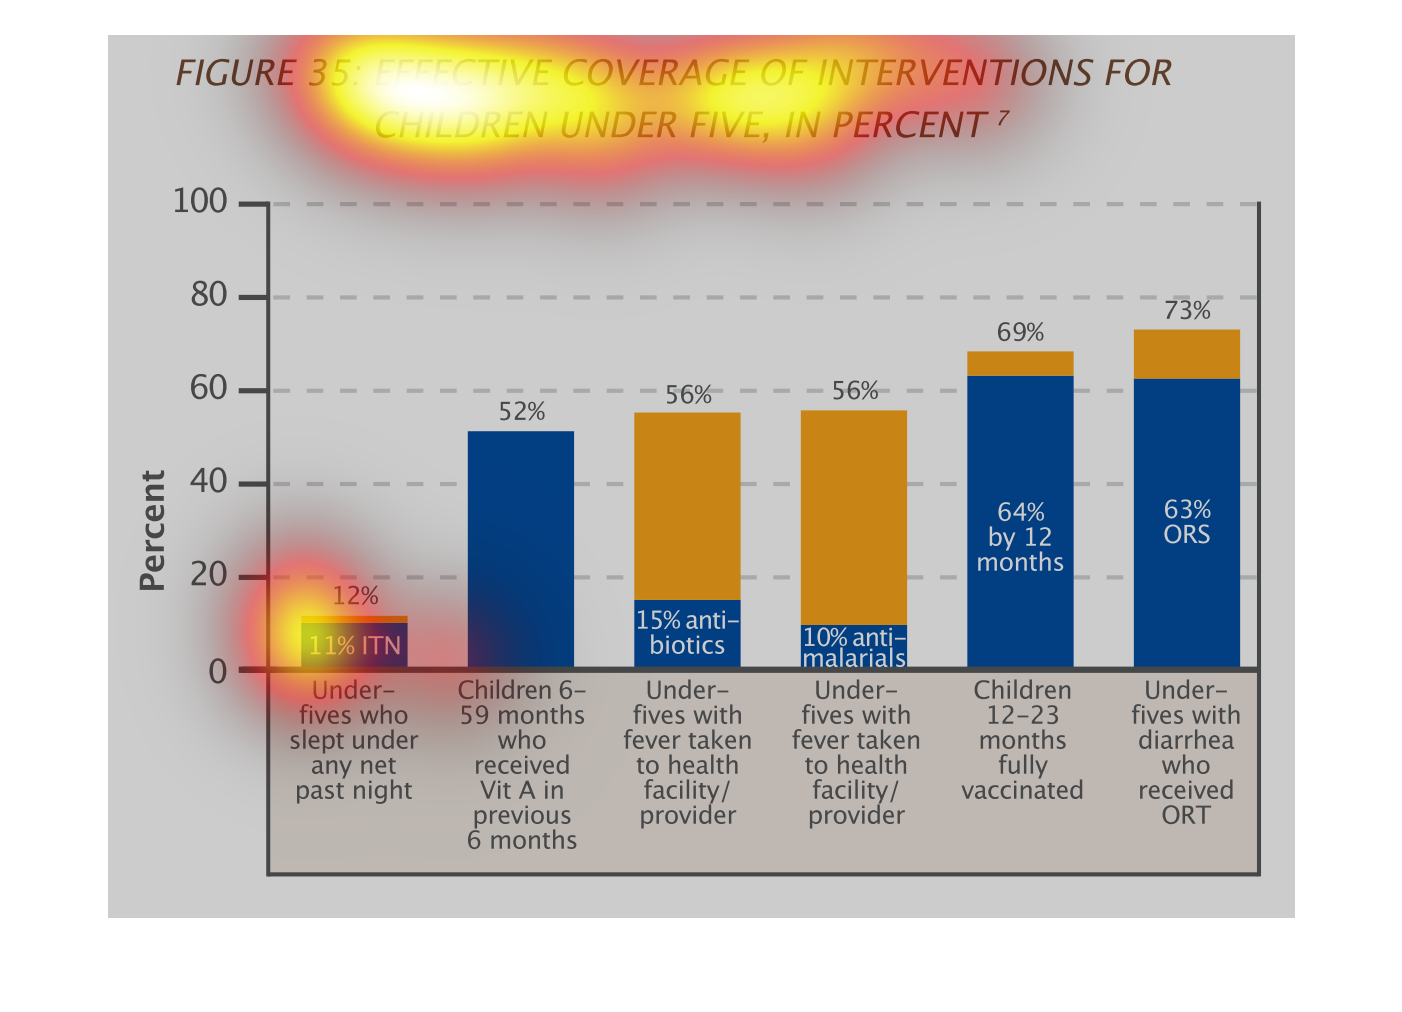
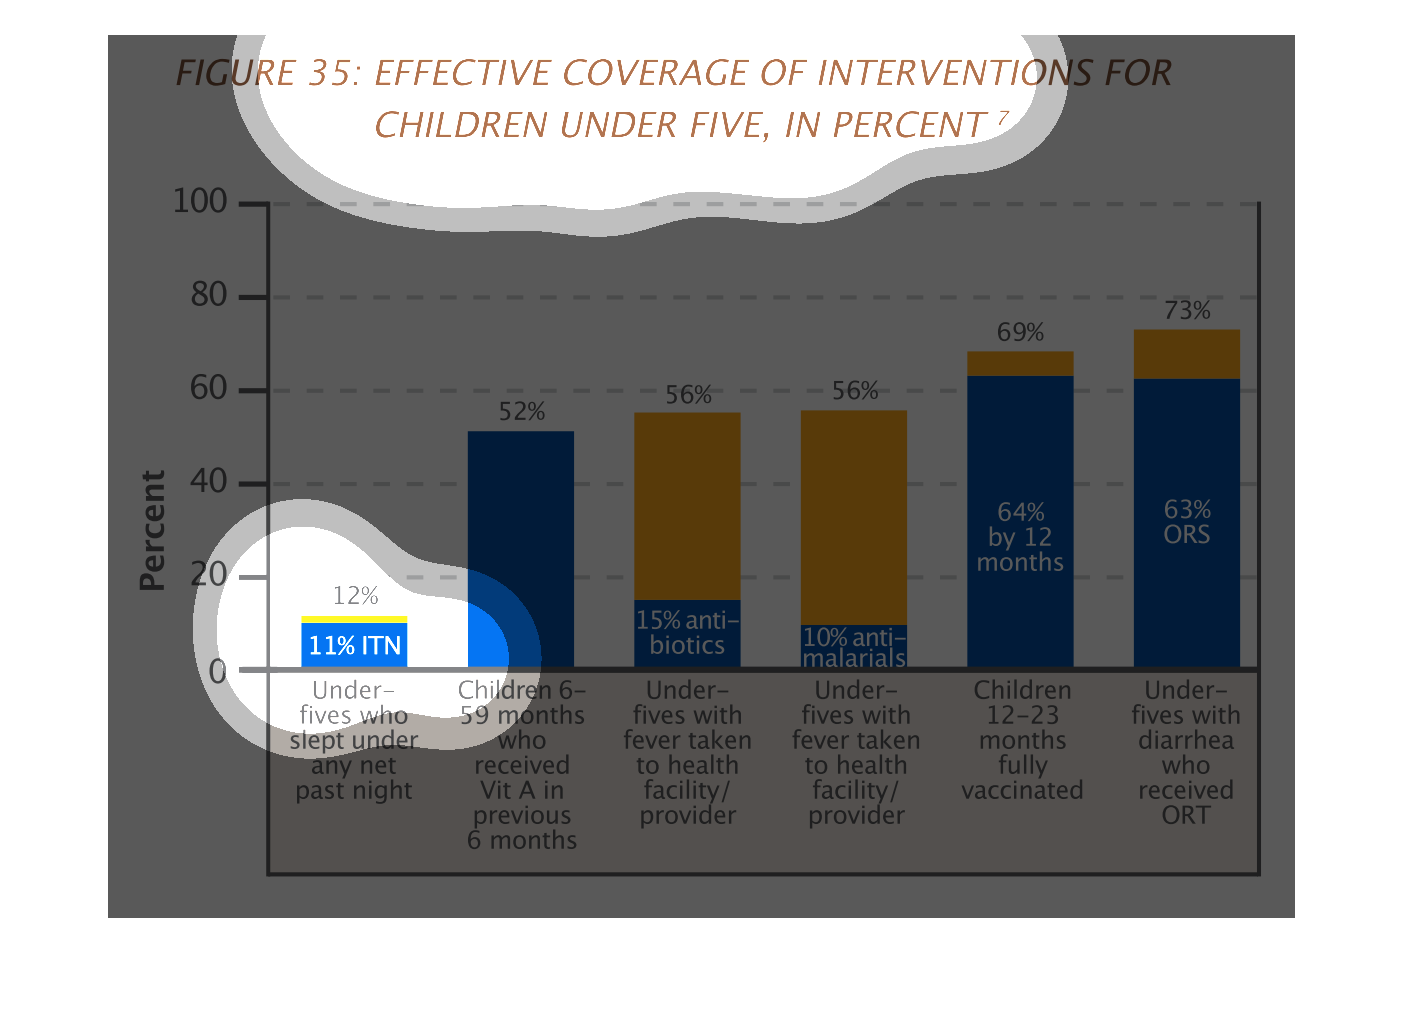
figure 35, effective coverage of interventions for children under five in percent. A graph,
the Y axis shows percentage 0 to 100, x axis features children of different qualifying age
groups and different health situations that impact infection rates
This is a graph that shows the effective coverage of interventions for children under five
years with respect to vaccinations and diseases that these children are susceptible to.
Effective coverage of interventions for children under five, in percent, It gives the percentages
of children under 5 who are fully vaccinated, taken to the hospital when they have a certain
condition. Or who receive medical treatment when they have an ailment.
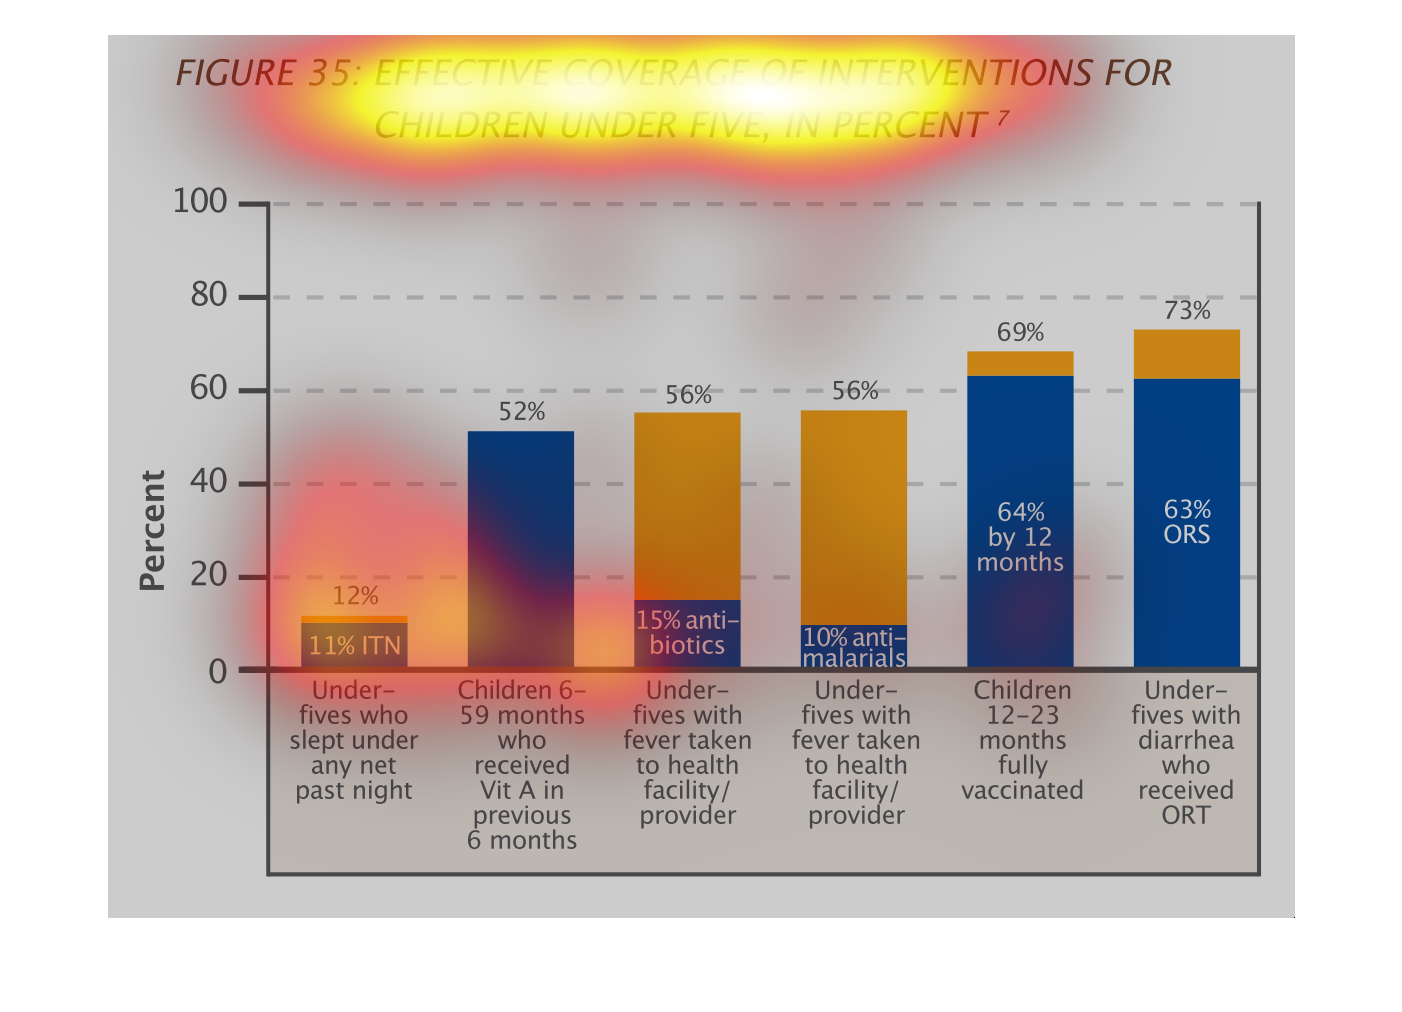
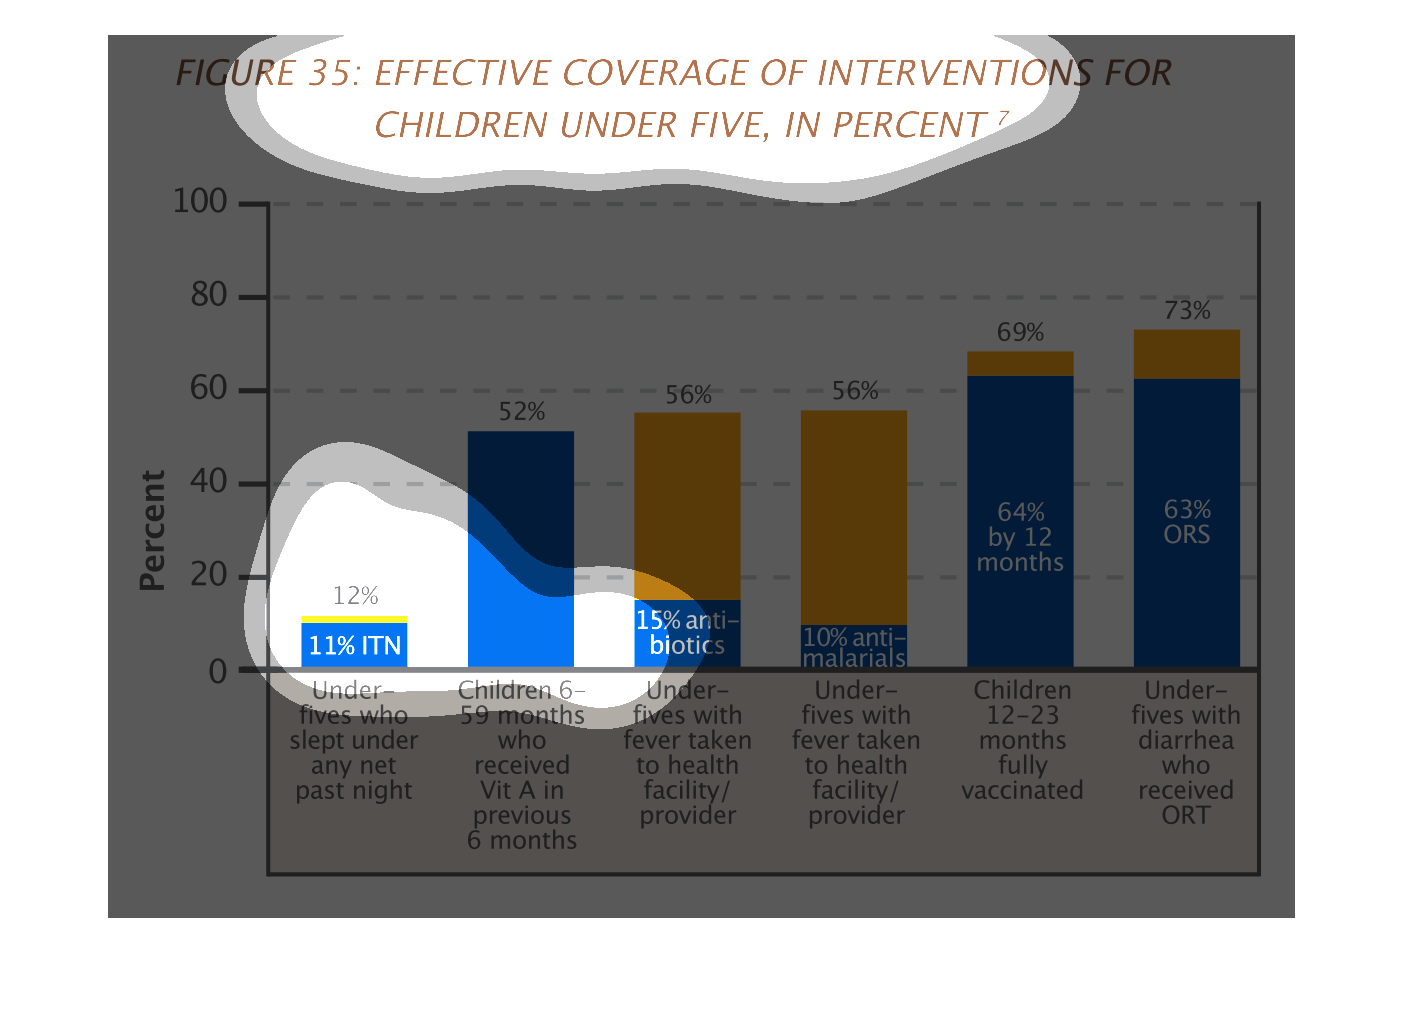
This graph shows effective coverage of medical interventions for children under the age of
5 in percent. It shows that 64% of children are fully vaccinated by 12 months of age, and
63% of children with diarrhea received ORS. Only 15% of children taken to health care facility
with fever were prescribed antibiotics.
This chart describes effective coverage of interventions for children under five, in percent.
Categories on the chart include under fives who slept under any net past night.
The image of the graph seems to deal with children whom are under the age of five and their
readily available access to healthcare facilities and provides.
This chart describes effective interventions of children sick with bug-related diseases under
5. The highest percentage intervention being children under 5 receiving ORT, and those being
vaccinated withing 12-23 months.