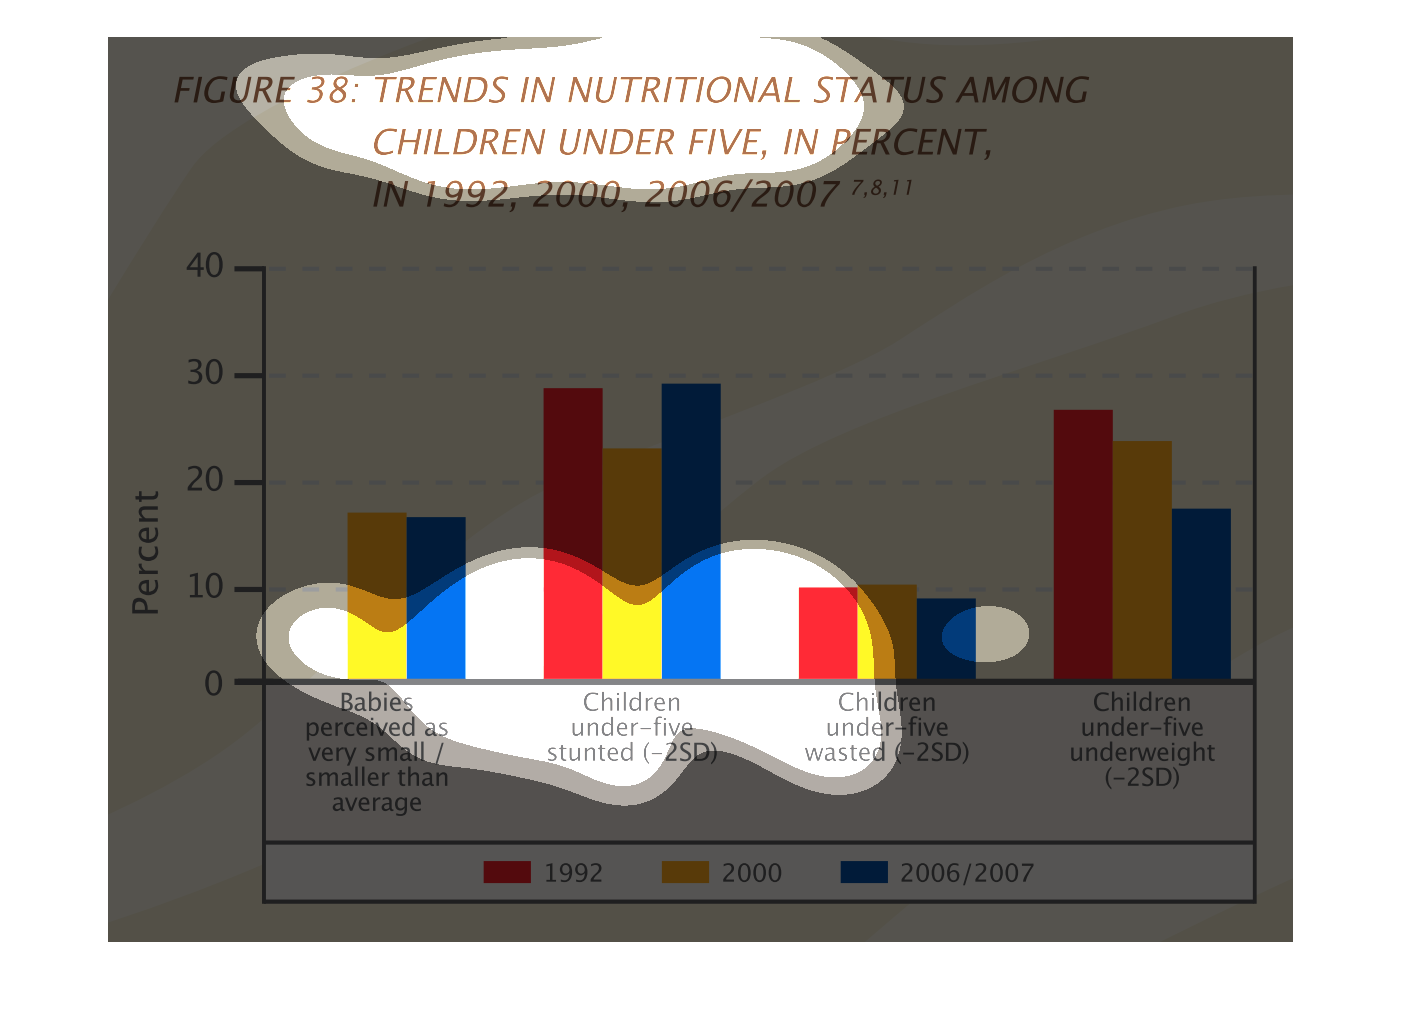
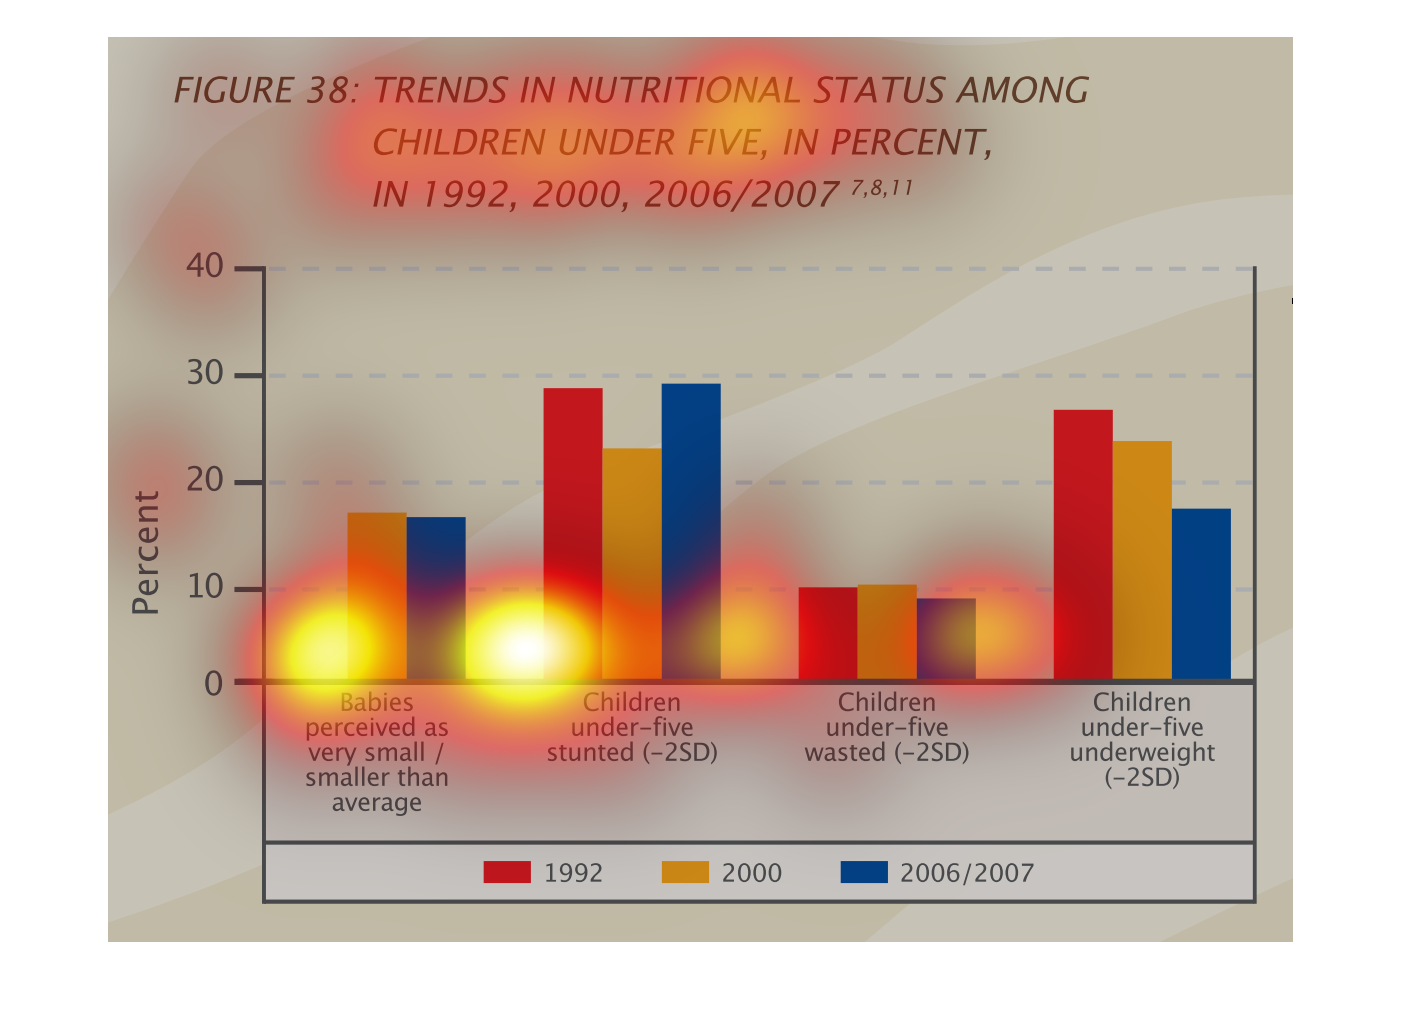
The image on the left hand side shows three different years over a roughly two decade period.
 It is represented in a column chart showing the nutrition rates for individuals less than
five years of age.  Over the two decade period from the data collected the most significant
drop has been in the under-nutrition rate over the past years since the study first began.
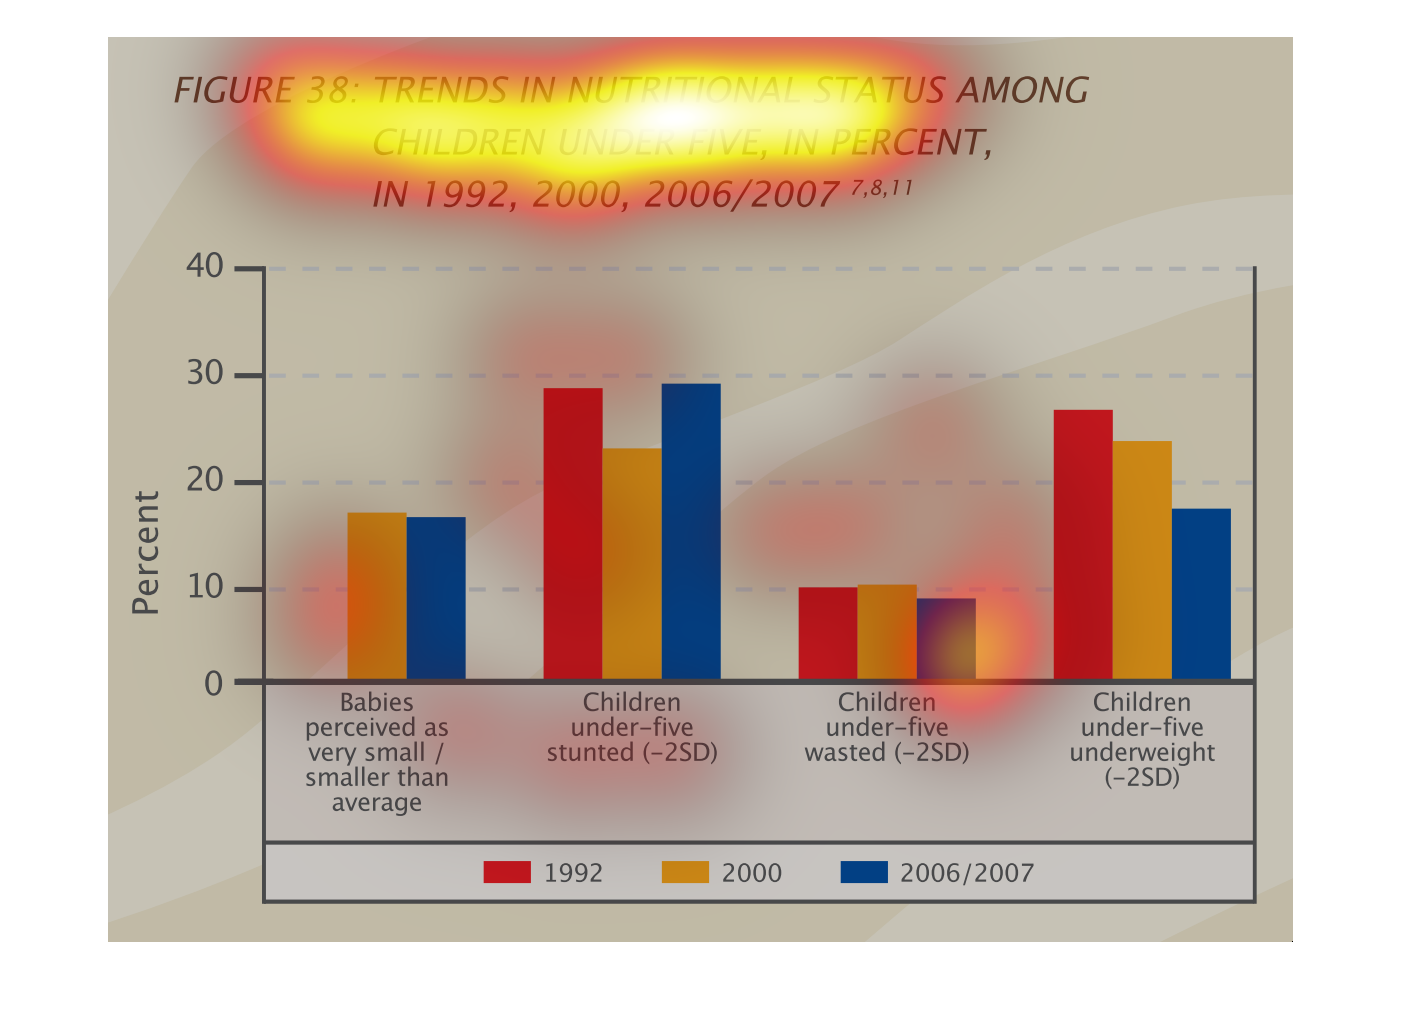
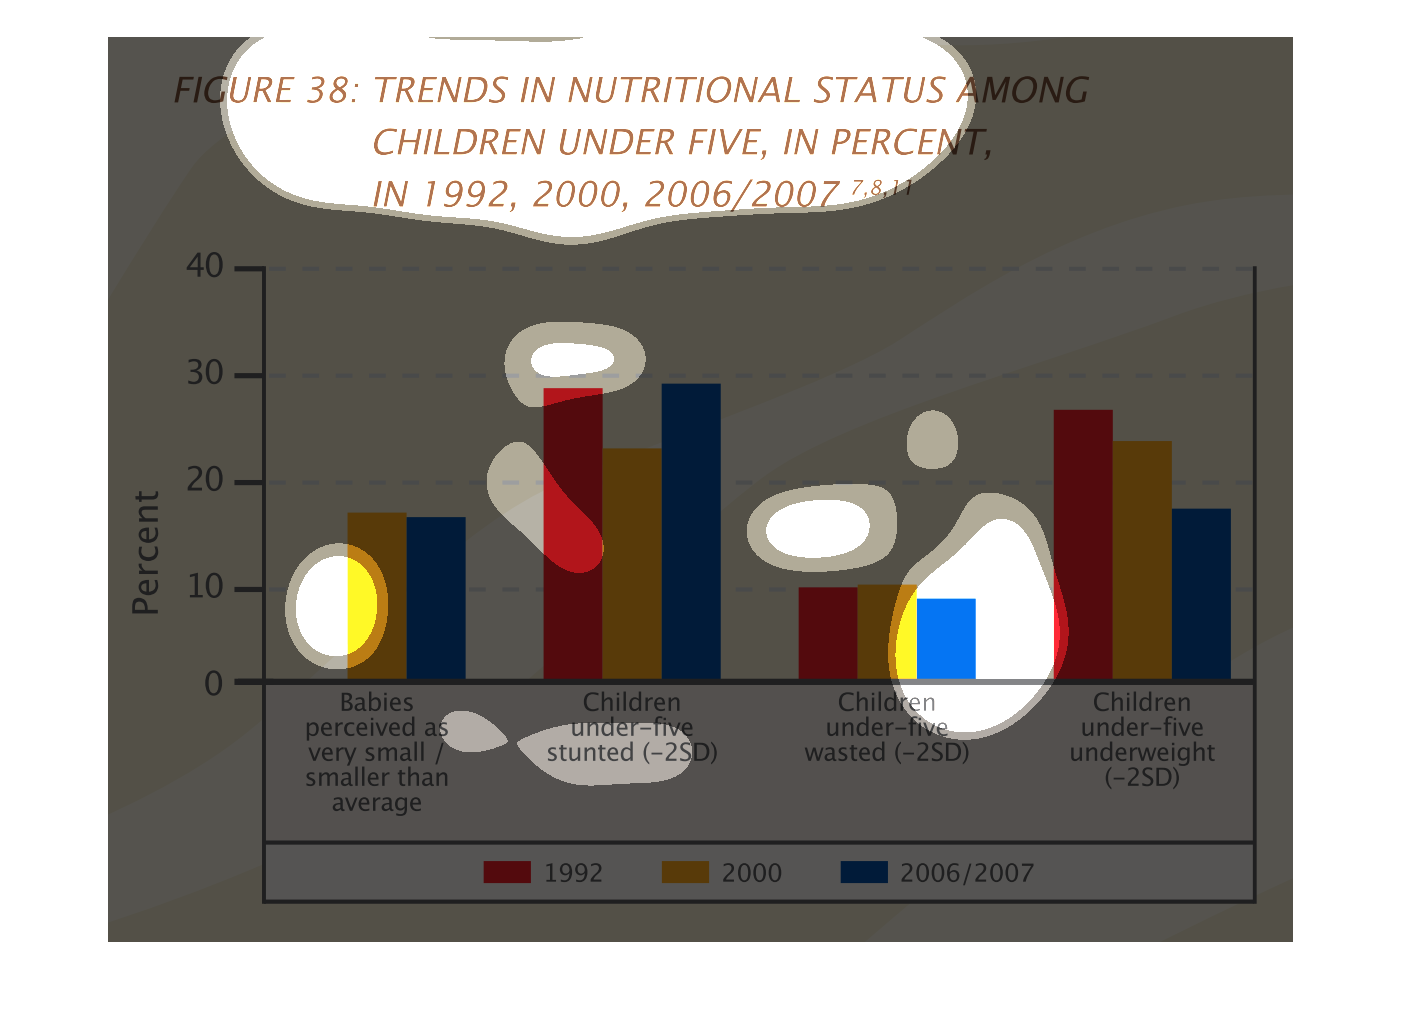
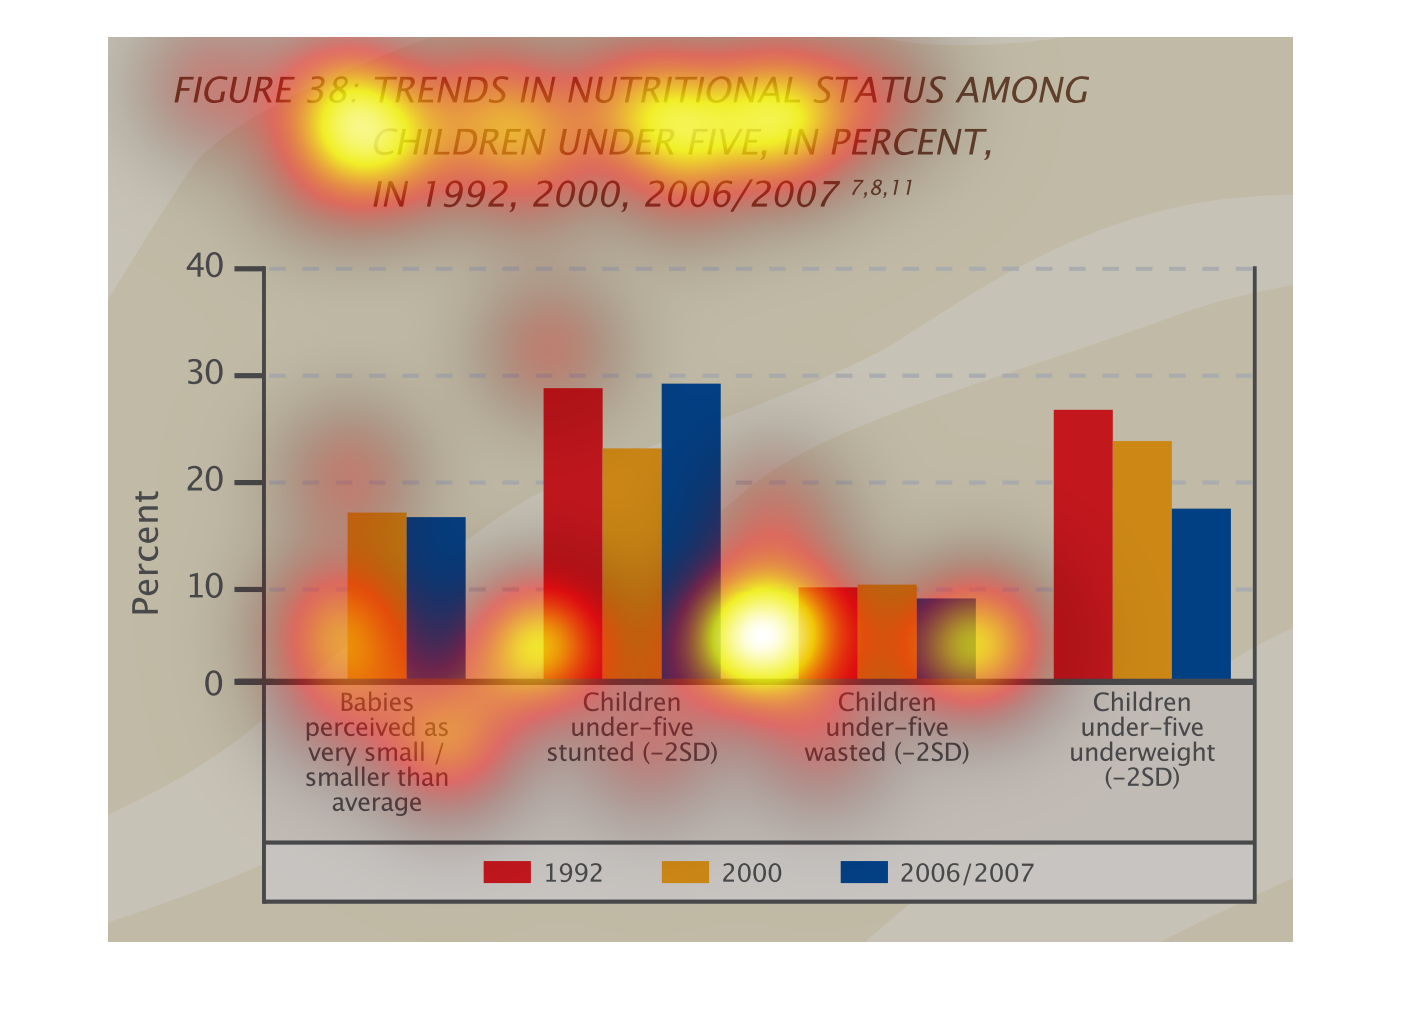
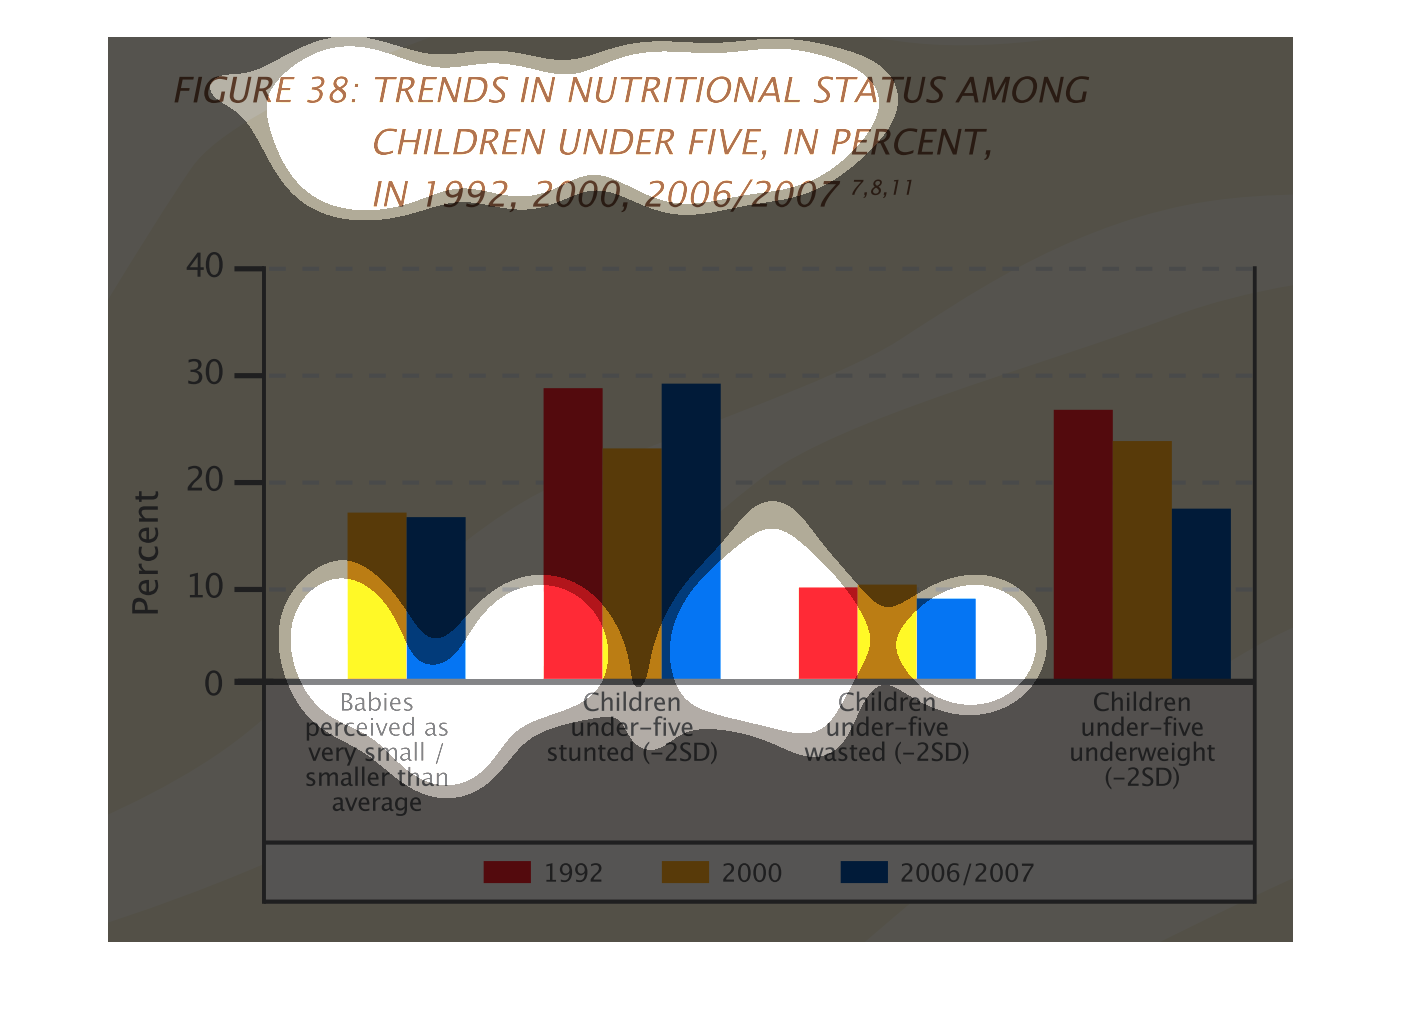
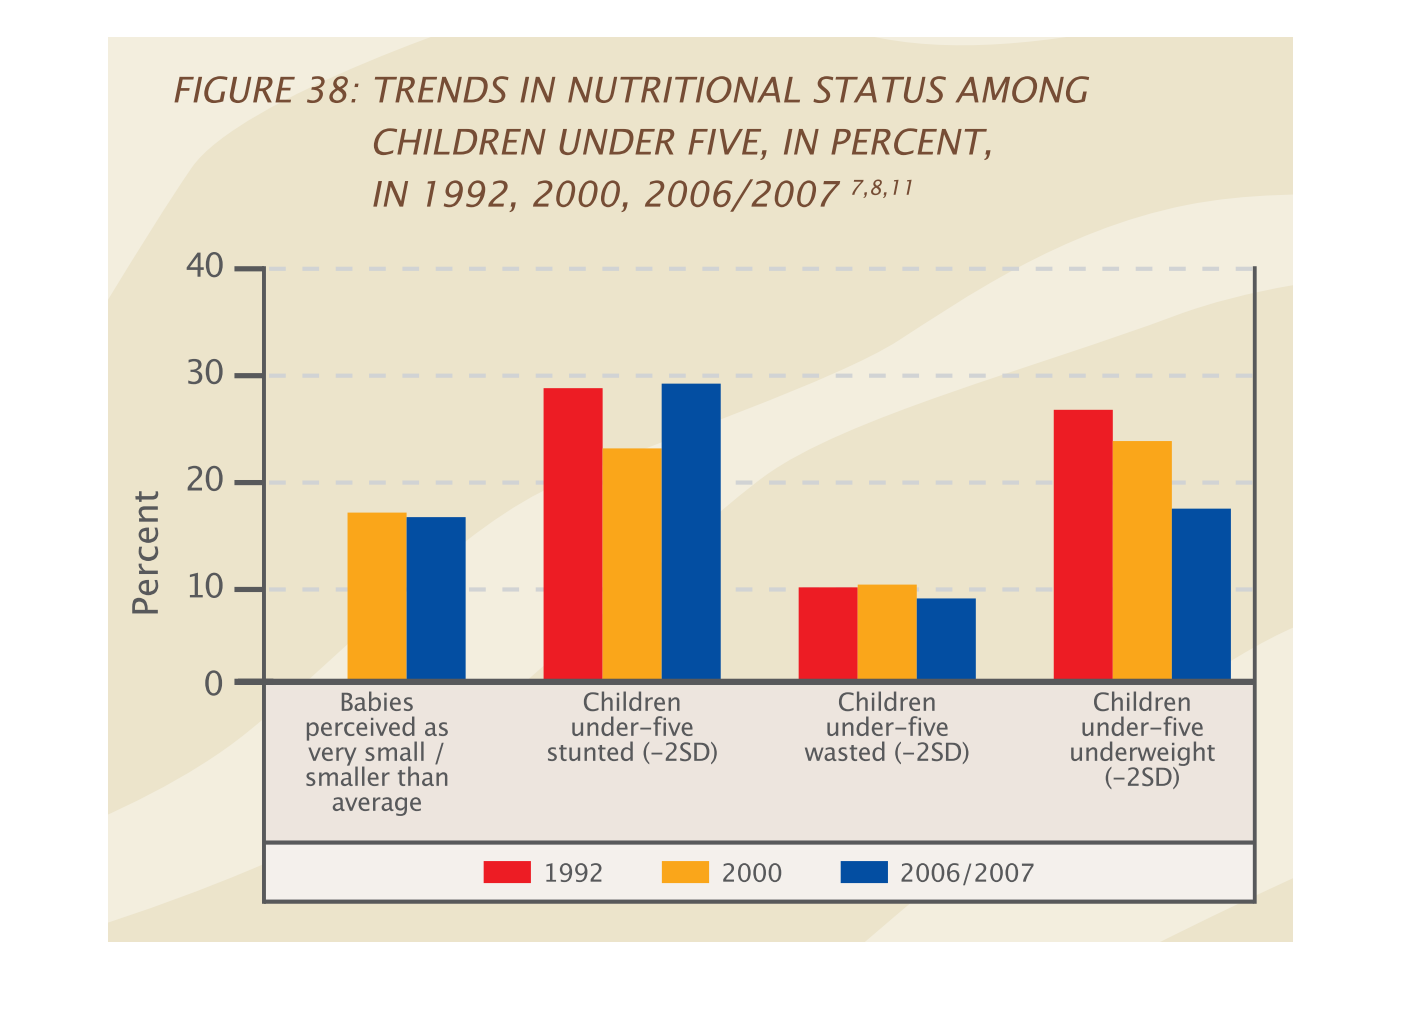
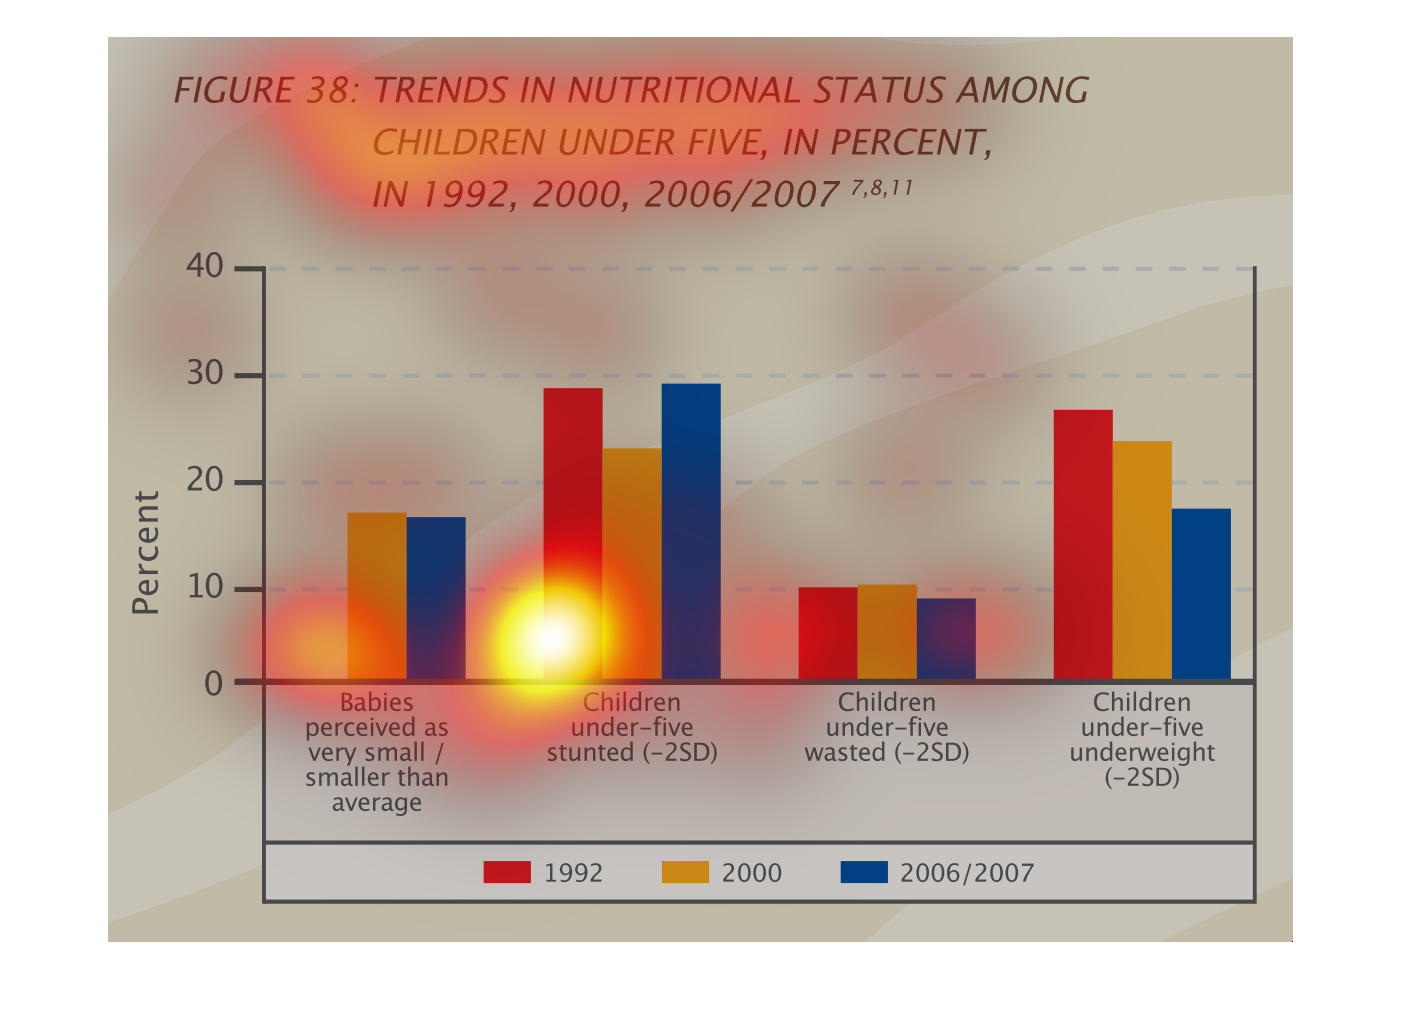
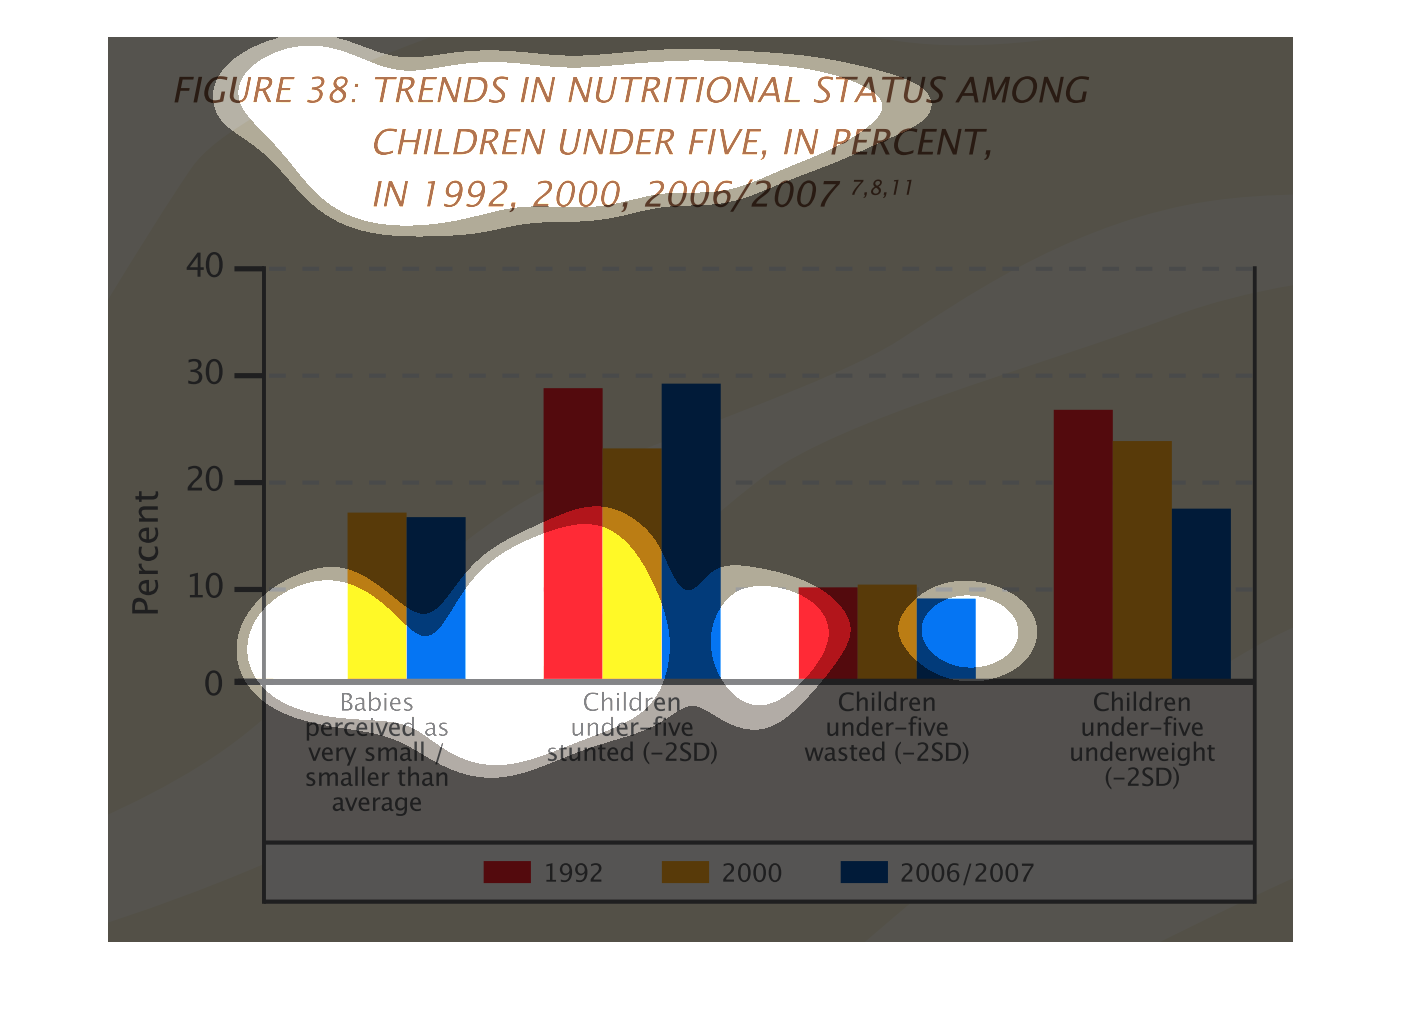
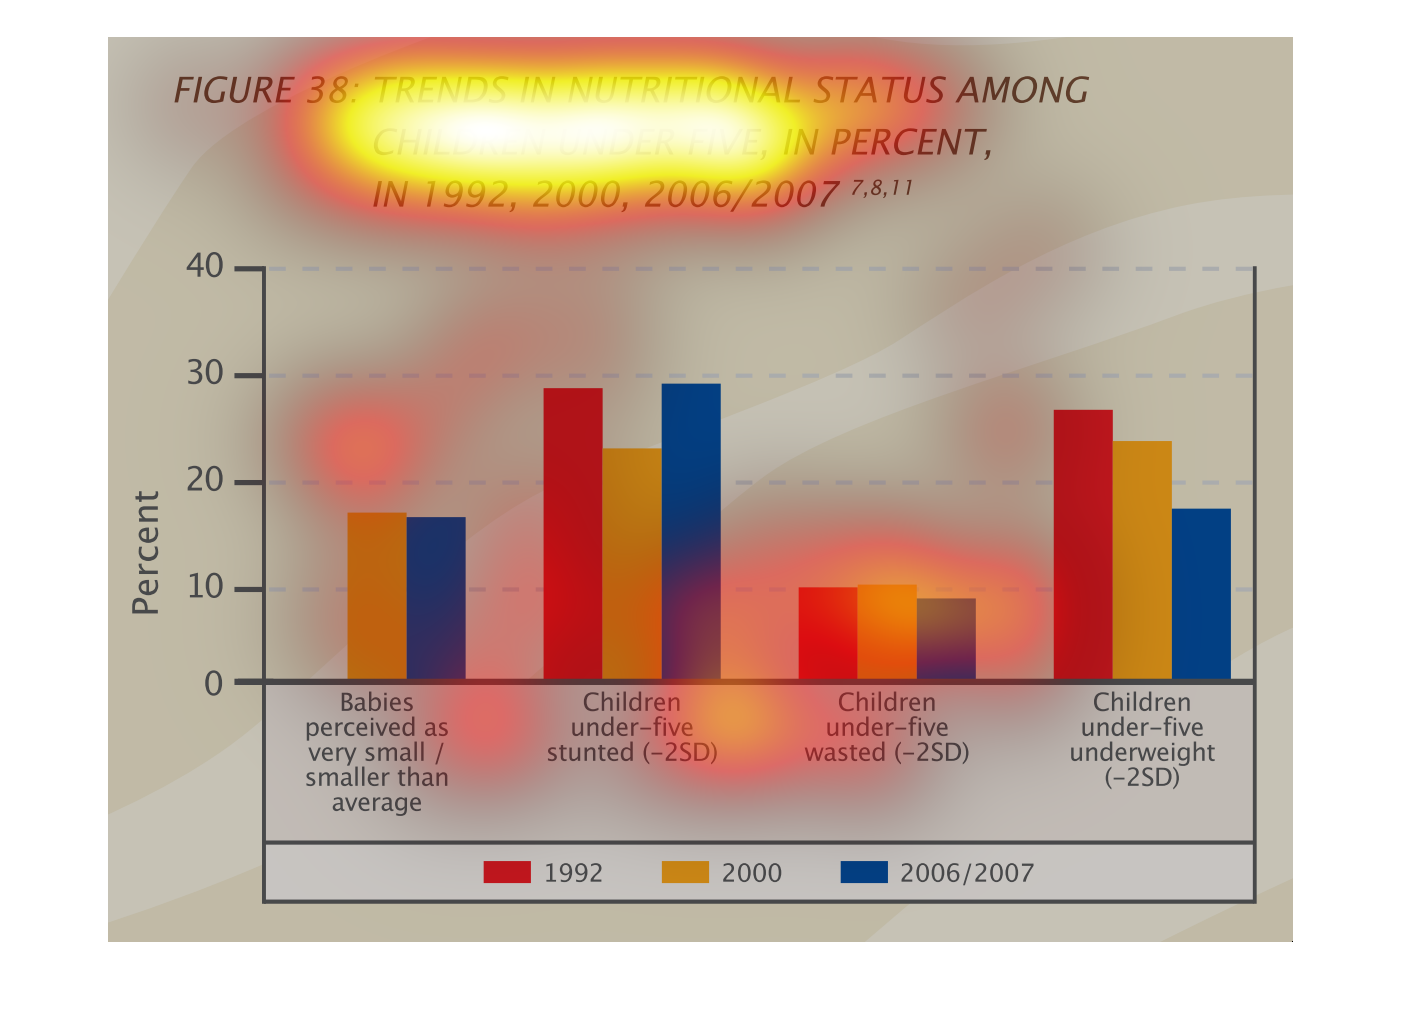
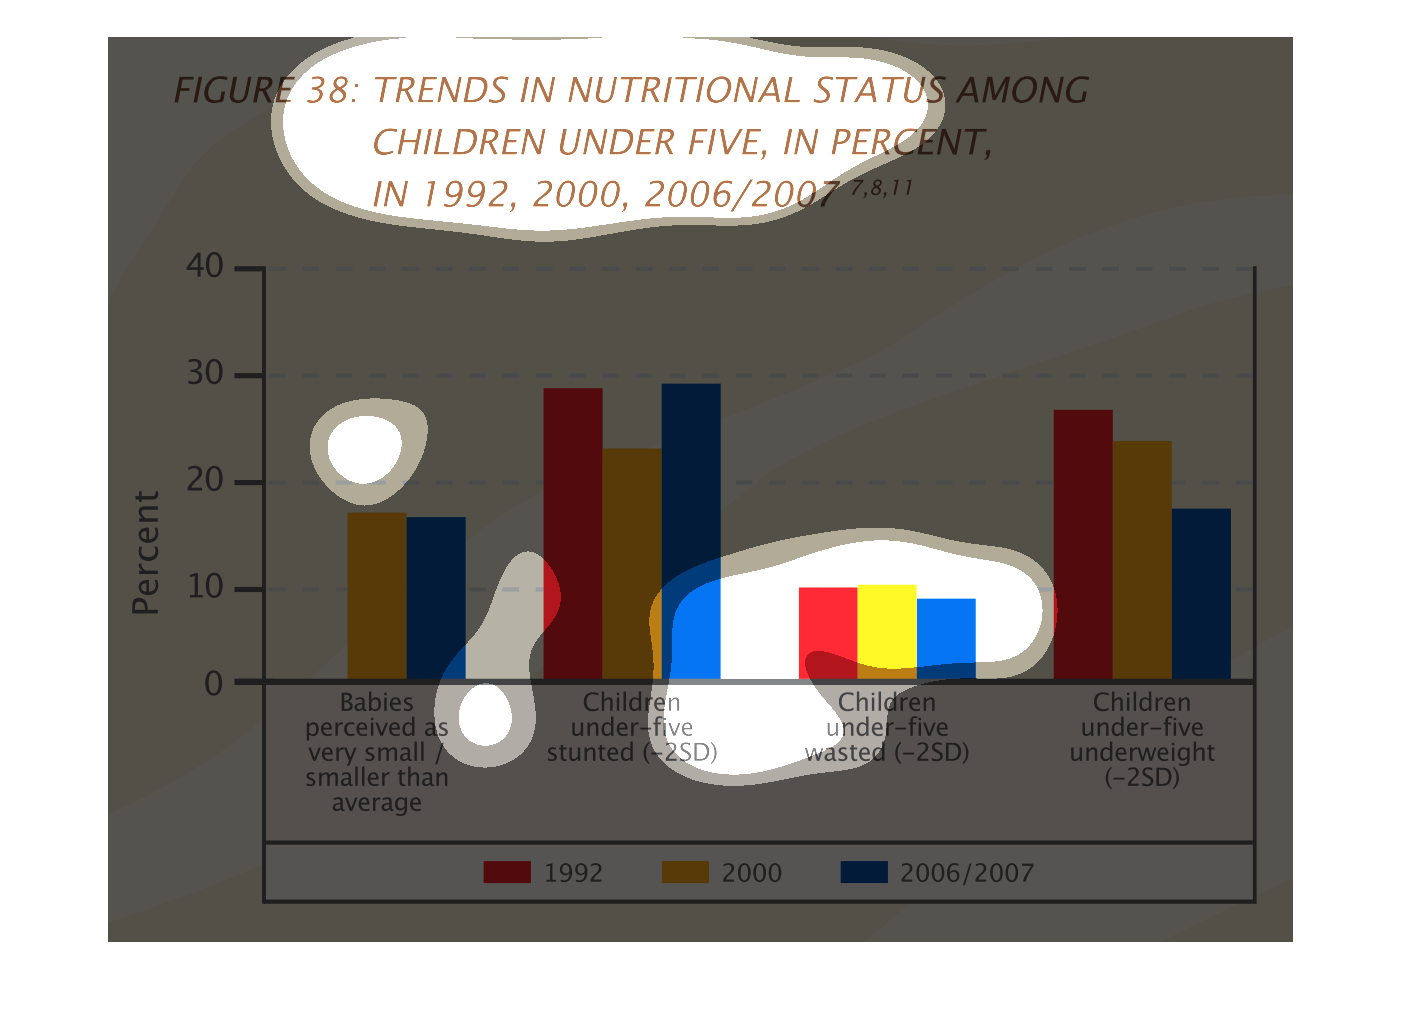
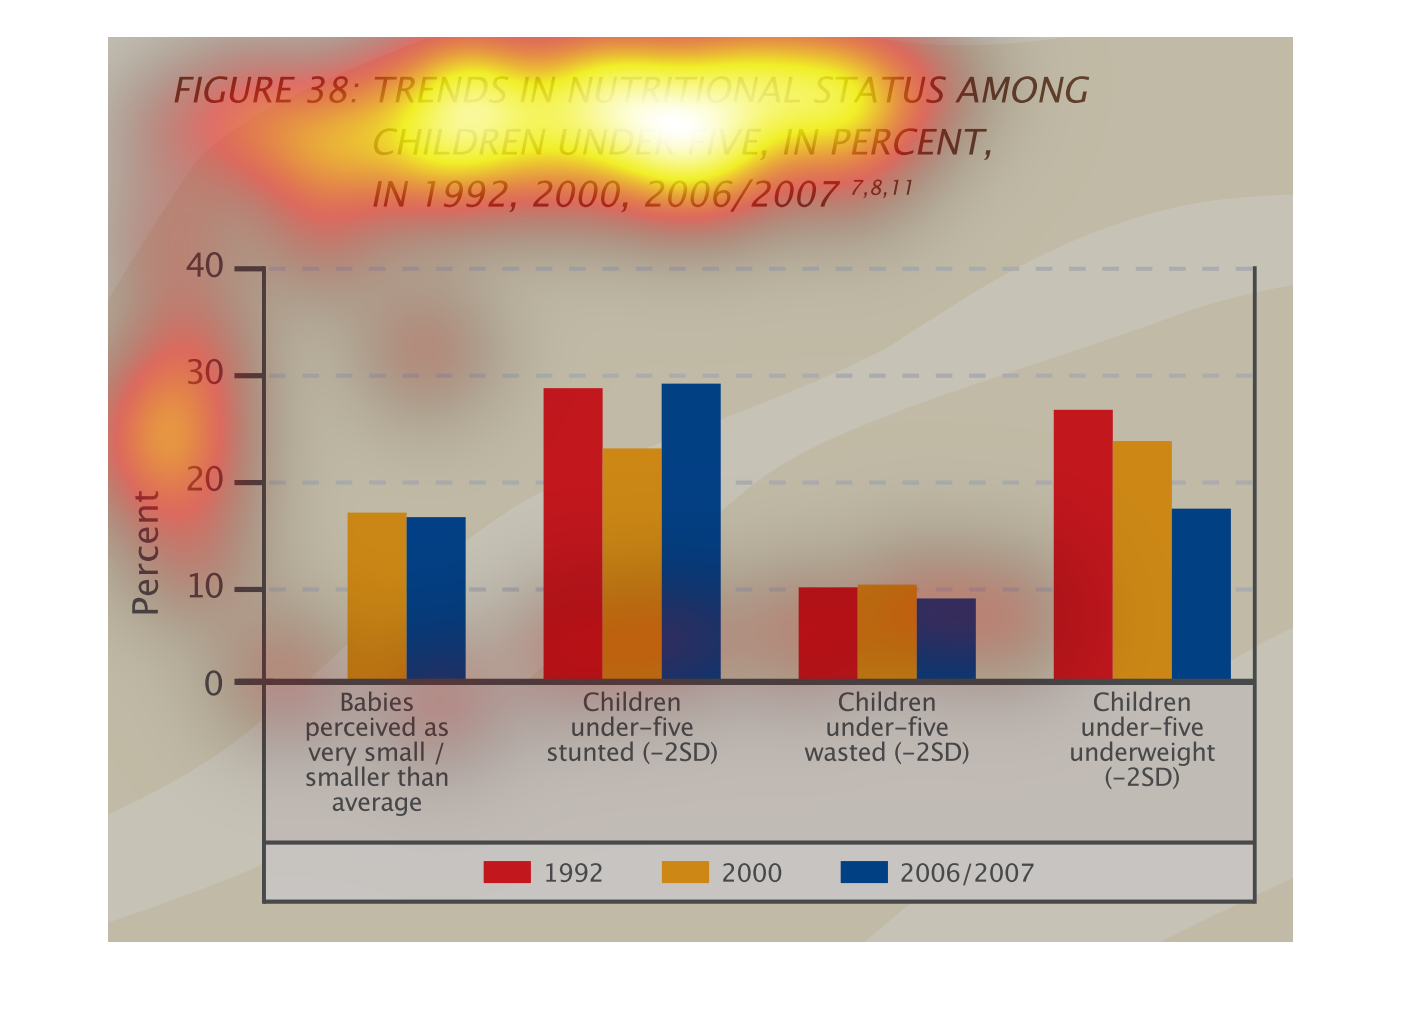
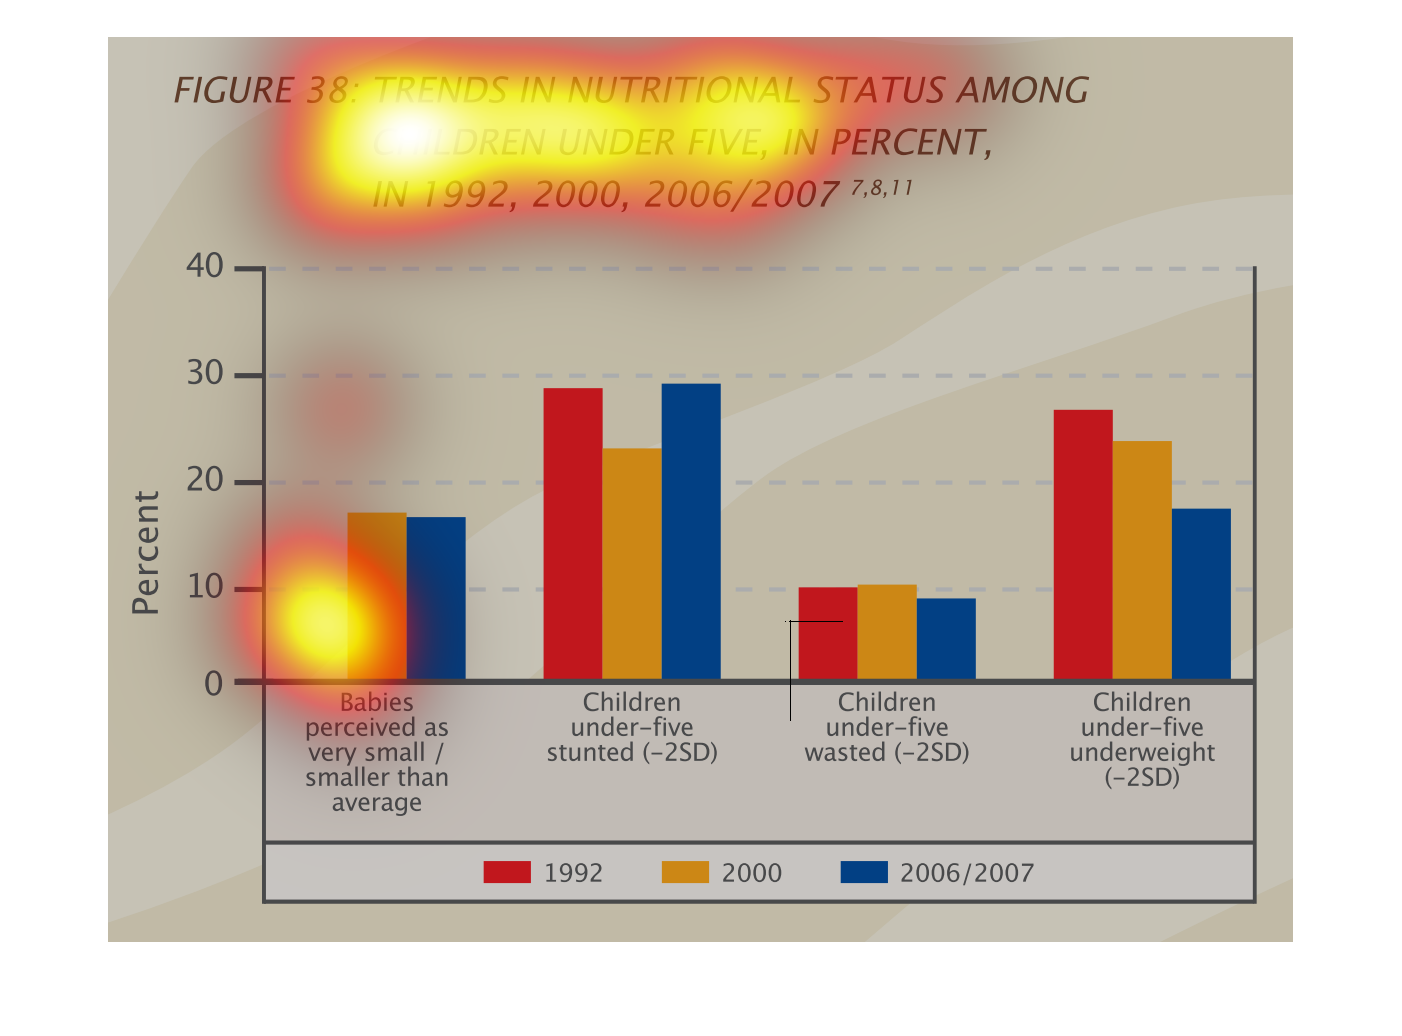
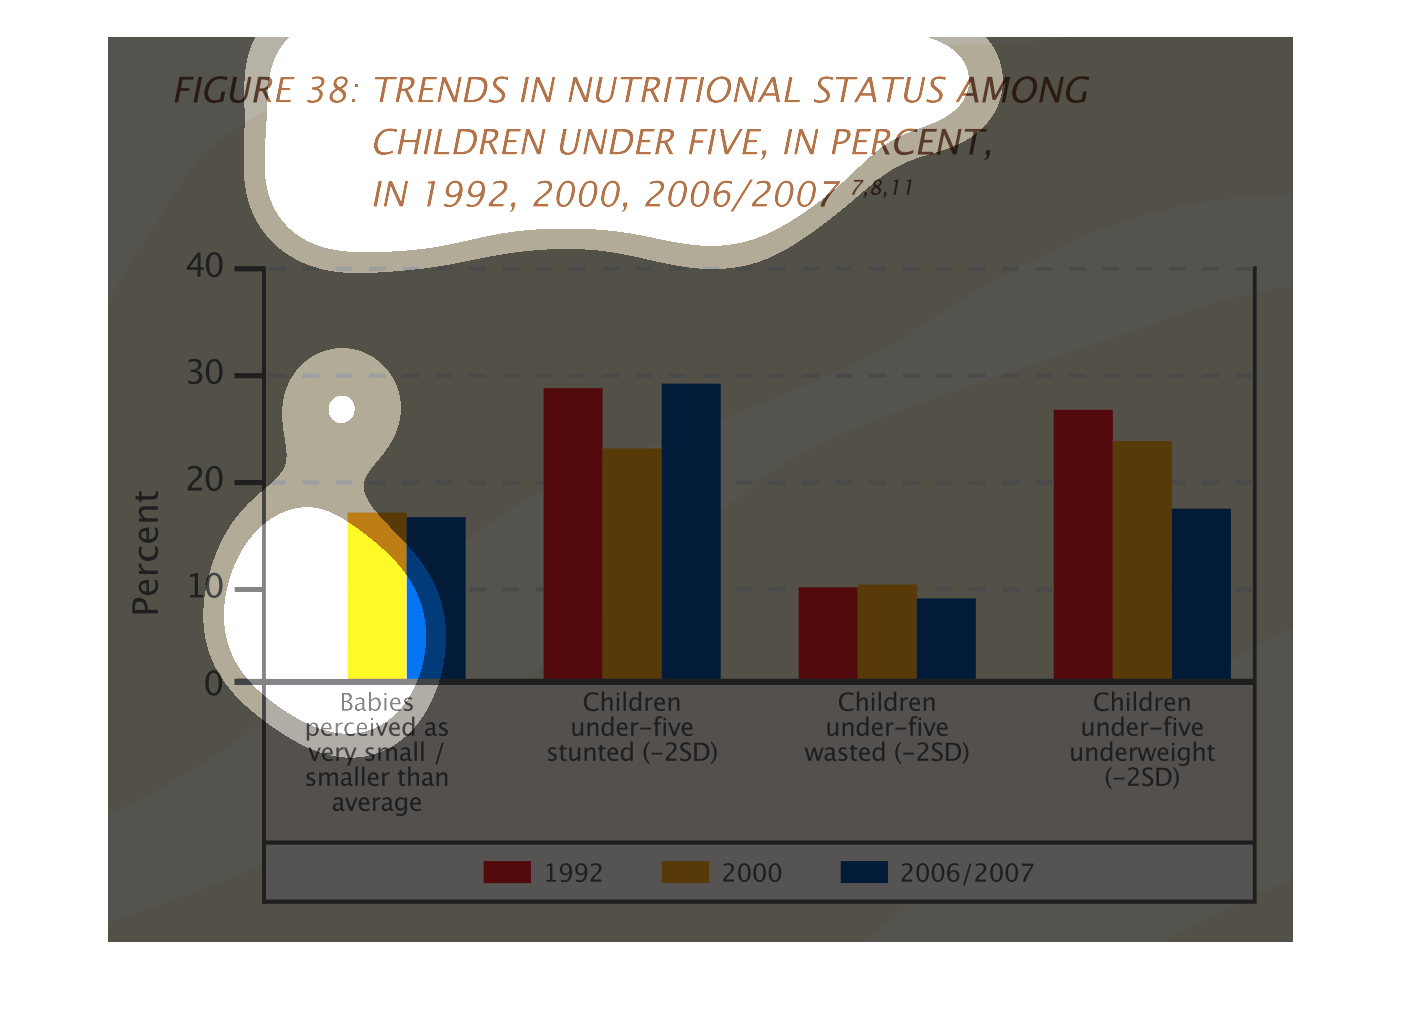
The following chart shows trends in nutritional status among children under five, in percent
in 1992, 2000, 2006/2007.  Babies were perceived as very small compared to average.

The figure presented is titled figure 38: trends in nutritional status among children under
five, in percent, in 1992, 2000, and in 2006/2007.  The figure shows nutrition status.


This chart shows the trends in nutritional status in children under 5. Its grouped into bars
for babies, children under 5 stunted, under 5 wasted, and children under 5 underweight, and
graphs are colored for 1992, 2000, and 2006/7.
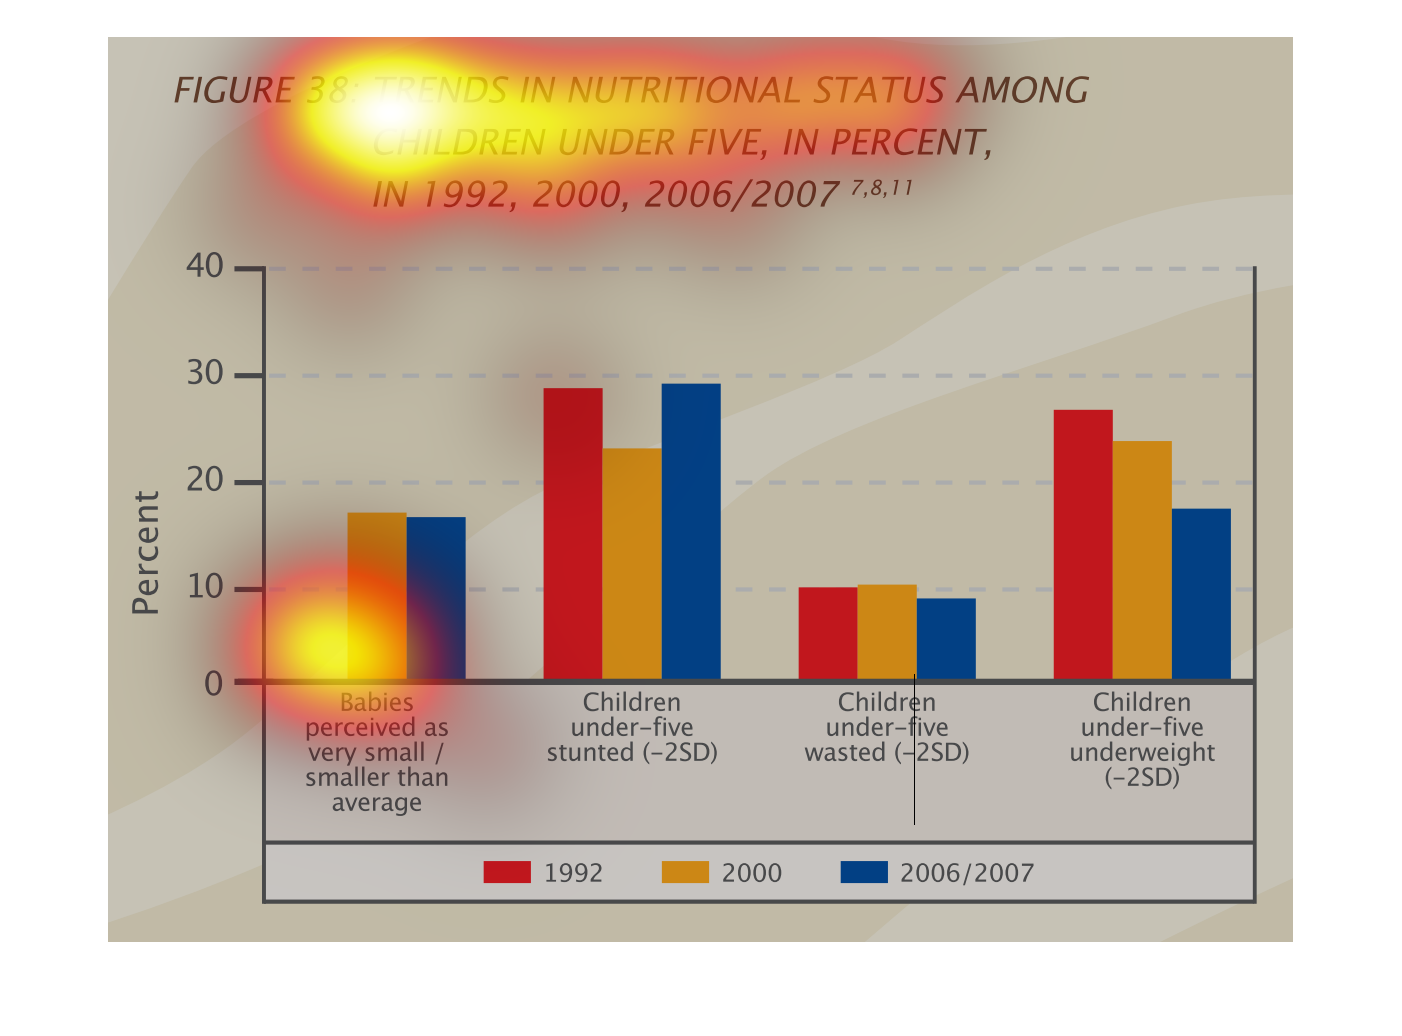
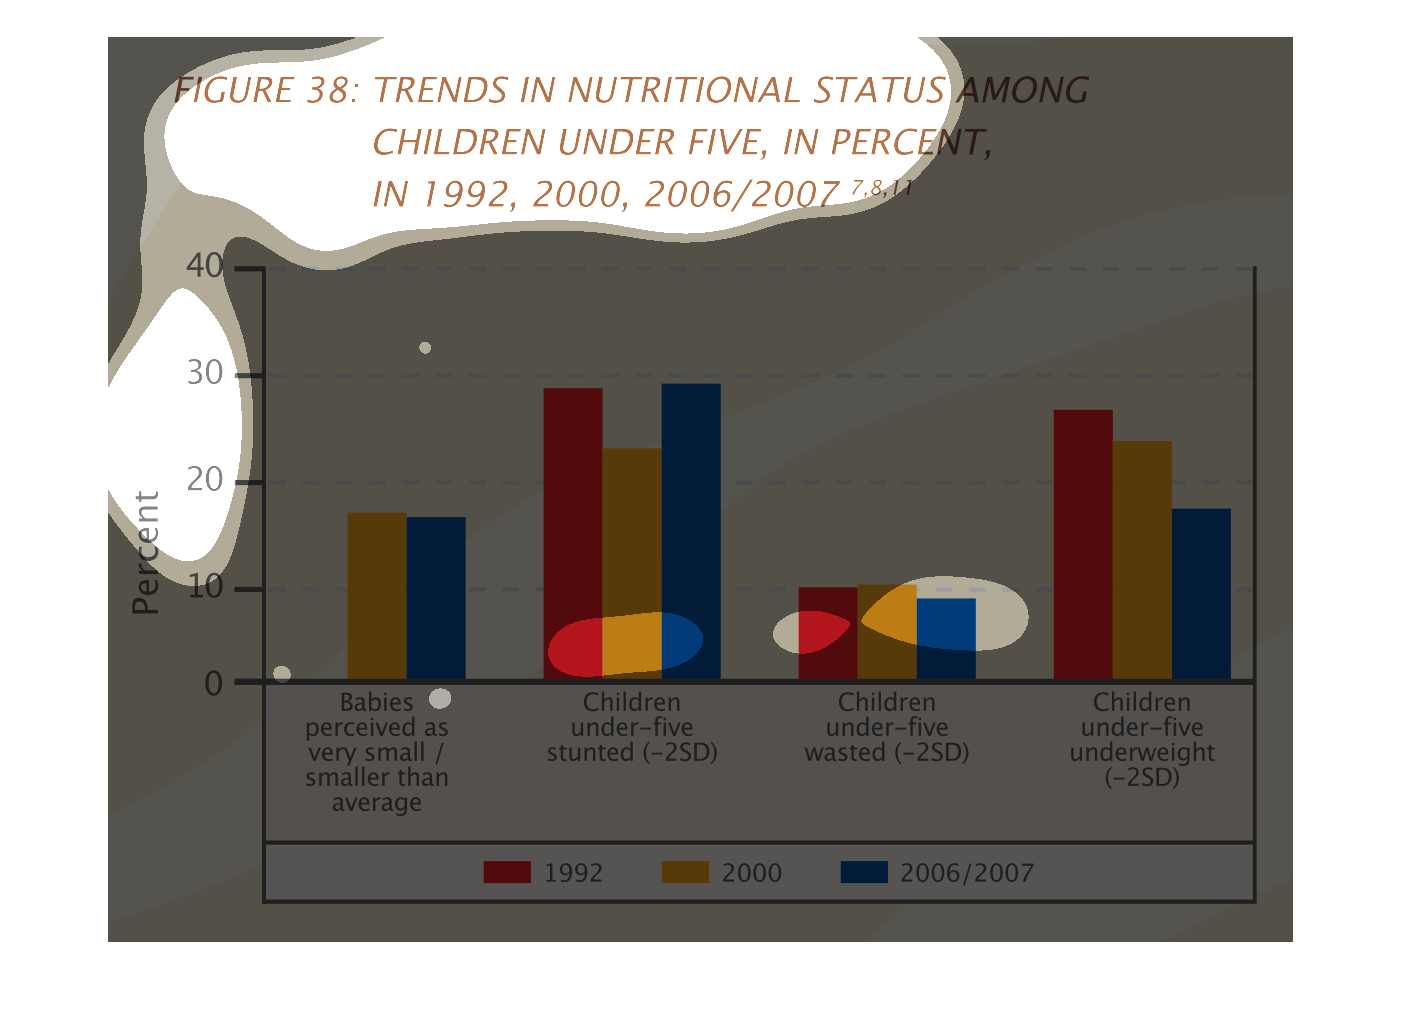
This chart takes a look at the trends in nutritional status in children under the age of five
during a period of years including 1992, 2000, and 2006/2007. The years are labeled according
to color and depicts how many children were underweight, wasted, stunted, or smaller than
average.
The following chart gives nutrition trends in children under five years of age. The data was
taken from the following years 2000, 2006, and 2007. It shows a decrease.
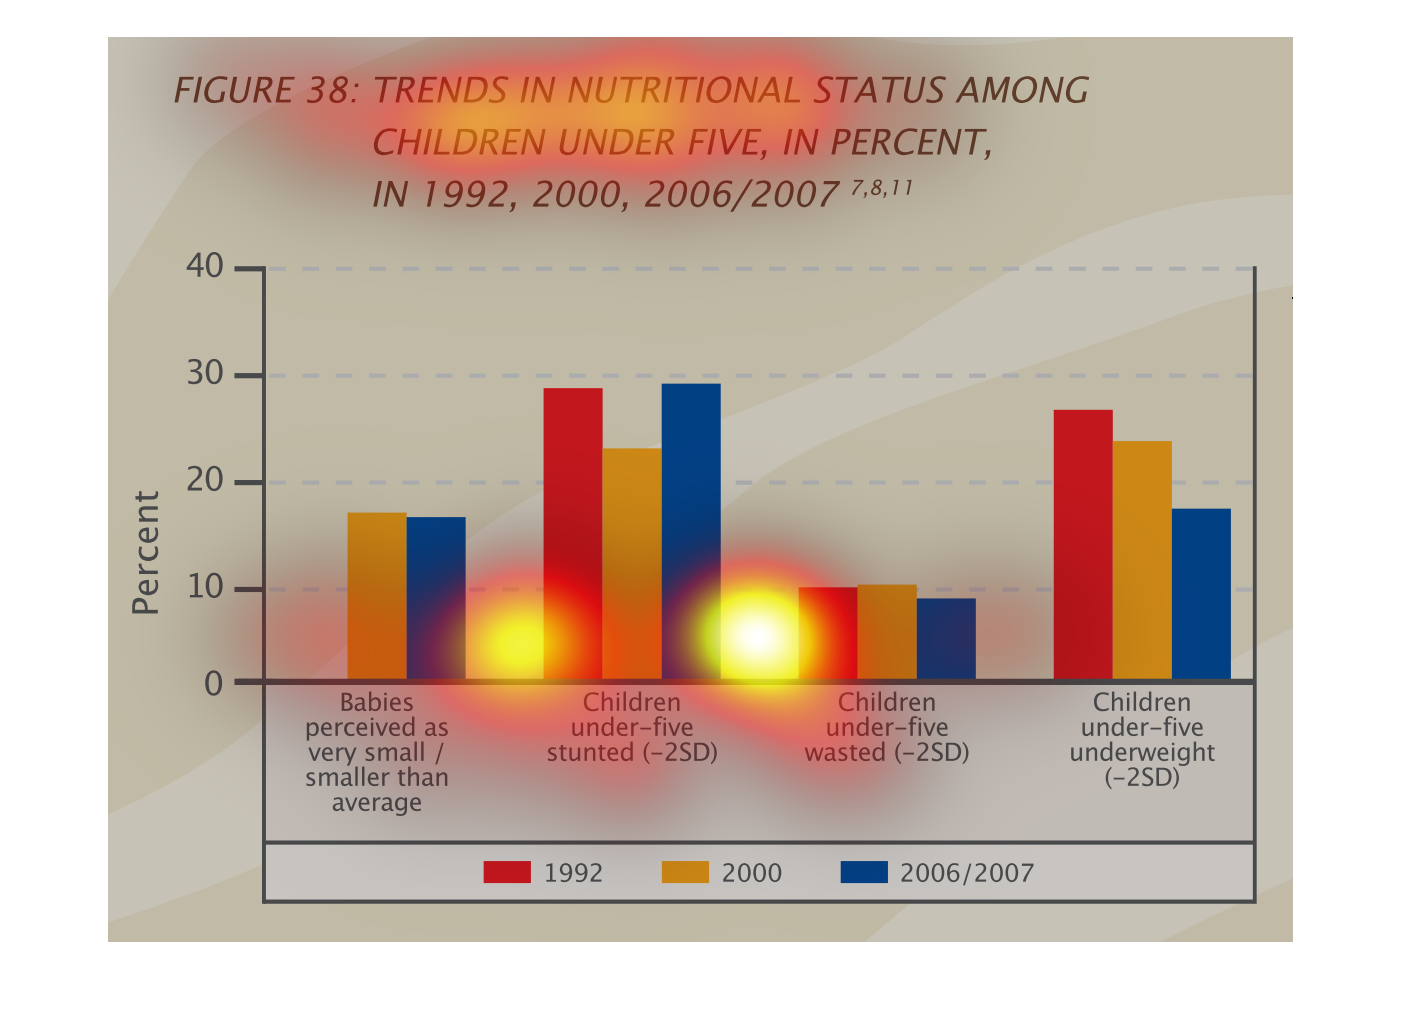
This is a graph that shows the trends in nutritional status among children under the age of
five and it covers the year 1992, 2000, 2006/7 and it shows this trend in form of a percentage.
This Bar Chart shows the trend is Nutritional Status among children under five years old in
1992, 2000, and 2006/2007. Data is grouped by the weight of the baby or child.
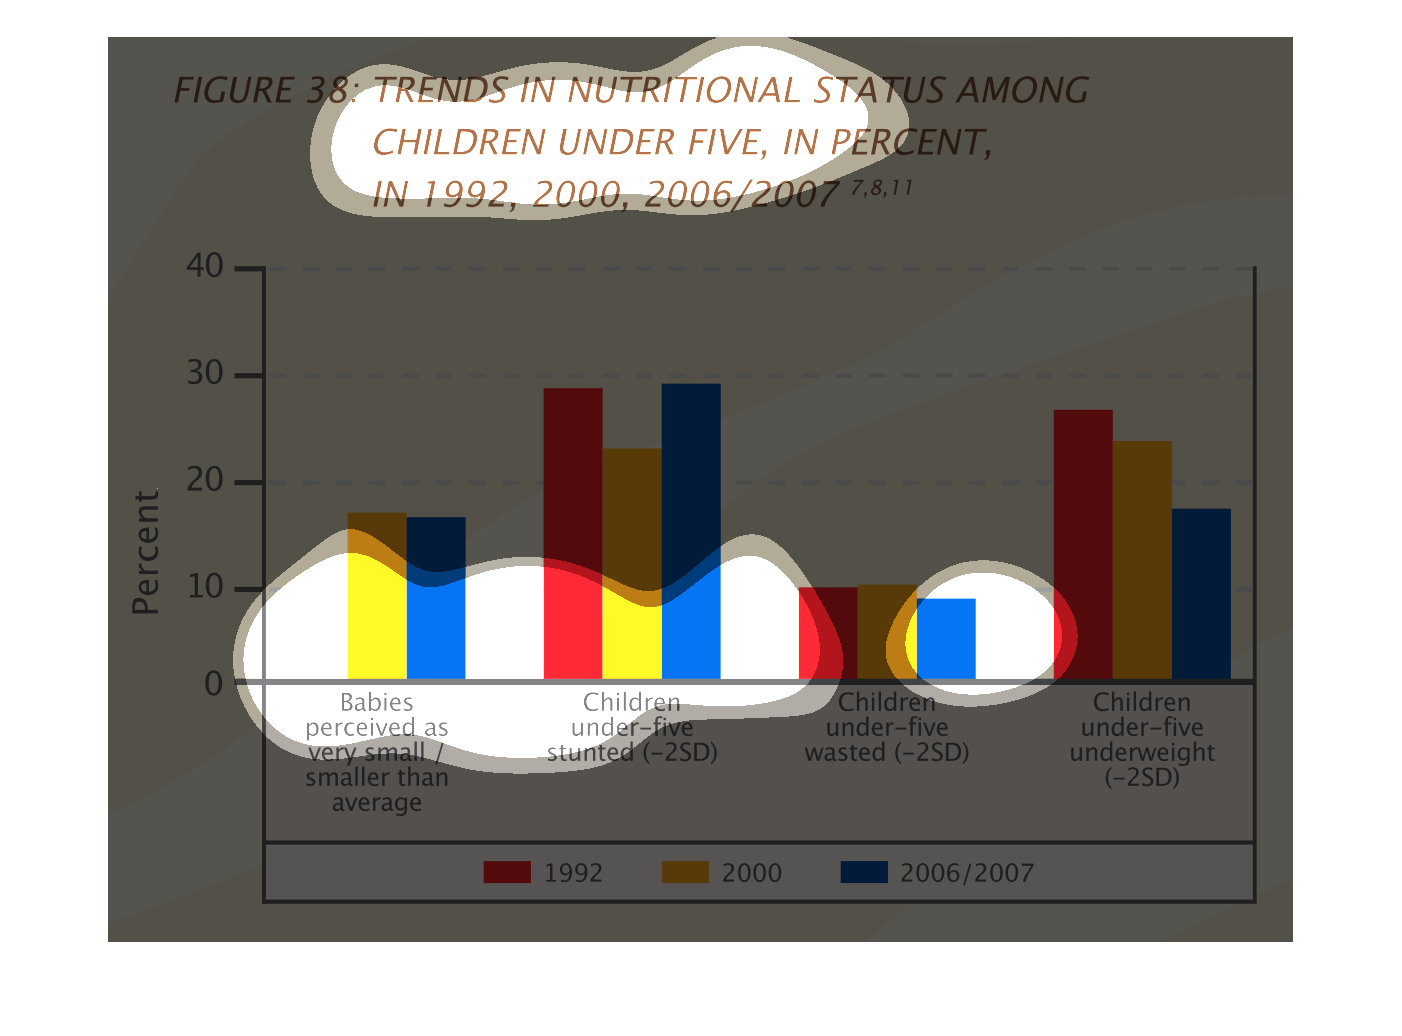
This chart describes trends in nutritional status among children under five, in percent, for
the years 1992, 2000, 2006/2007. Categories on the chart include babies perceived as very
small.
This graph illustrates the rends in nutritional status in children under five in the years
1992, 2000, and 2006/2007.    There are various categories such as underweight children and
those with stunted growth.
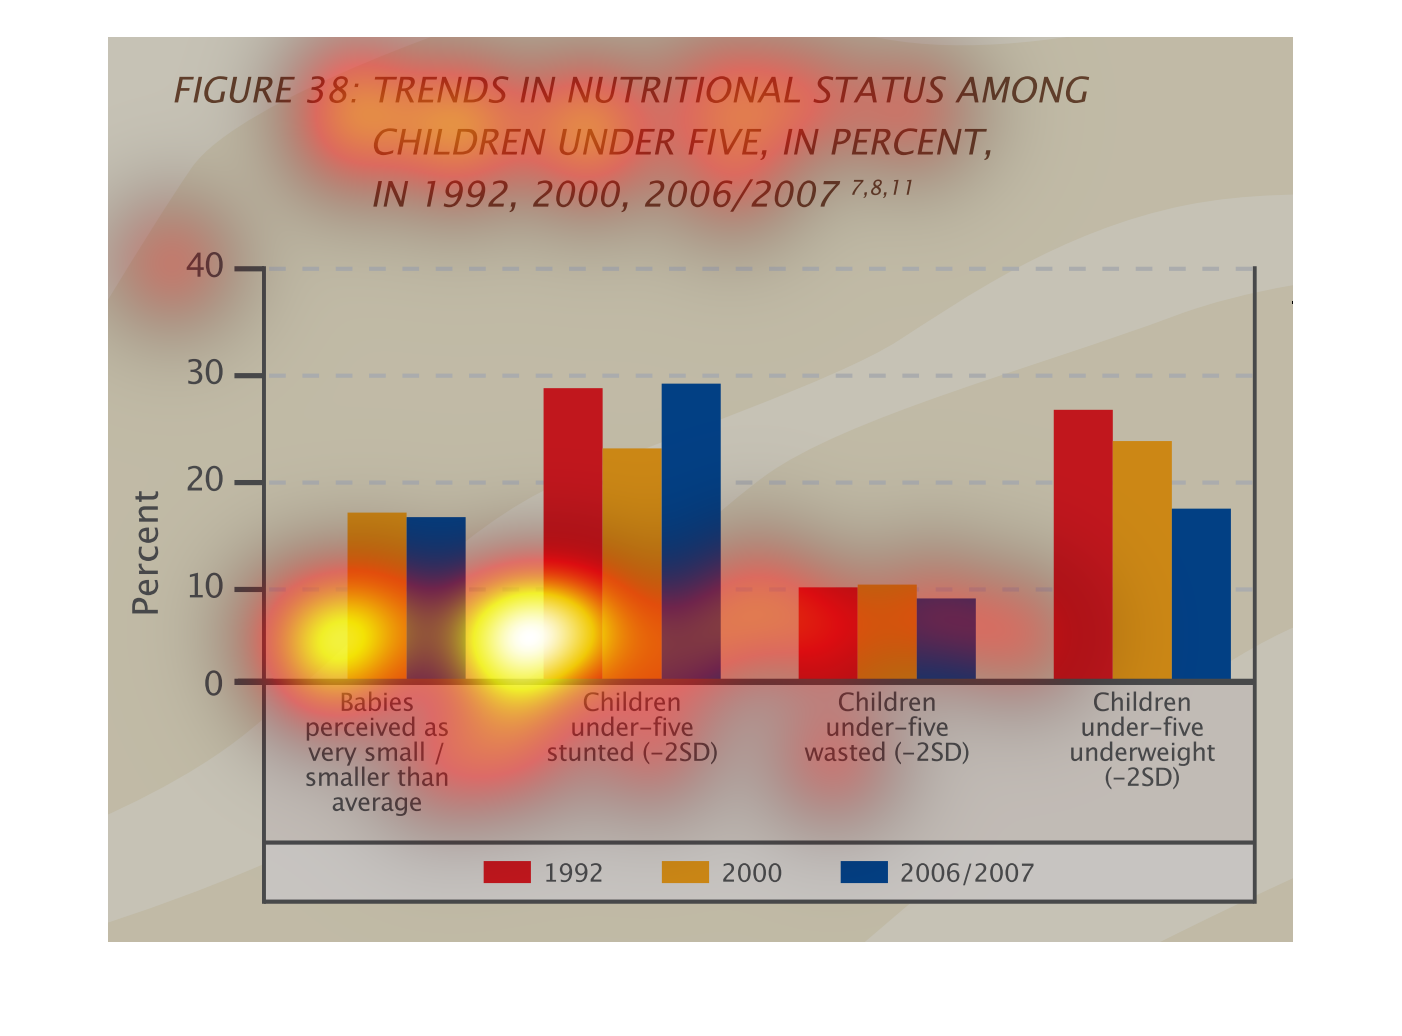
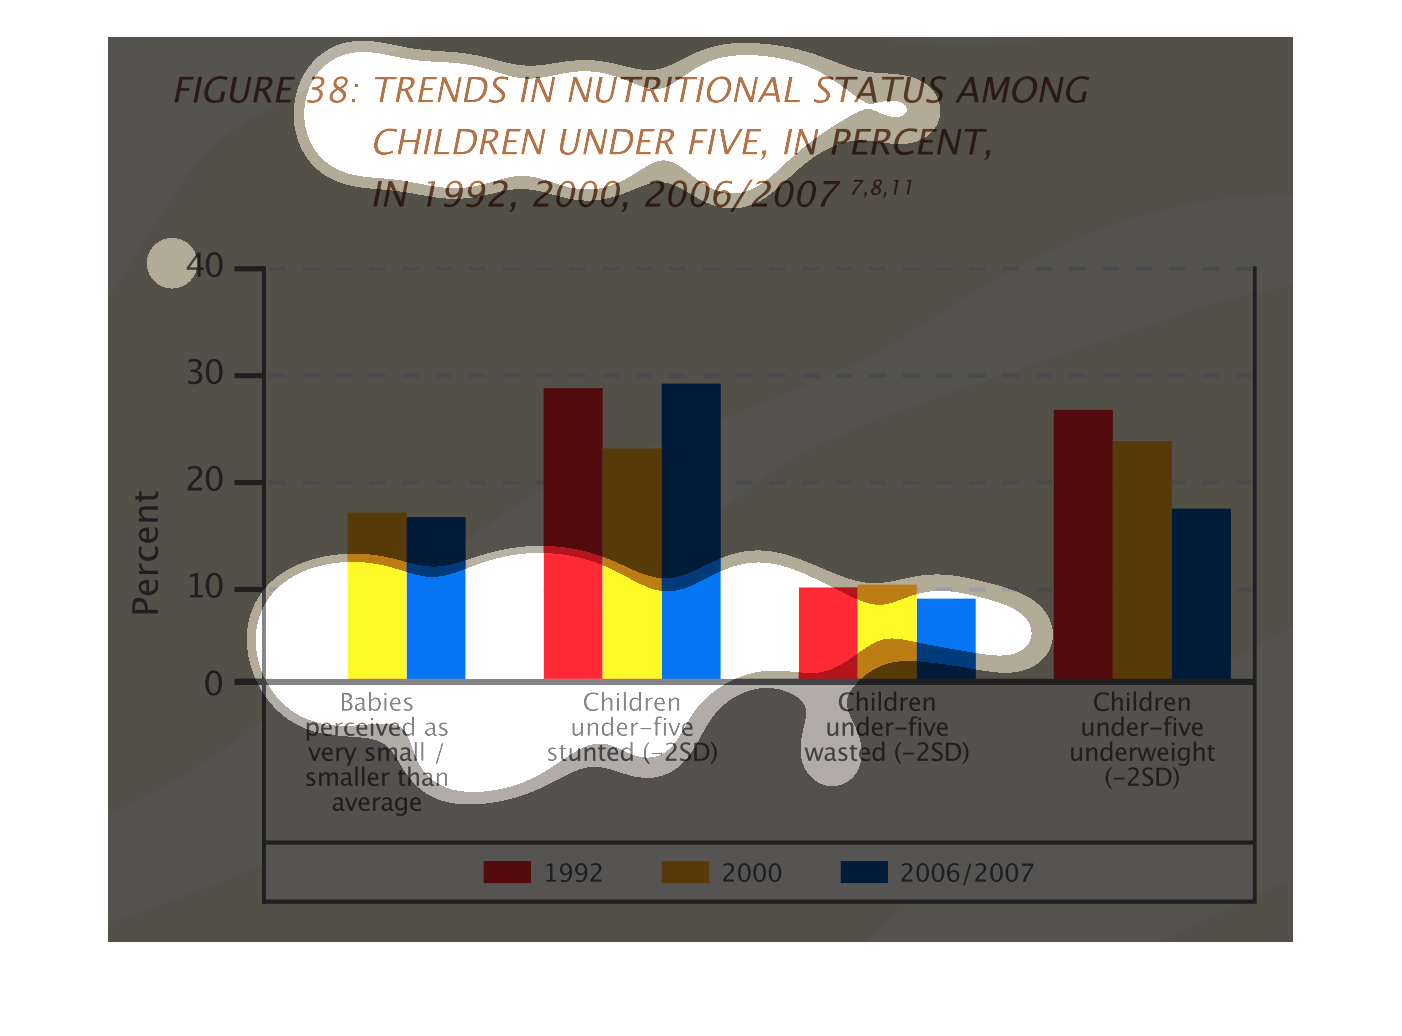
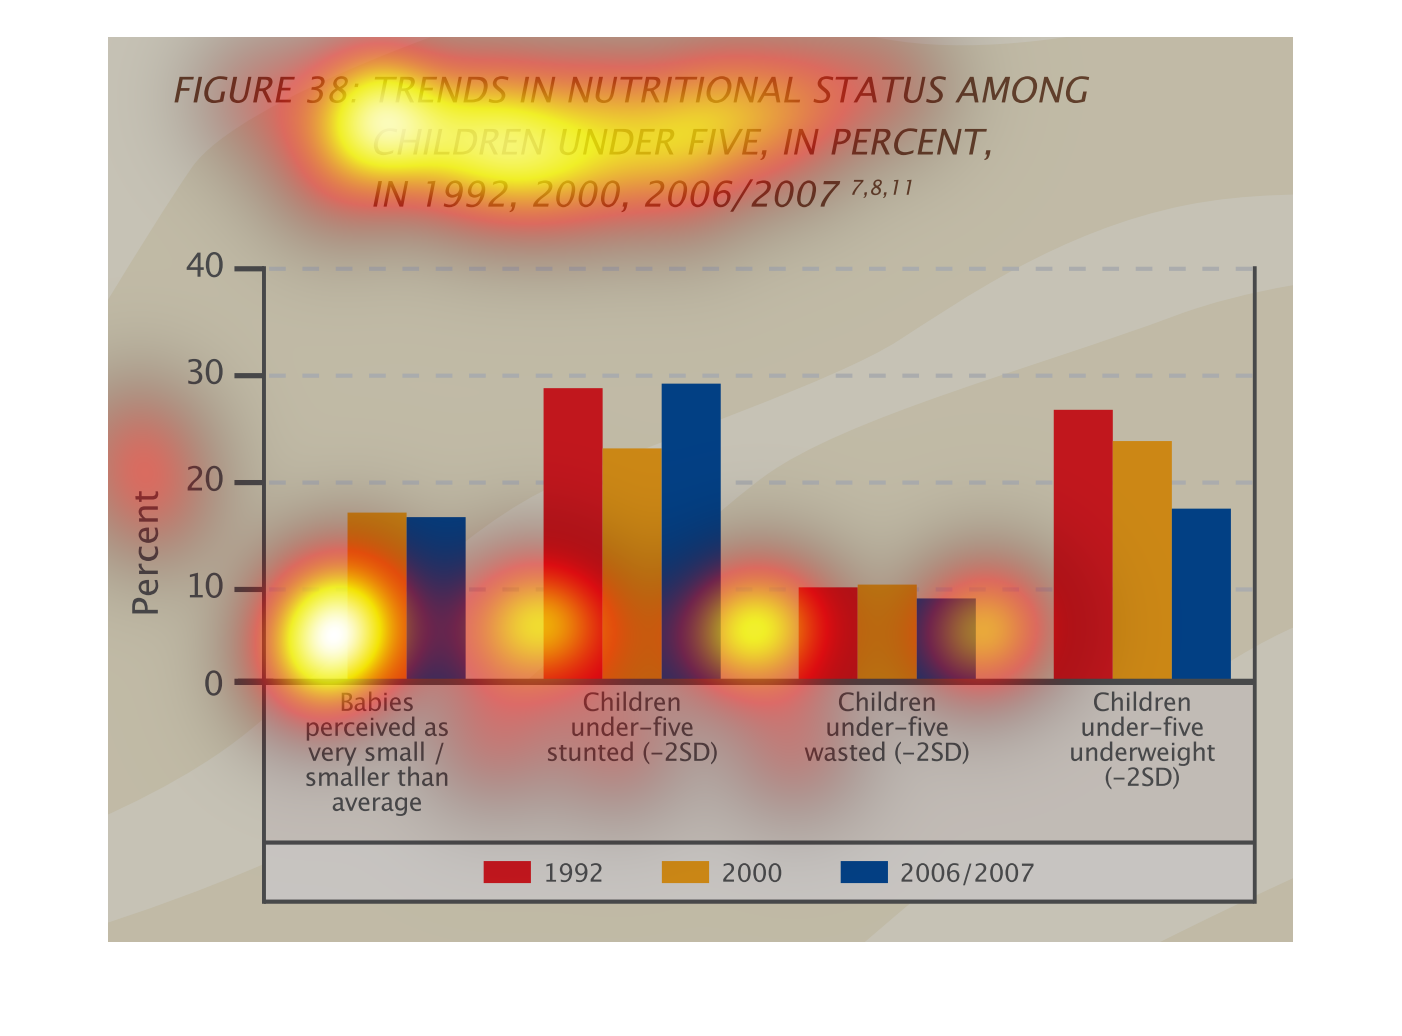
Trends in nutrition status among children under five in percent in 1992, 2000, 2006/2007.
Children underweight have decreased over the three time frames while the other categories
(stunted, wasted, and perceived as small newborns) have stayed relatively consistent.

Trends in nutritional status in children under five from 1992 to 2007, seems to indicate the
percentage of children under 5 that are underweight weight increased over time but those stunted,
wasted, and small at birth remained relatively the same.