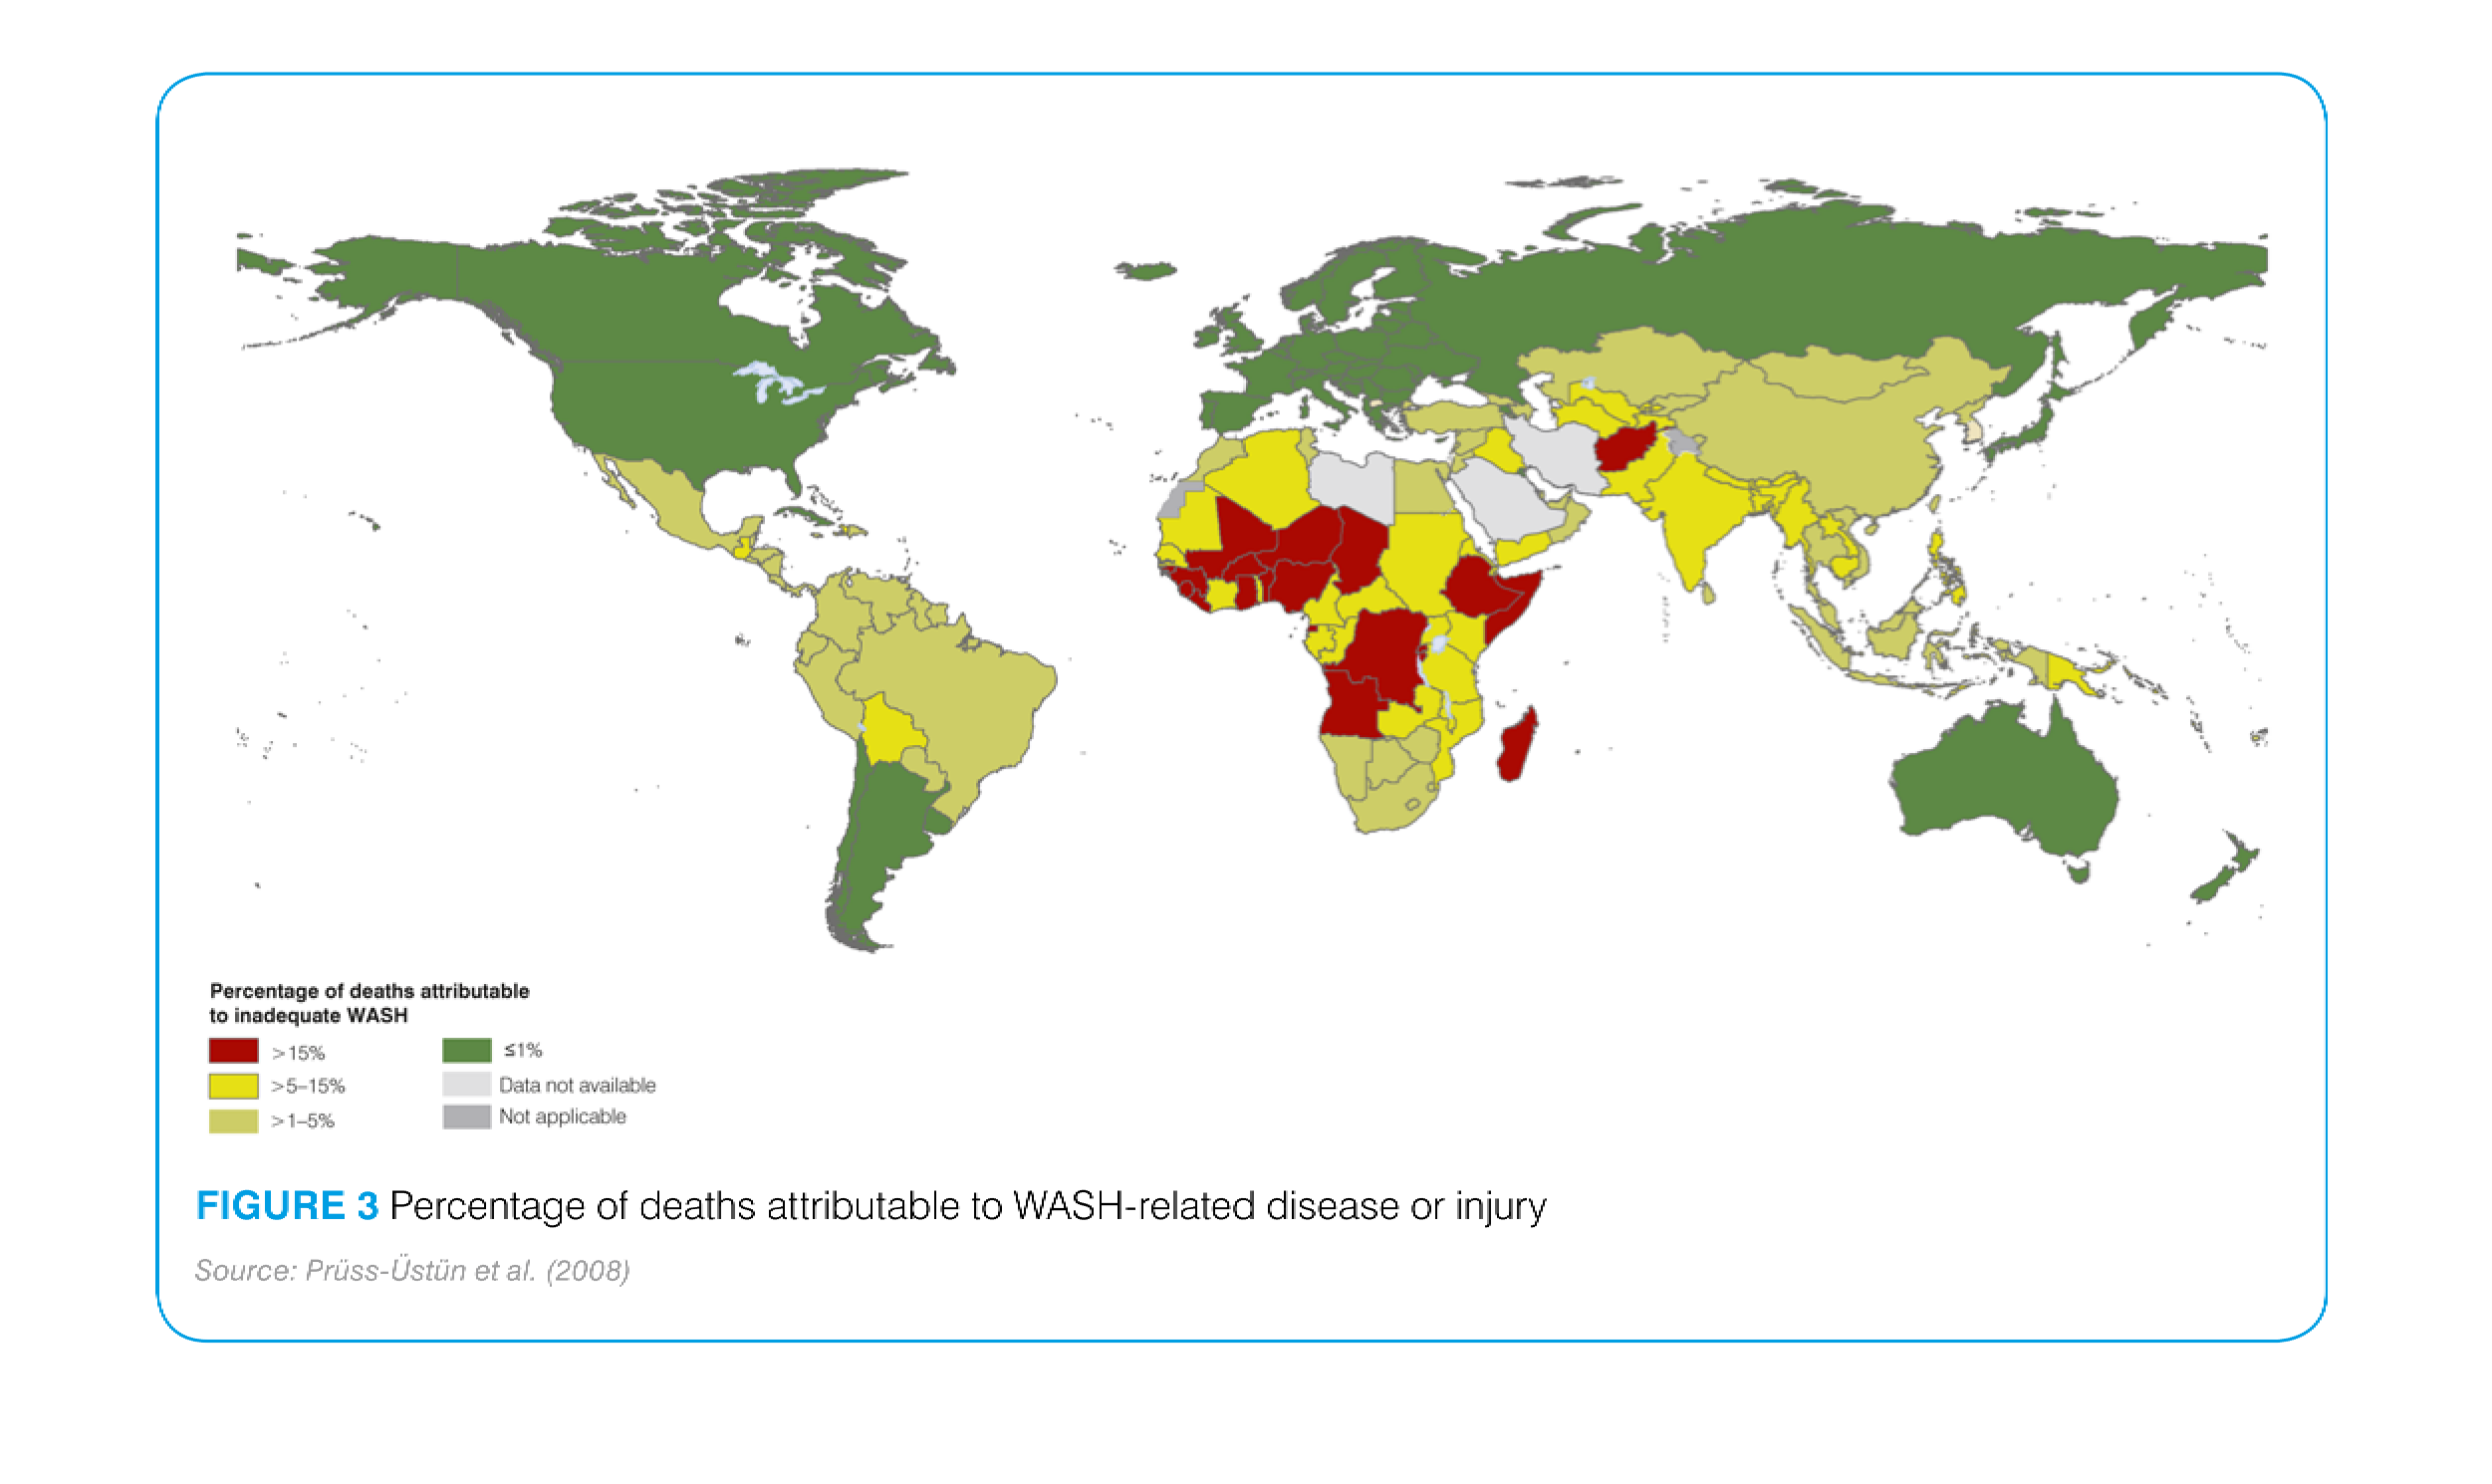
This is a world map showing the worldwide percentage of deaths attributable to WASH related
disease or injury. Countries are color coded and shaded by degree of percentage.
This chart describes percentage of deaths attributable to wash related disease or injury.
Different categories on the chart are represented by different colors.

The image on the left hand side is a continent view showing the deaths in a color coordinated
legend about the number of deaths related to WASH related disease or injuries.  From the data
collected one would infer that Africa, specially the central and western coast of Africa has
the highest per capita incidents of WASH related injuries as apposed to the rest of the world.
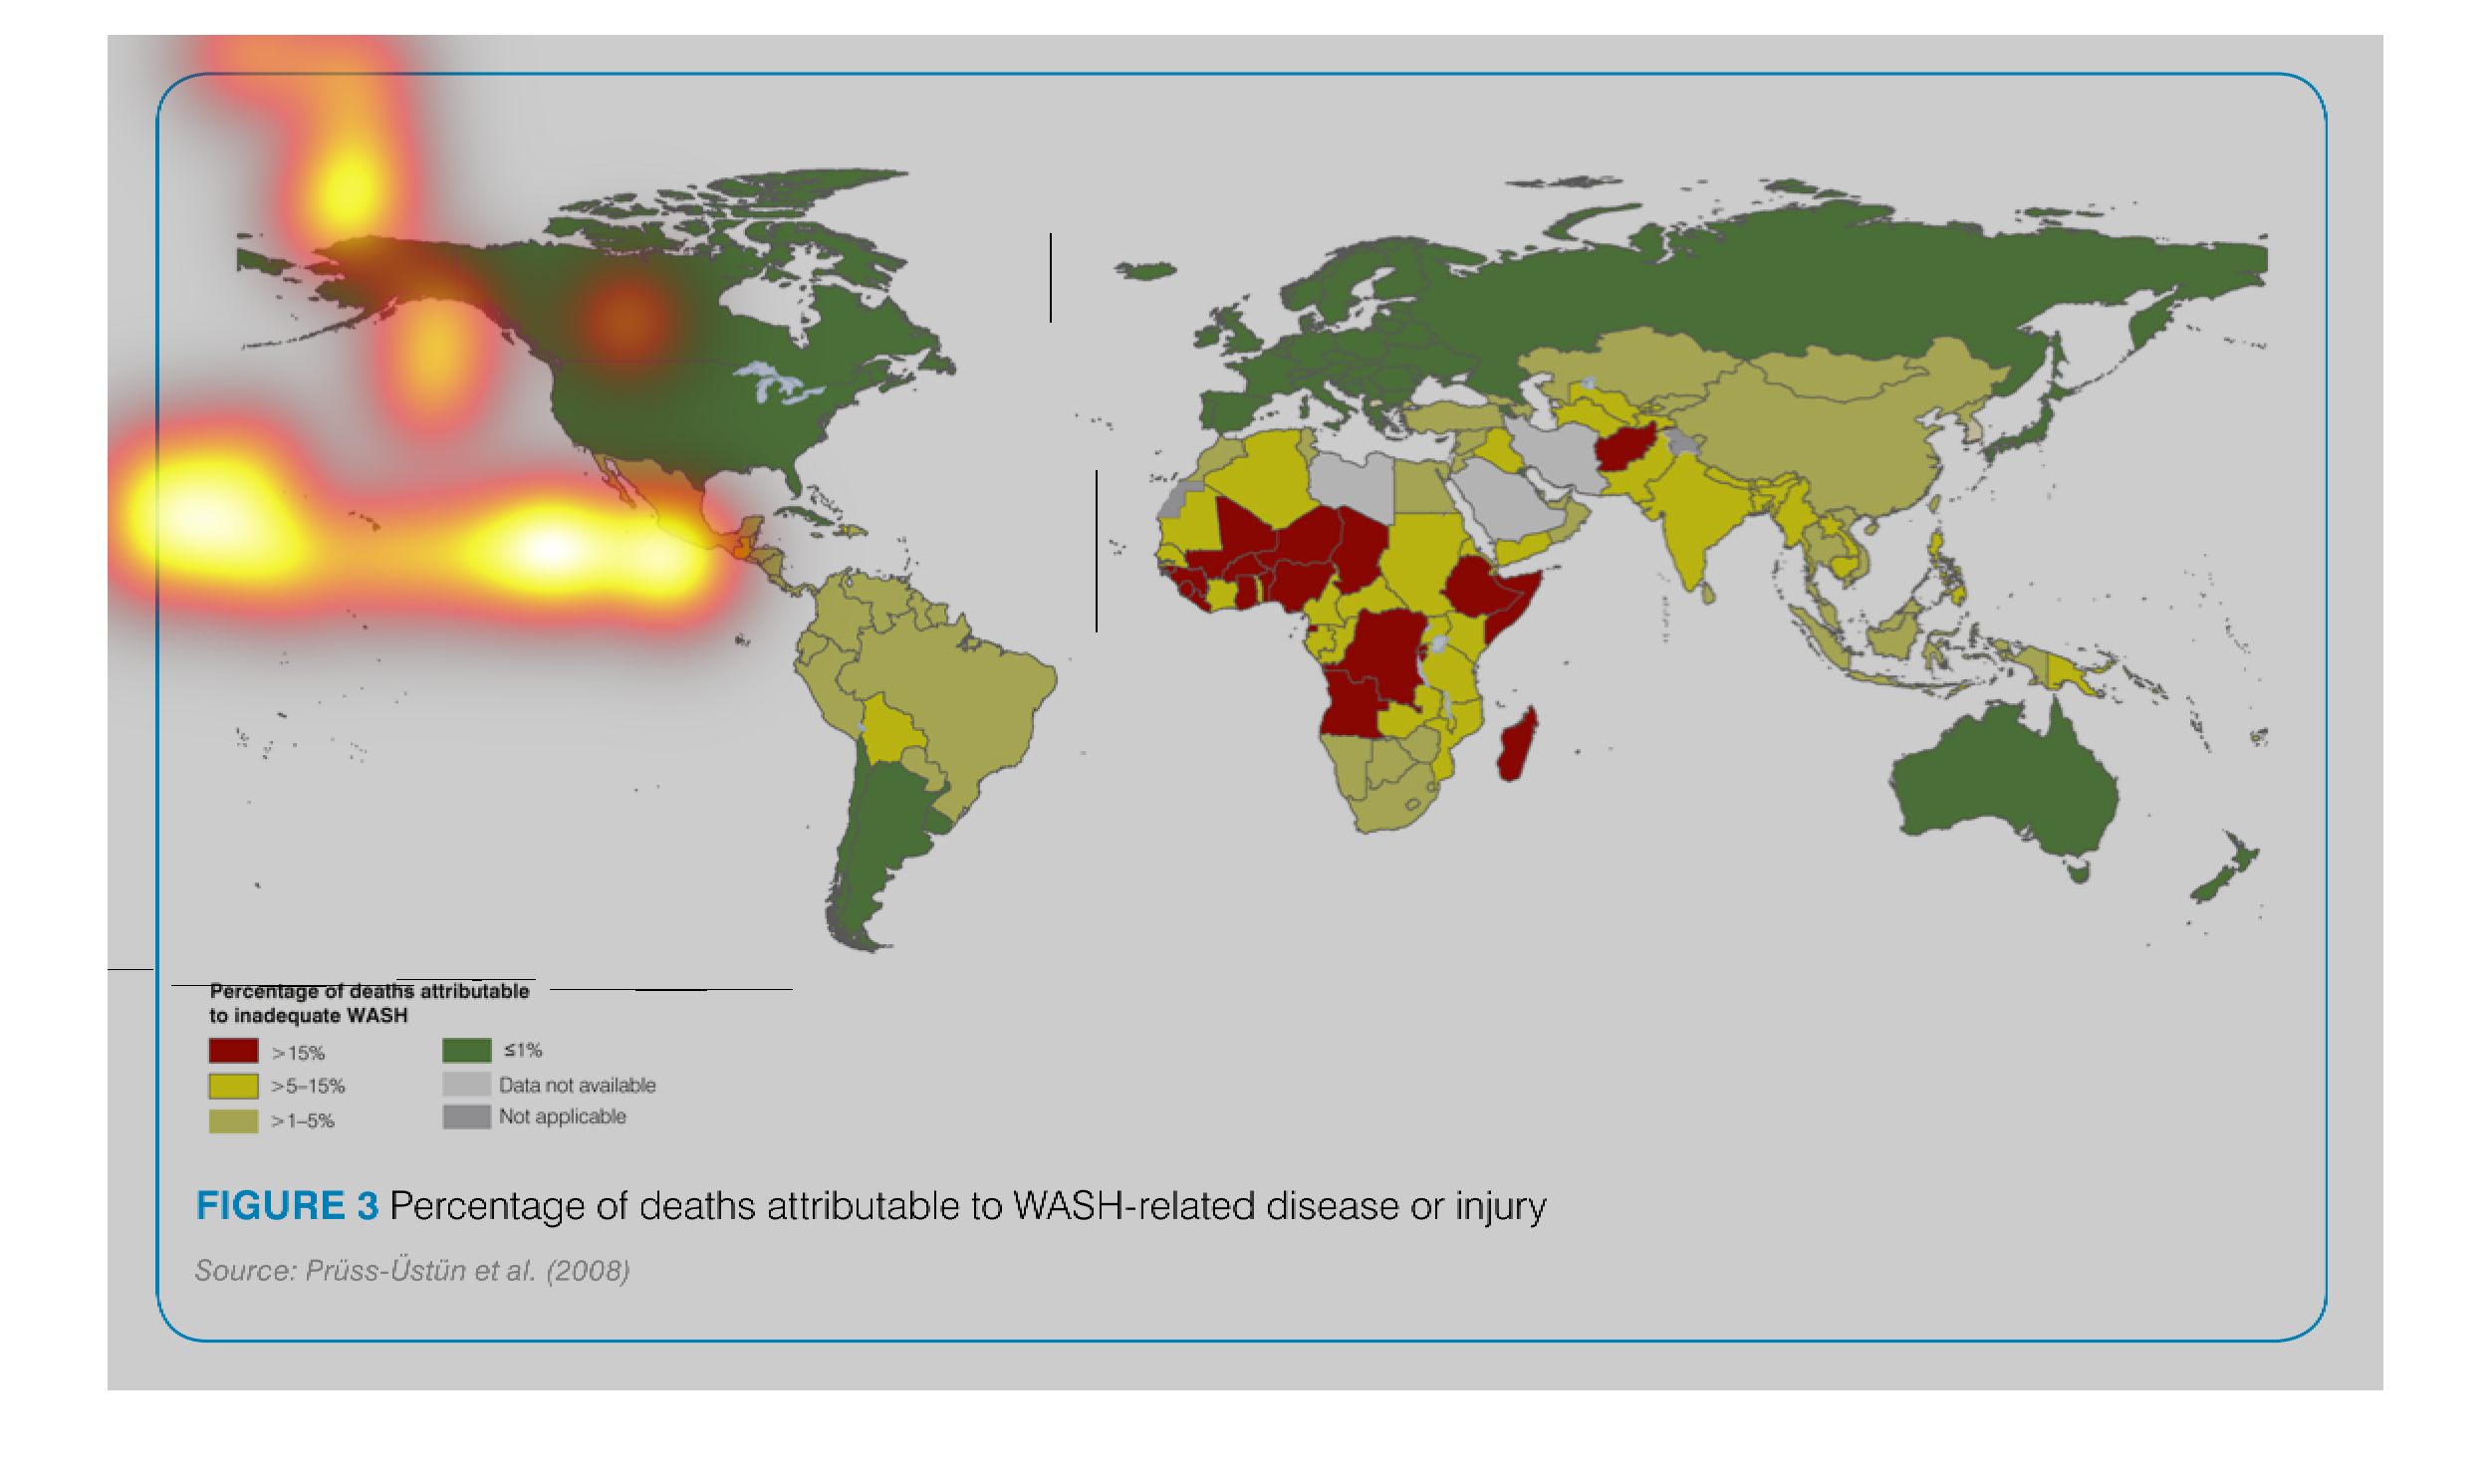
The following chart gives data by country of number of deaths attributed to WASH. It does
not define what WASH is, however countries in Africa had the highest occurrence of these deaths.

This figure shows the percentage of deaths due to WASH-related disease or injury, but does
not elaborate on what WASH stands for. The leading countries are located in Africa; Europe,
North America, and Russia are not prone to such diseases or injuries.

This chart depicts the percentage of deaths attributable to WASH-related disease or injury
around the world.  Central Africa has by far the highest incidence.
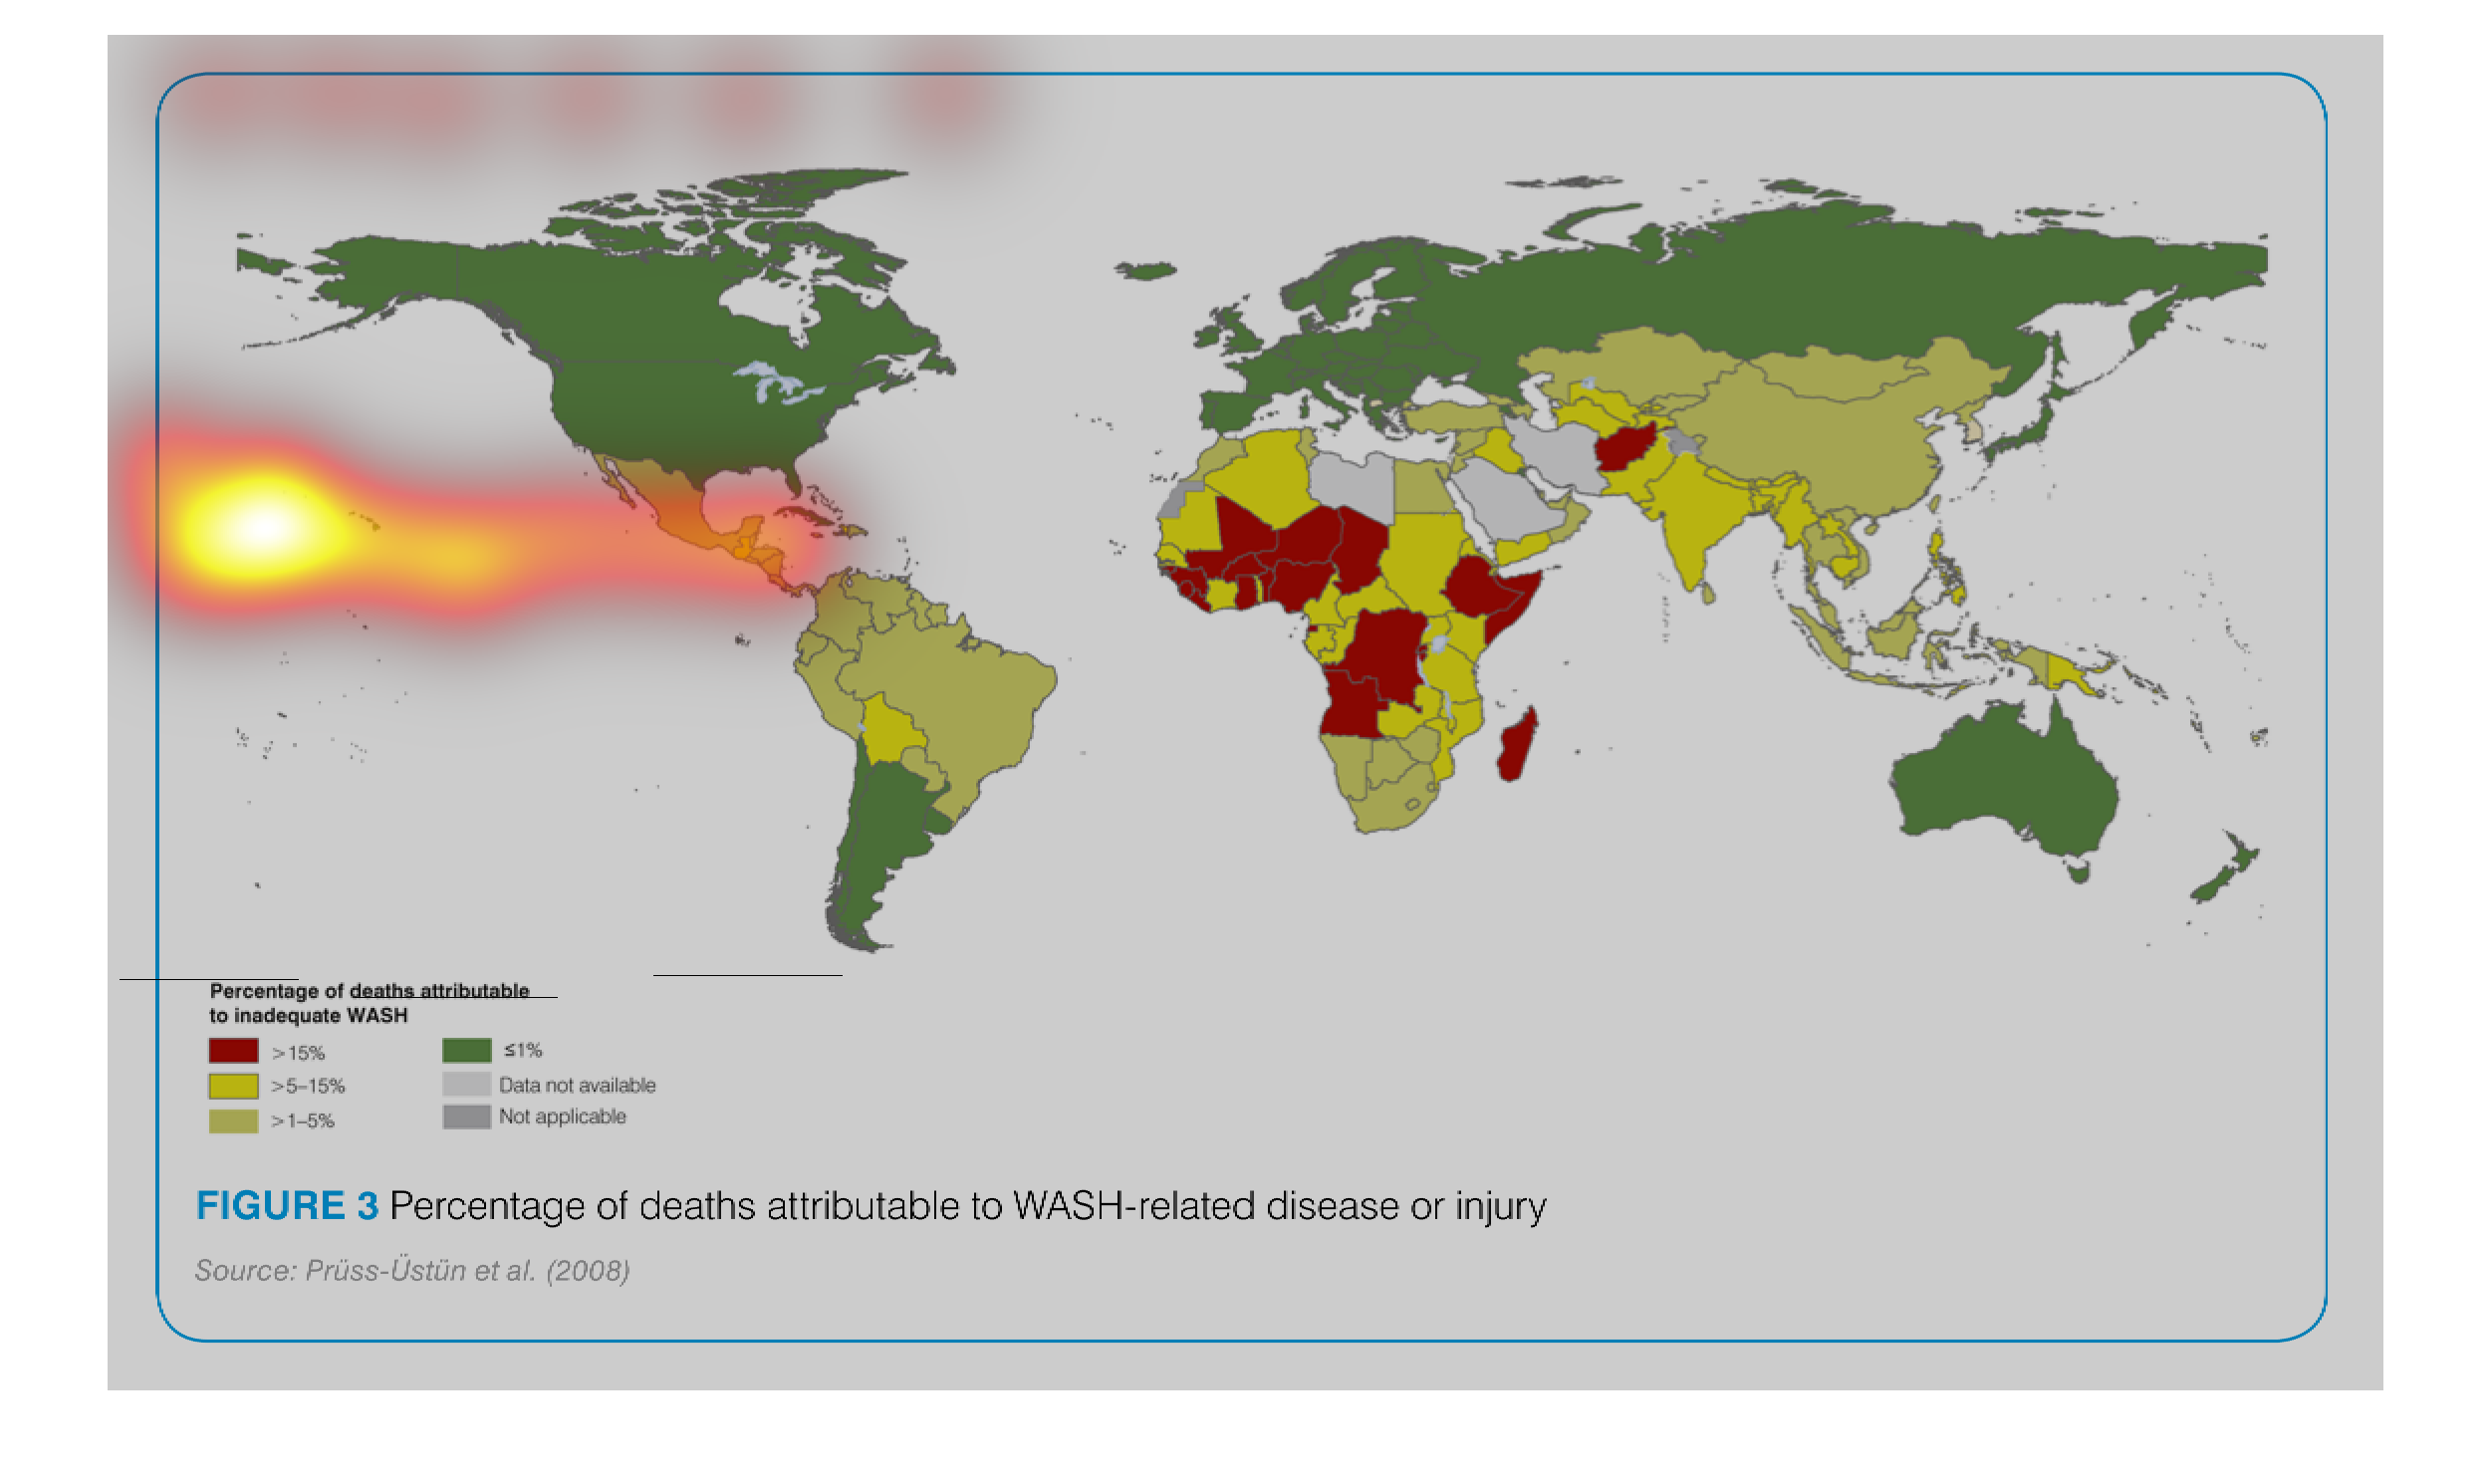
The figure presented is titled Percentage of deaths distribution to WASH related disease of
injury.  The figure is a representation of the WASH related disease.

This graphic shows a heat-map concentration of the numbers of WASH-related deaths or injury.
The more equatorial countries show a higher concentration of such deaths or injuries than
do the more northern/southern latitudes.


This is a graphic that shows the percentage of deaths related to WASH disease or injury. It
shows this information for all the continents that are affected.

Figure 3 shows number of deaths attributed to WASH related disease or injury. Multiple colors
are used to highlight the map graph.The highest number of deaths are shown in Africa.
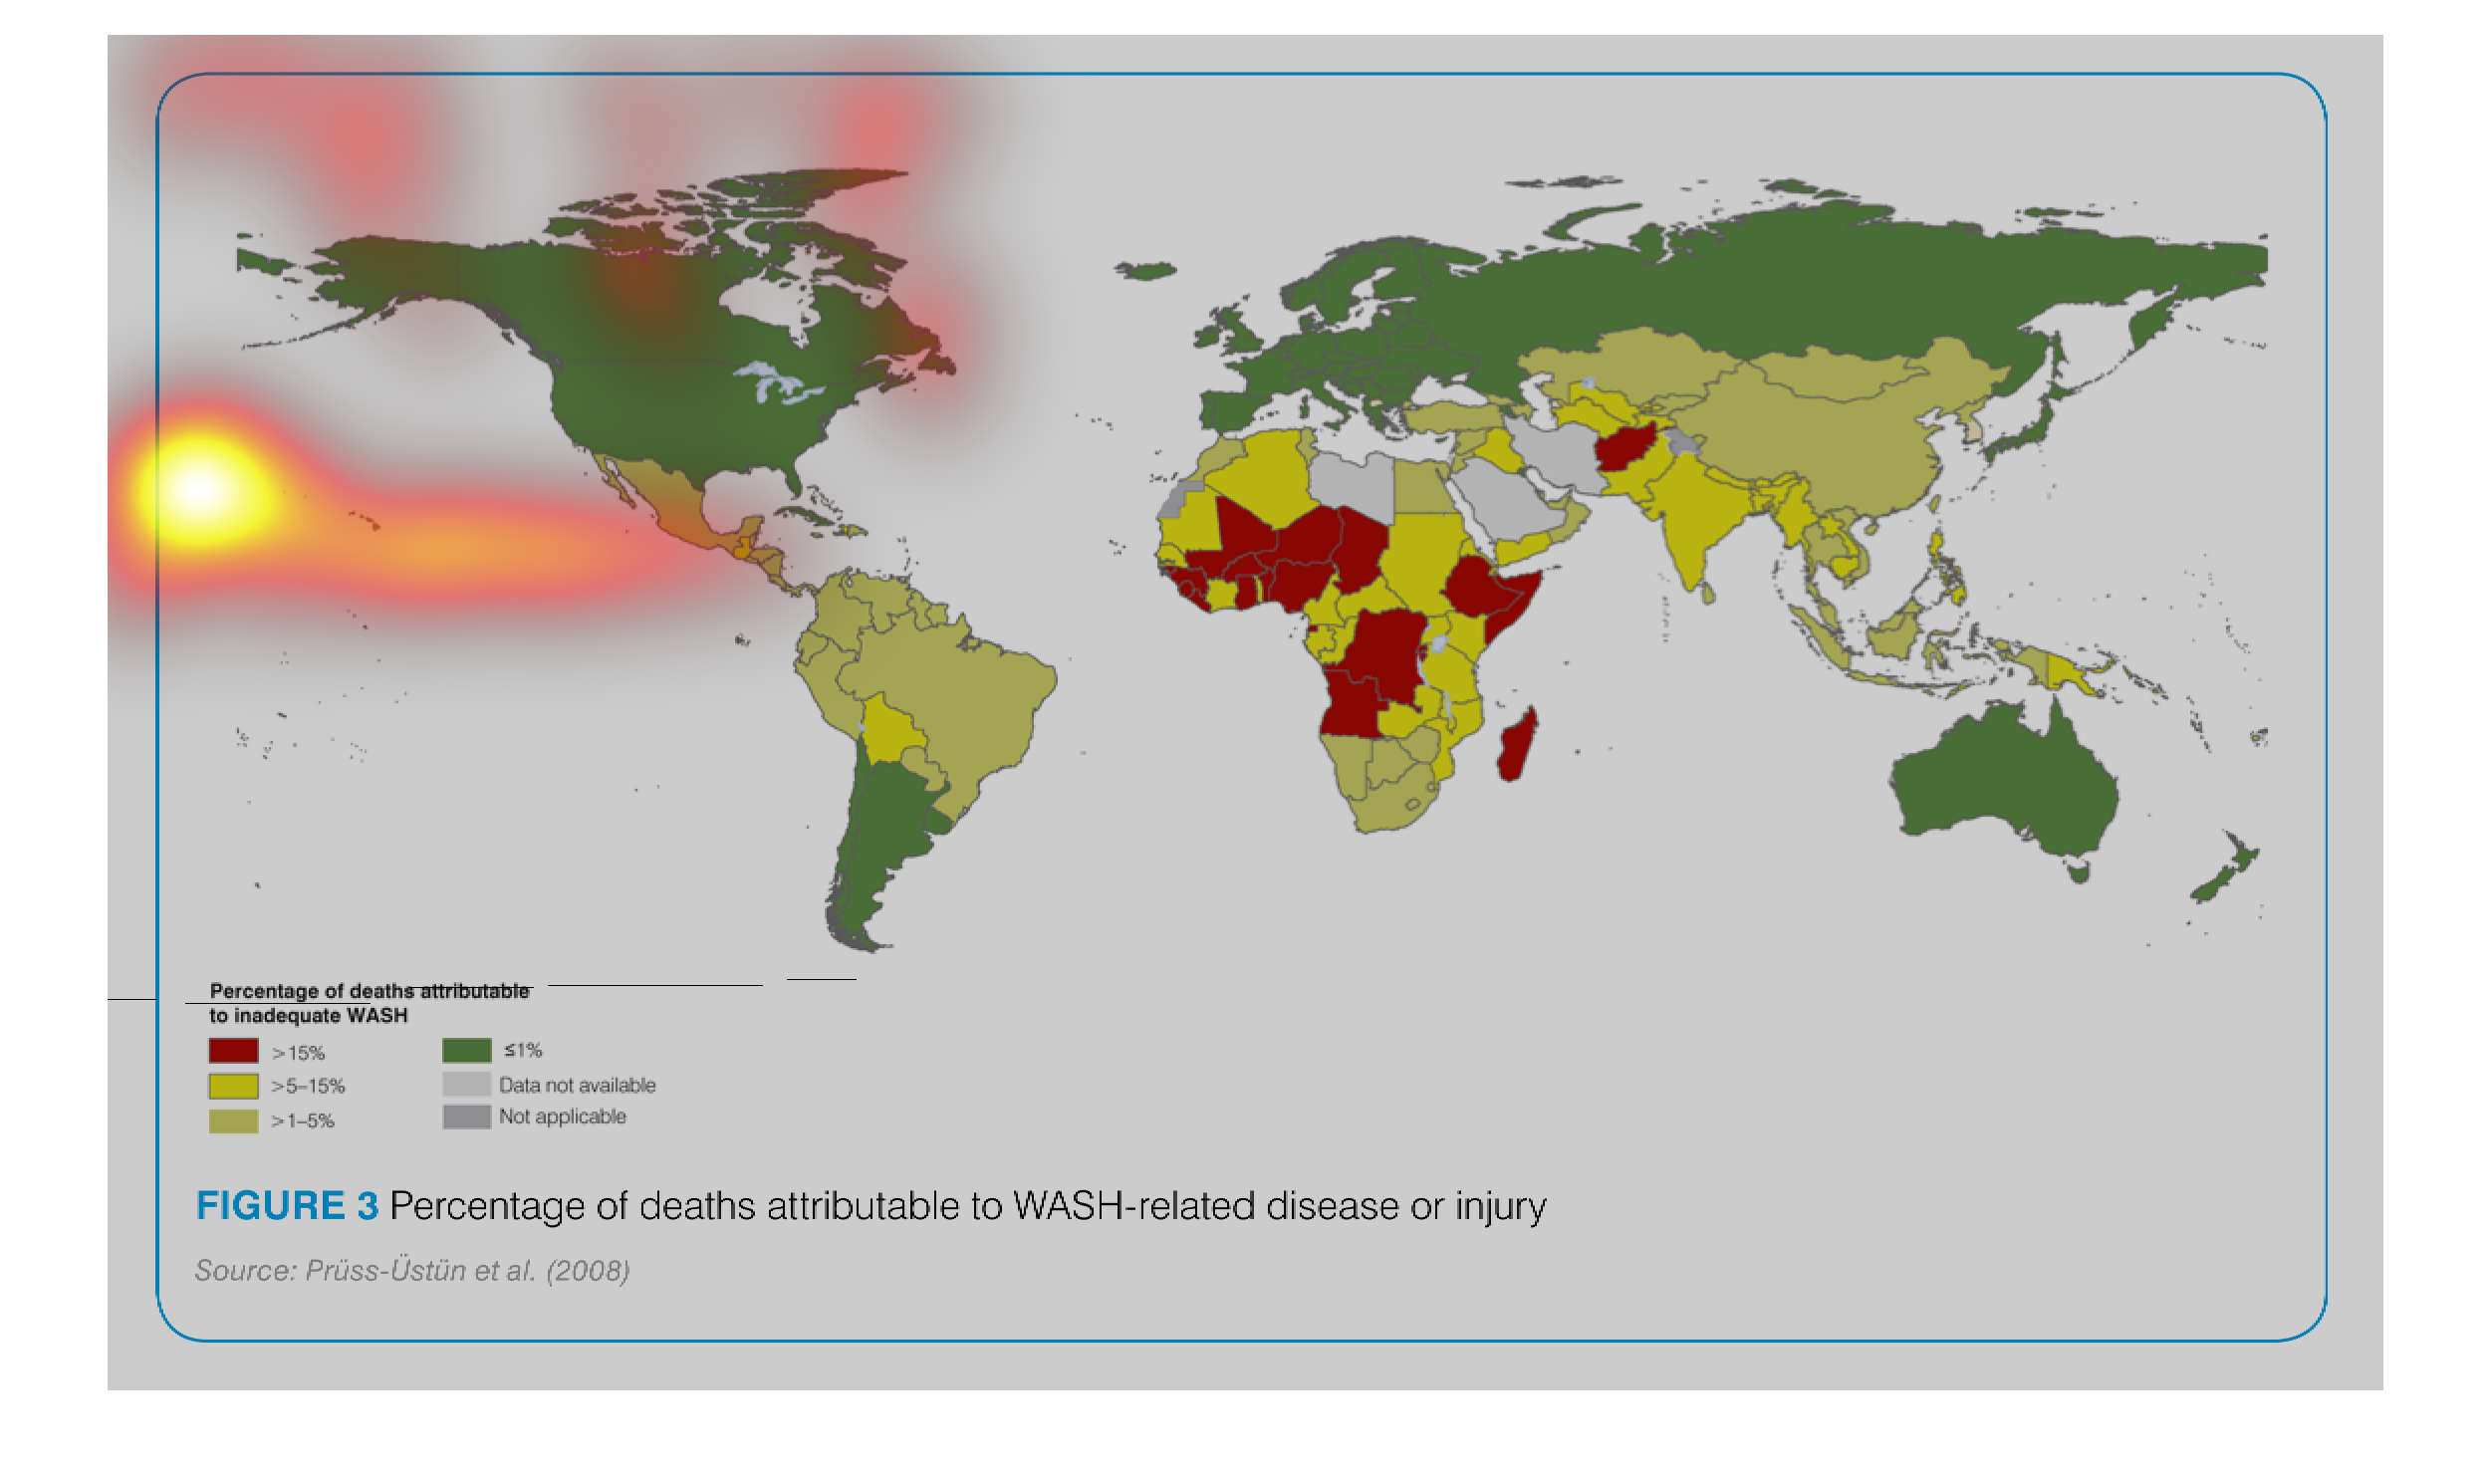
This image shows the percentage of deaths attributed to WASH related disease or injury.  The
highest percentage appears to be in African countries with a small area in the Middle East.
 The countries that seem to be the least affected are North America, Russia, and Australia.
This image or figure shows in statistical Worldwide Geographical format percentage of deaths
attributable to WASH related diseases or injury. Africa seems to have the highest percentages
overall.

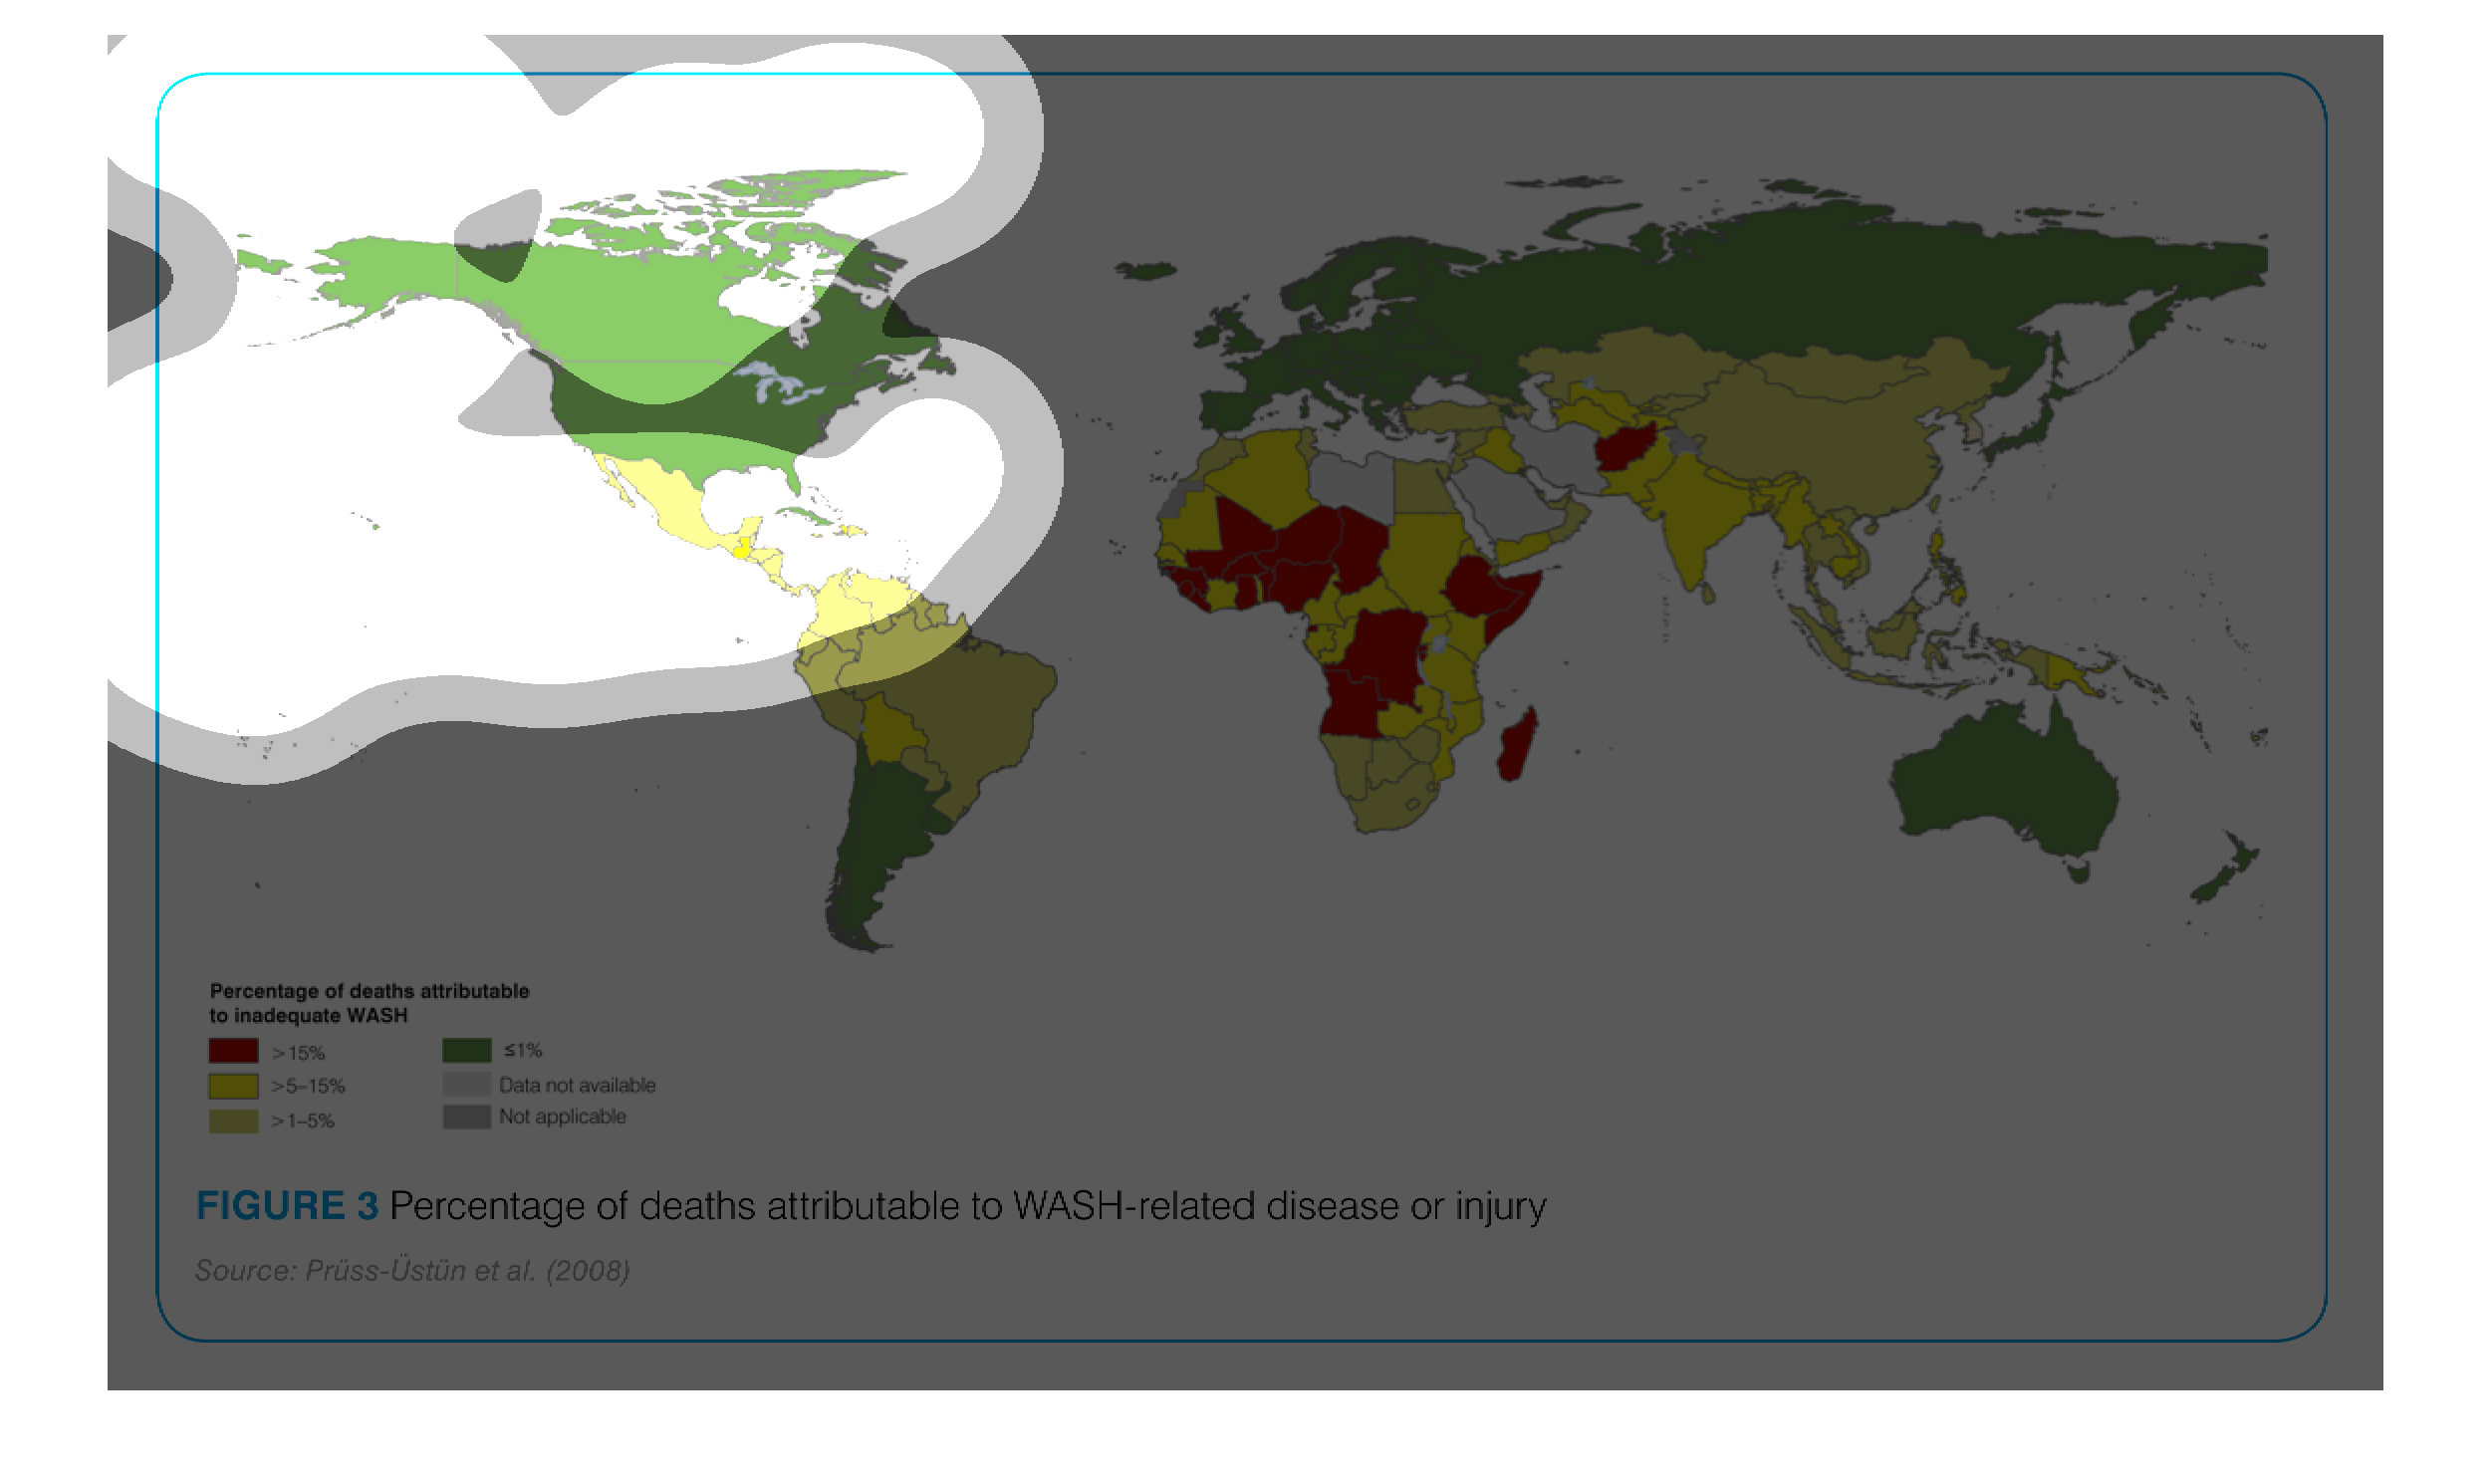
This chart describes the percentage of WASH related diseases or injury globally.  The country
with the most significant rates is Africa. Higher rates also occurred in South Asia and South
America.


This chart describes the percentage of deaths attributable to WASH-related disease or injury.
Different percentages on the chart are represented by different colors.

