Warning: Image is too big to fit on screen; displaying at 50%
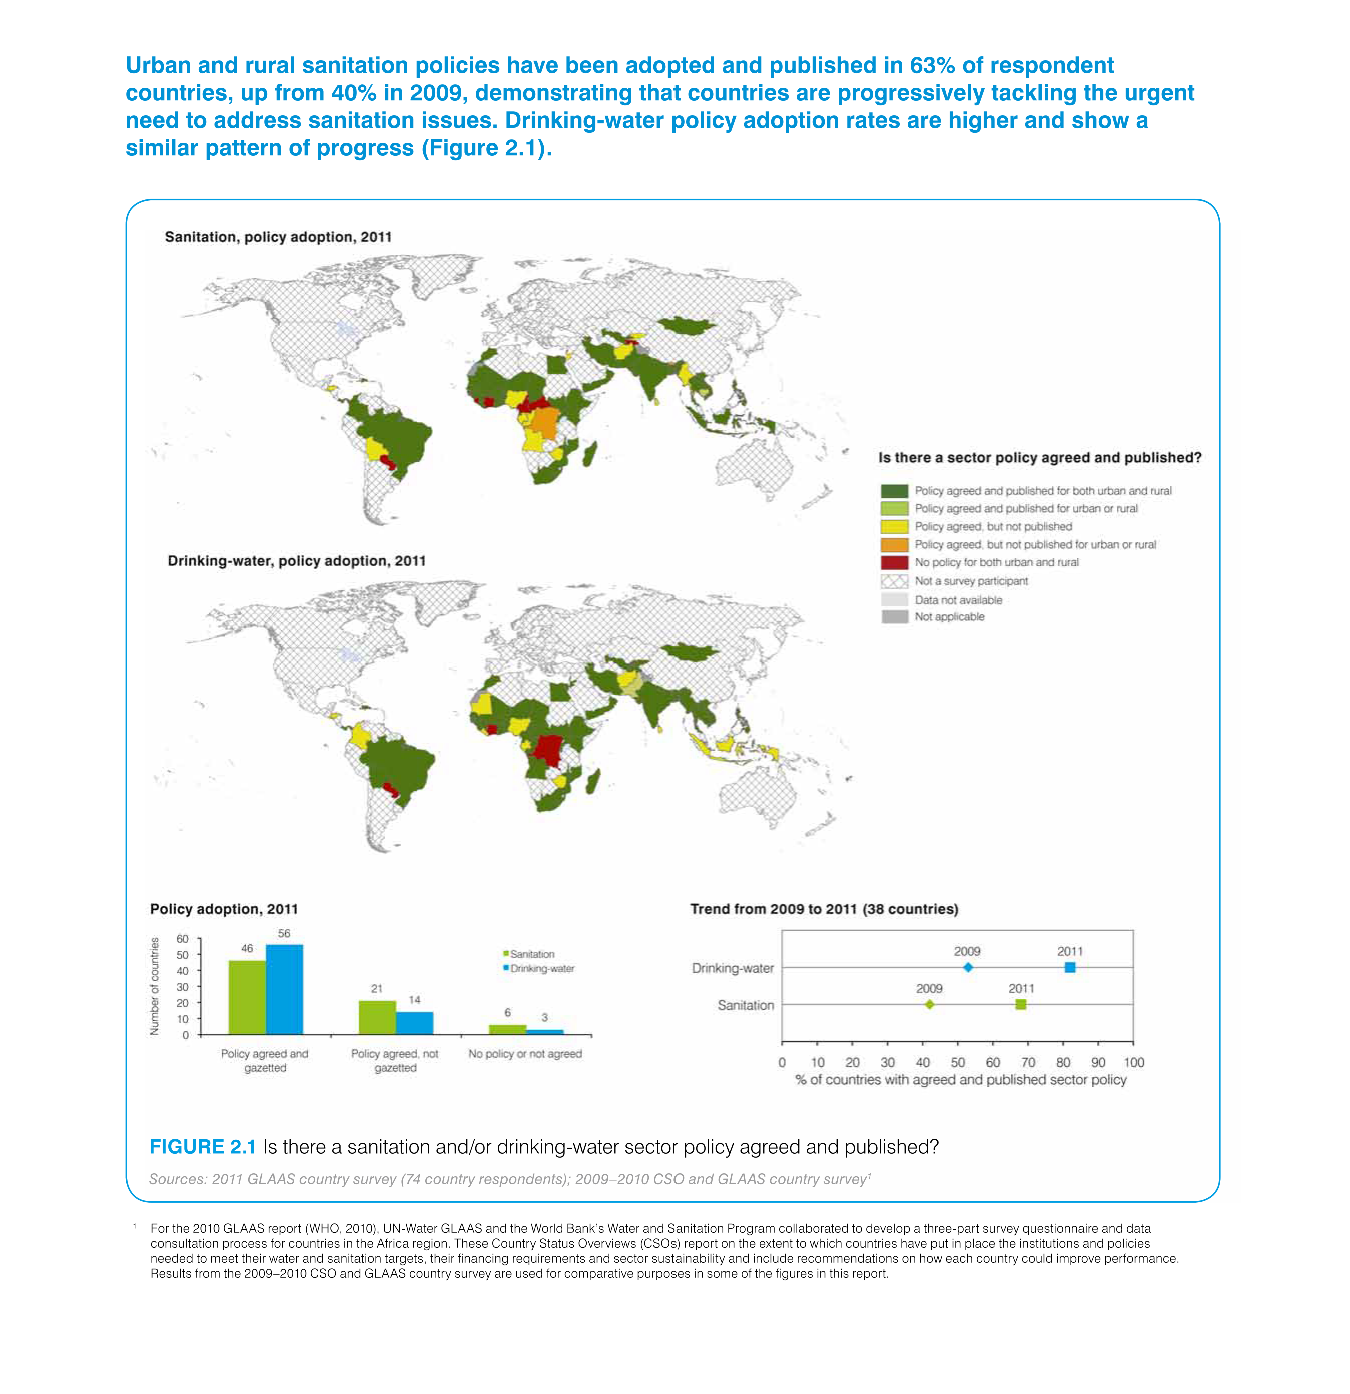
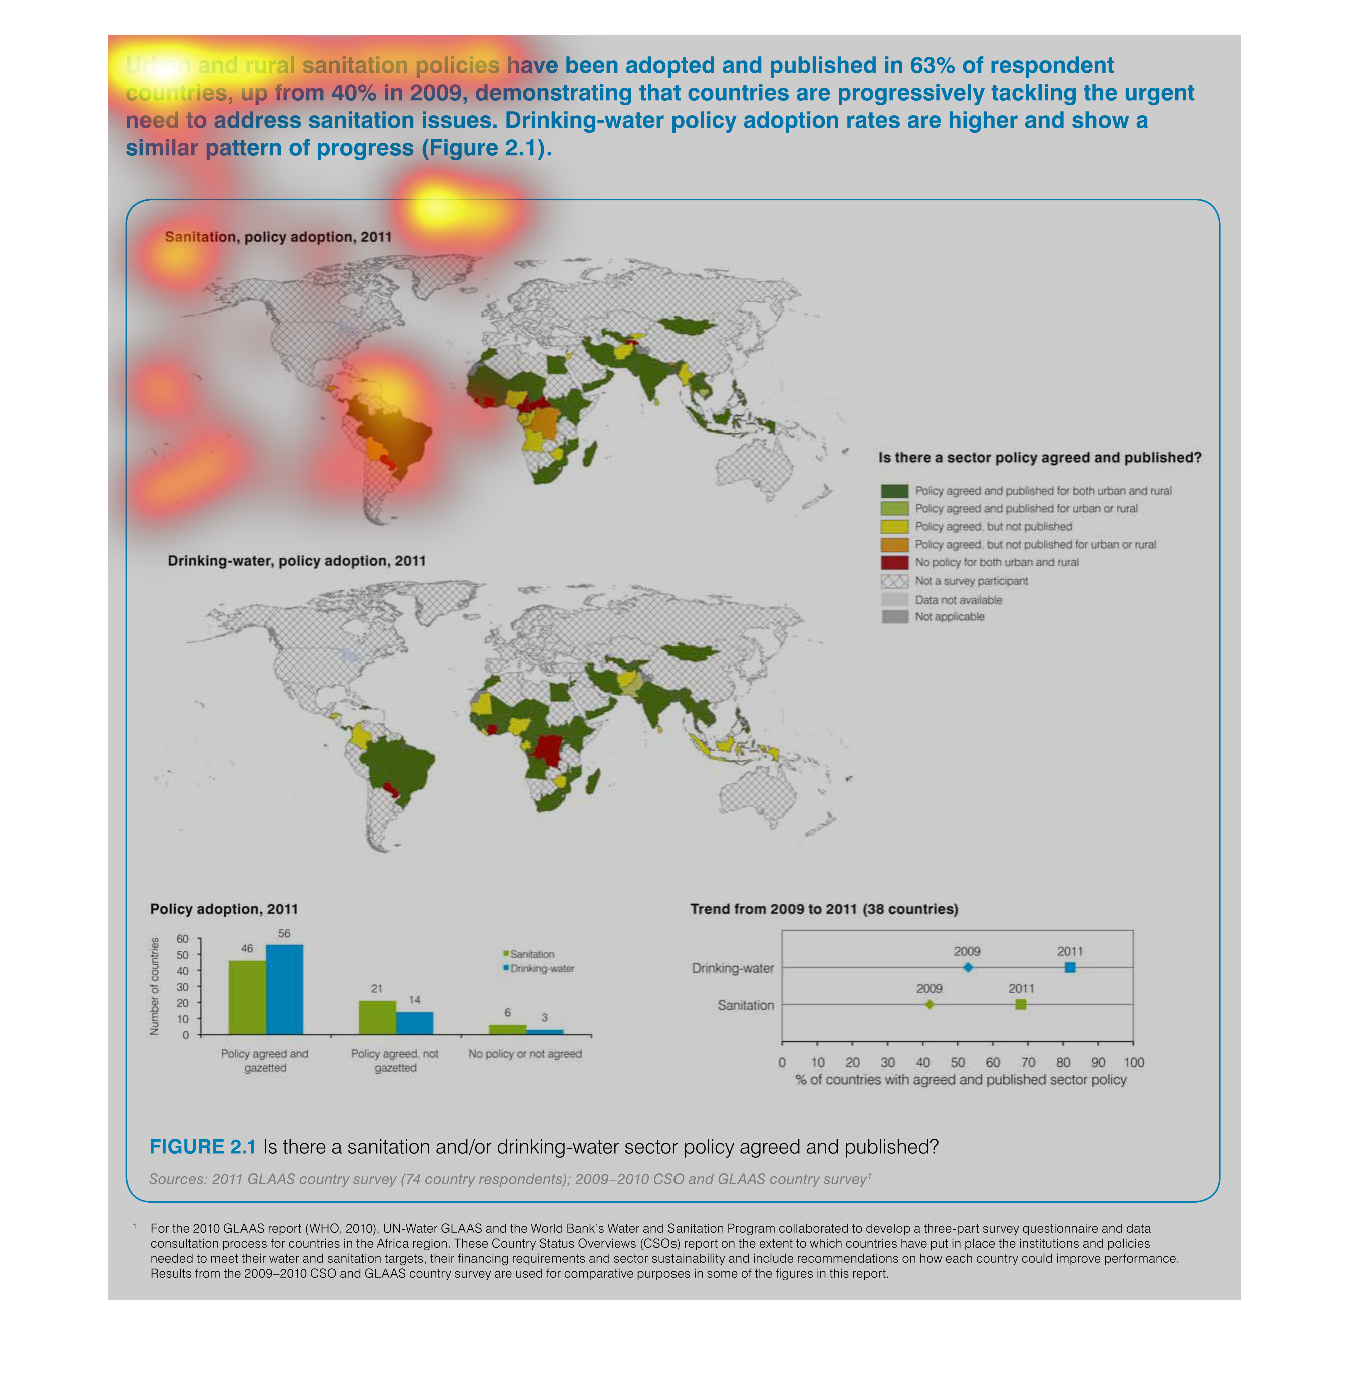
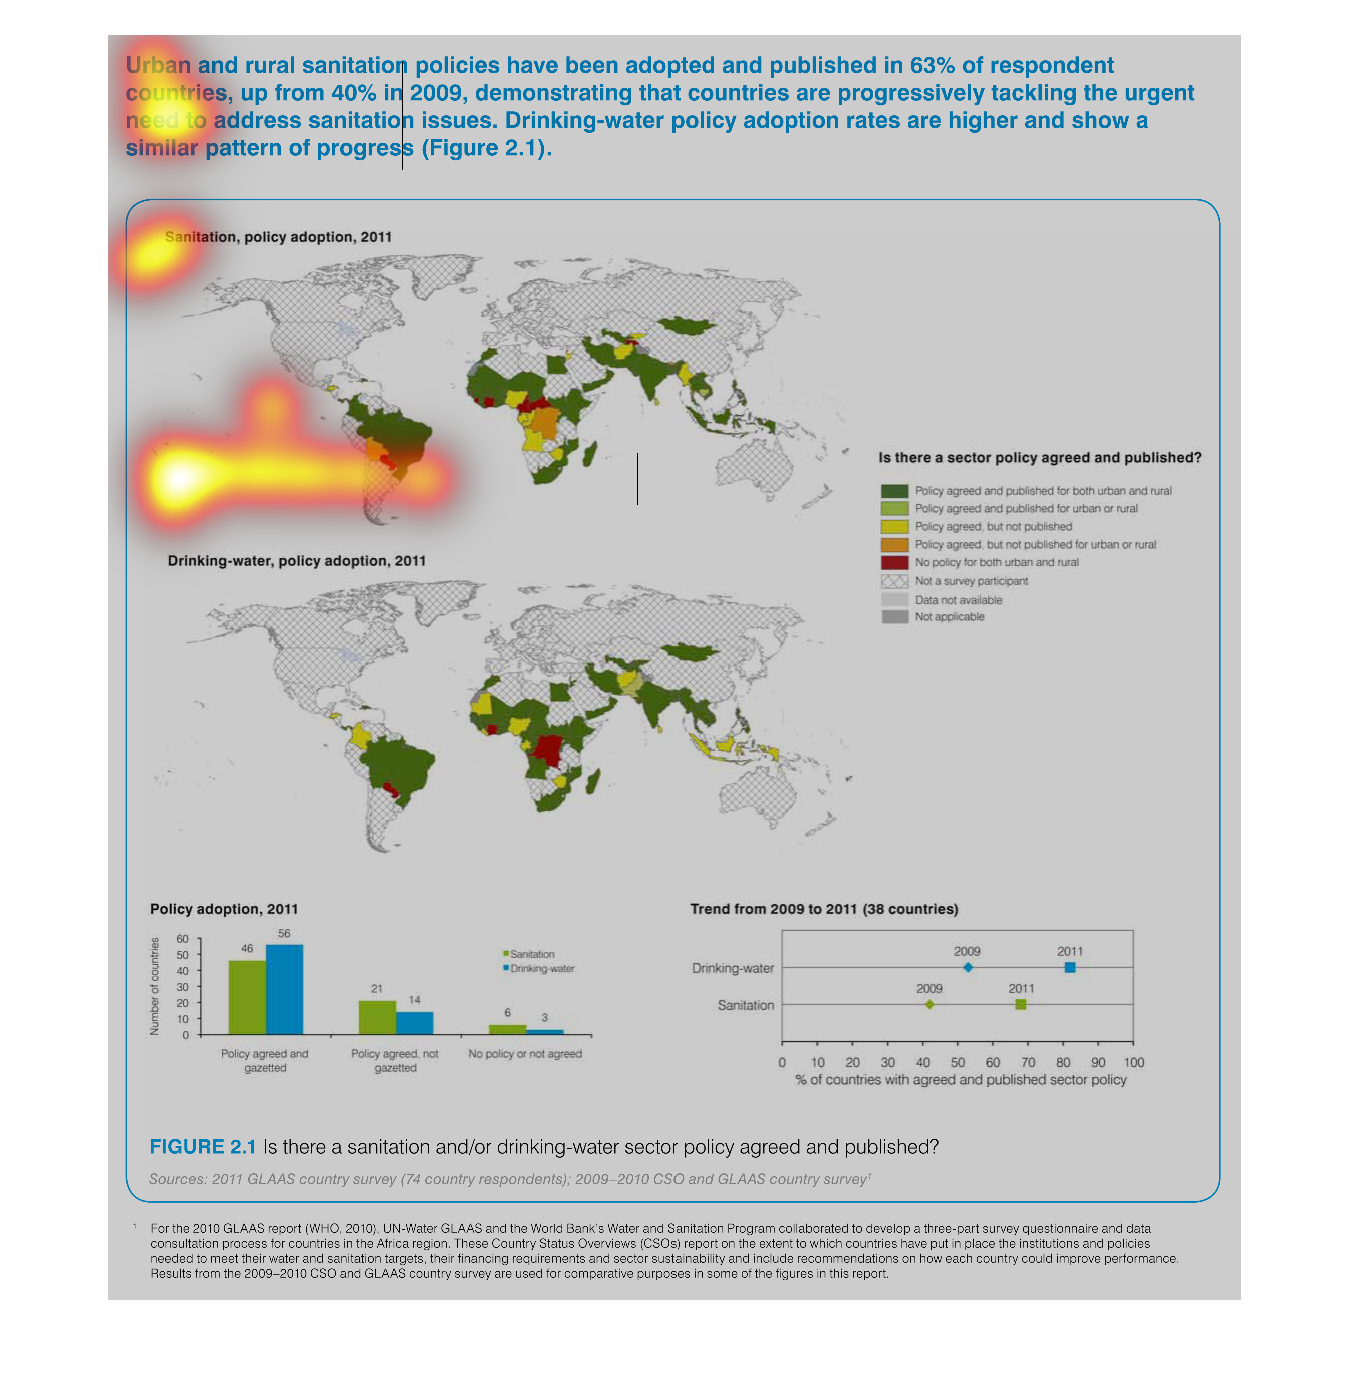
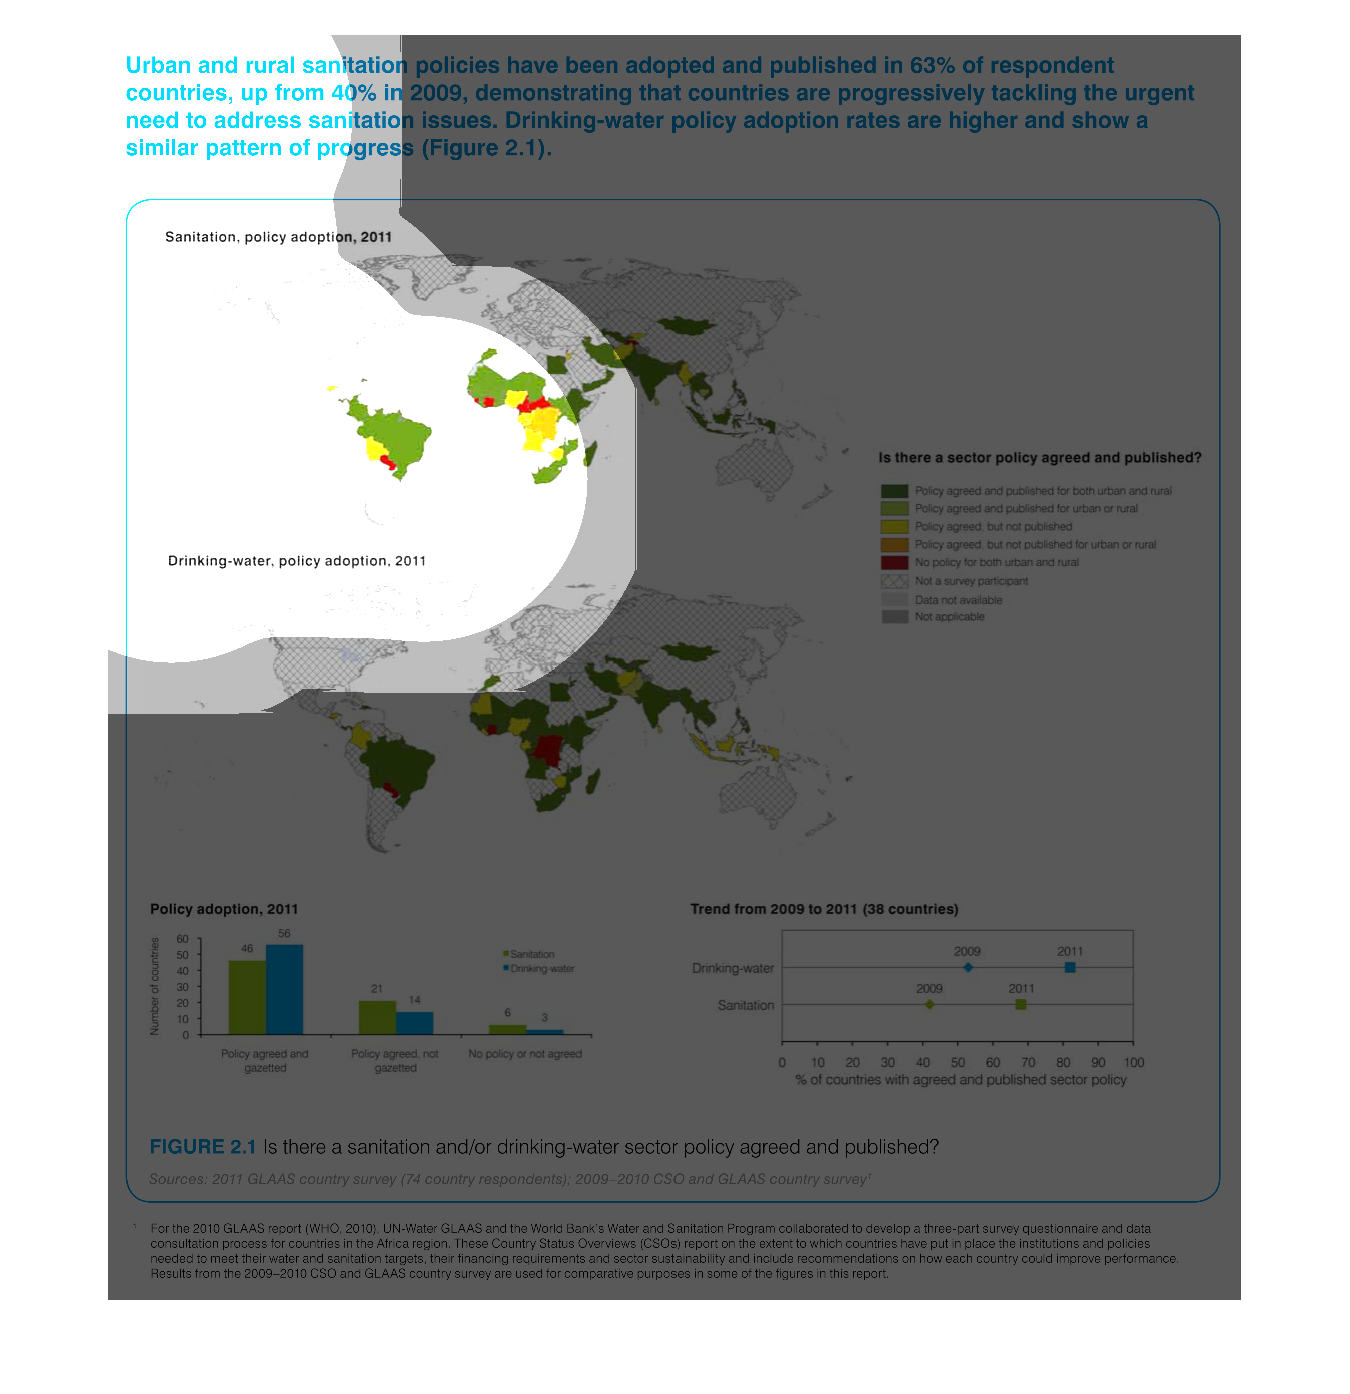
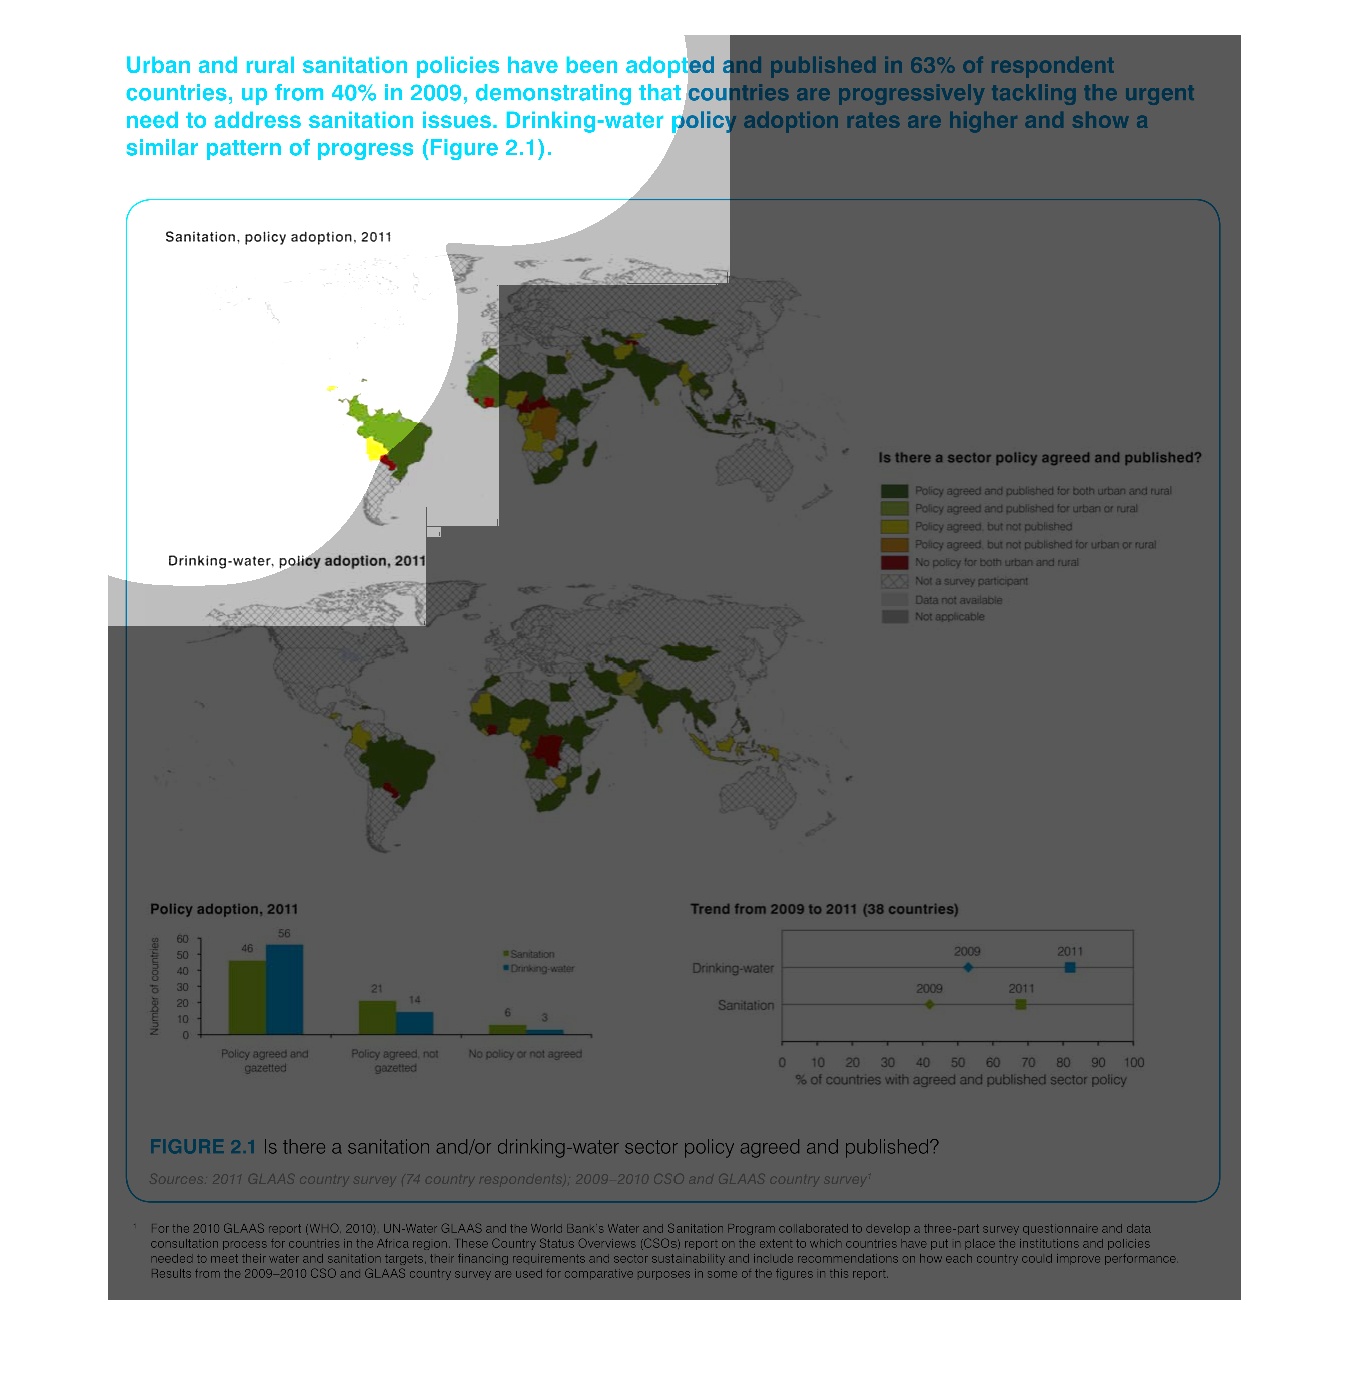
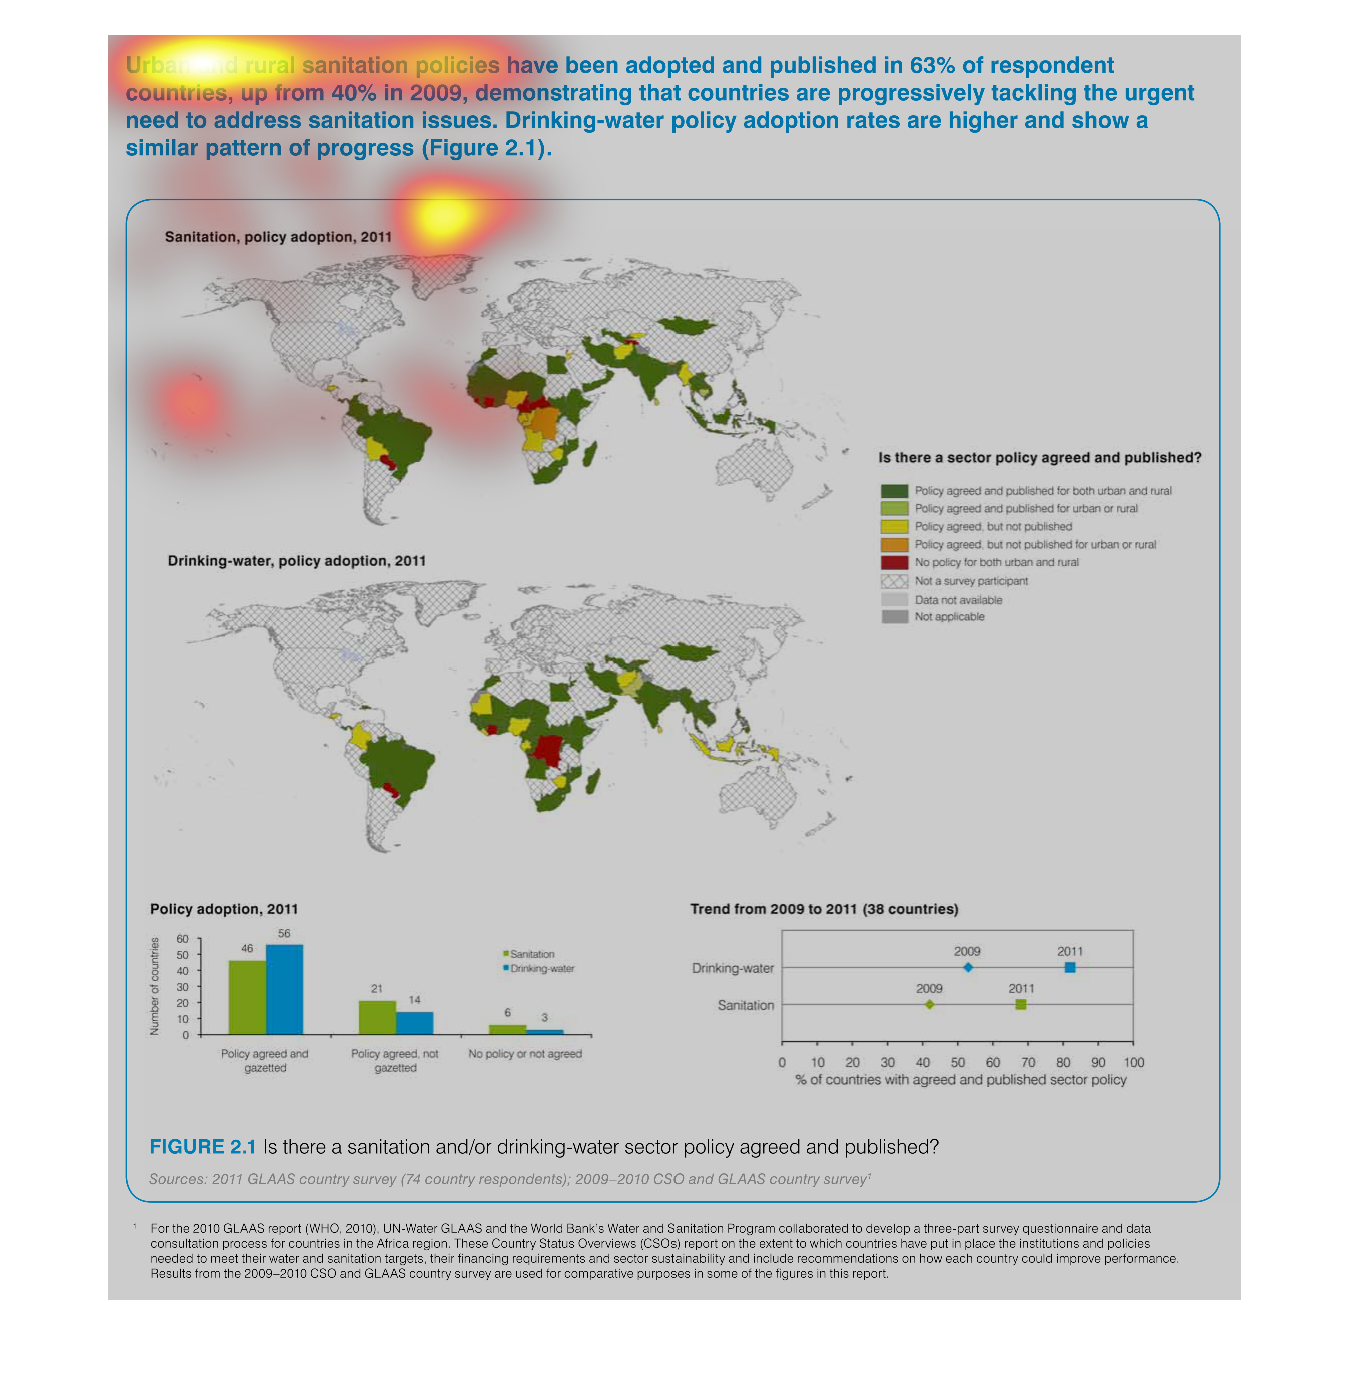
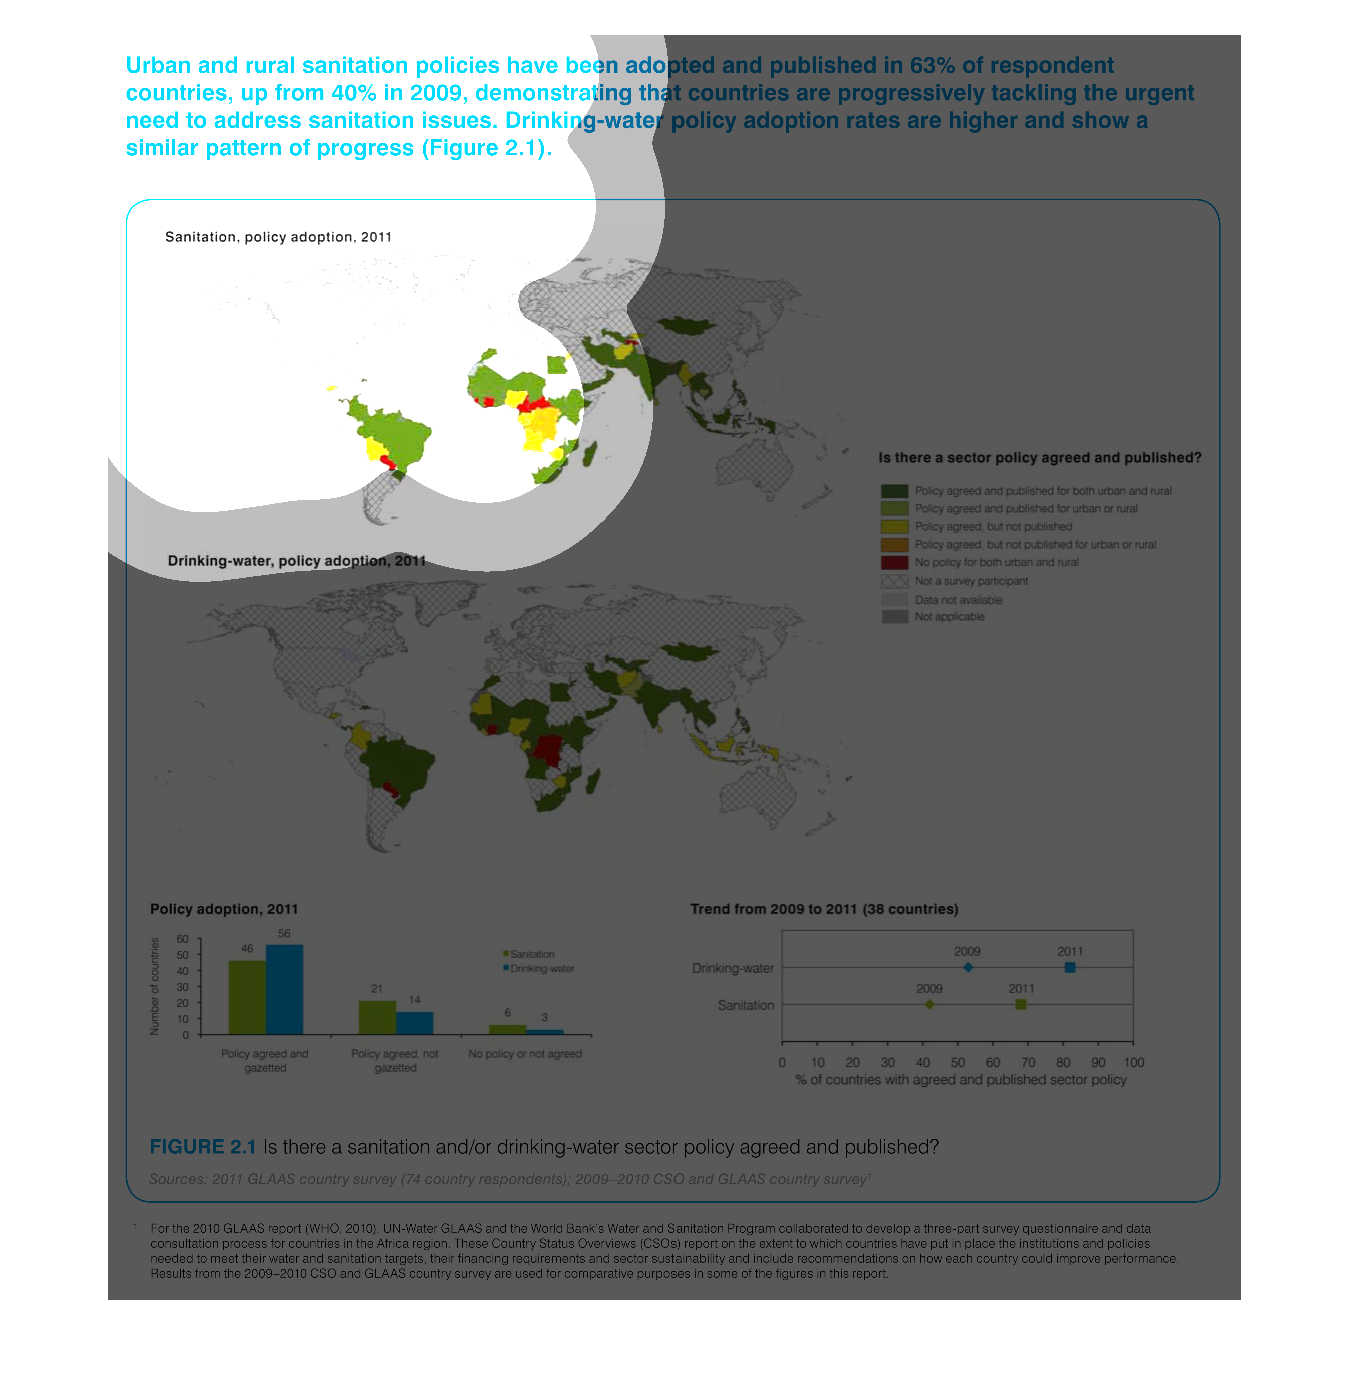
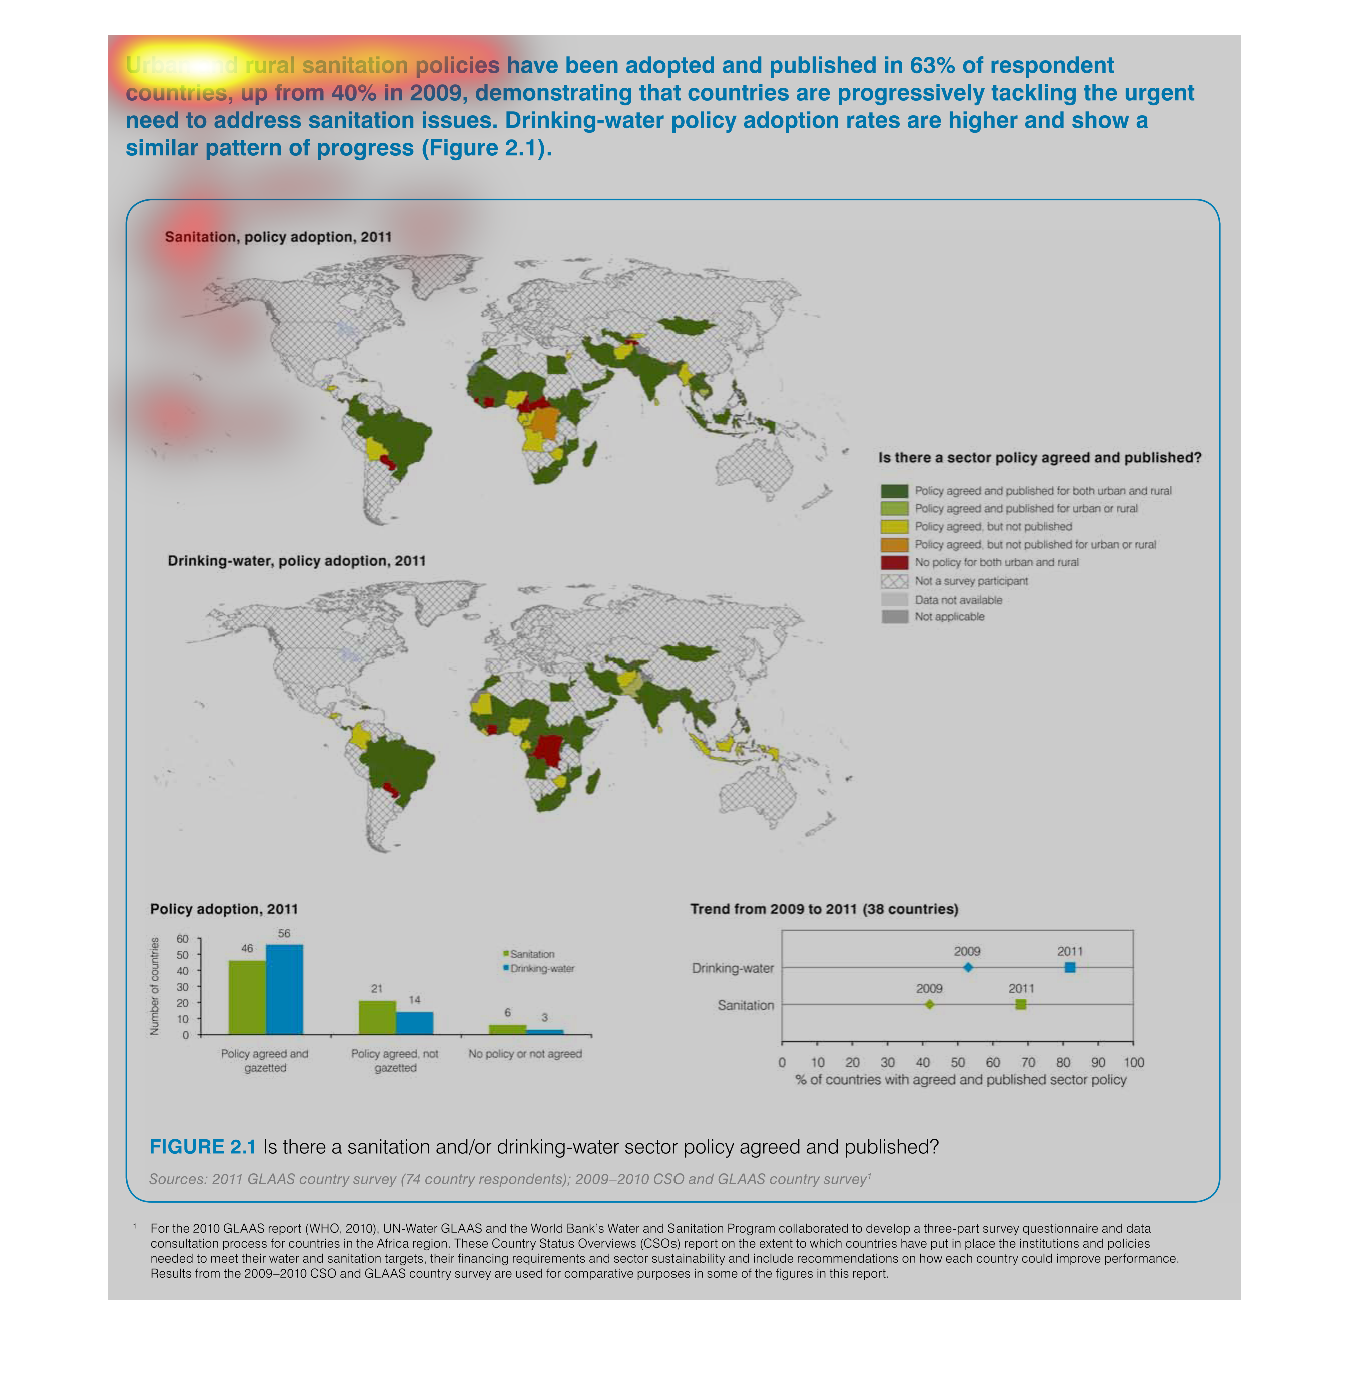
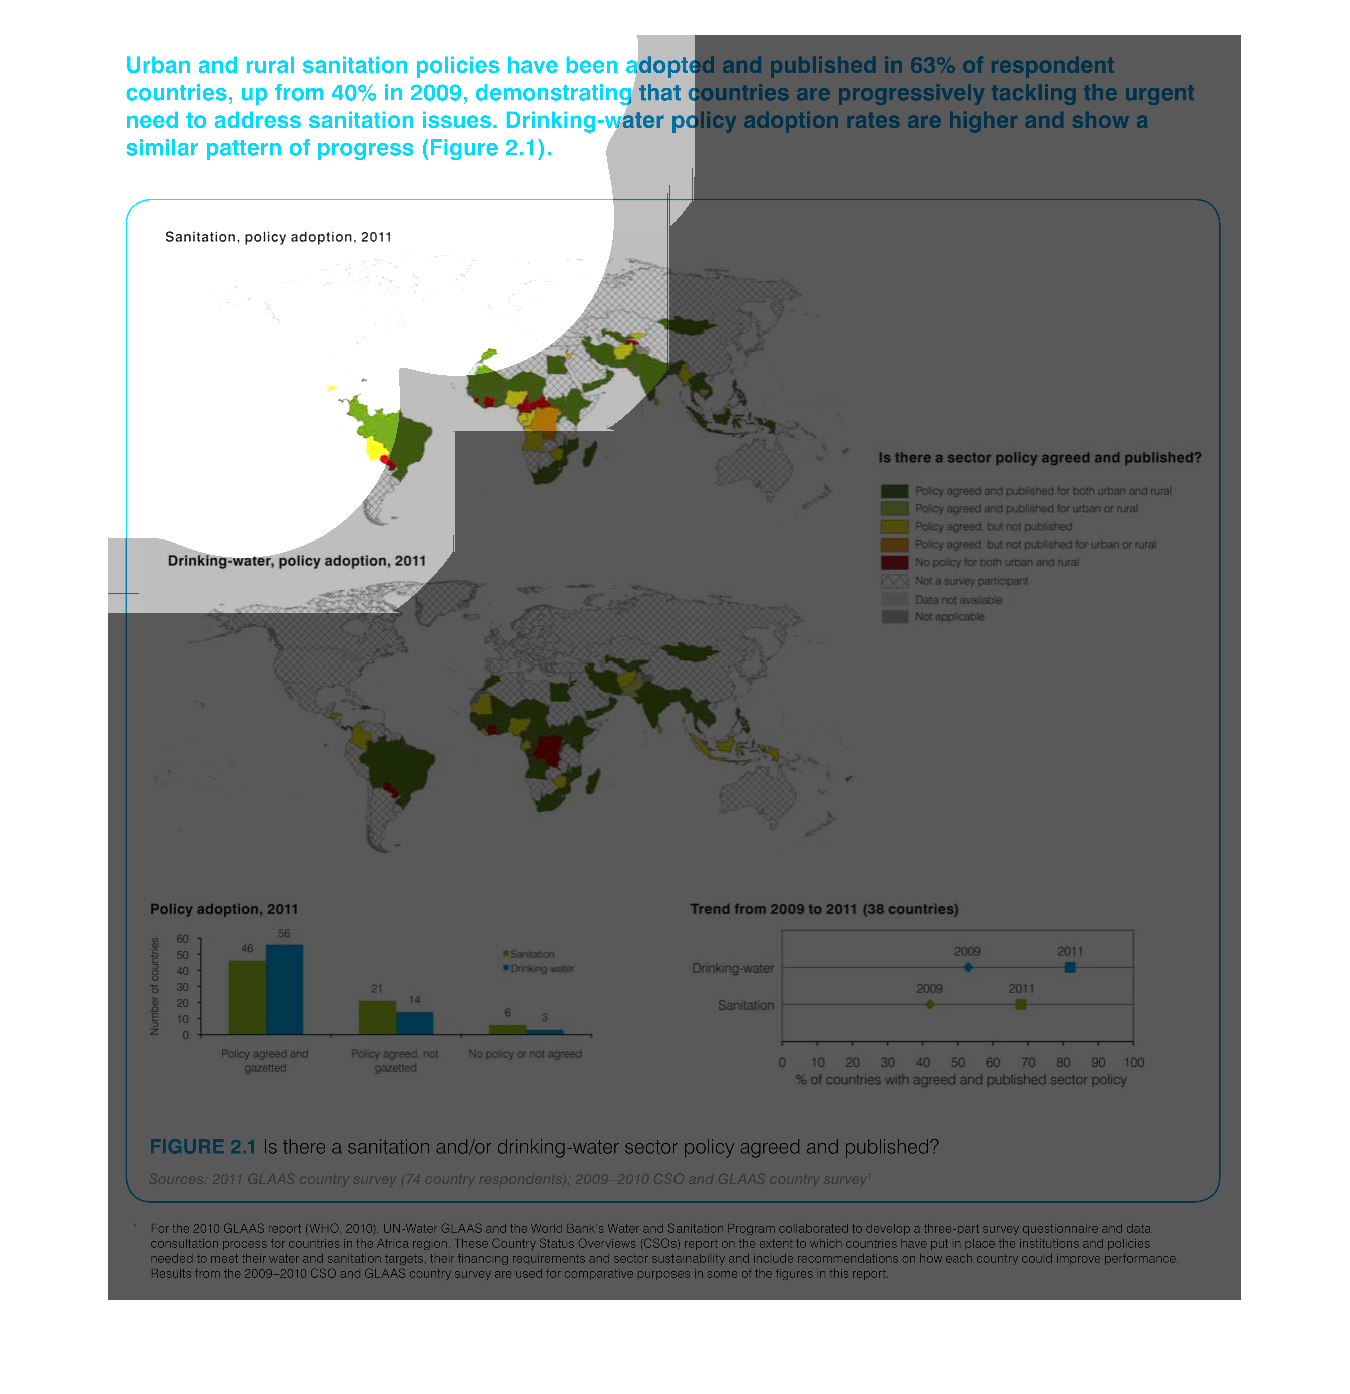
This is a regional map that illustrates whether there is  a sanitation or drinking water policy.
 The upper map shows whether there is a current sanitation policy and the bottom shows whether
there is a current drinking water policy.
Warning: Image is too big to fit on screen; displaying at 50%
Warning: Image is too big to fit on screen; displaying at 50%
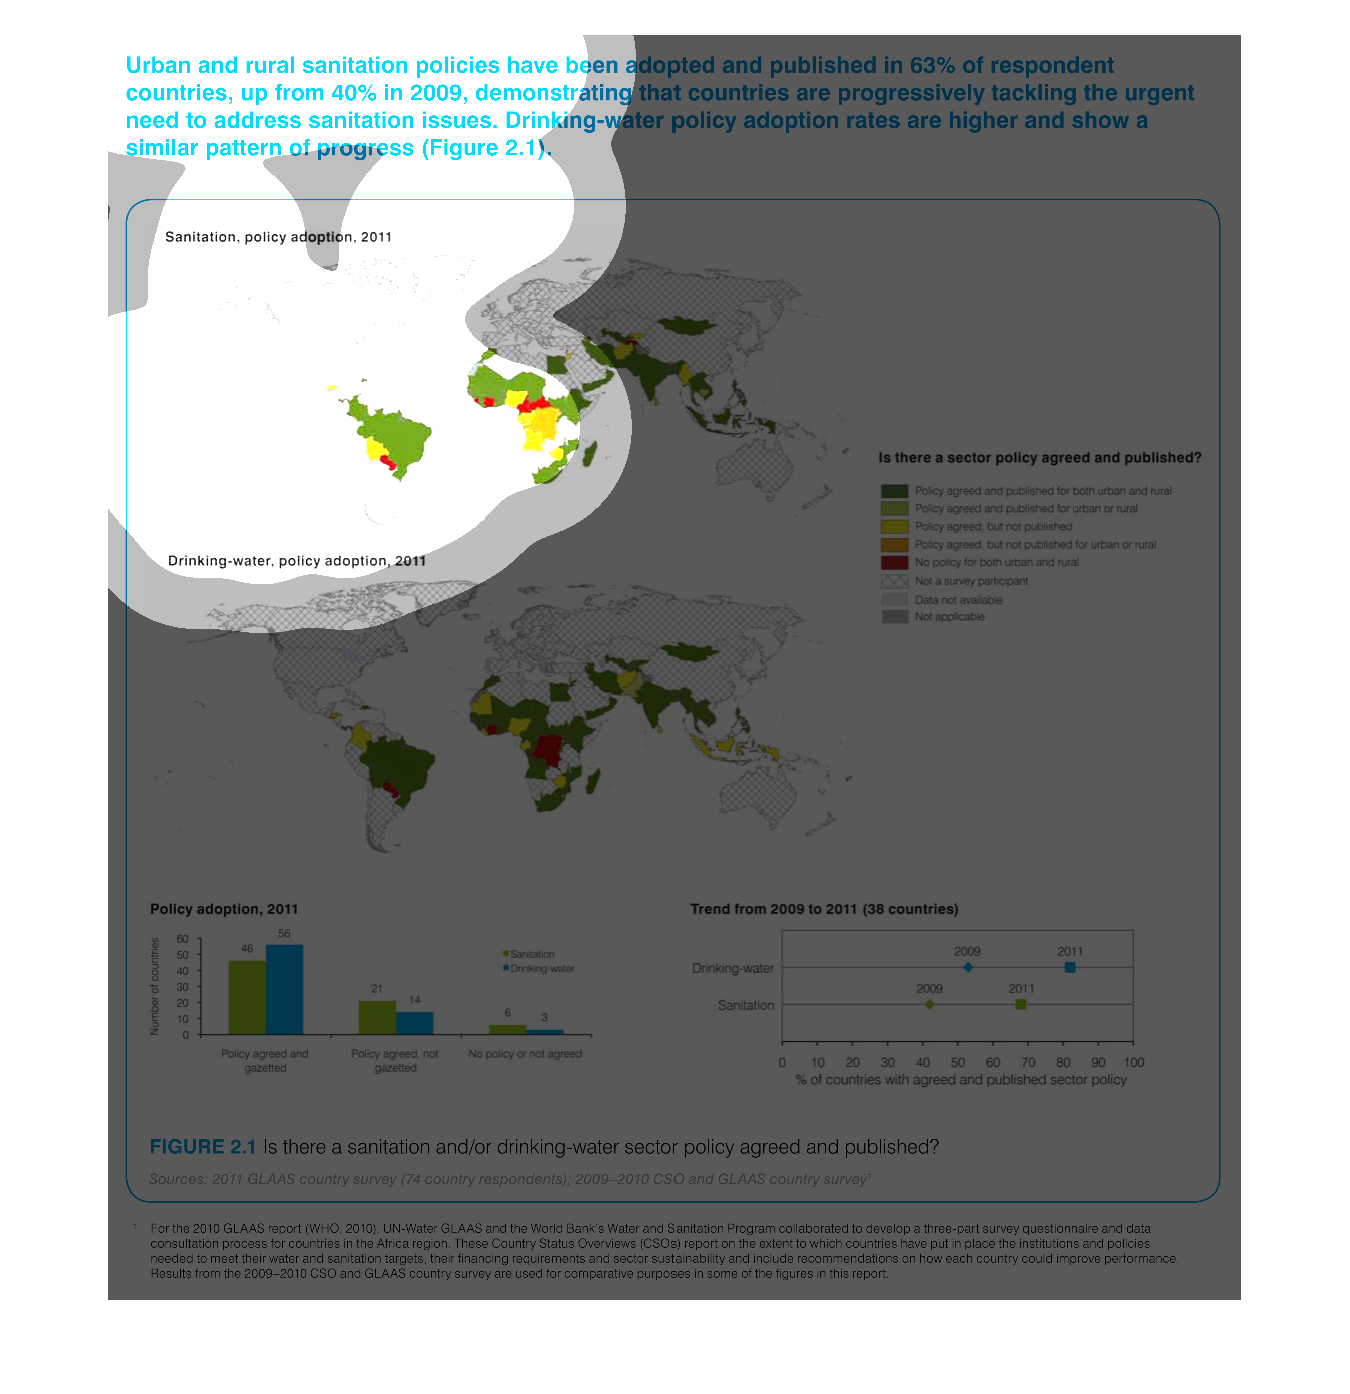
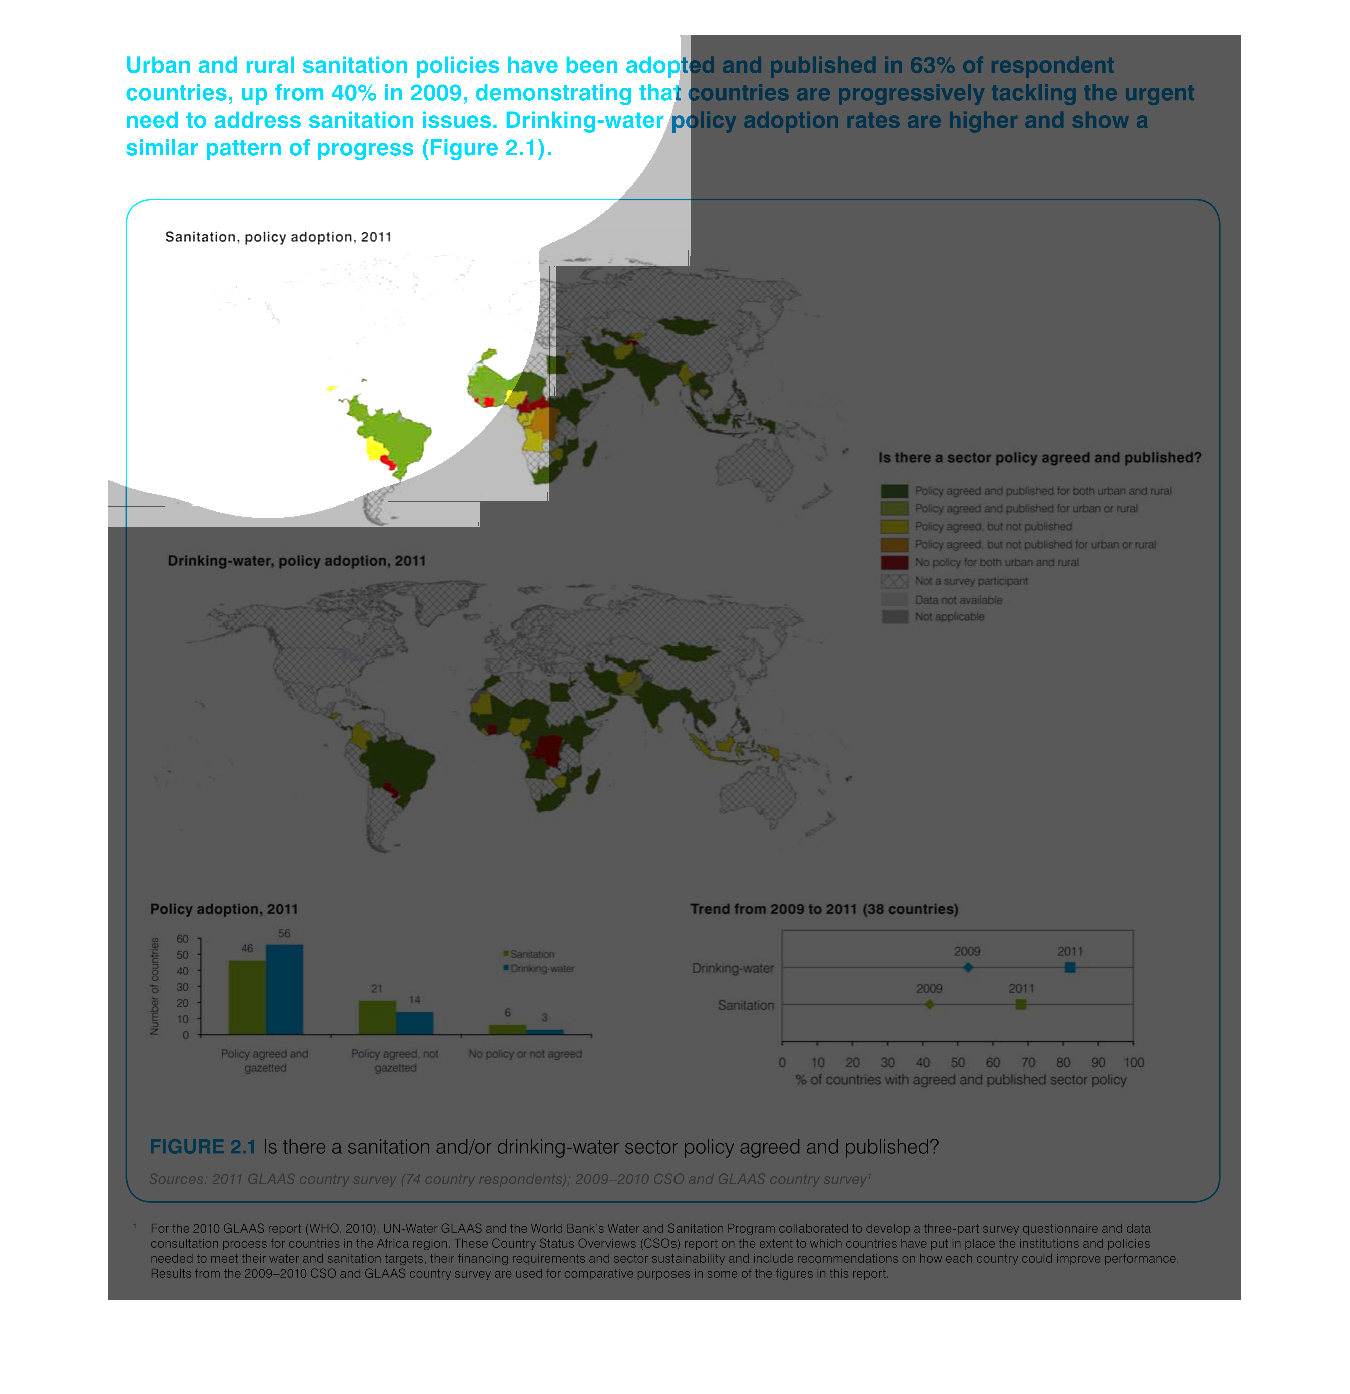
This shows a map of the world and what countries are doing about sanitation in their region.
specifically about water sanitation and if there is a policy instilled or not. It is color
coded to tell you not only who has water sanitation policies, but also when the policies were
established.
Warning: Image is too big to fit on screen; displaying at 50%
Warning: Image is too big to fit on screen; displaying at 50%
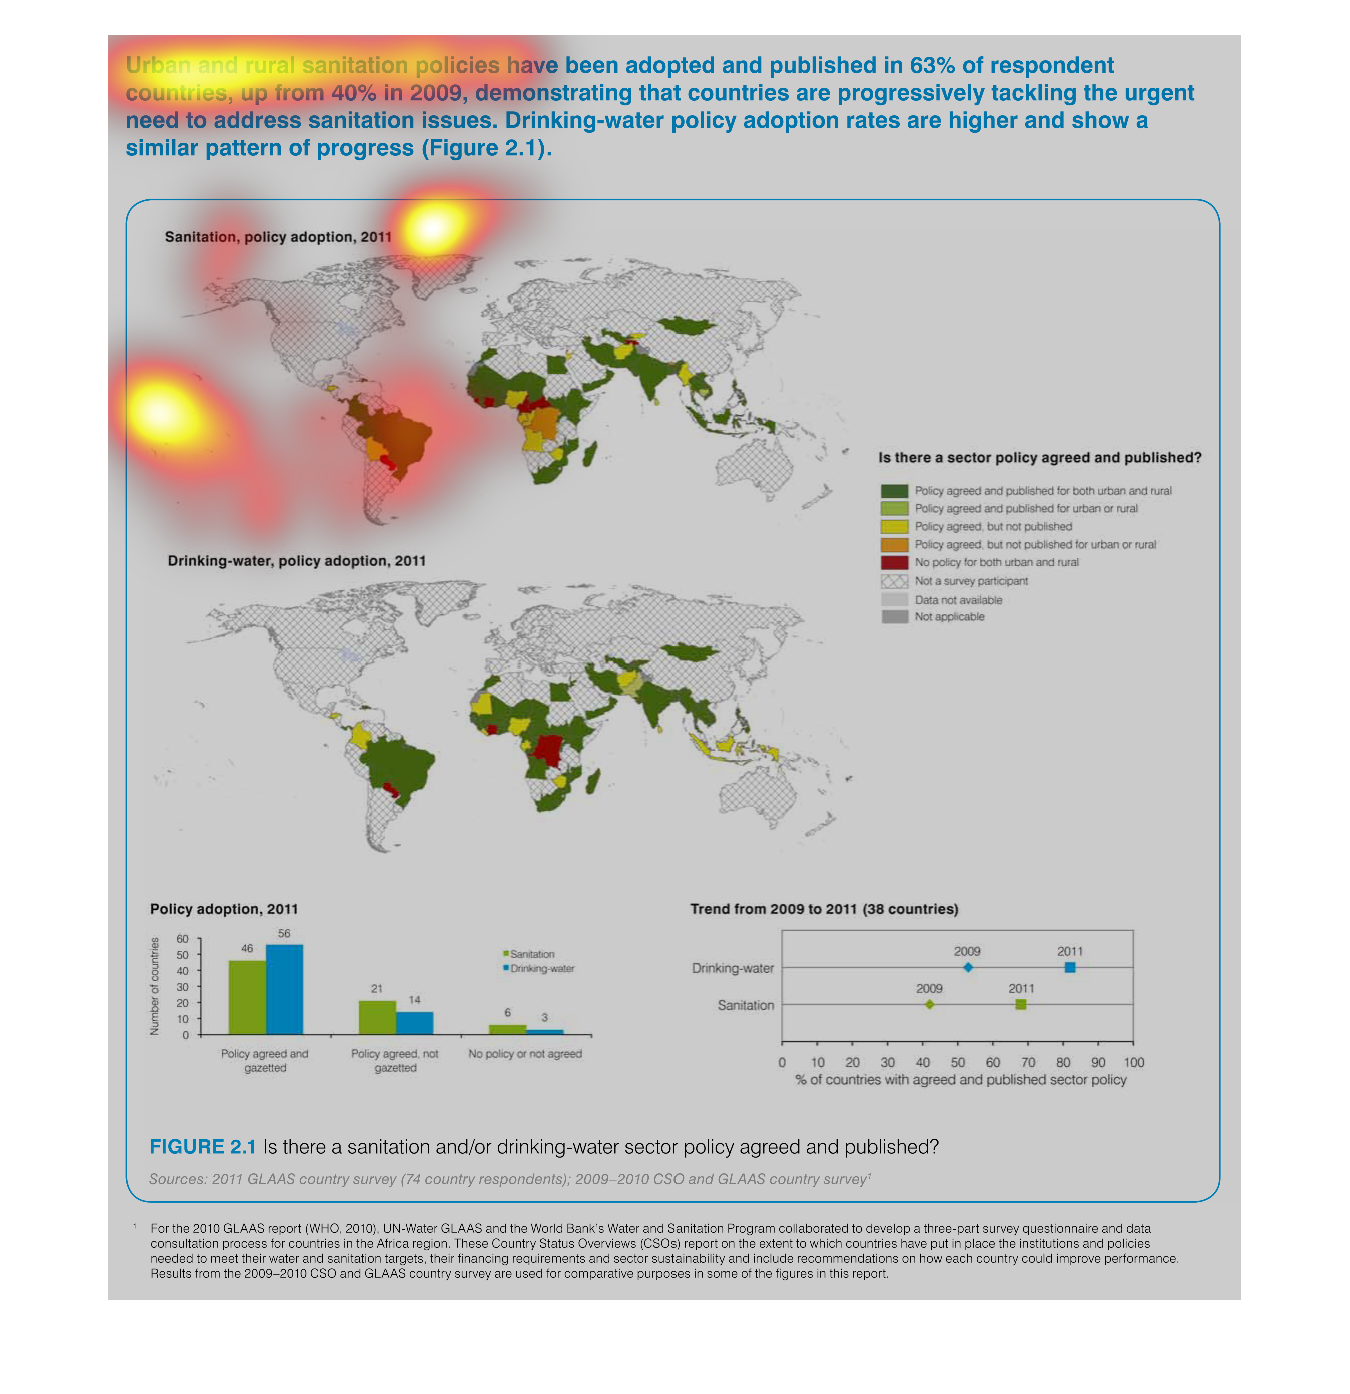
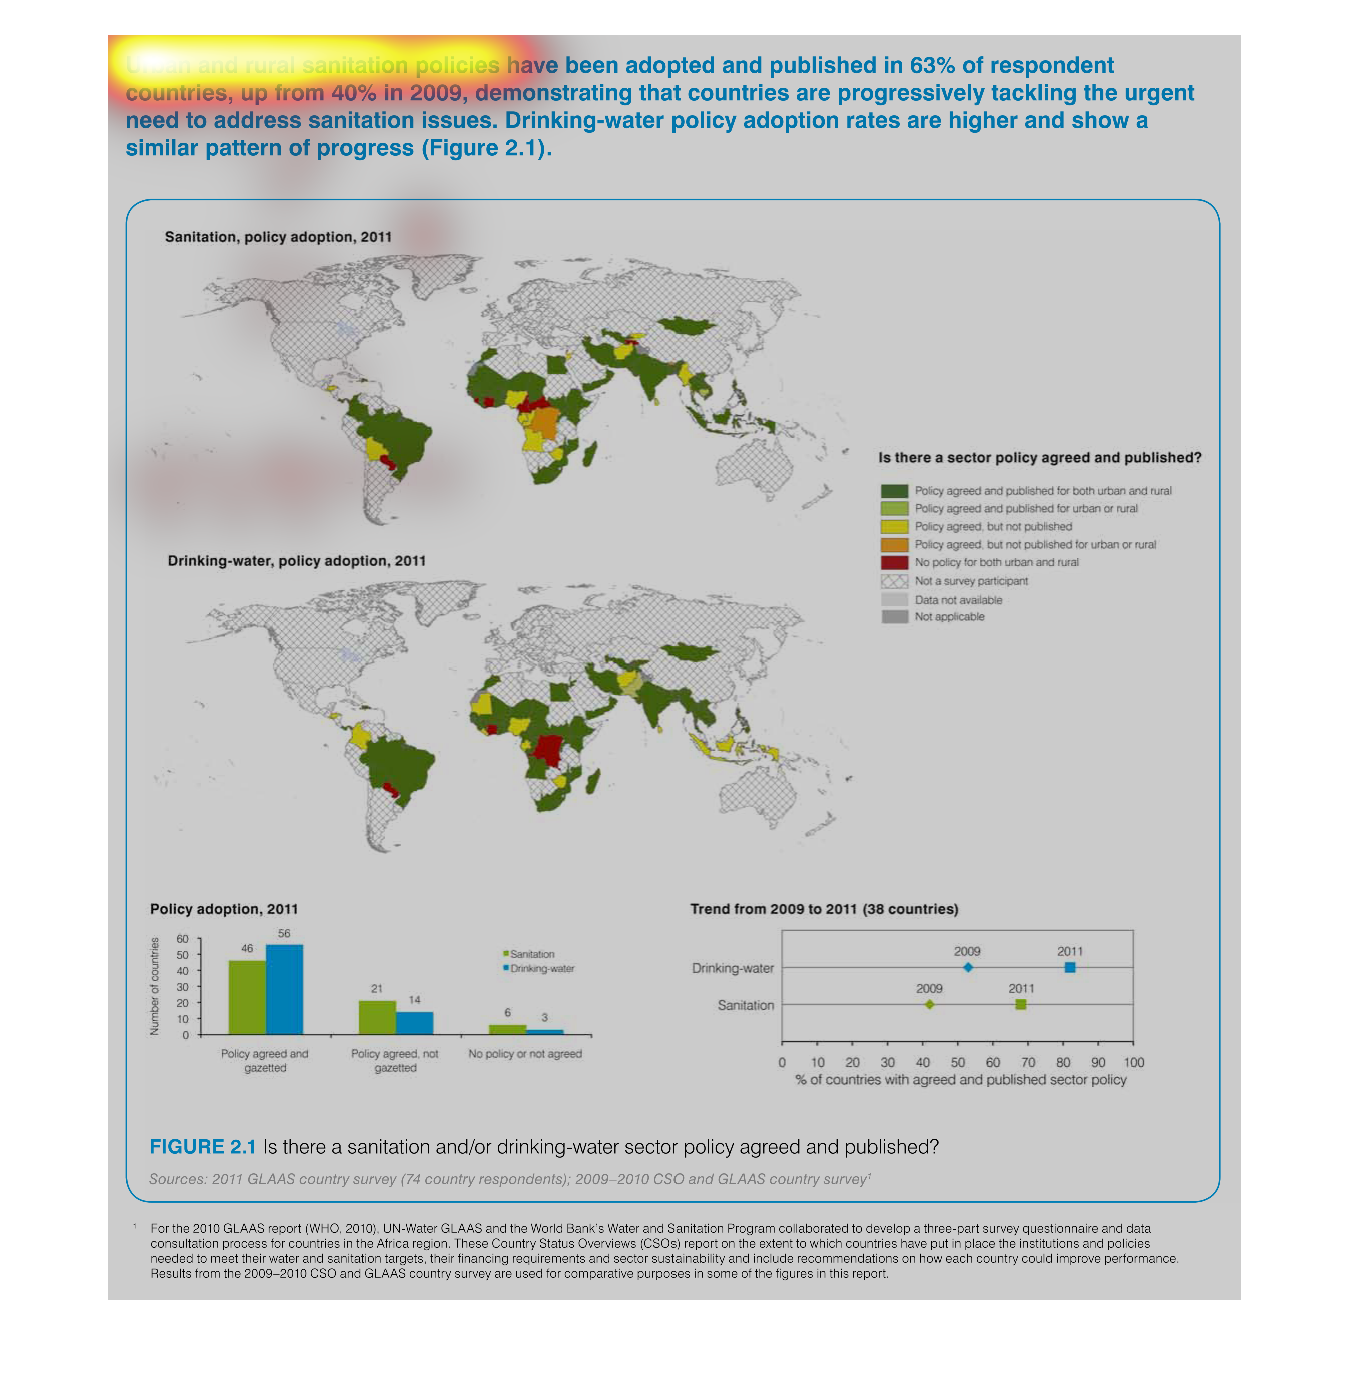
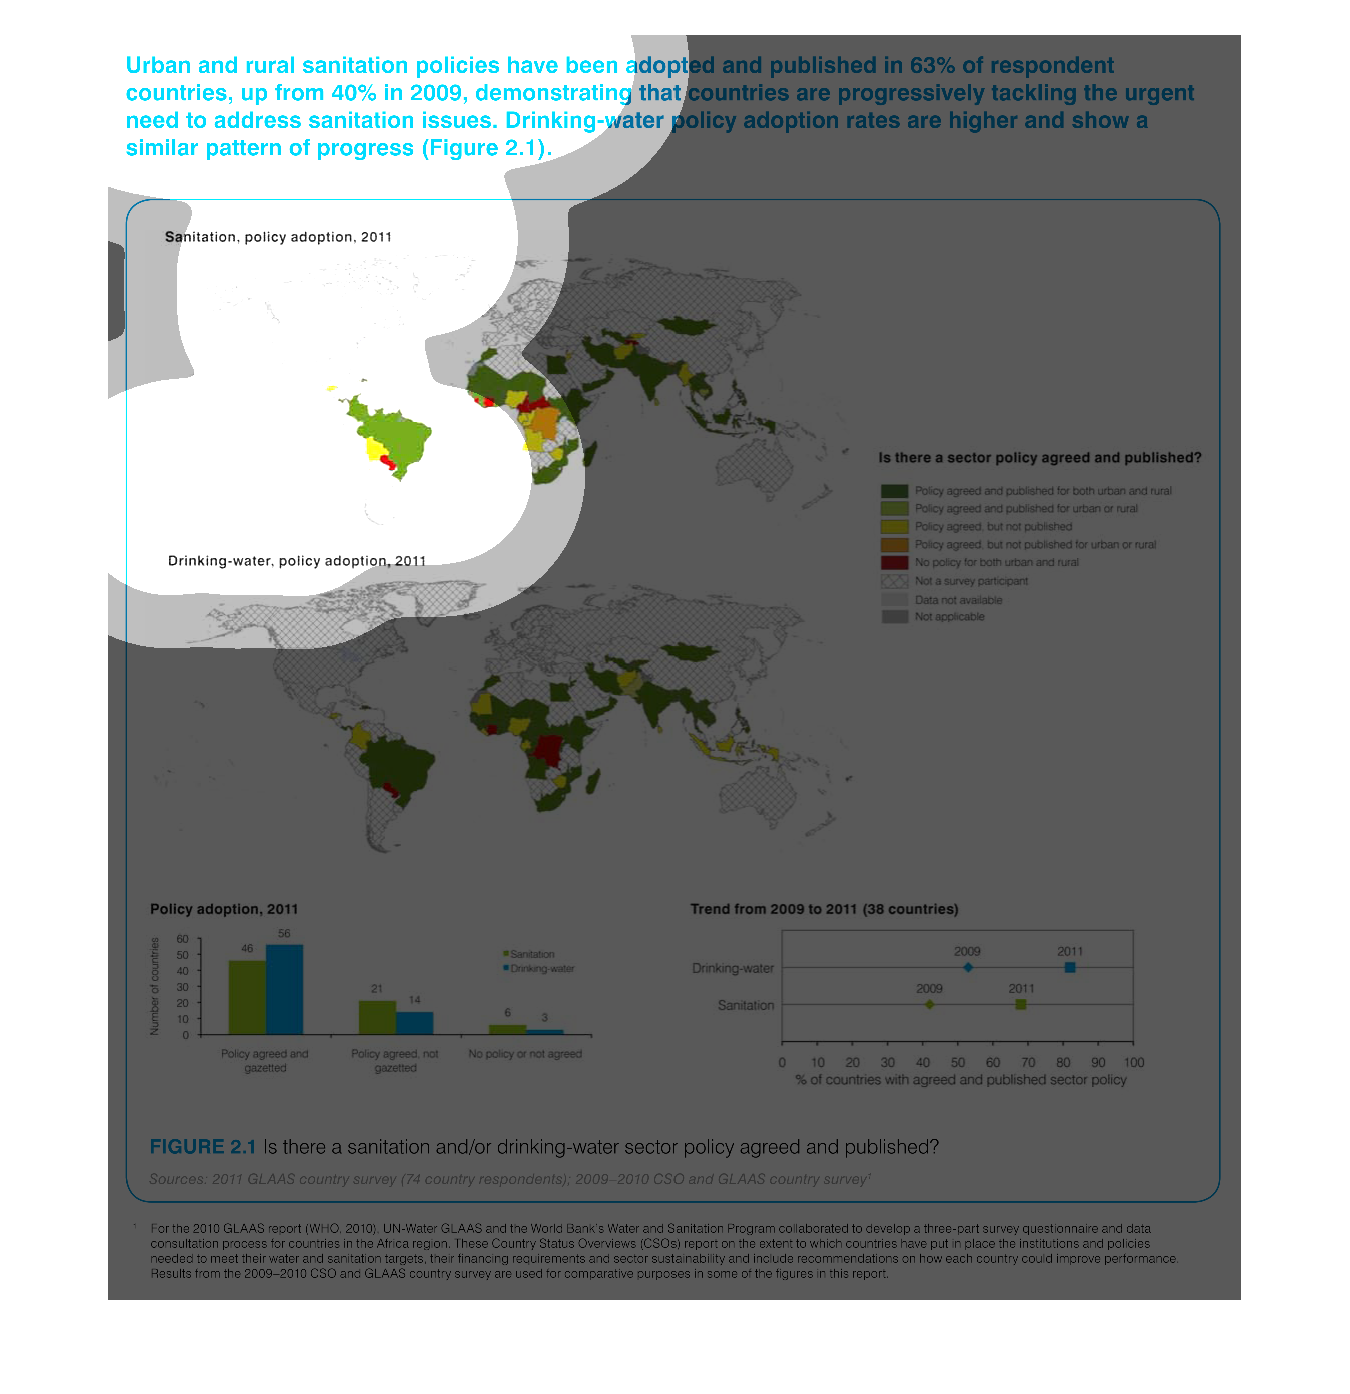
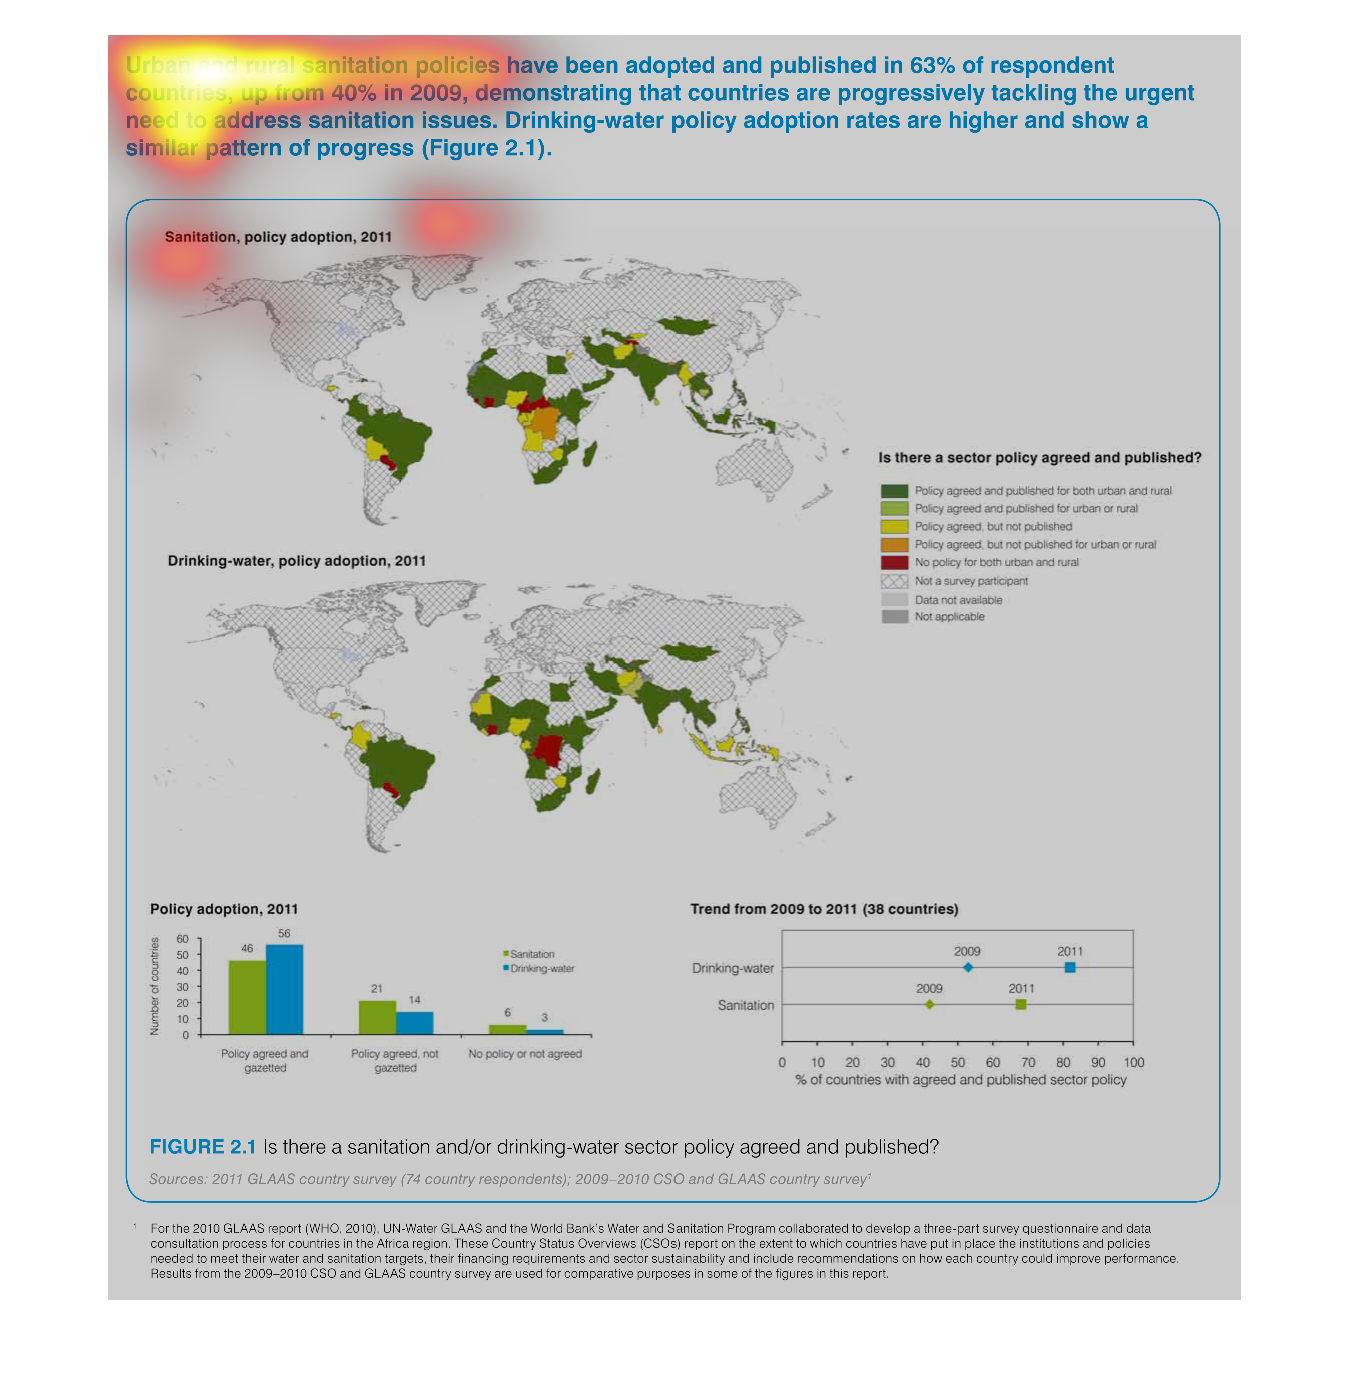
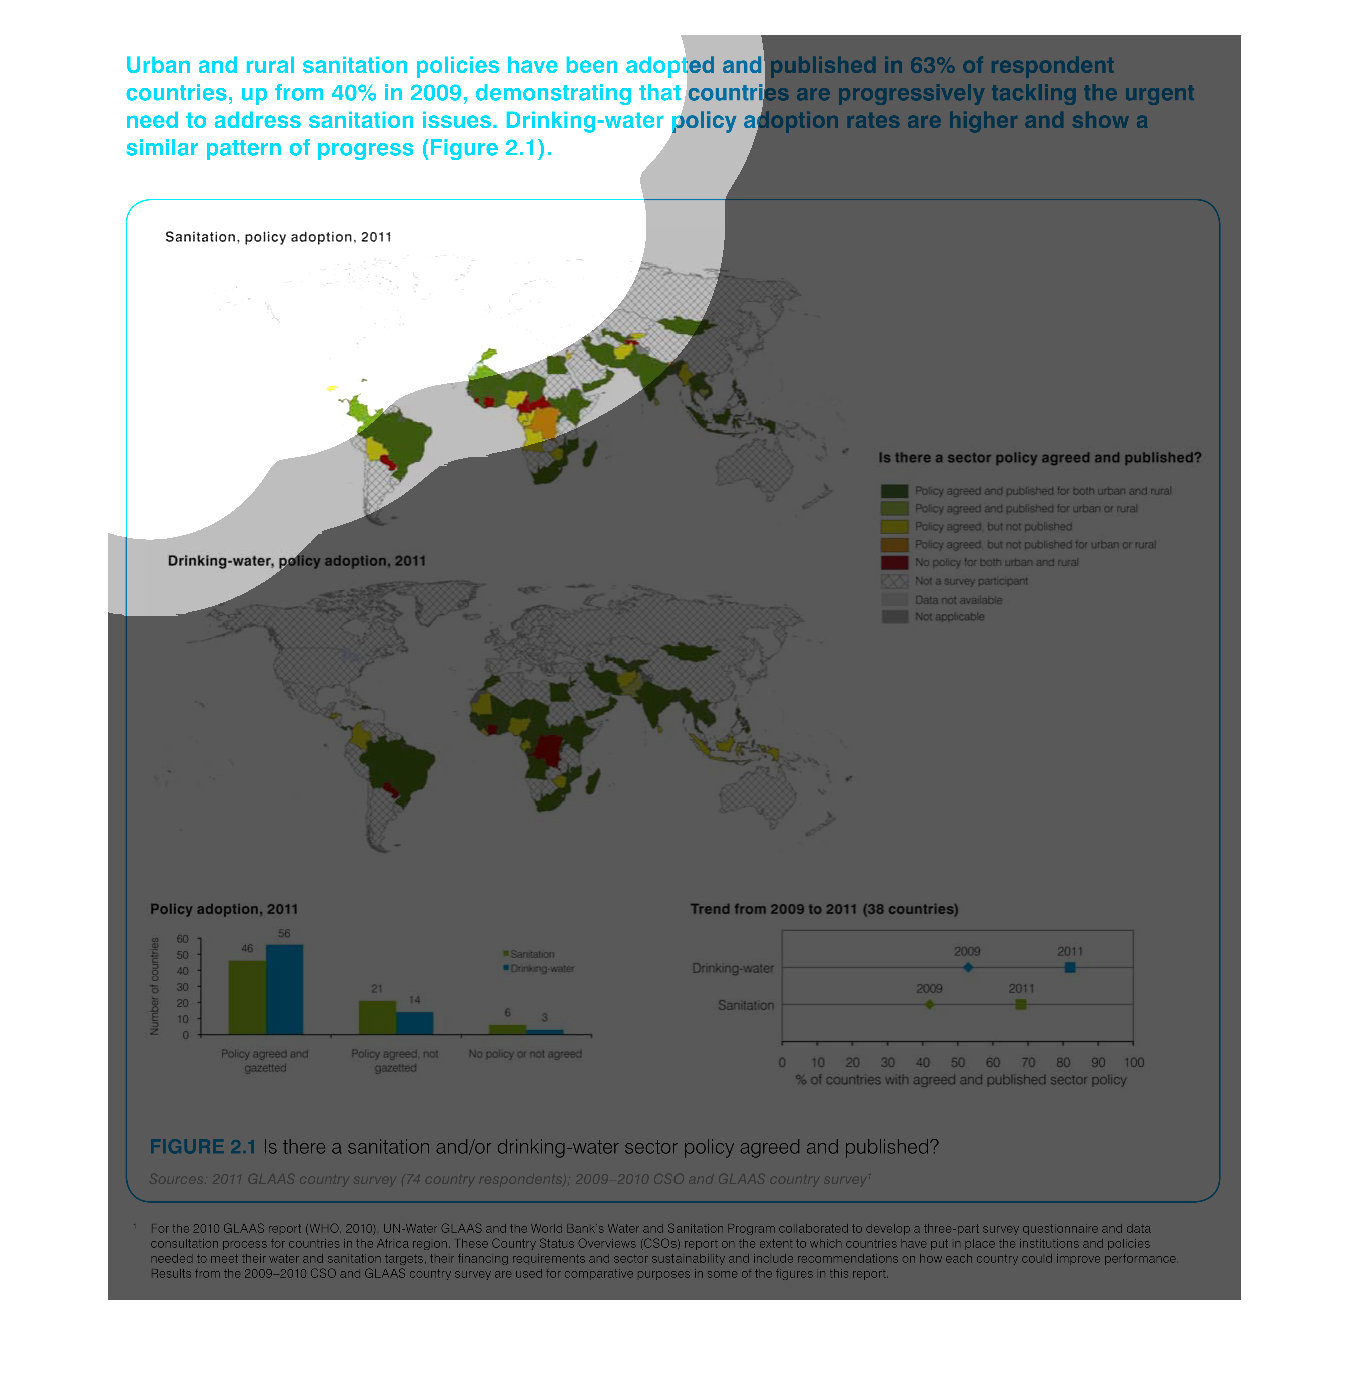
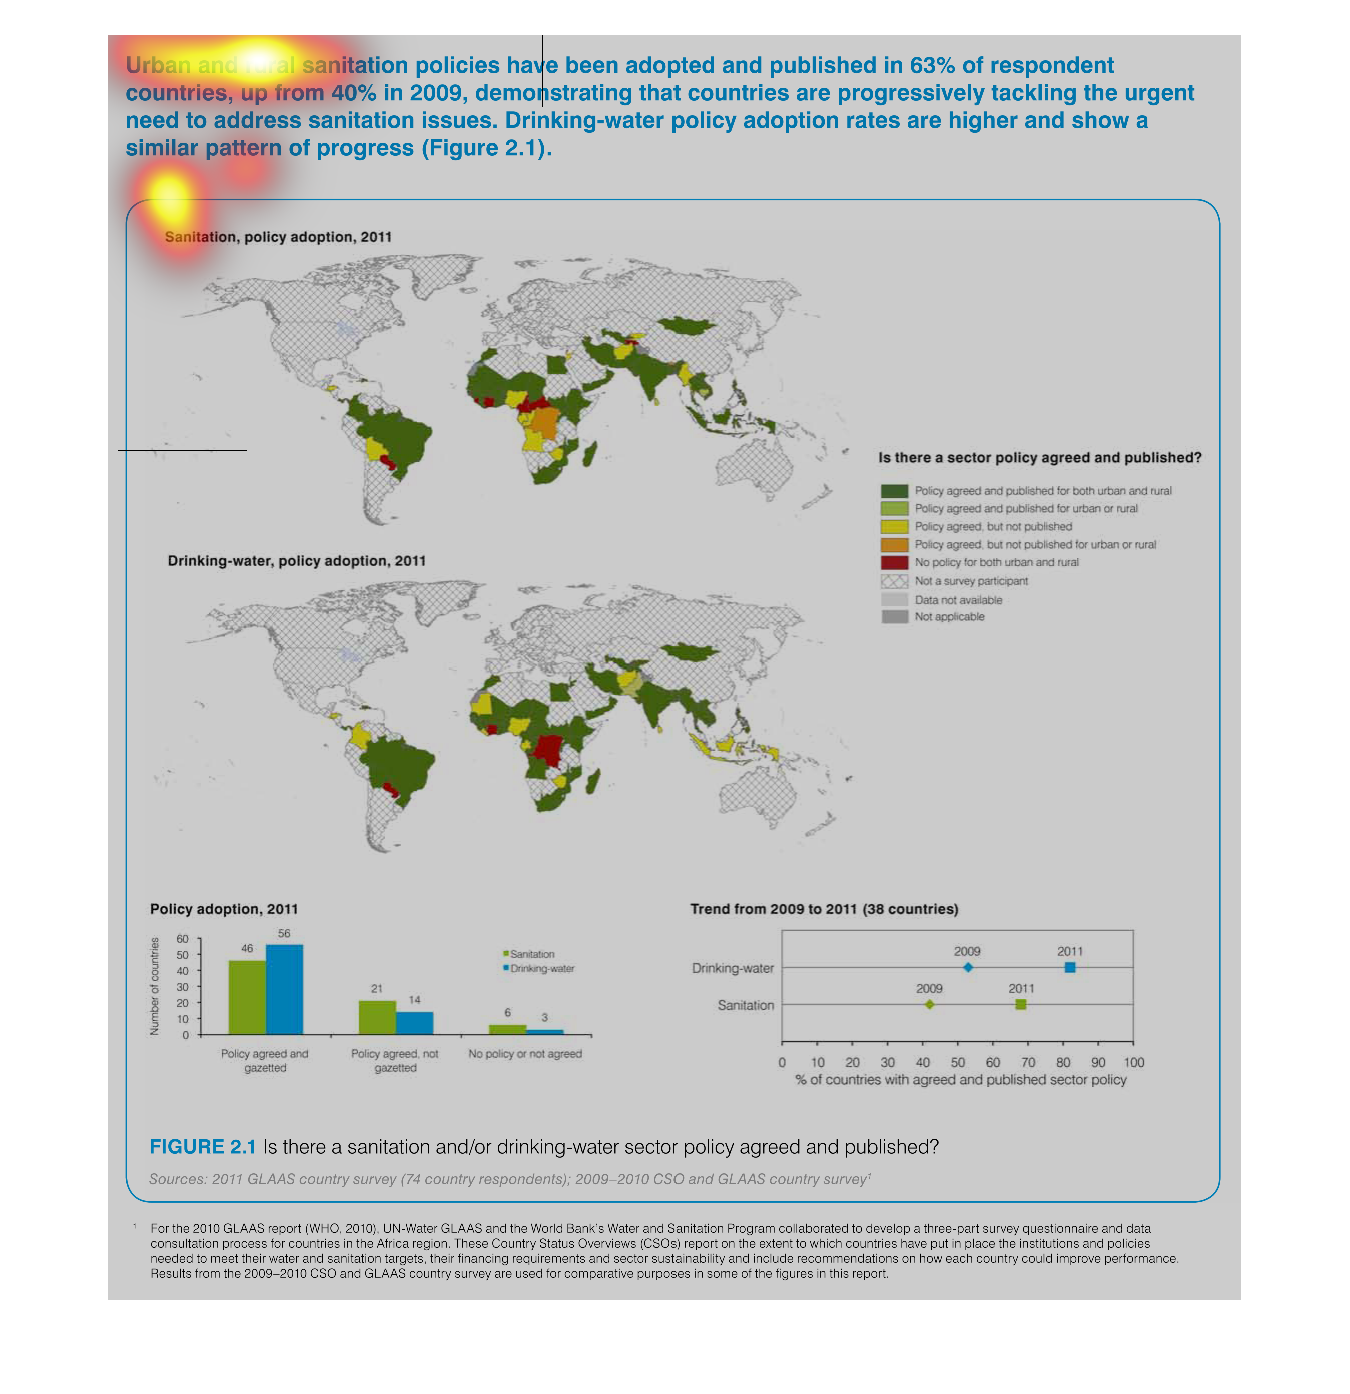
This is a series of color-coded global maps depicting urban and rural sanitation policies
that have been adopted and reported and show that a pattern of progress in implementation
has been happening.
Warning: Image is too big to fit on screen; displaying at 50%
Warning: Image is too big to fit on screen; displaying at 50%
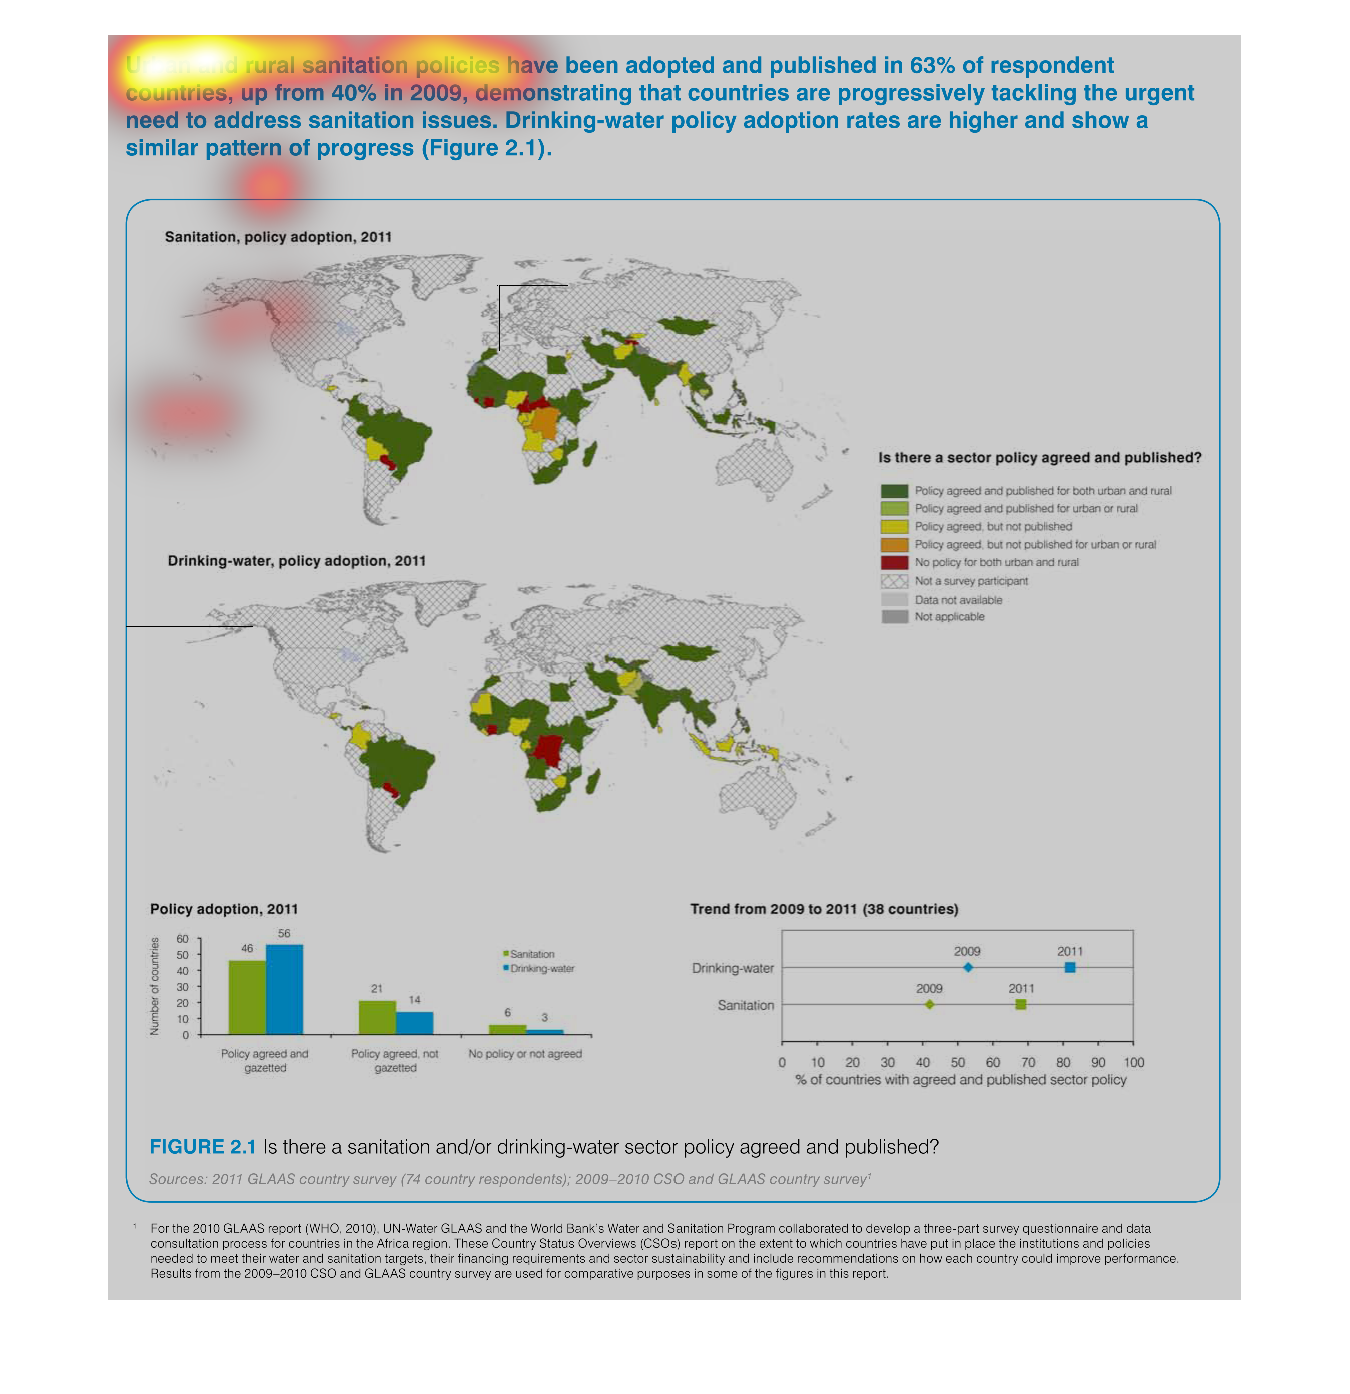
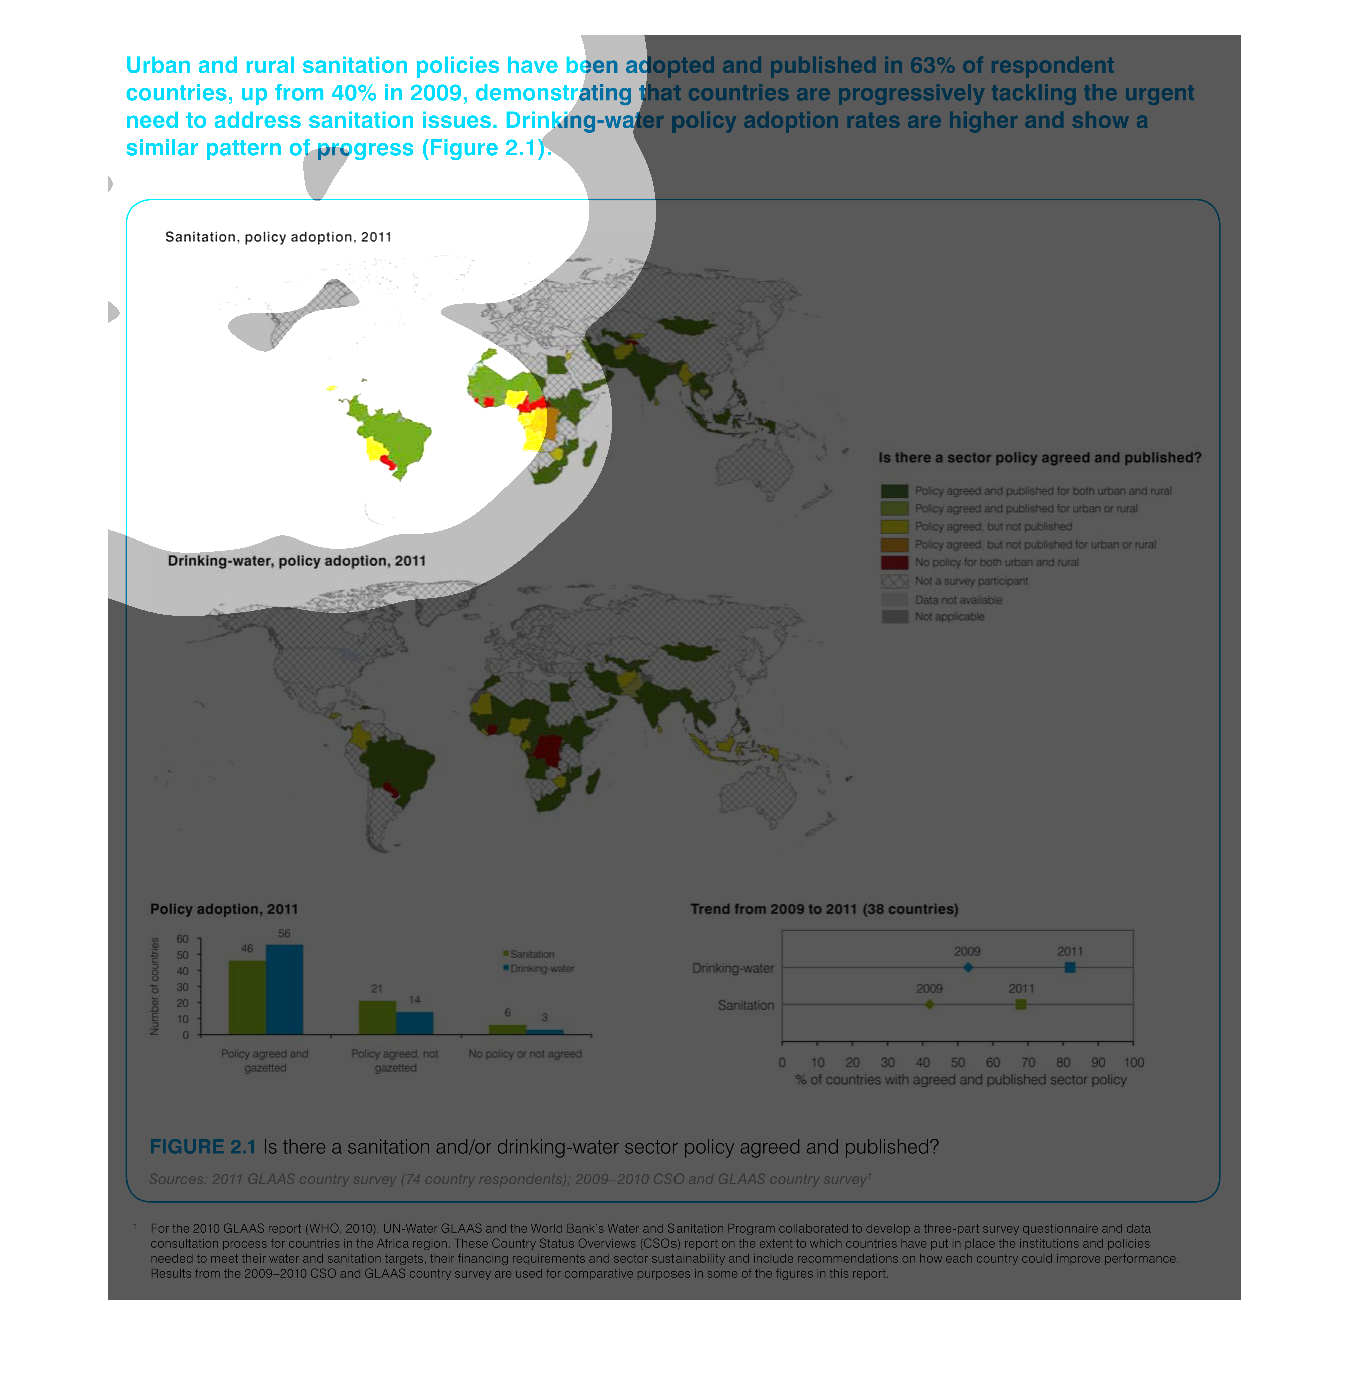
This is a series of color coded global maps depicting the reports of selected countries in
terms of their public sanitation policies and the need to address sanitation policies in general.
Warning: Image is too big to fit on screen; displaying at 50%
Warning: Image is too big to fit on screen; displaying at 50%
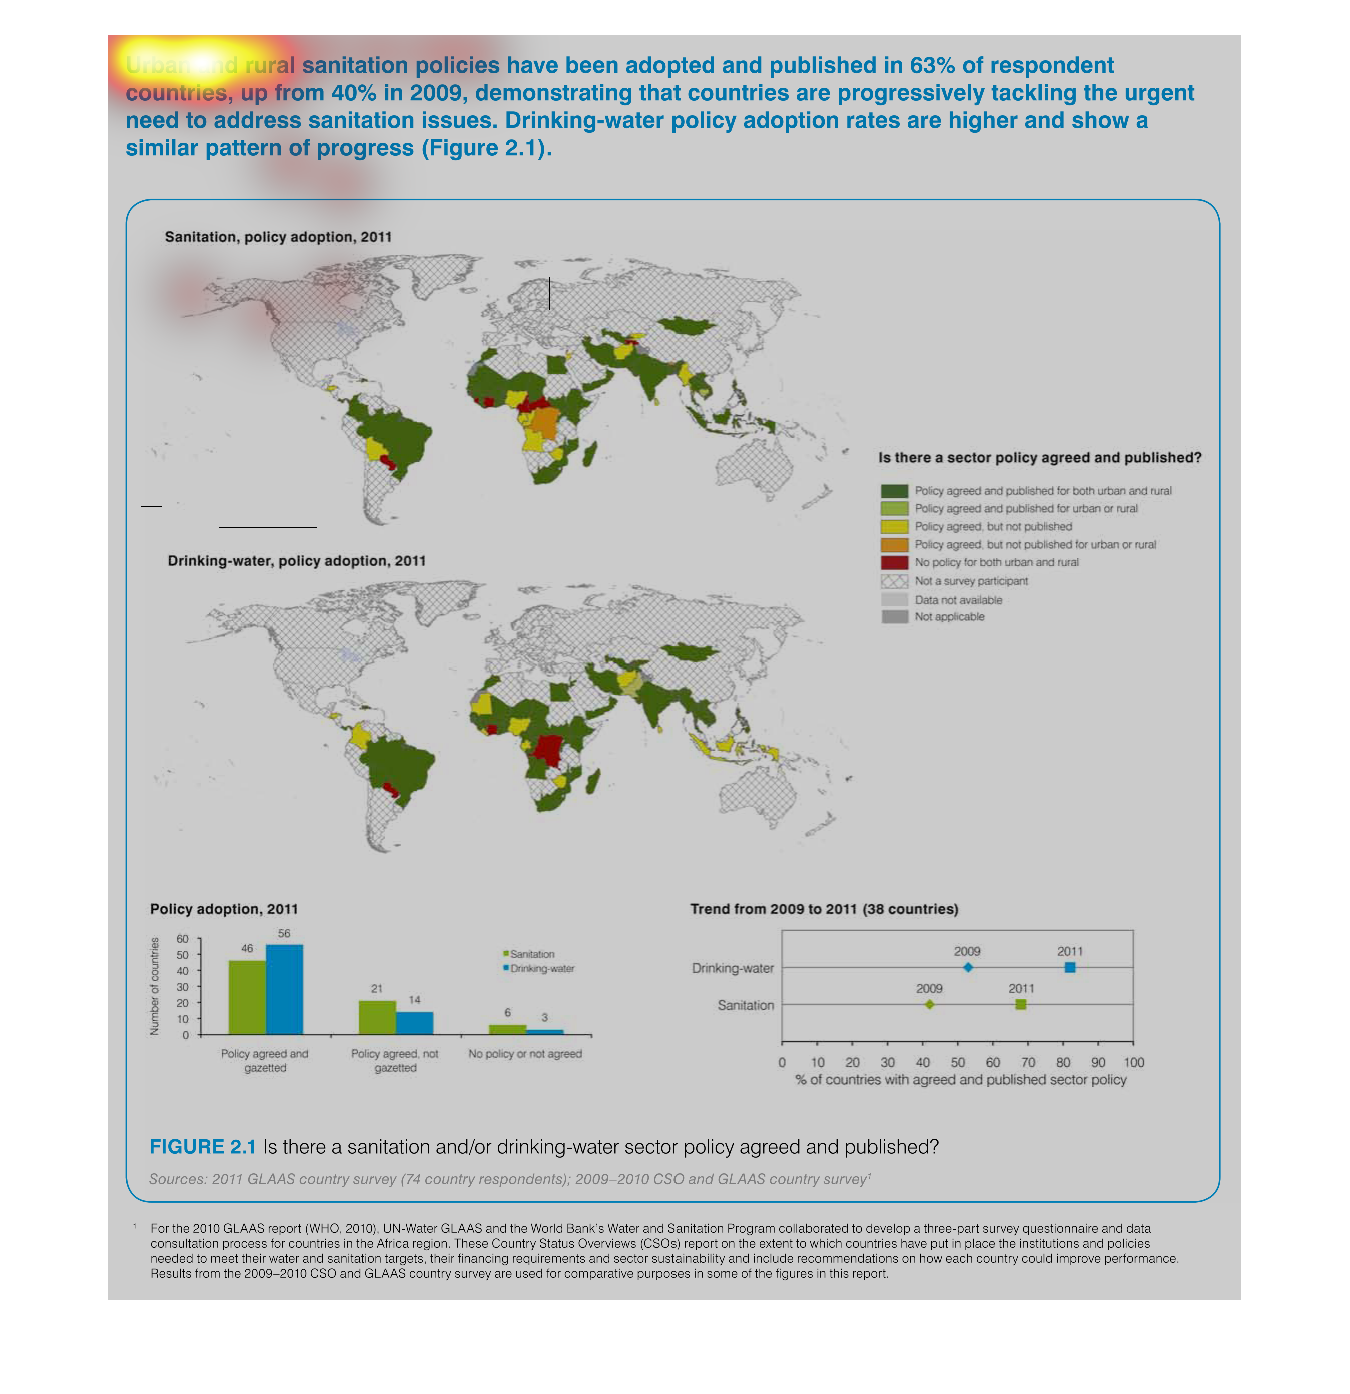
This chart is about urban and rural sanitation that were published in 63% of respondent countries,
that is up from 40% in 2009 shows that the countries are progressively tackling and addressing
the urgent need on sanitation issues. Drinking water sanitation rate is higher in this policy
and is shown in the graph.
Warning: Image is too big to fit on screen; displaying at 50%
Warning: Image is too big to fit on screen; displaying at 50%

Sanitation policies have been adopted by more and more   countries up from 40% to 63%.  Drinking
water policies been accepted at a higher rate.    The maps show which level of sanitation
and drinking water policy adoption has occurred in which countries.  The two bottom graphs
show the number of total countries are participating and the trend toward adoption.
Warning: Image is too big to fit on screen; displaying at 50%
Warning: Image is too big to fit on screen; displaying at 50%
The image on the left hand side side is a comparison of different countries showing the change
over time of sanitation policies for each country.  The data from the later year 2009 shows
that these sanitation changes have increased 40% over the time the data was first collected.
Warning: Image is too big to fit on screen; displaying at 50%
Warning: Image is too big to fit on screen; displaying at 50%

This is a graphic that shows the various levels of various policies covering sanitation, drinking
water for all the continents. It covers the effects of these policies for the year 2011.
Warning: Image is too big to fit on screen; displaying at 50%
Warning: Image is too big to fit on screen; displaying at 50%

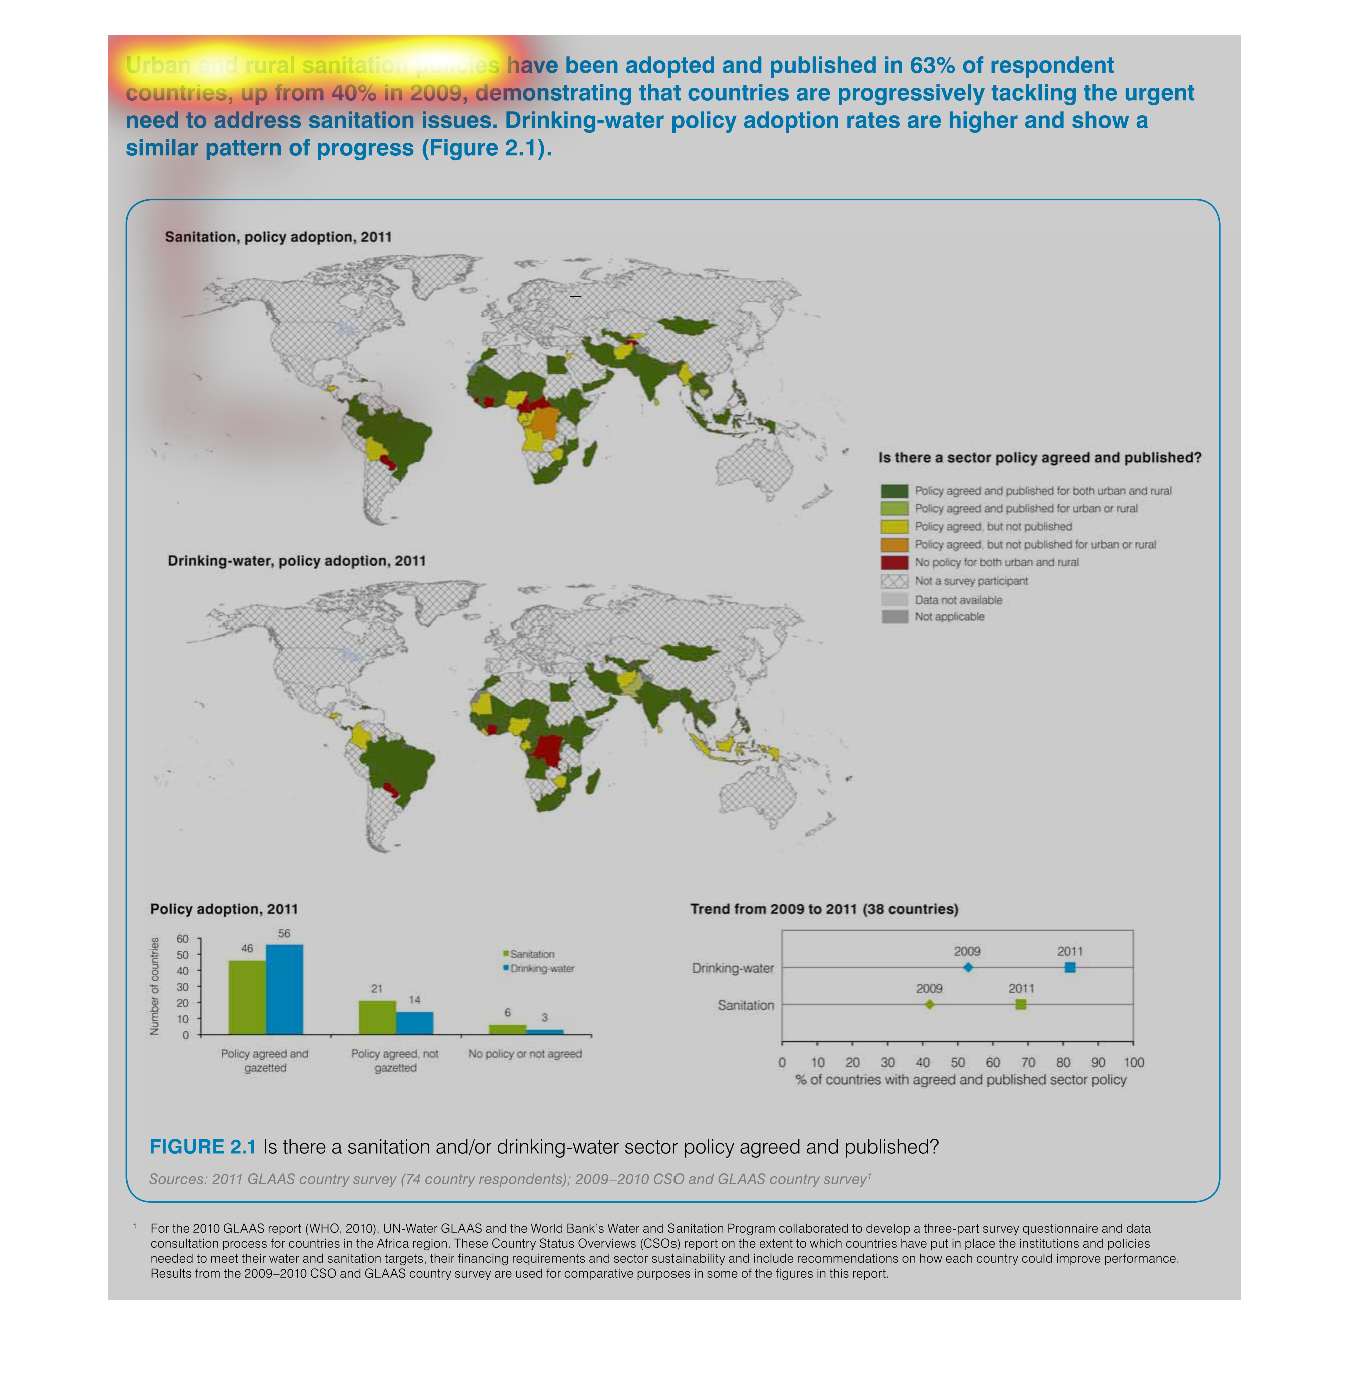
This graph shows of the 63% of respondant countries, levels of drinking water and sanitation
issues are improving by a large margin since 2009. This shows that many countries are progressing
in recent years.
Warning: Image is too big to fit on screen; displaying at 50%
Warning: Image is too big to fit on screen; displaying at 50%
It is a map that shows the different Urban and rural sanitation policies that have been adopted
by 63% of the countries world wide since 2009. This also includes the necessity of the policies
as they effect the quality of drinking water in those countries as well. There is a direct
correlation between the countries that have adopted these new sanitation policies and their
drinking water.
Warning: Image is too big to fit on screen; displaying at 50%
Warning: Image is too big to fit on screen; displaying at 50%

The graph displays every country's rate of adopting a sanitation policy as well as their rate
of adopting a drinking water policy in the year 2011. The sanitation policy adoption rate
has gone up approximately 20% since 2009 and the drink water policy rate is also increasing.
Warning: Image is too big to fit on screen; displaying at 50%
Warning: Image is too big to fit on screen; displaying at 50%
This handmade chart shows something about urban versus rural sanitation needs. The print though
is too small to read so it is difficult to see anything else
Warning: Image is too big to fit on screen; displaying at 50%
Warning: Image is too big to fit on screen; displaying at 50%

The chart describes urban and rural sanitation policies that have been adopted by different
areas of the world. There is additional information on whether the satiation policy is published
and agreed upon, the policy adoption rate, and the trend from 2009 to 2011
Warning: Image is too big to fit on screen; displaying at 50%
Warning: Image is too big to fit on screen; displaying at 50%