This is a chart that shows the urban and rural sanitation levels and drinking water situation
as reported by reliable information monitoring systems in various countries.
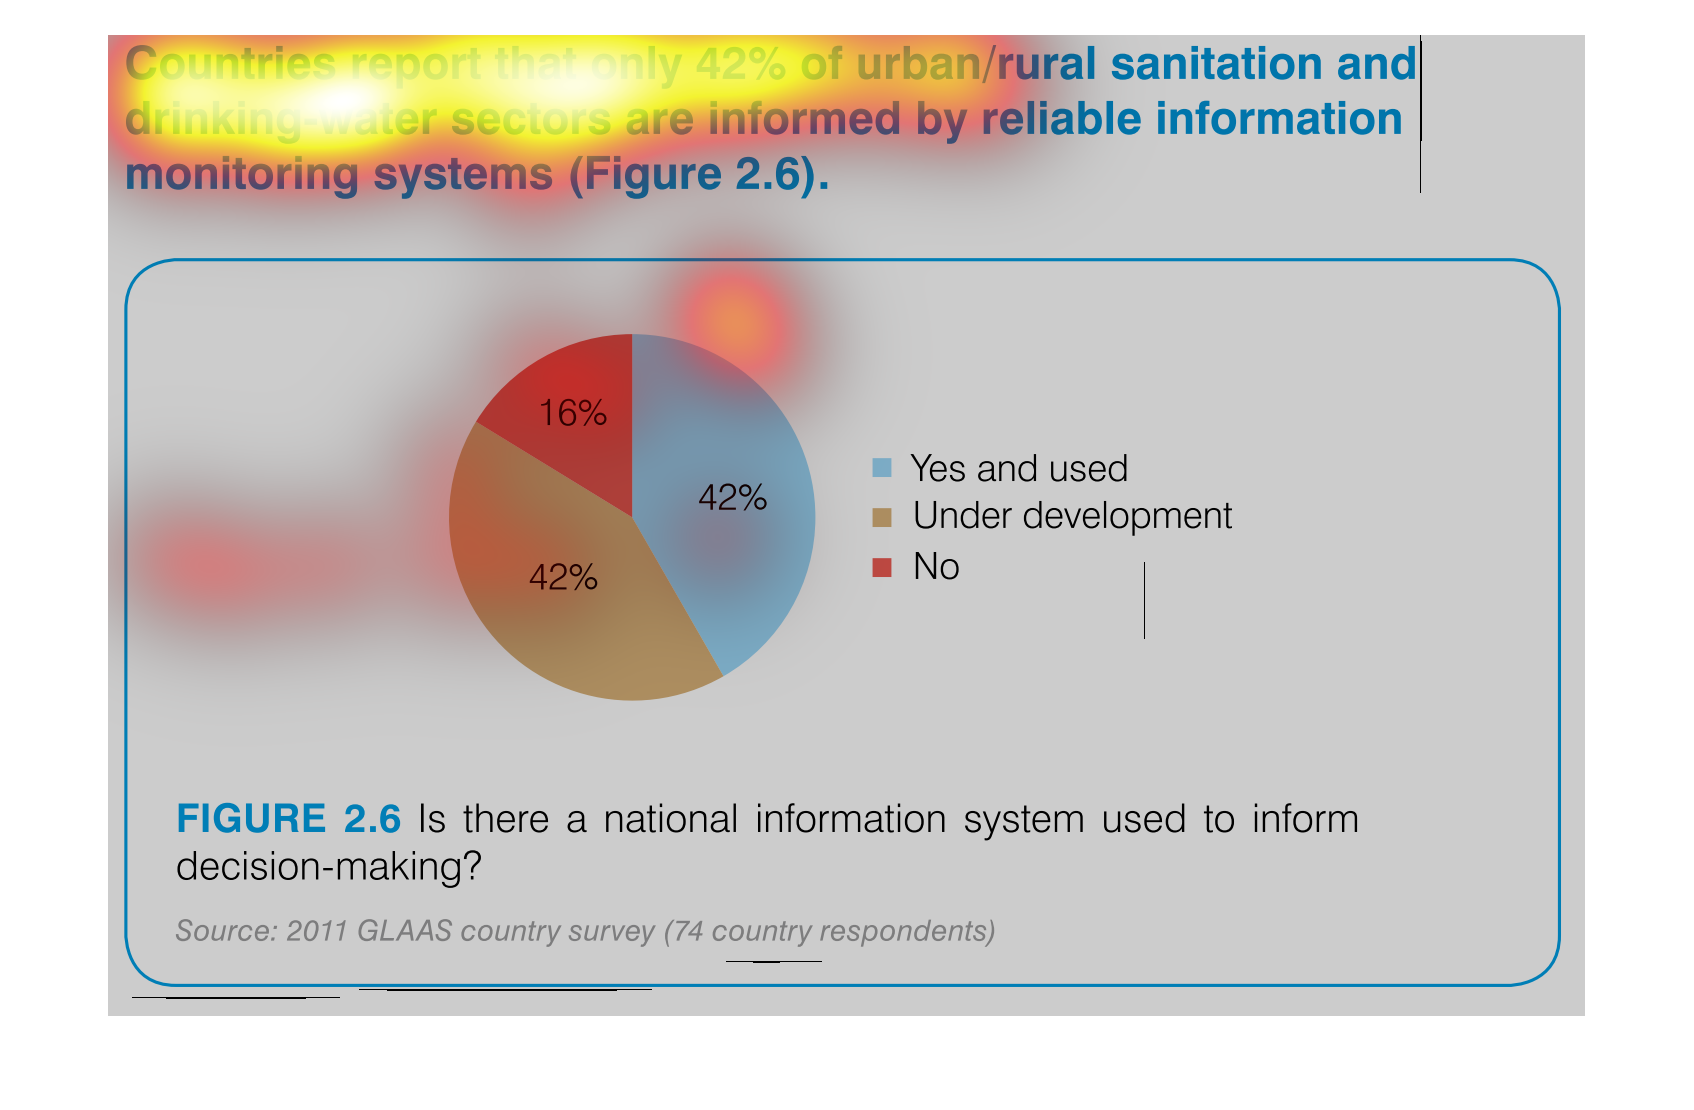
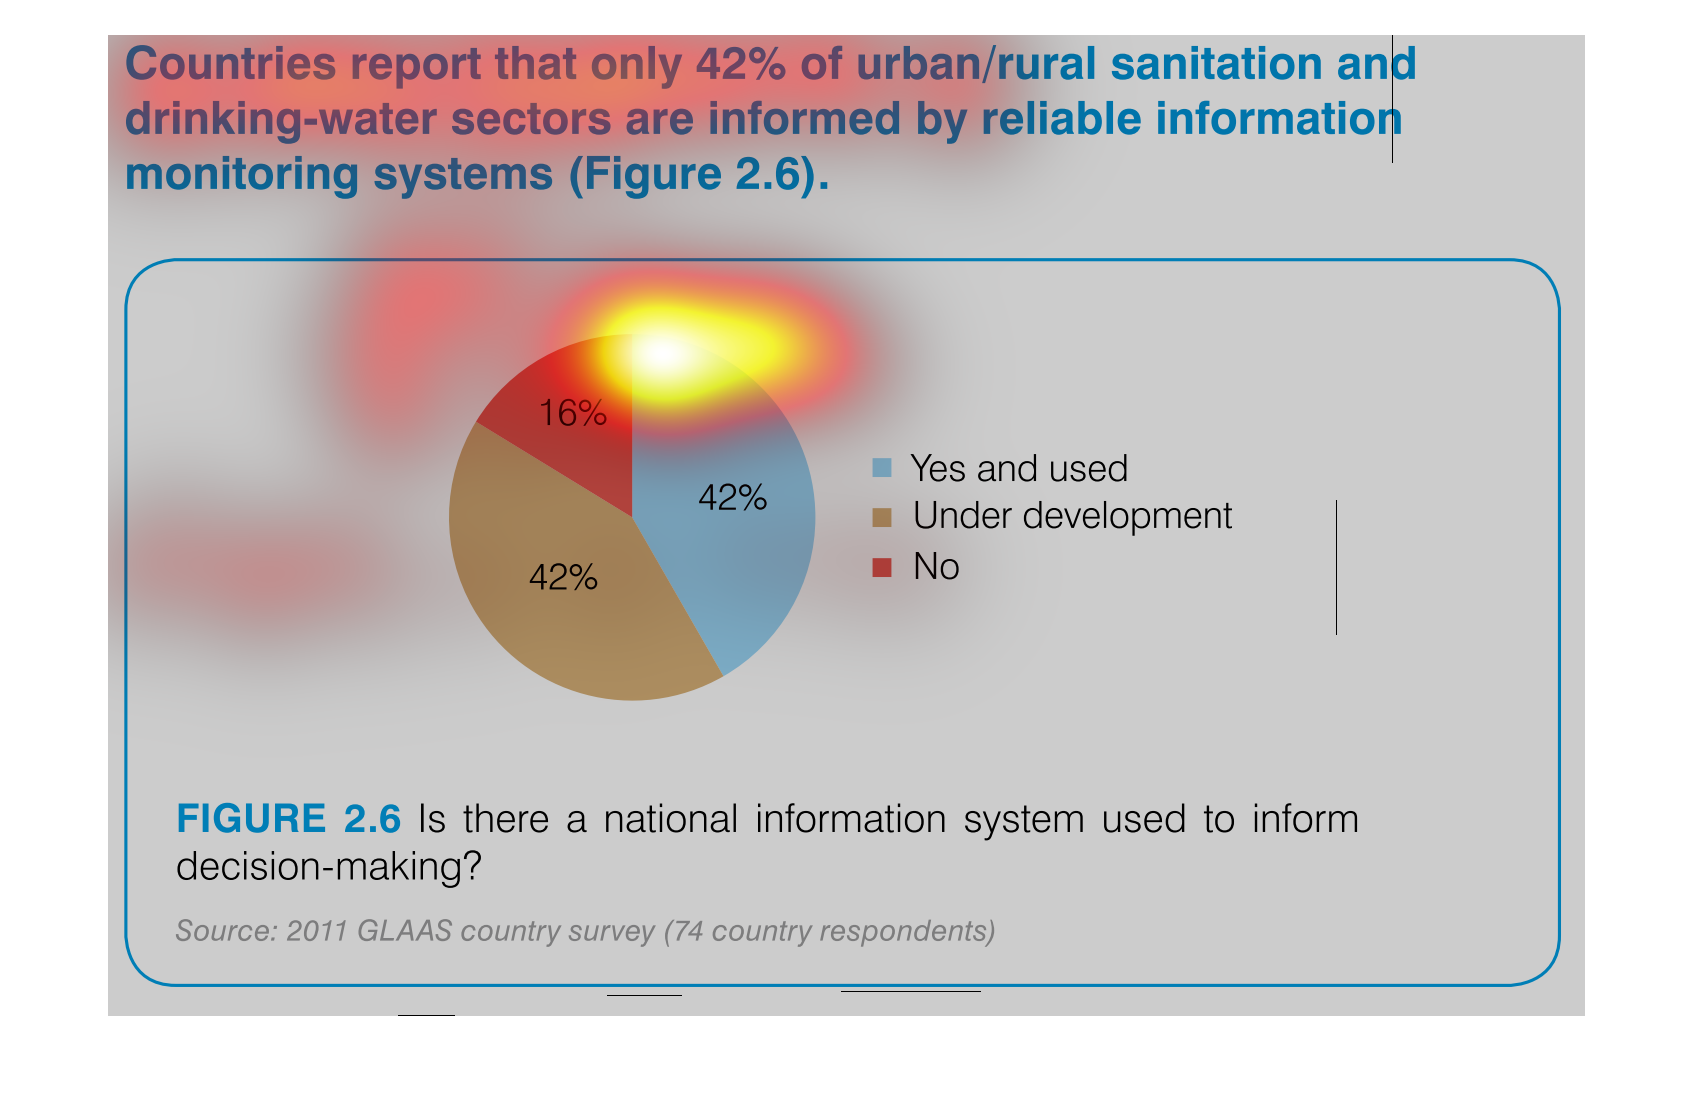
It is a pie chart showing a percentage of urban and rural sanitation drinking water sectors
are at 42%, another 42% is still under development. While  16% has none. This information
came by reliable monitoring systems.
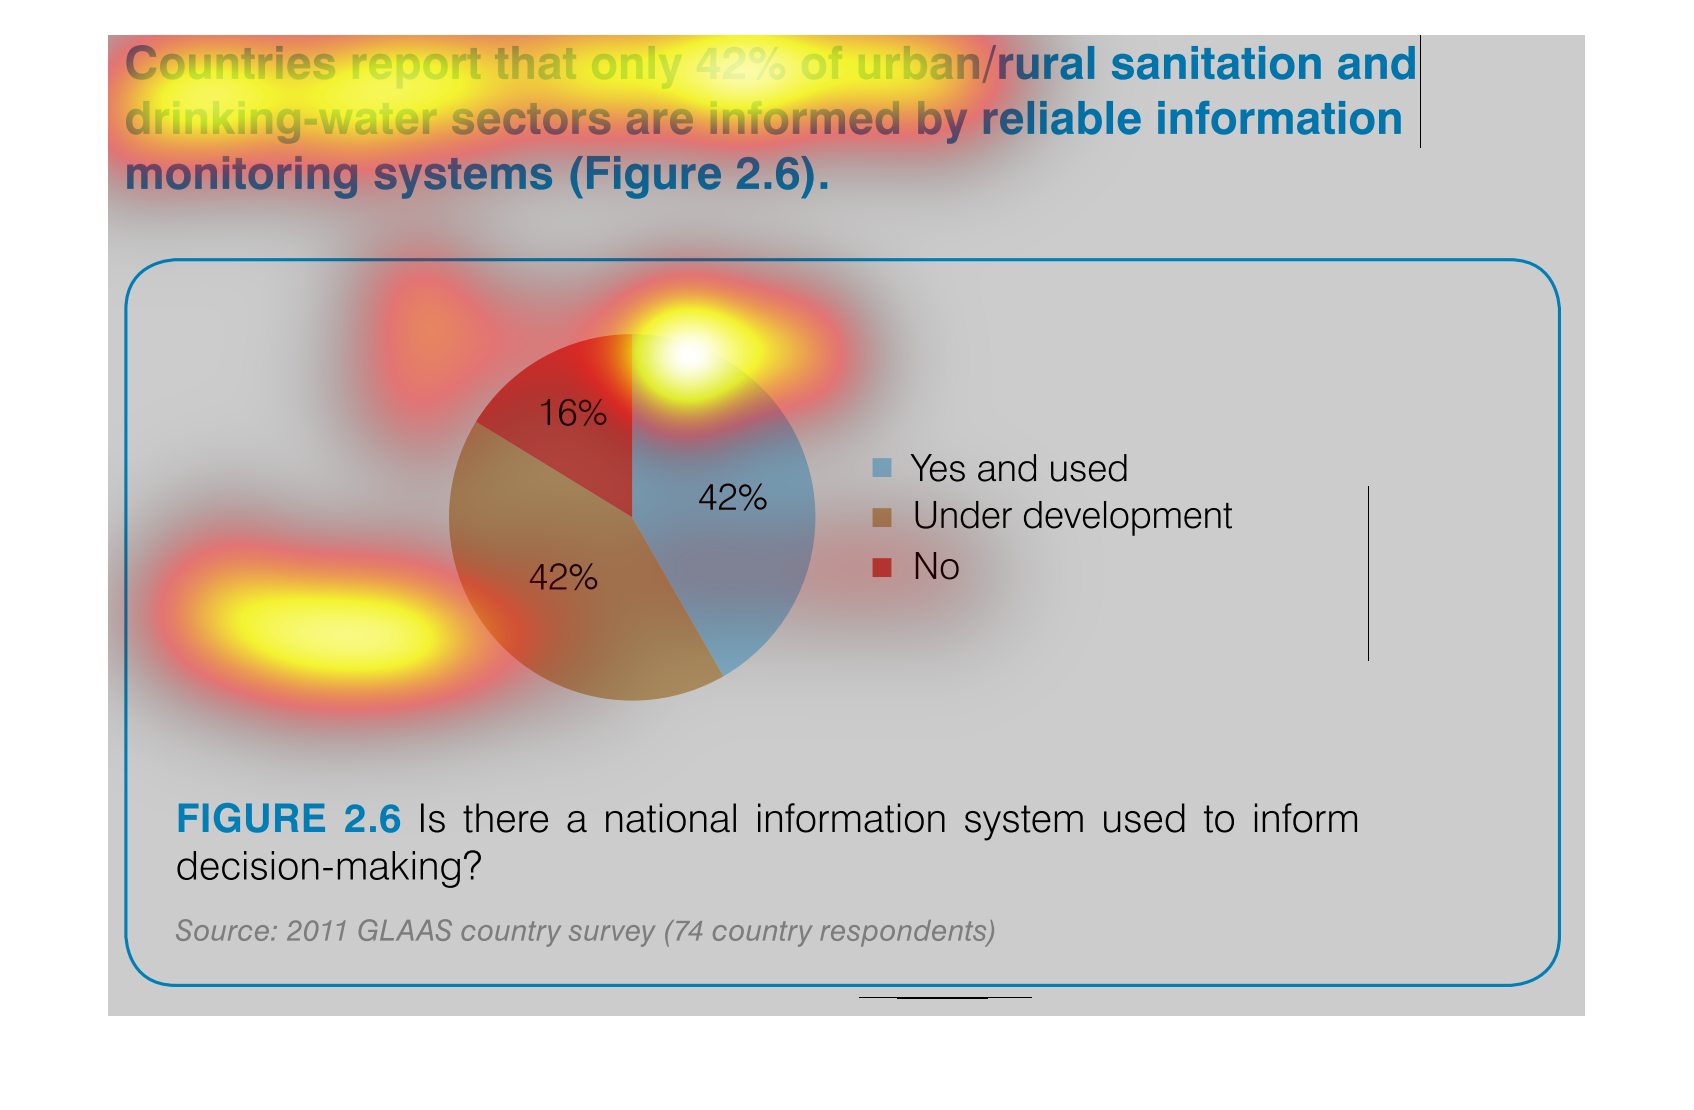
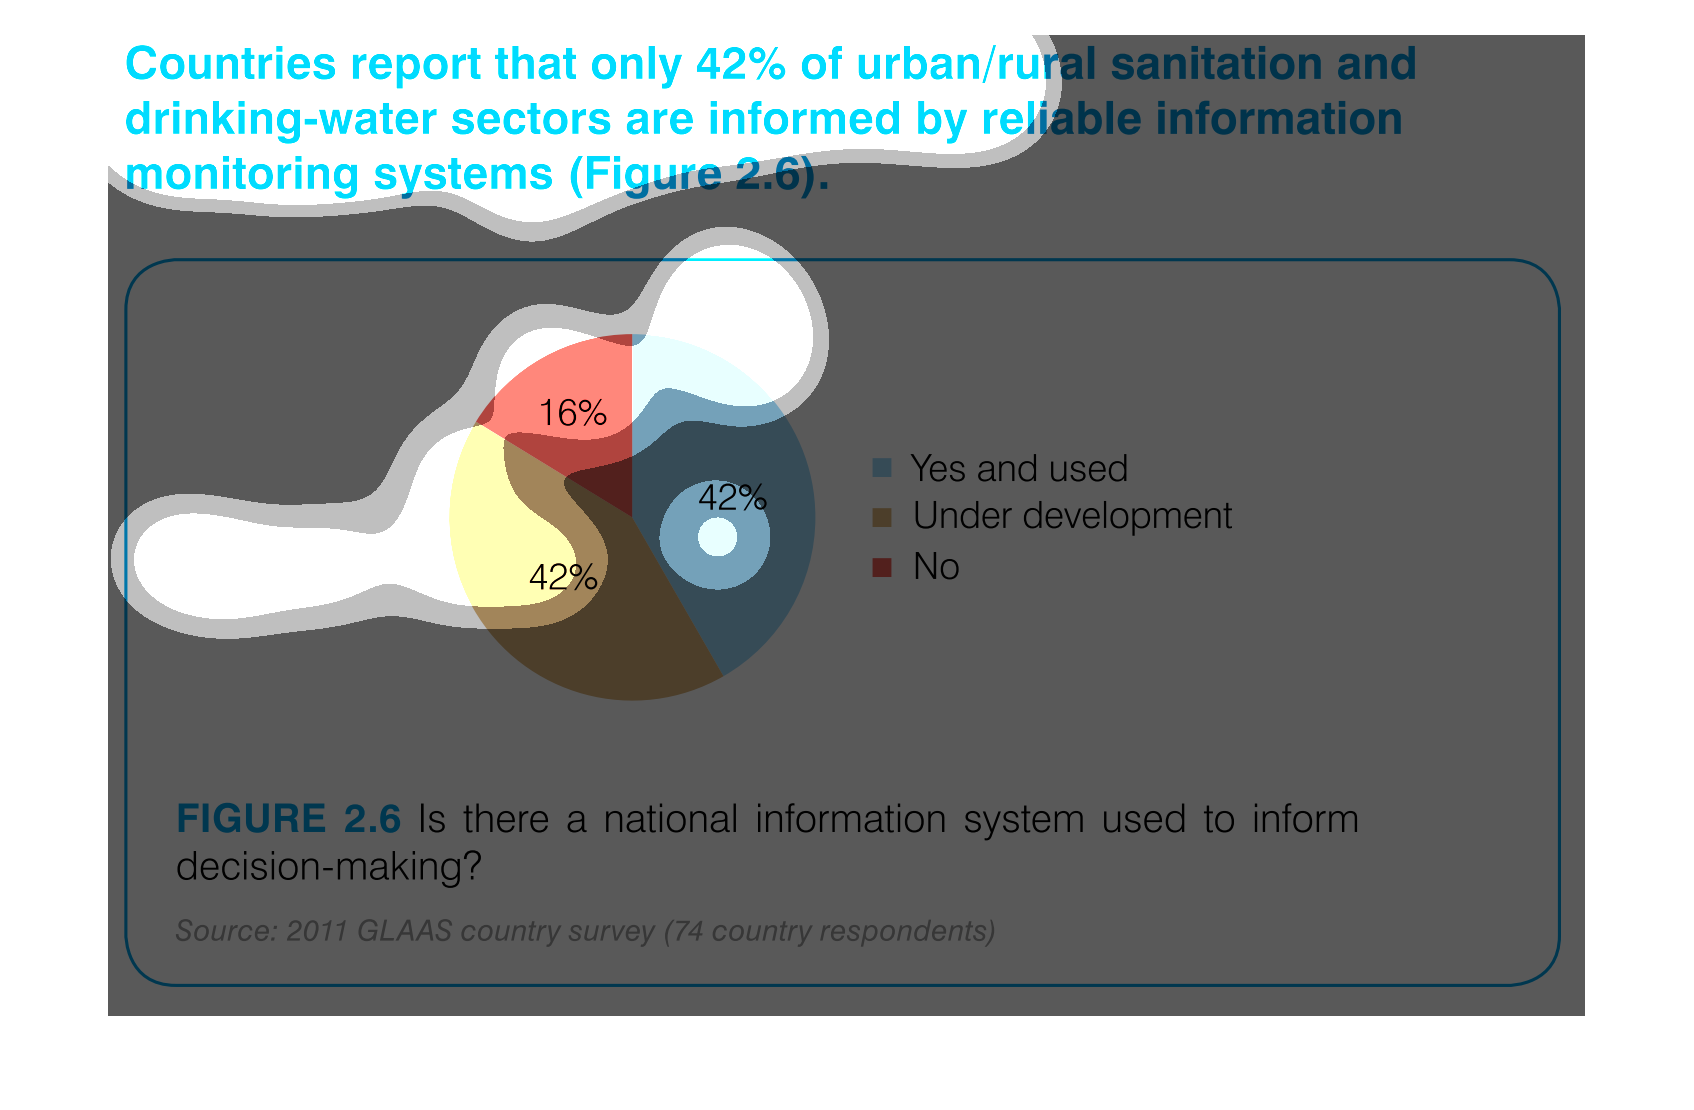
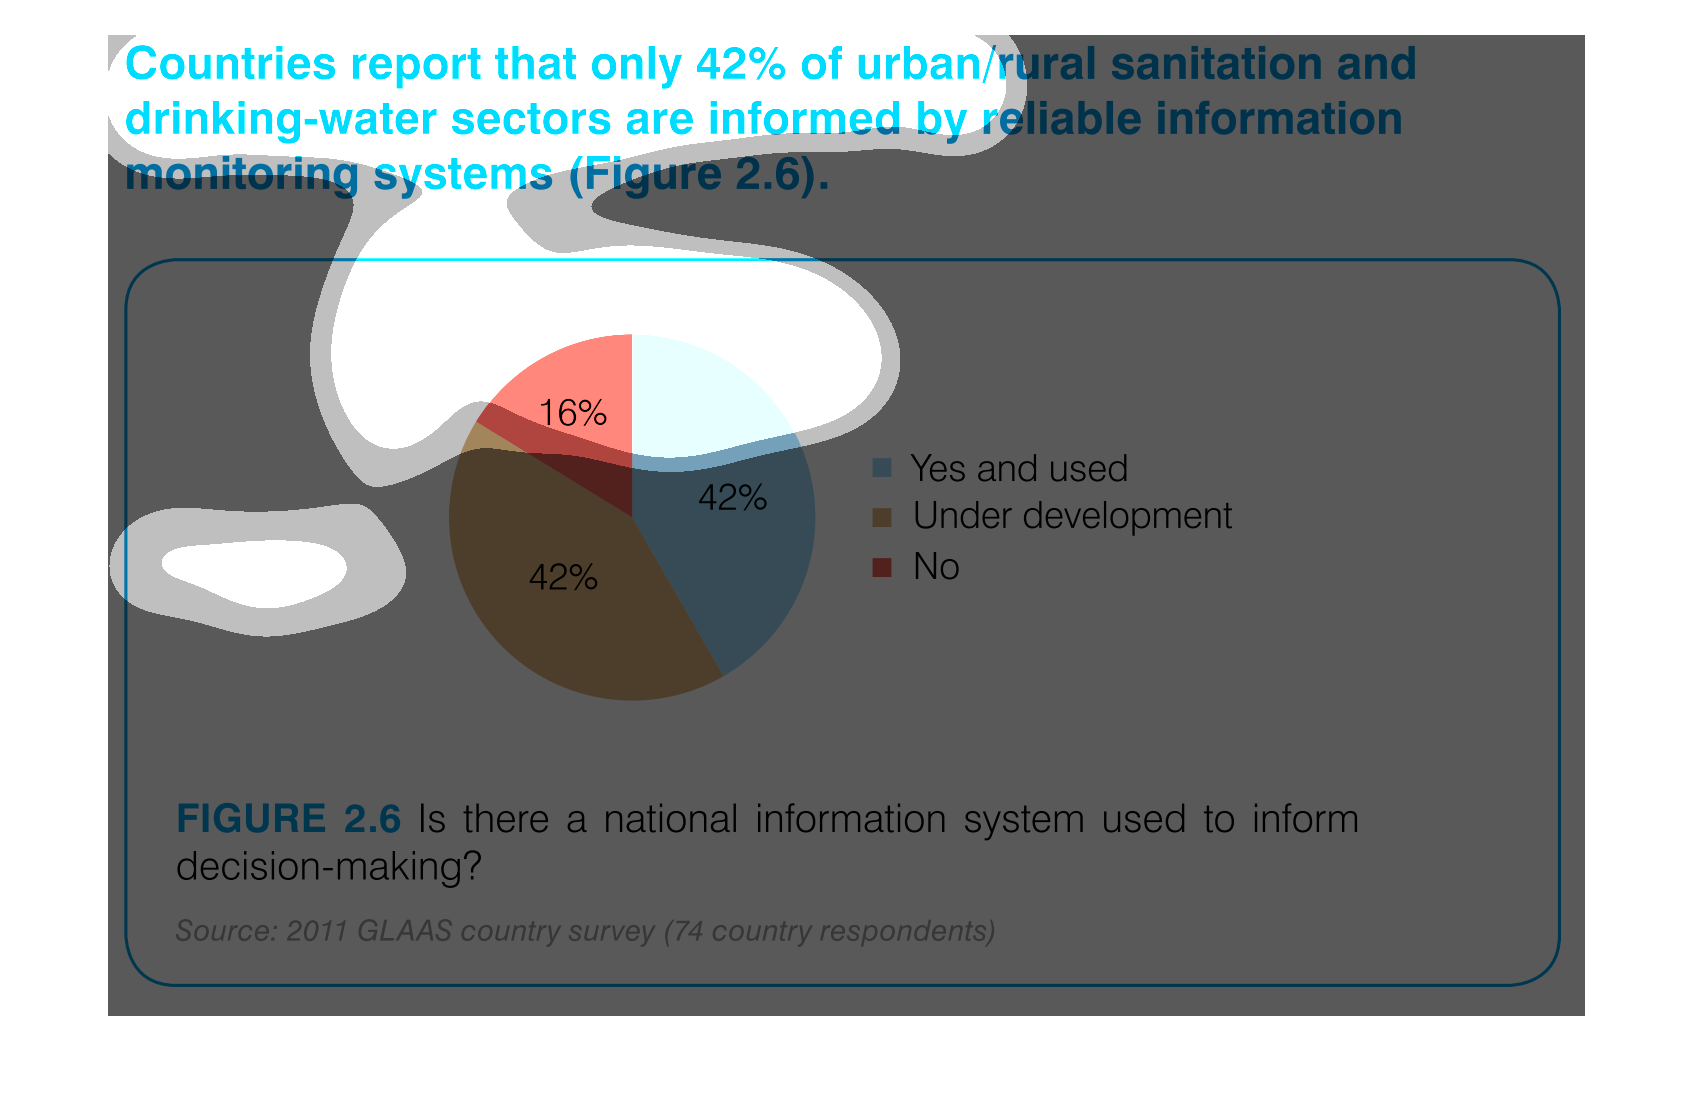
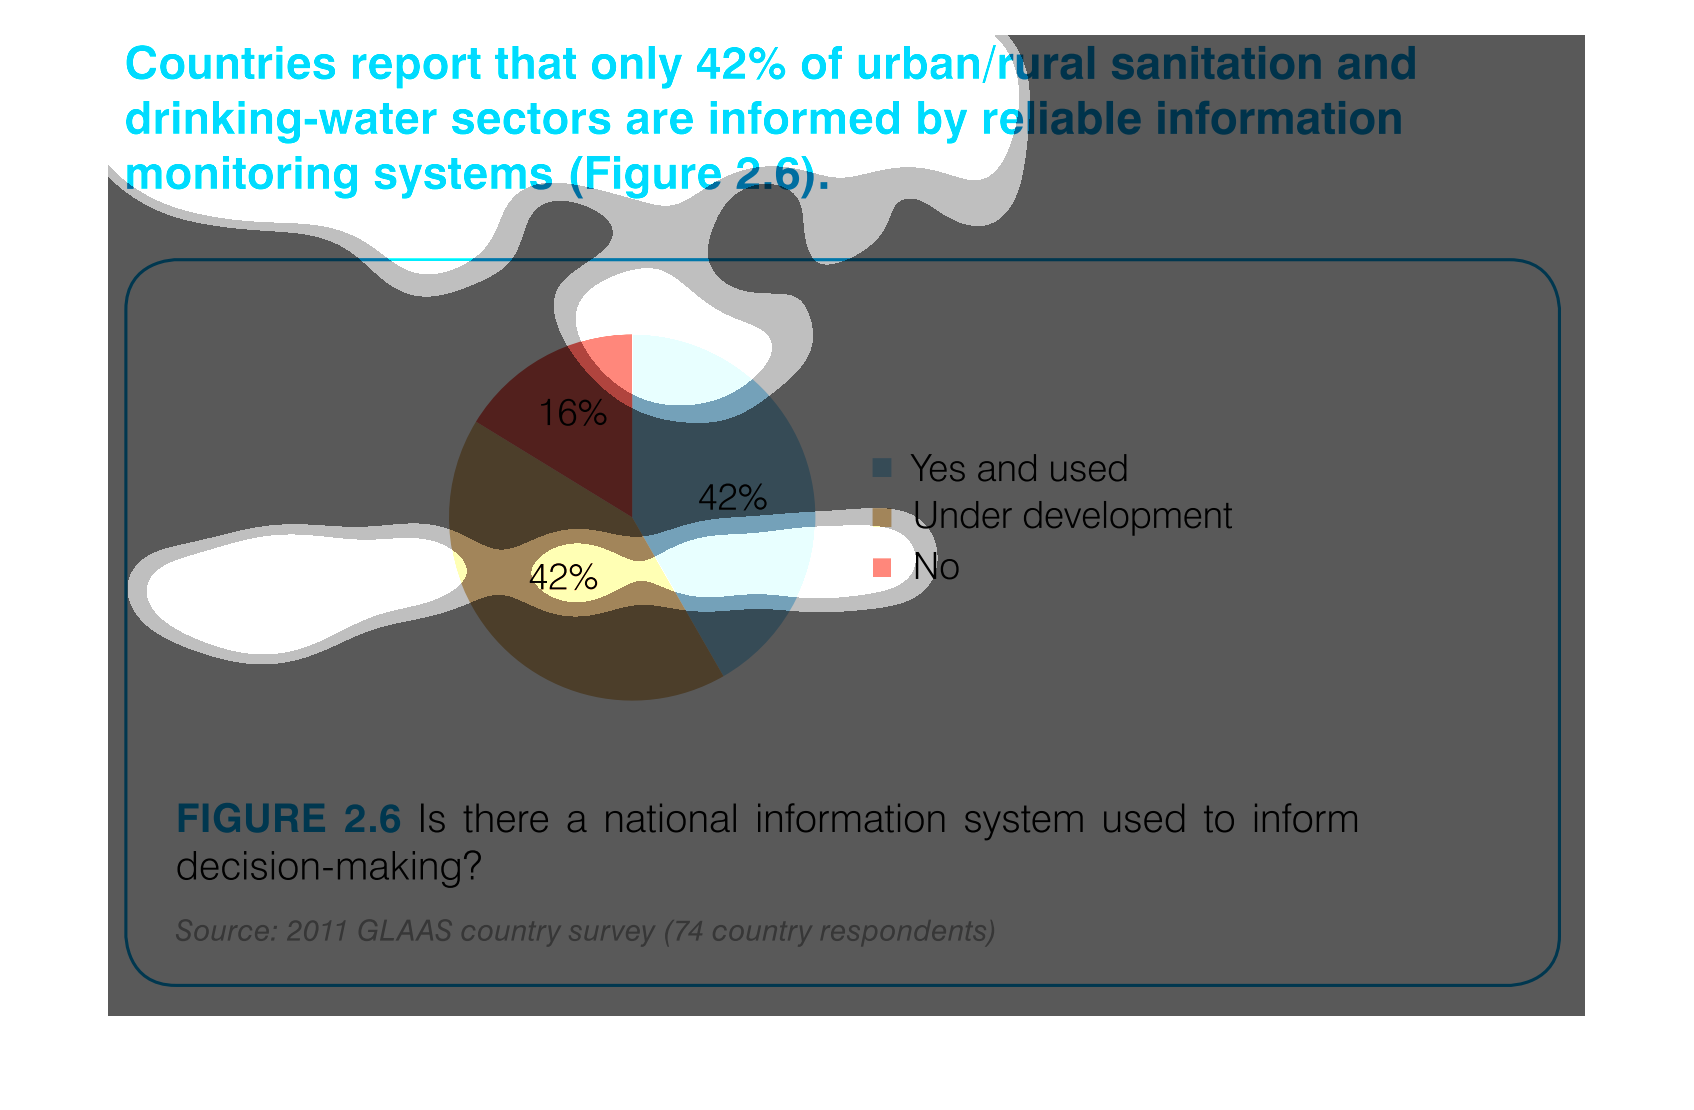
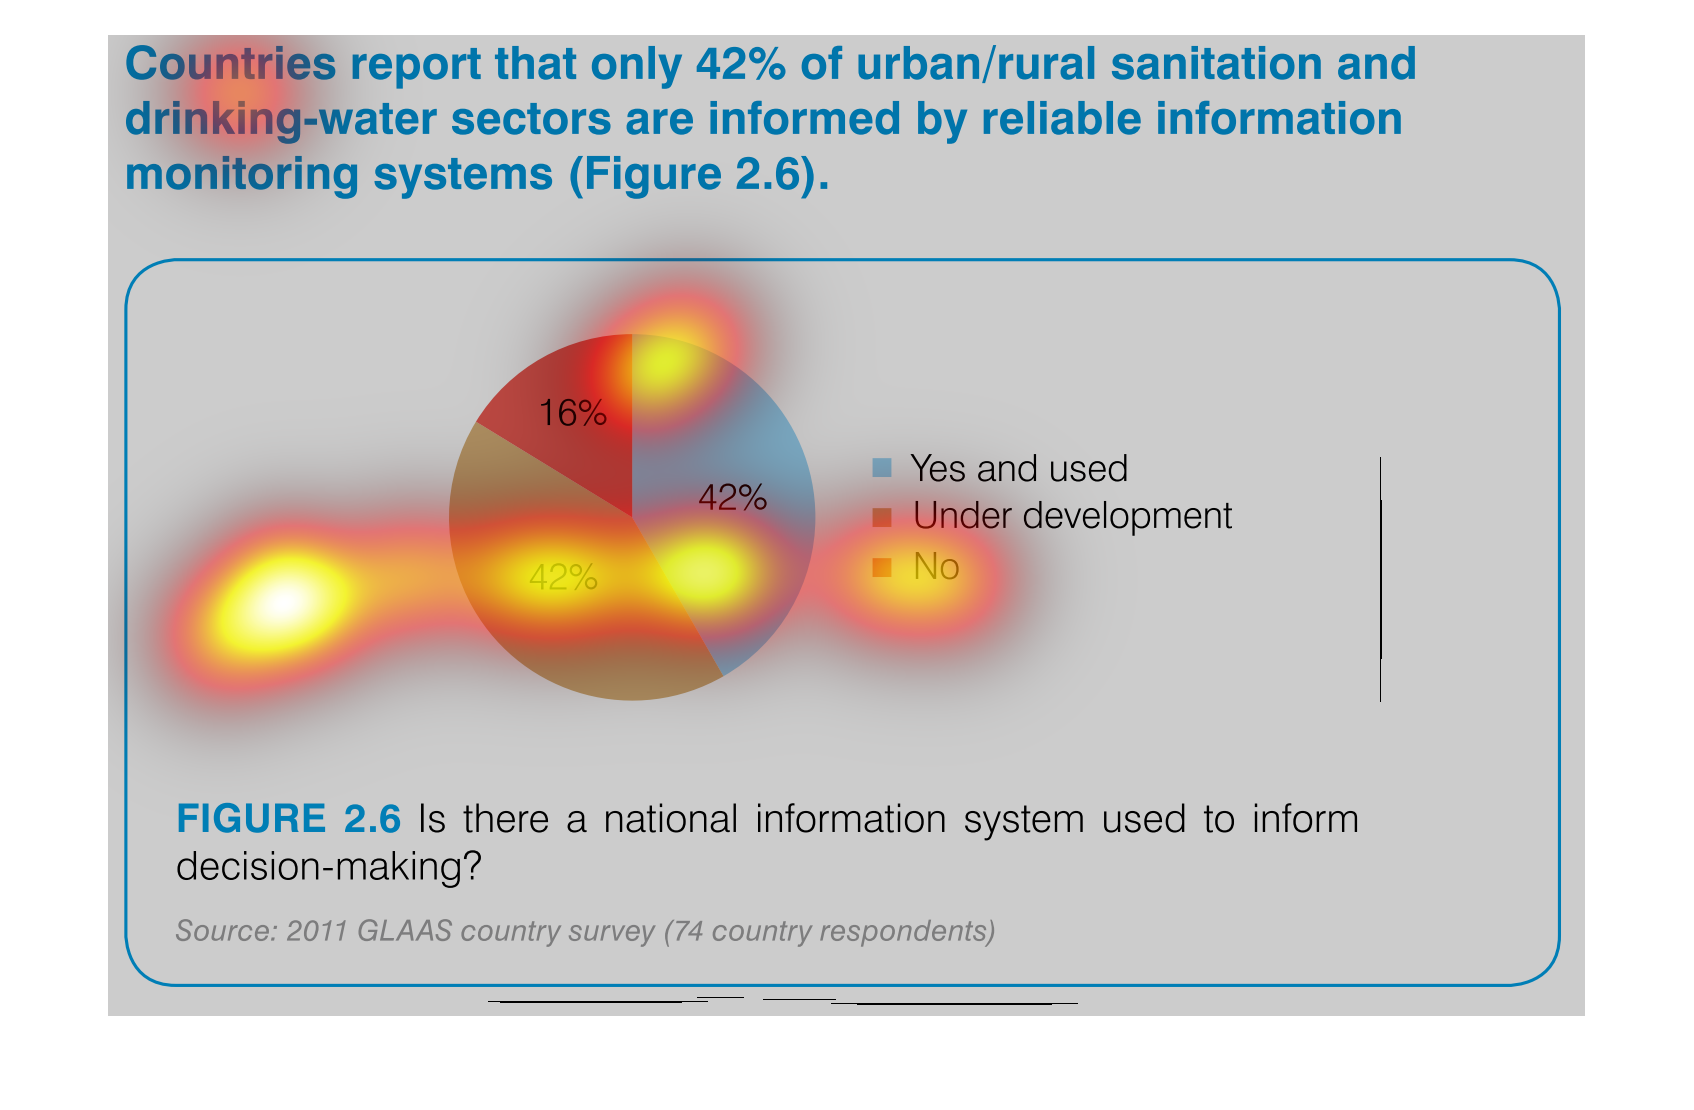
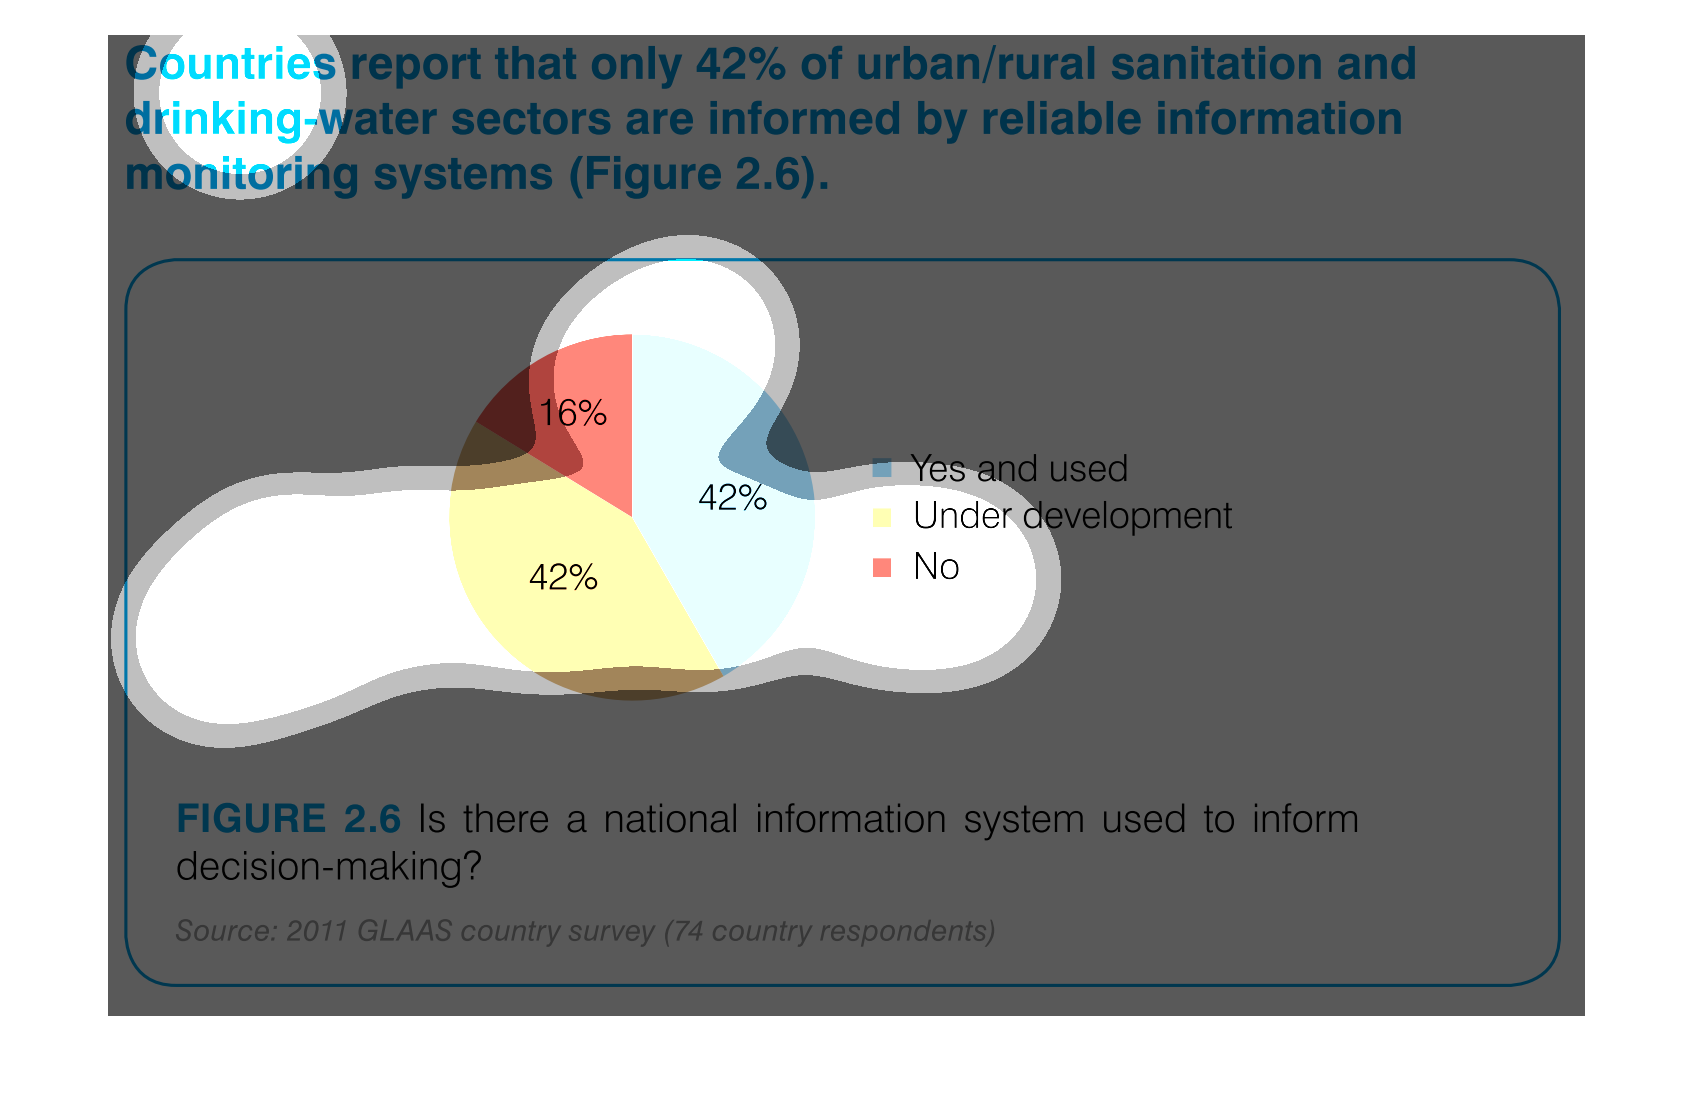
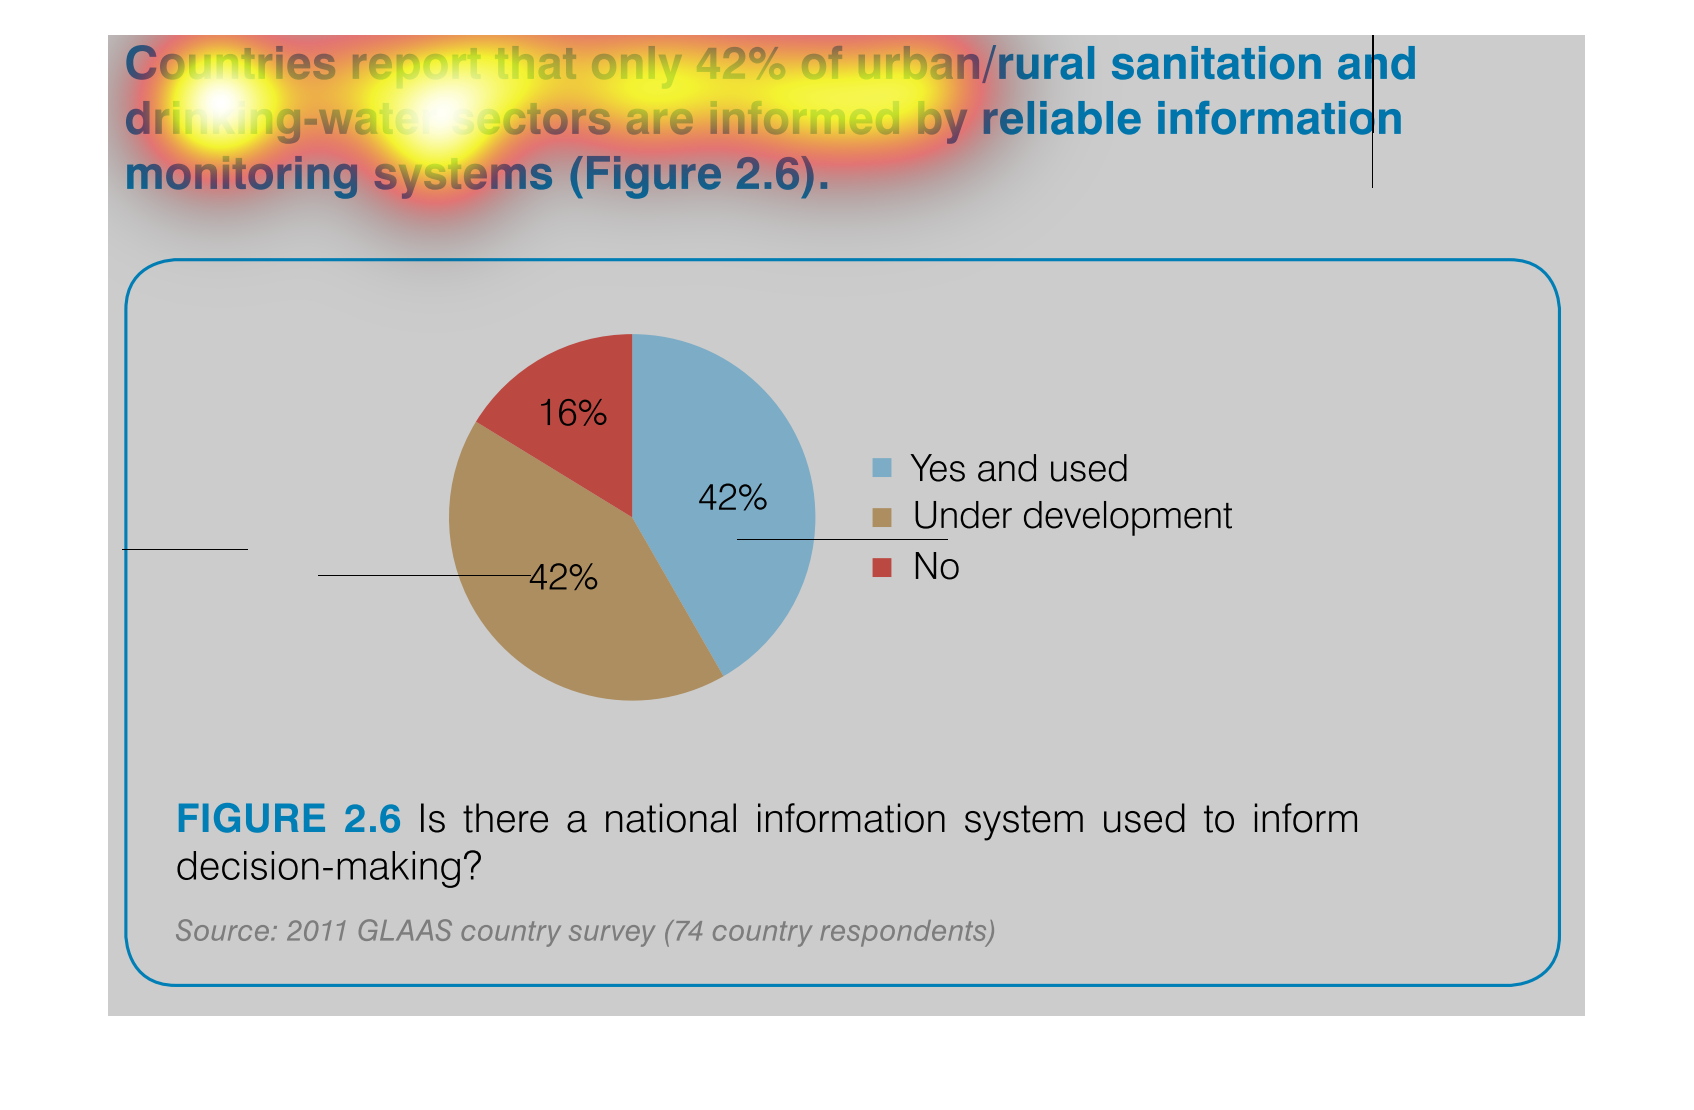
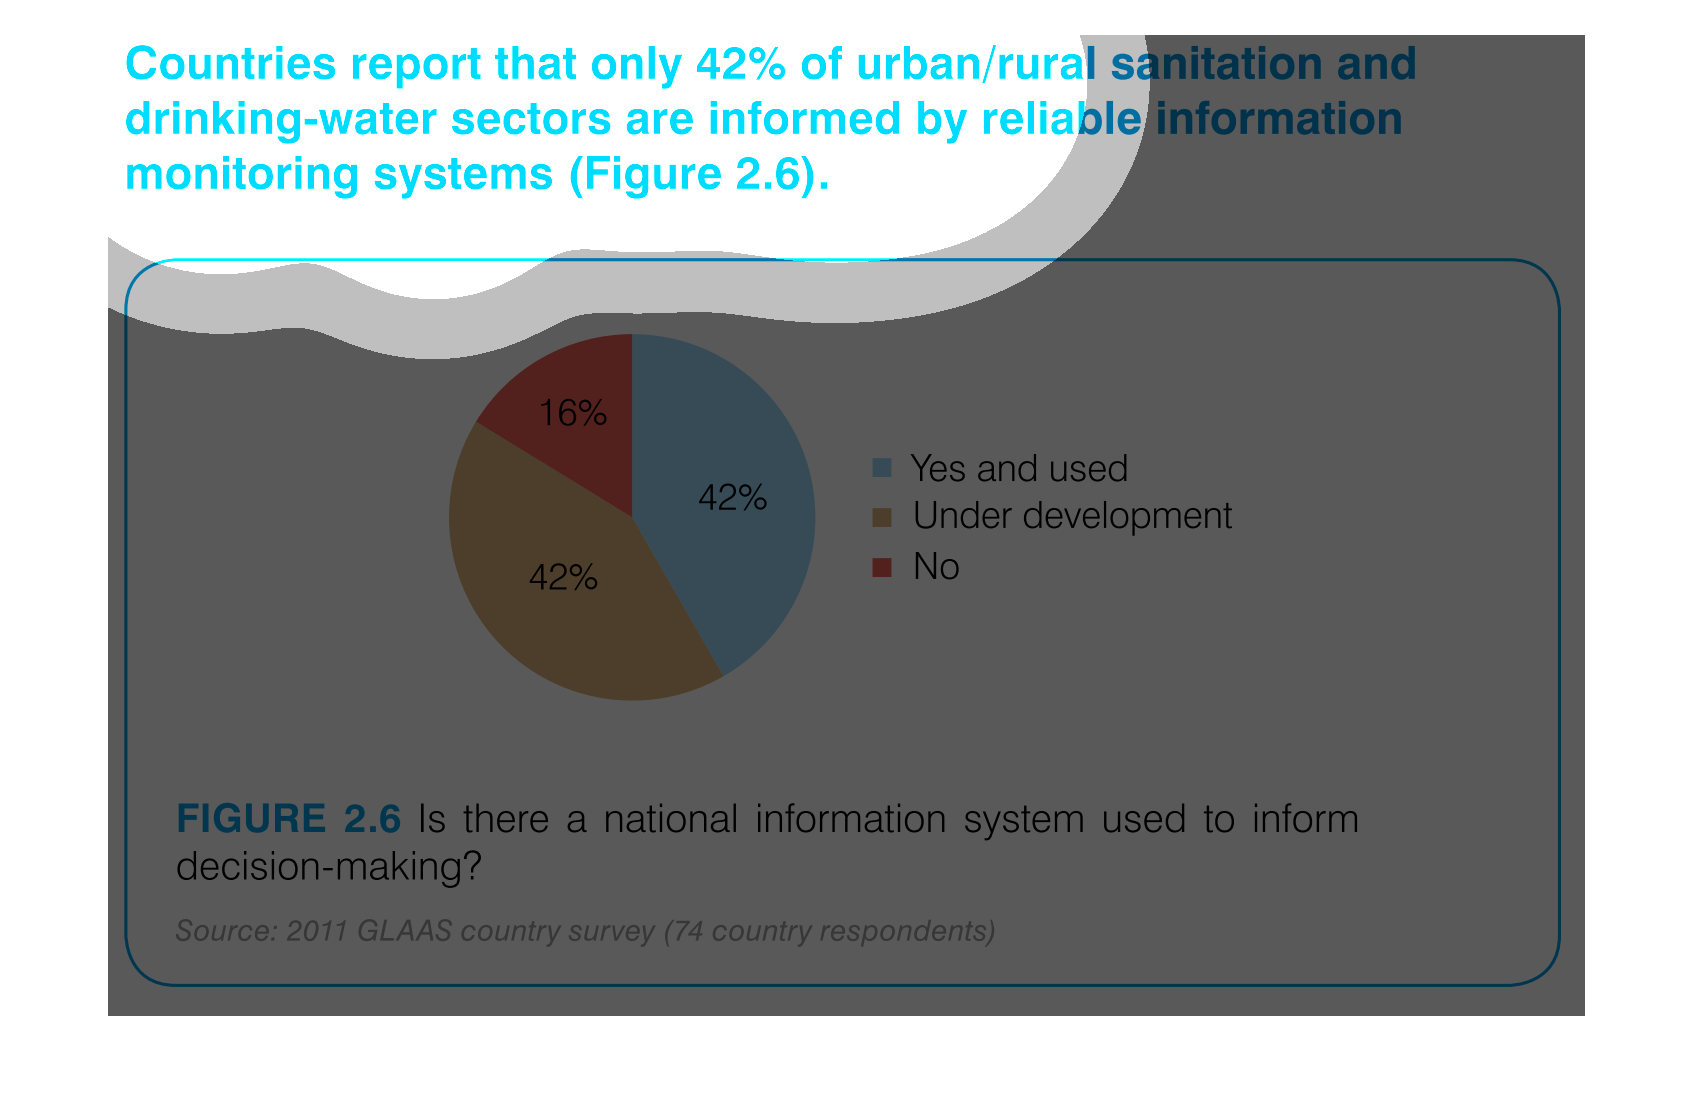
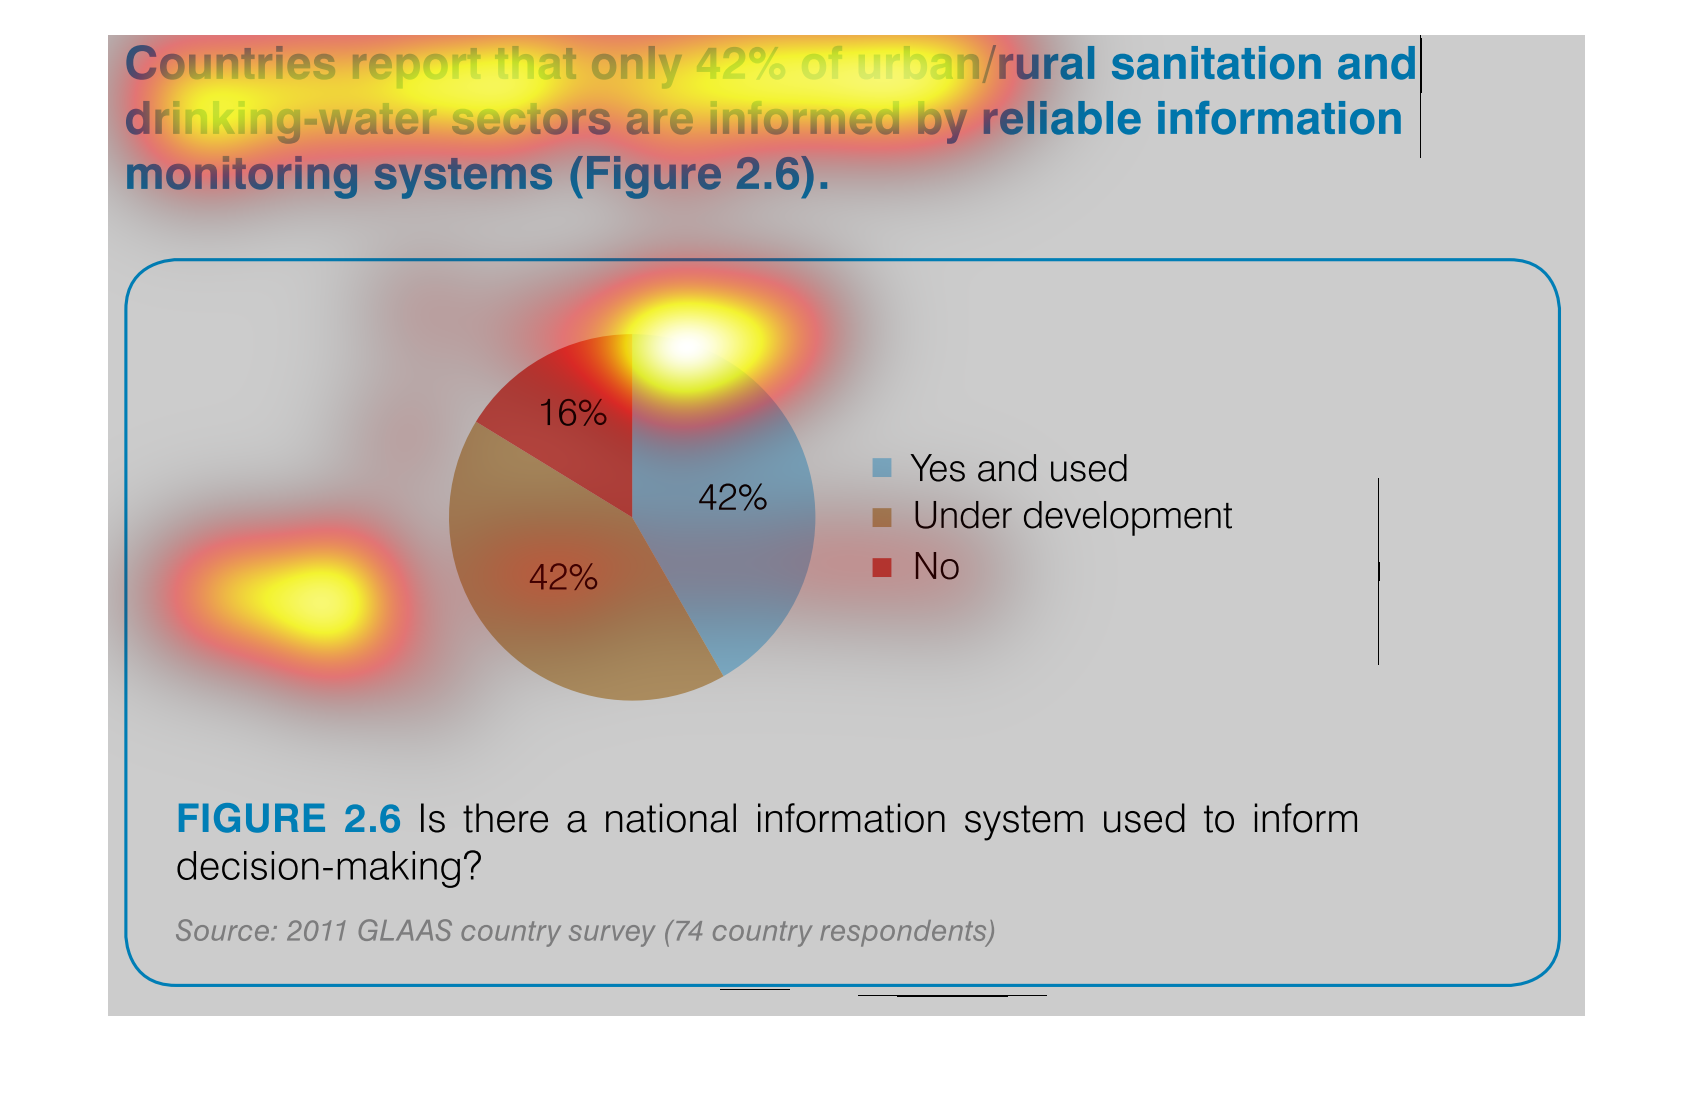
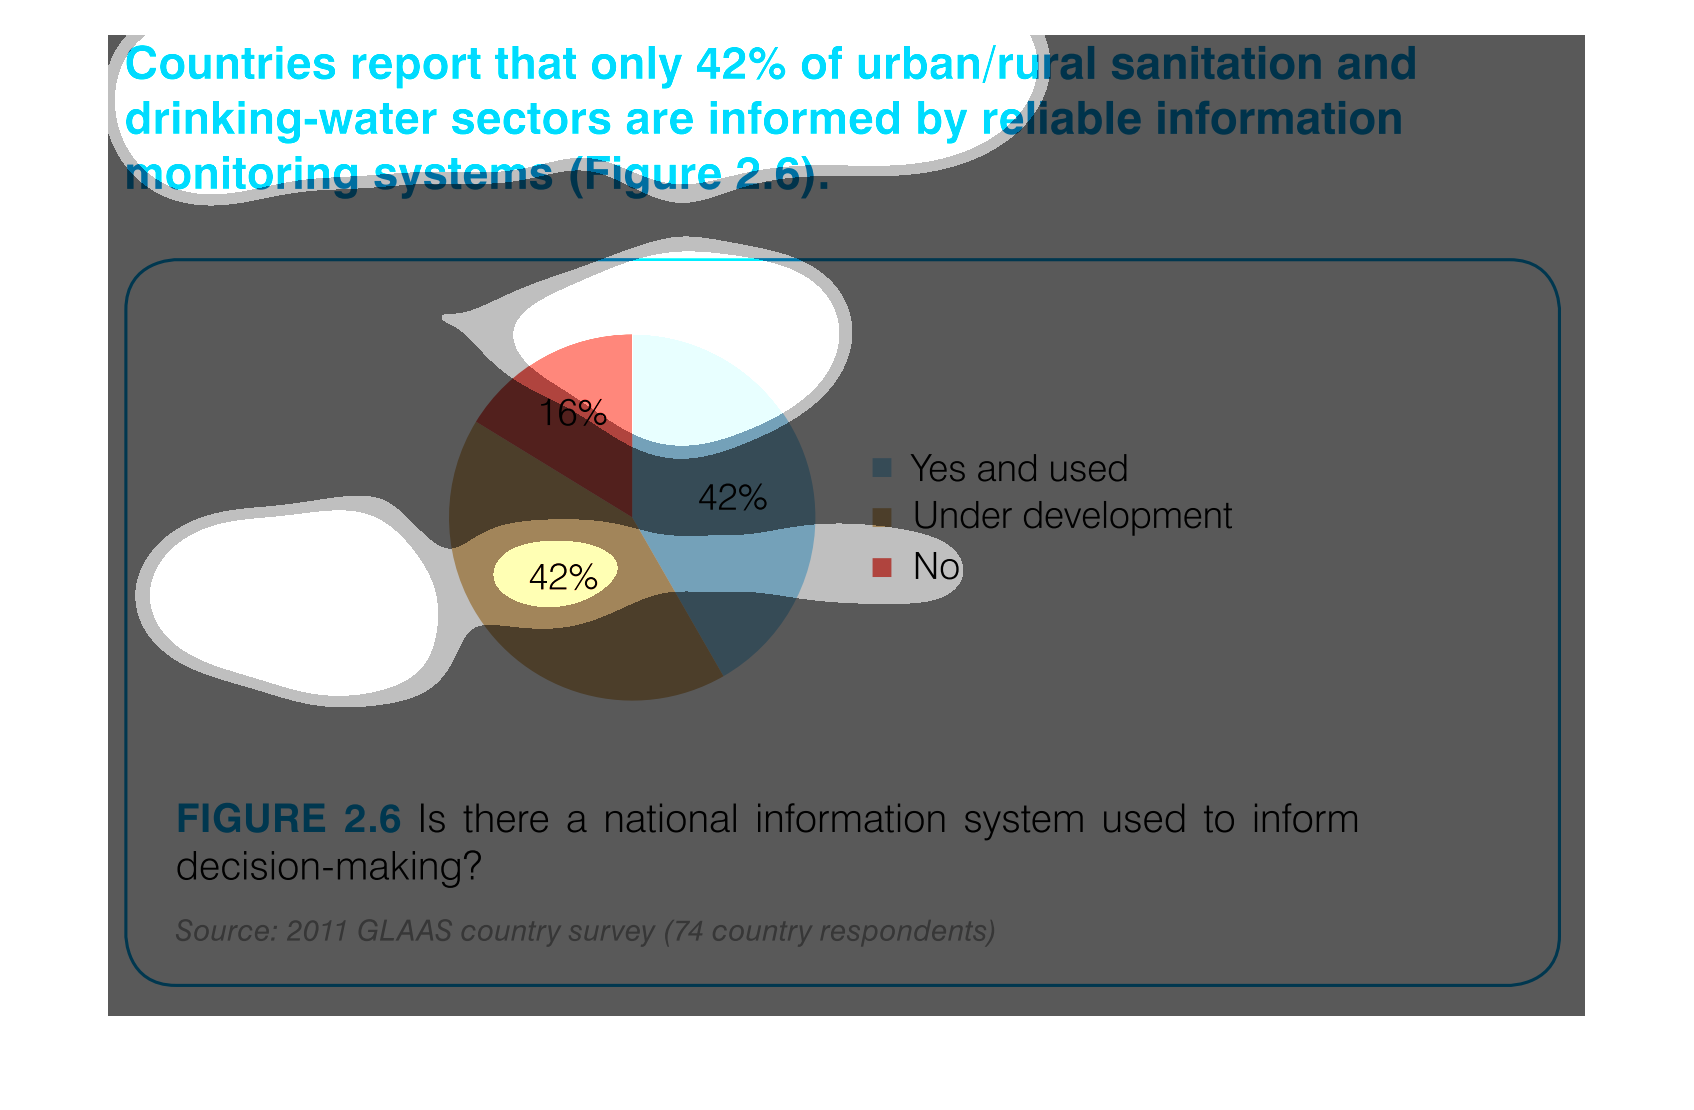
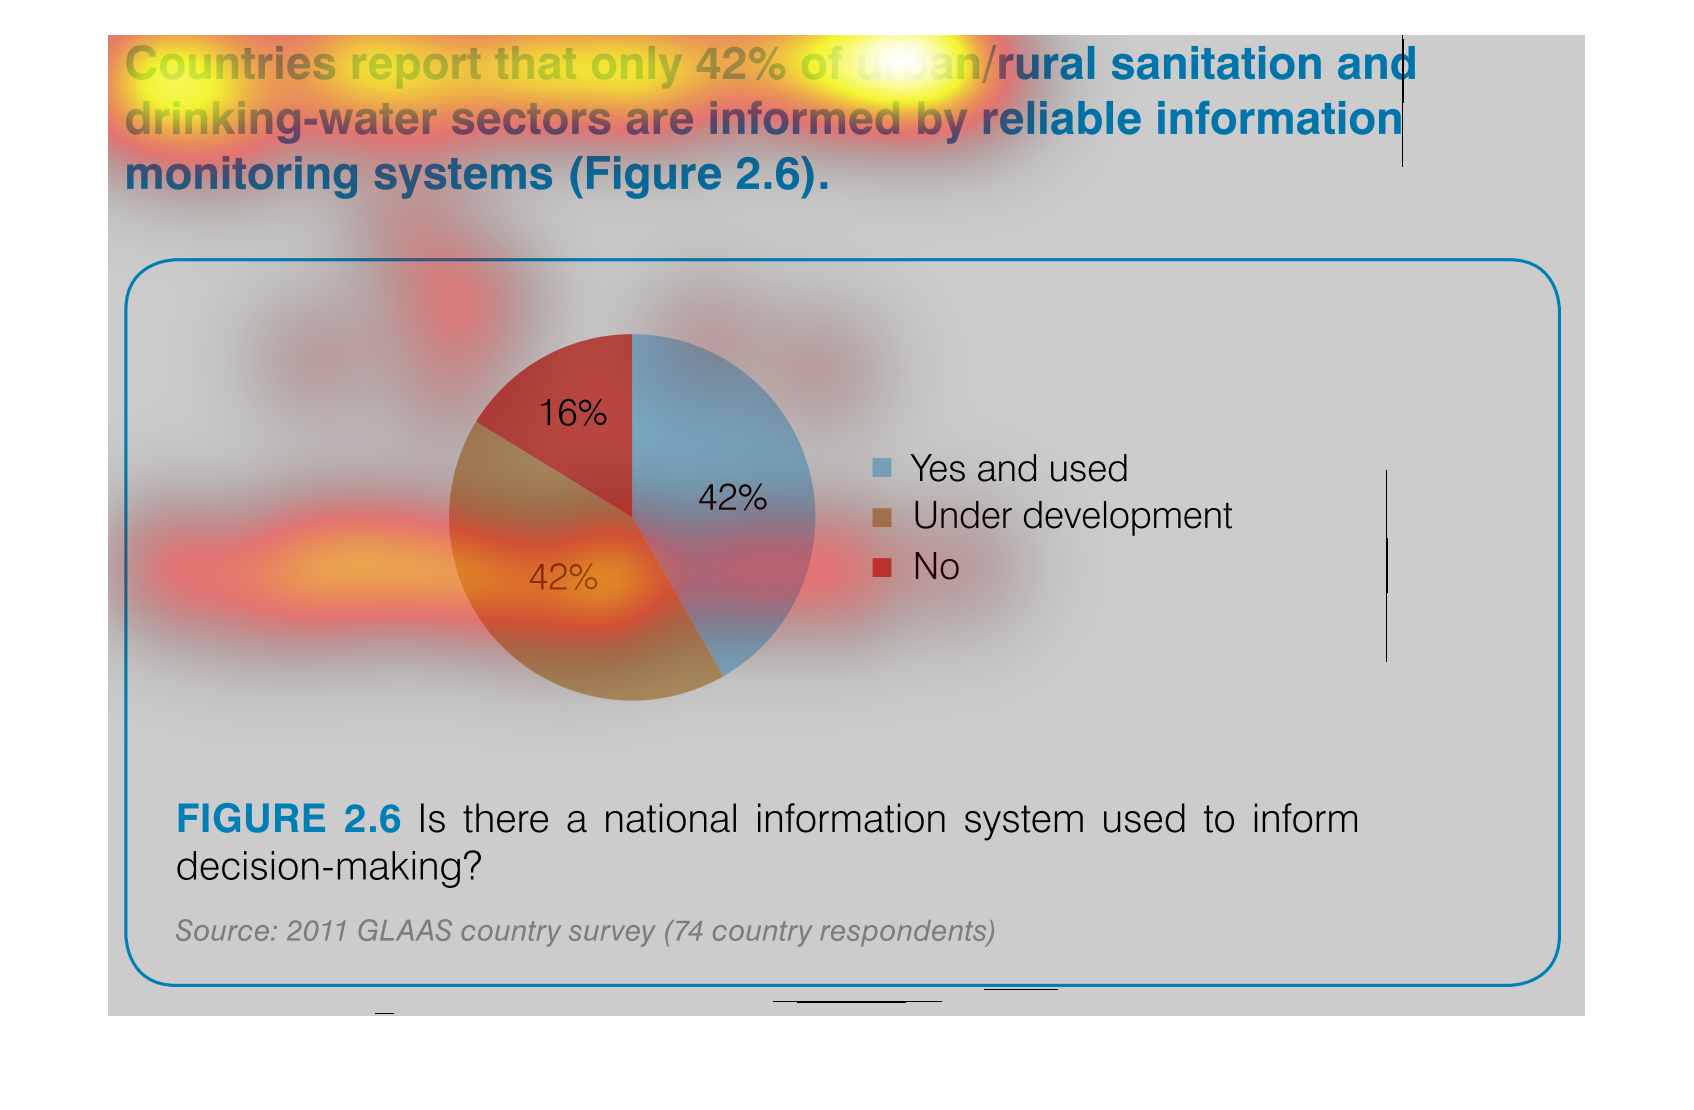
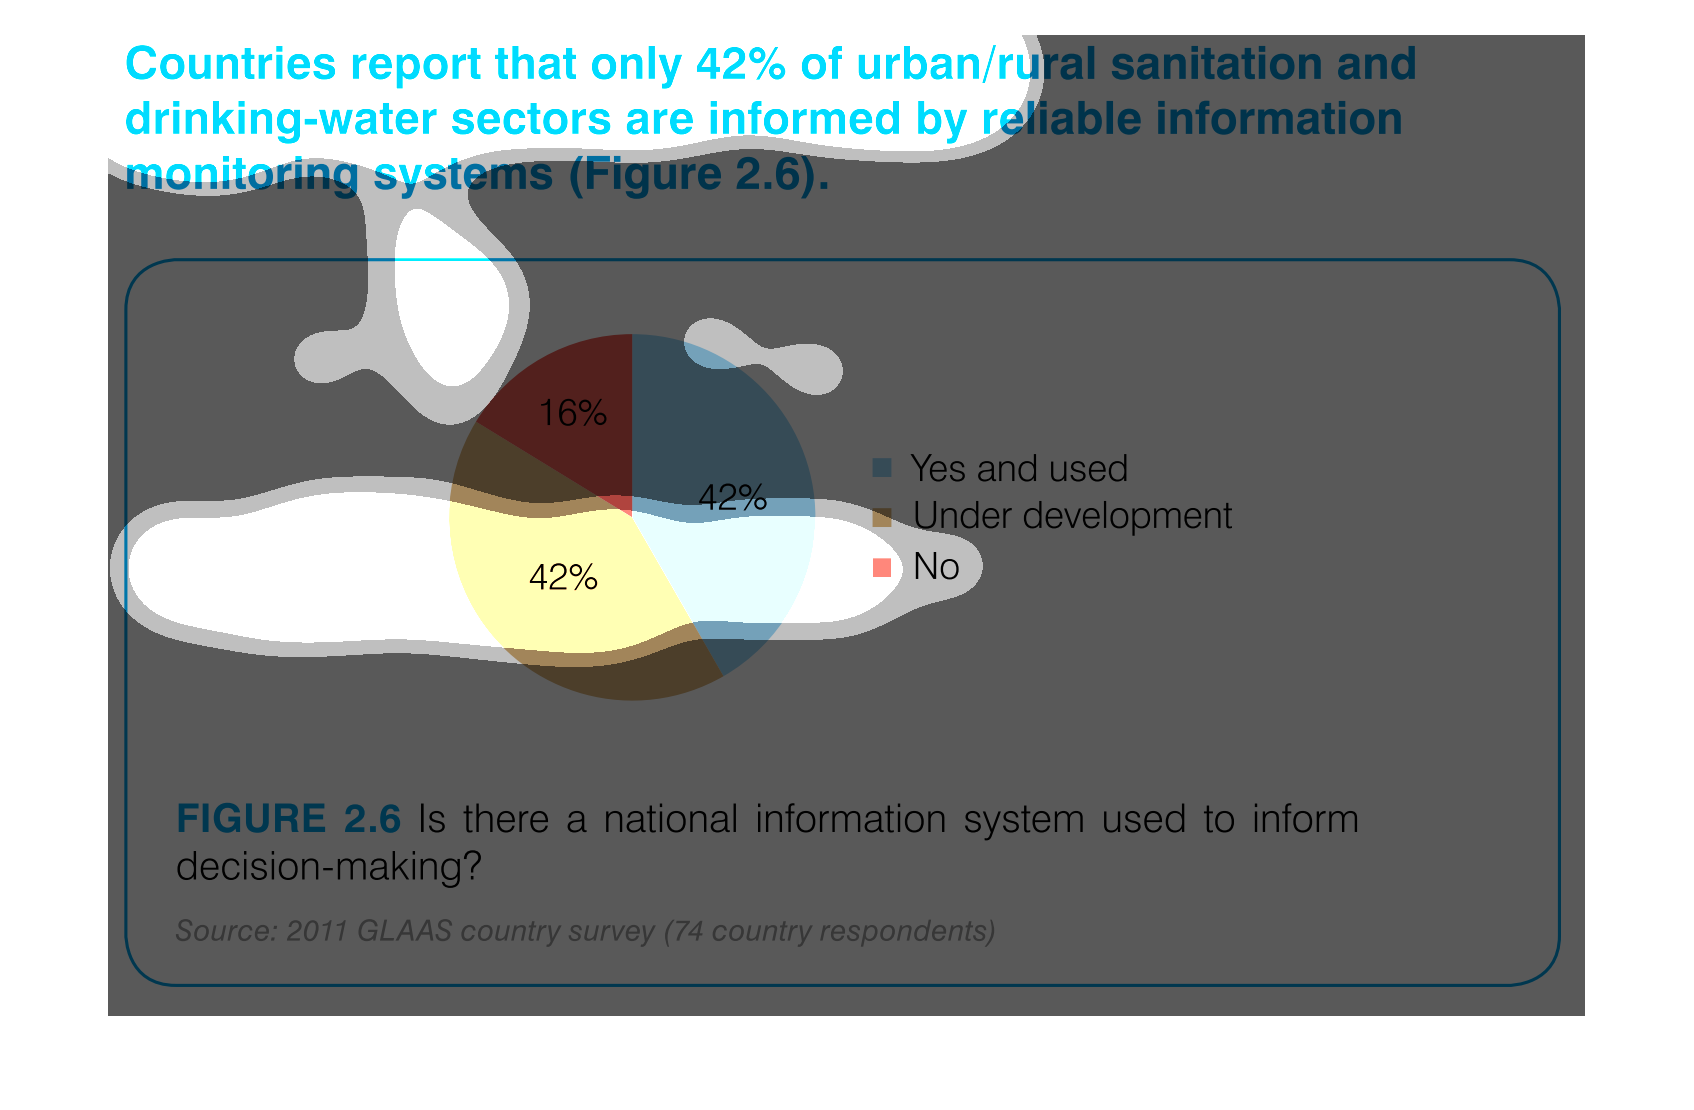
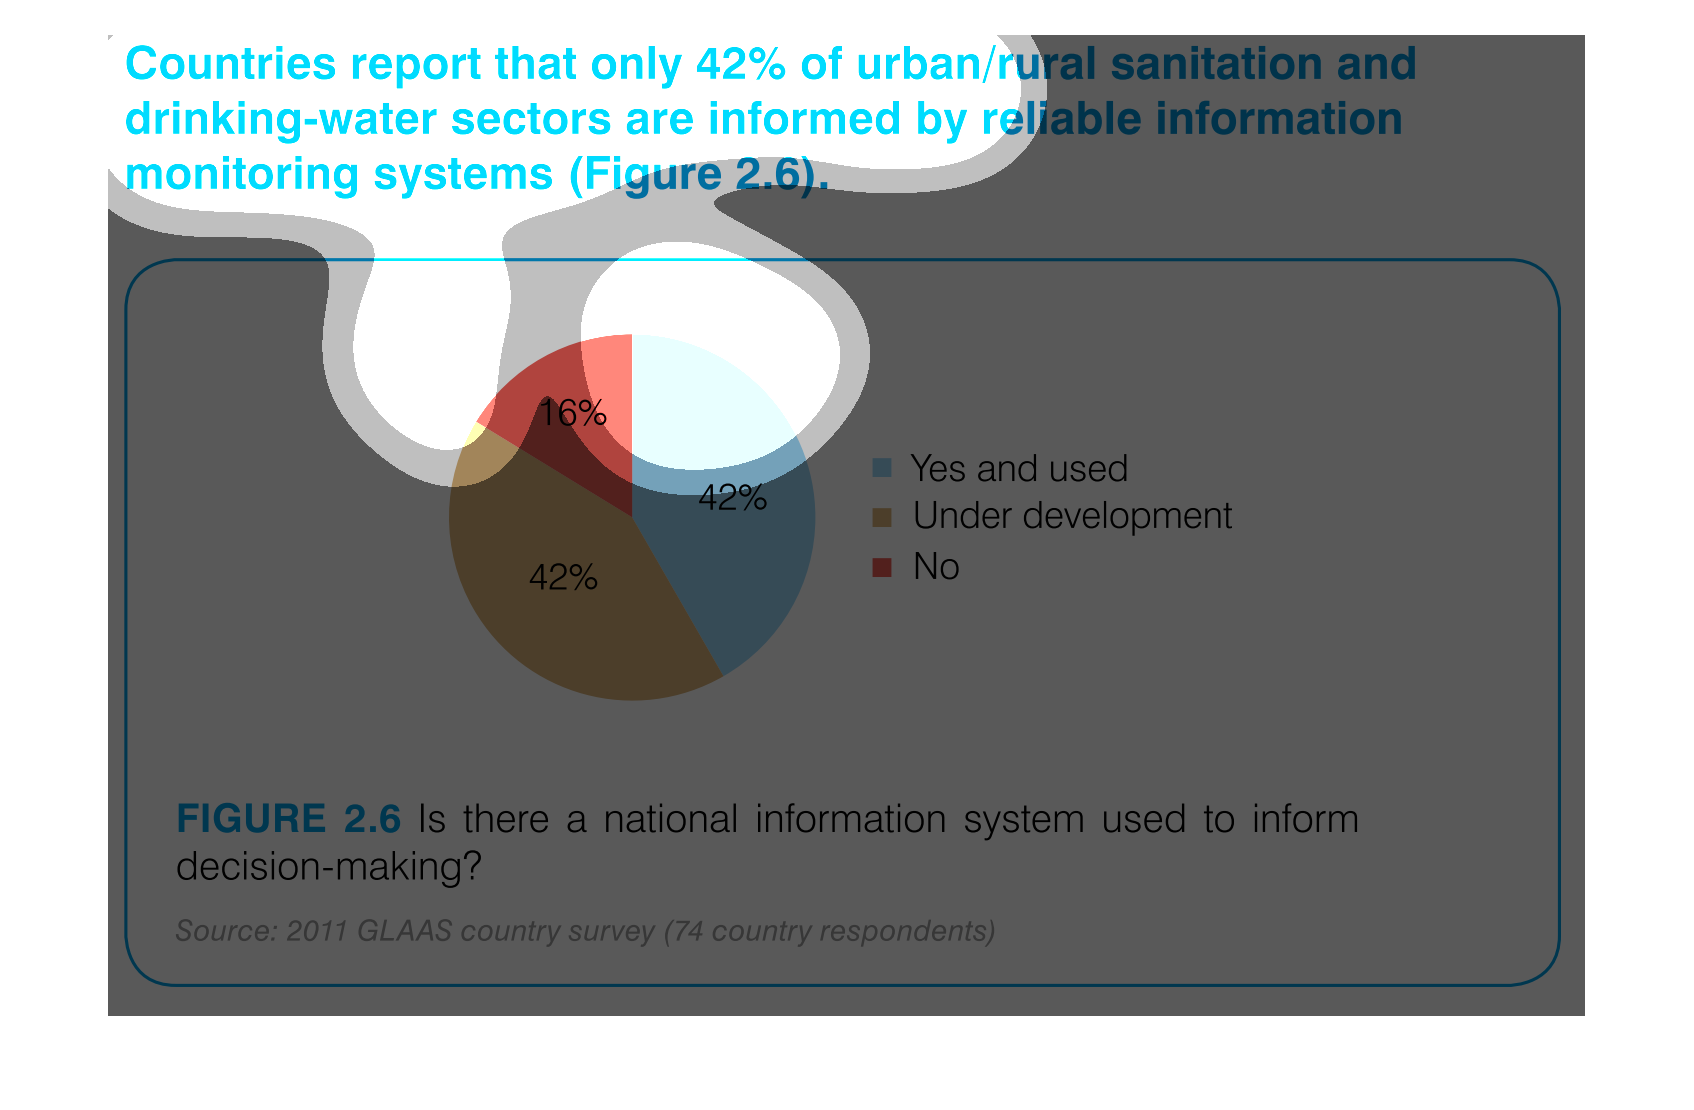
This charts shows that countries report that only 42 percent of urban/rural sanitation and
drinking-water sectors are informed by reliable information monitoring system.  Fourty-two
percent reported as "yes and used", fourty-two percent reported "under development", and sixteen
percent "no".
This is a chart showing the percentage of countries that say that their water and sanitation
sources are from reliable source. They report that only 42 percent of sources are reliable.
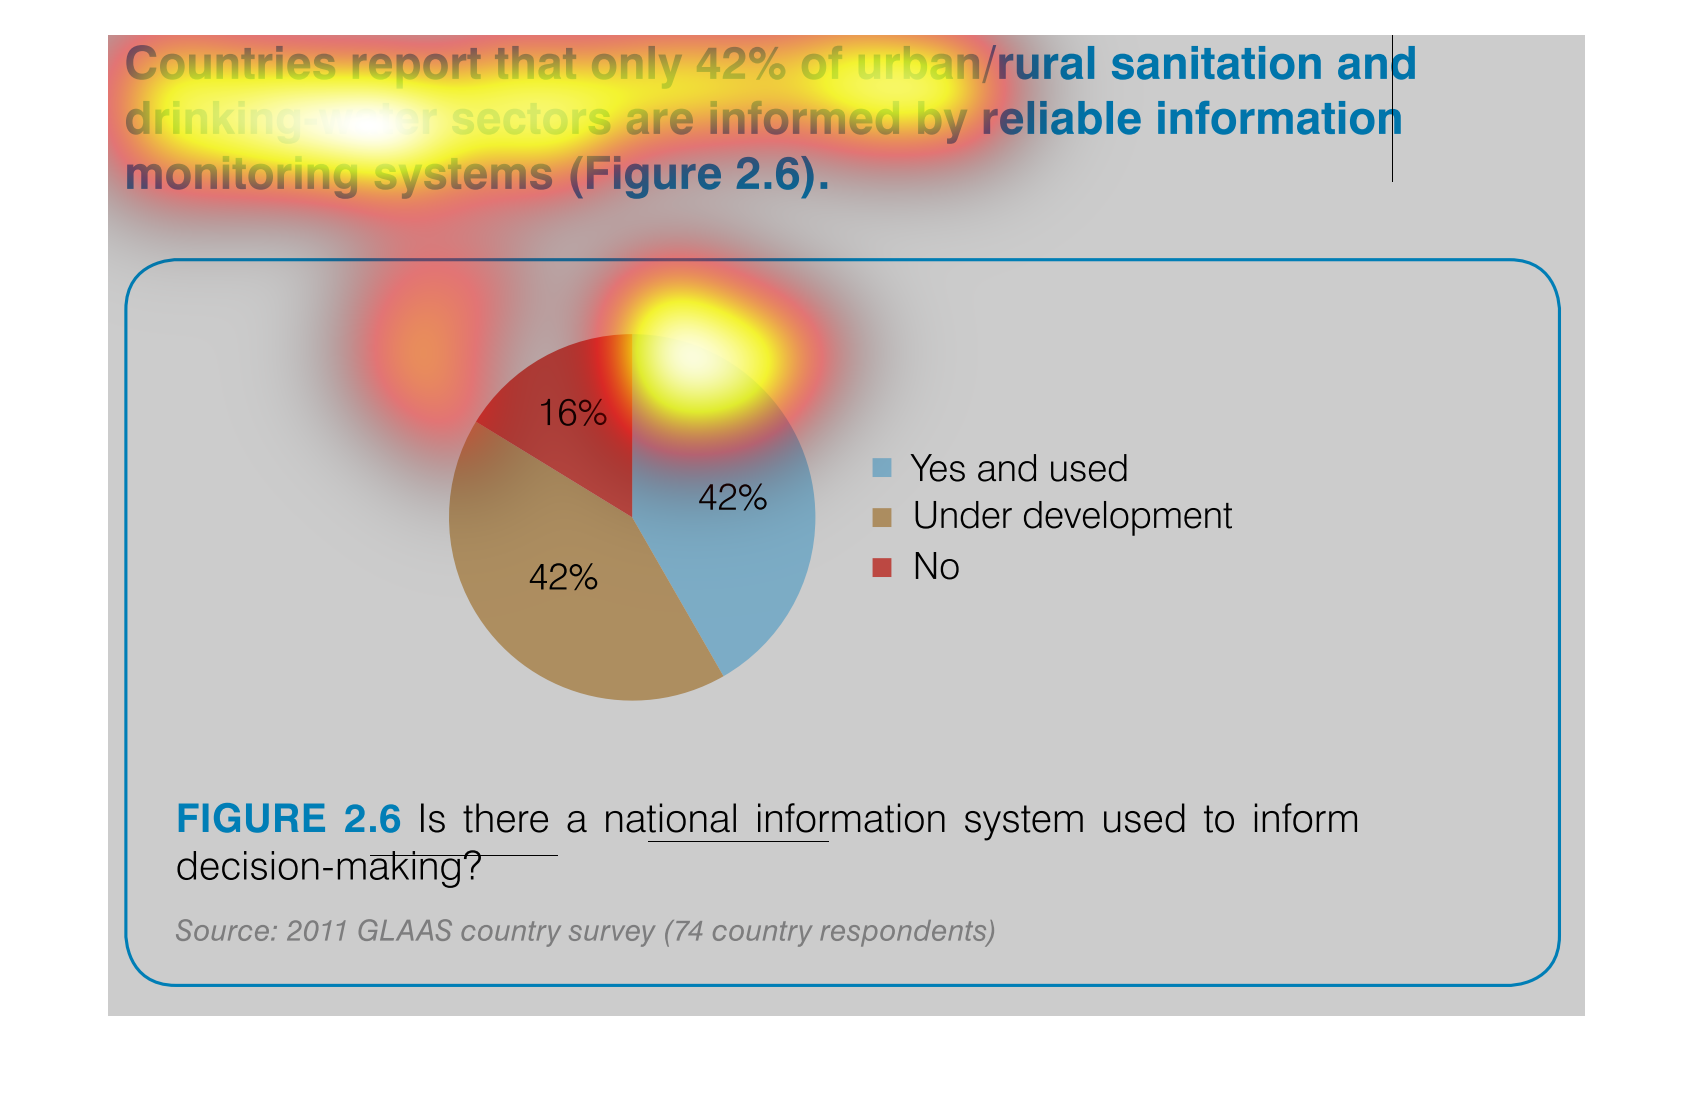
The graph on the left hand side is a pie chart showing that countries report that only 42%
of rural/urban sanitation and drinking water are informed by reliable information monitoring.
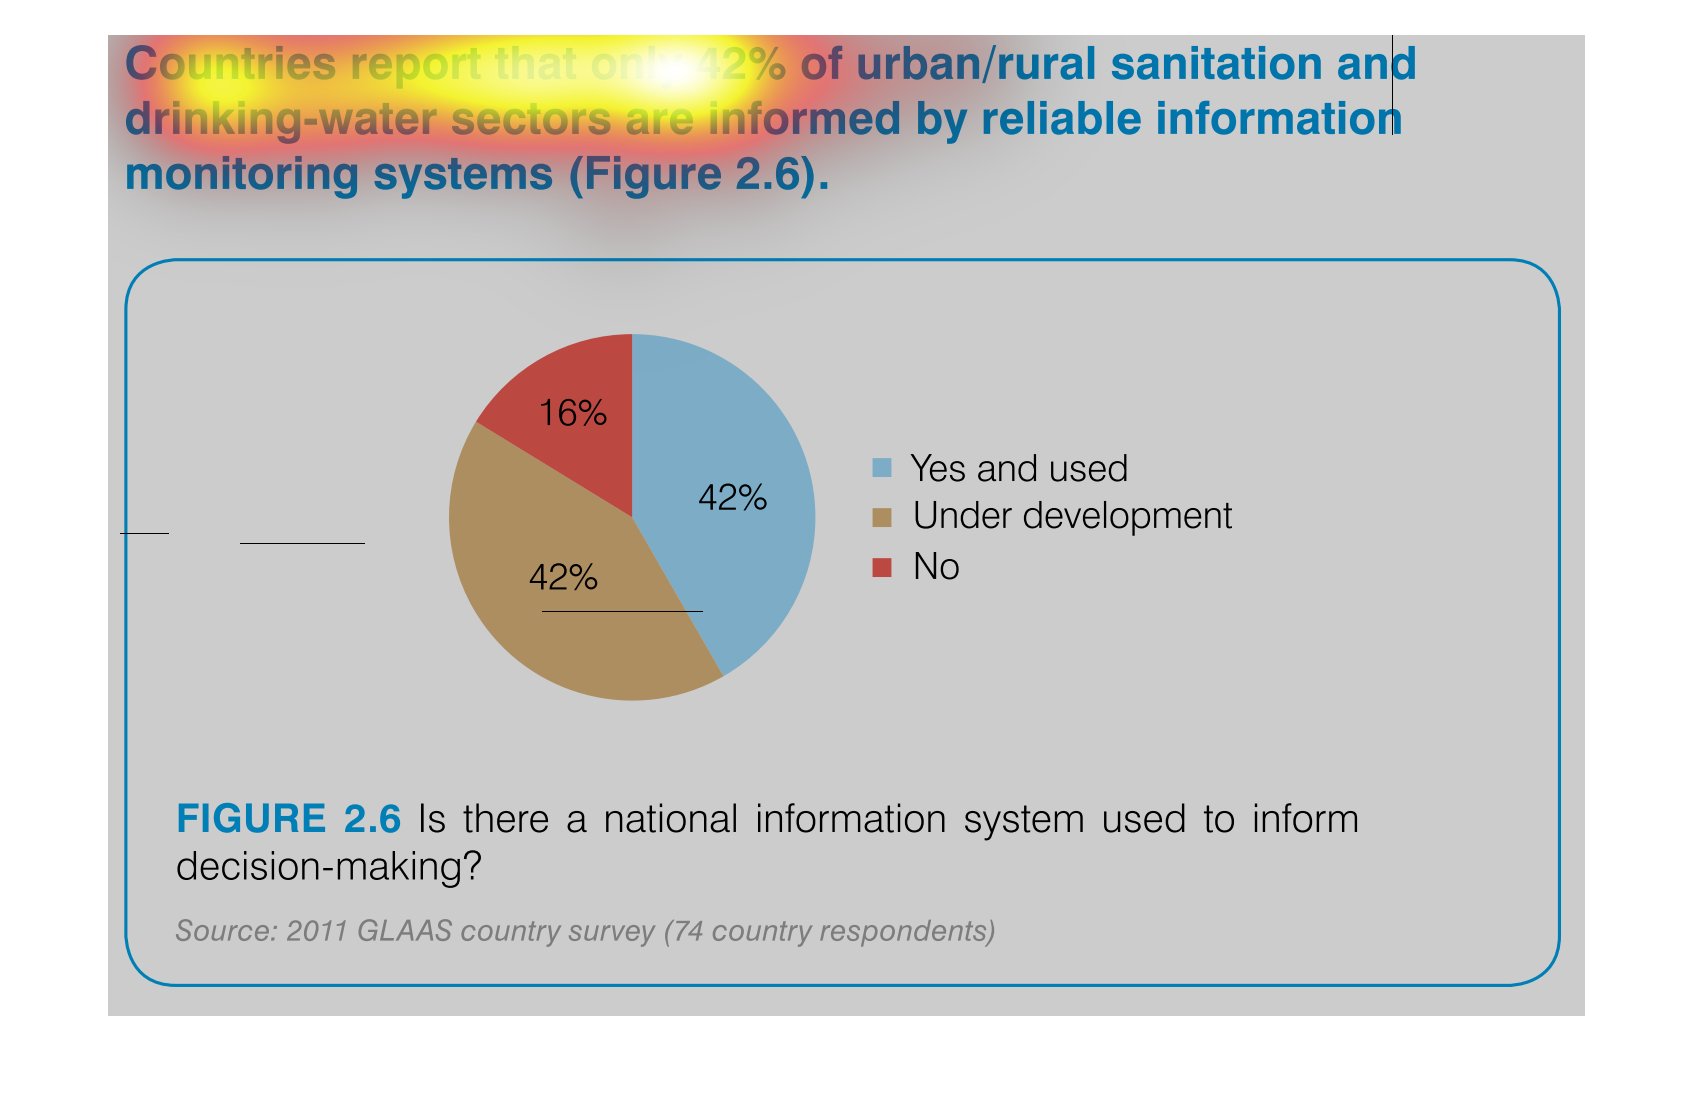
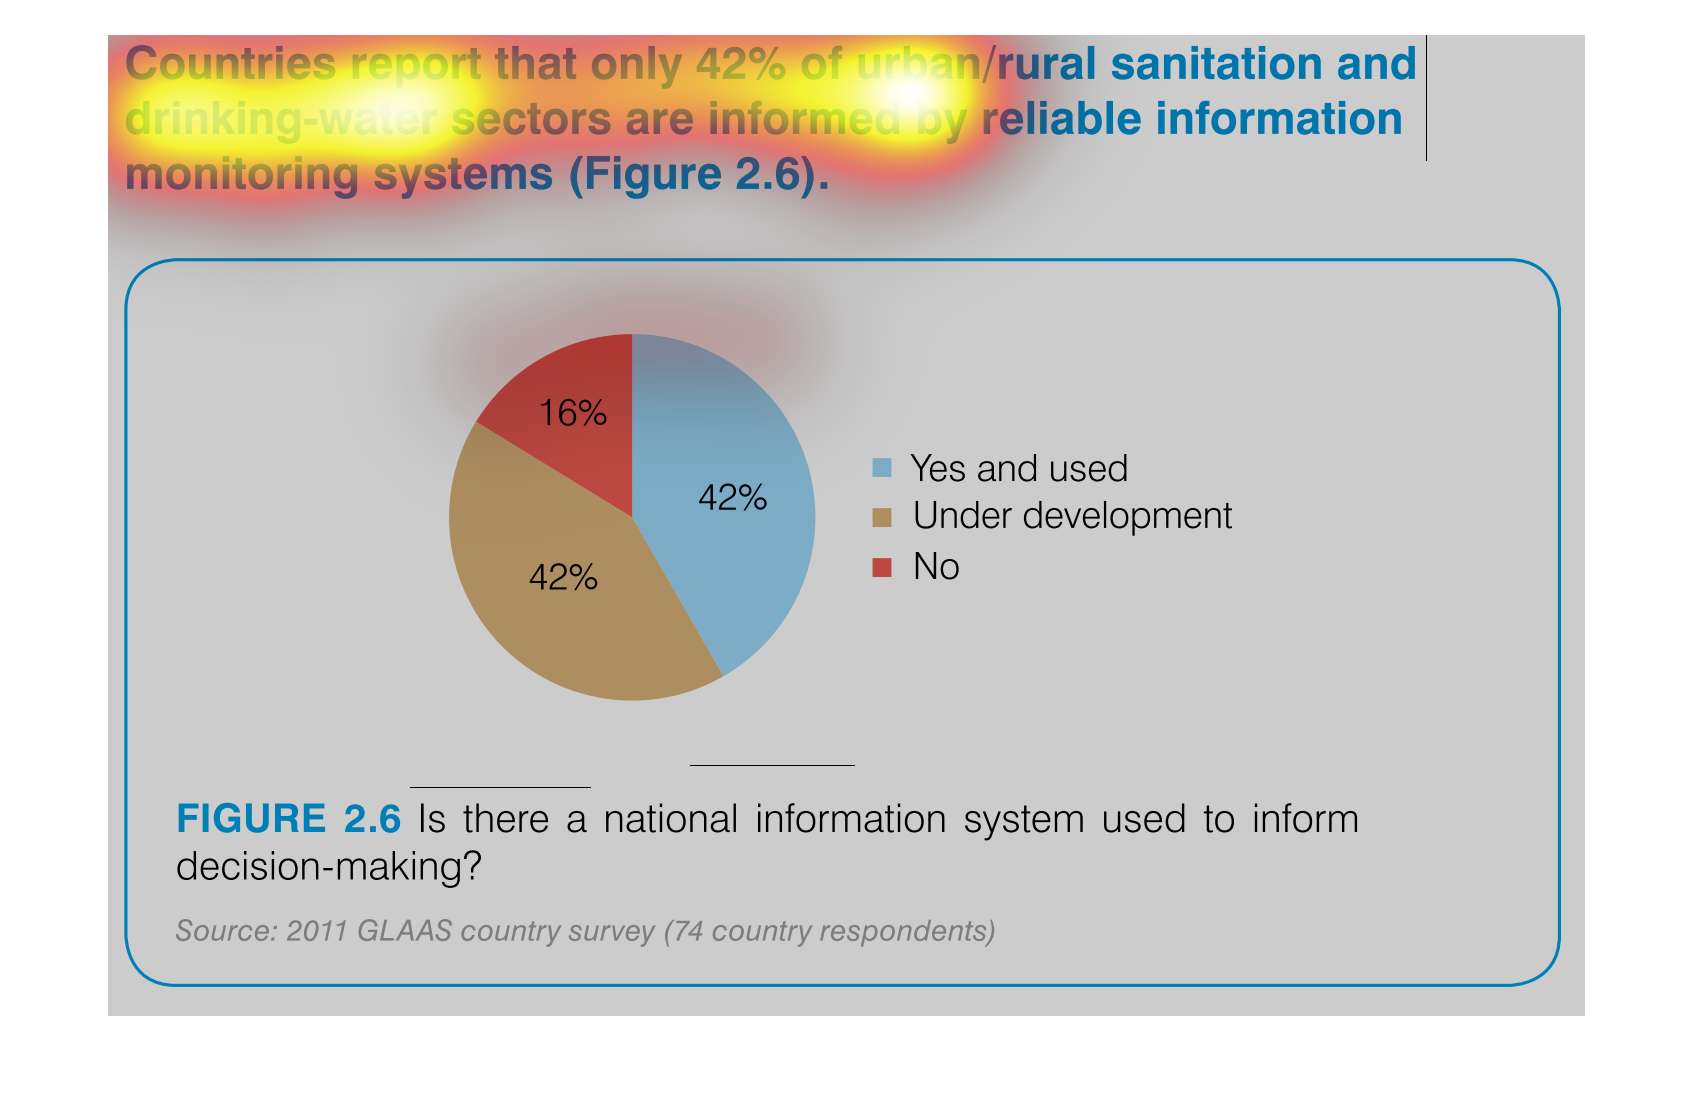
This graph illustrates whether there is a national information system used to inform decision
making.  The repsonses are yes, undecided, and no with yes being in the majority.
This handmade chart shows that most people do not think that the public water system is healthy
and safe to drink. It does not specify source or region
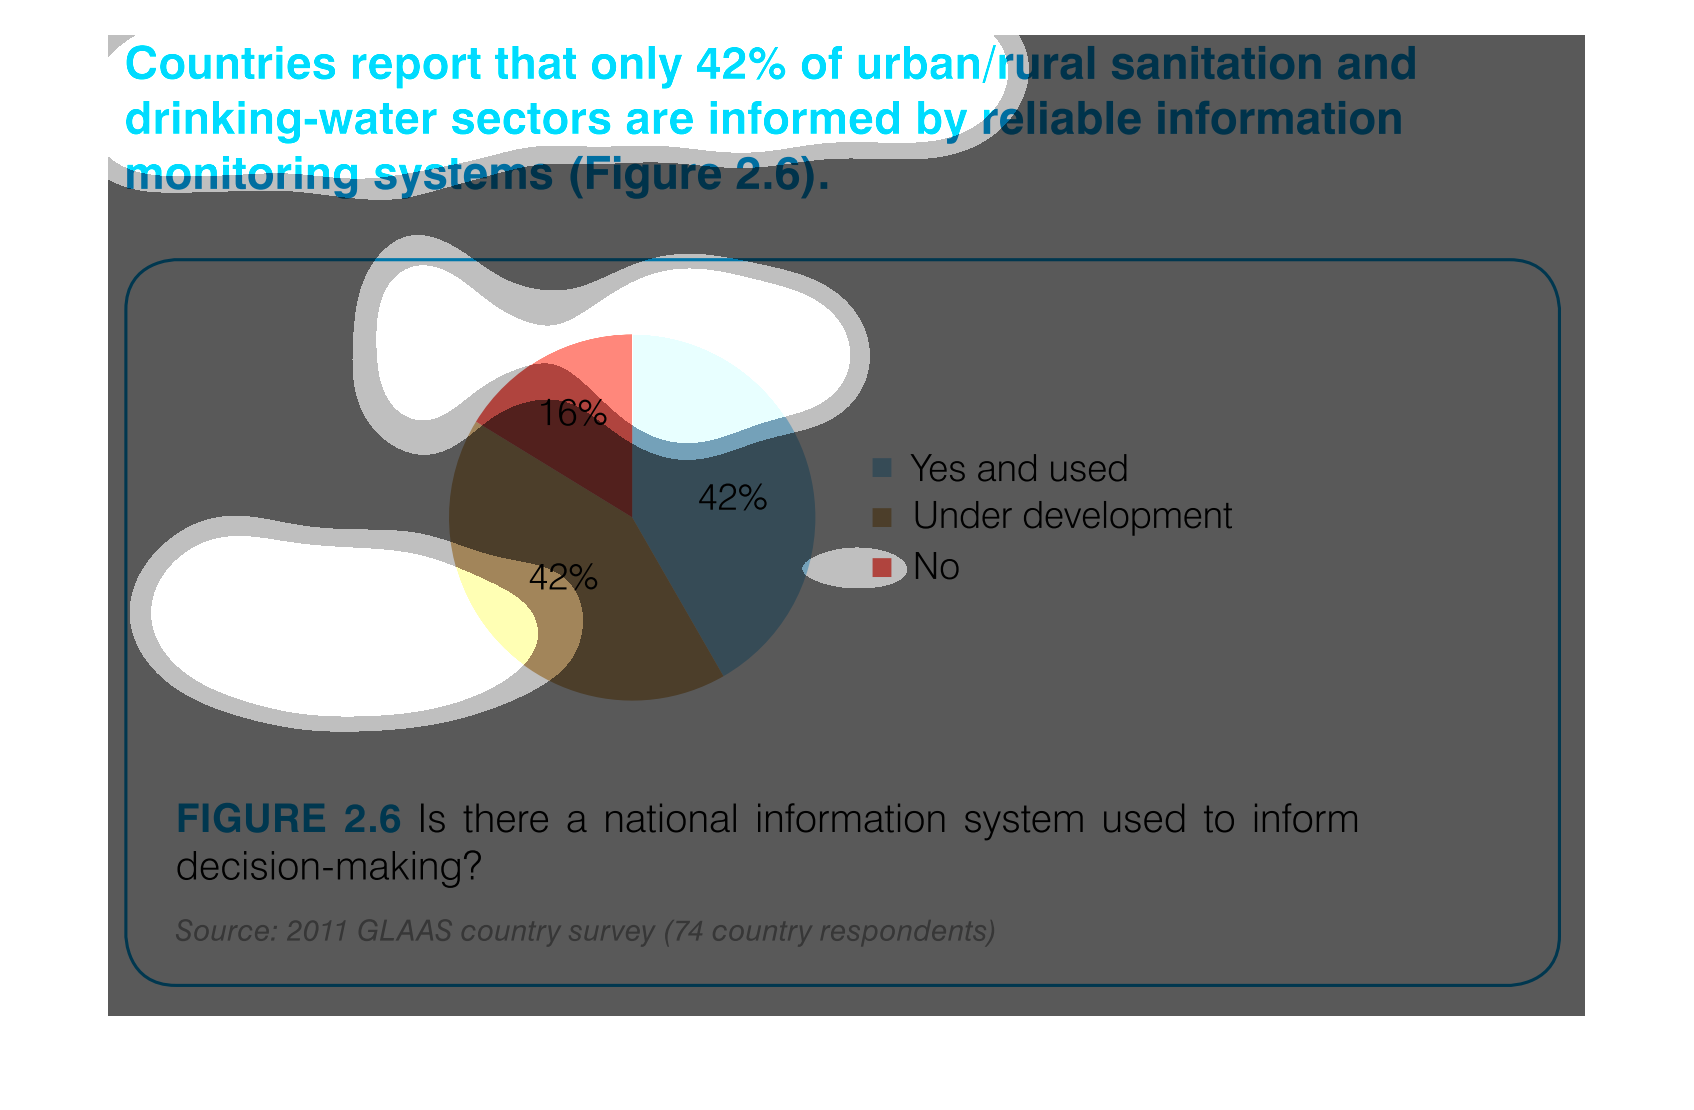
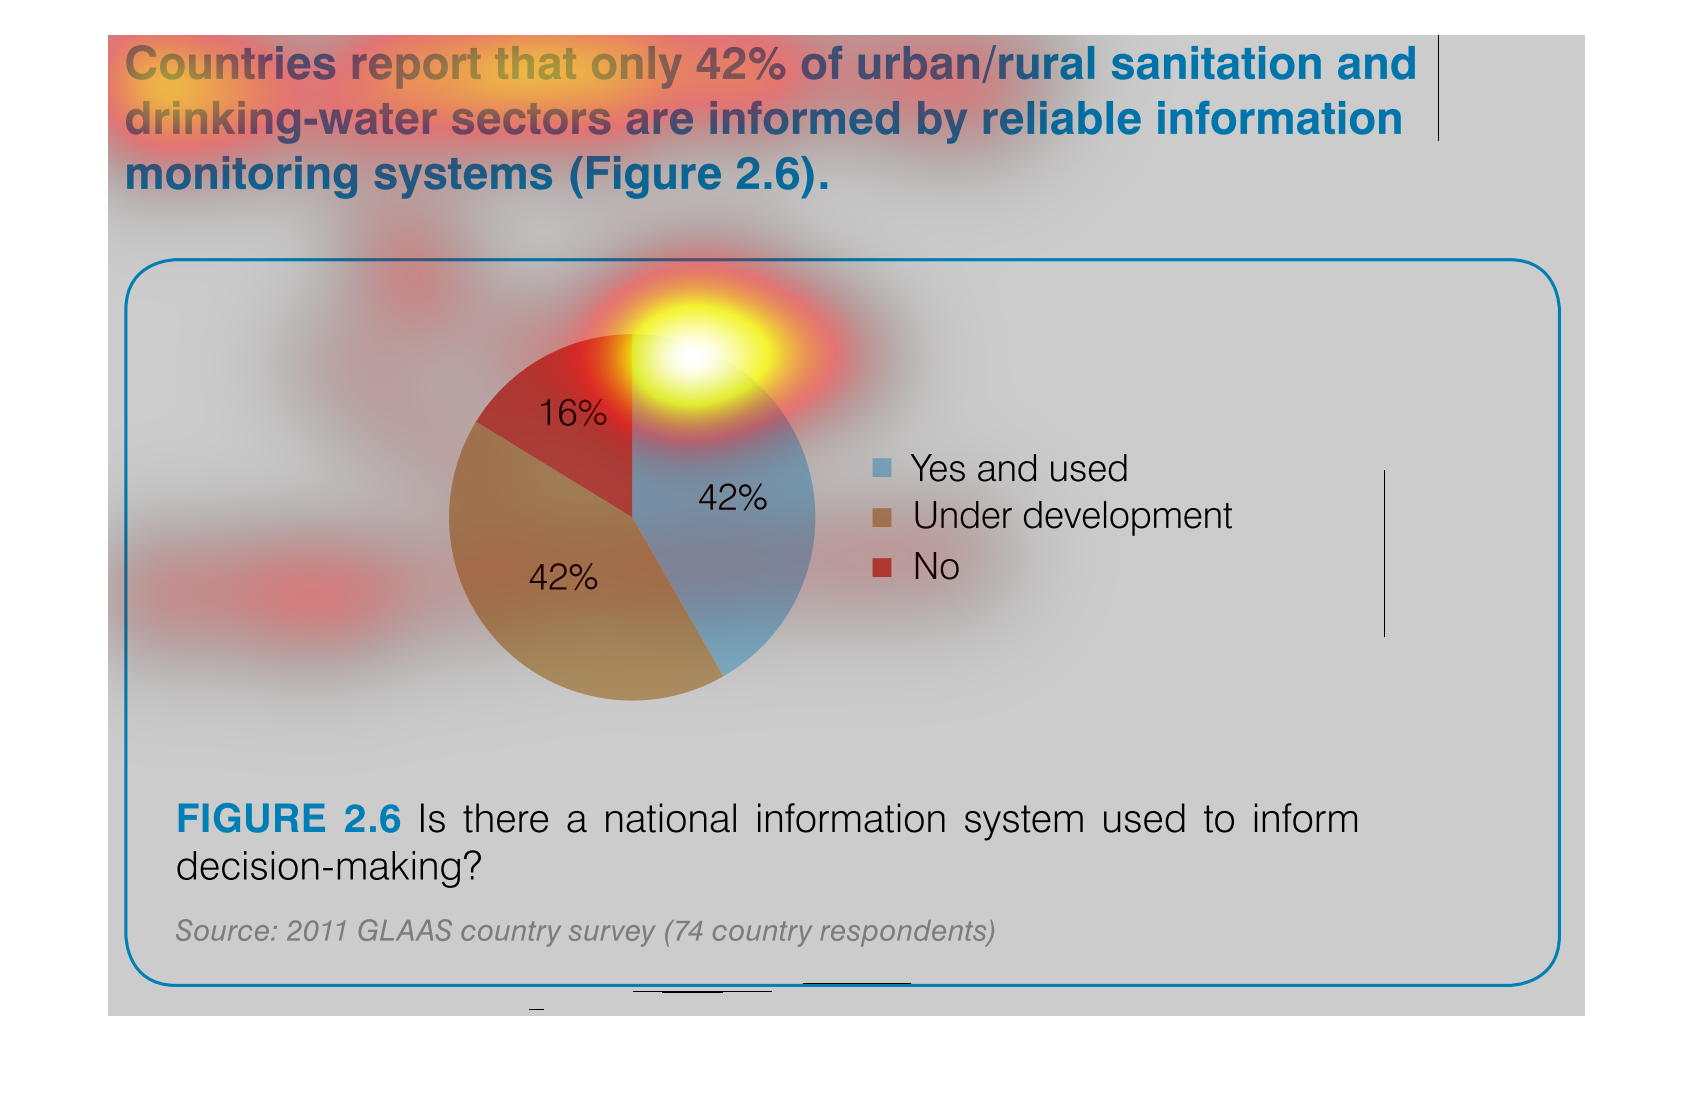
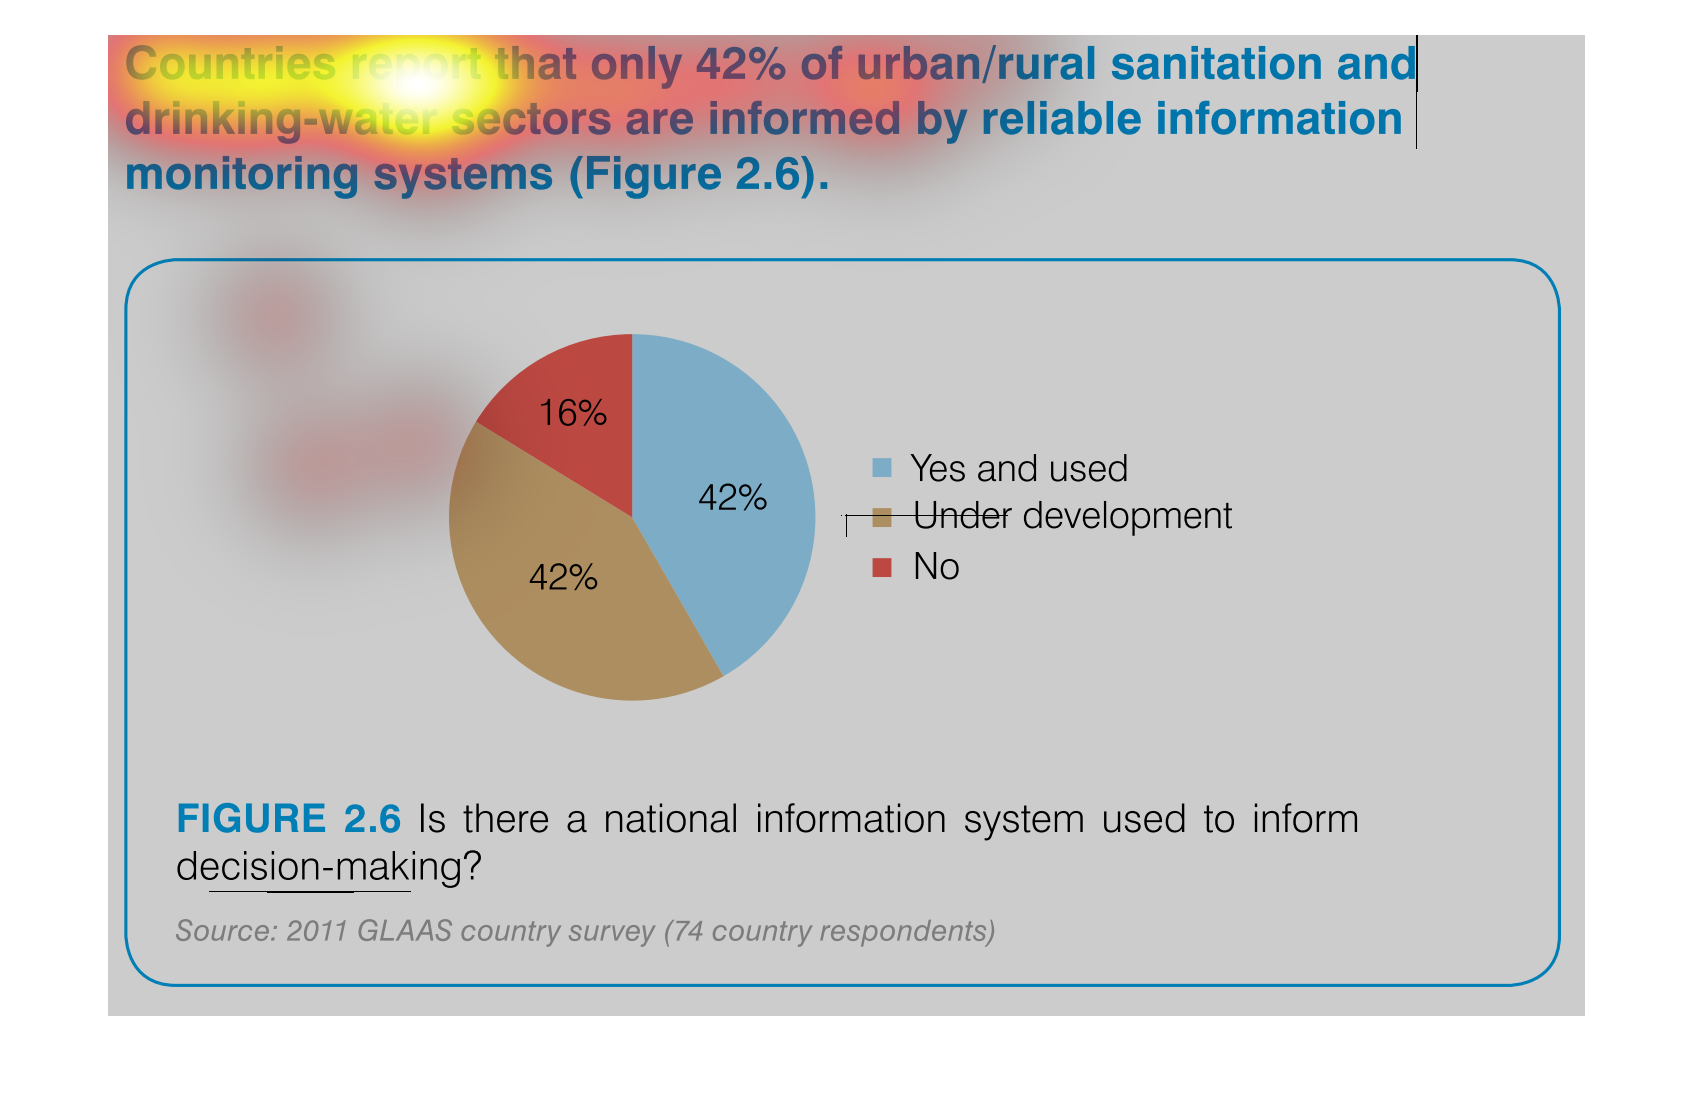
The image depicts a pie chart indicating that only 42% of urban/rural sanitation and drinking
water sectors are informed by reliable information monitoring systems. 42% are informed and
used, 42% are under development, and 16% are not informed. Source GLAAS.
The graph shows how many urban/rural areas are keeping up on sanitation. The question remains
as to whether there is a national standard that should be followed
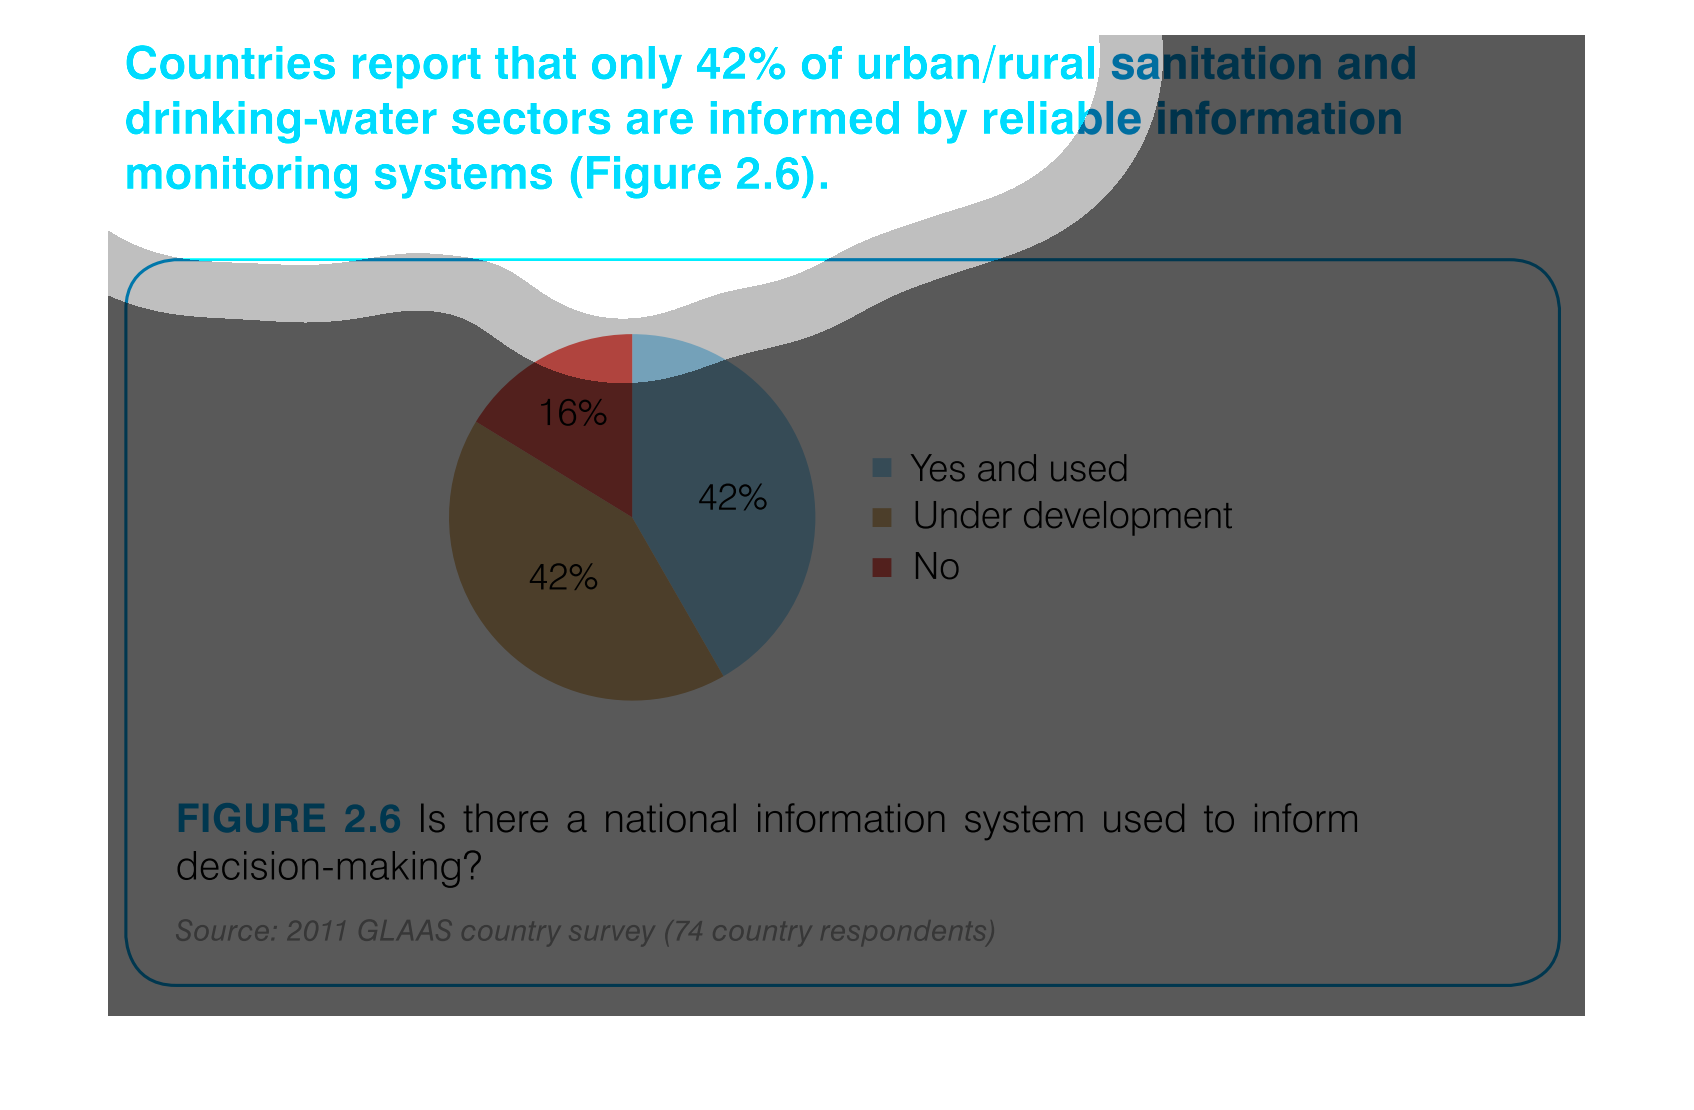
This is a circle chart that details how many countries obtain at least 42% of their drinking
water from sources that are monitored for sanitation. Most do, however they are not the majority
of the circle.
Sanitation and clean drinking water reports are displayed as often times not being reported
by reliable informants. 42% are, 42% are being developed, and 16% are a flat no.
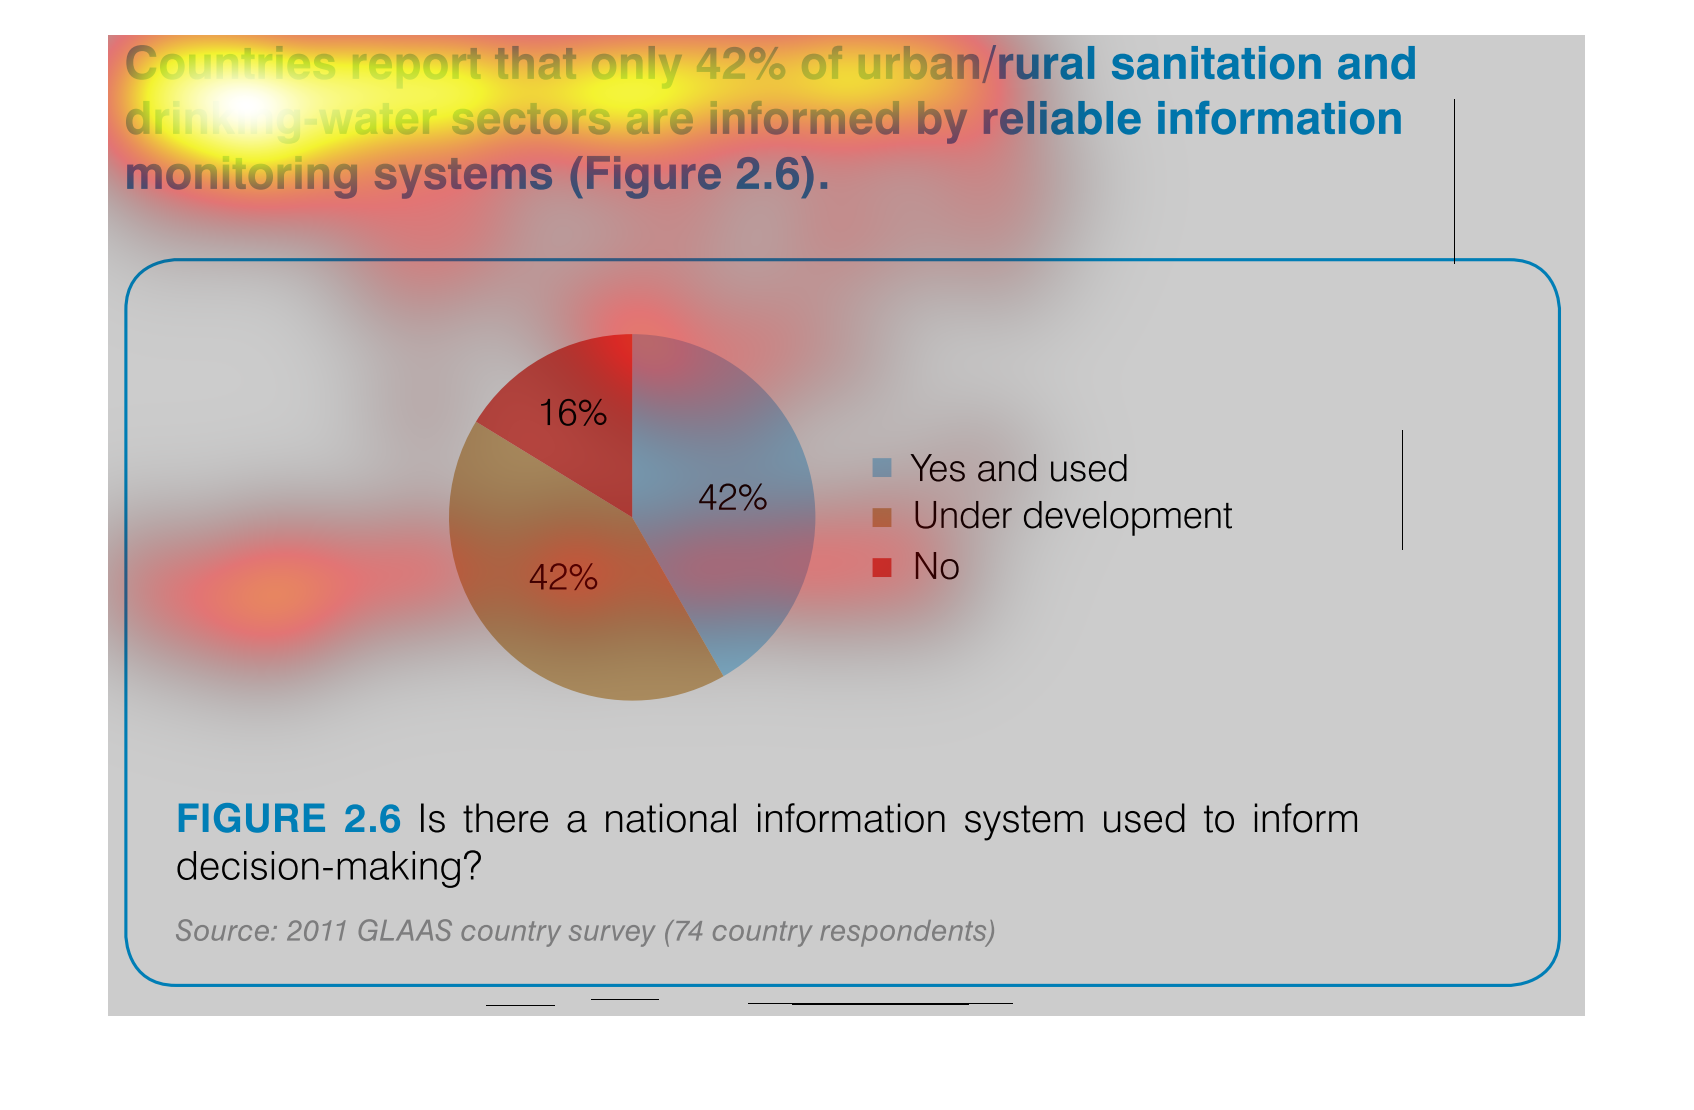
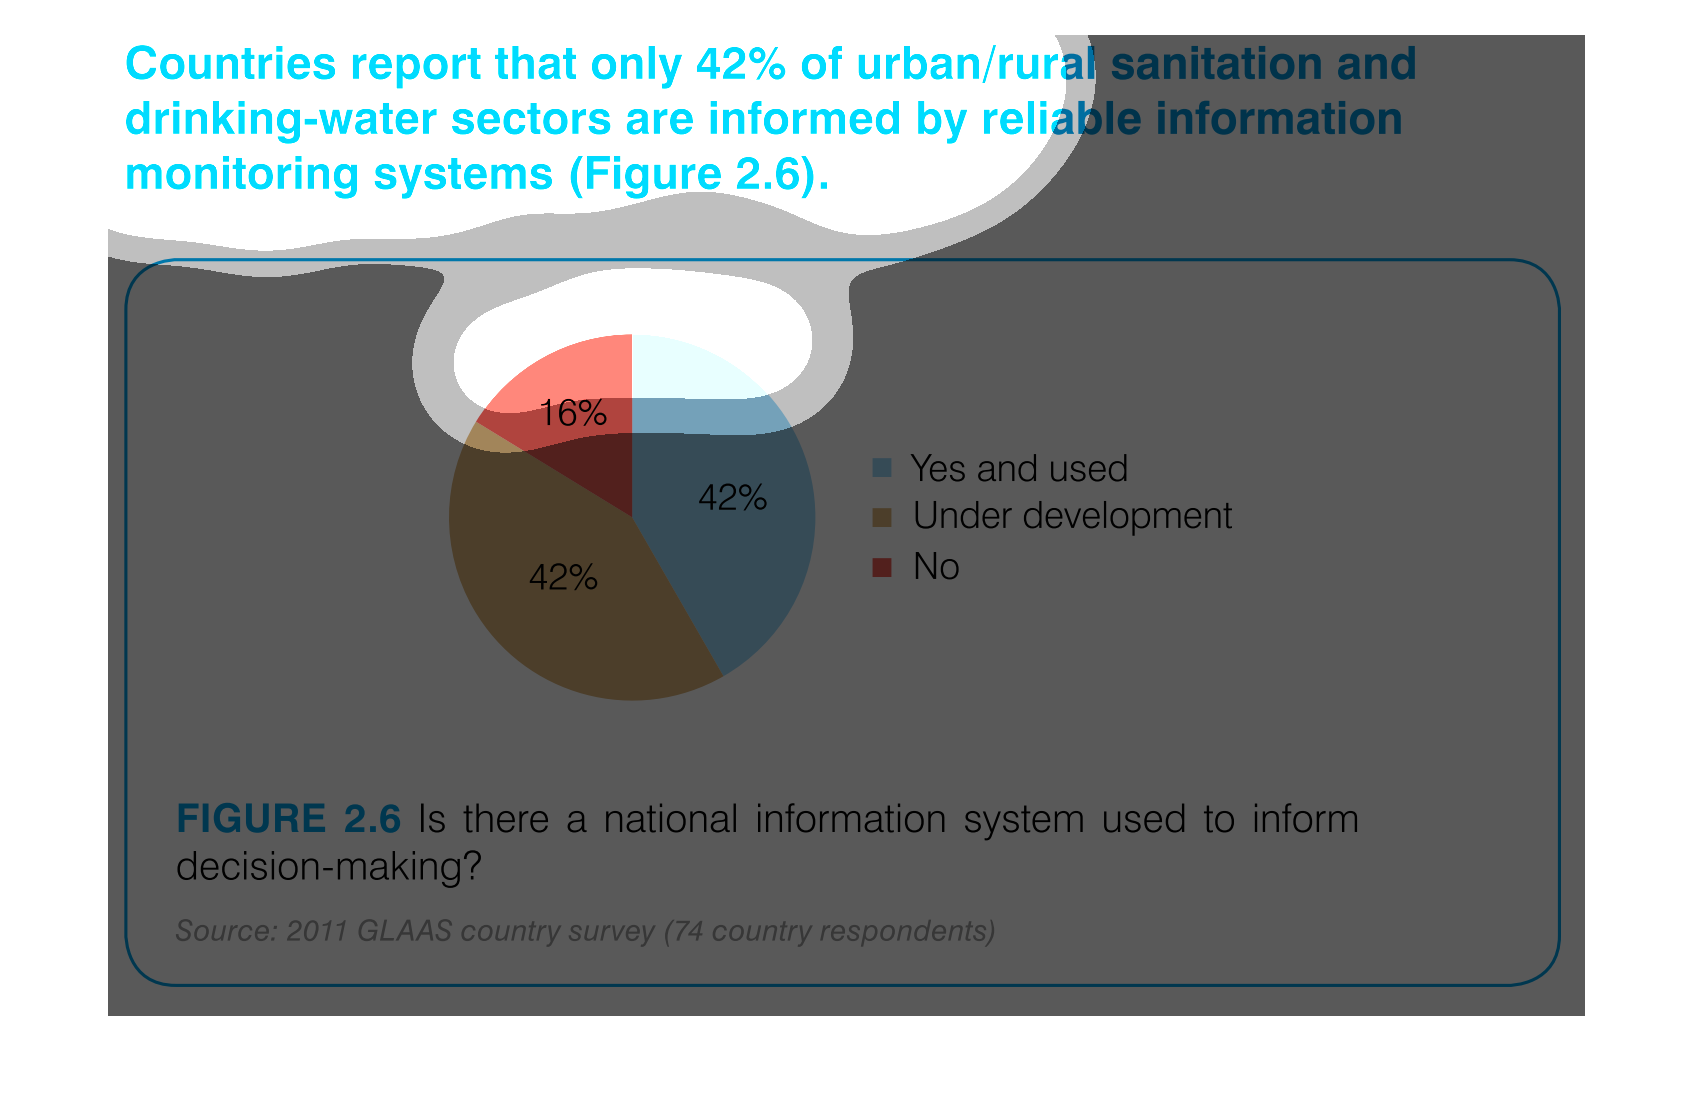
This is a color-coded pie chart depicting that countries report that onlt 42% of the rural/urban
sanitation and drinking-water sectors are informed by reliable information.
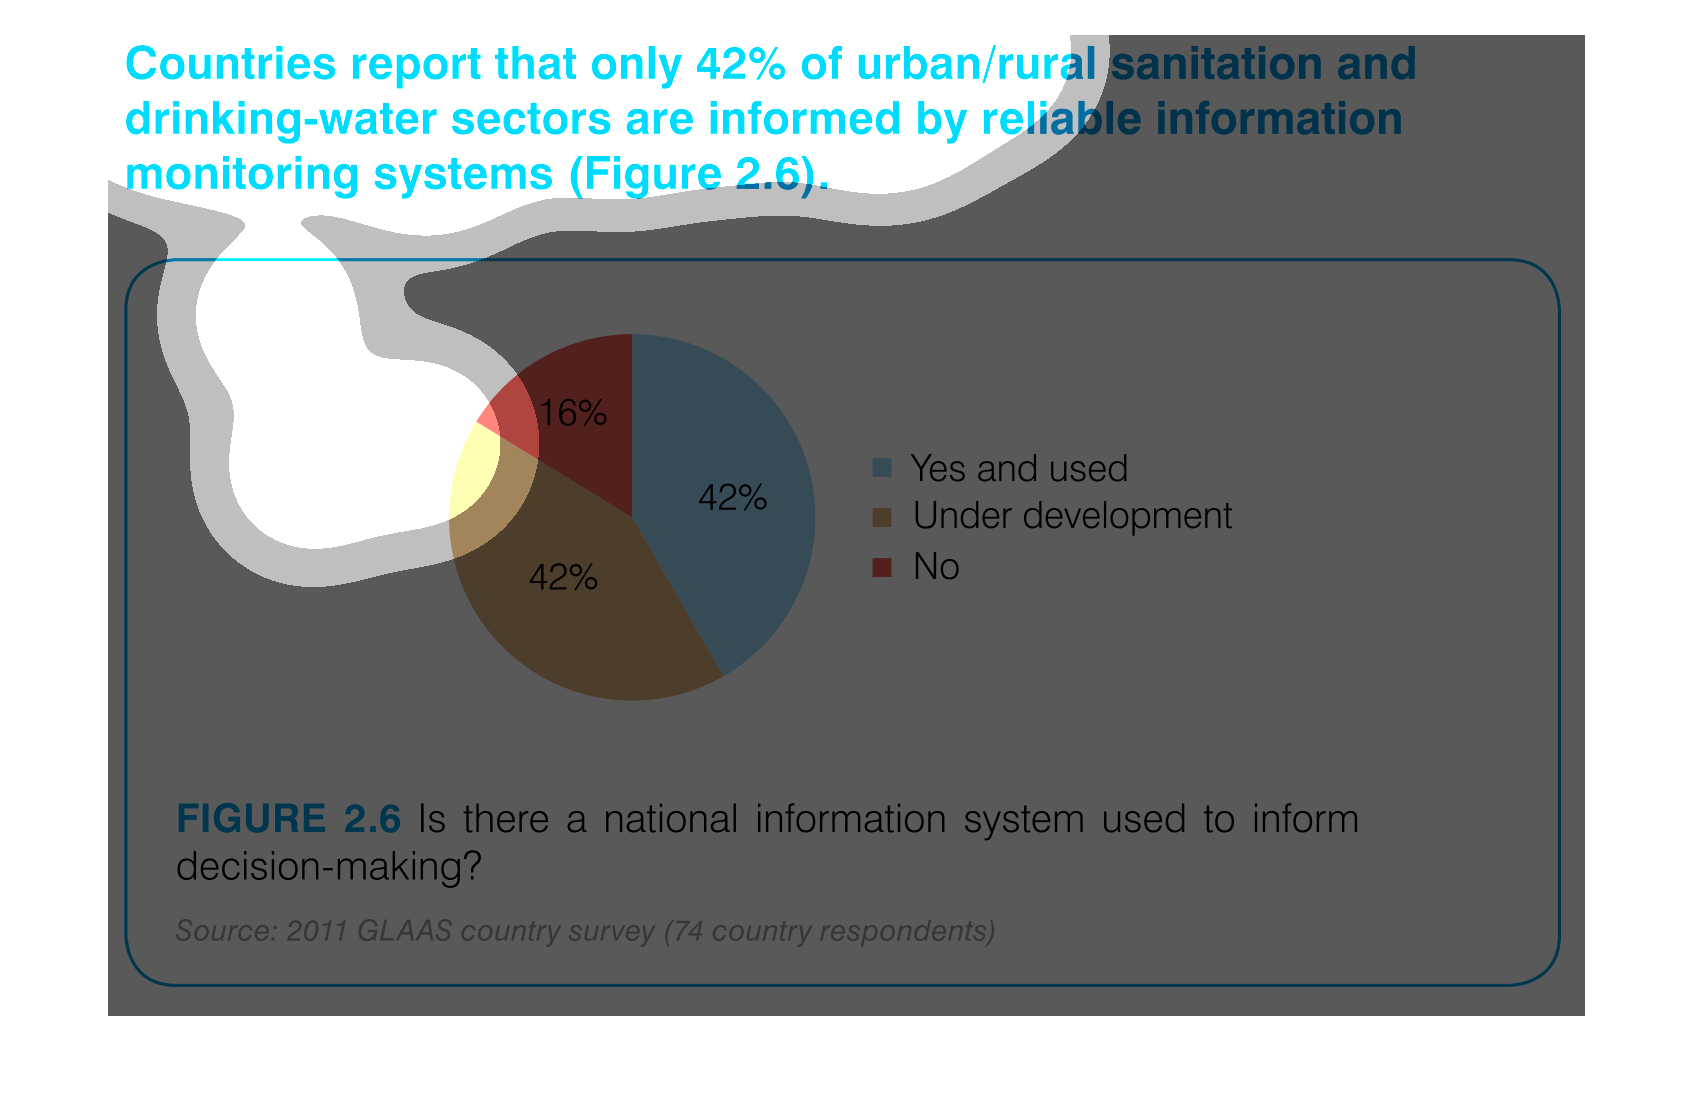
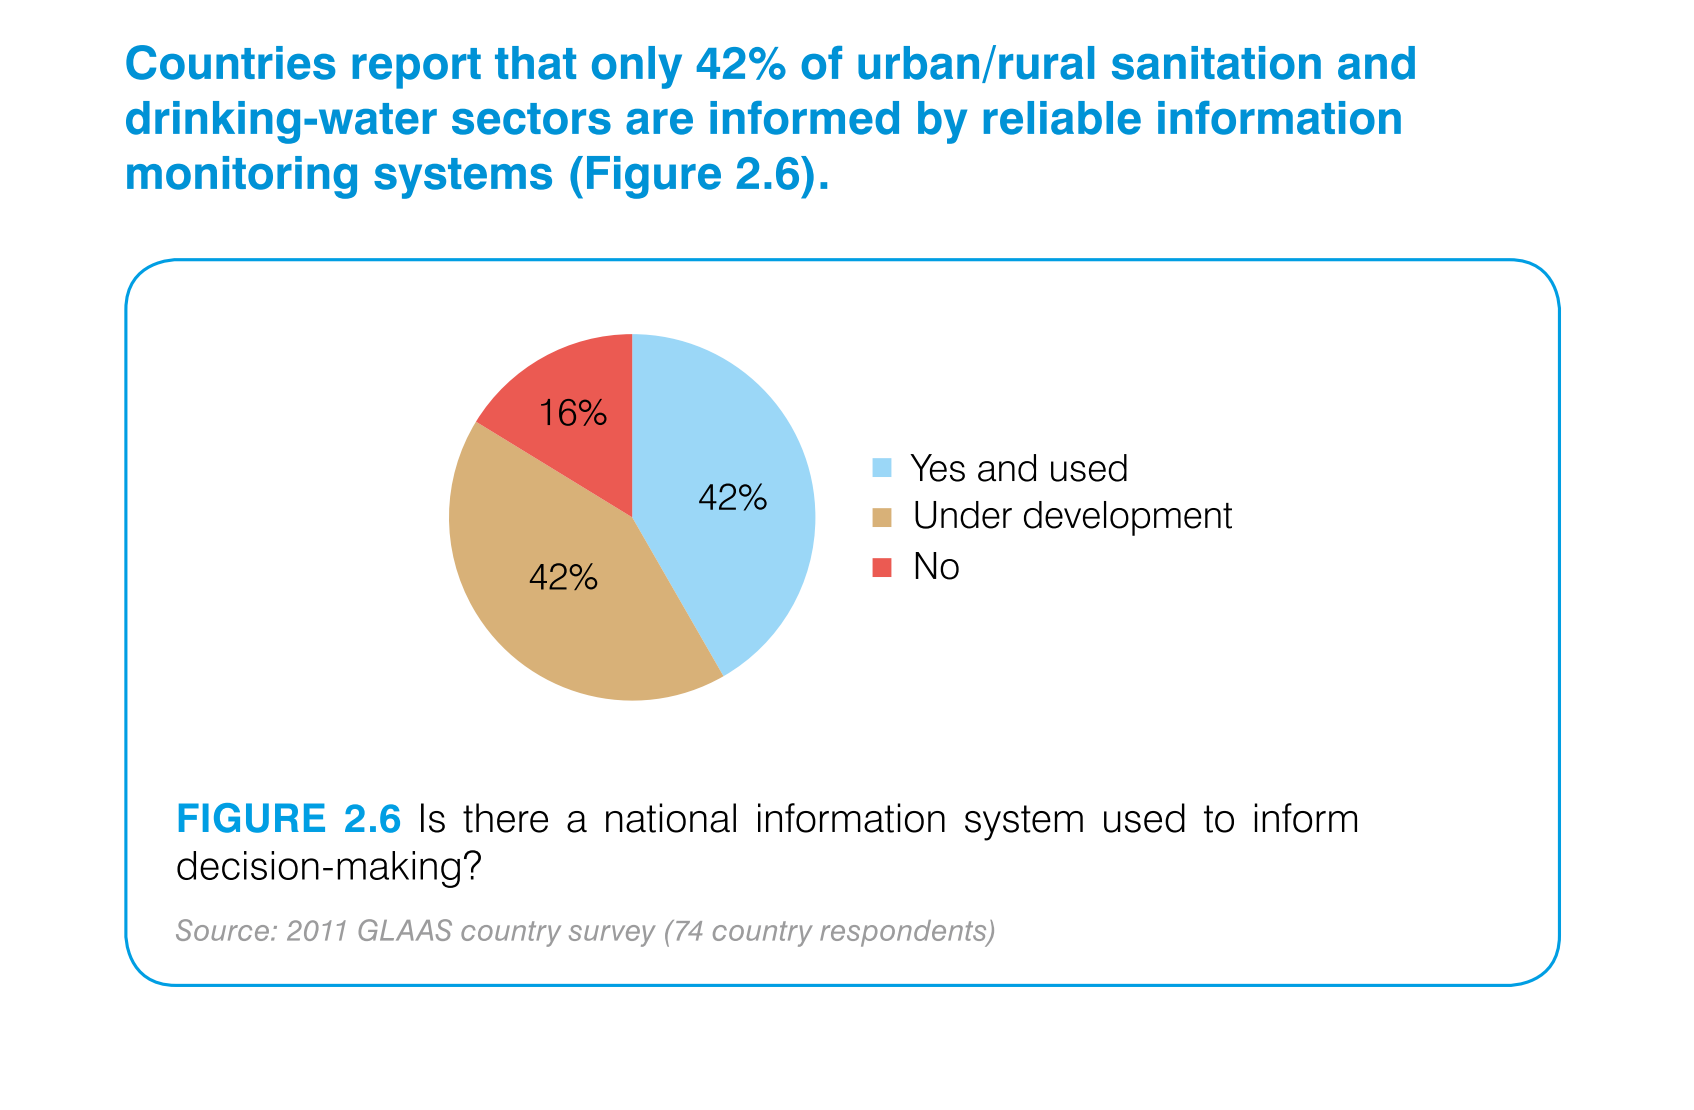
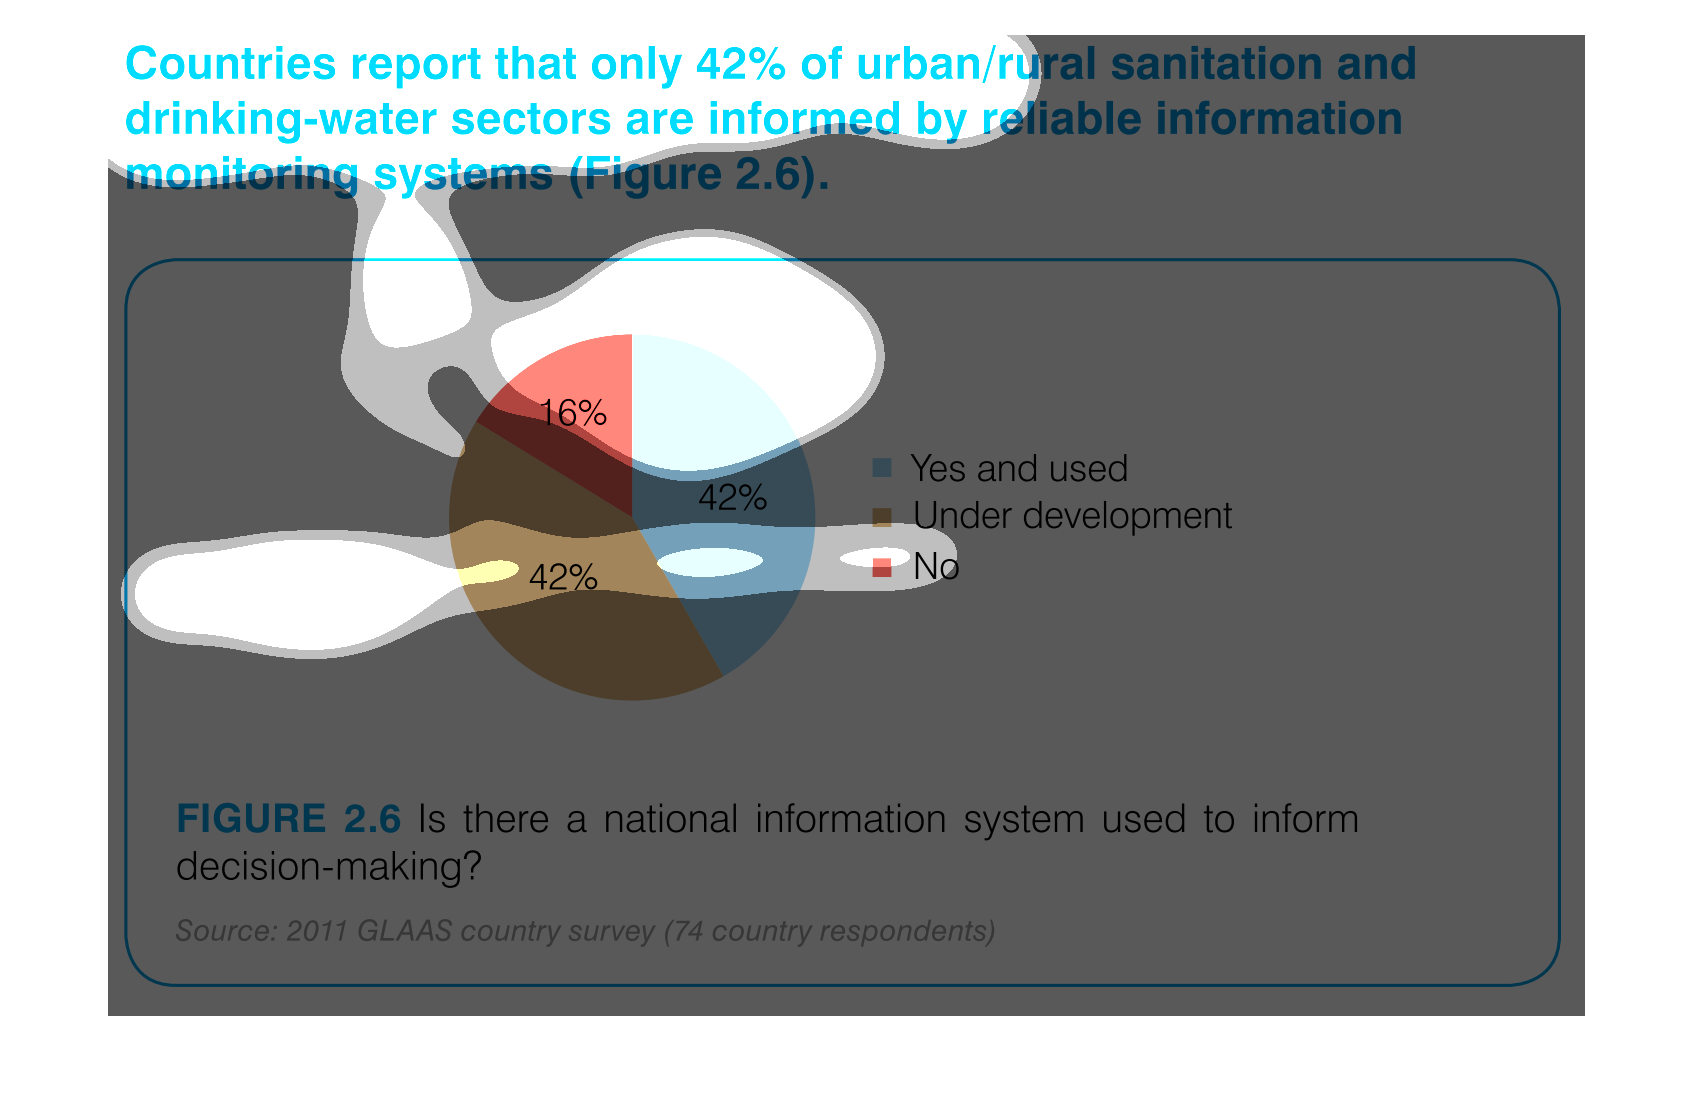
The image depicts a pie chart showing that only 42% of urban/rural sanitation and drinking
water sectors are informed by reliable information monitoring systems. 42% are informed, 42%
are under development, and 16% No. Source was a 2011 GLAAS country survey.