The graph displays the various sources of funding for sanitation and drinking water. If you
exclude households, the central government is by far the largest source. However, if you include
households, the largest source is tariff and self-supply.
These pie charts demonstrate the sources of funding for sanitation and drinking water including
federal government, regional government, local governemtn, tariffs, and other.
This figure shows who pays for sanitation and drinking water. It shows that while governments
do pay for sanitation, household contributions to sanitation and clean drinking water area
also very important.
This diagram illustrates the division of government funding in terms of local and external
government as well as the source of such funding, whether taxes or otherwise.
This chart makes no sense because there is no context and it is hard to read. It has too many
words and cannot be read without understanding the context
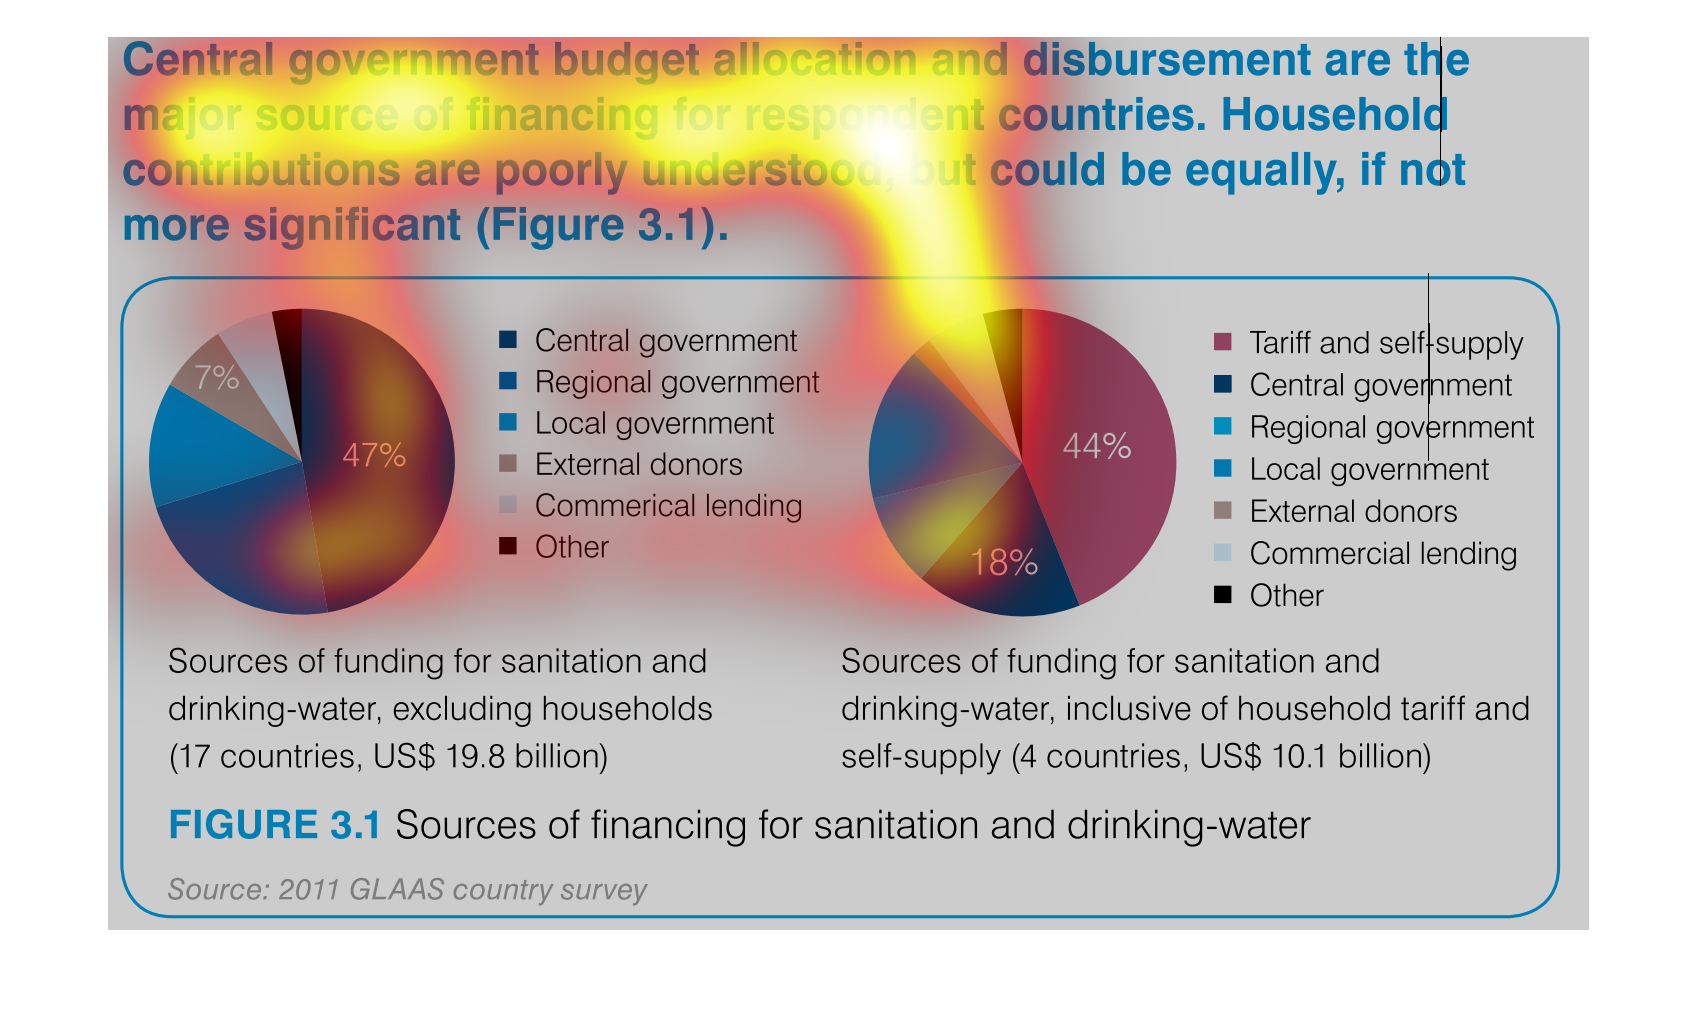
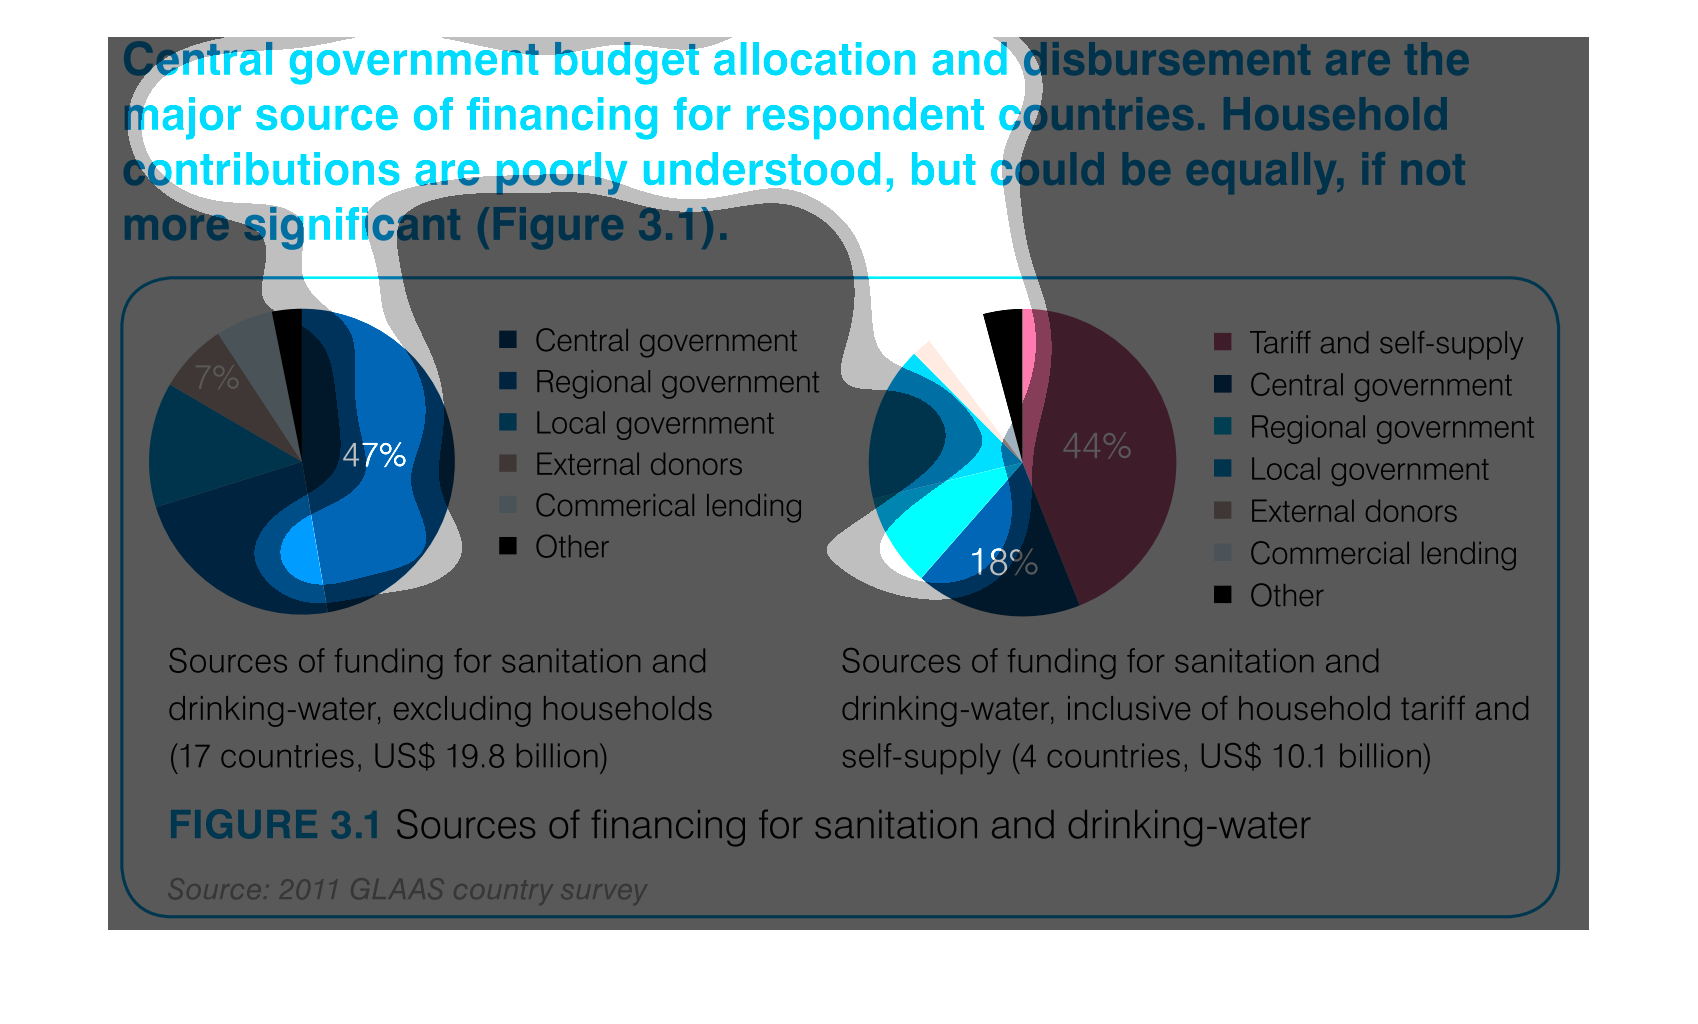
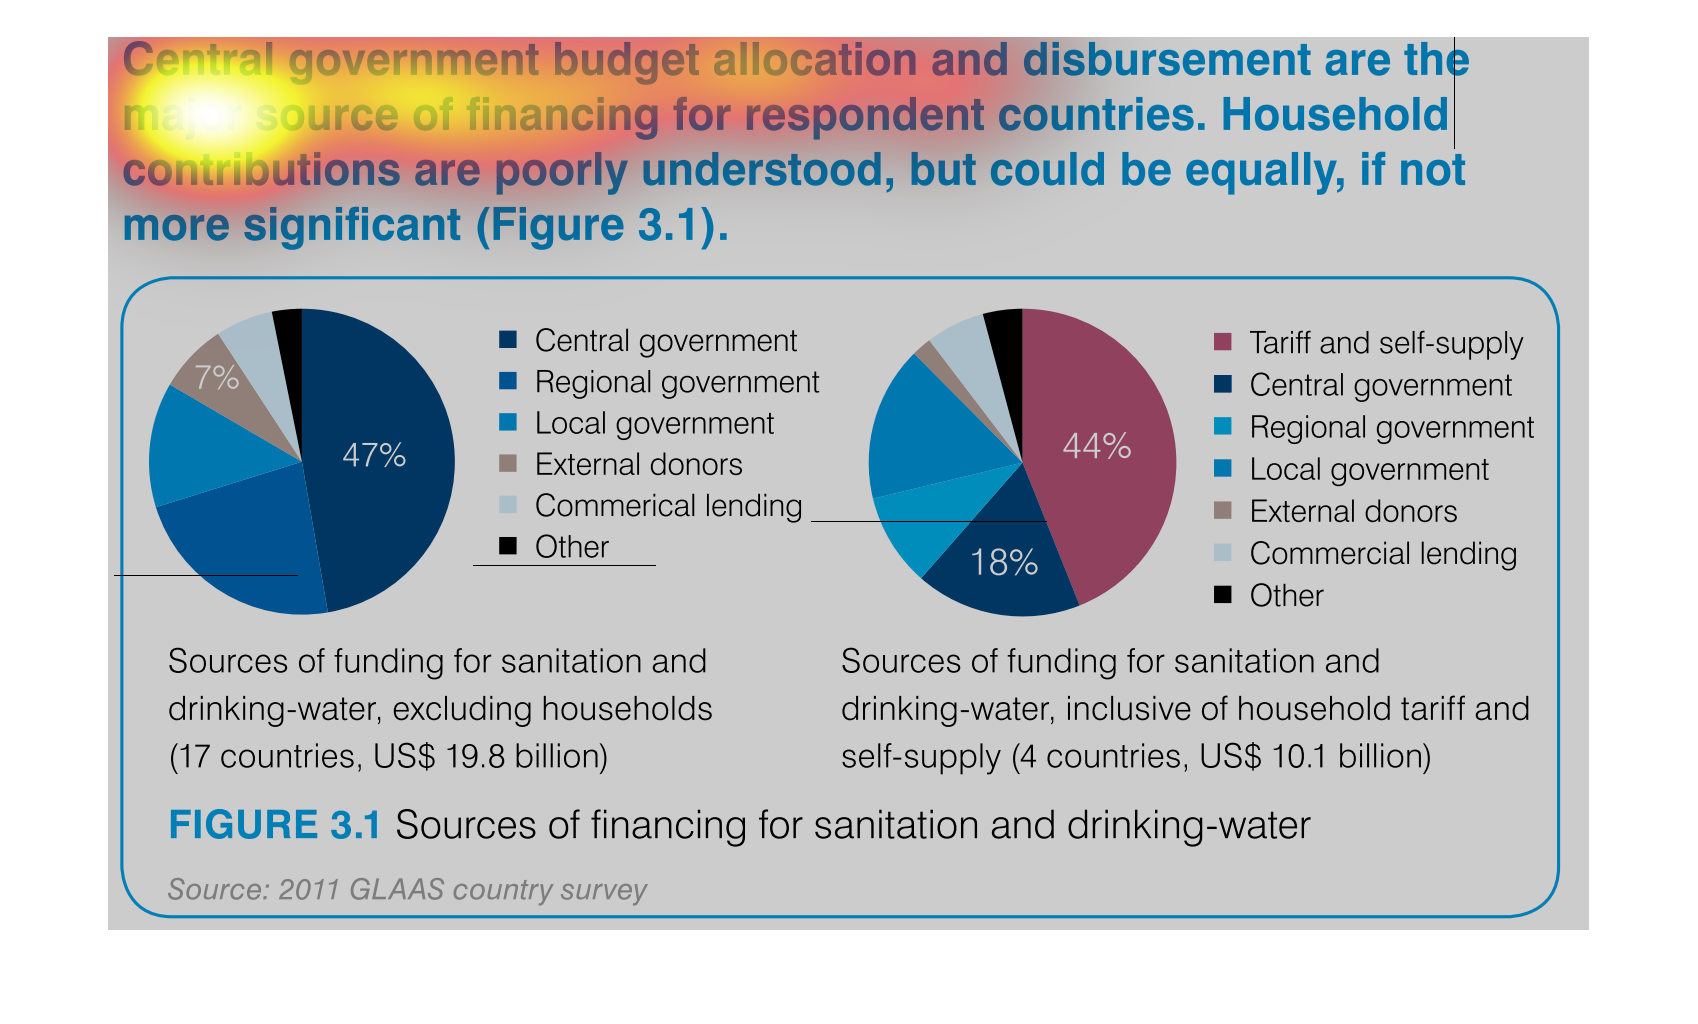
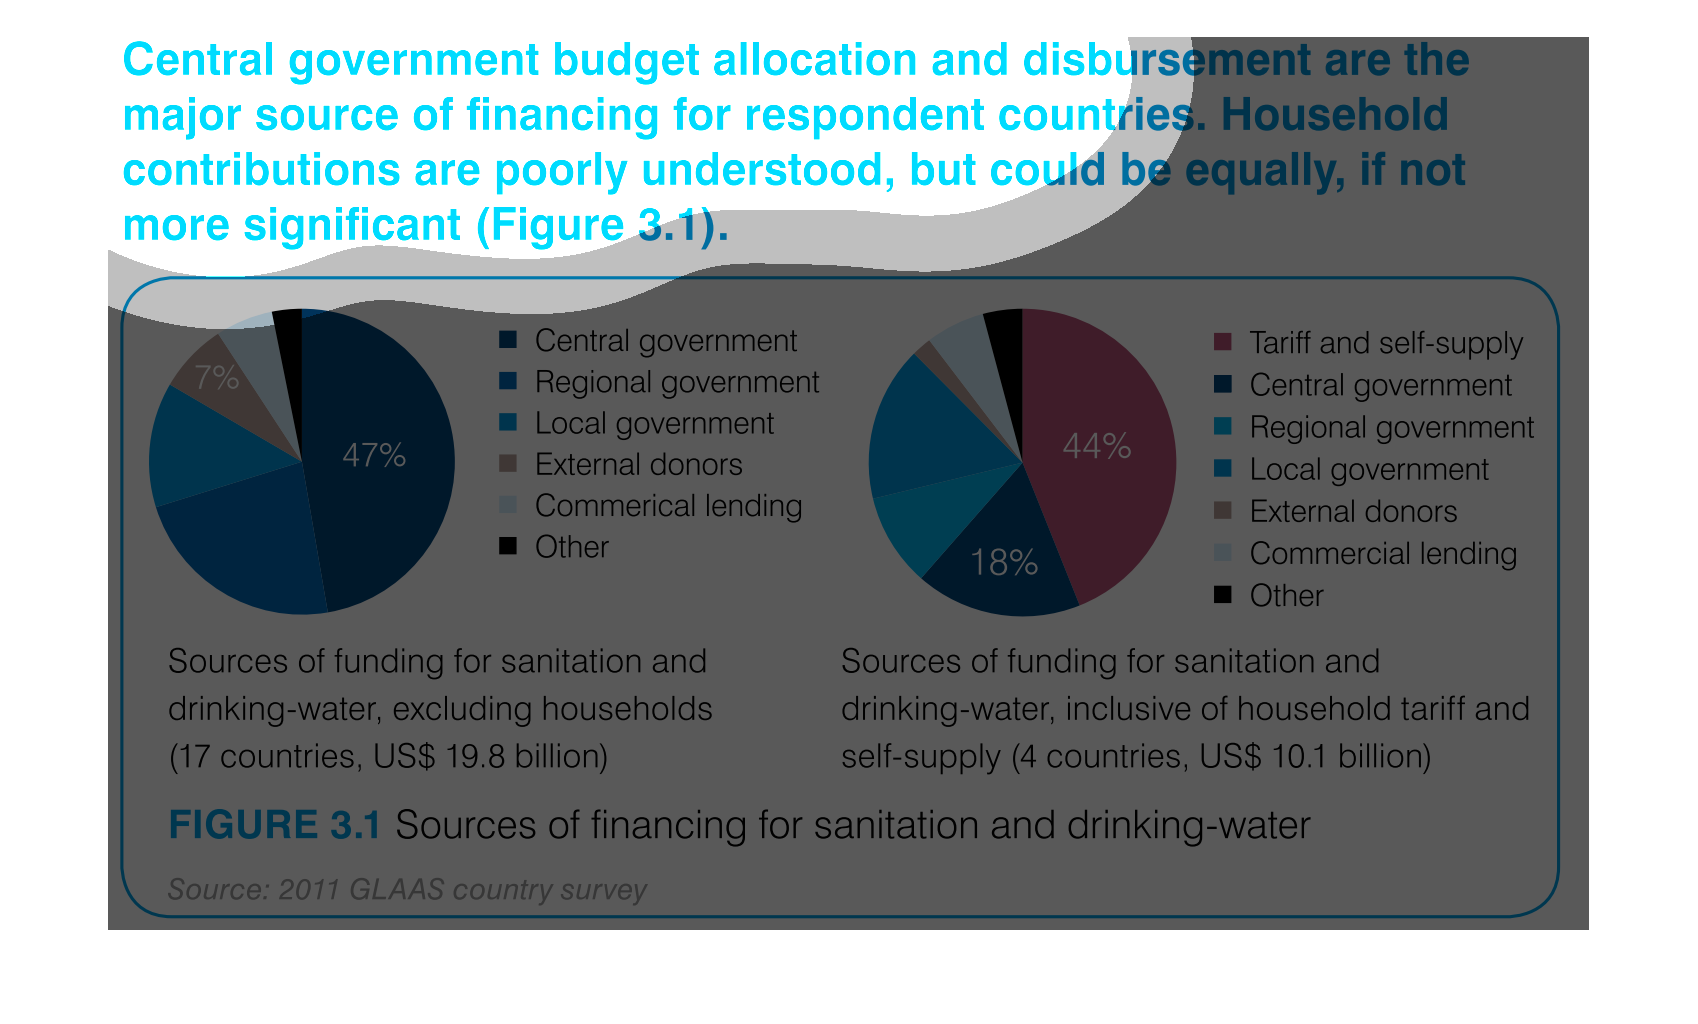
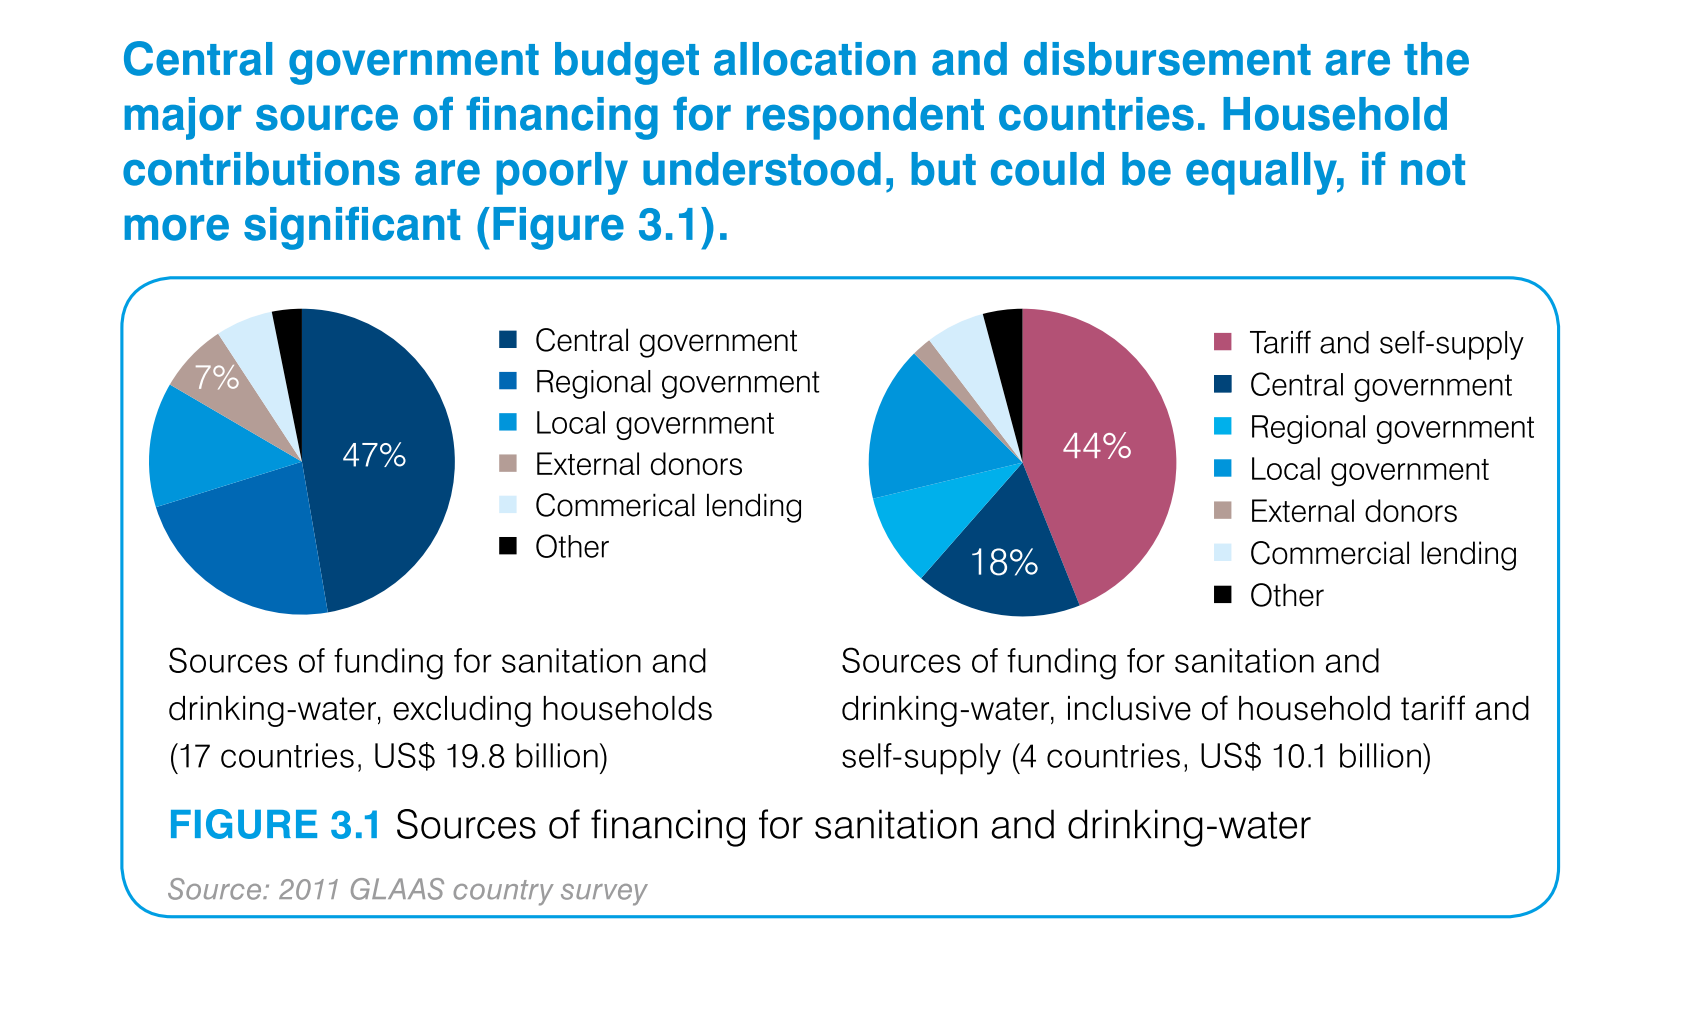
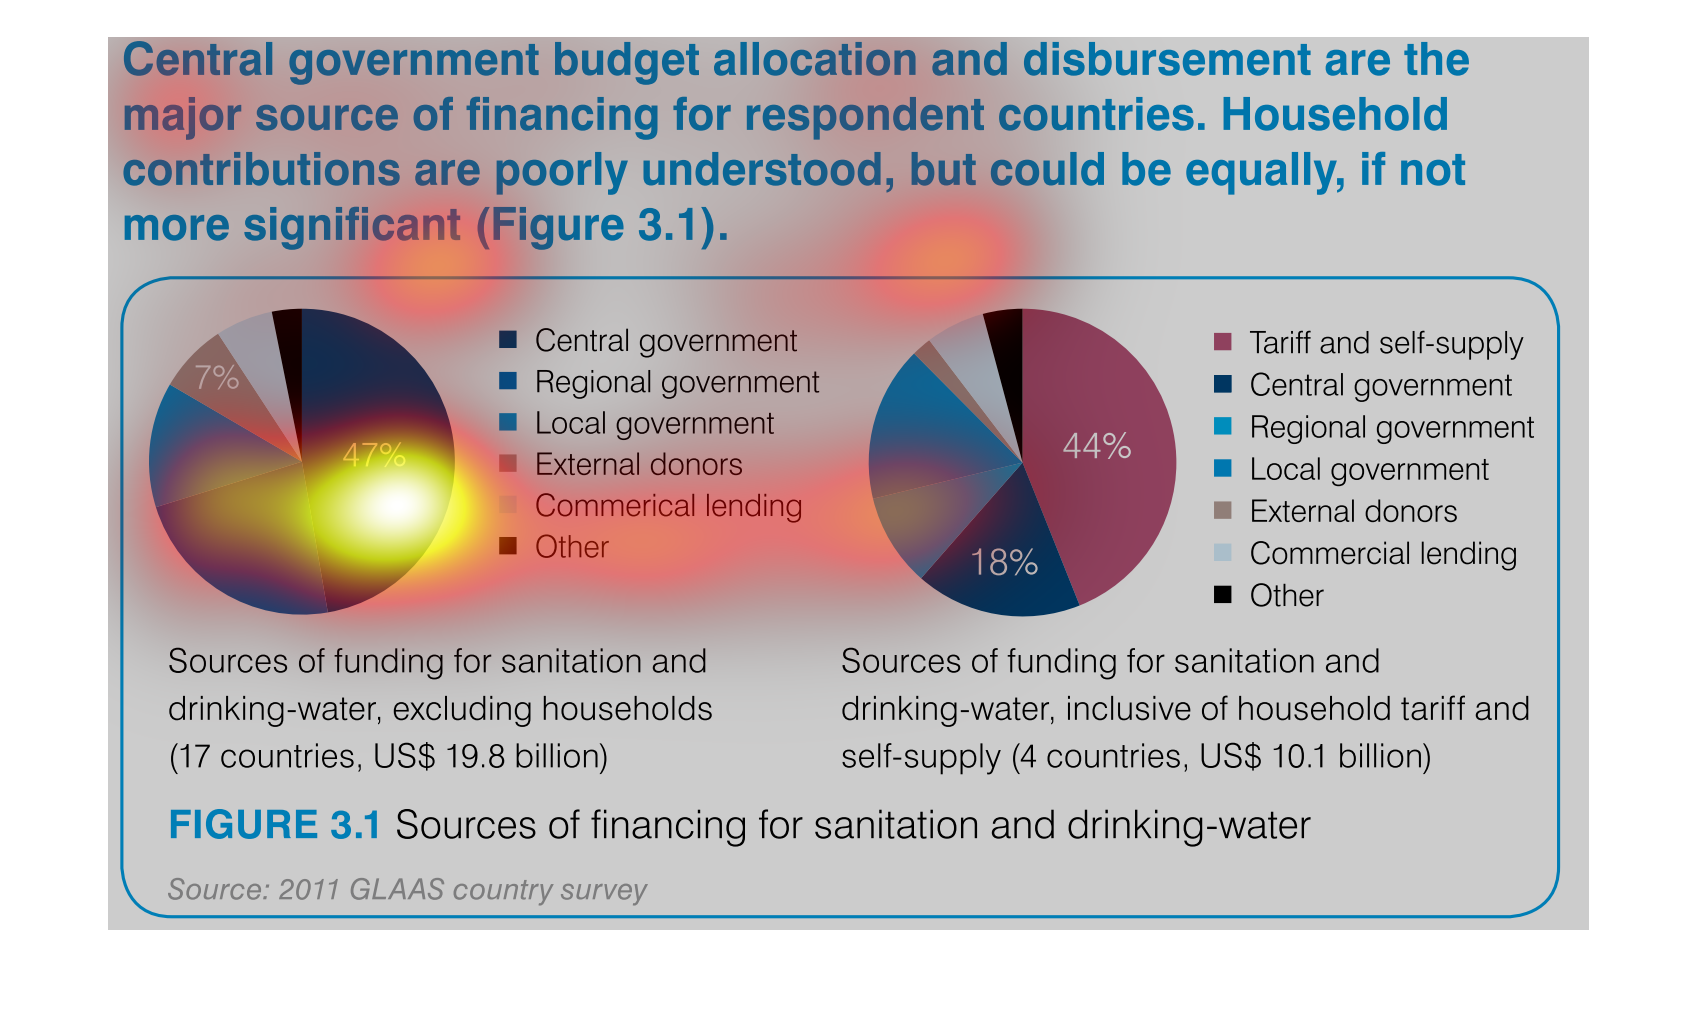
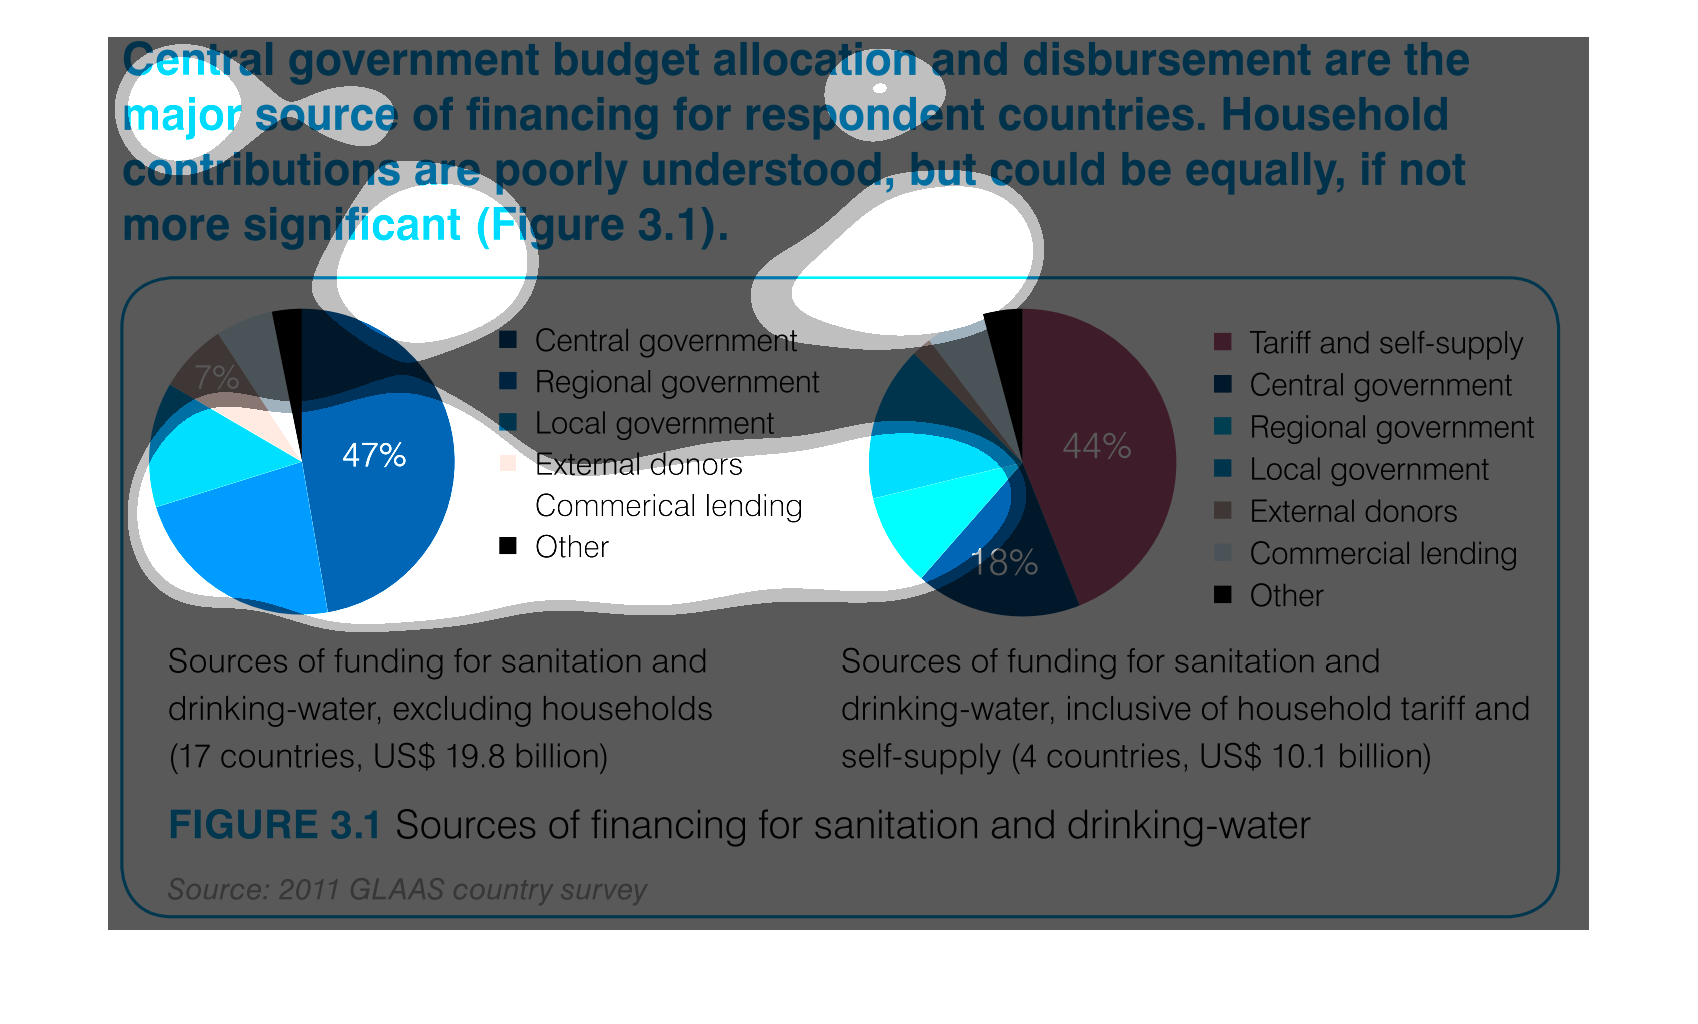
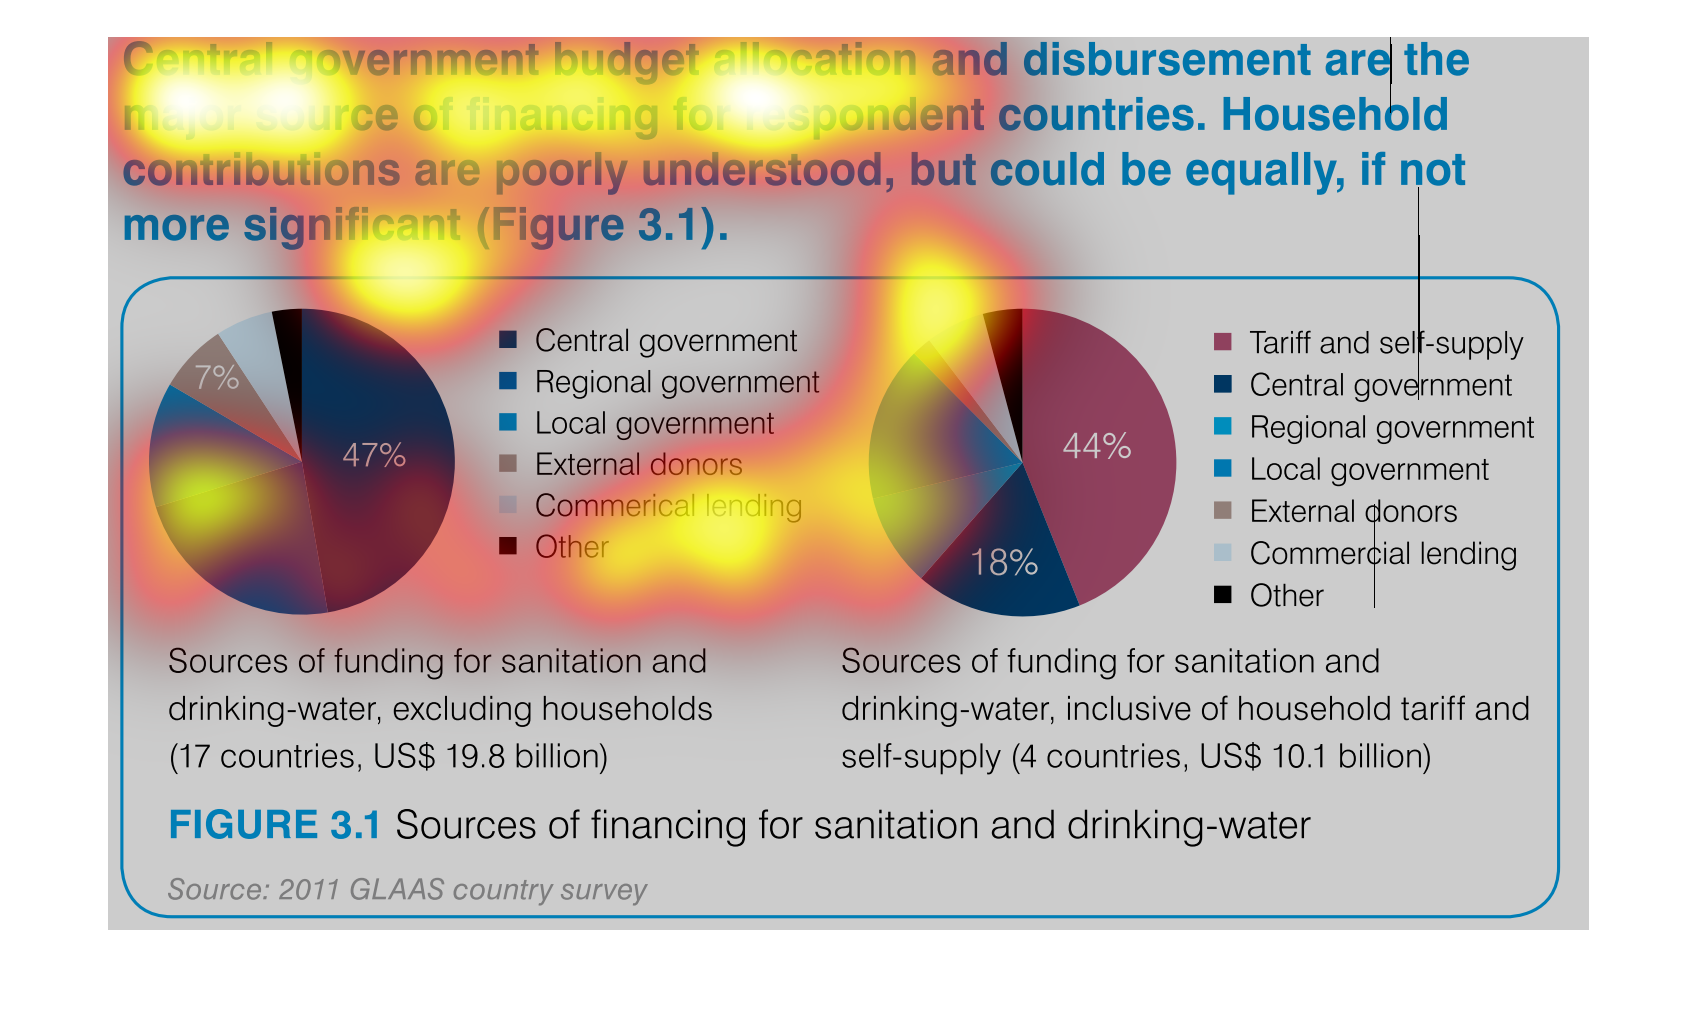
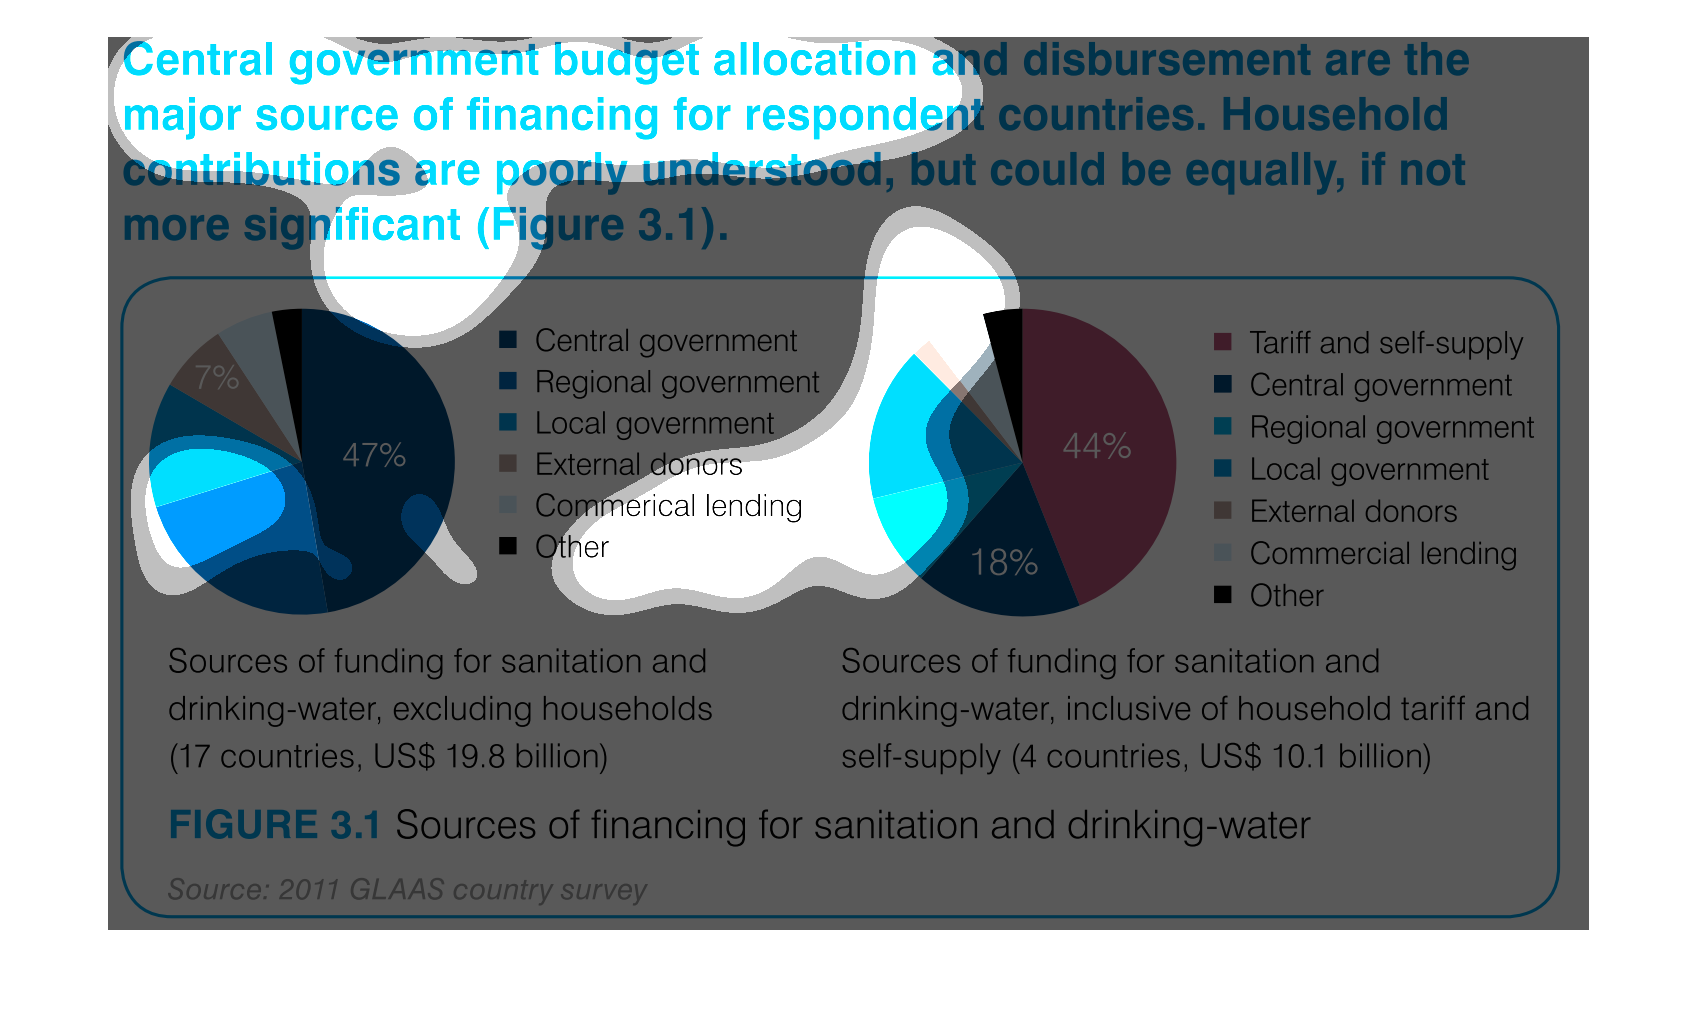
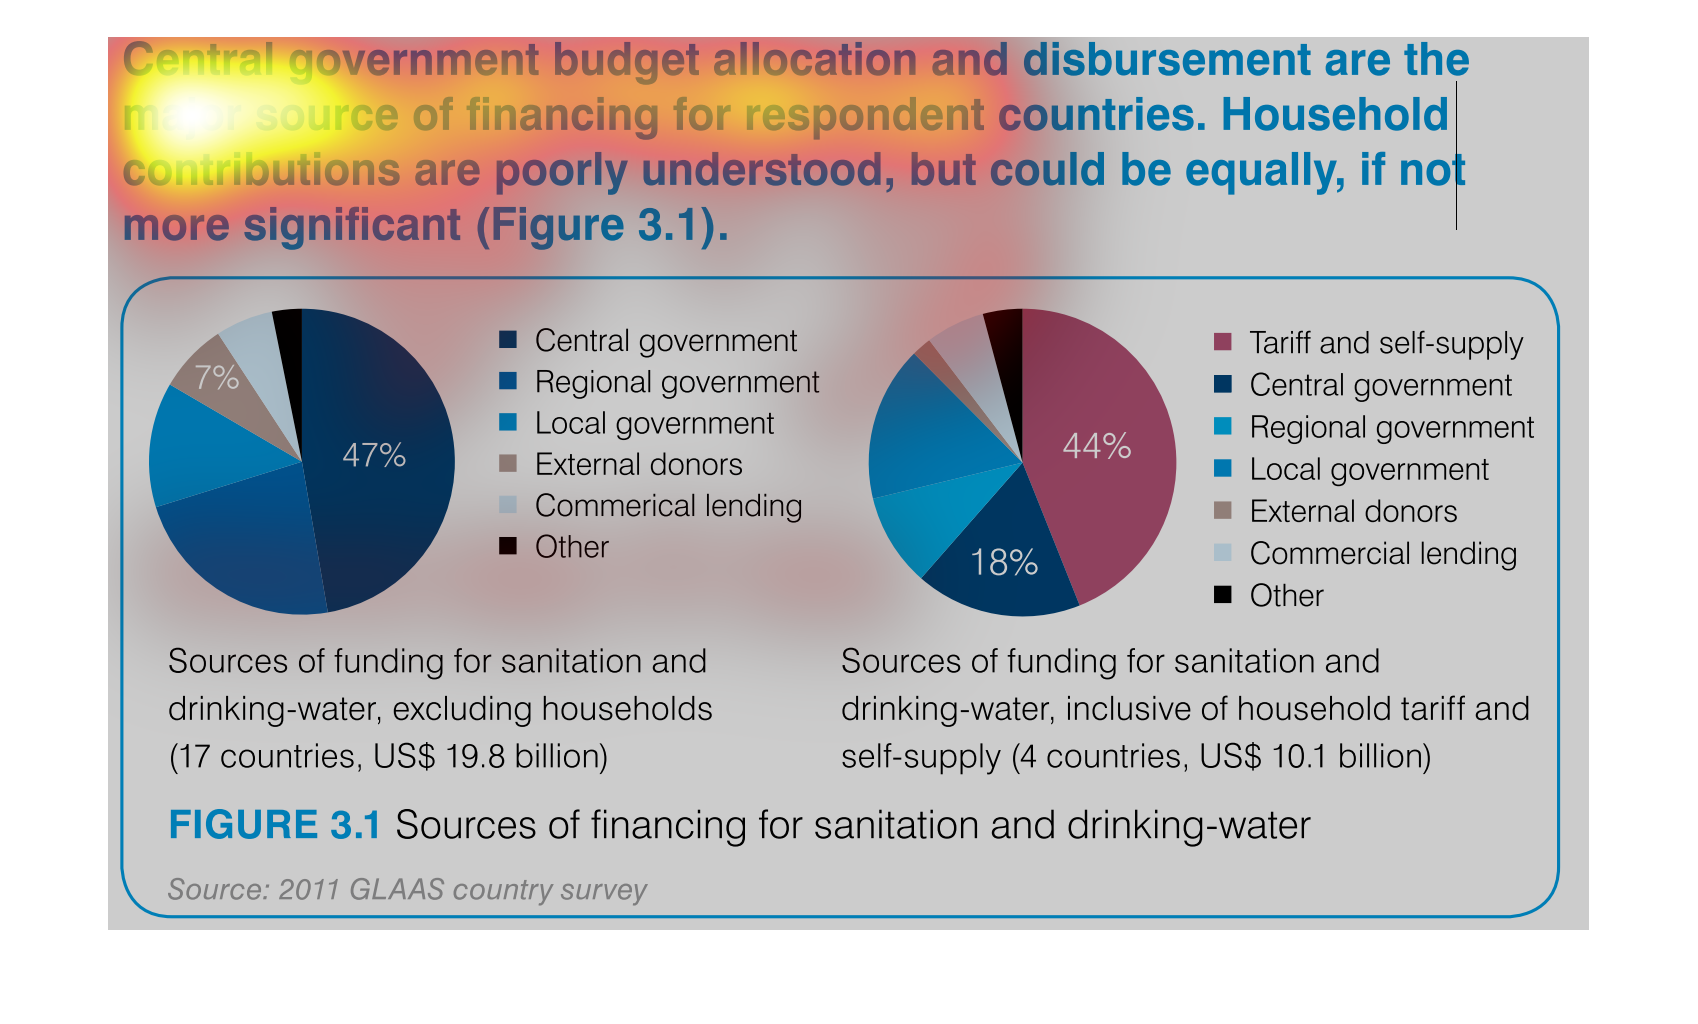
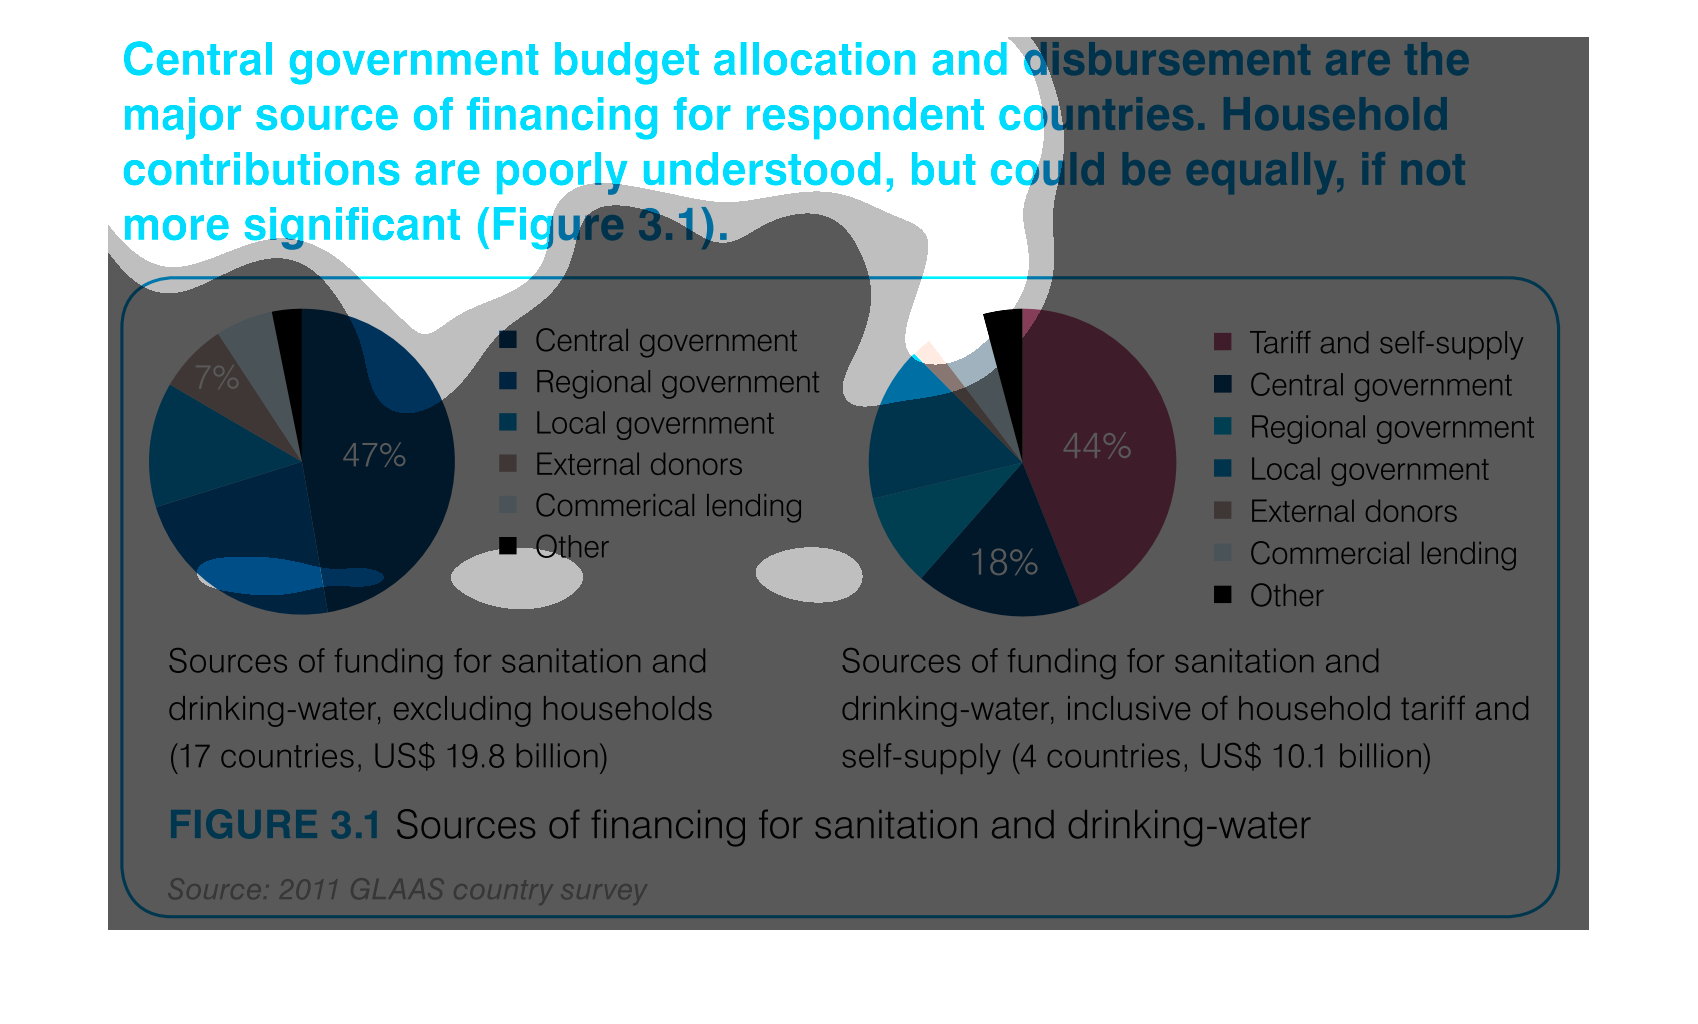
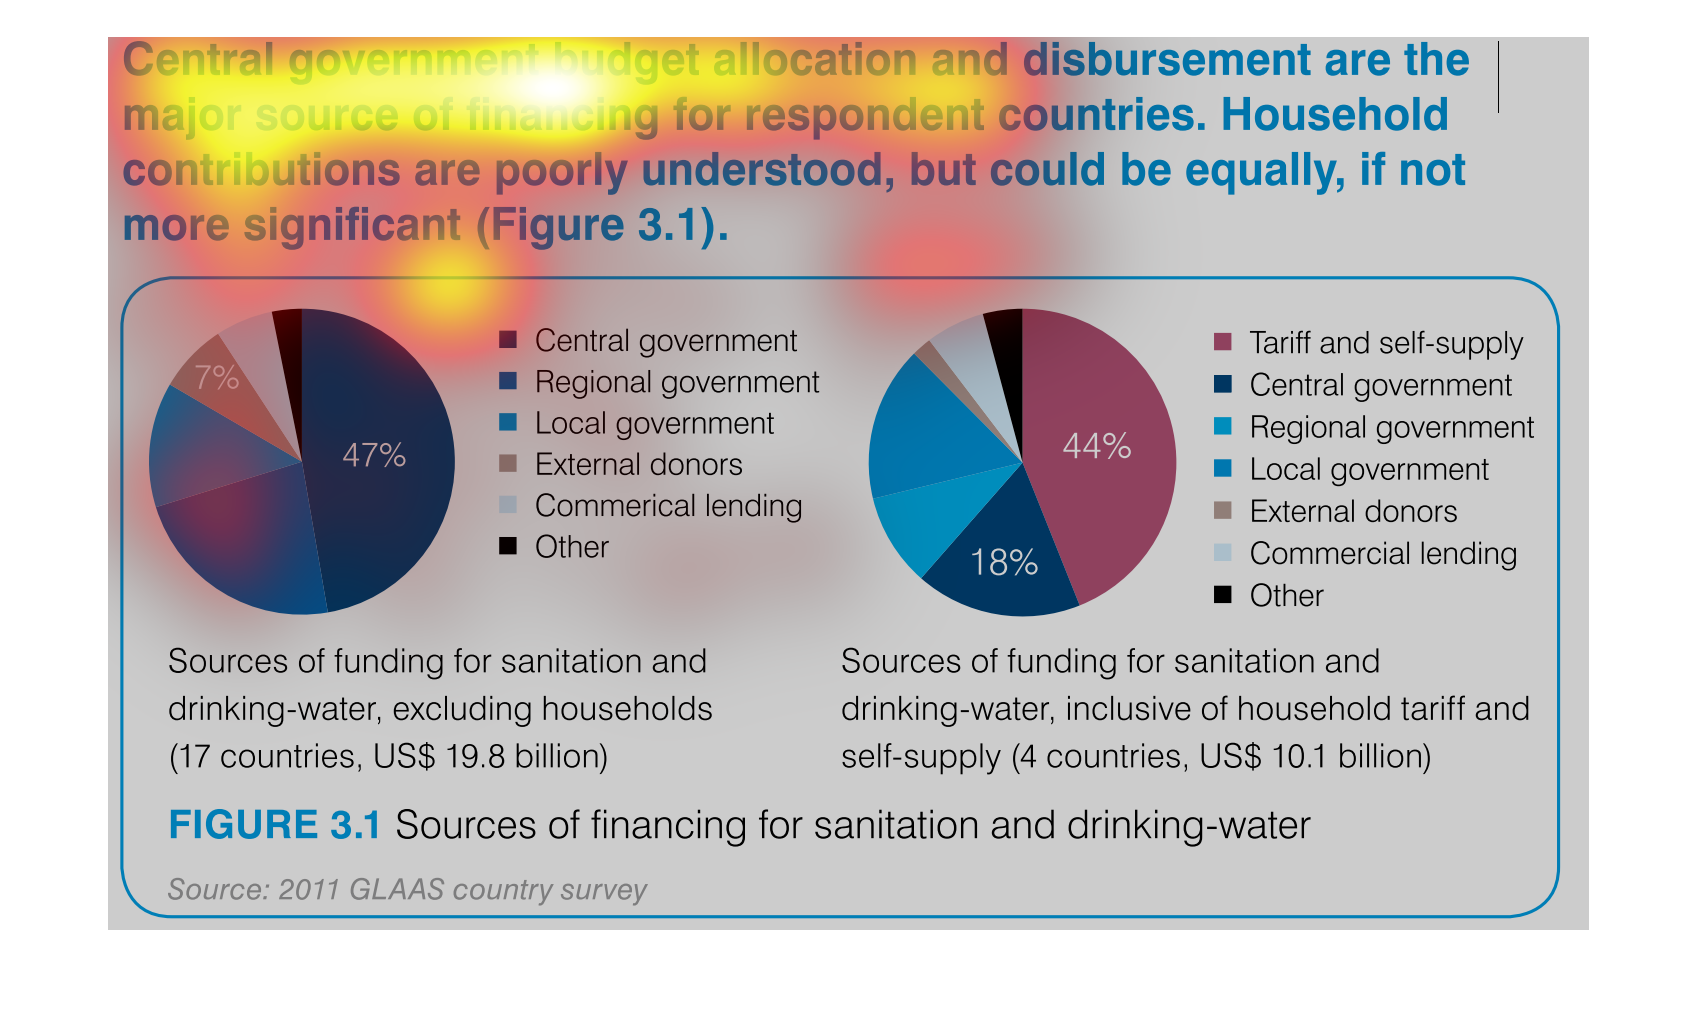
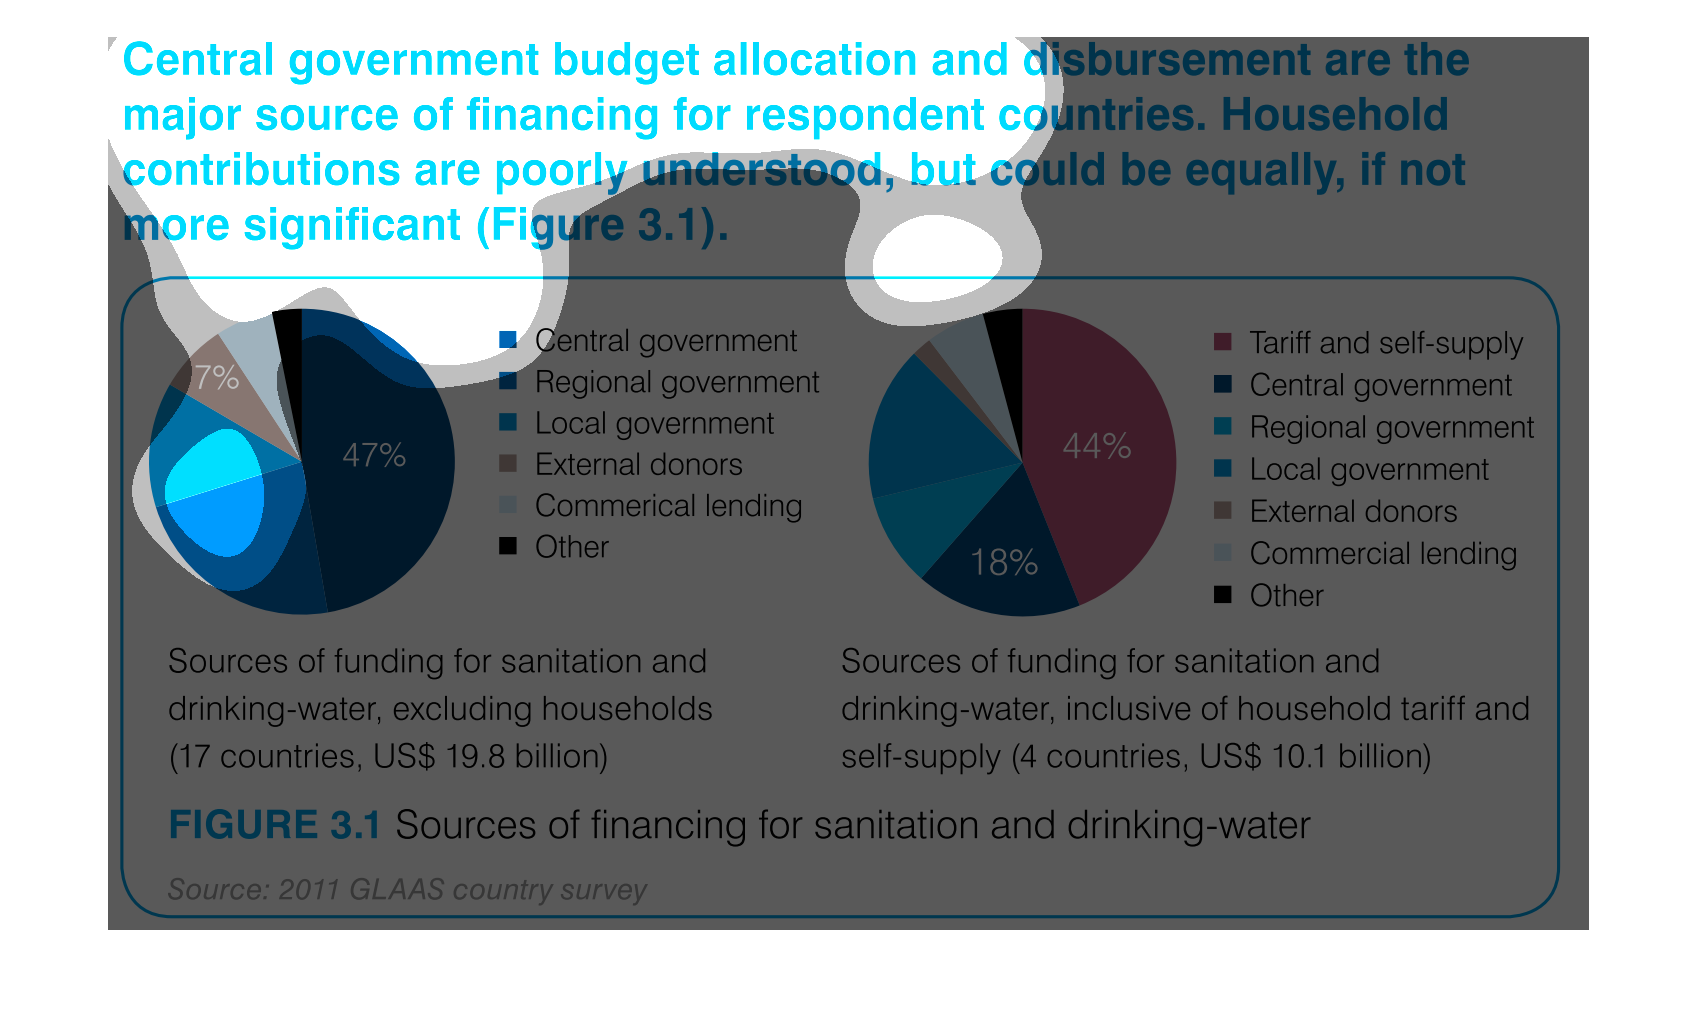
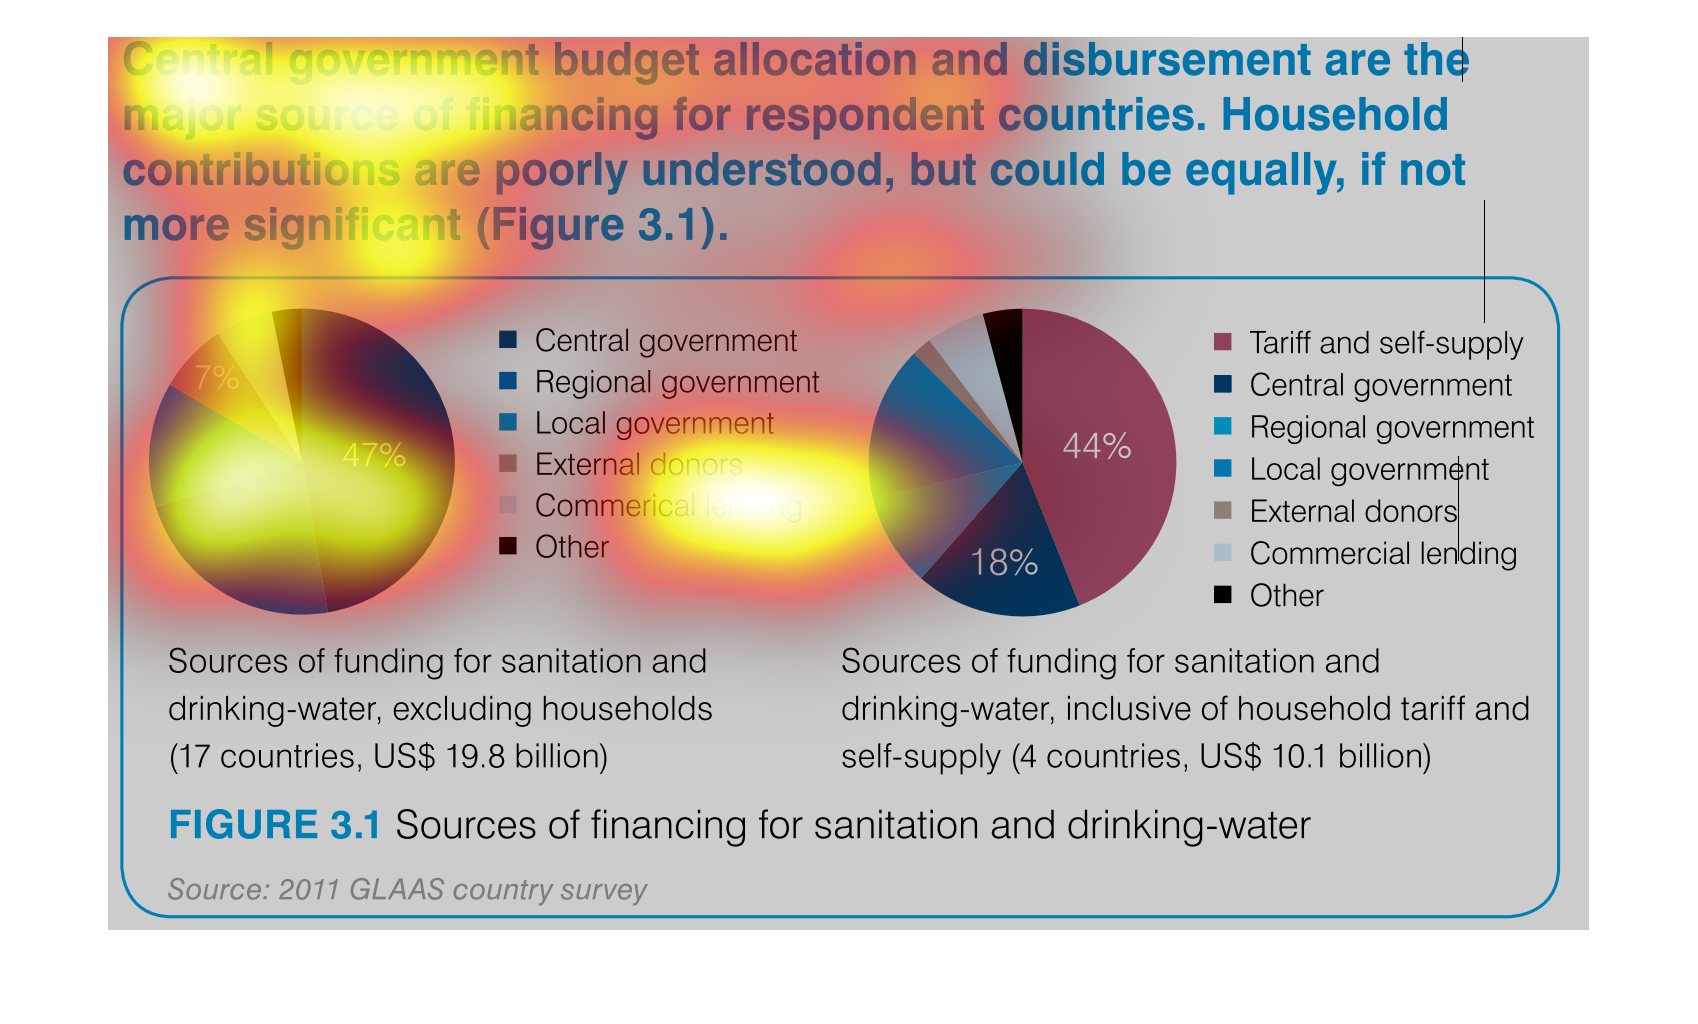
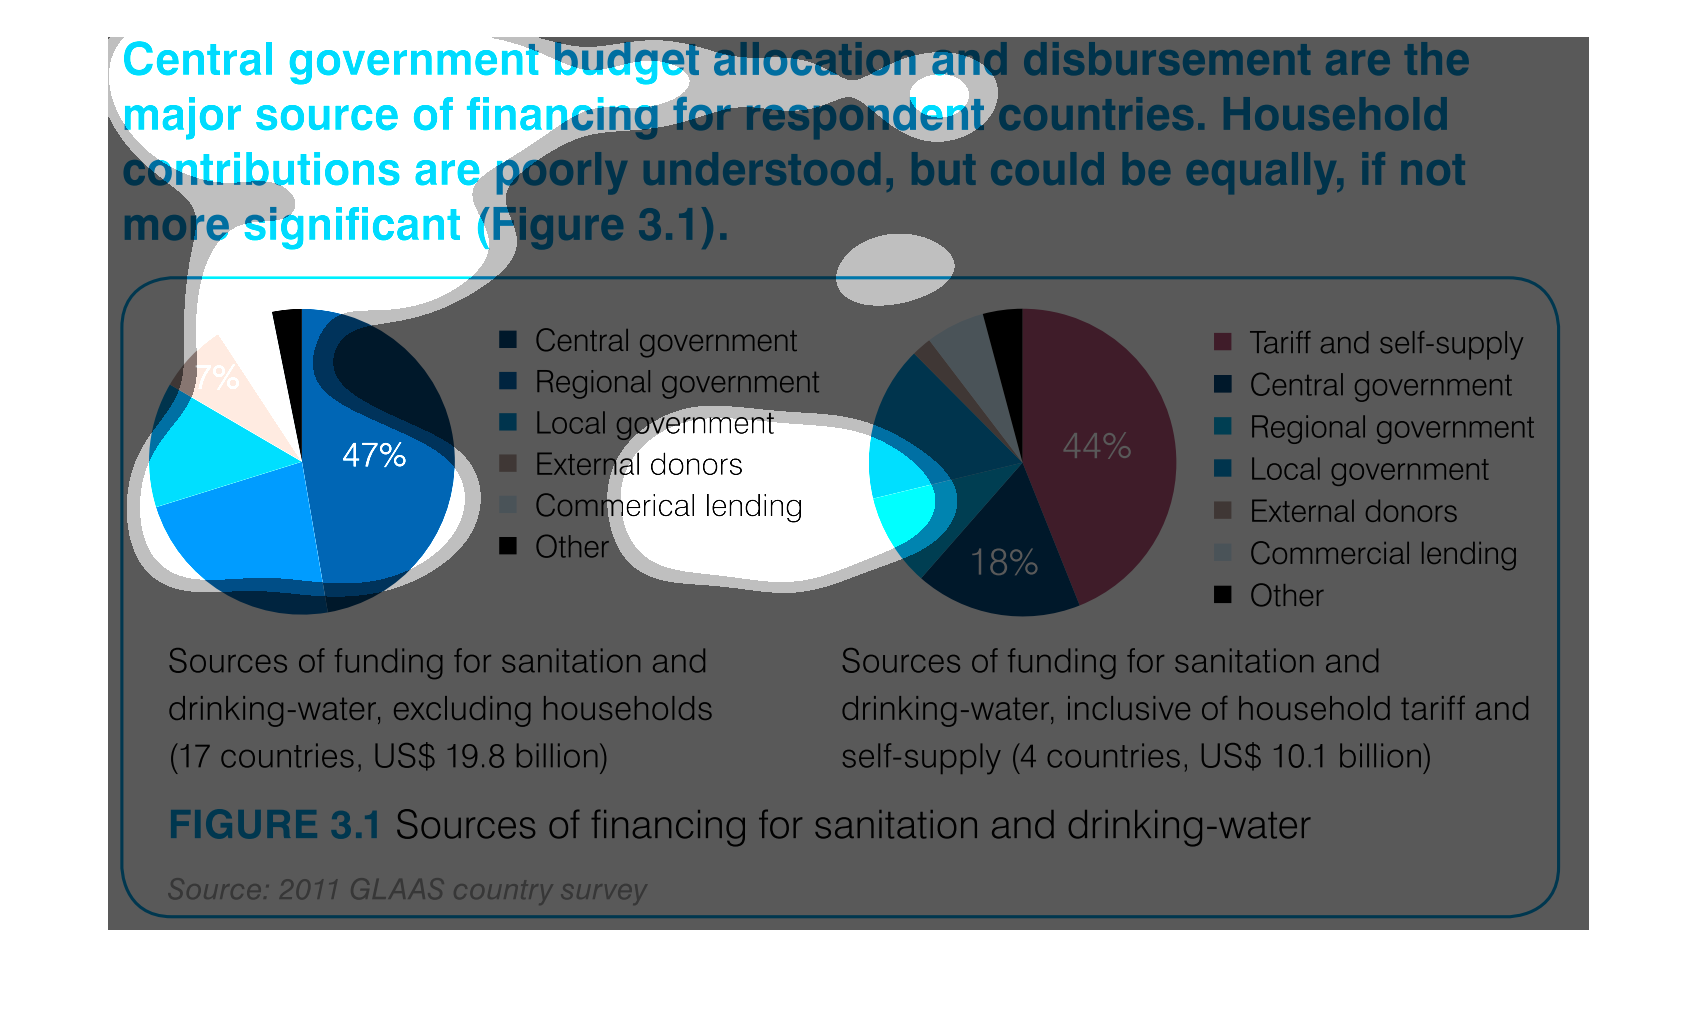
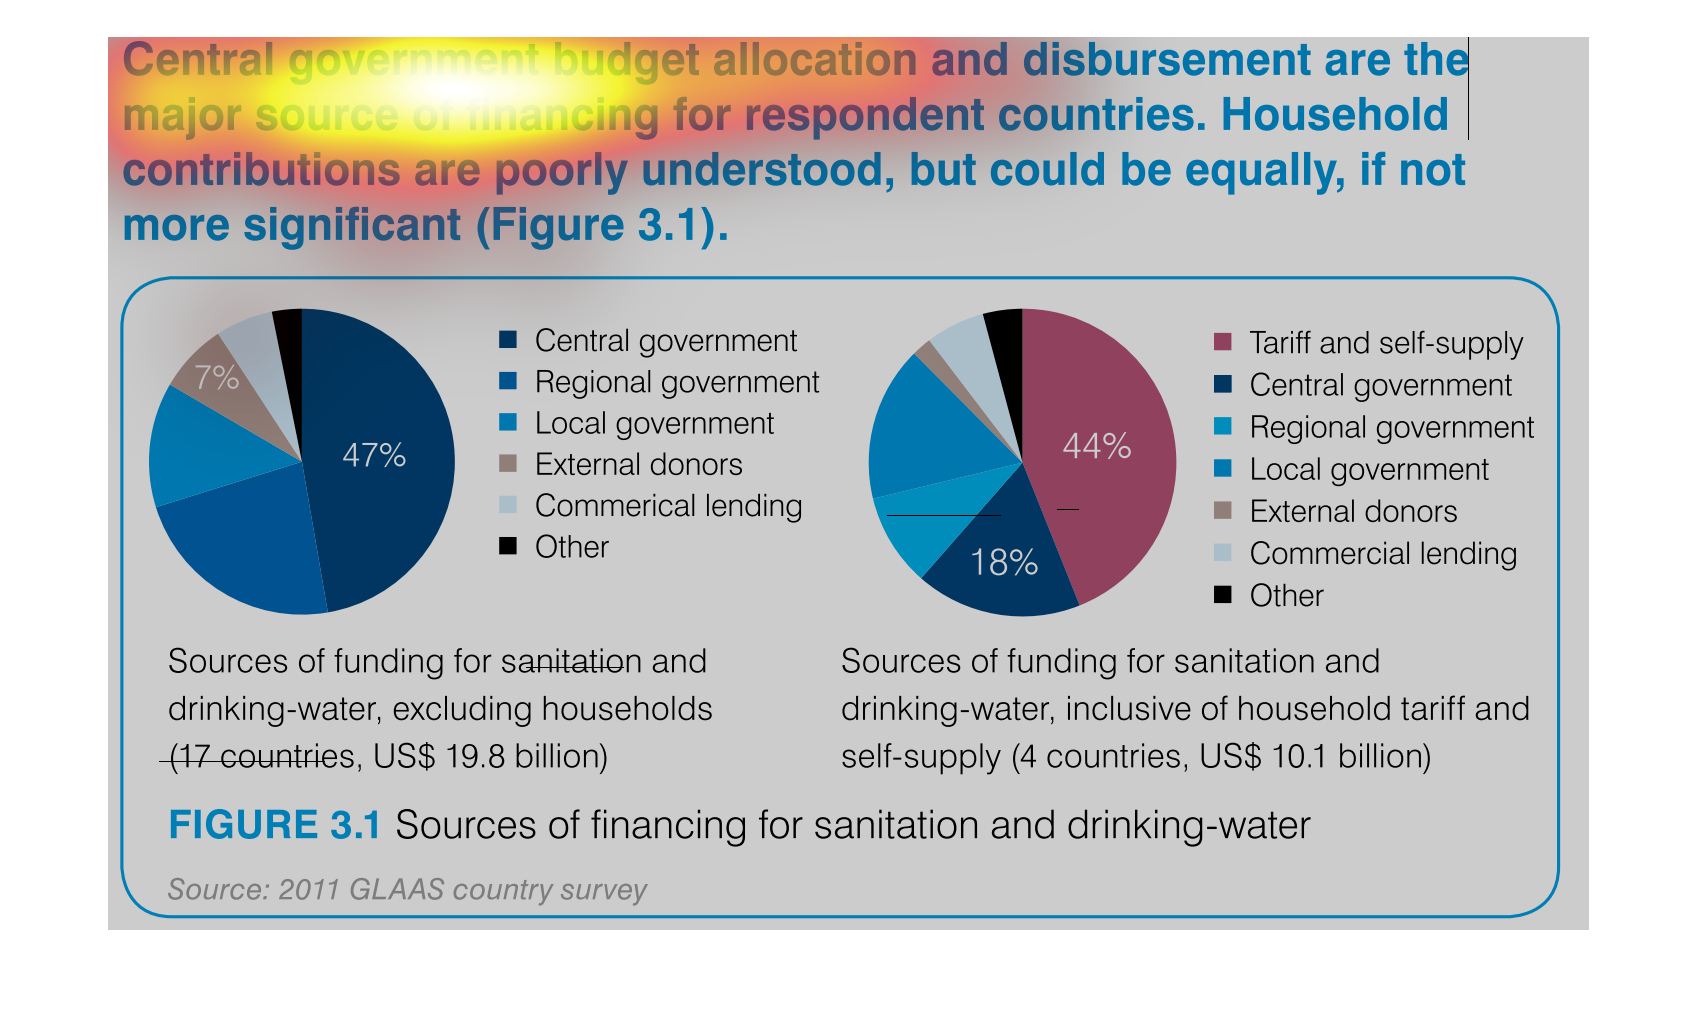
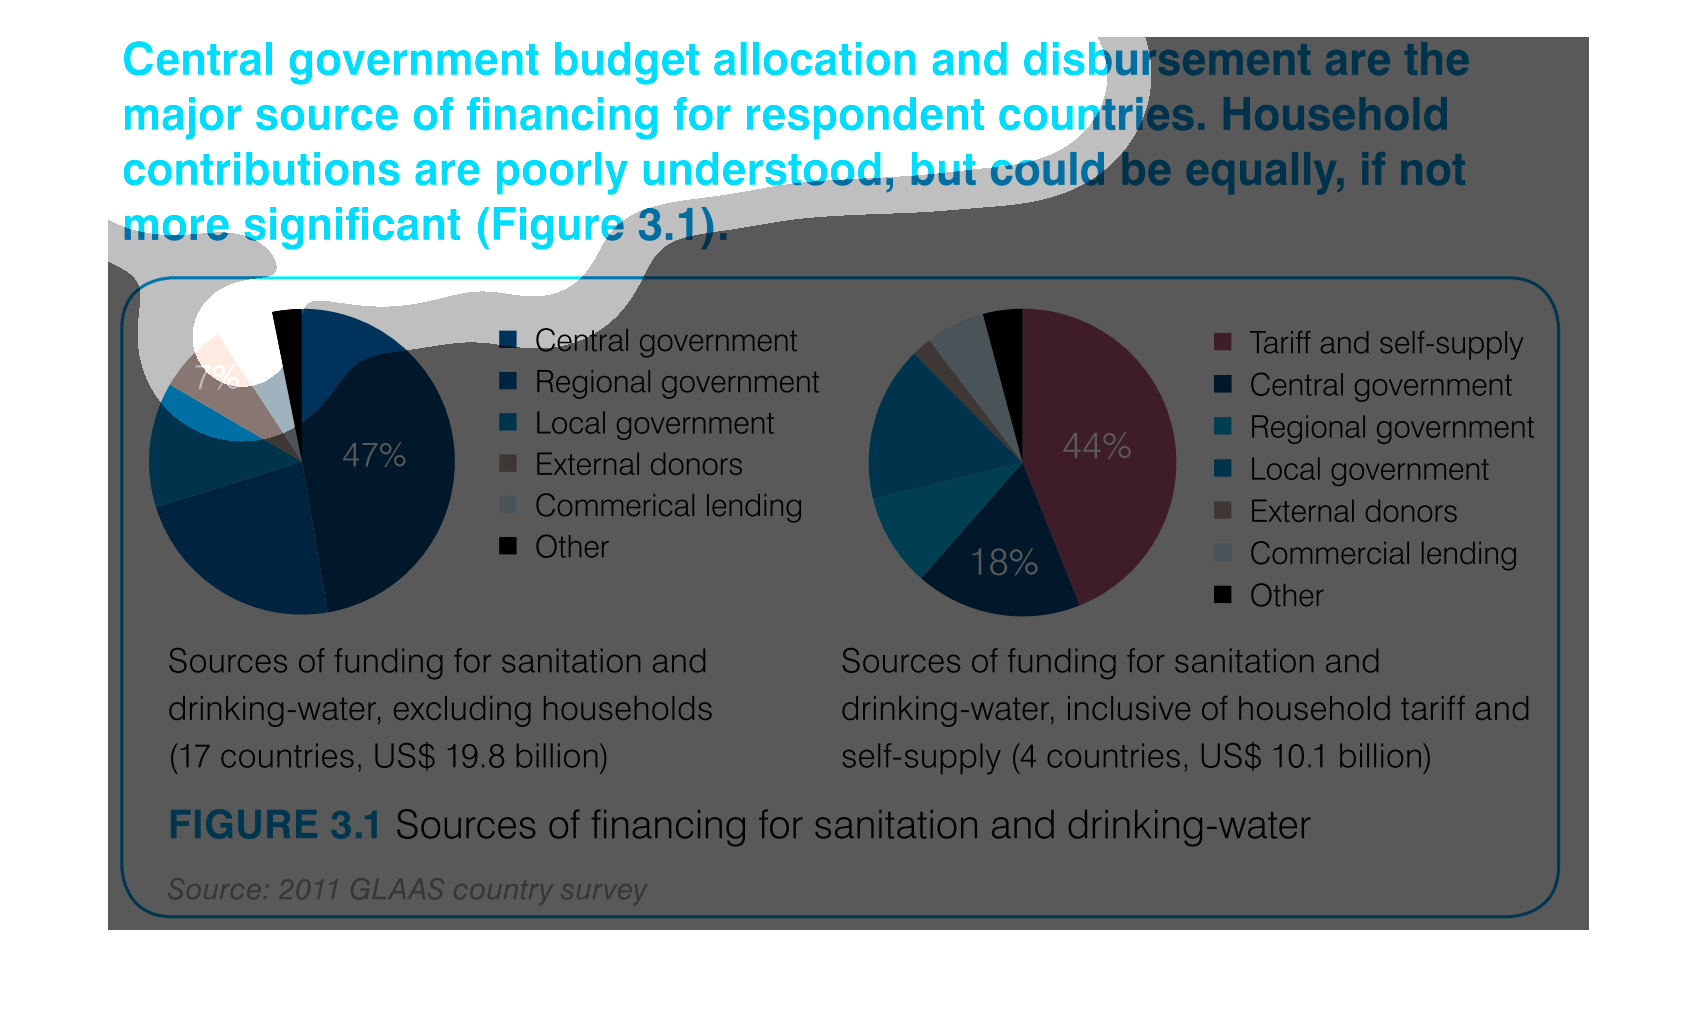
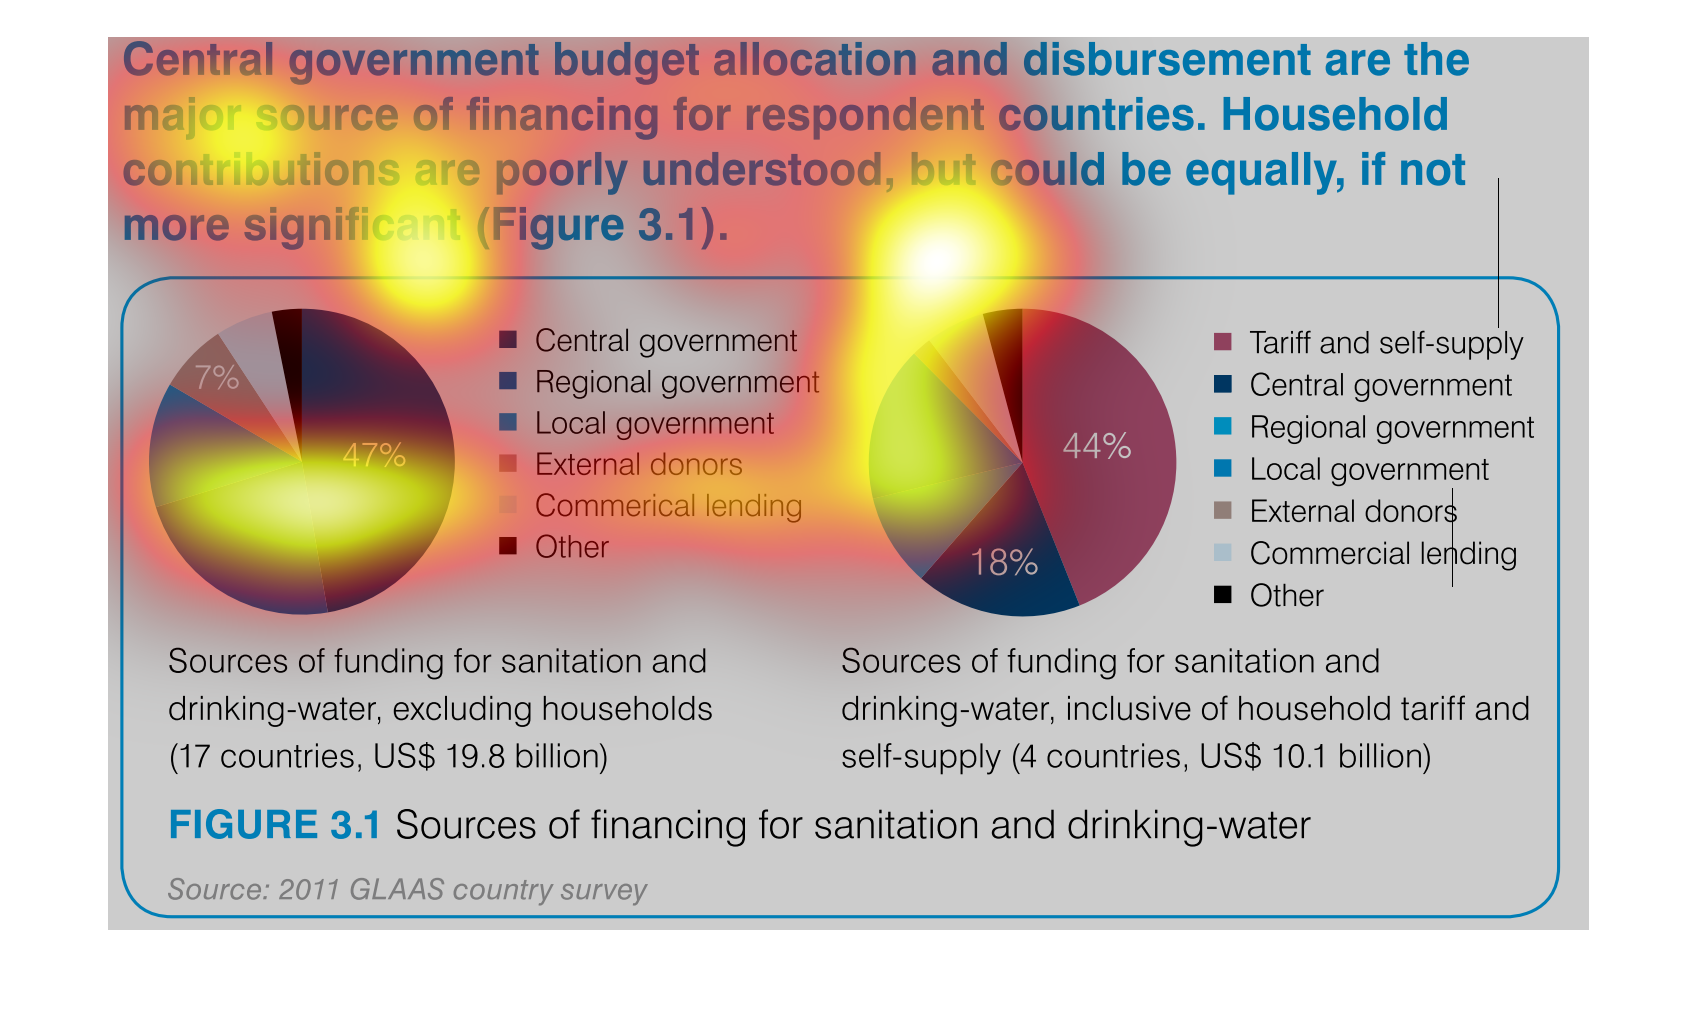
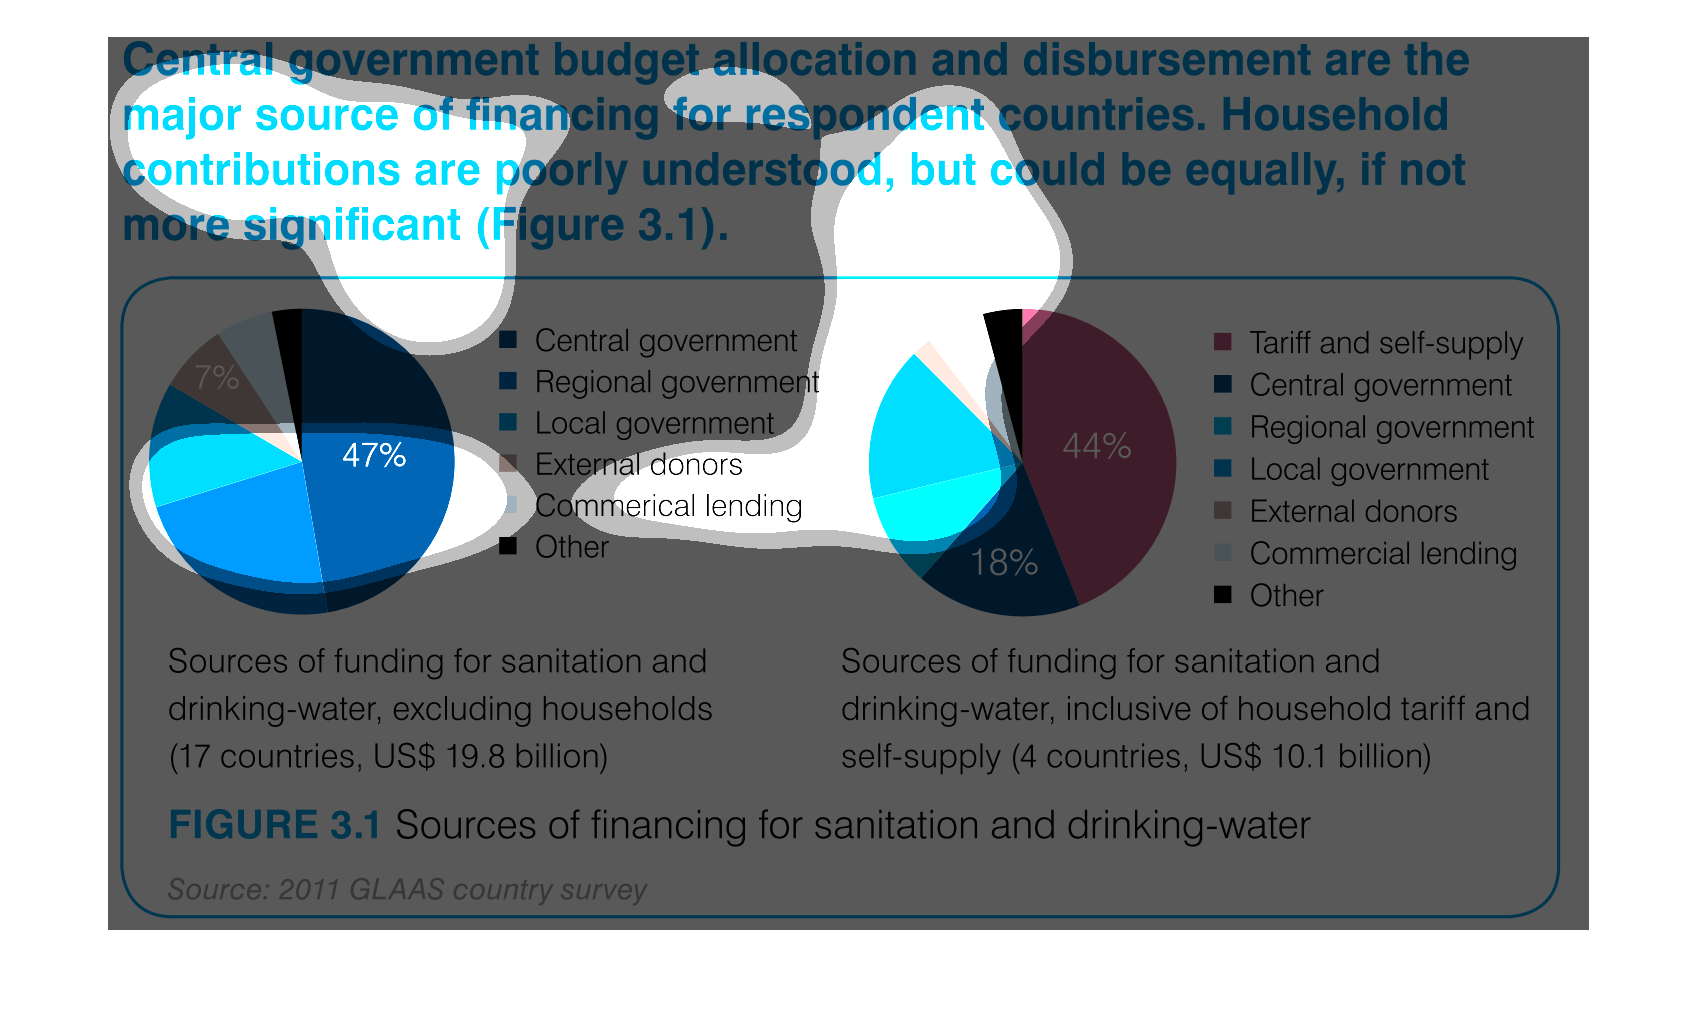
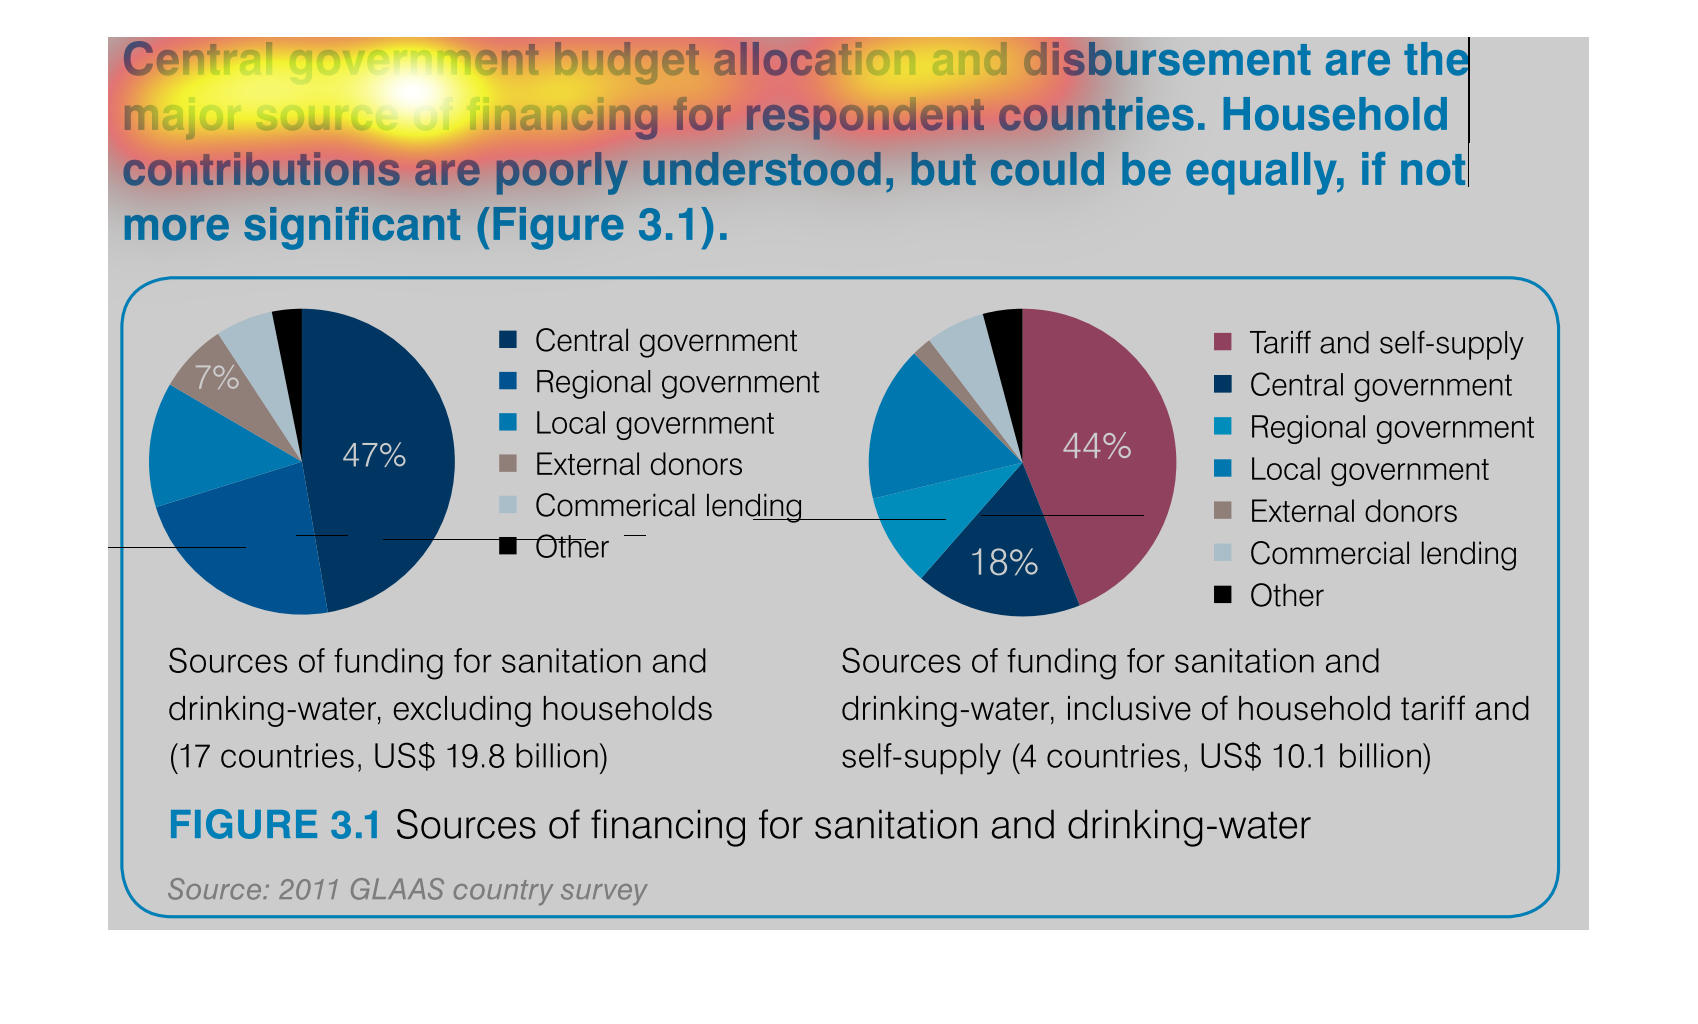
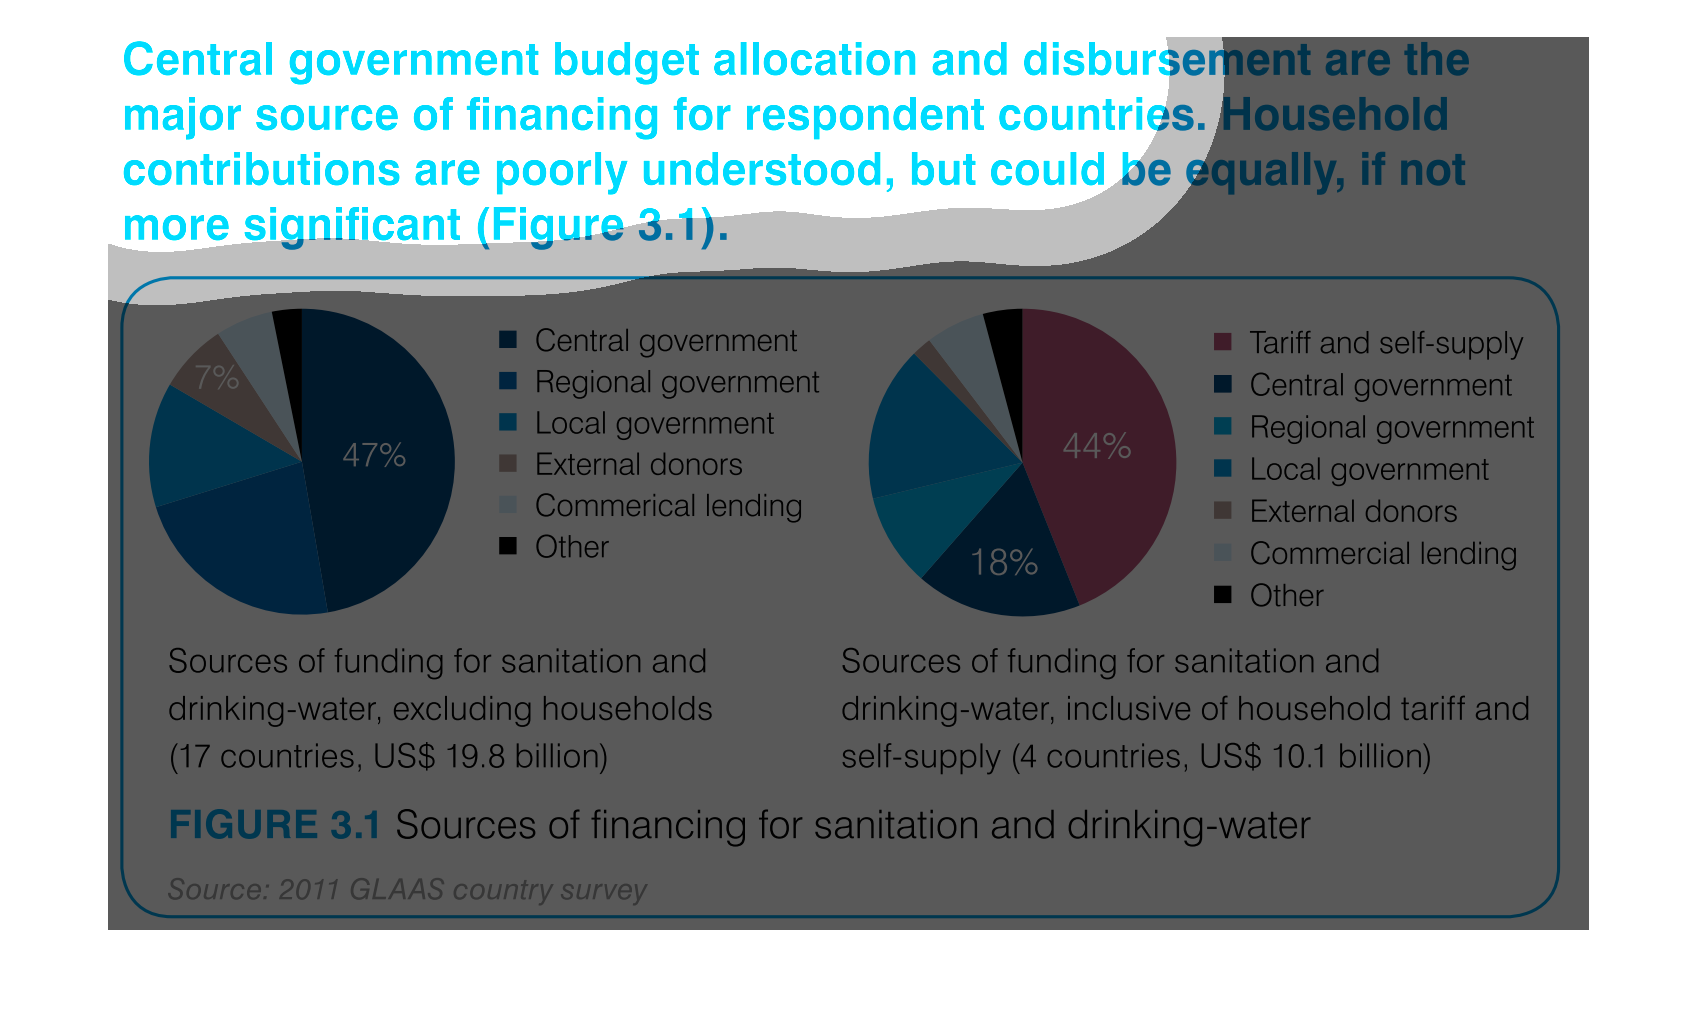
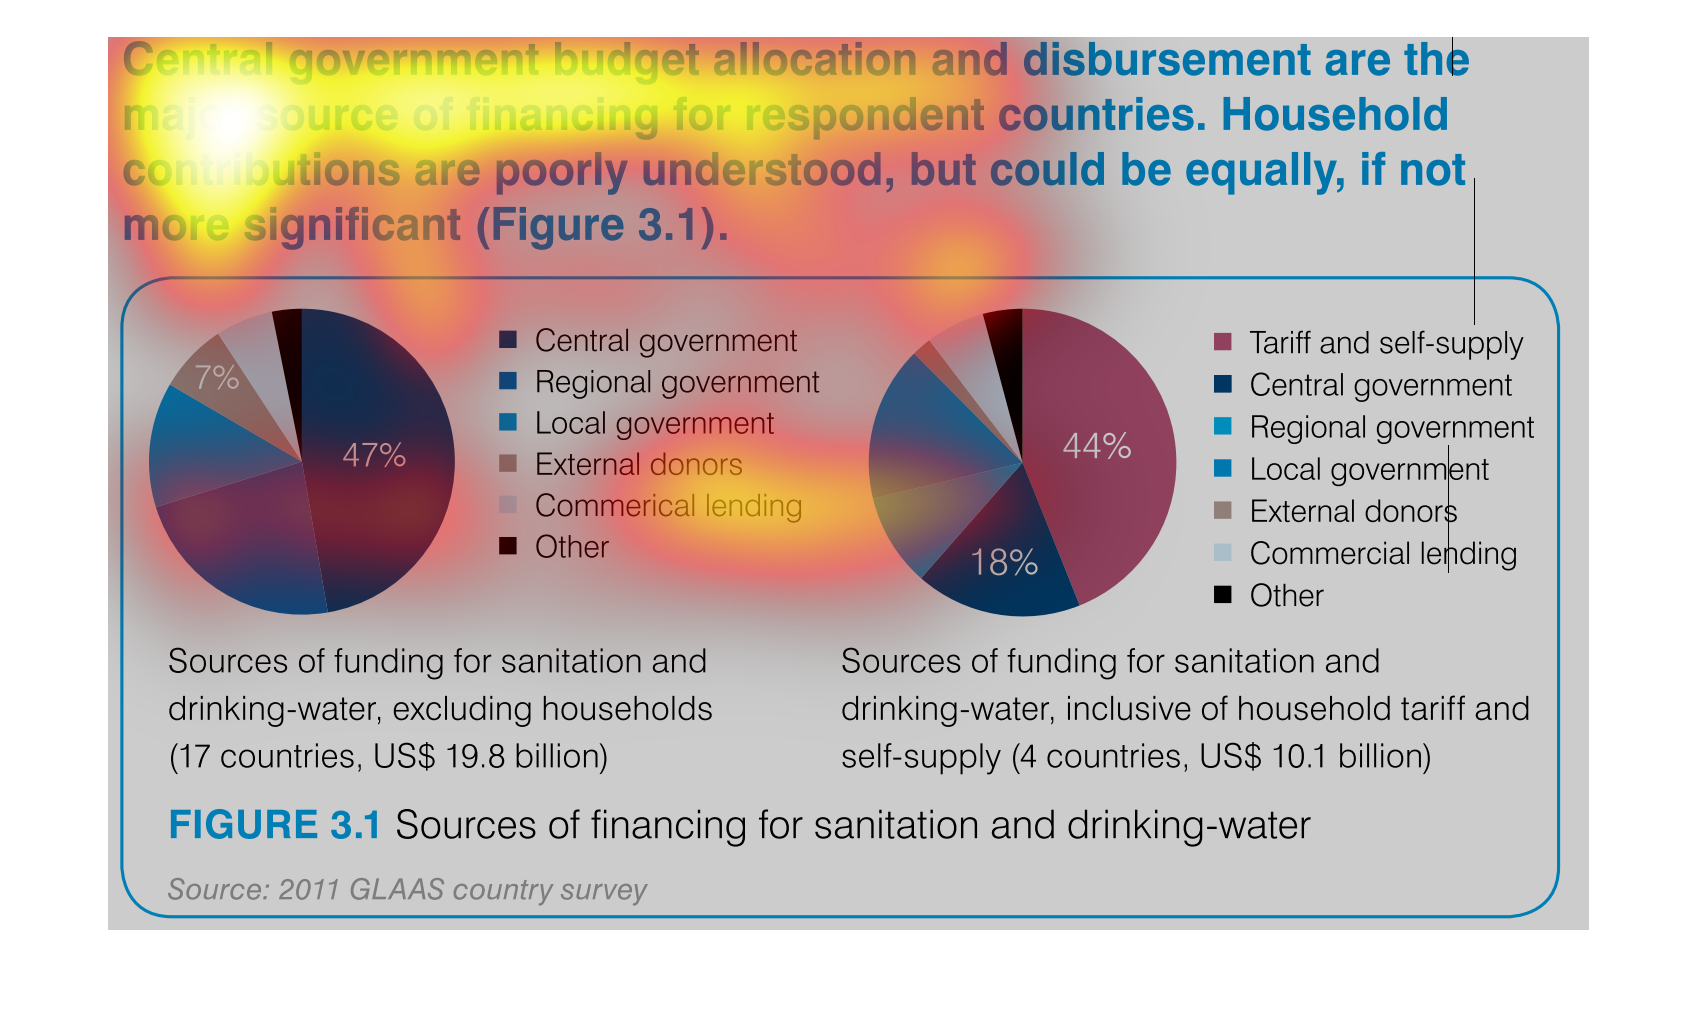
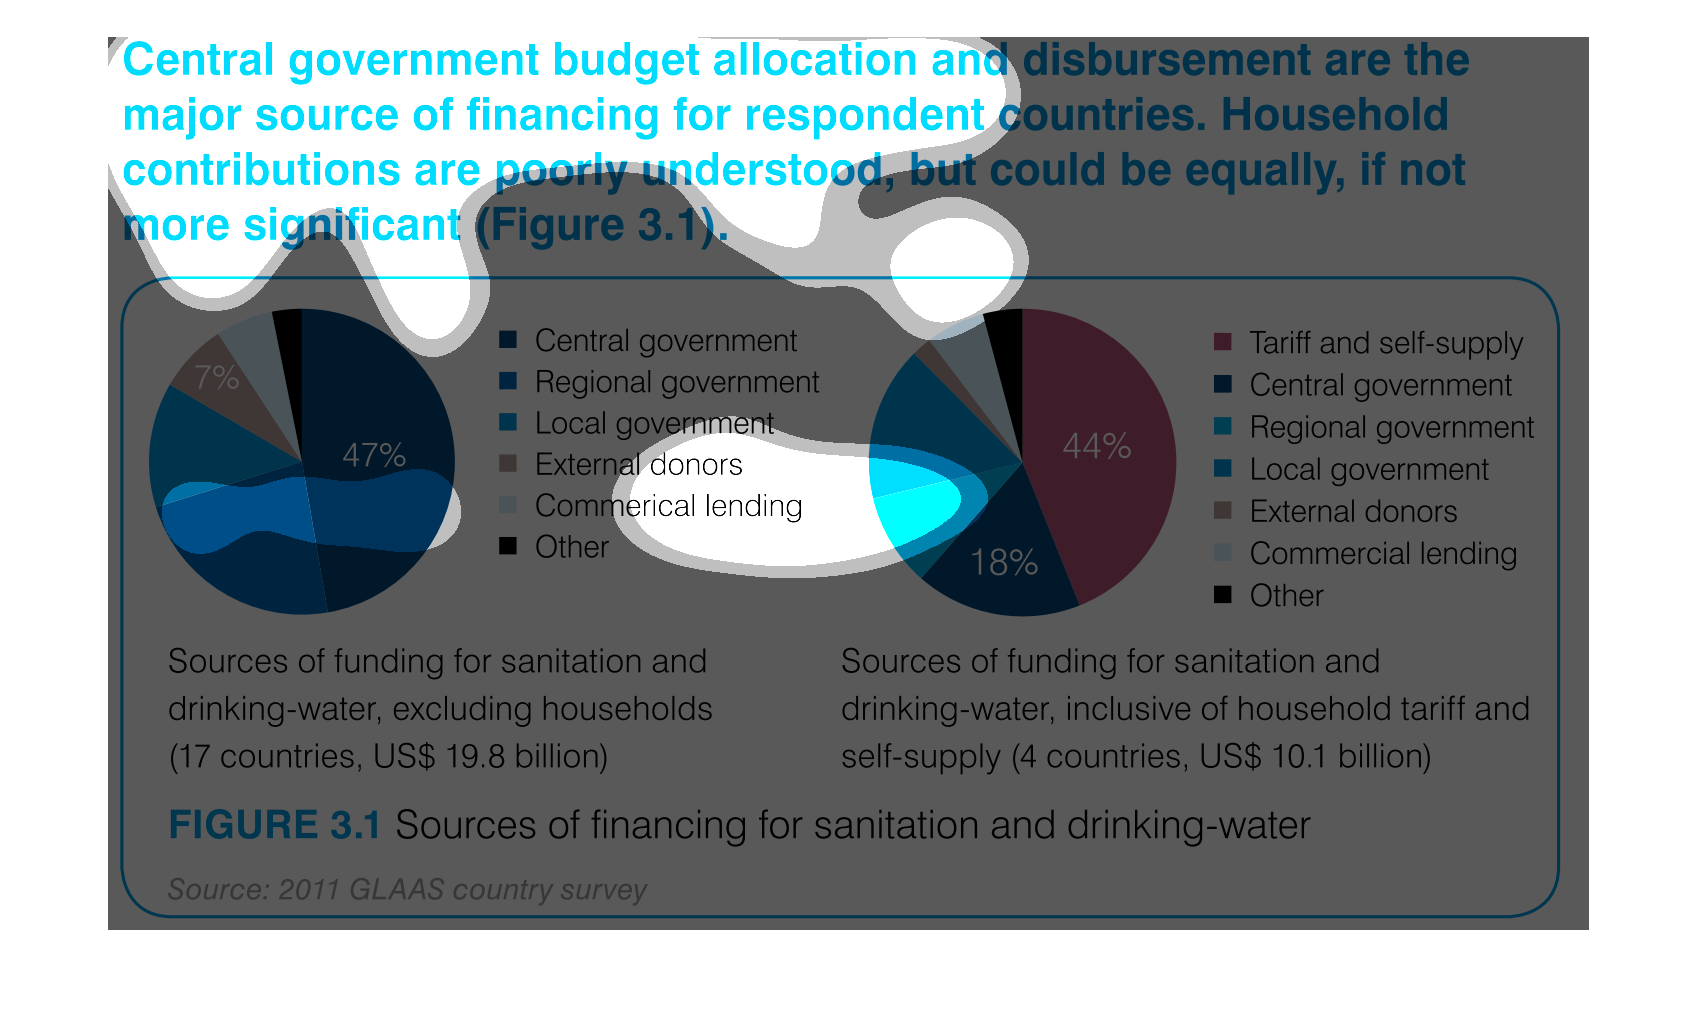
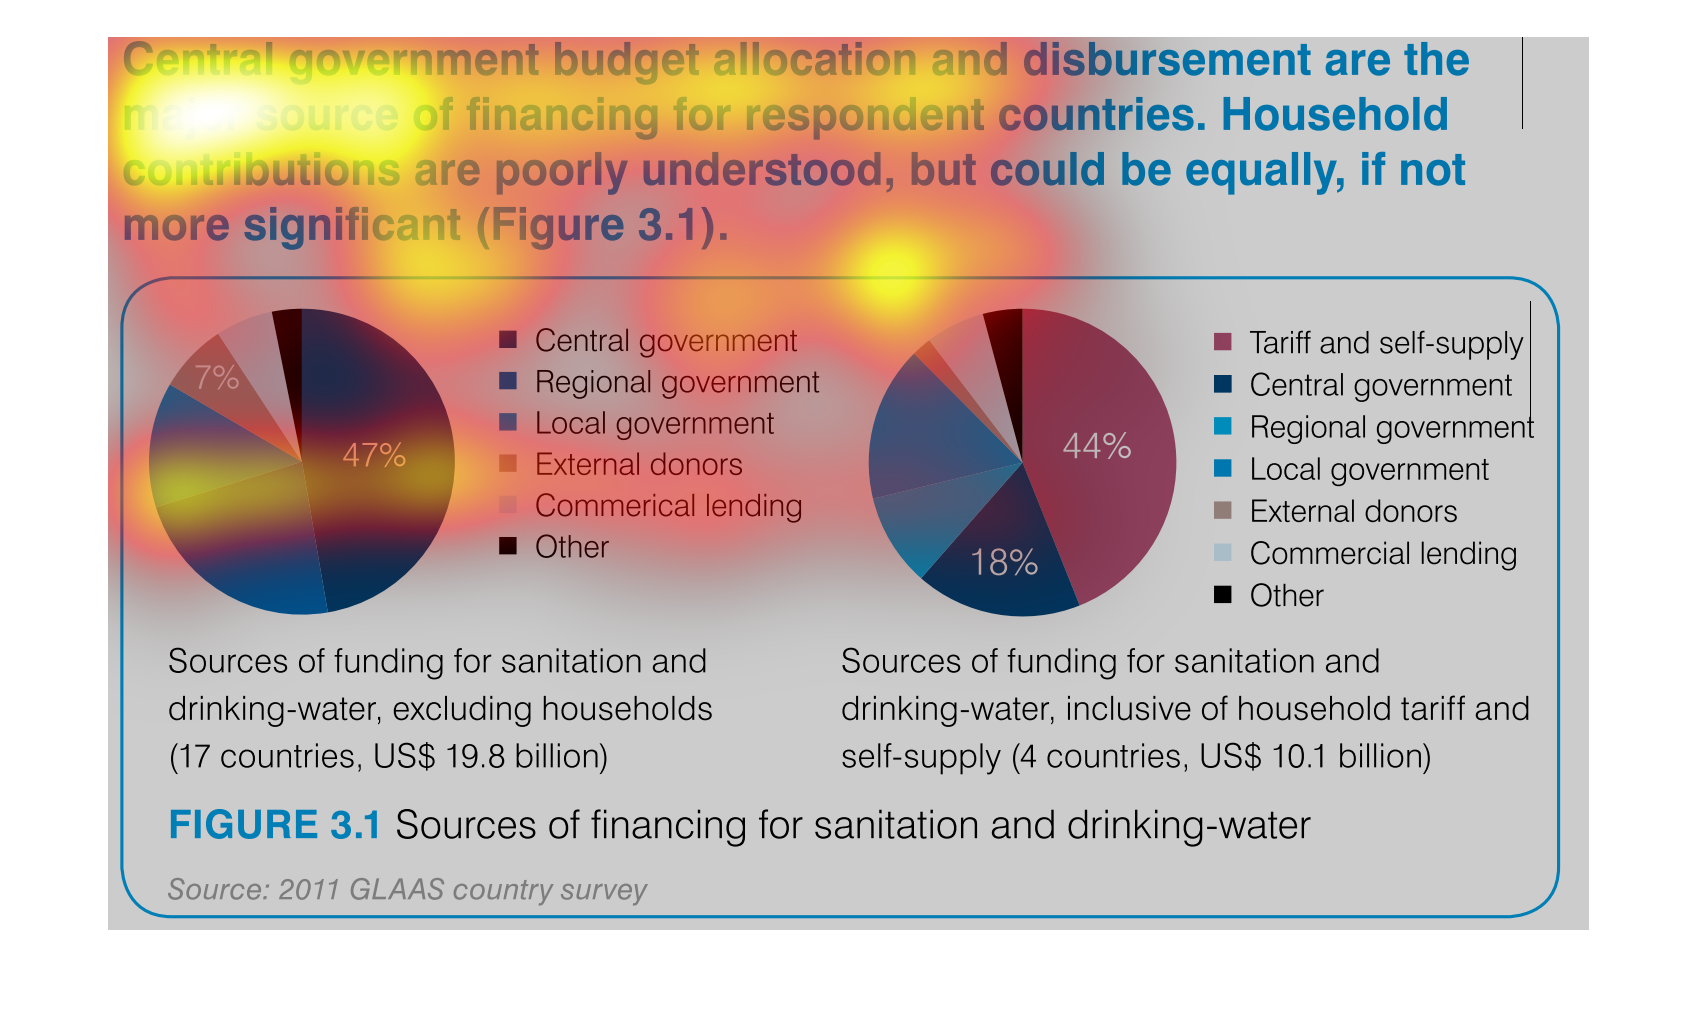
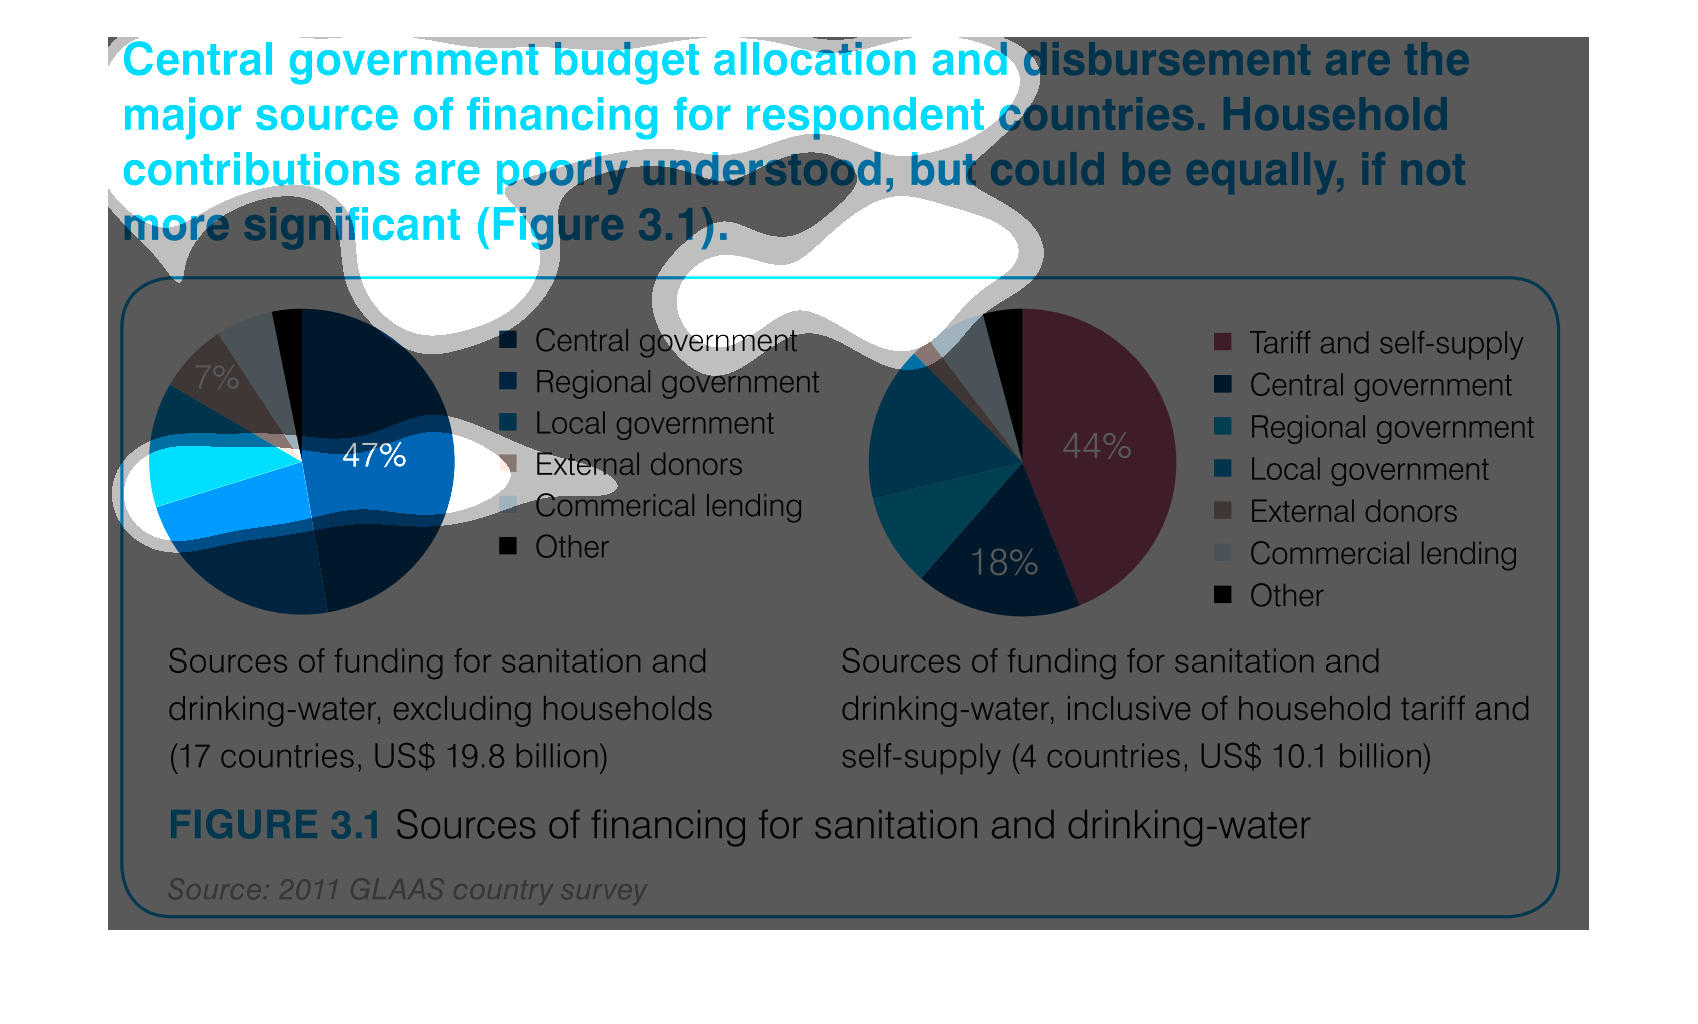
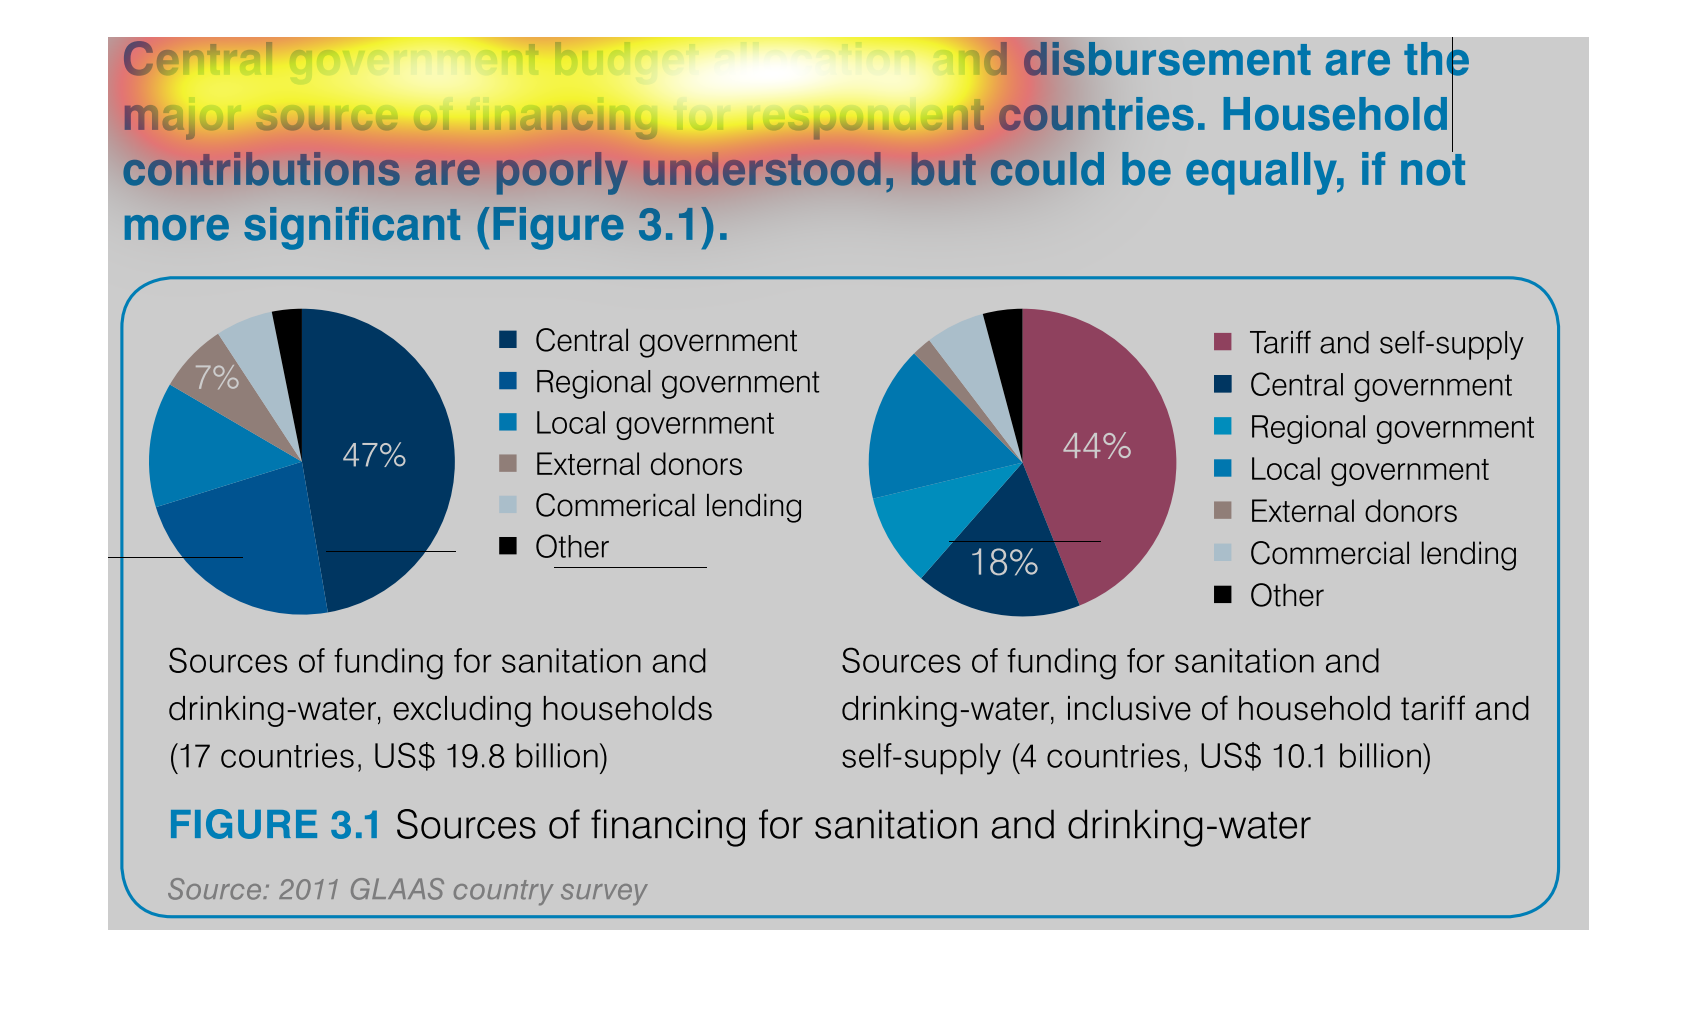
The charts show the central government budget allocation and disbursement are the major source
of financing for respondent countries. Household contributions are poorly understood, but
could be equally, if not more significant. In the first chart, sources of funding for sanitation
and drinking-water, excluding households. The central government takes over 47% of the chart,
being the largest one. The second chart is sources of funding for sanitation and drinking-water,
inclusive of household tariff and self-supply in 4 countries. 44% was tariff and self-supply,
while 18% belongs to the central government.
The pie charts represents central government allocation and disbursement of major sources
of financing for respondent countries. Household contributions are poorly understood
The graphs appear to show the percentage of funding by each source of government used for
funding sanitation and drinking water.  The graph on the right shows 4 countries that spend
almost as much as the other 19.
The figure presented is titled Central government allocation and disbursement are the major
source of financing for respondent countries. The figure is a graph of government distribution.
The pie charts display how sanitation is financed around the world. The financing of the sanitation
is divided into different categories like central government and local government.
The image depicts two graphs represent the source of funding for sanitation and drinking water.
One graph depicts the funding without household contributions. In  this graph the highest
source of funding is from central government. In the second graph household funding and tariffs
are included. In that graph the highest source of funding is from tariffs and self supply.
This shows that  central government budget allocation and disbursement are the major source
of financing for respondent countries.  Household contributions in the study are poorly understood.

This chart describes central government budget allocation and disbursement are the major source
of financing for respondent countries.Household contributions are poorly understood.