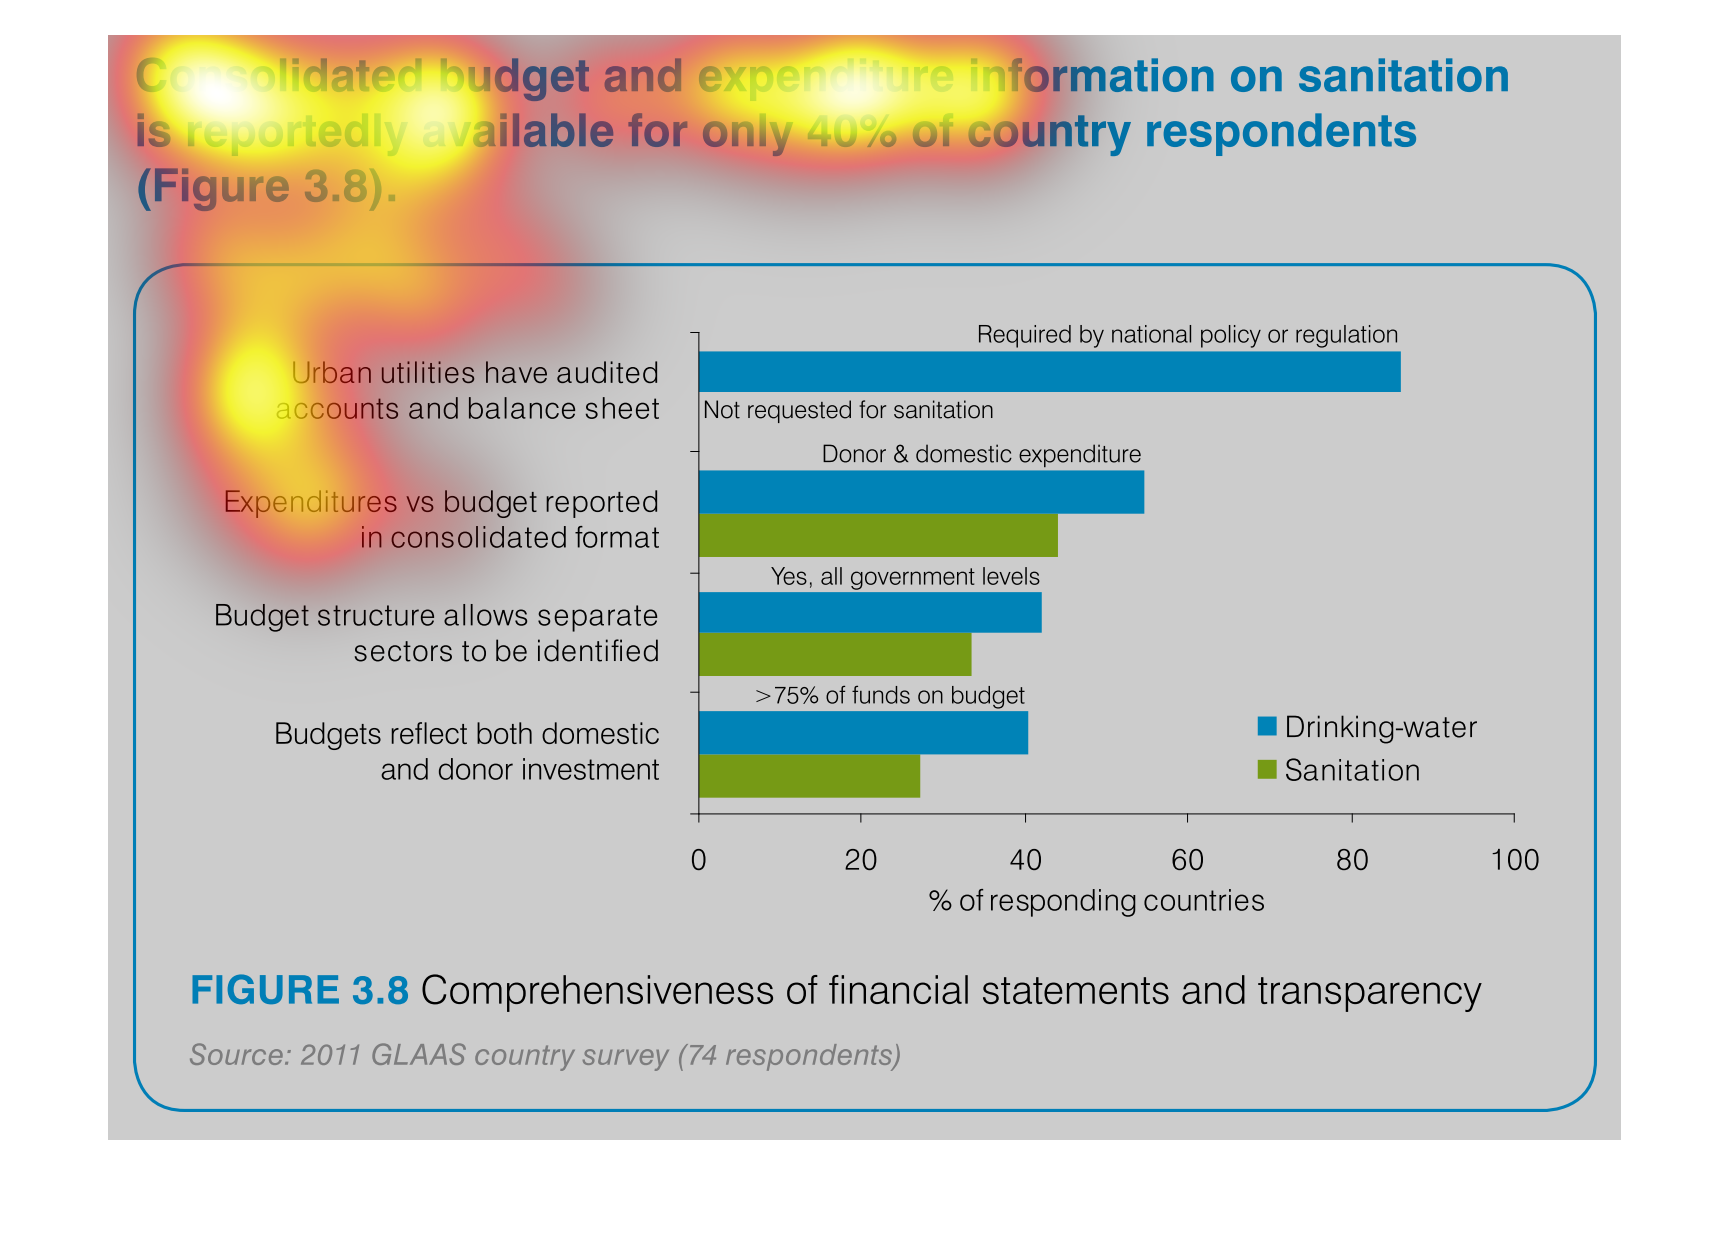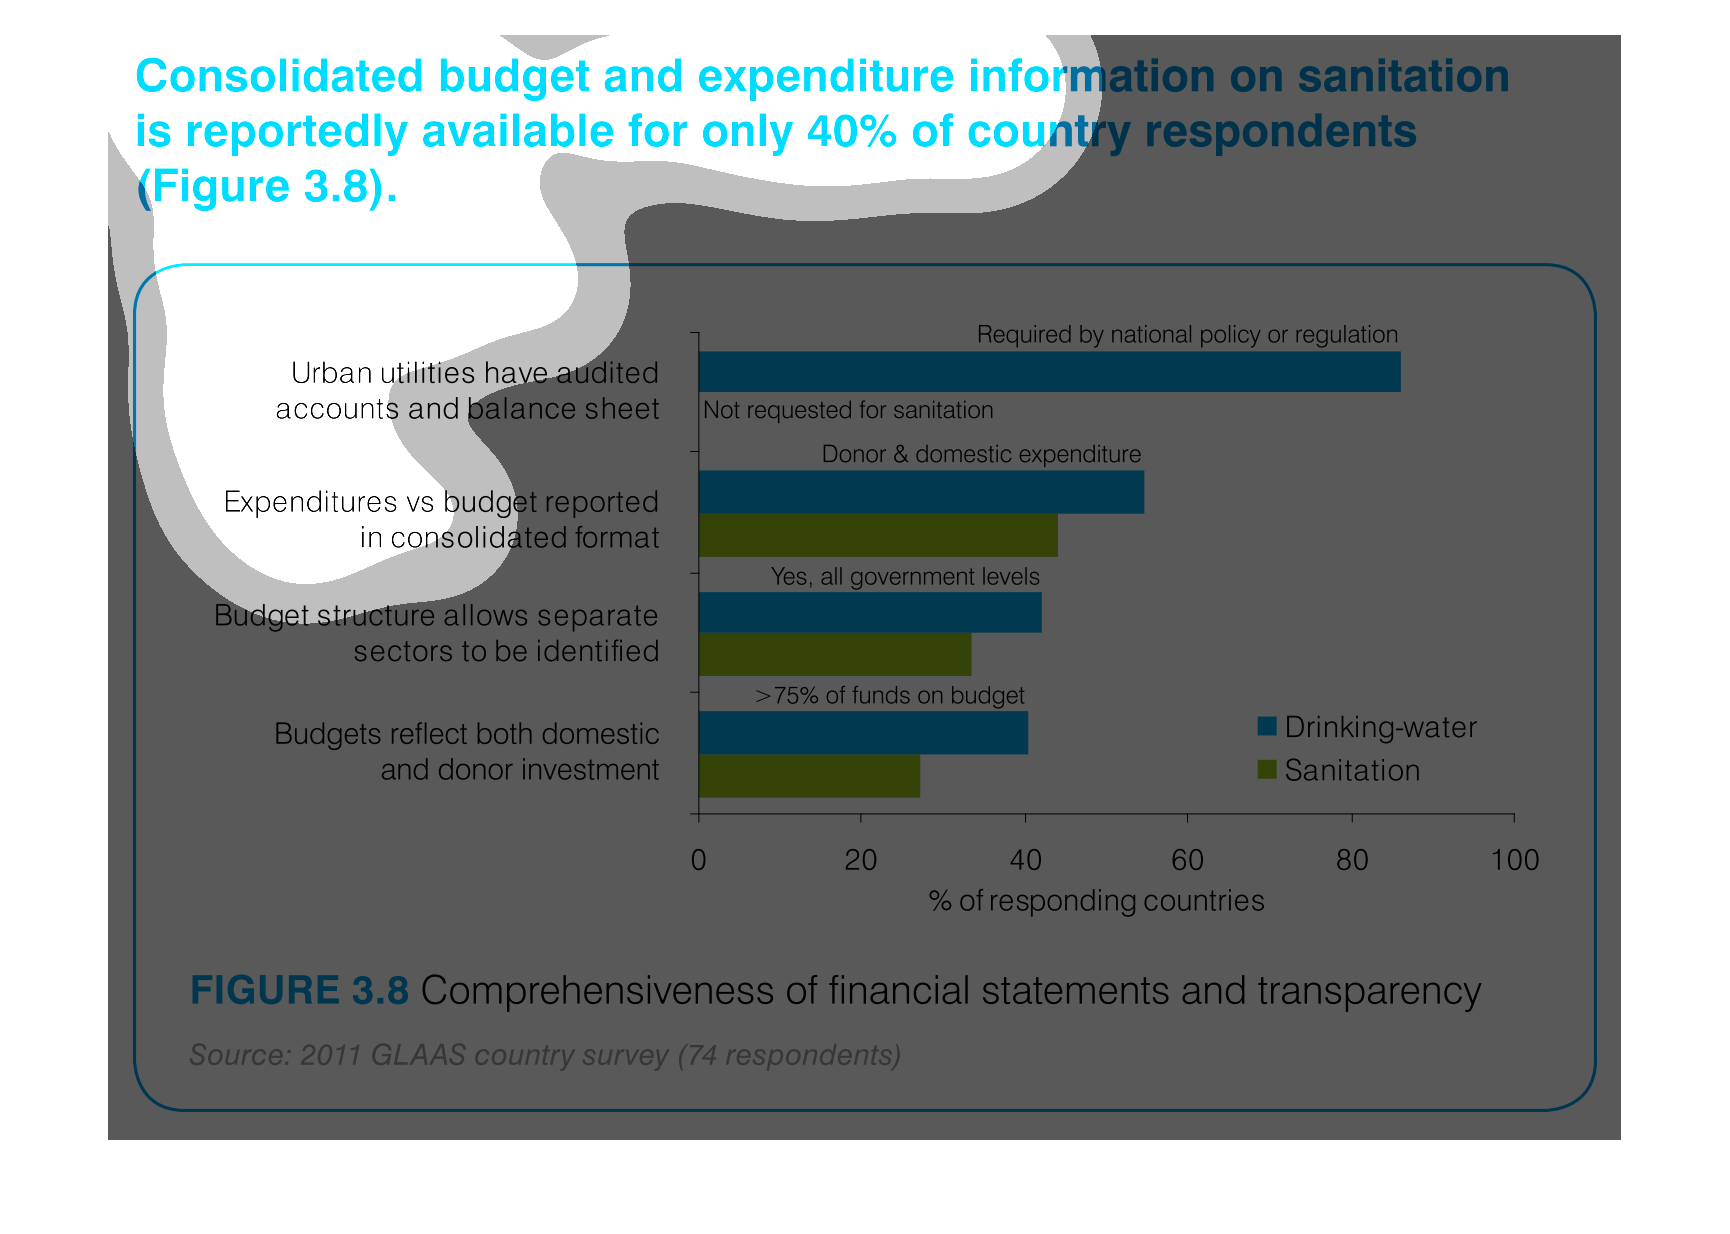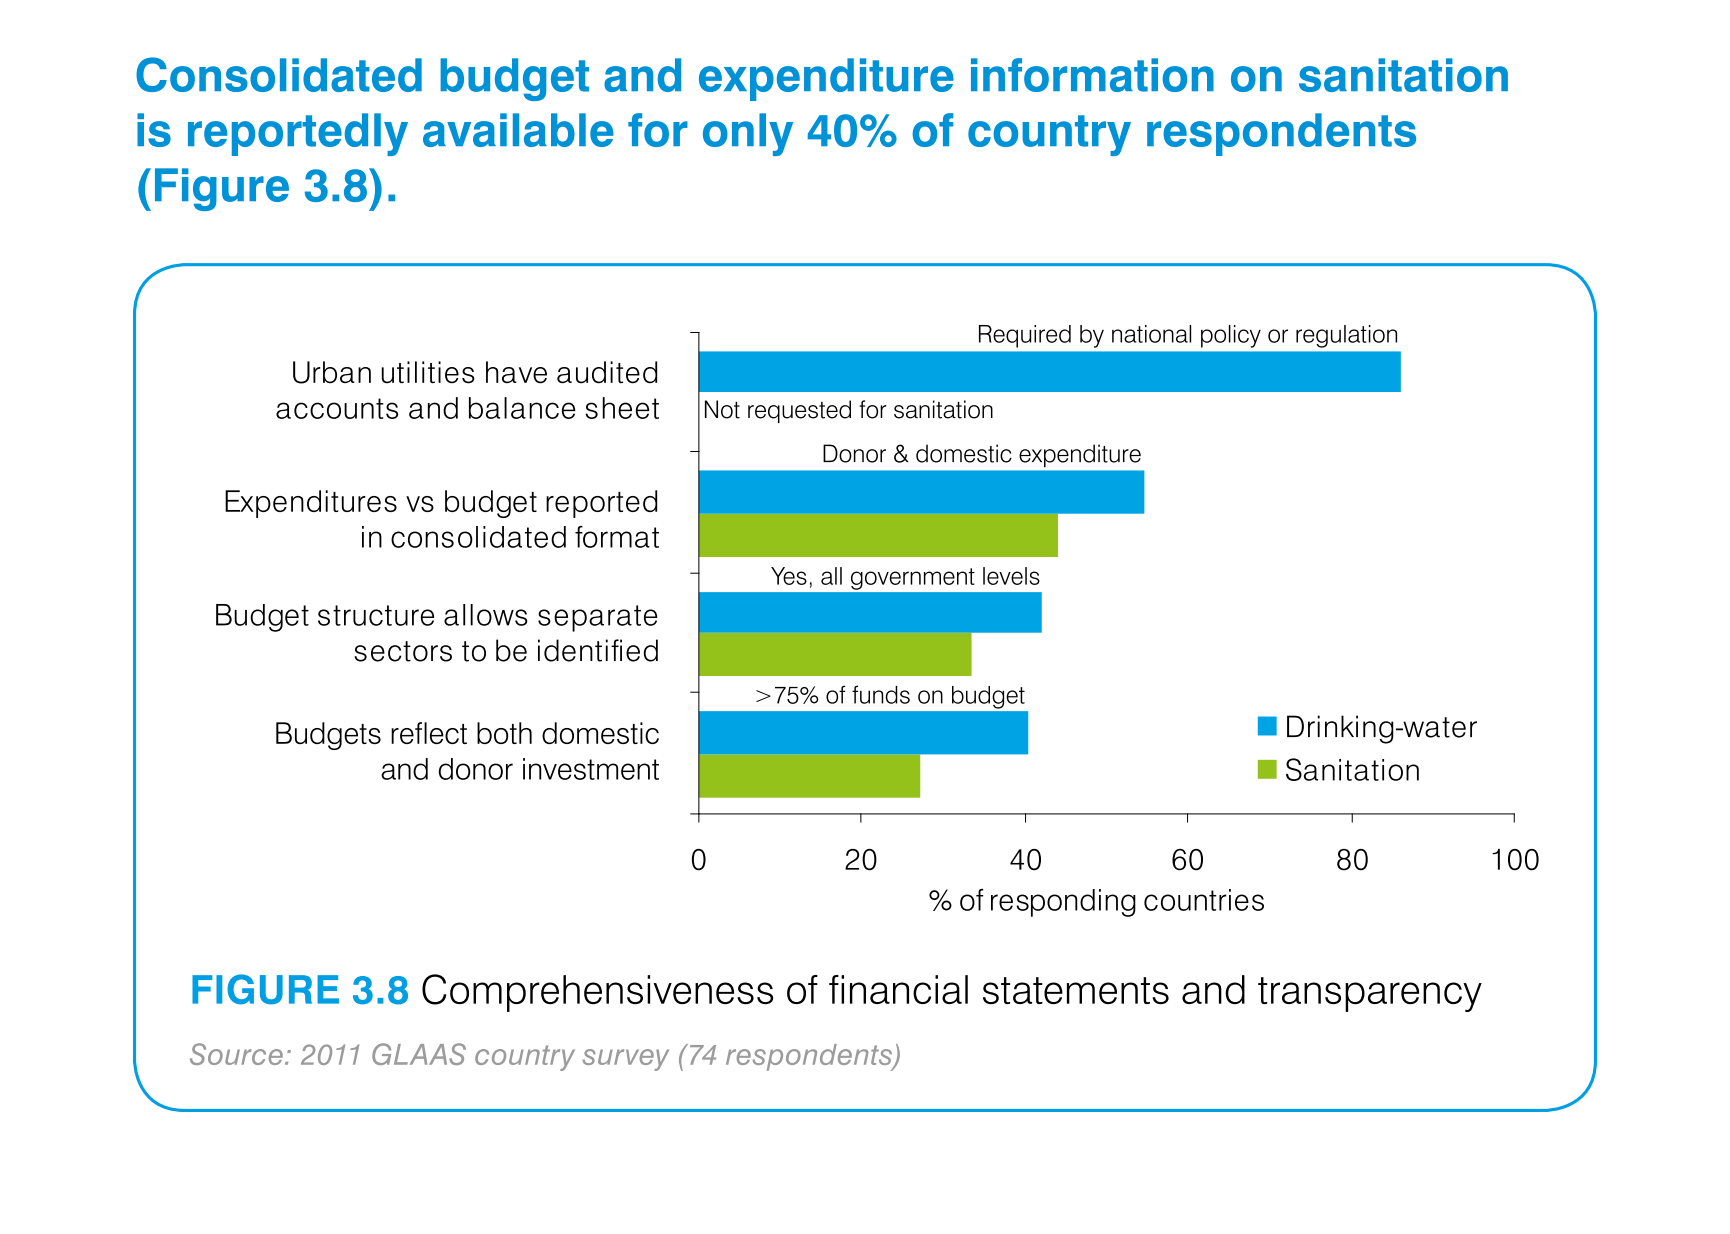
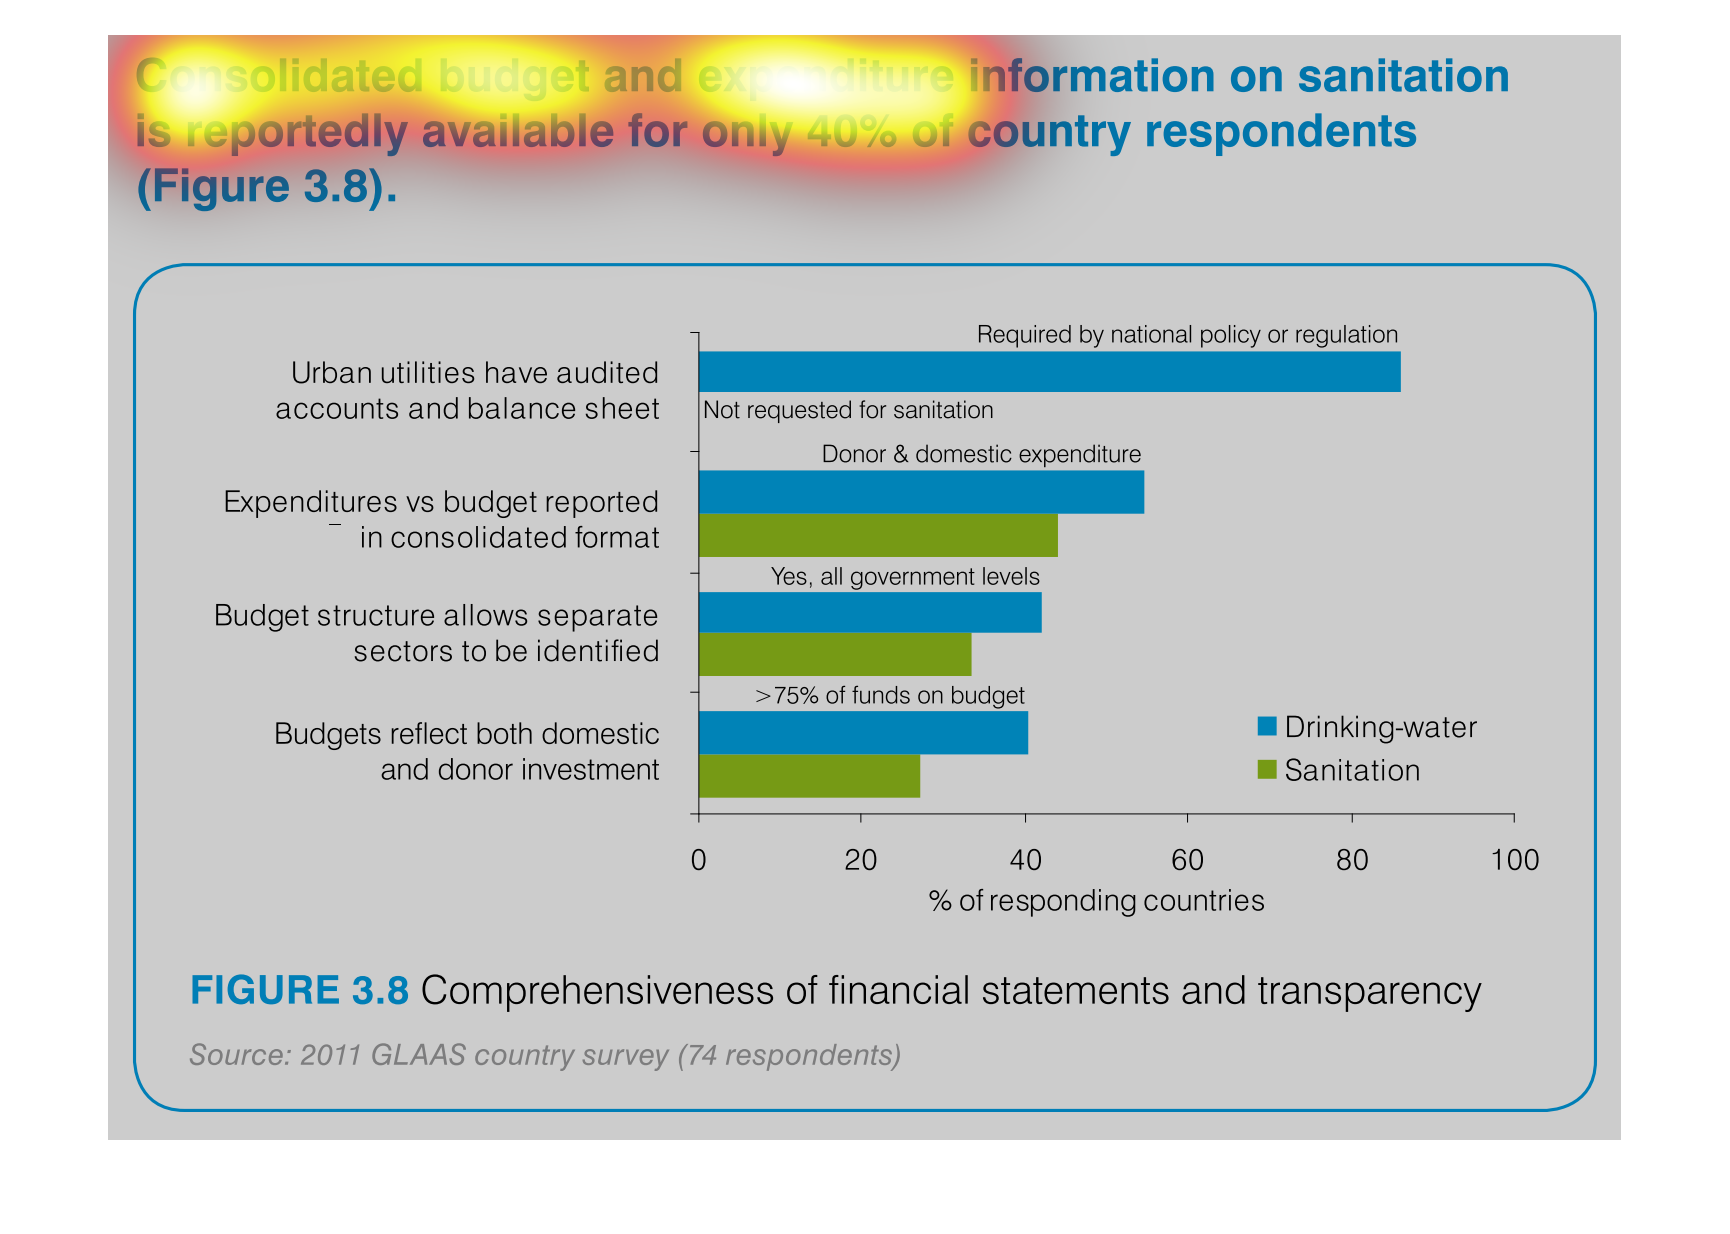
This handmade chart shows something about the budget and expenditures on sanitation for only
40% of the countries that repsonsed. It is too hard to read
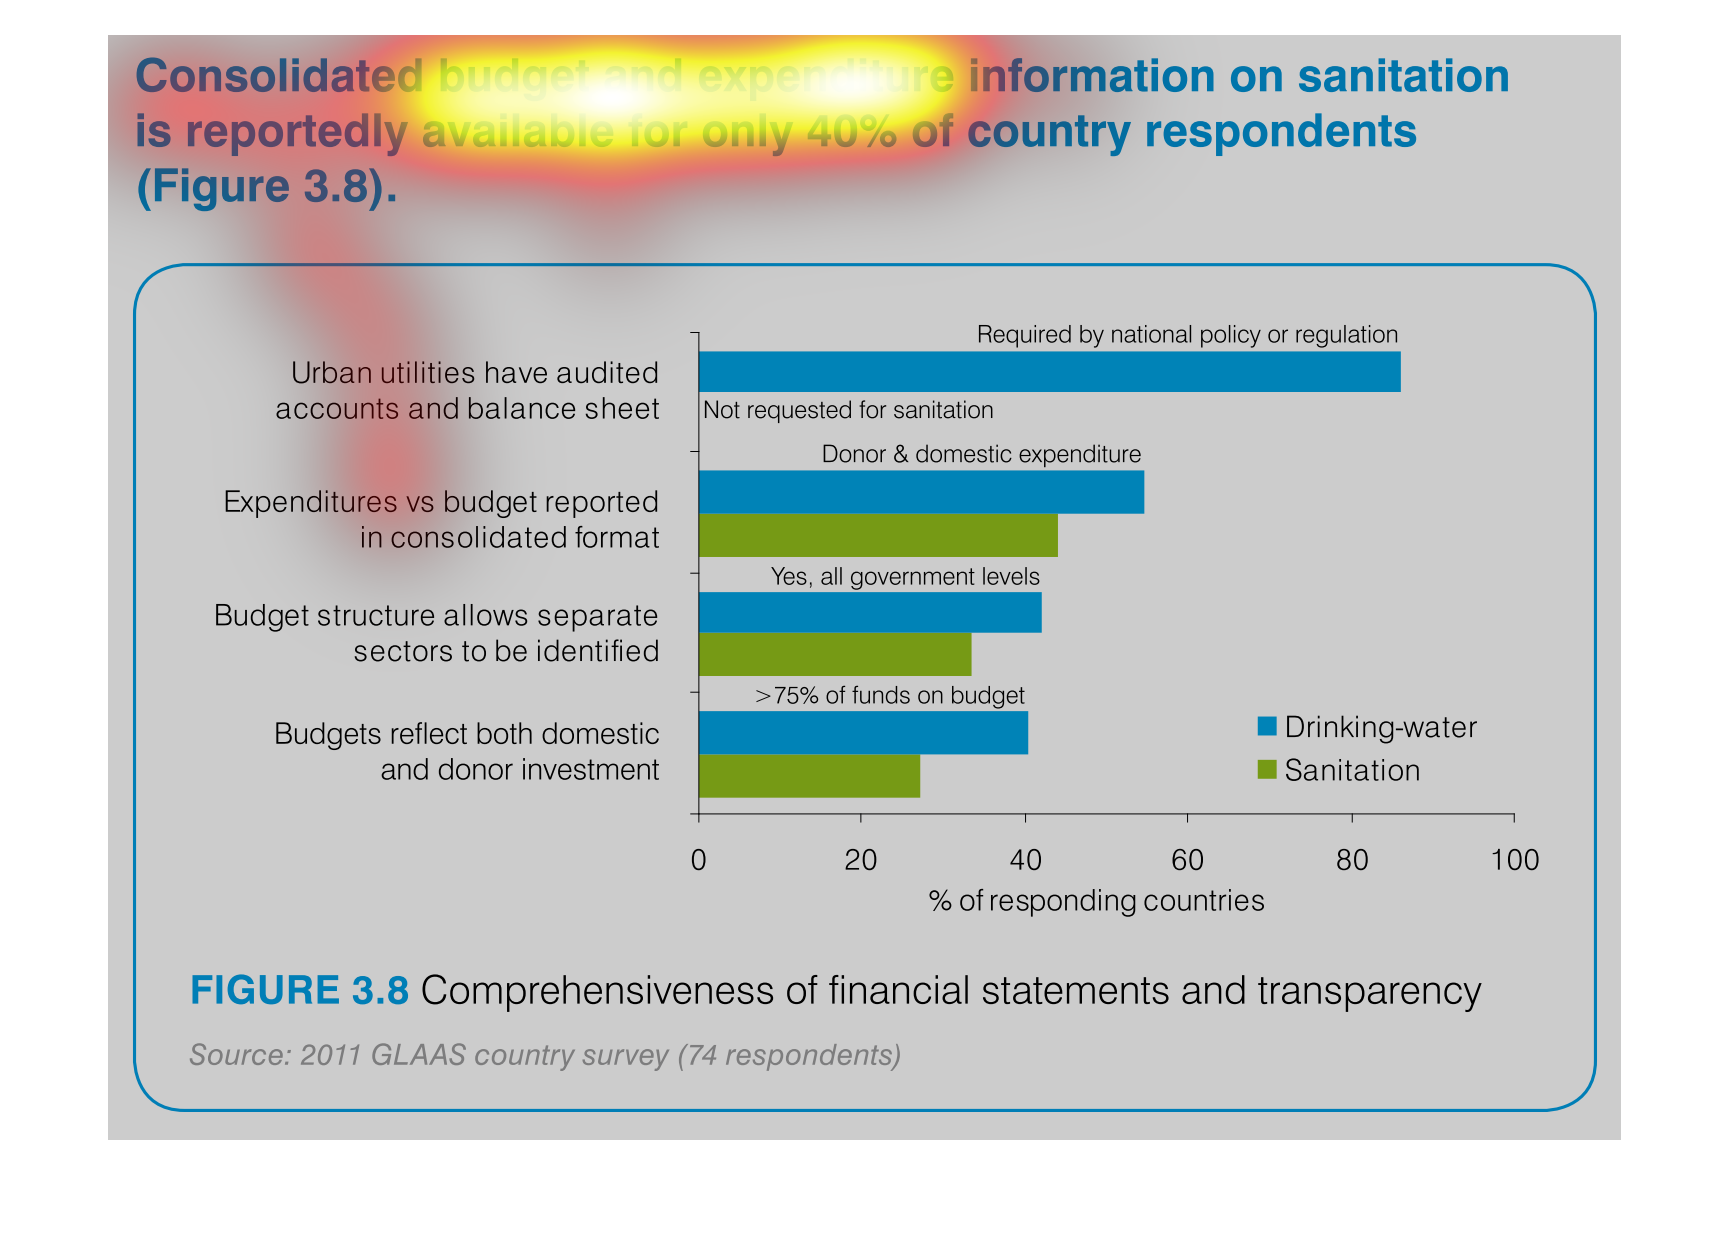
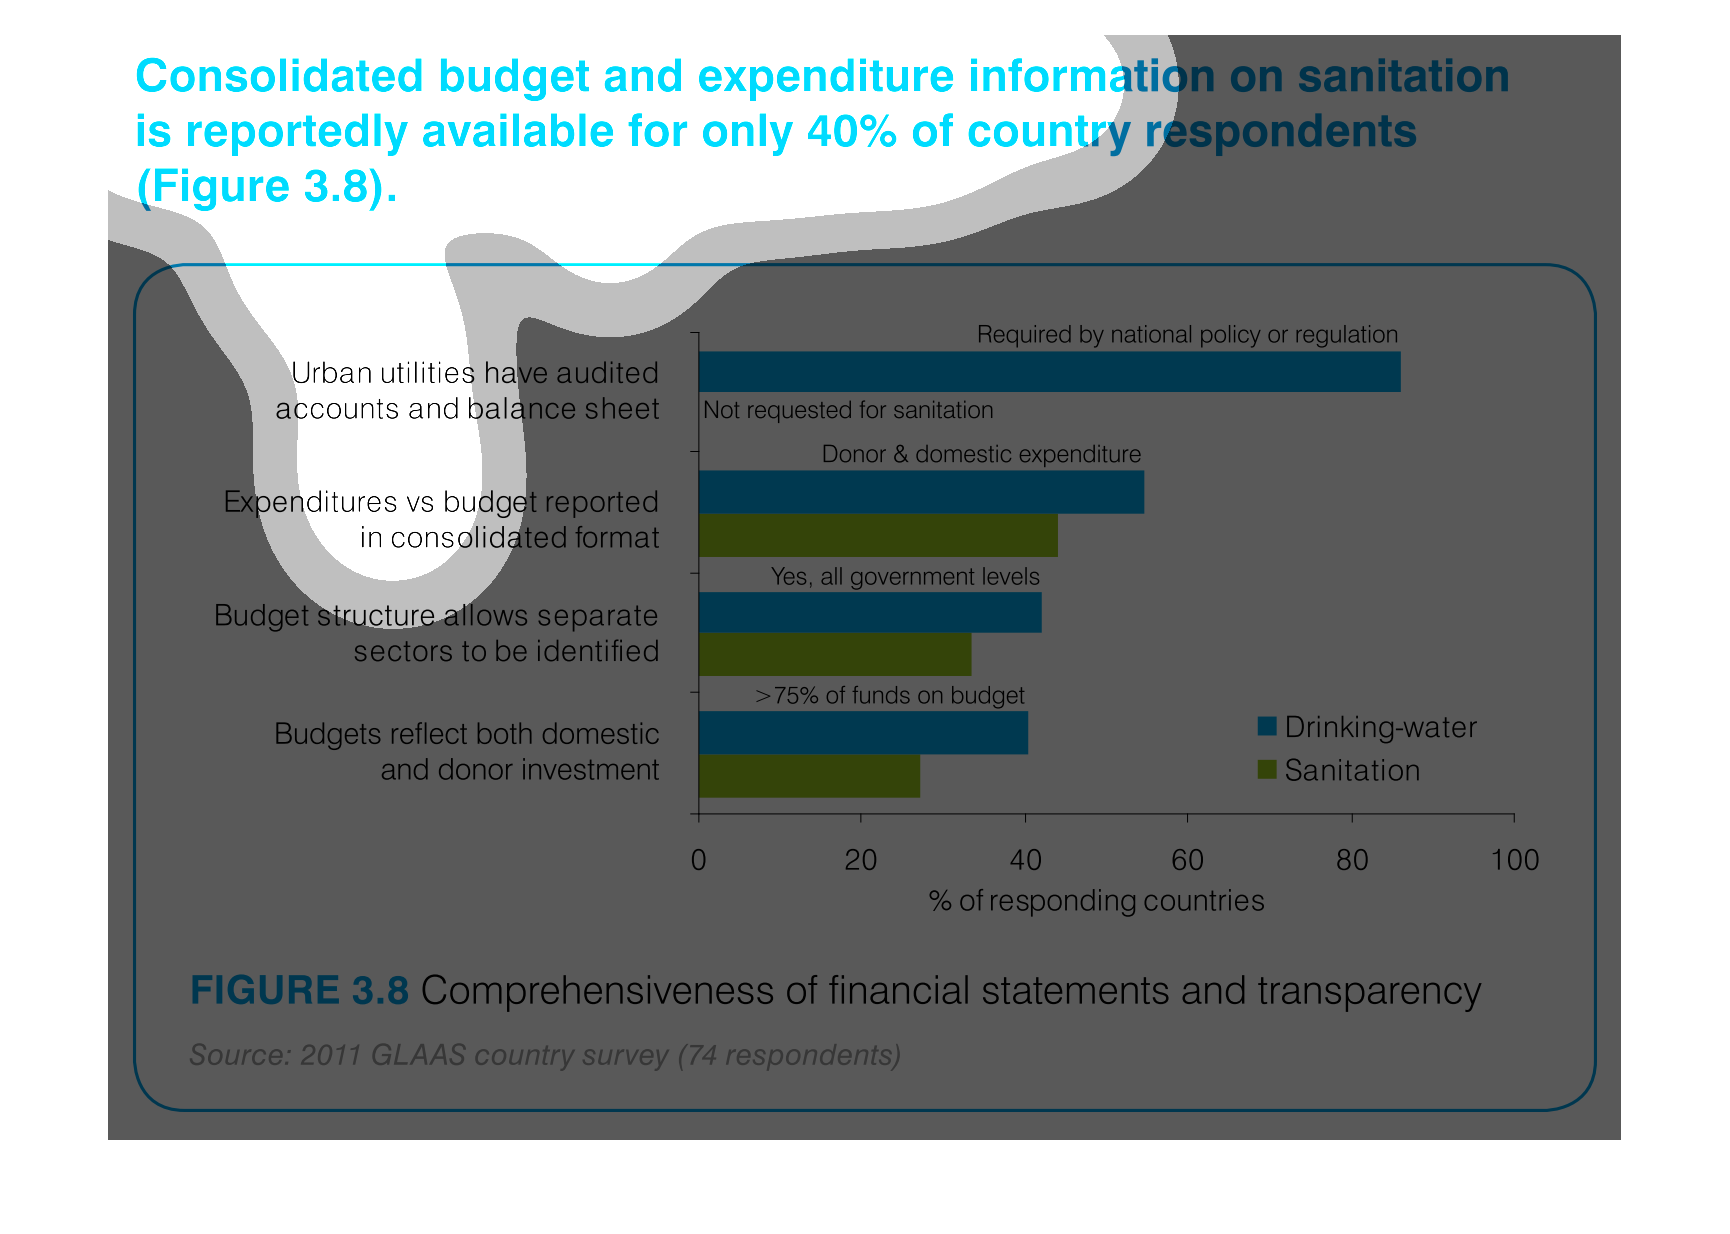
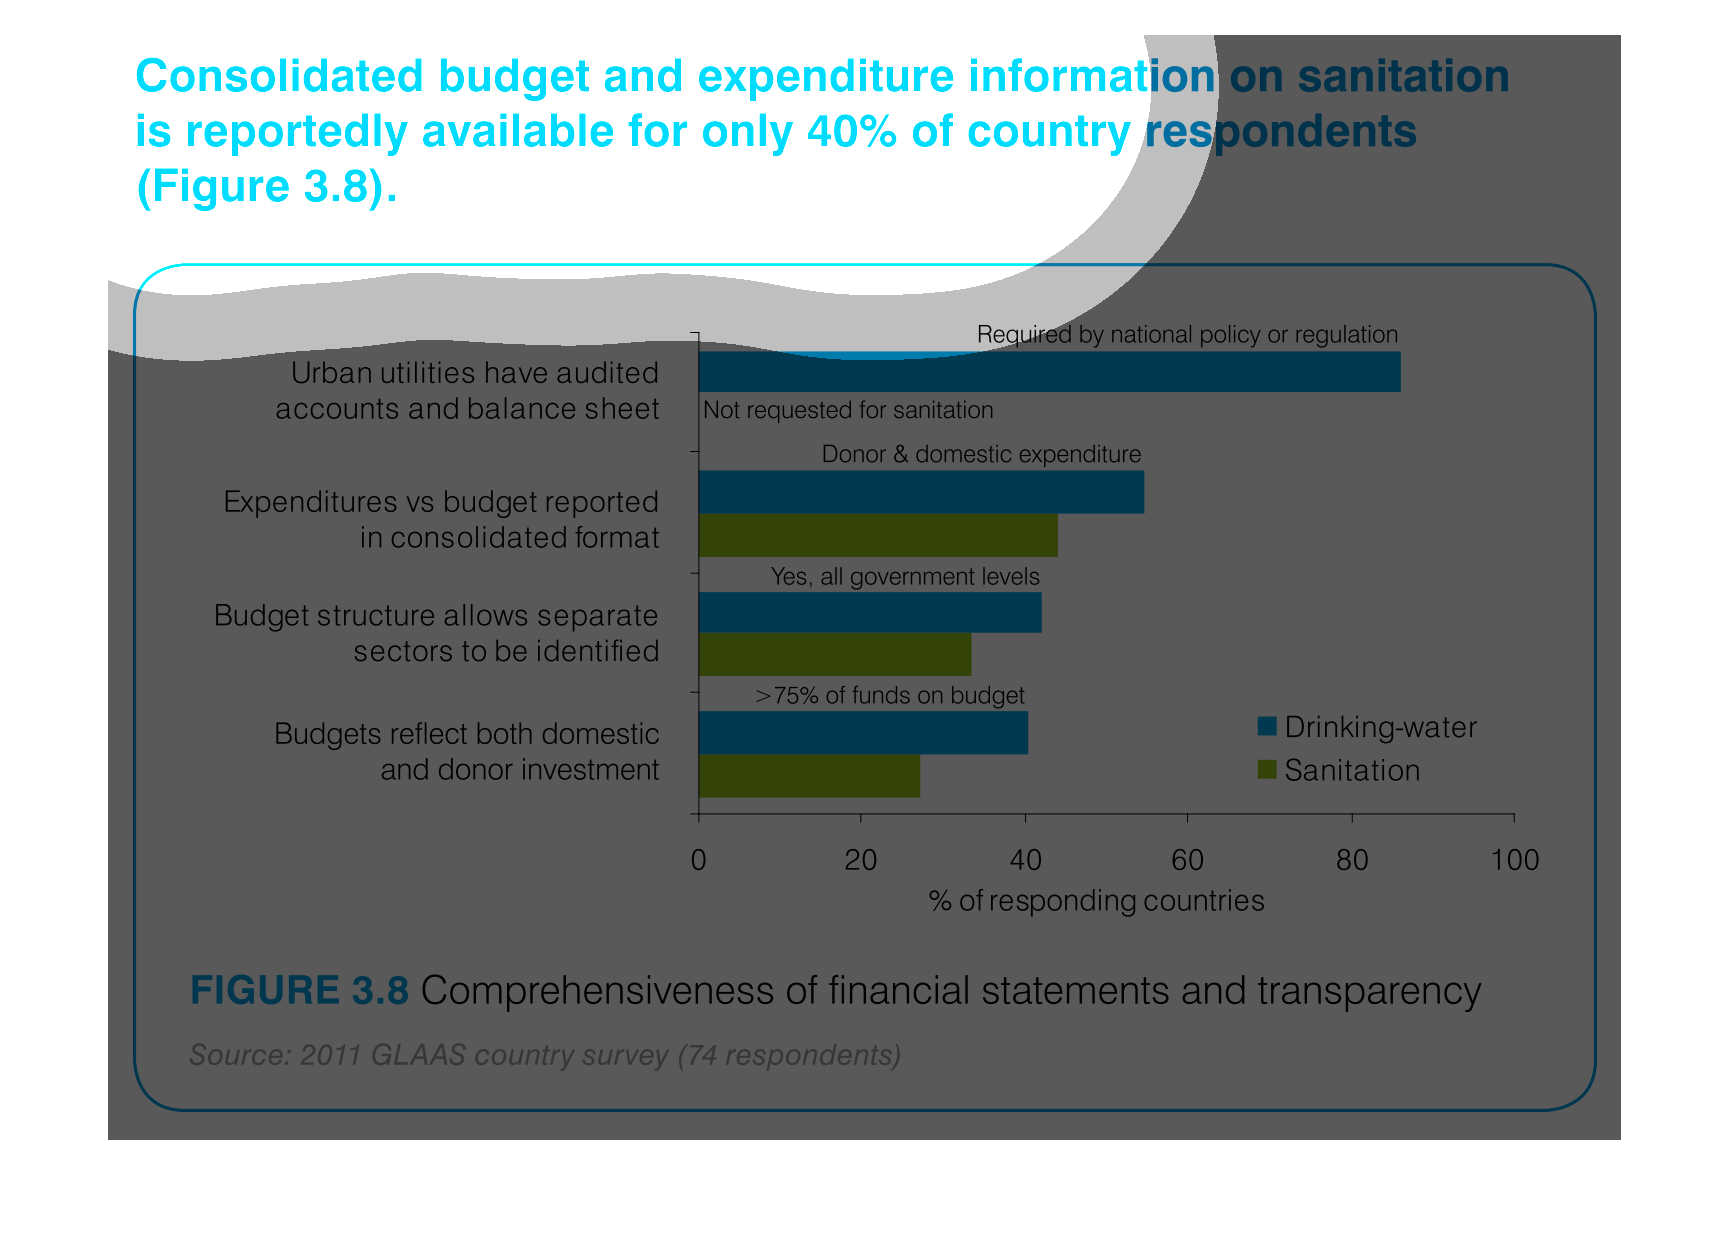
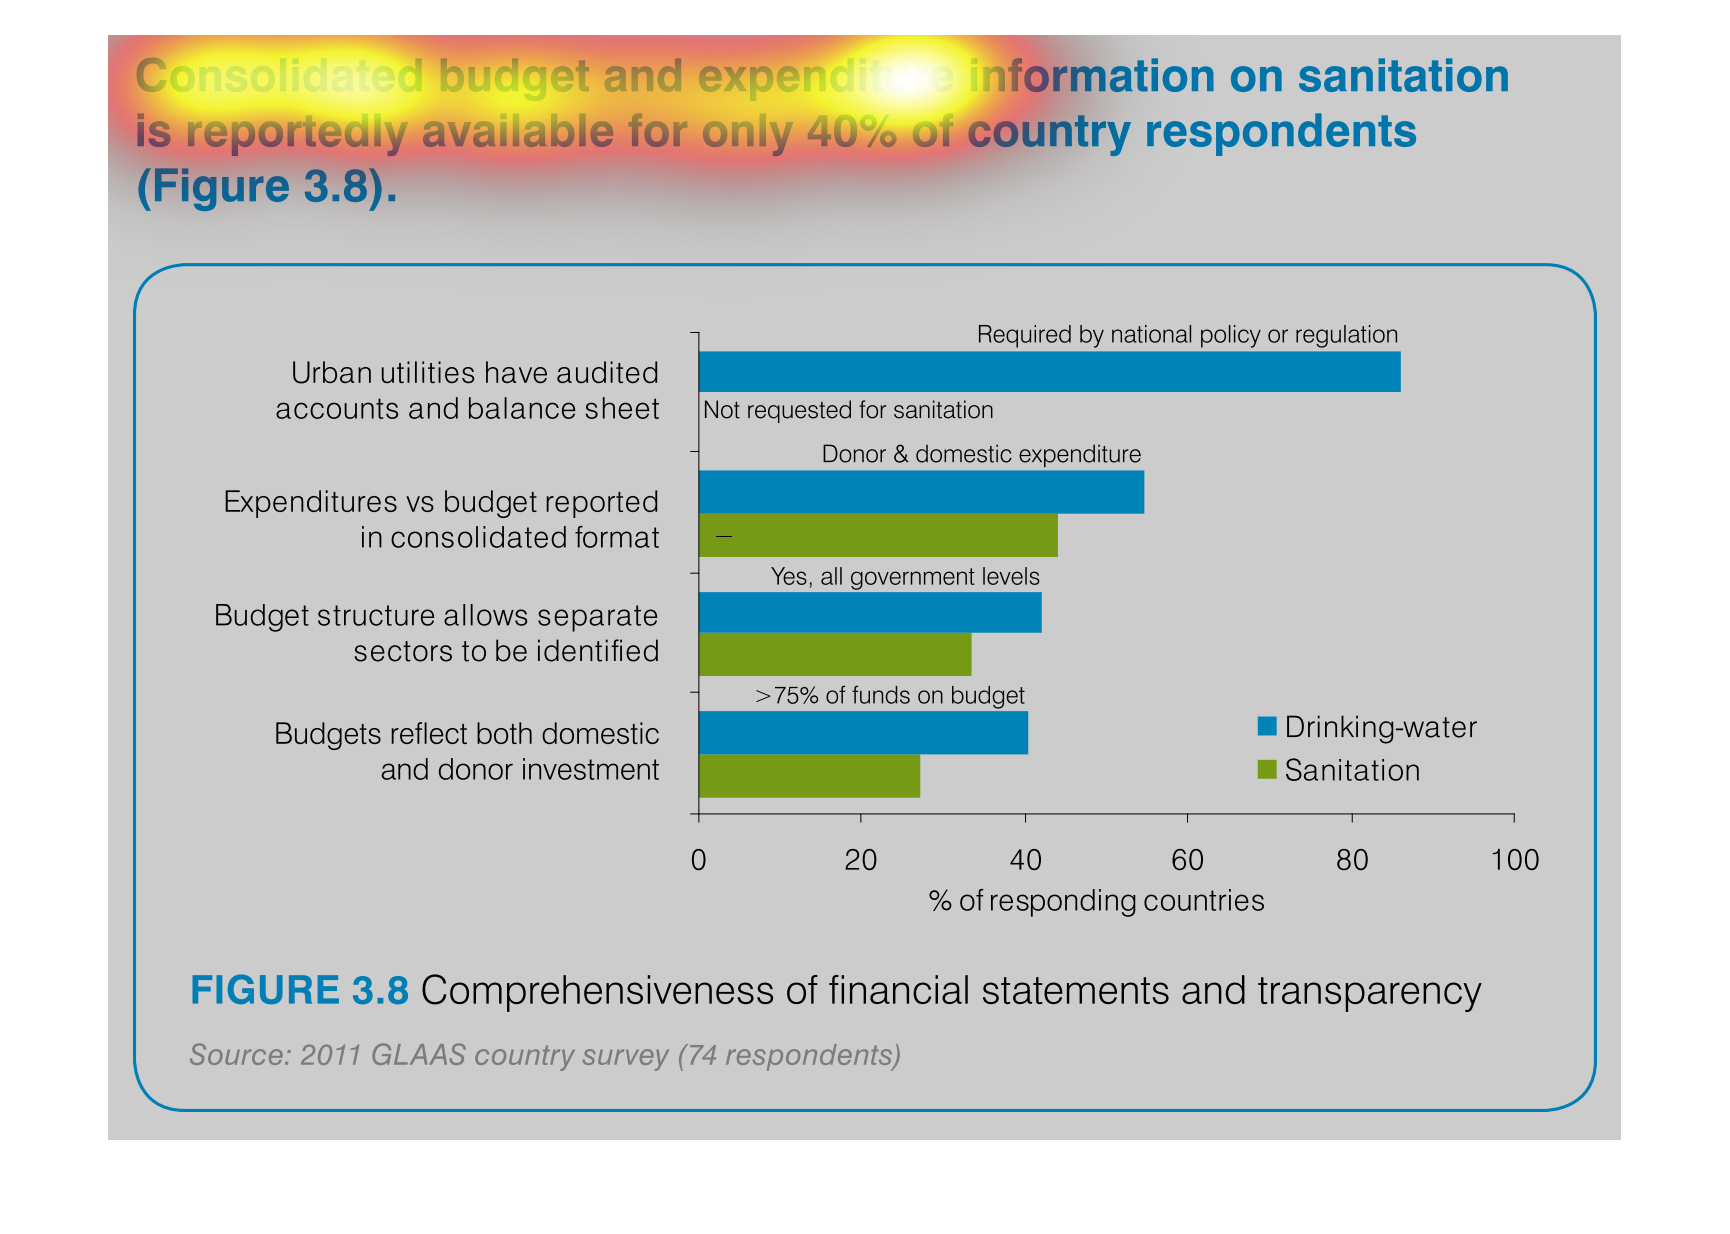
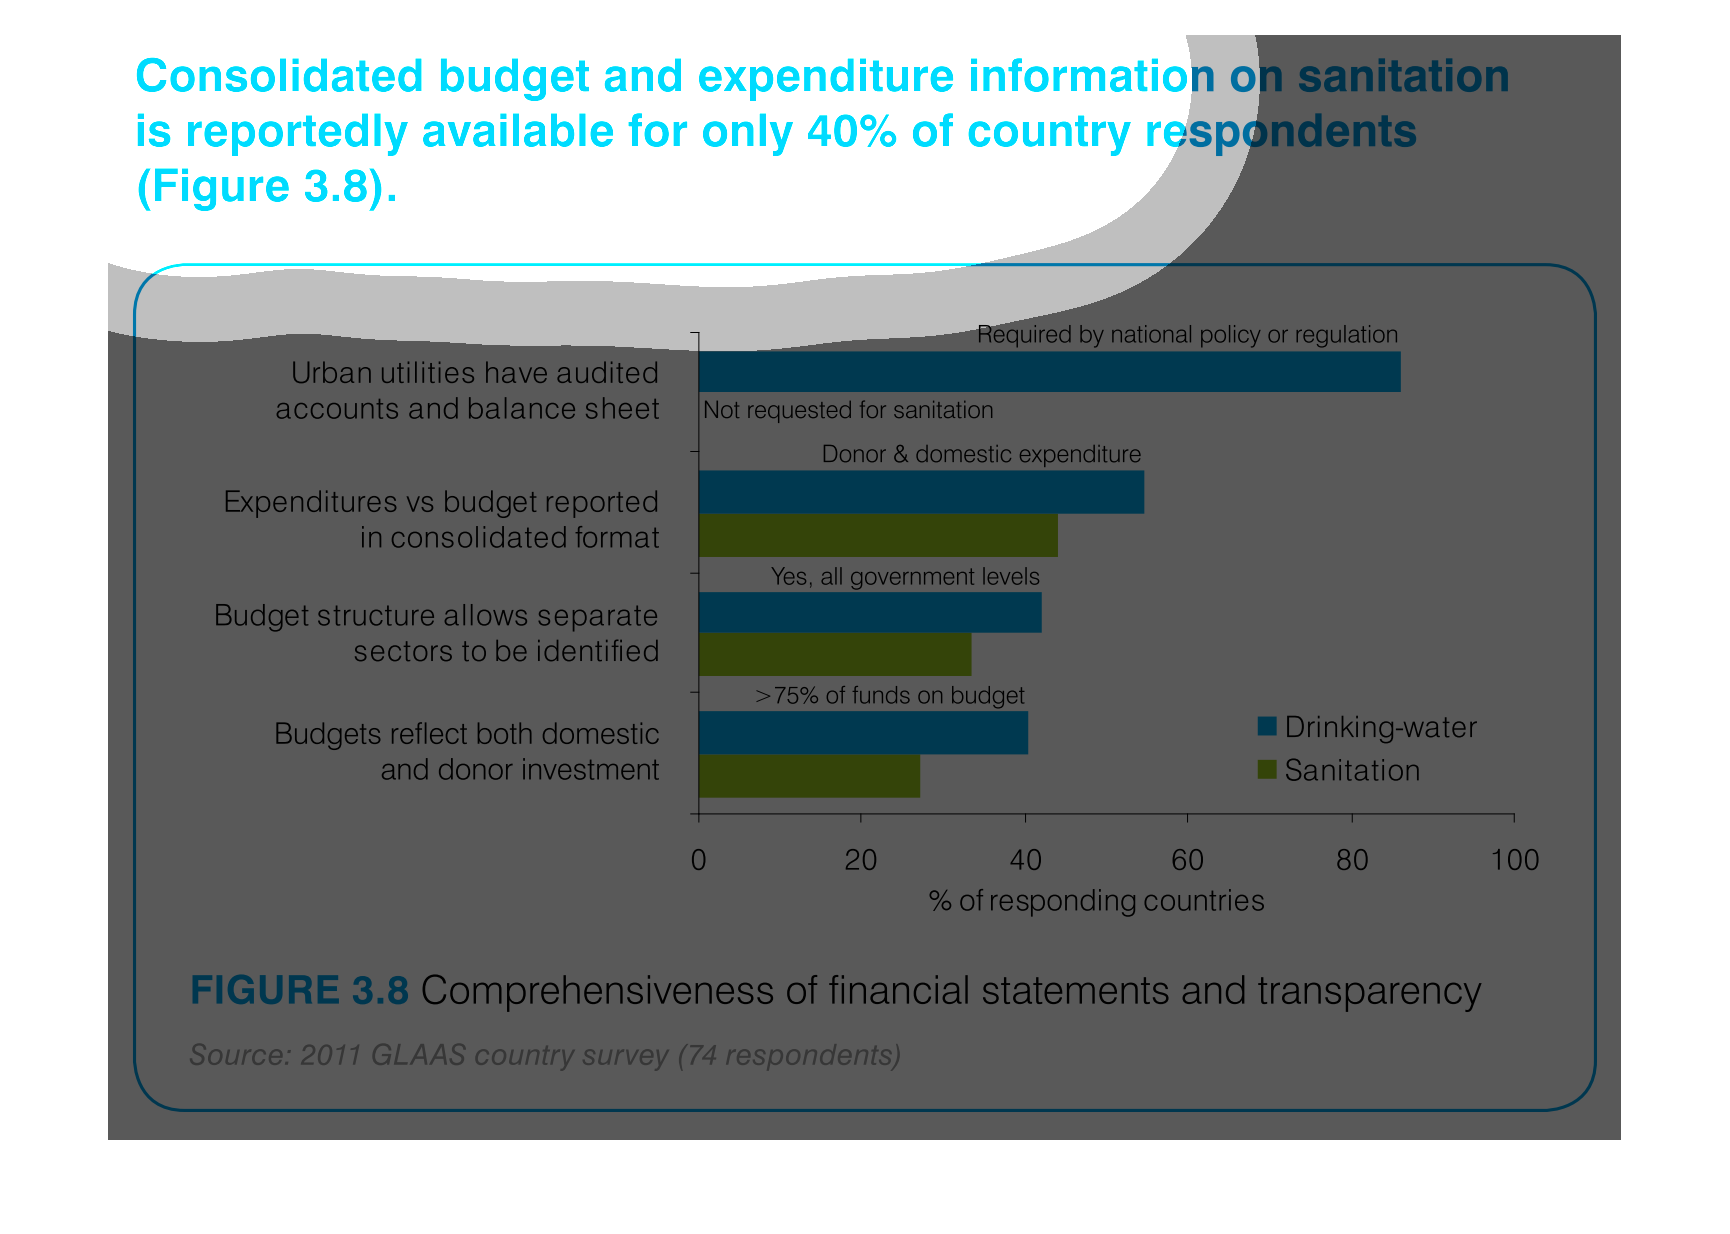
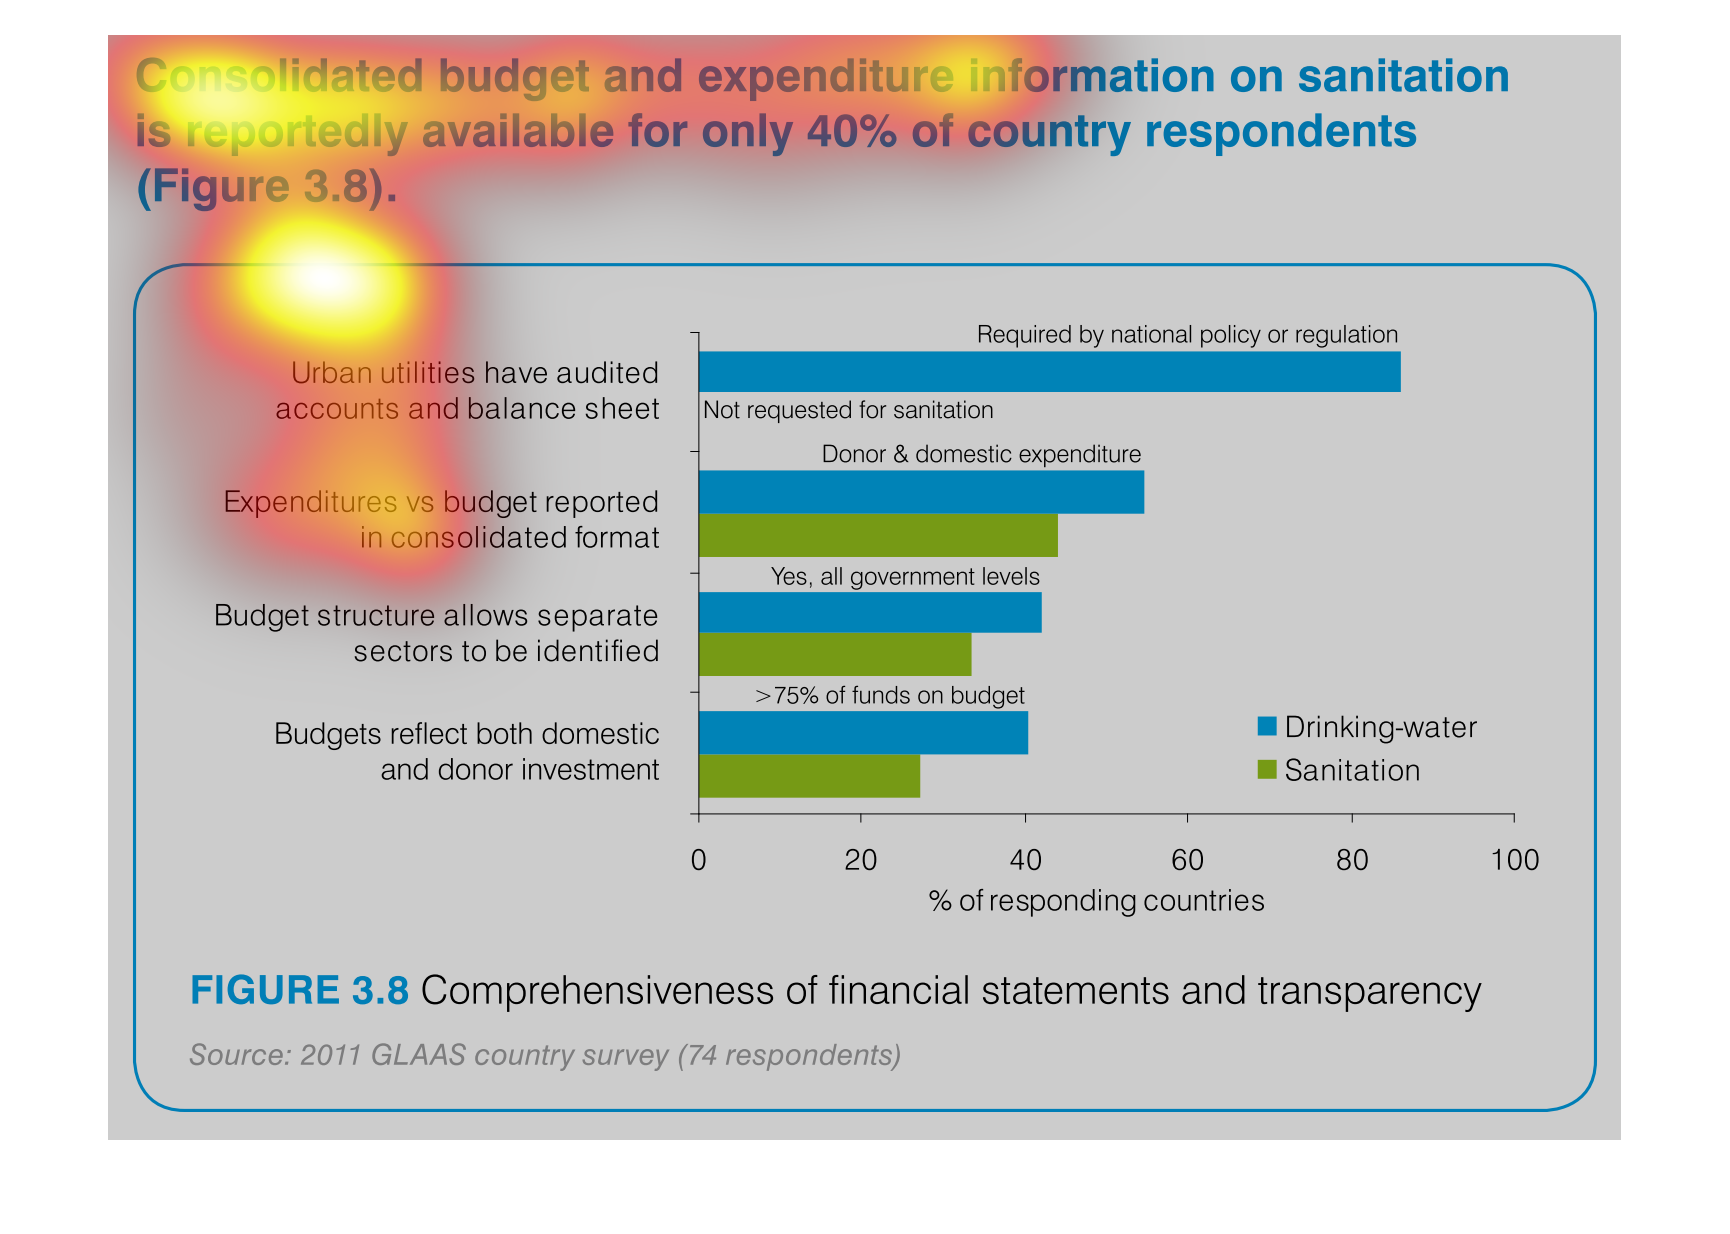
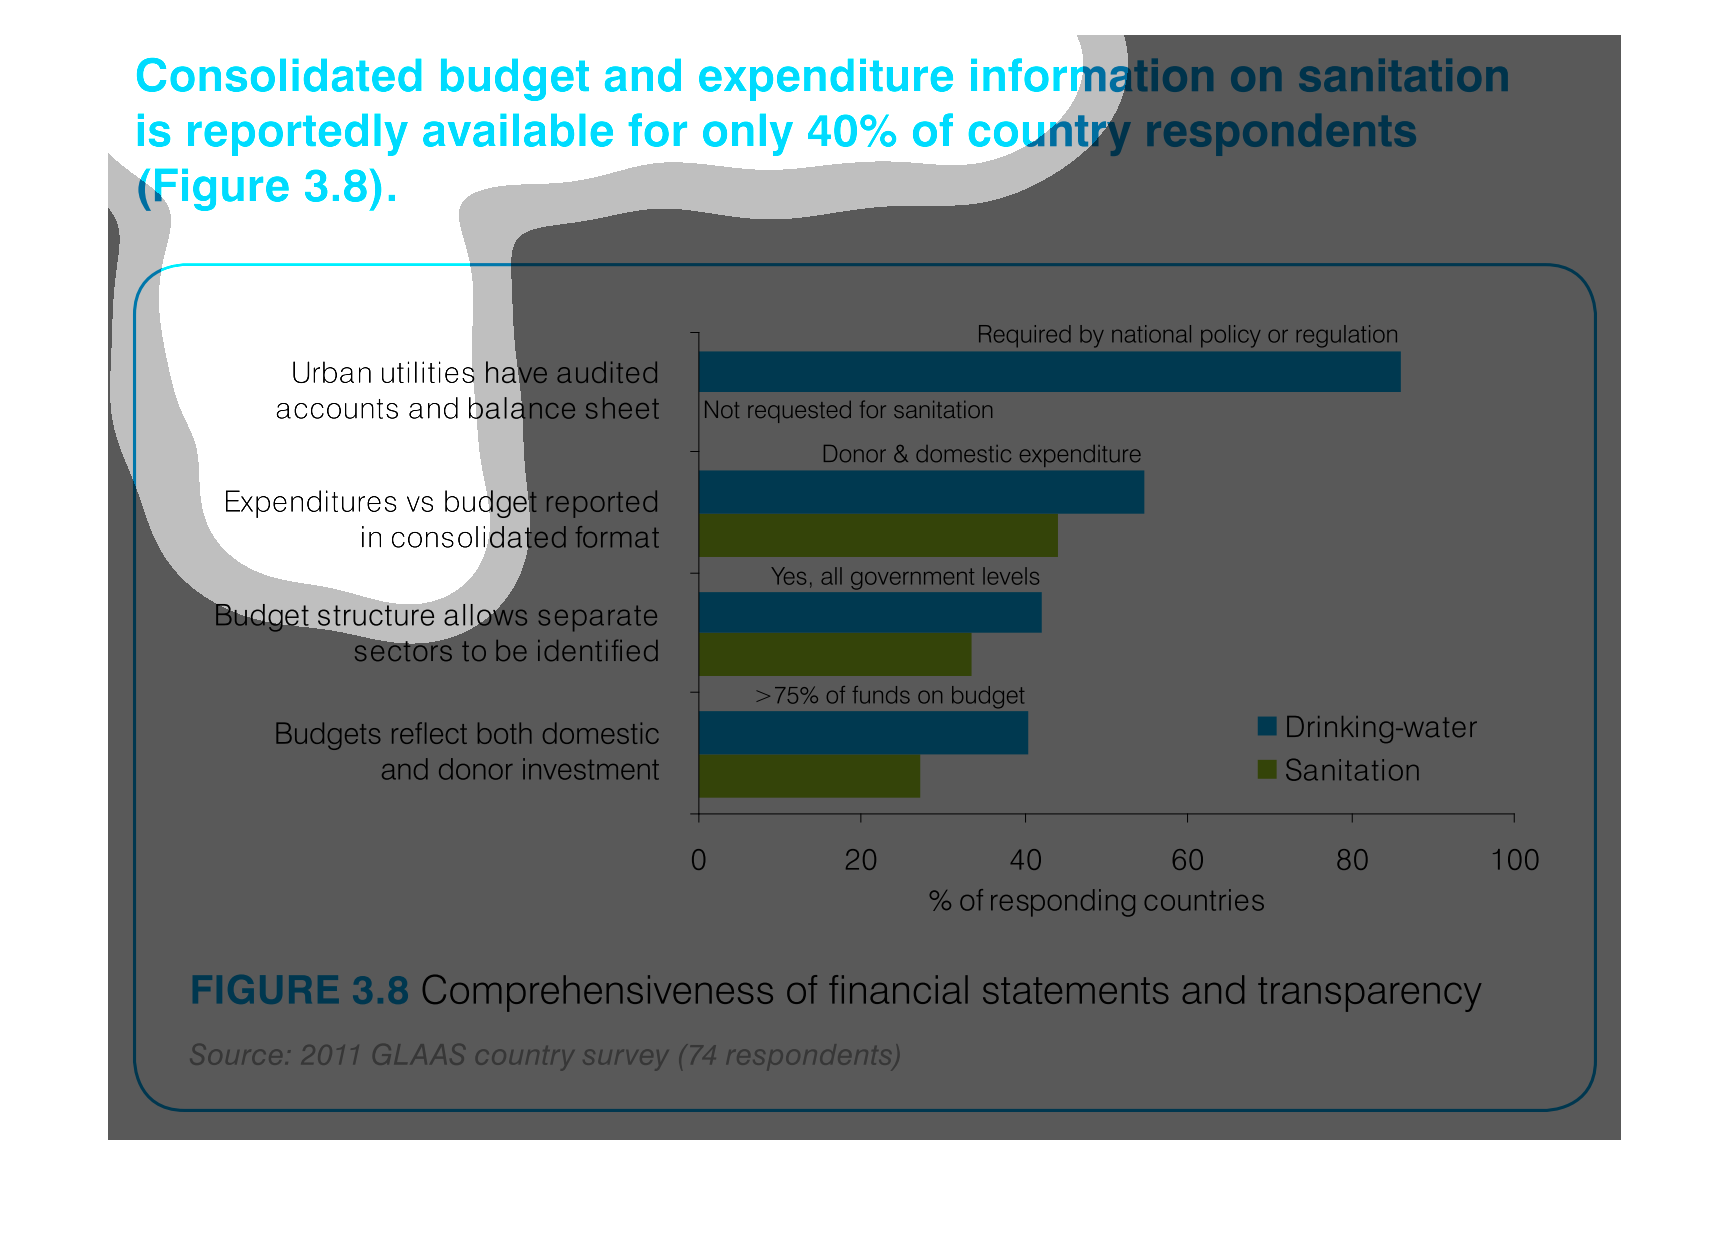
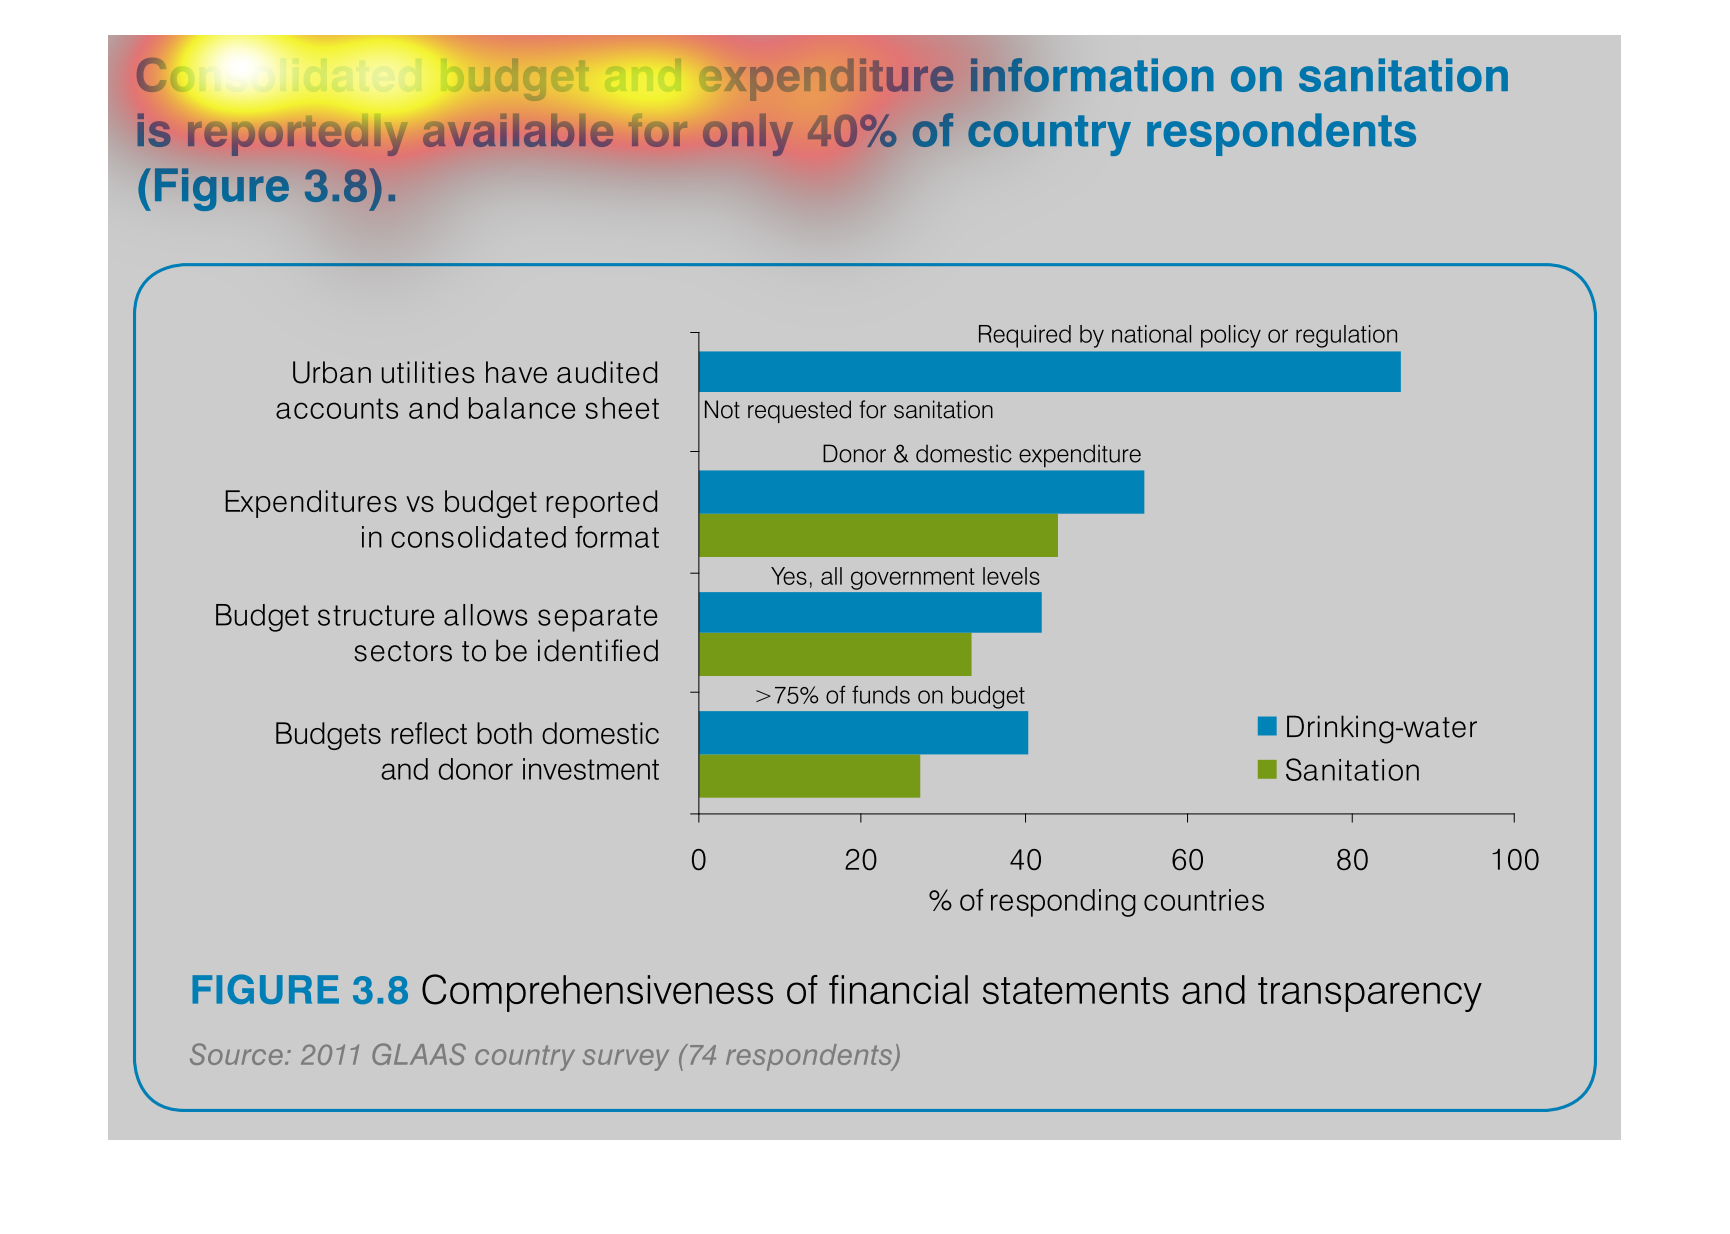
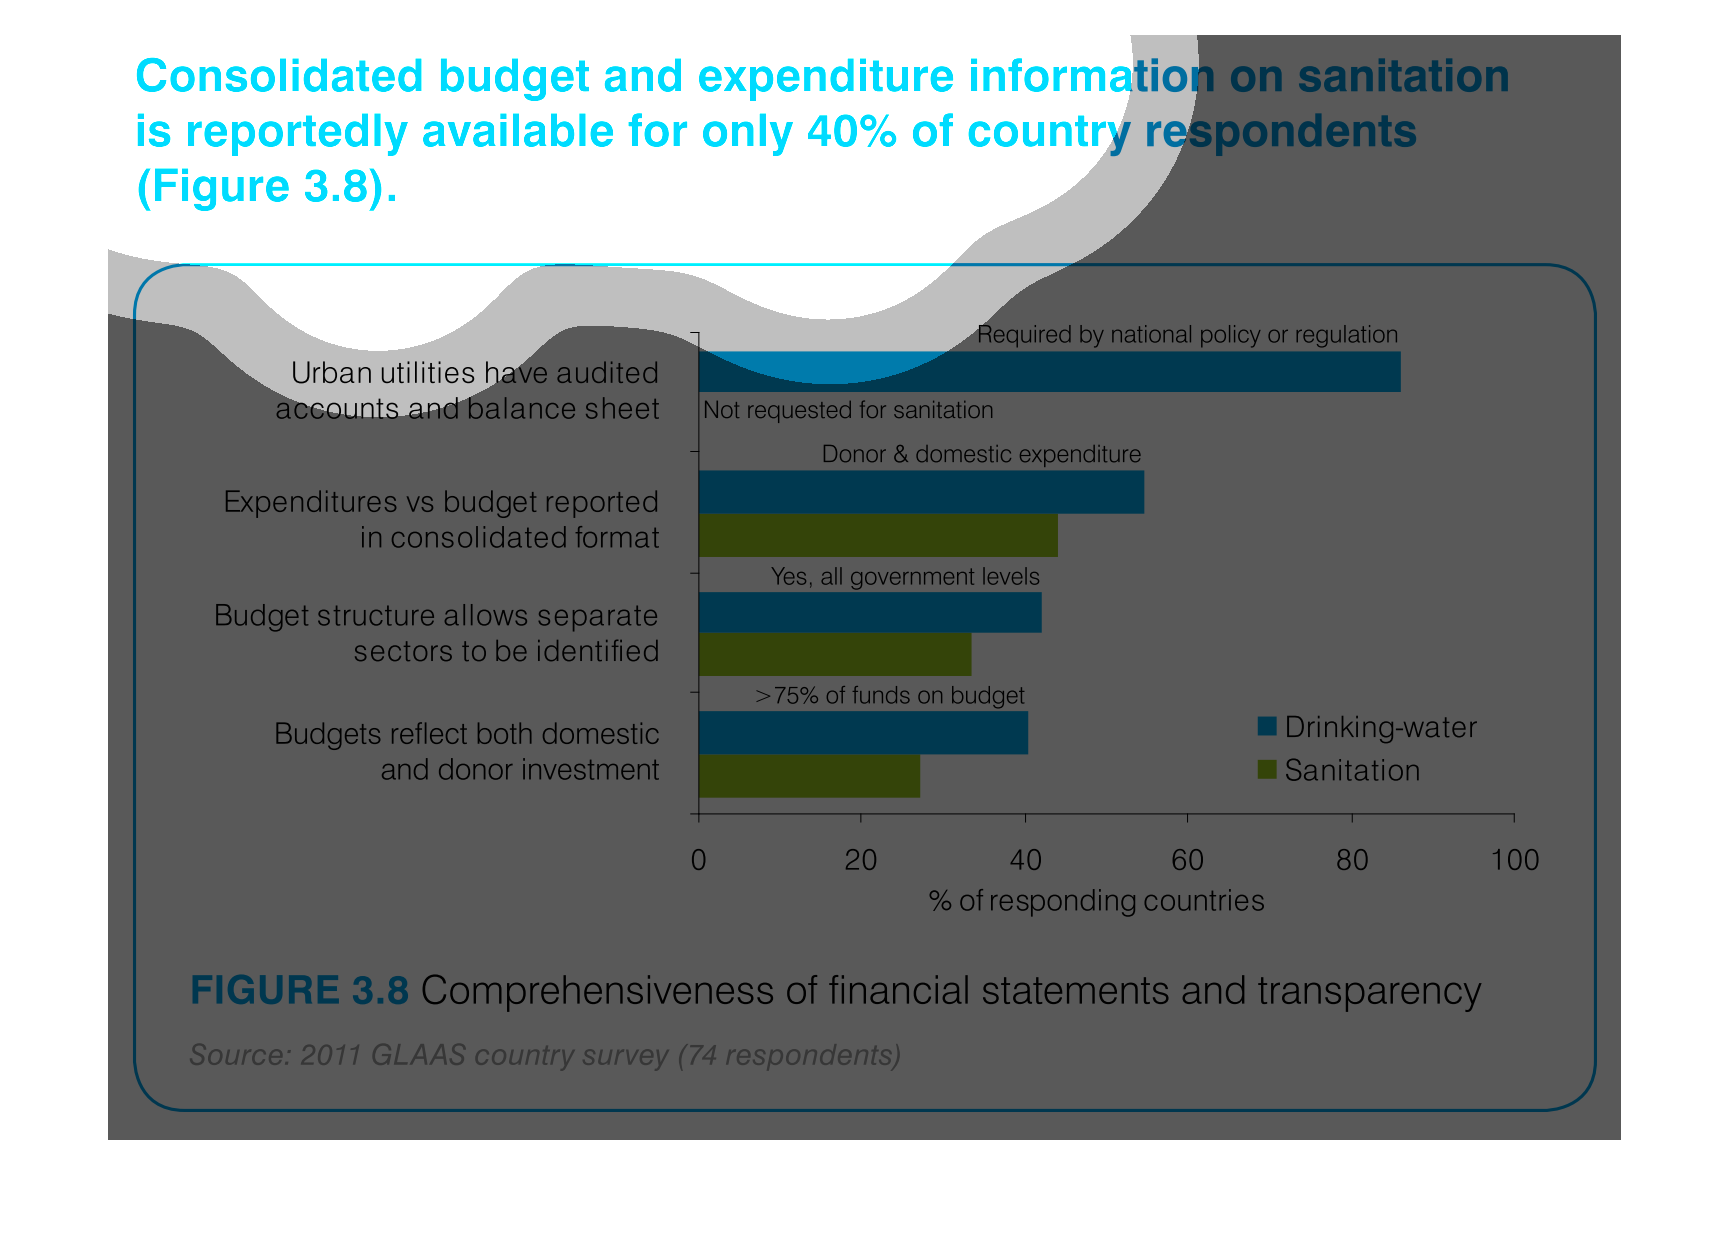
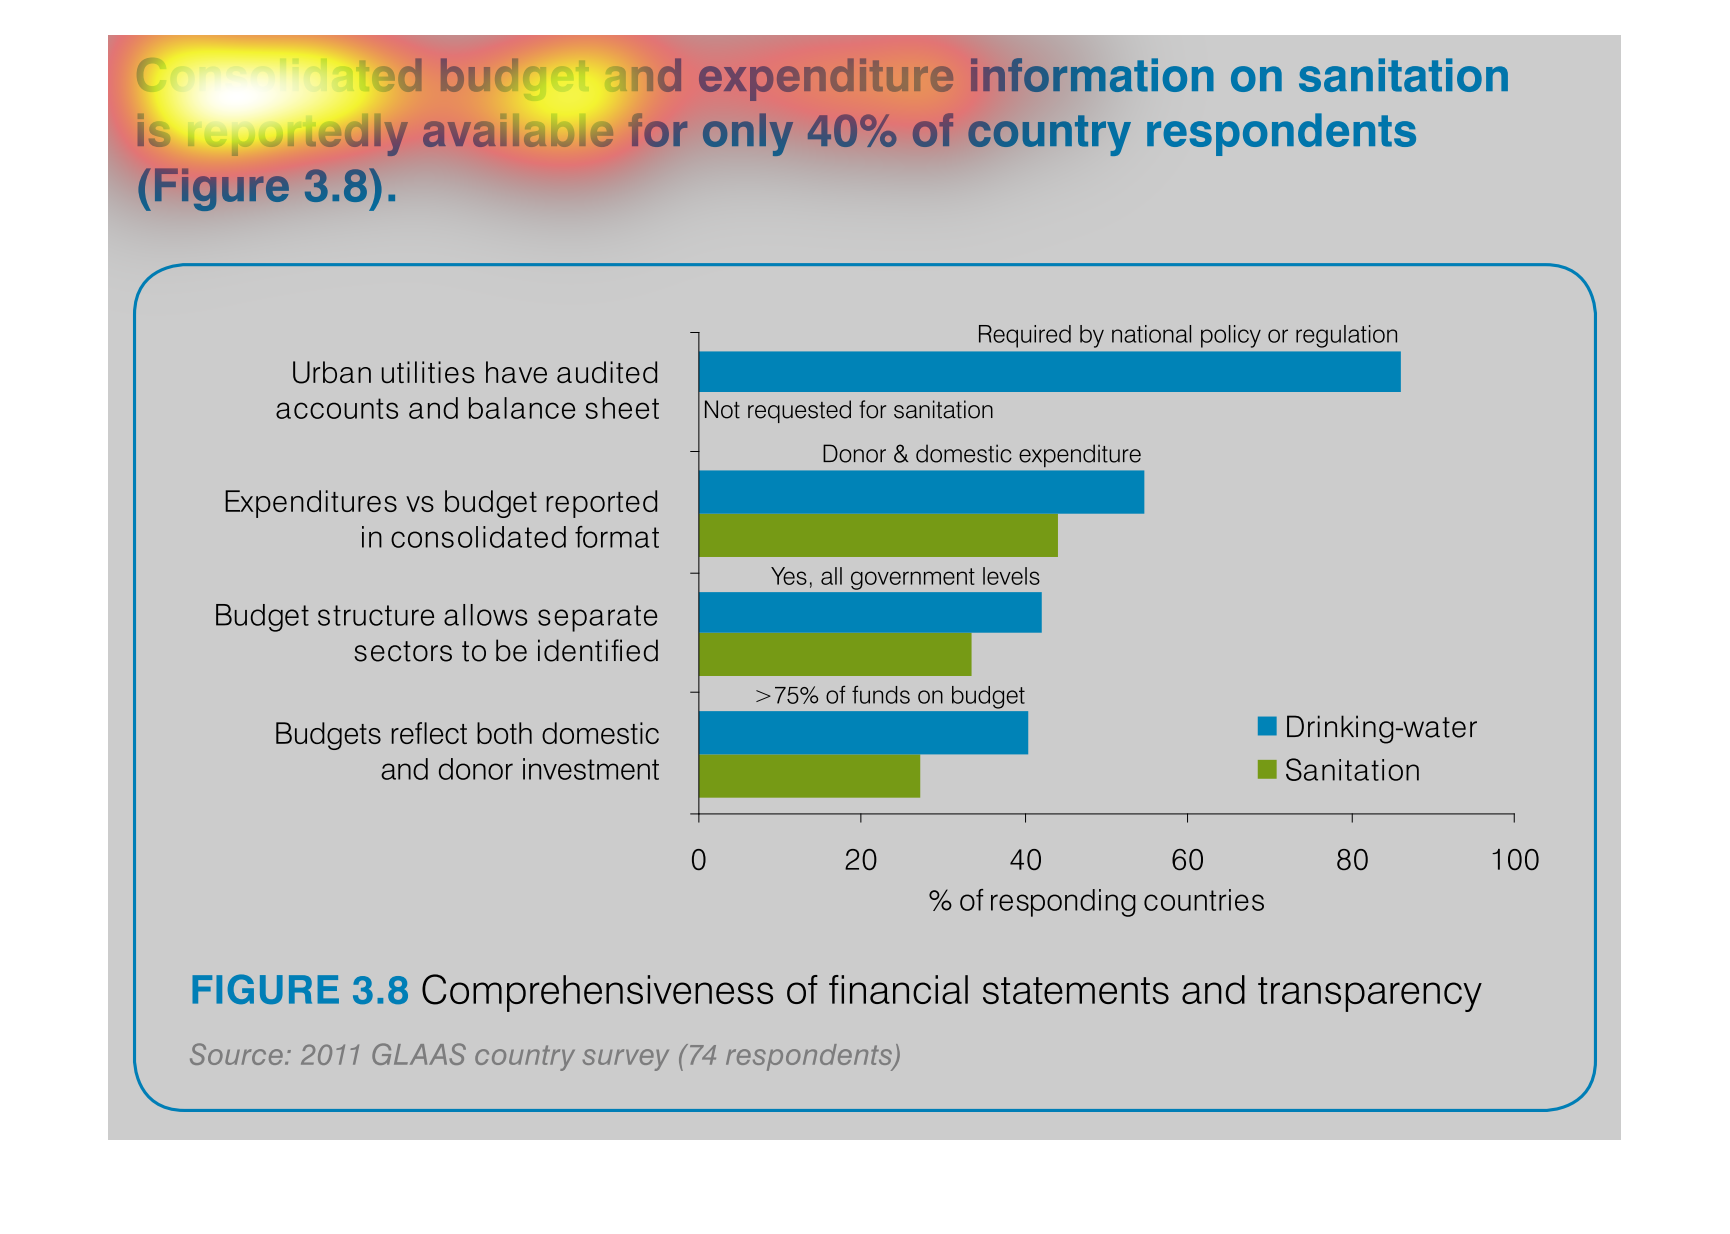
This is a series of graphs depicting consolidated budget and expenditure information on sanitation
is reportedly available for only 40% of country respondents.
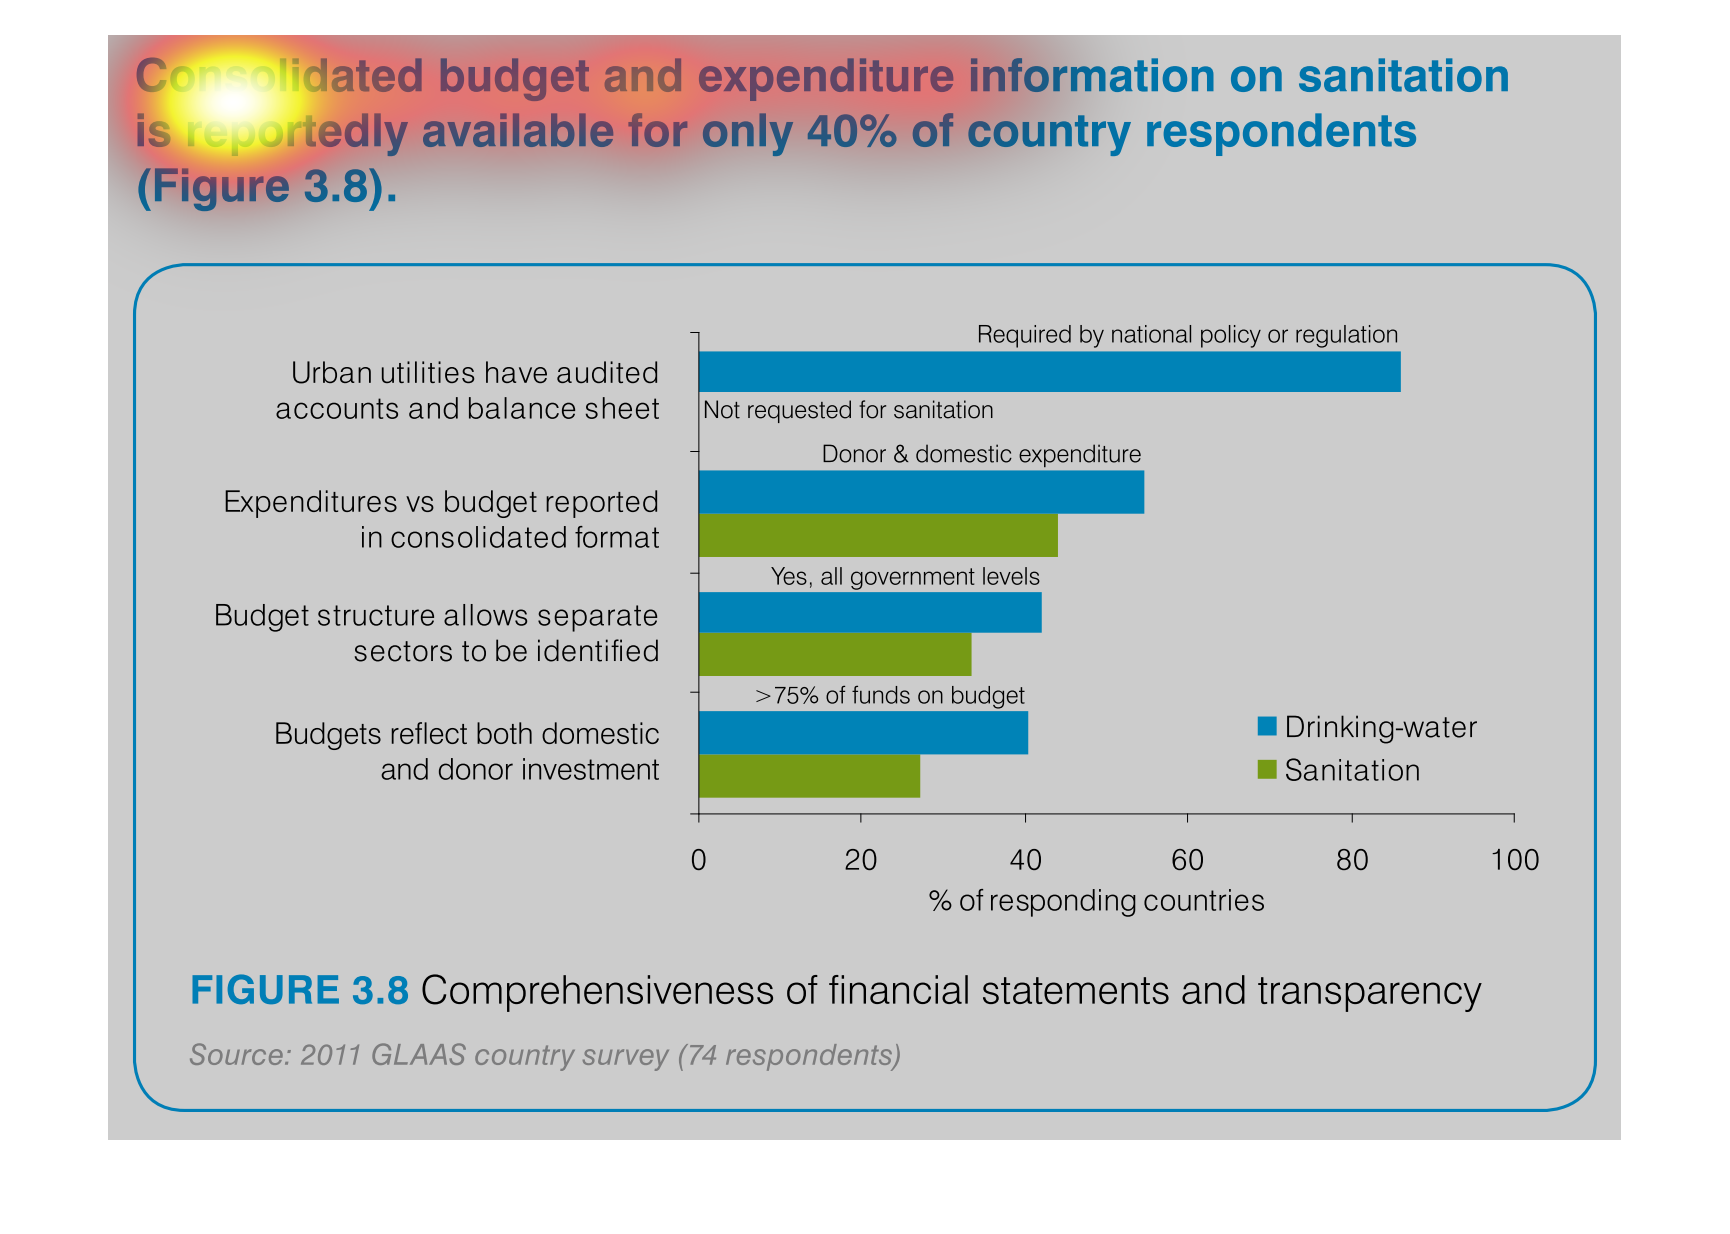
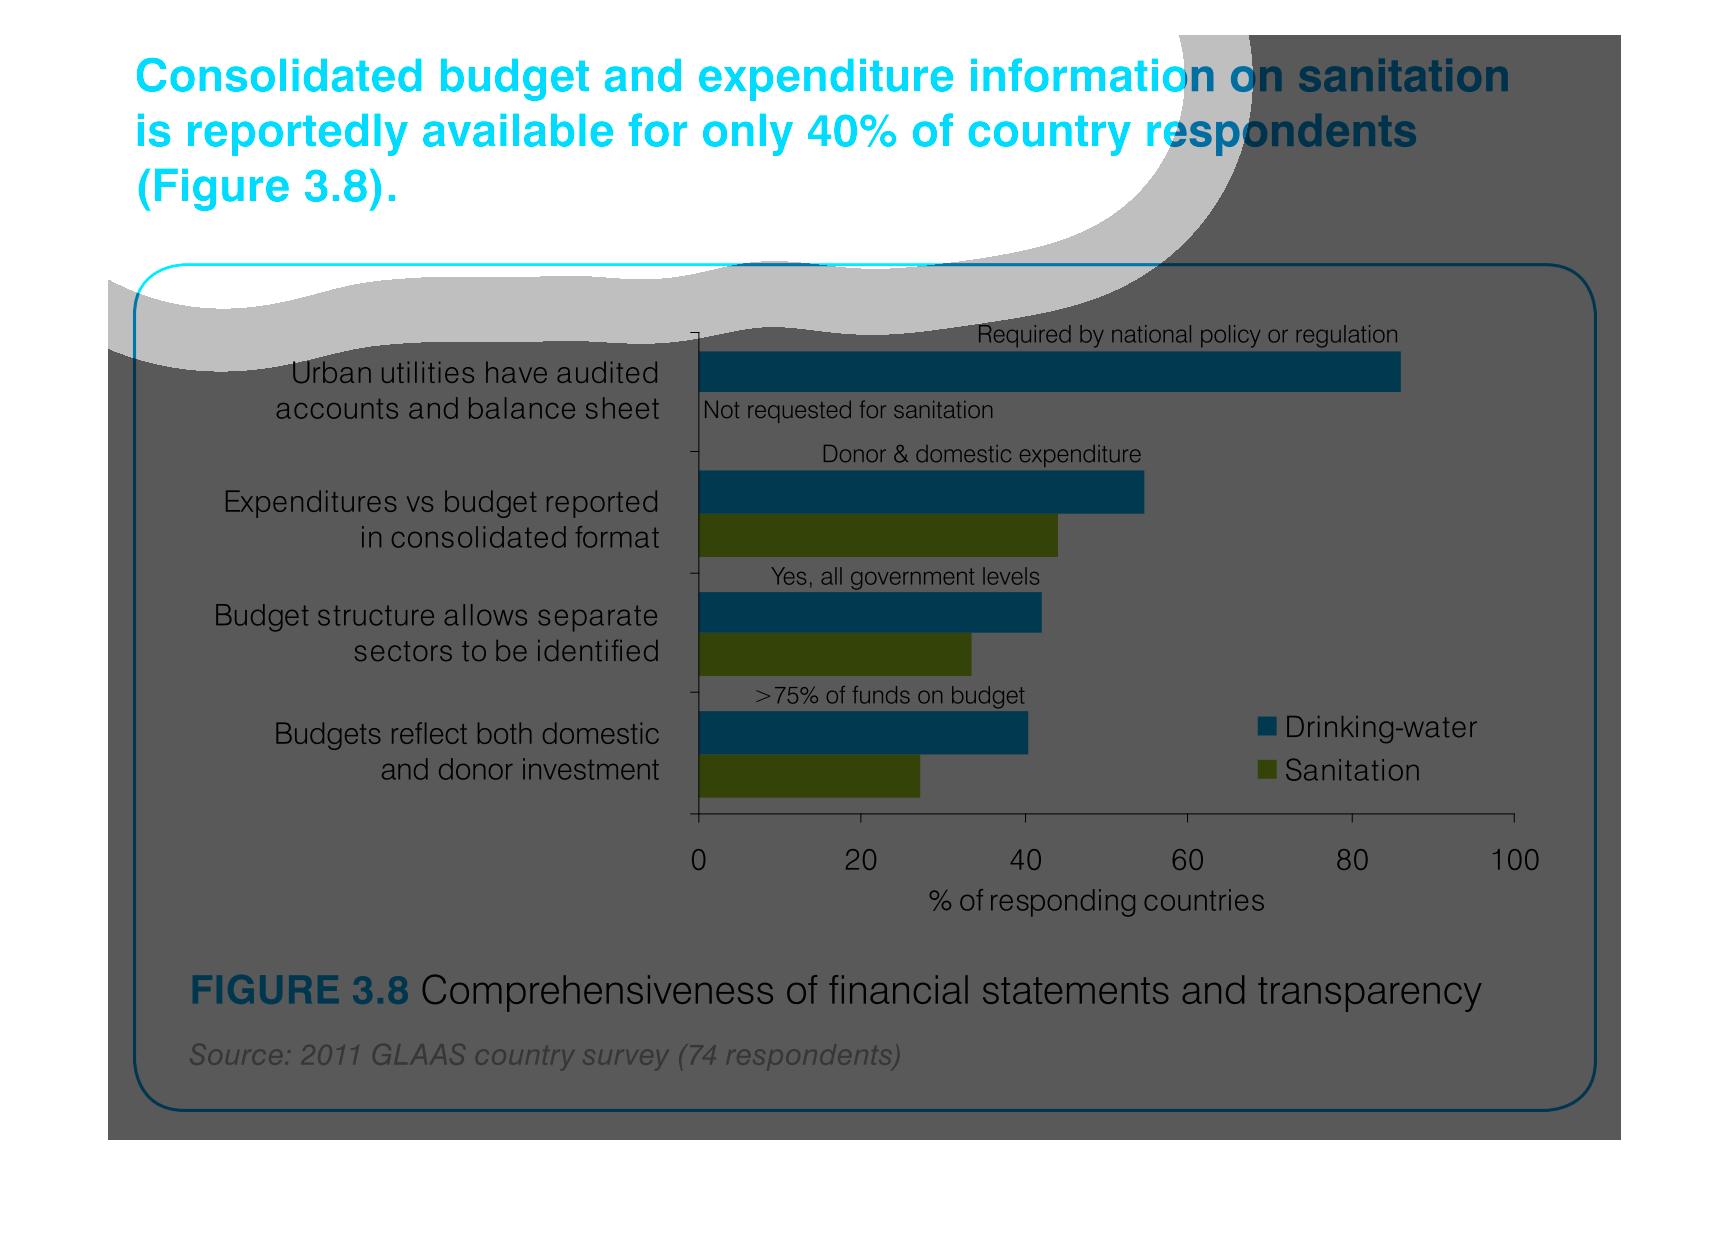
This chart describes consolidated budget and expenditure information on sanitation is reportedly
available for only forty percent of country respondents.
This chart describes consolidated budget and expenditure information on sanitation is reportedly
available for only forty percent of country respondents.
The chart describes how sanitation budget and expenditures are detailed for forty percent
of the countries that were contacted. the chart goes into detail with regards to the account
and balance sheet.
This shows the consolidated budget and expenditure information on sanitation is reportedly
available for only forty percent of the countries that responded.
consolidated budget and expenditure information on sanitation is reportedly available for
only 40% of country respondents figure 3.8. Y axis highlights different financial aspects
in relation to drinking water and sanitation
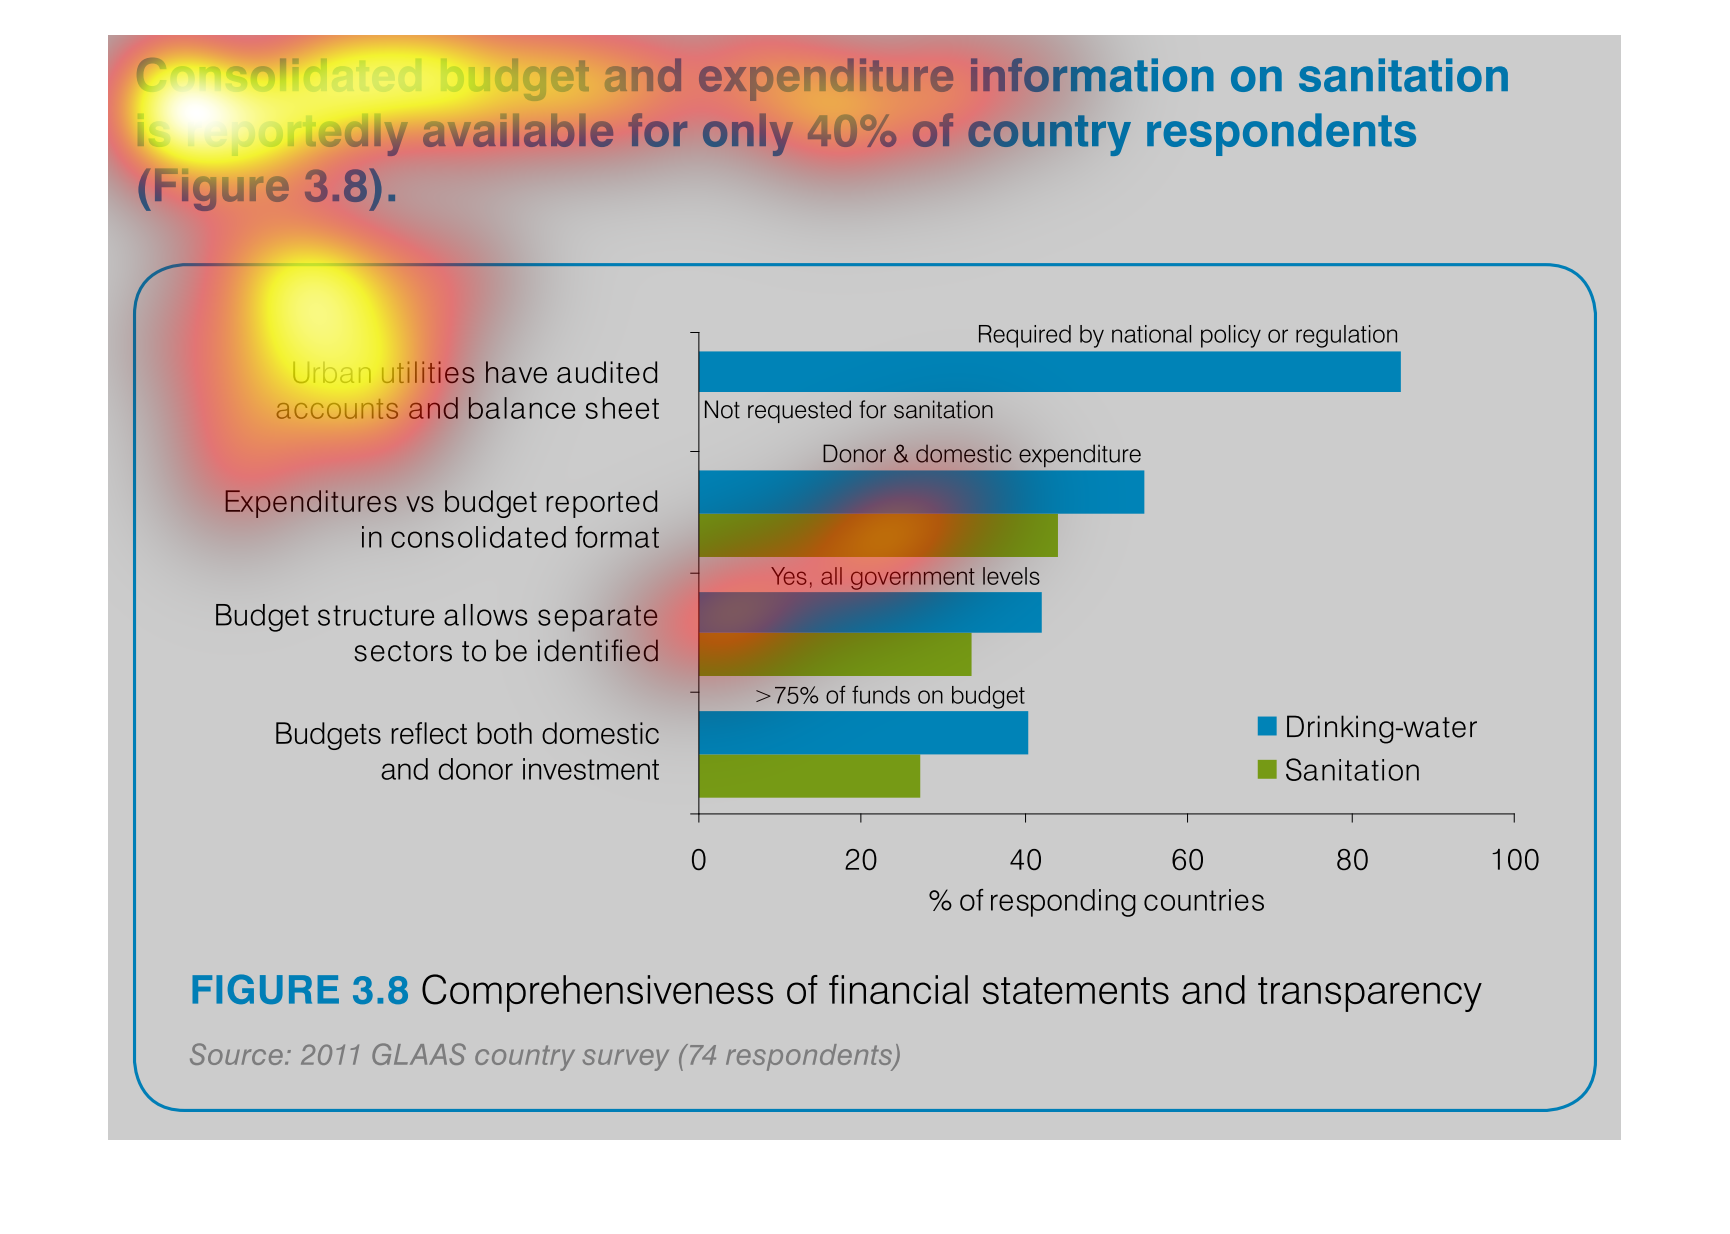
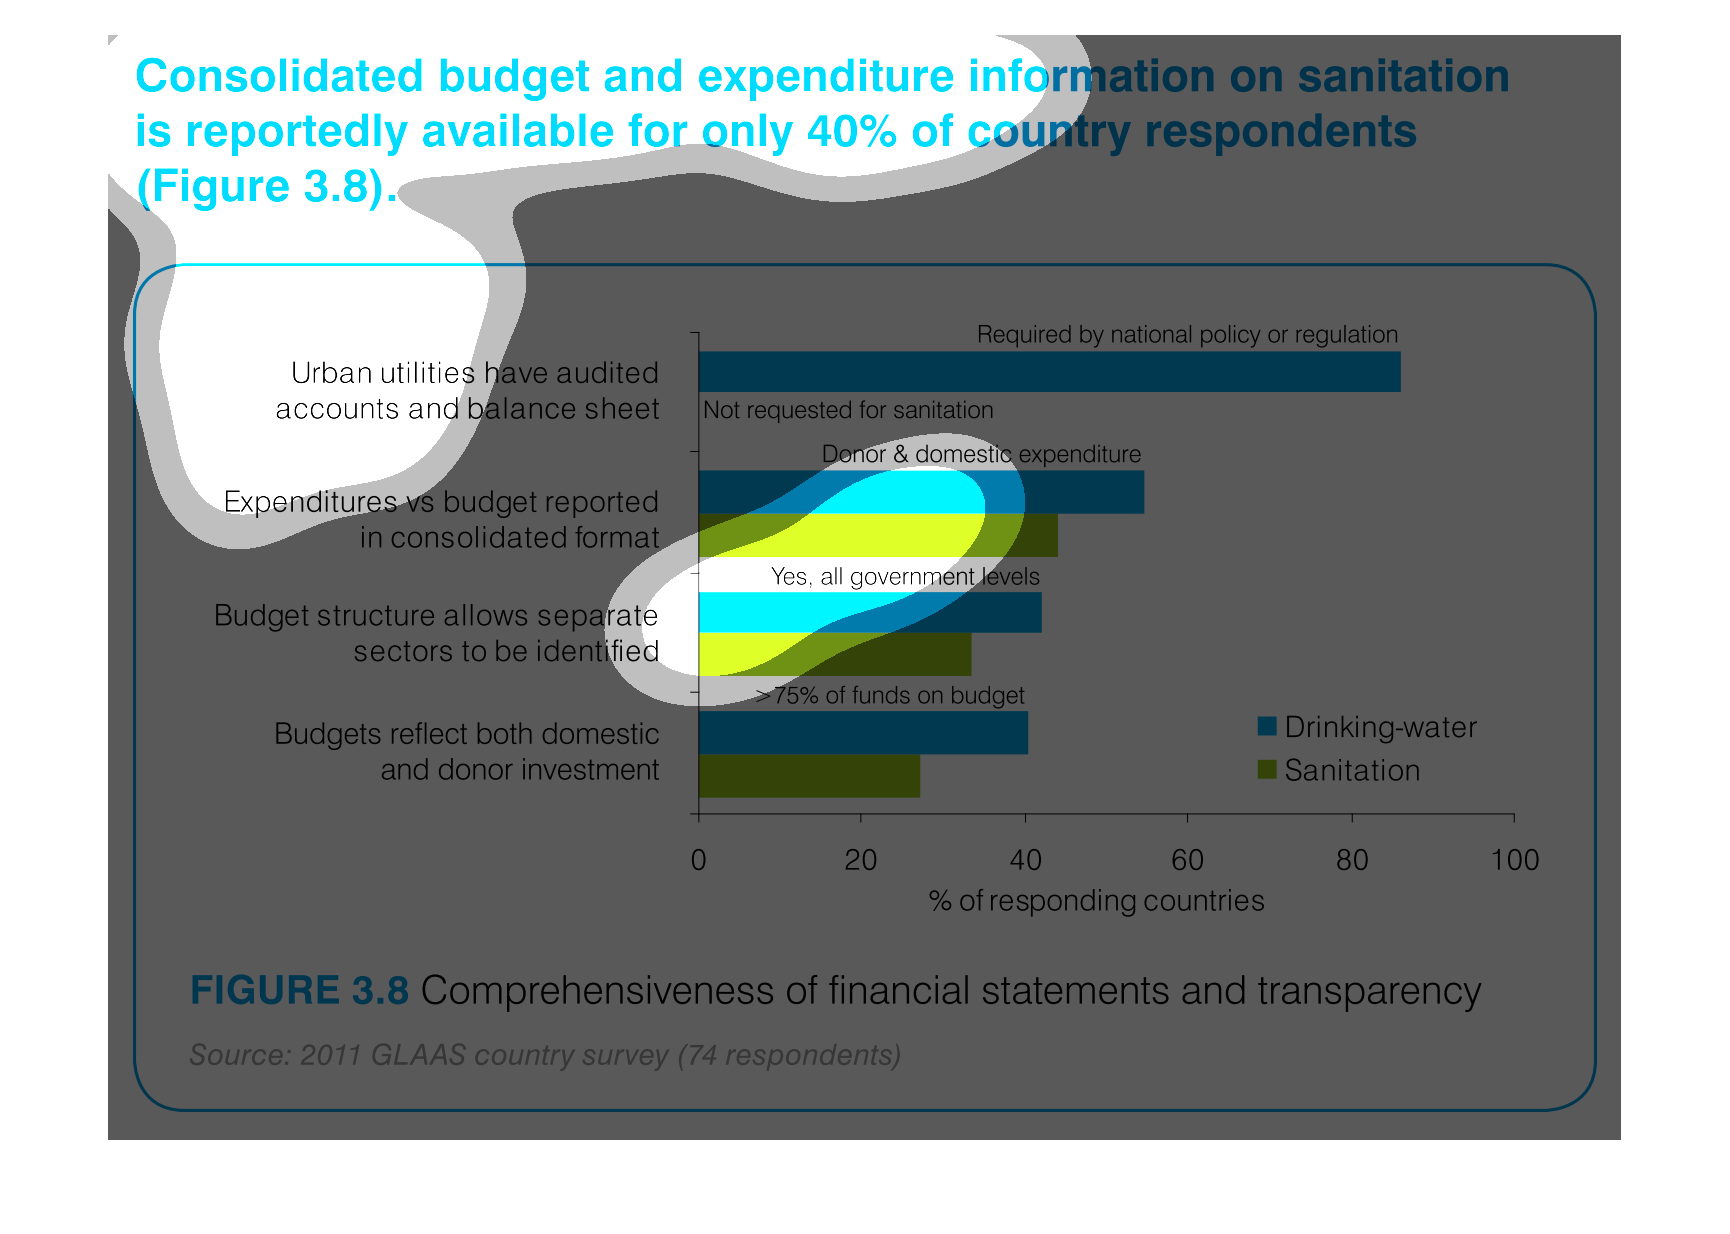
This is from a 2011 GLASS country survey with 74 respondents. The figure (3.8) shows the Comprehensiveness
of Financial Statements and Transparency. The chart tracks Drinking Water and Sanitation in
regards to the following: Urban utilities have audited accounts and balance sheets, Expenditures
and budget recorded in a consolidated format, Budget structure allows separate sectors to
be identified, Budgets reflect both domestic and donor investment.
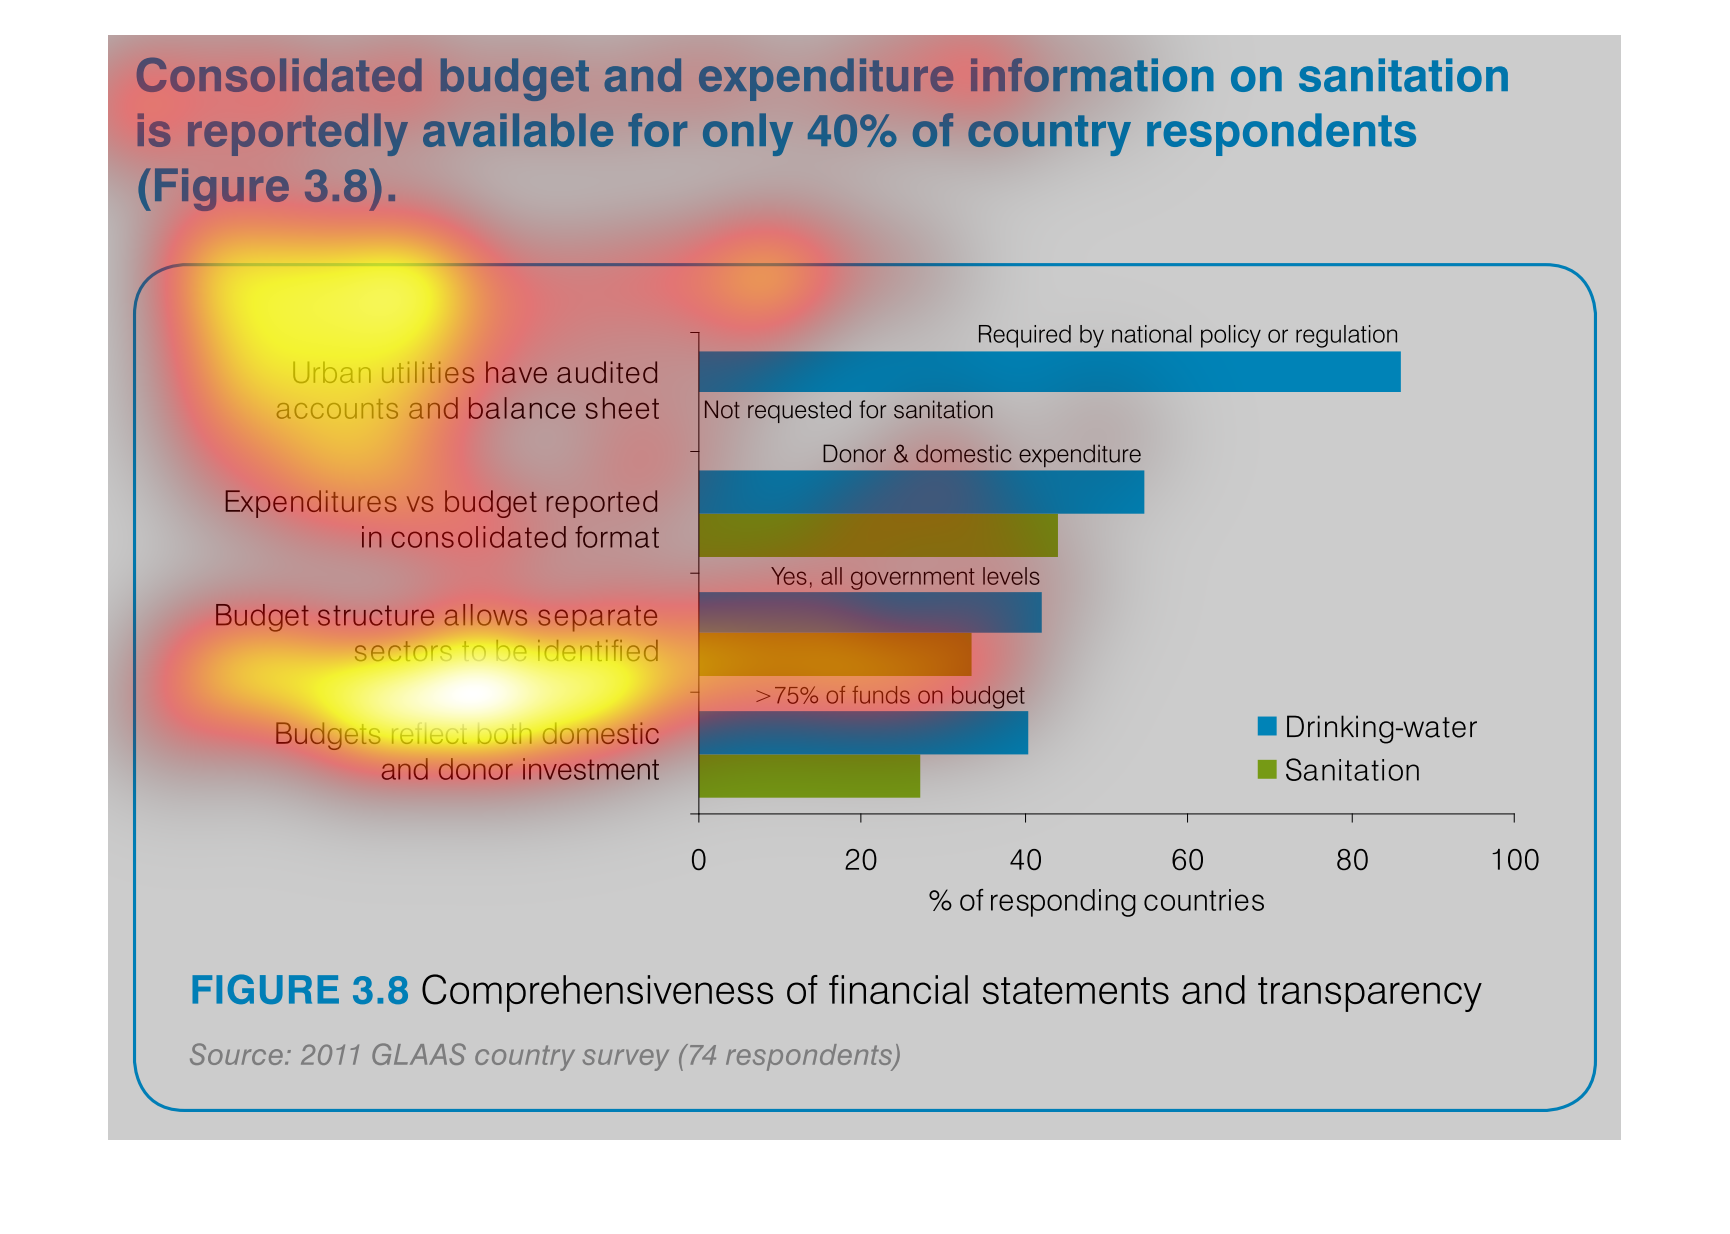
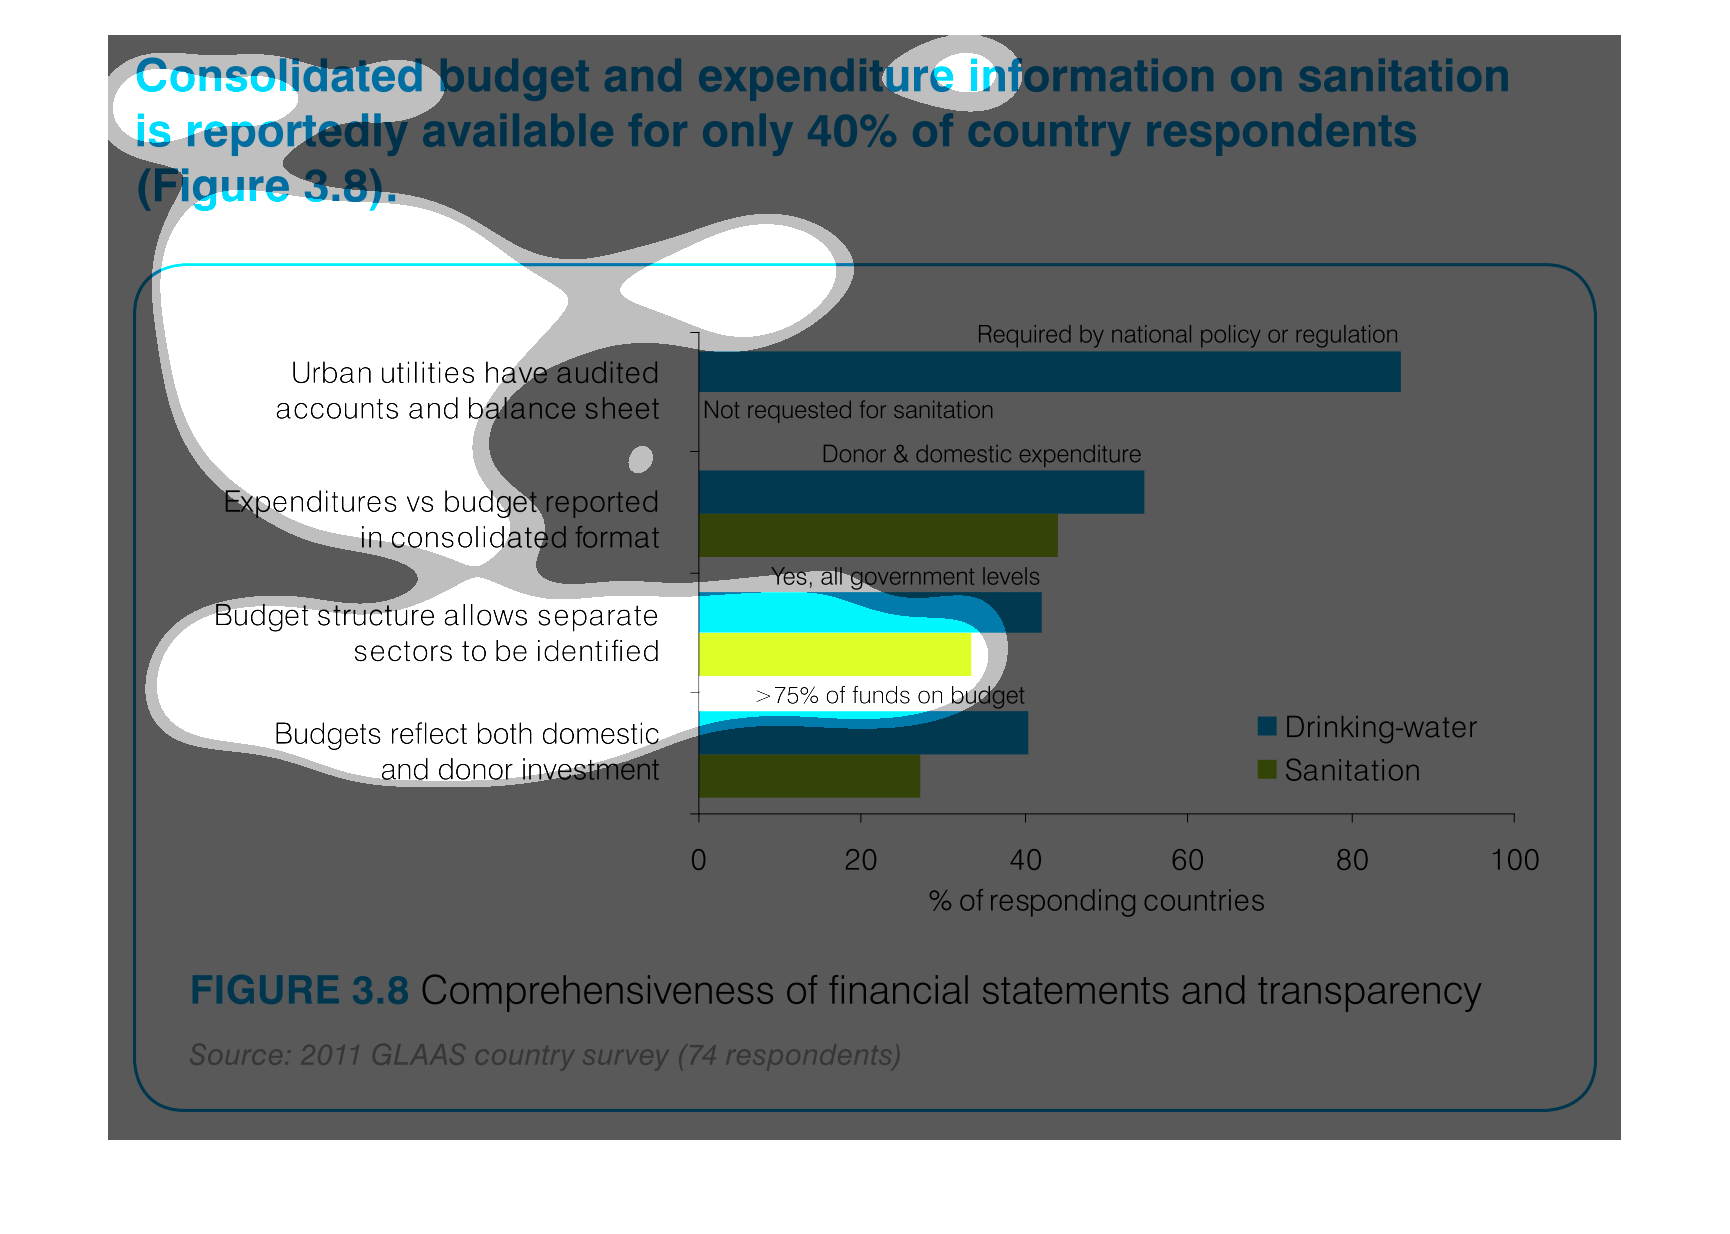
The figure presented is titled Consolidated budget and expenditure information on sanitation
is reportedly available for only 40% of country respondents.

This is a graph that shows the consolidated budget and expenditure information on sanitation
for various sample countries and it covers sanitation and drinking water.
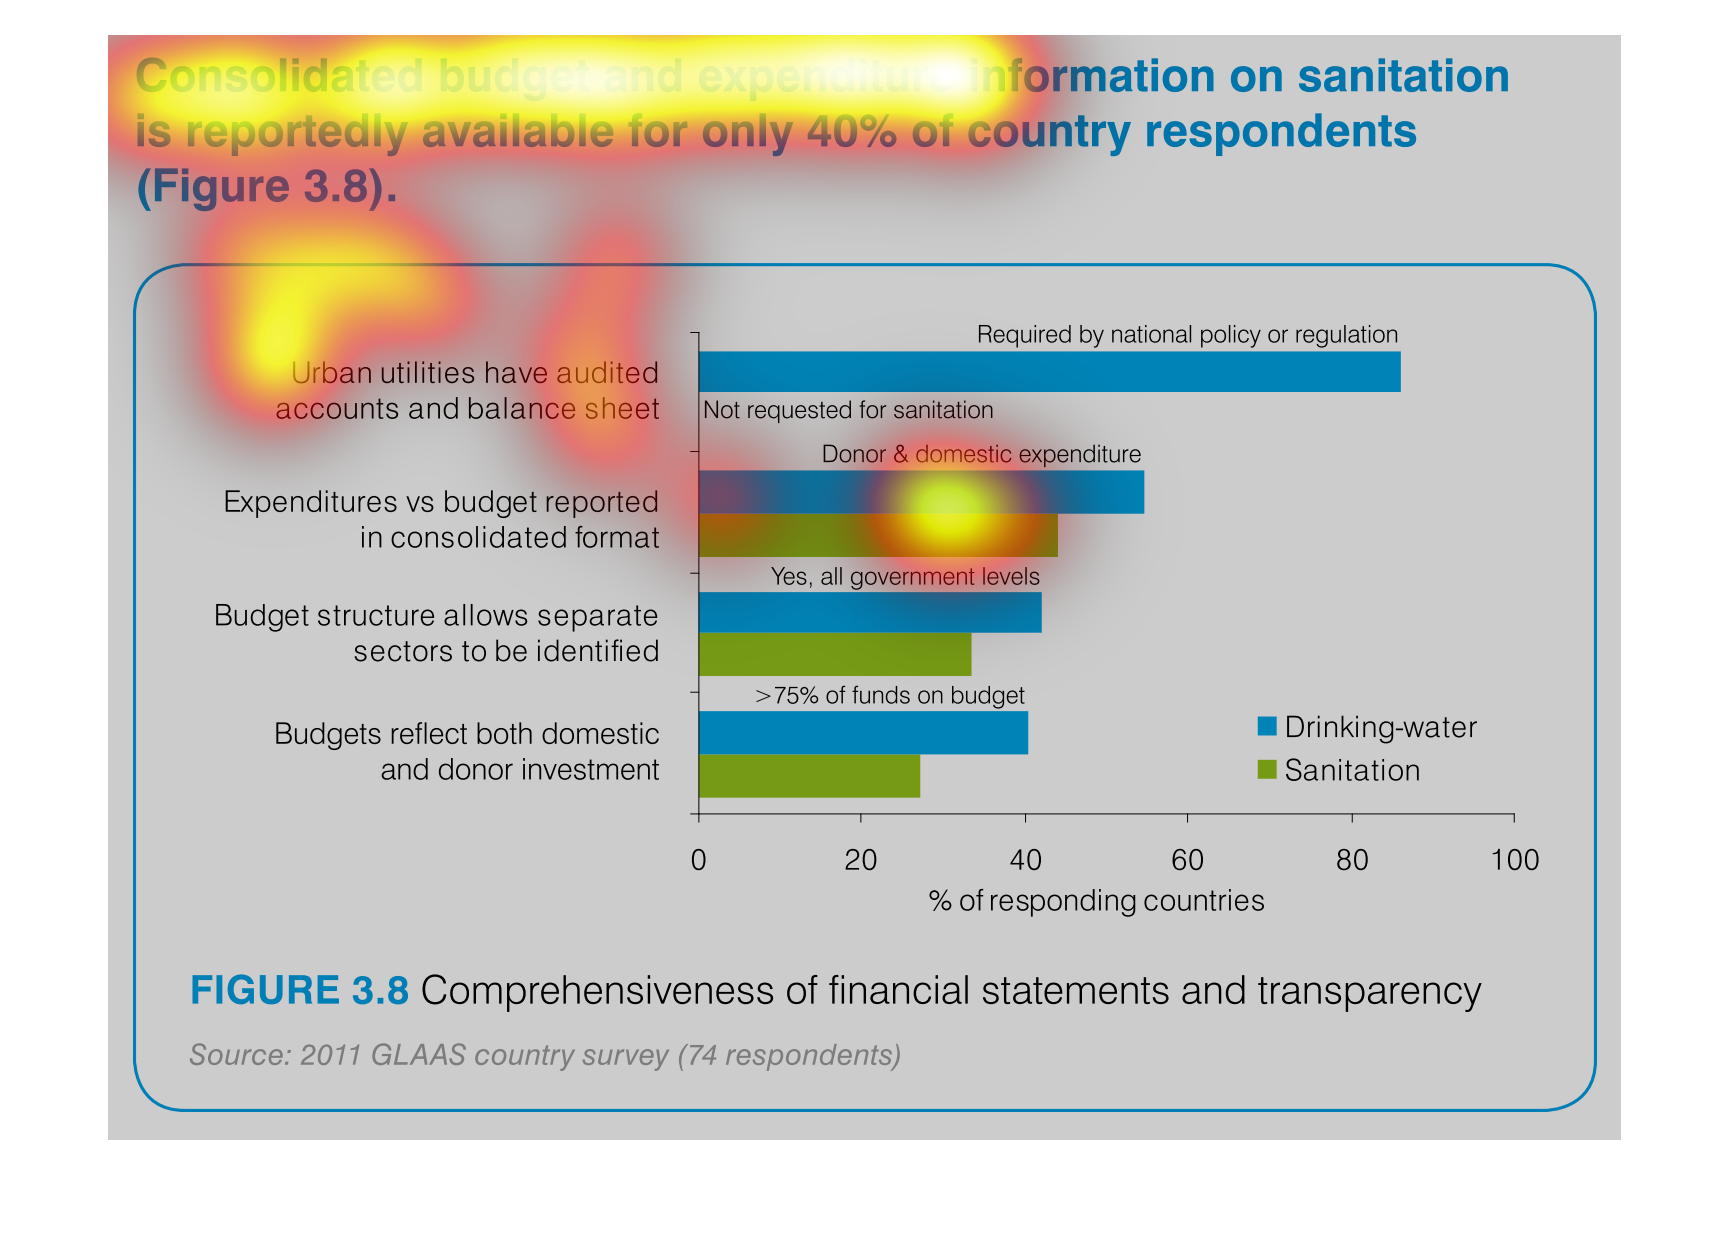
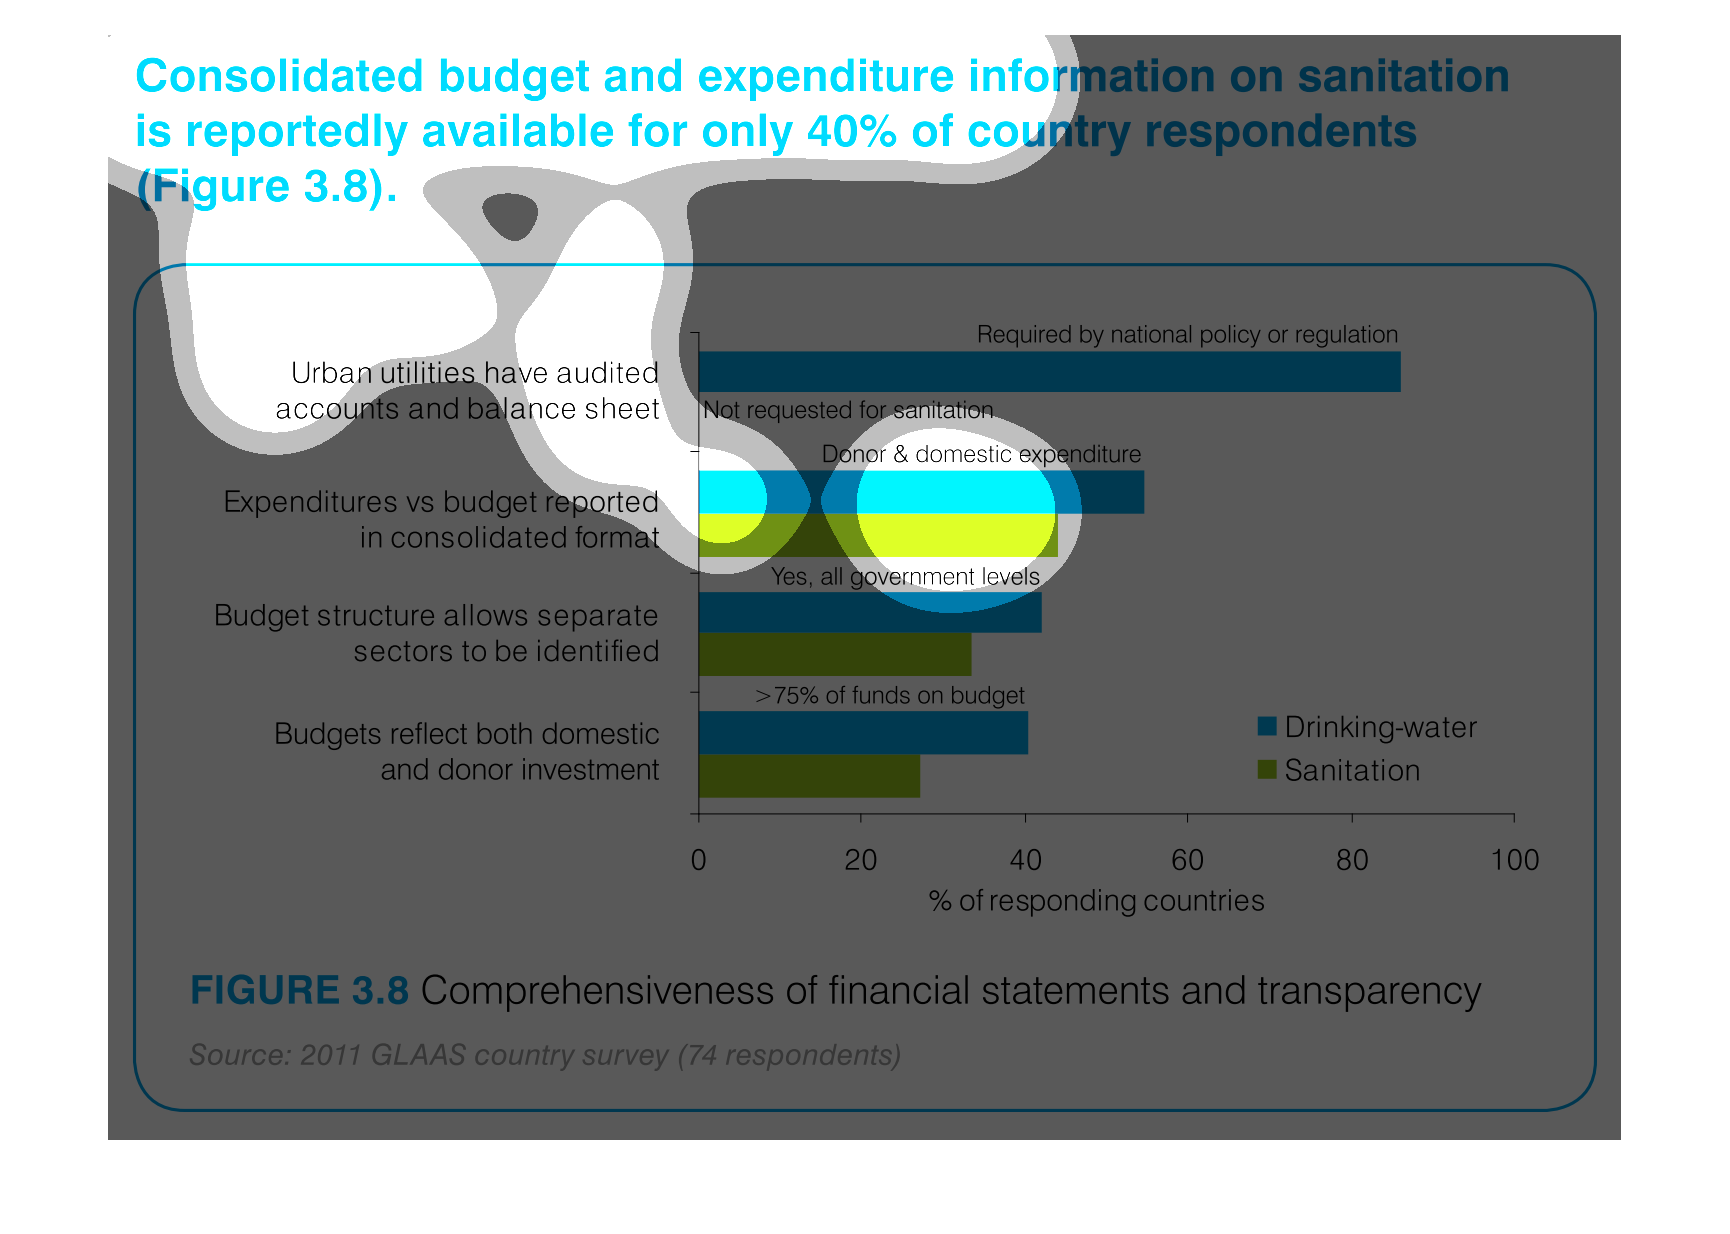
The following chart list information on a consolidated budget, expeditures, information on
sanitization is reputably available for only forty percent of country respondents.
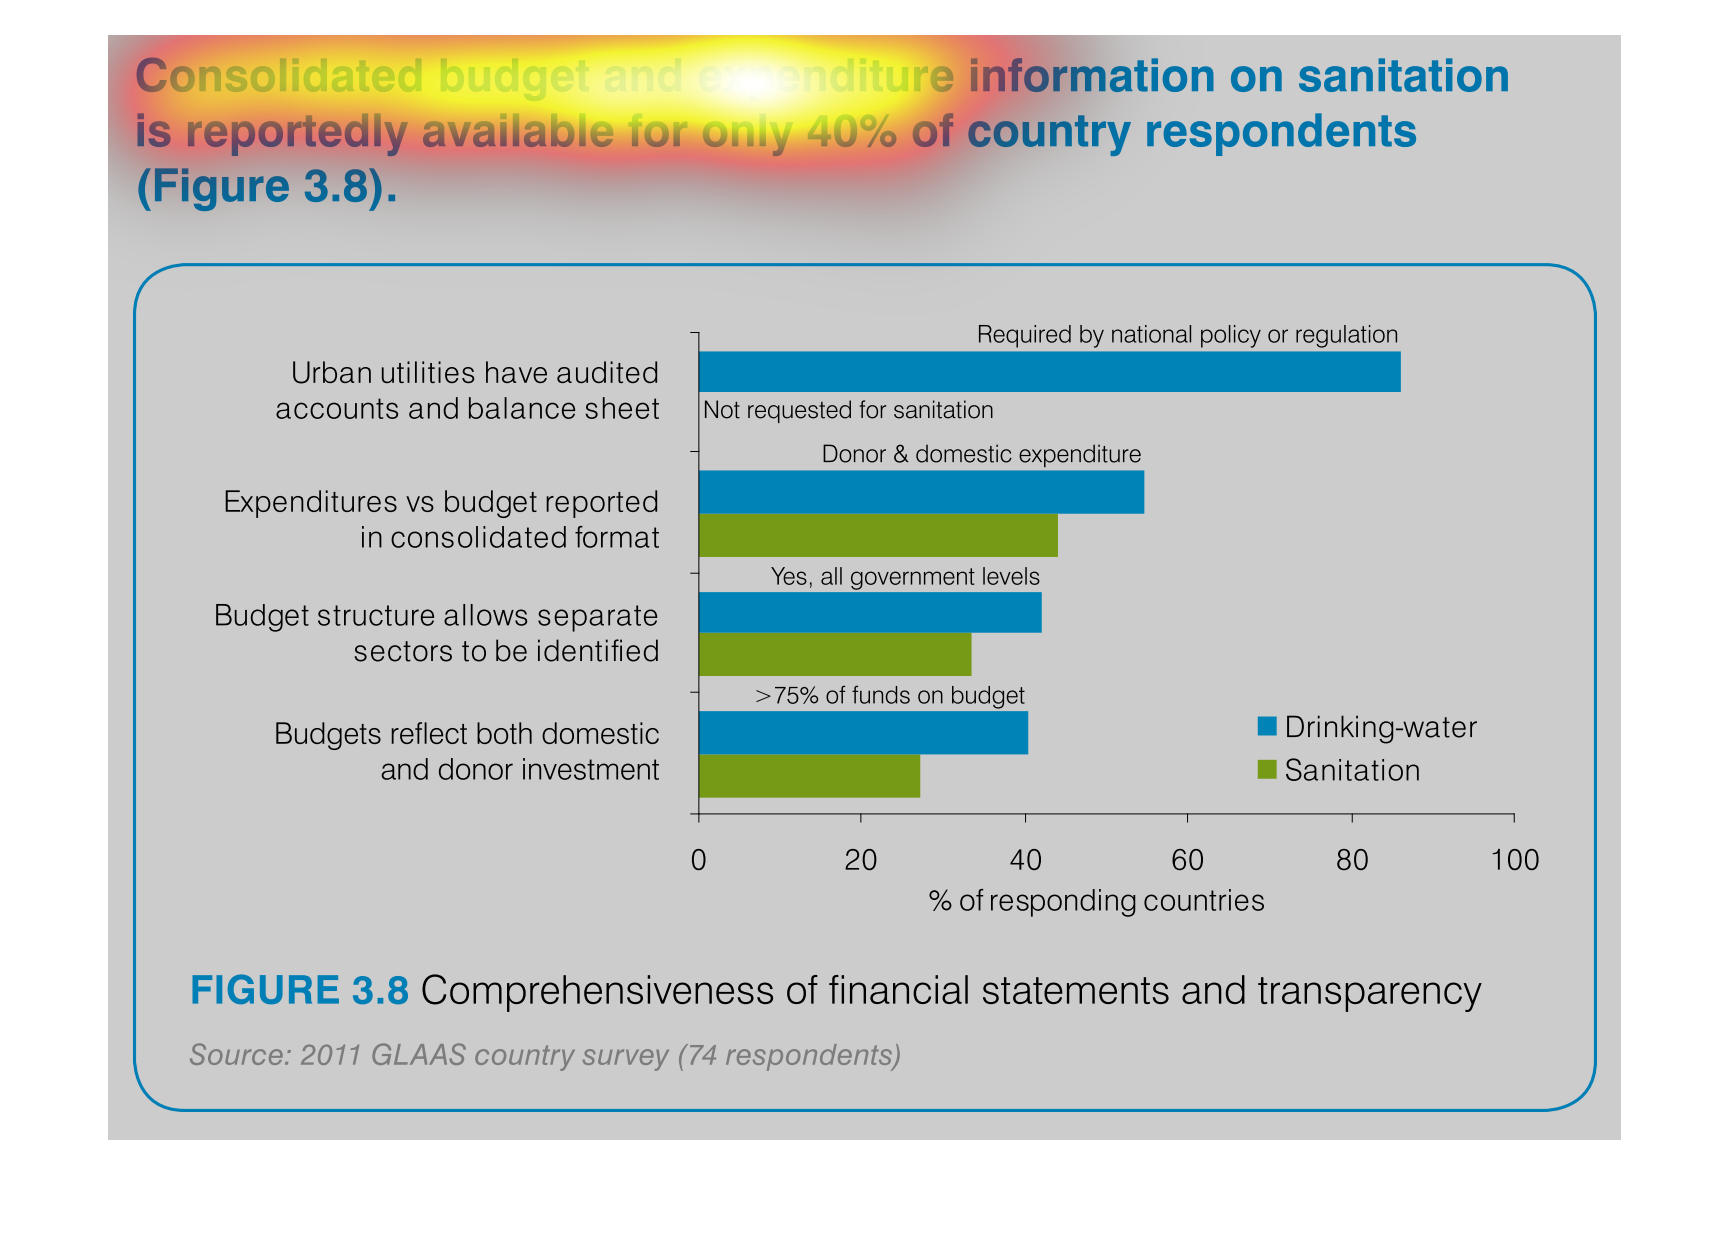
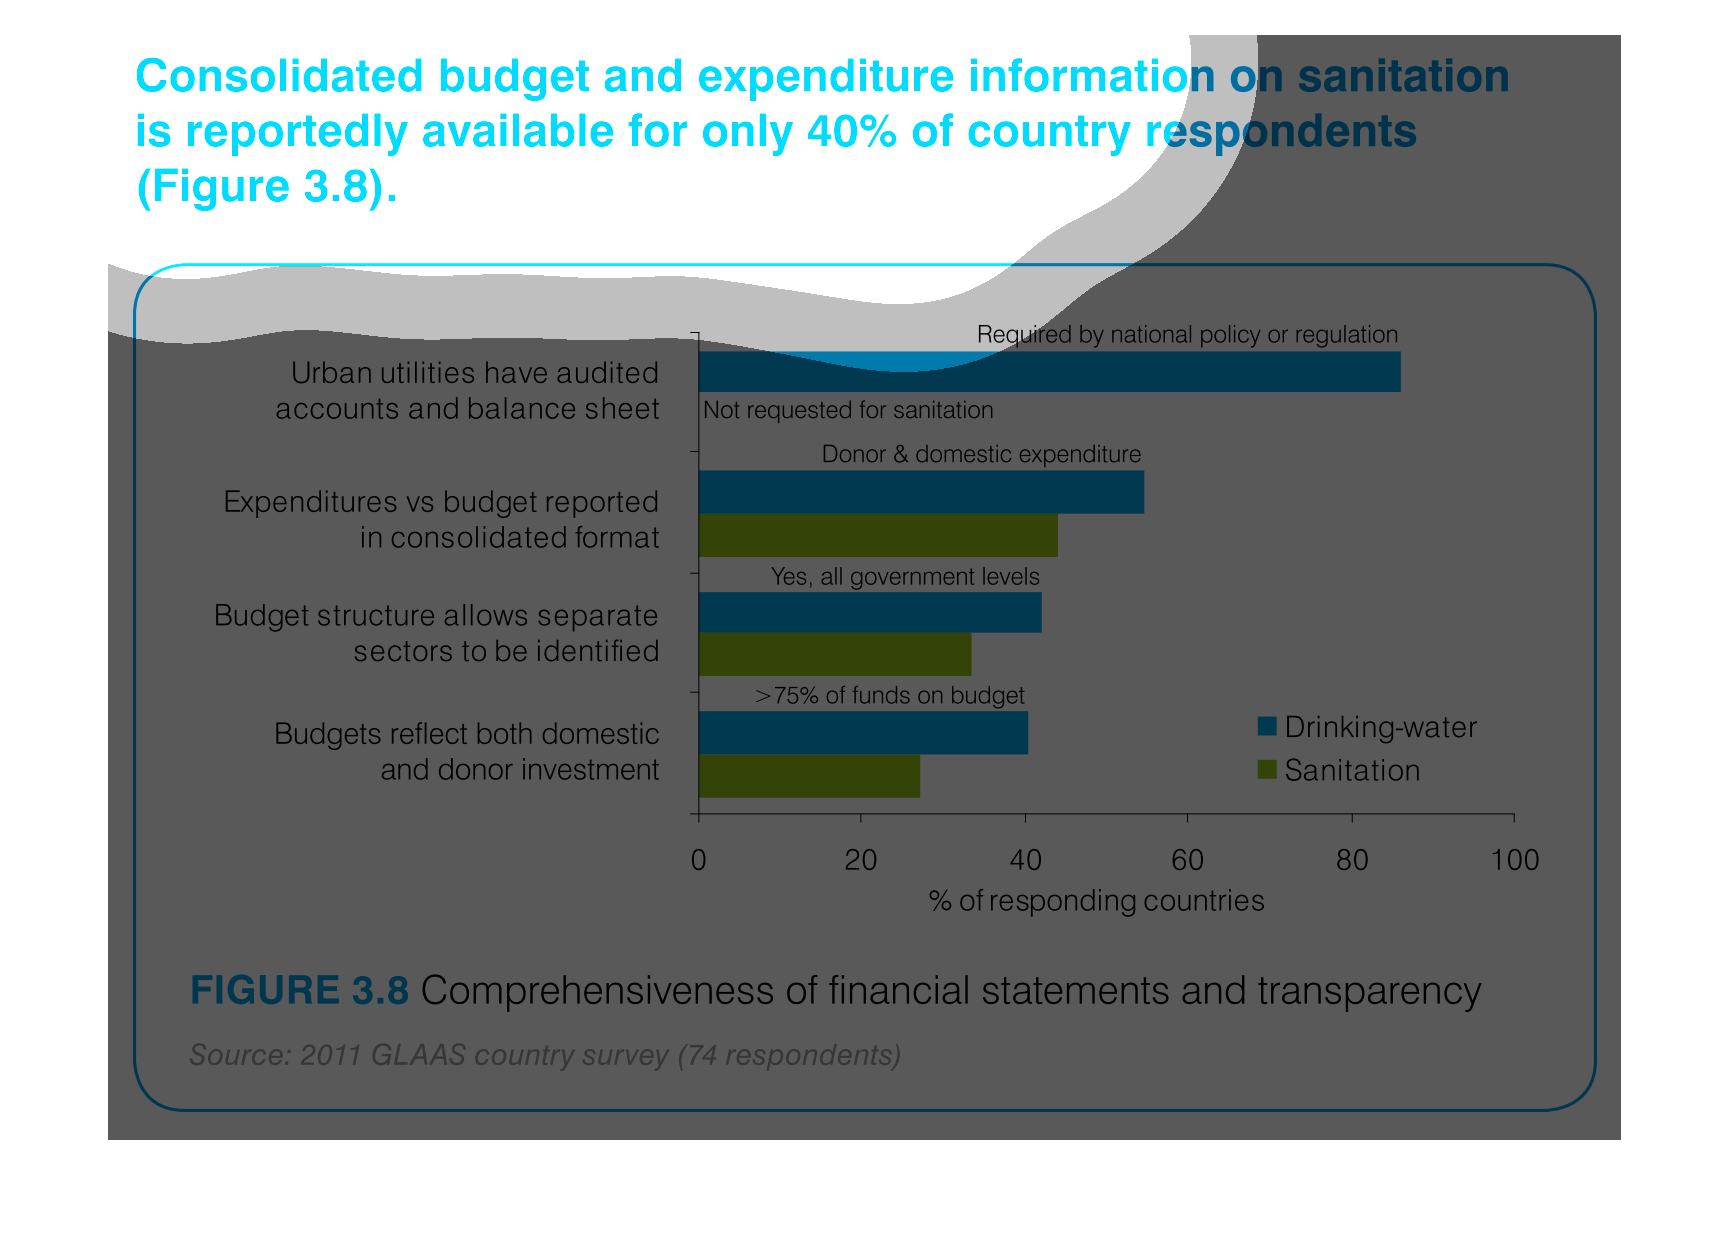
The image of the graph seems to deal with the sanitation utilities of various types of living
method (cities, suburbs, rural, etc.) and the varying budgets tied to them