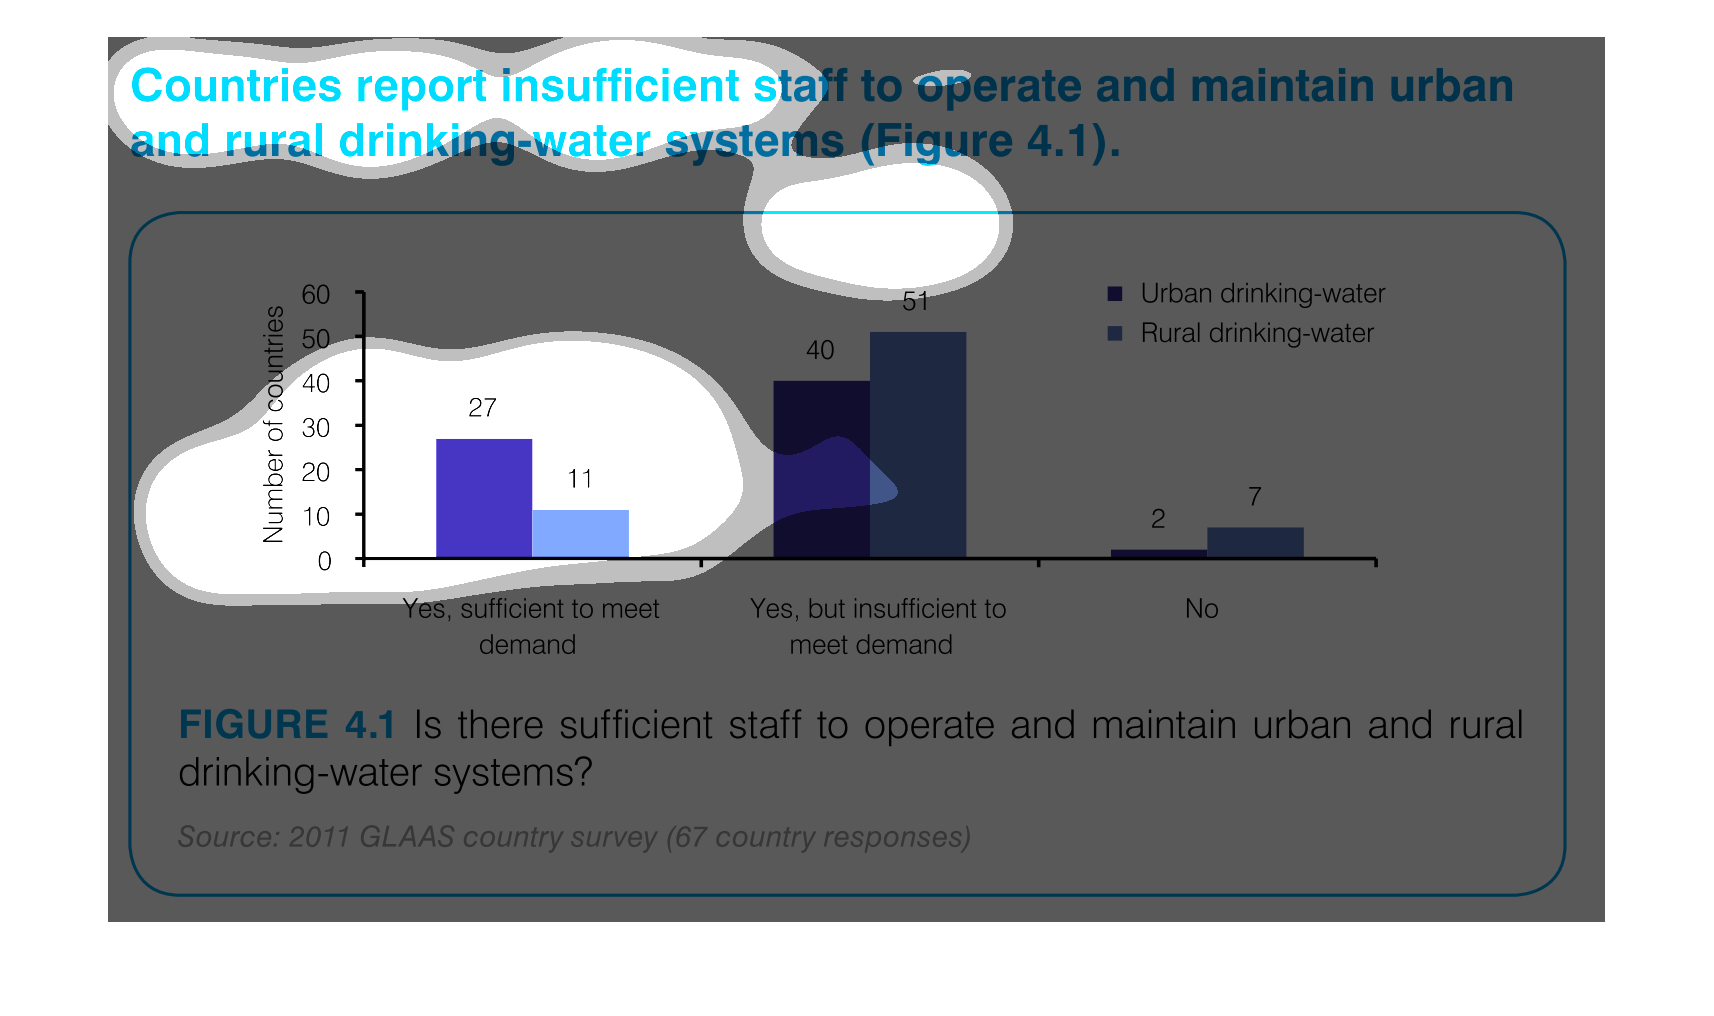
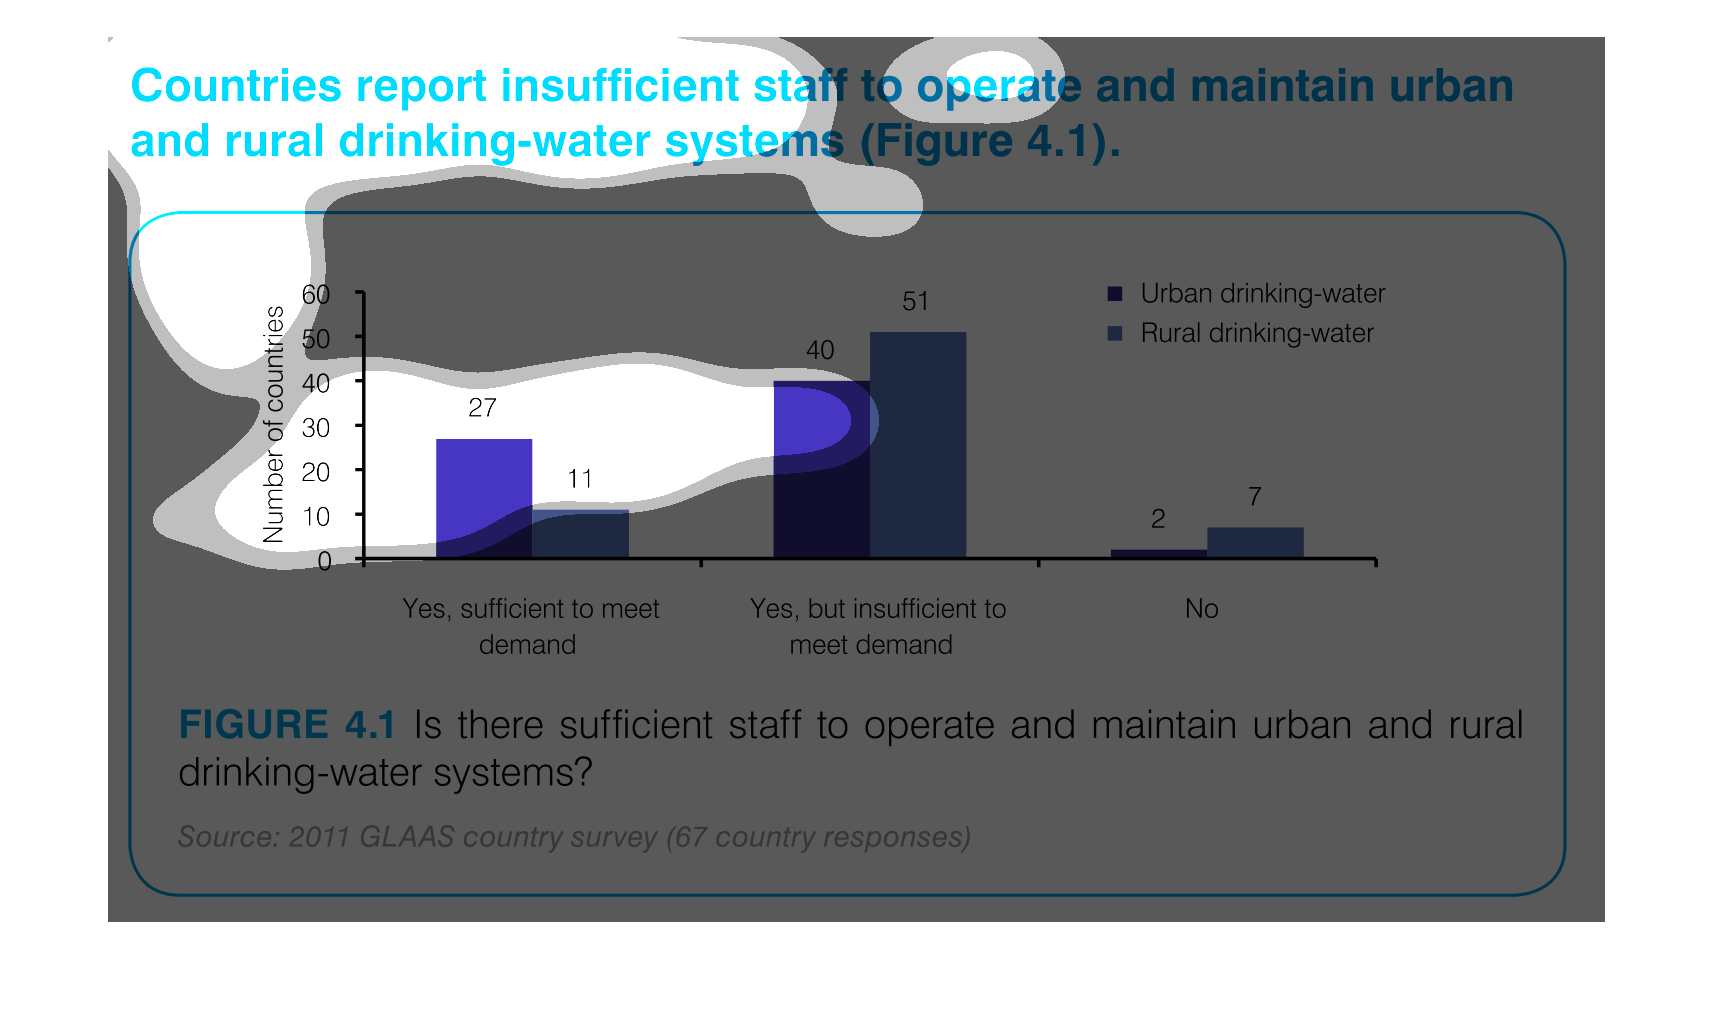
This graph outlines staffing levels in urban and rural areas to supply drinking water. This
bar graph shows that most areas have drinking water but it is insufficient to meet the demand.
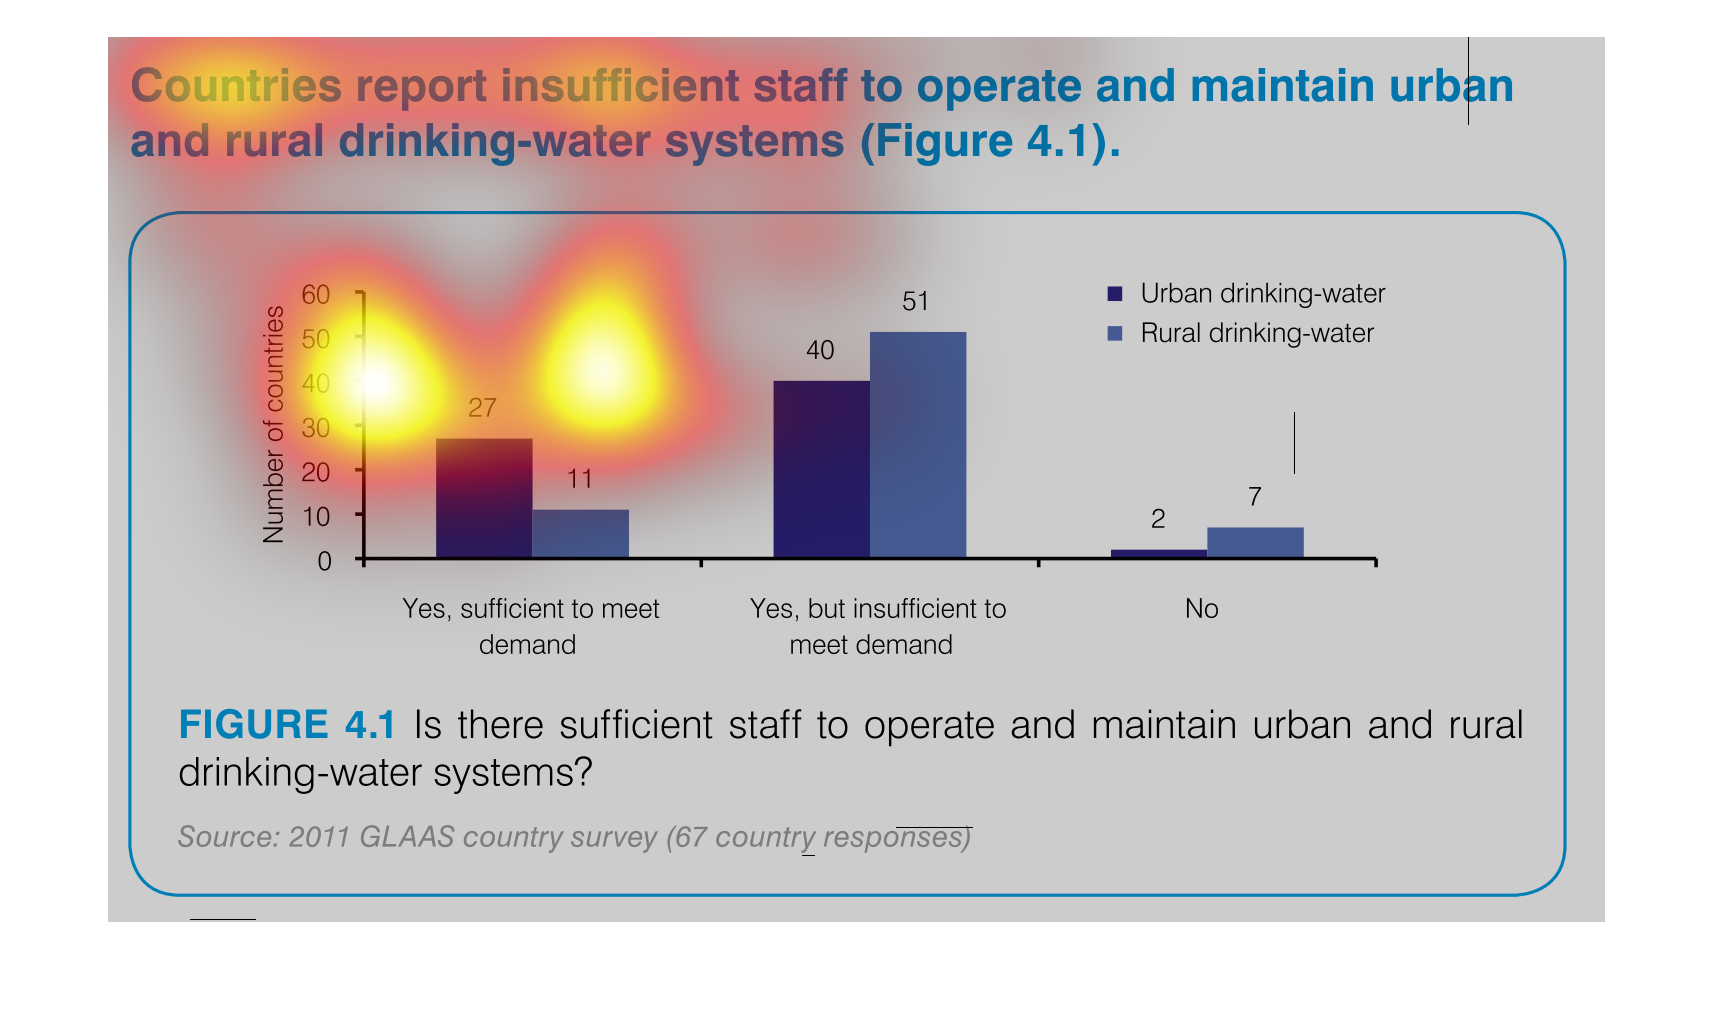
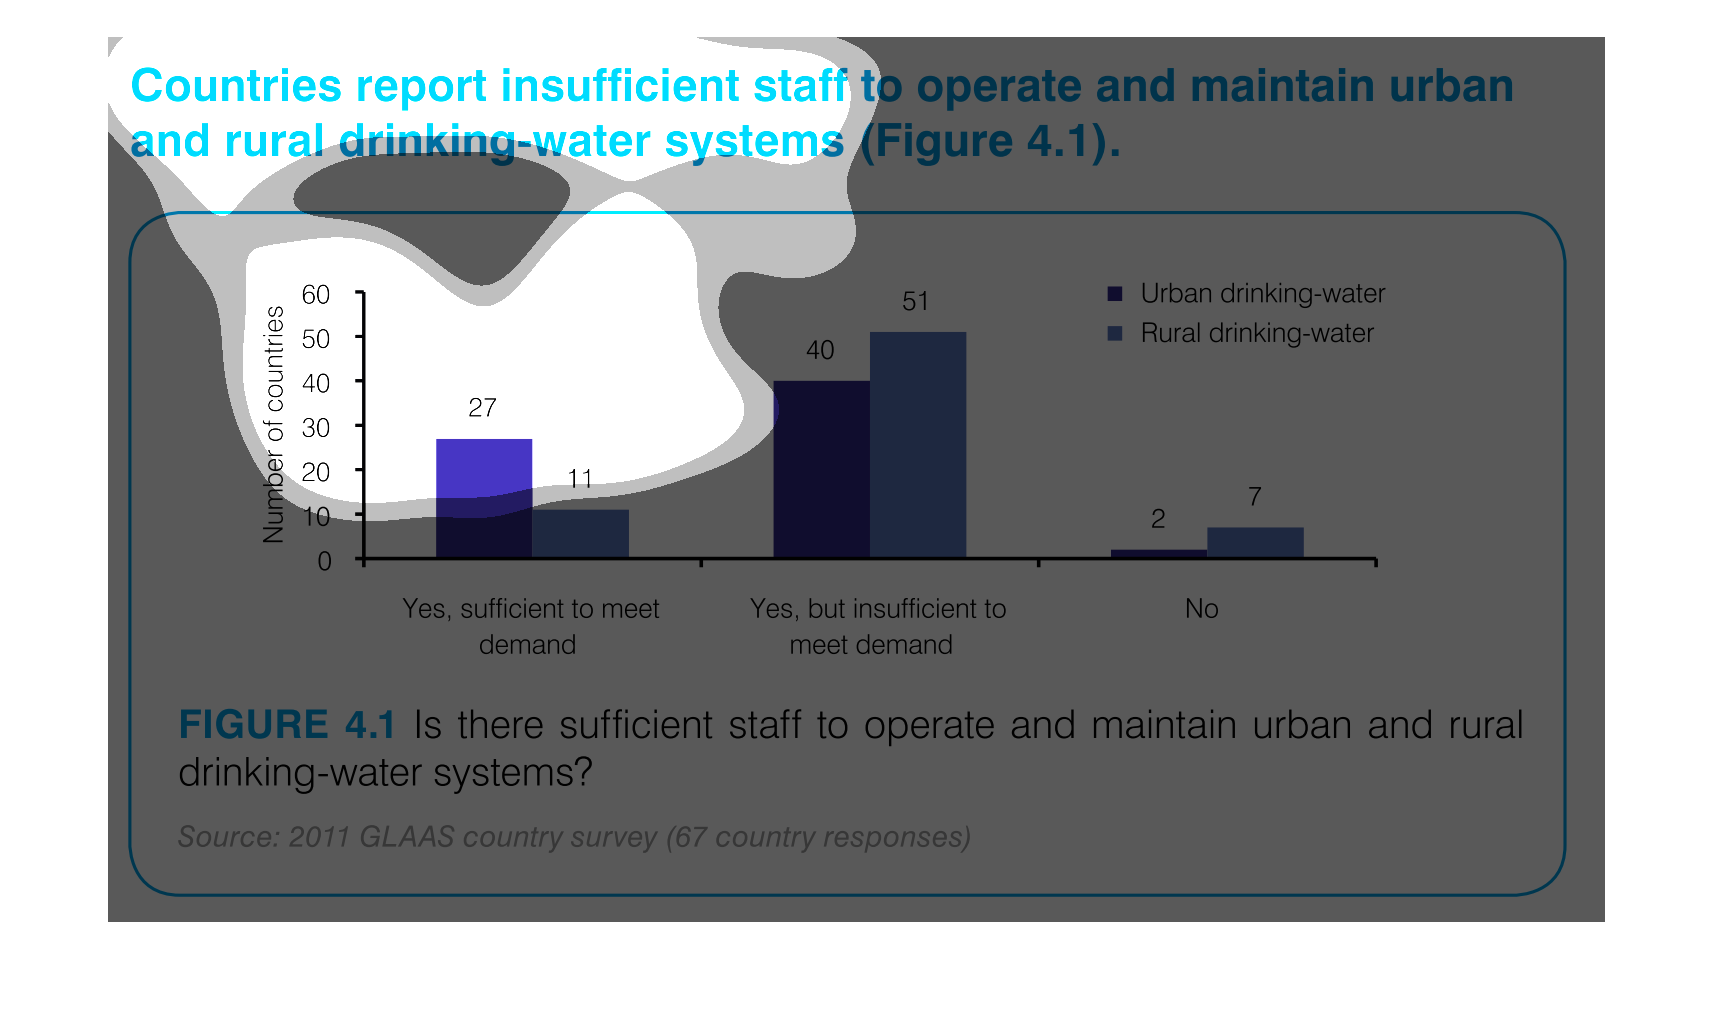
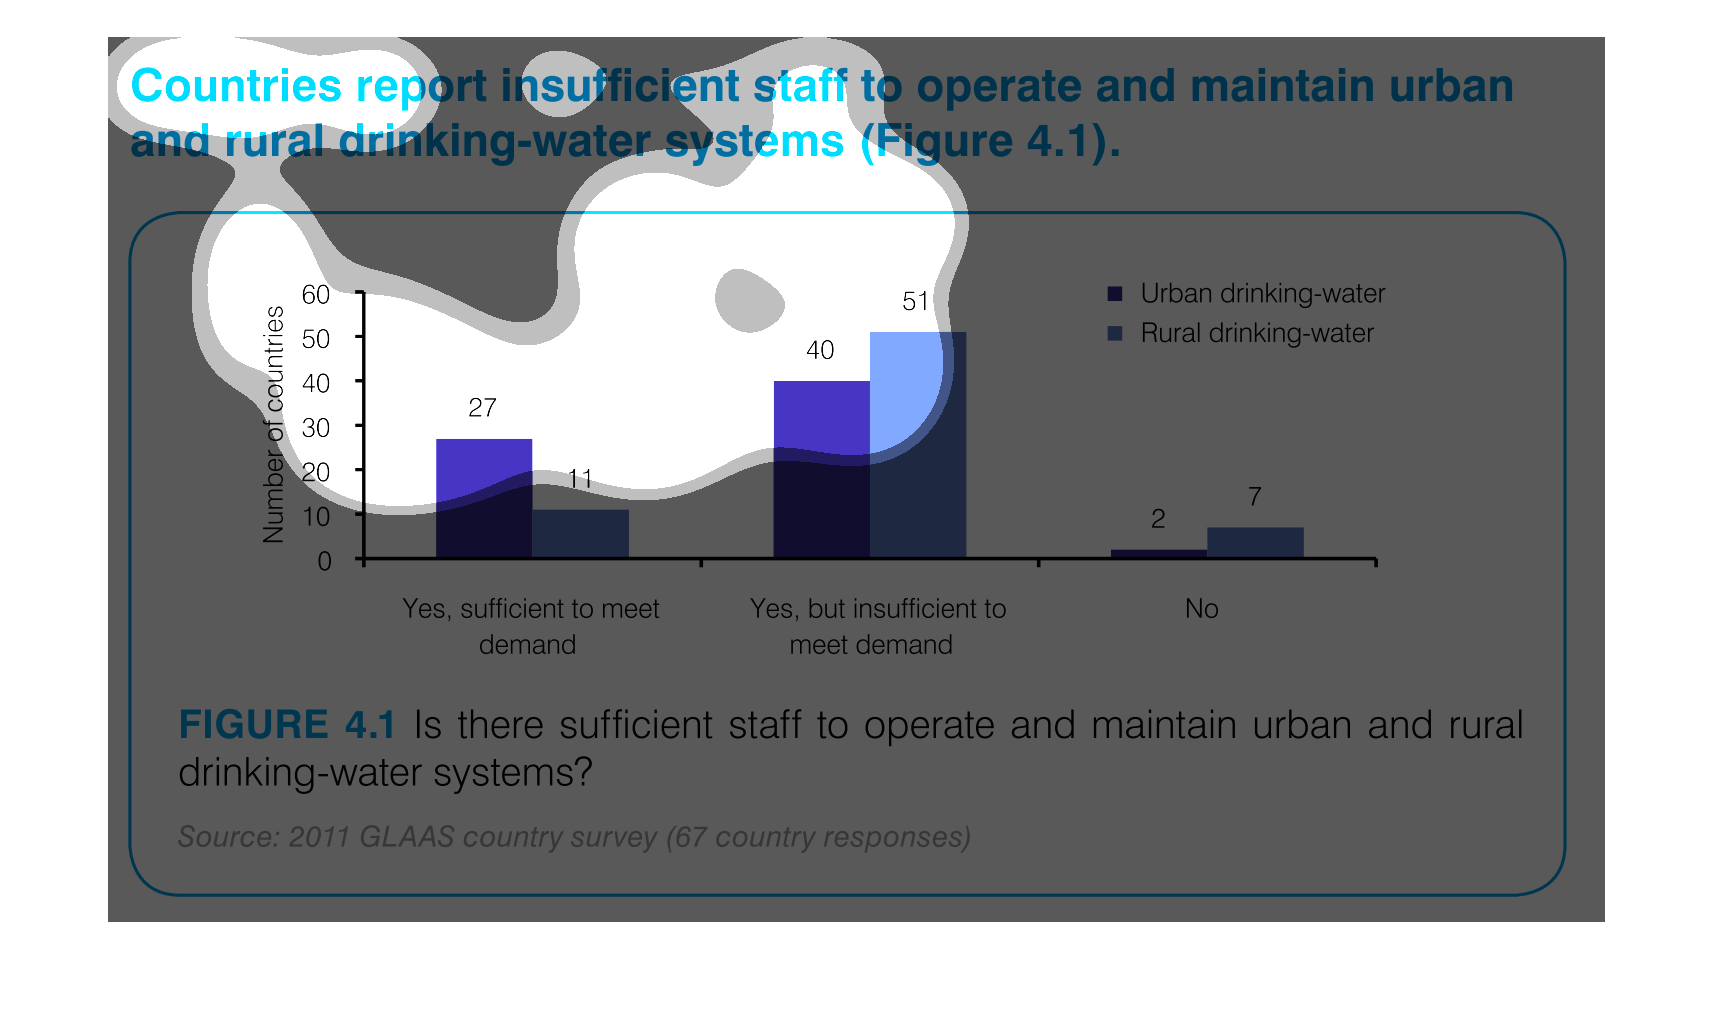
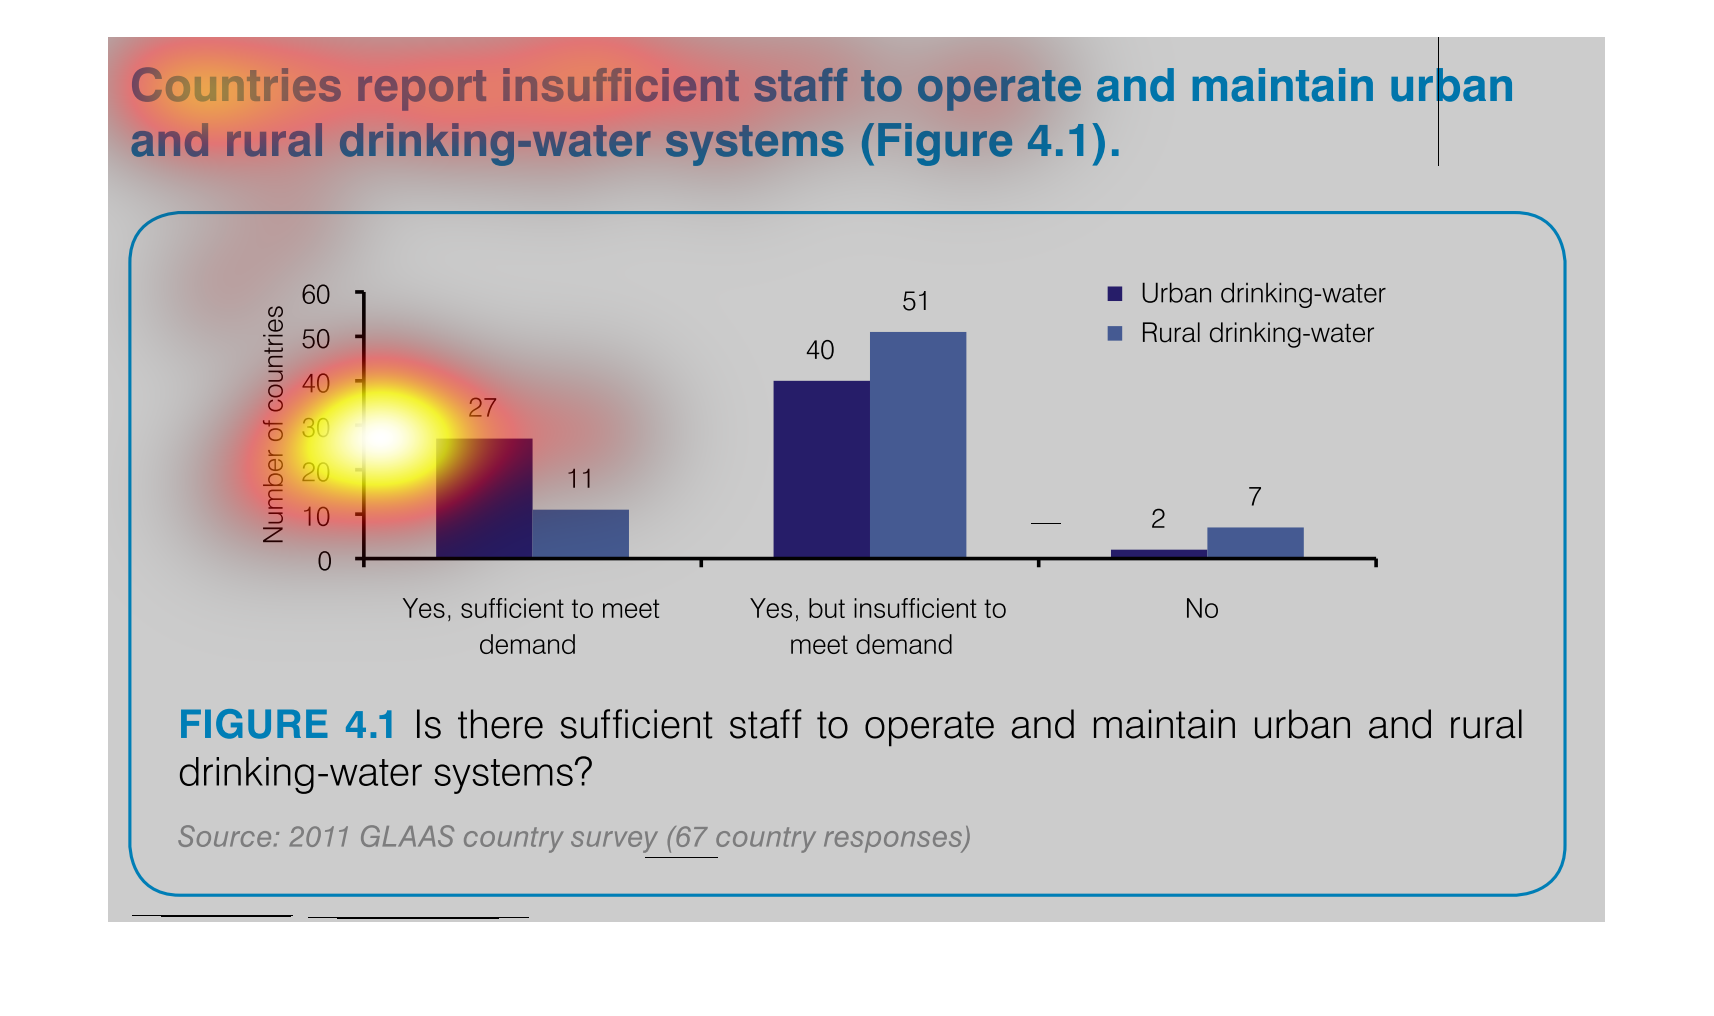
Chart showing countries with sufficient staff to meet demand vs. insufficient staff to meet
demand for drinking-water systems, showing urban and rural distribution, and including countries
which have no support.
The graph indicates the number of countries that can support the water systems for both rural
and urban areas. They separate by the demand on the water supplies to indicate not only if
the water systems can be maintained but if it's sufficient to meet the demand of the area.
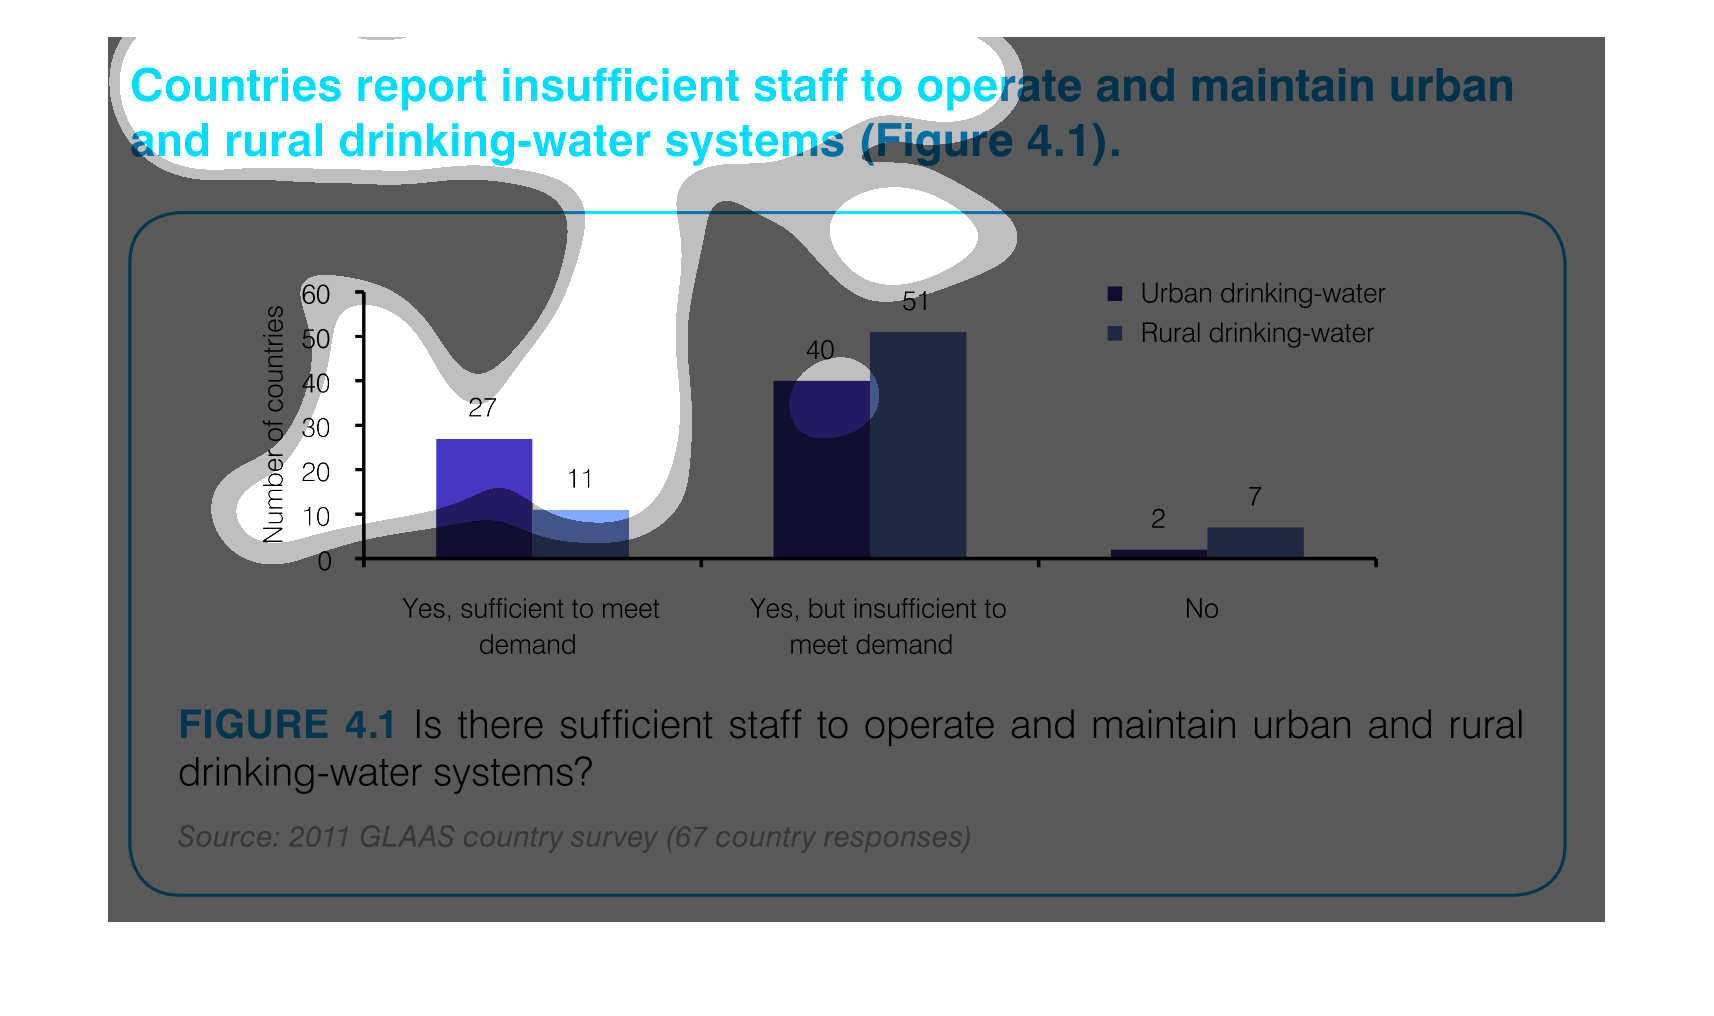
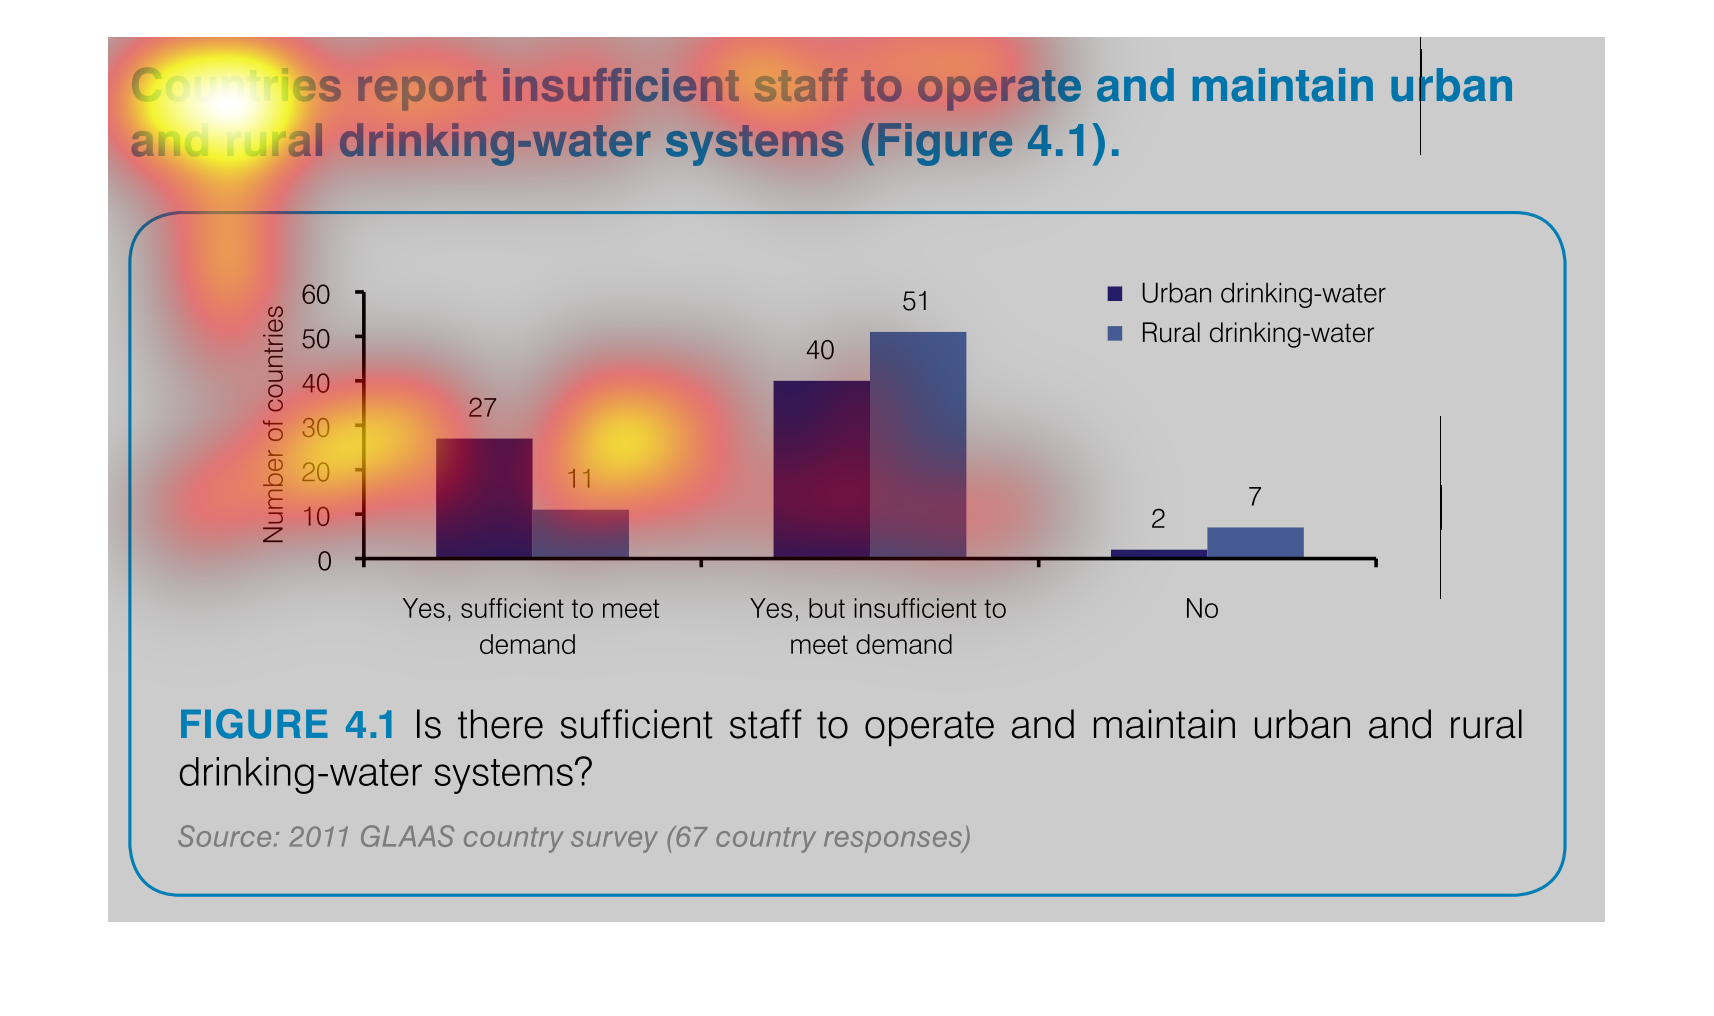
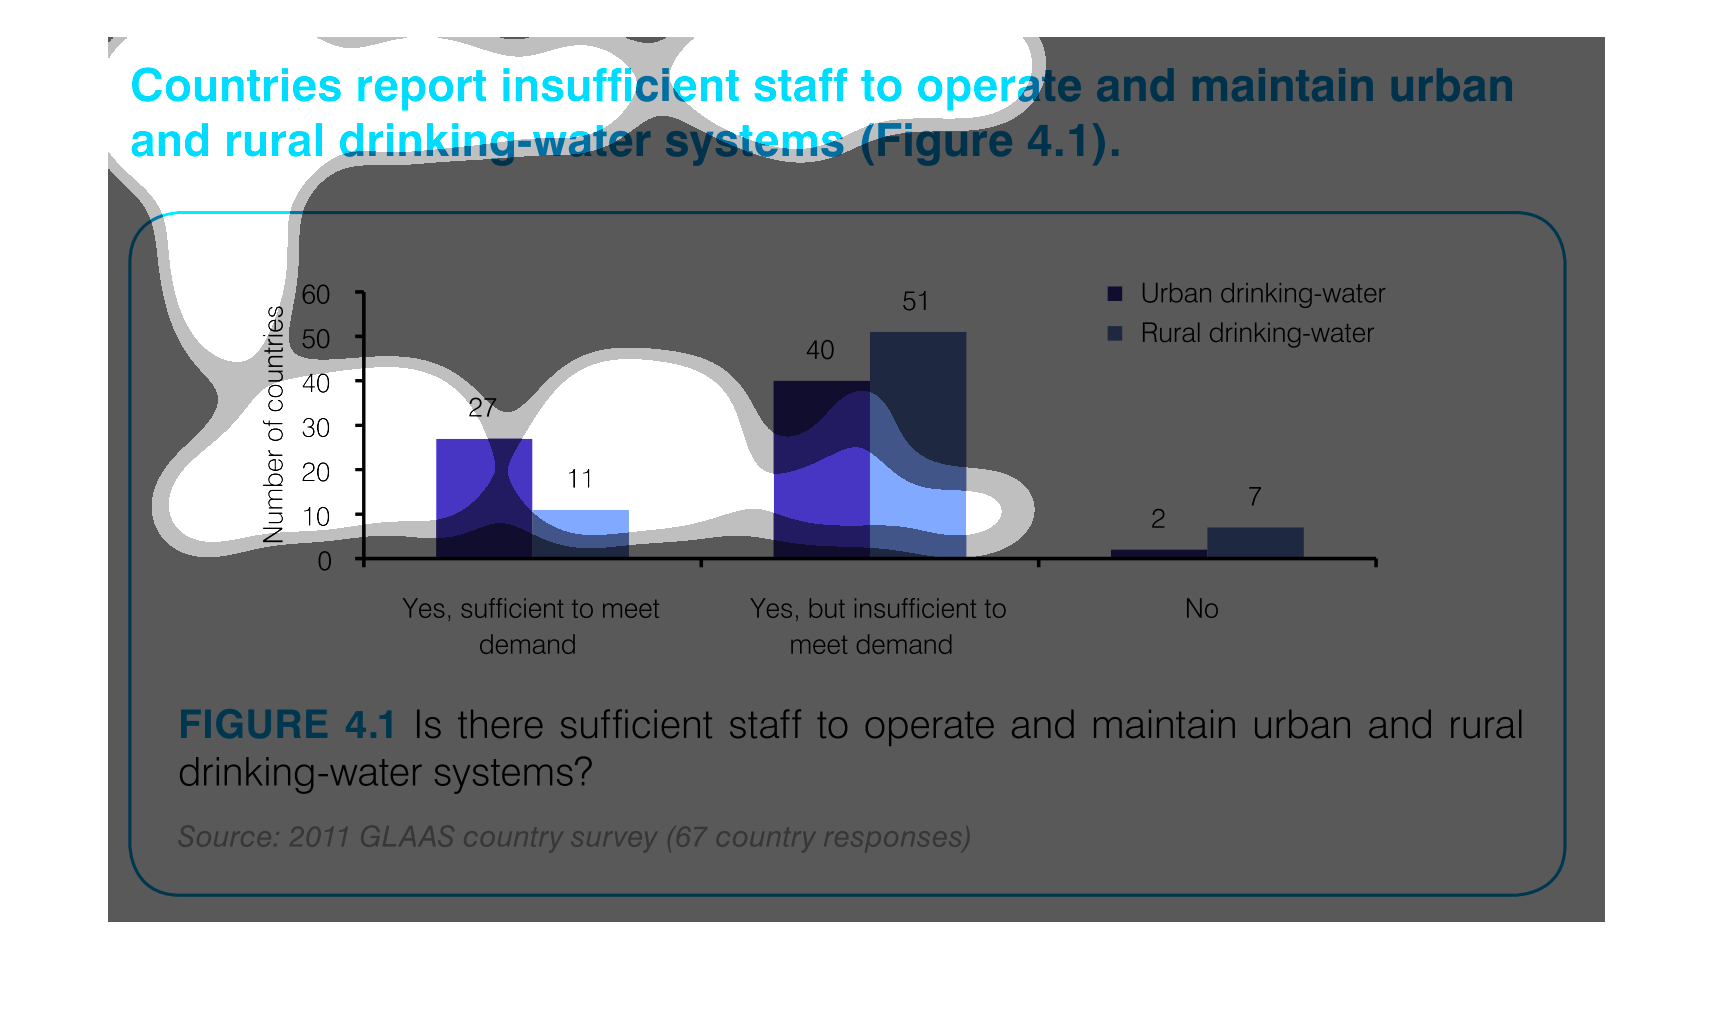
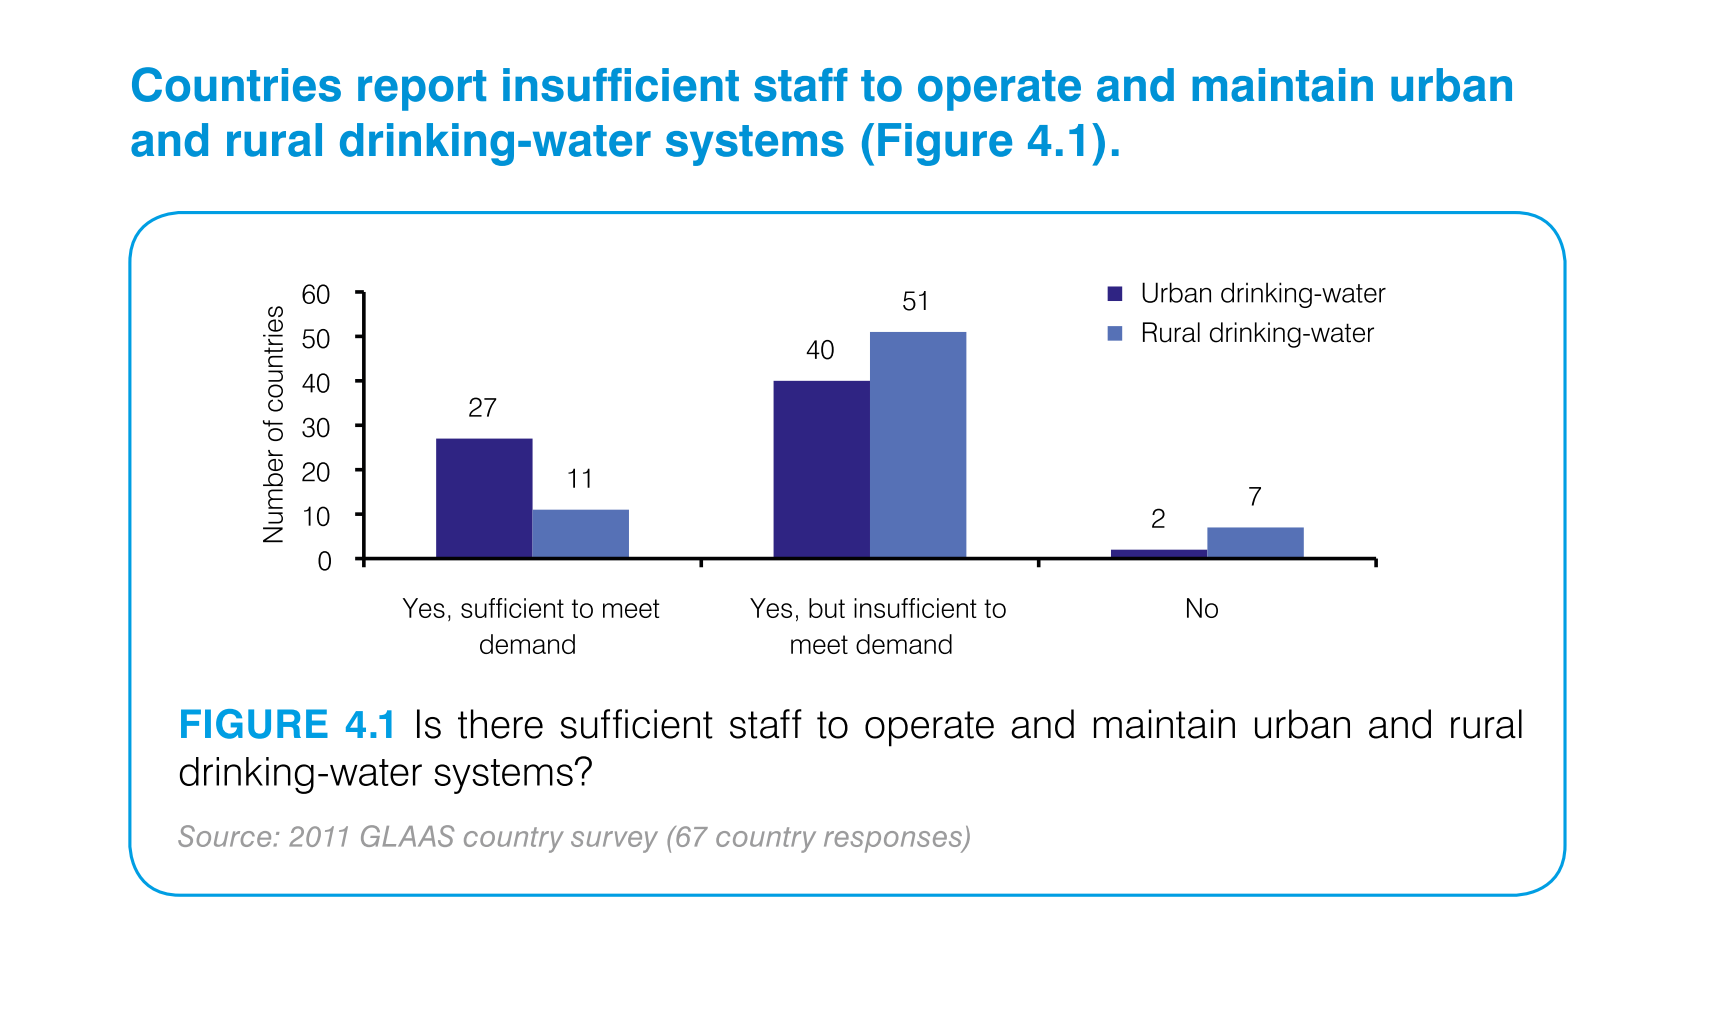
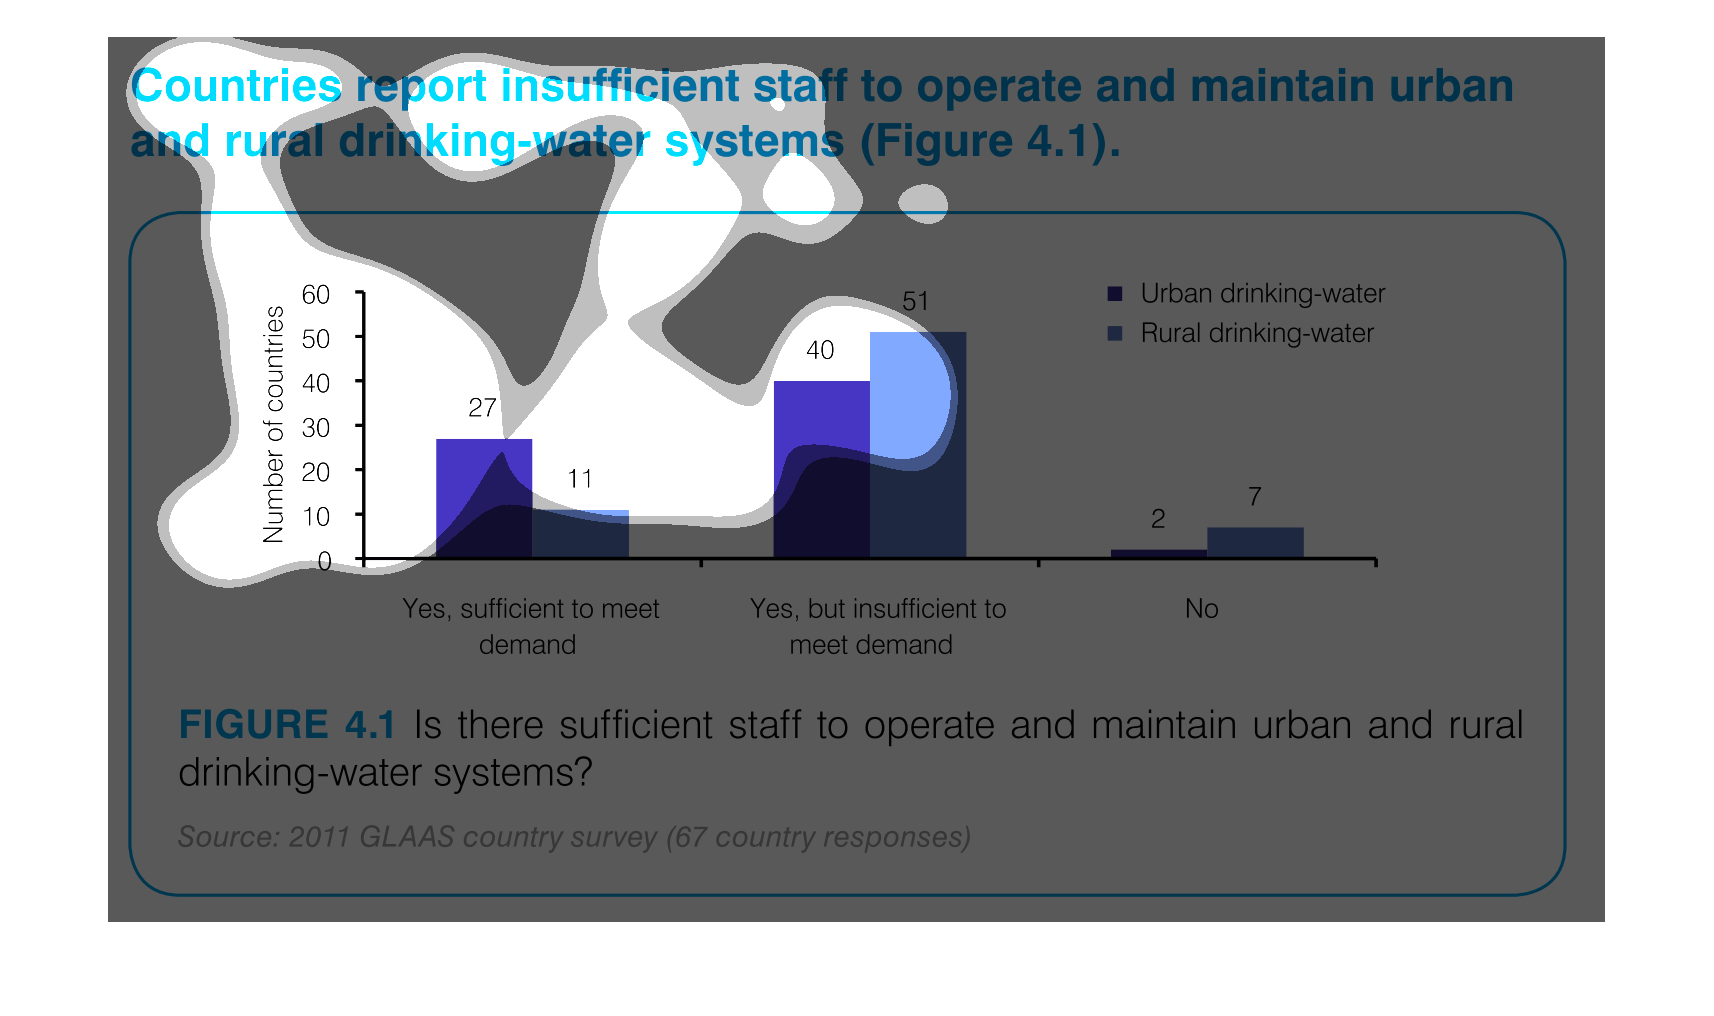
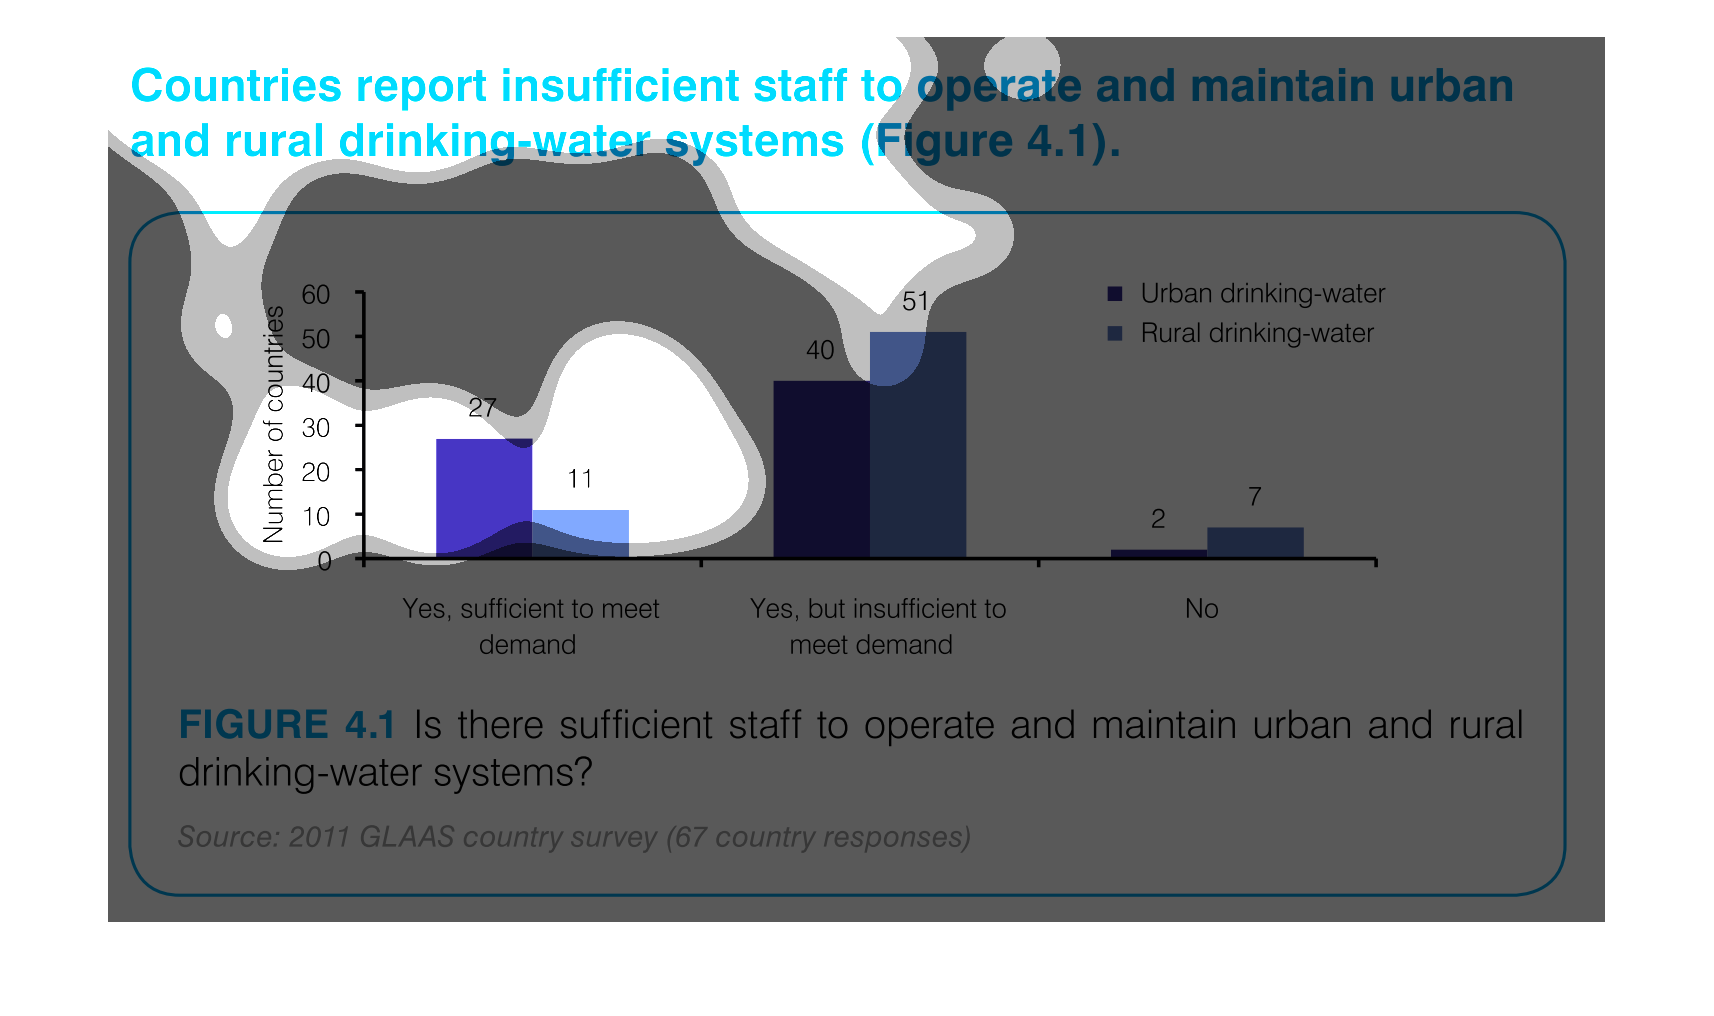
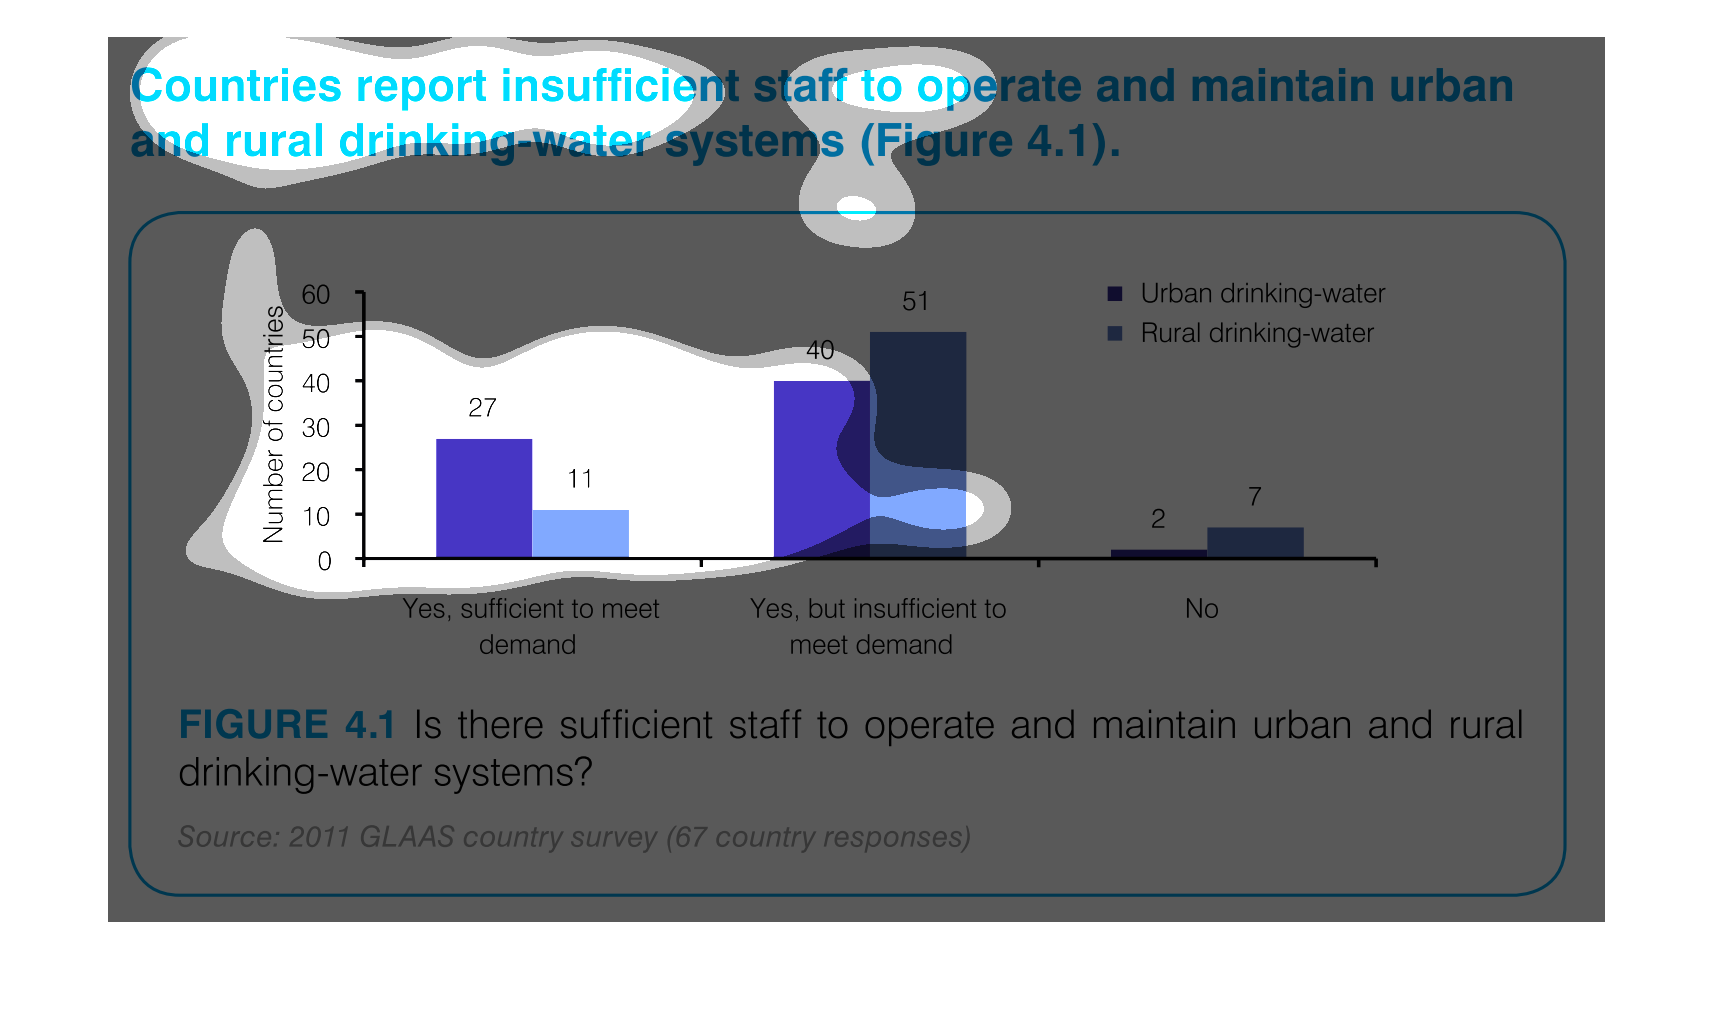
This image demonstrates that several countries report insufficient staff to maintain clean
drinking water facilities. This is especially severe in rural areas, where 51 countries reported
they could not meet the demand for clean drinking water.
The number of staff sufficient to maintain the drinking water for rural and urban areas is
27 for urban areas, and  11 to meet the demand of rural areas.
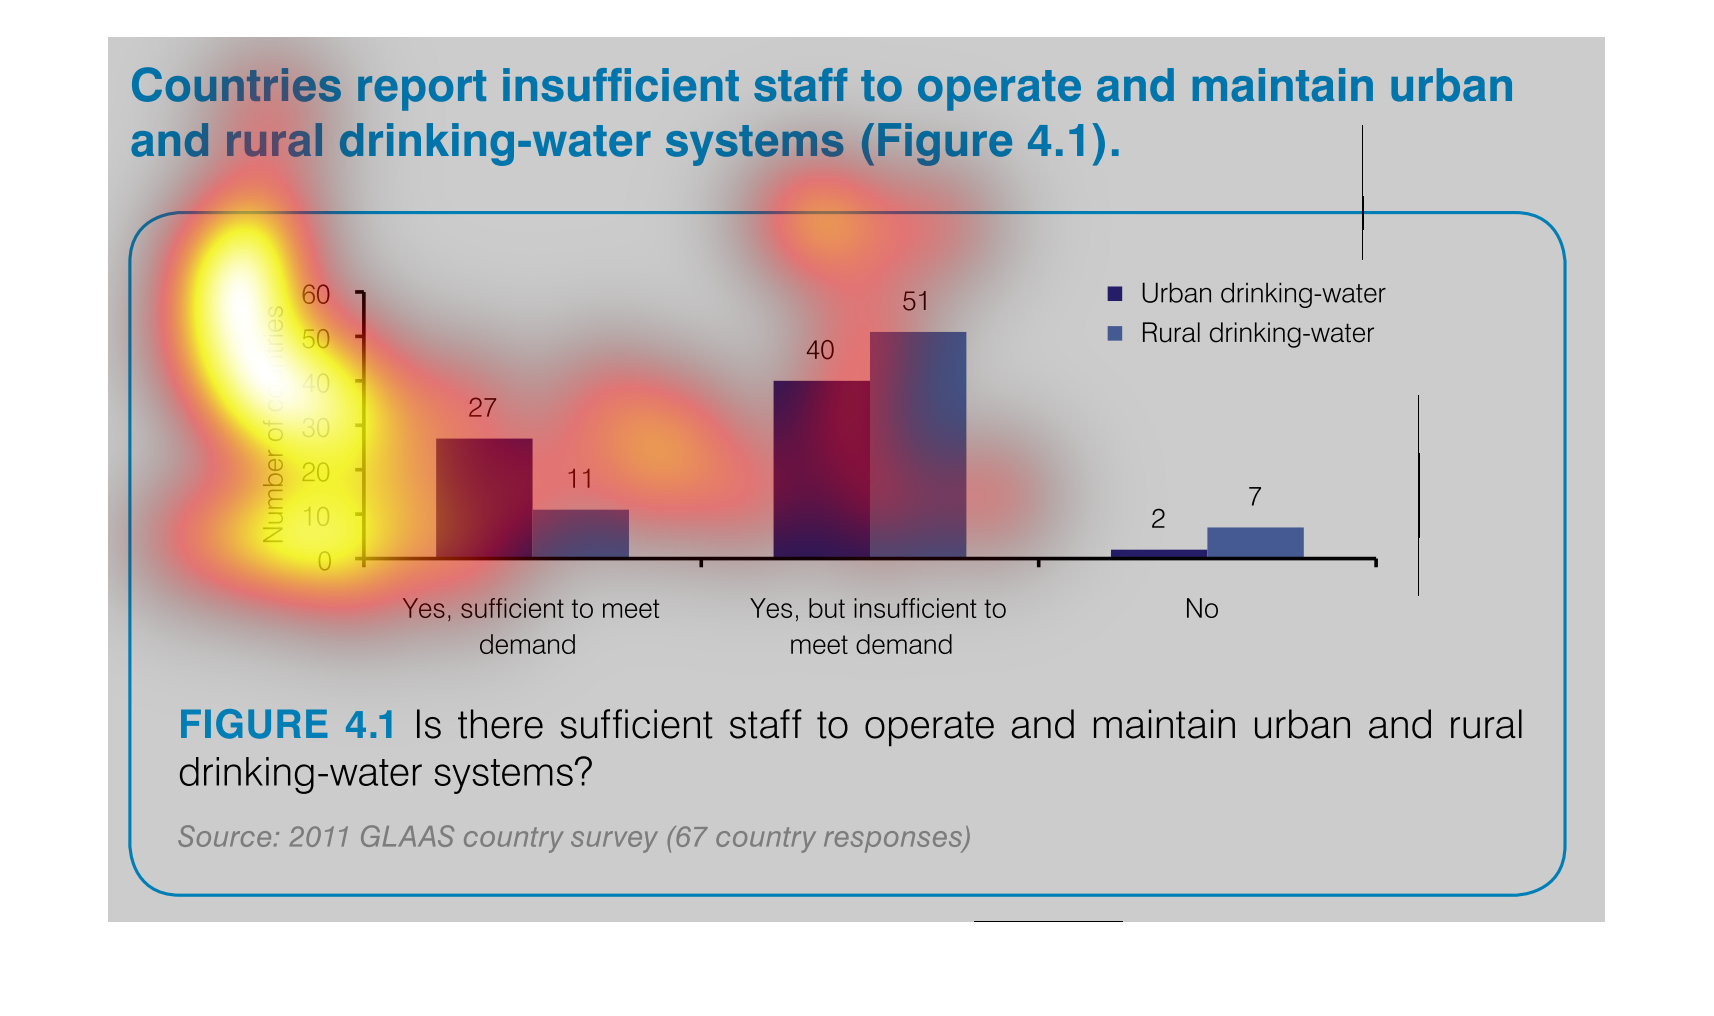
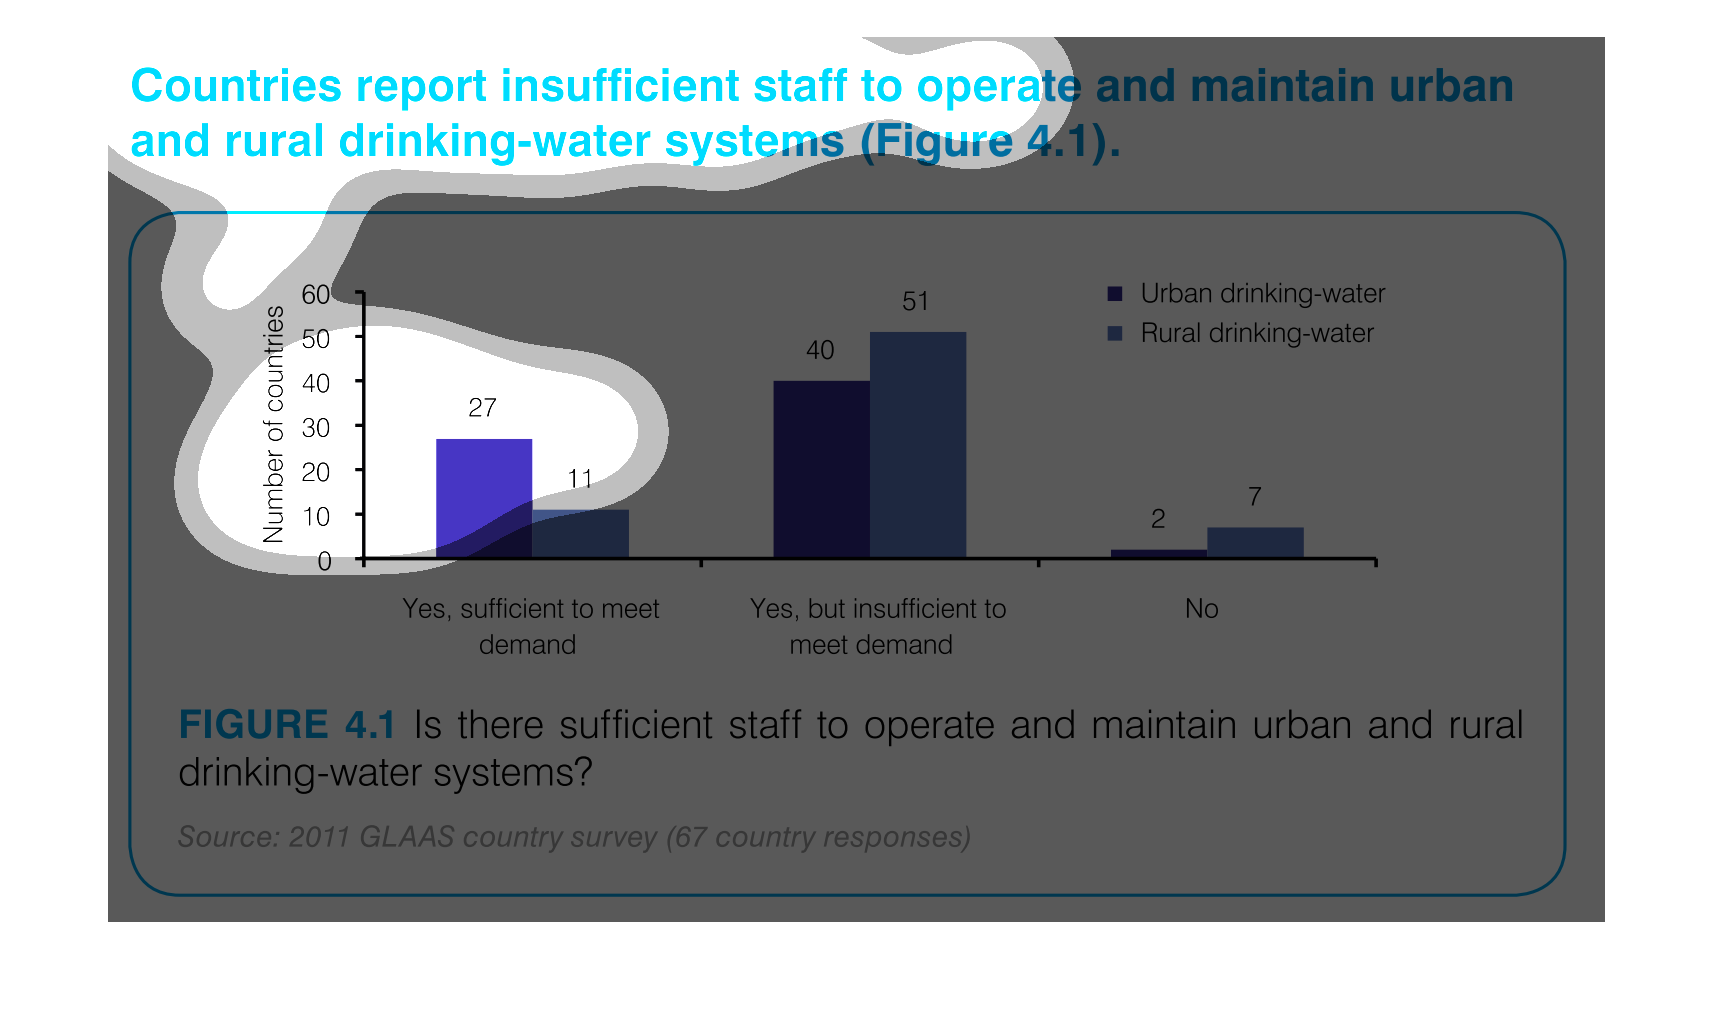
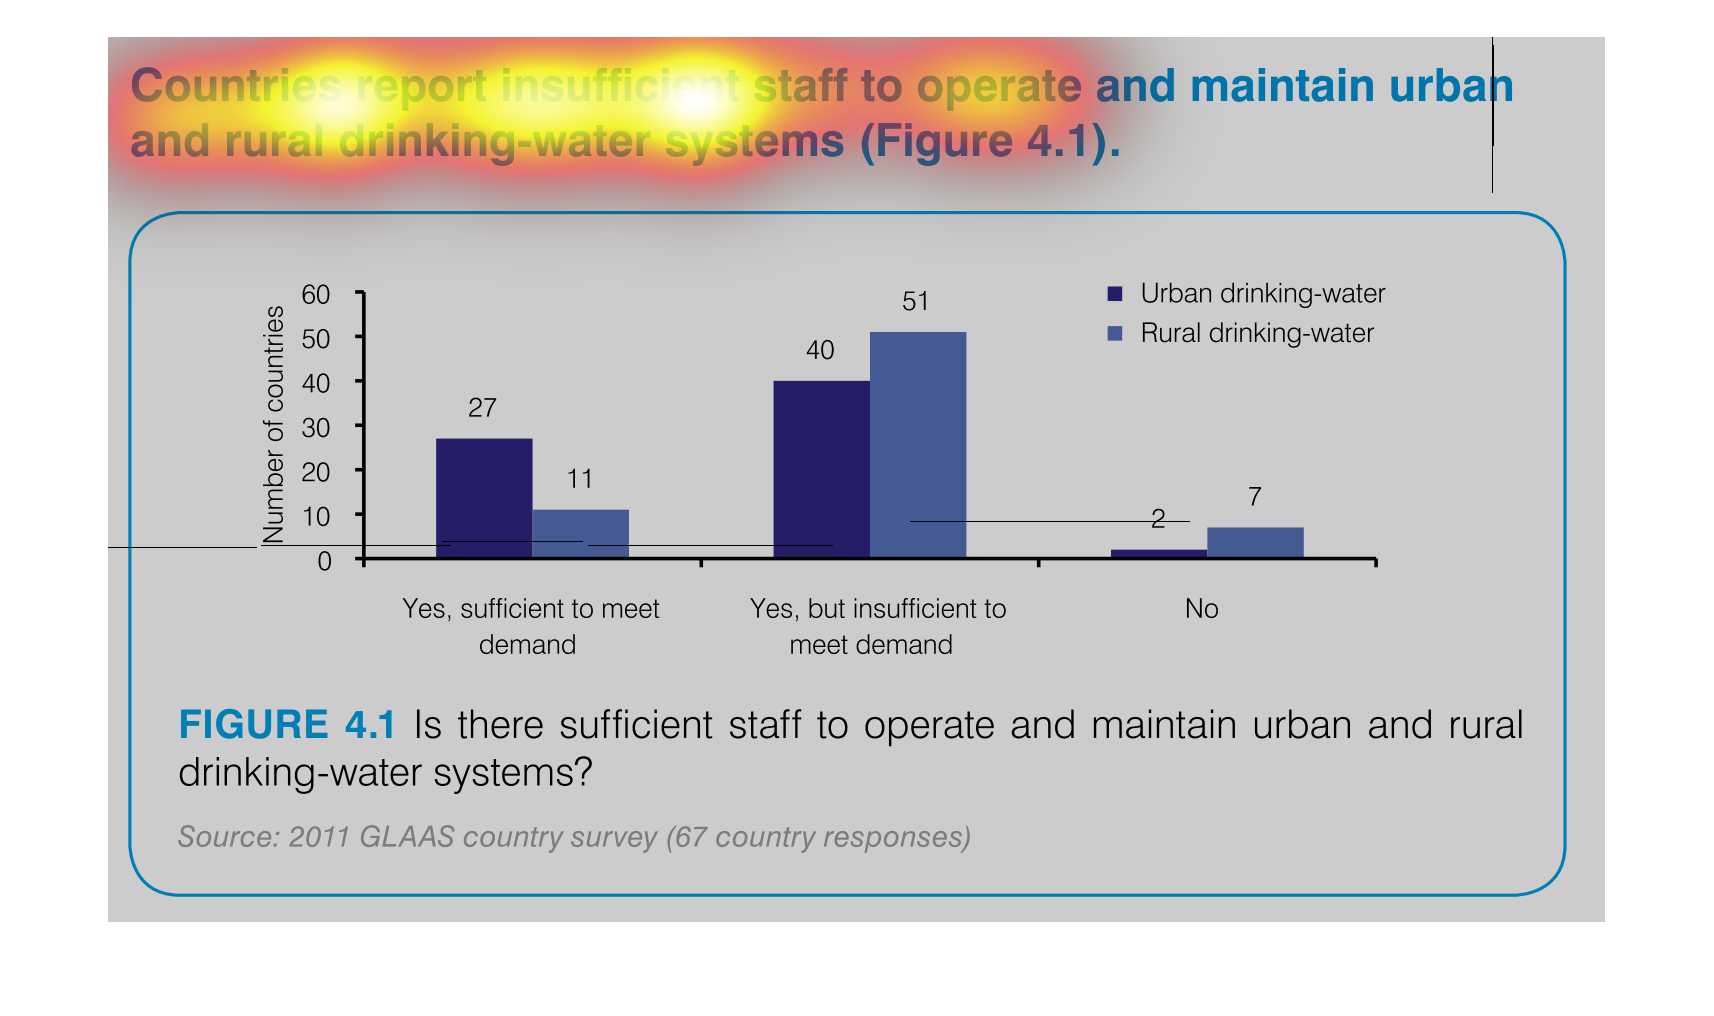
This graph illustrates countries that report insufficient staff to maintain rural drinking
water system.  The responses are yes, staff is sufficient to meet demand, yes but staff is
insufficient and no.
This is a graph that shows the extend to which various regions have reported insufficient
staff to operate and maintain urban and rural drinking water systems.
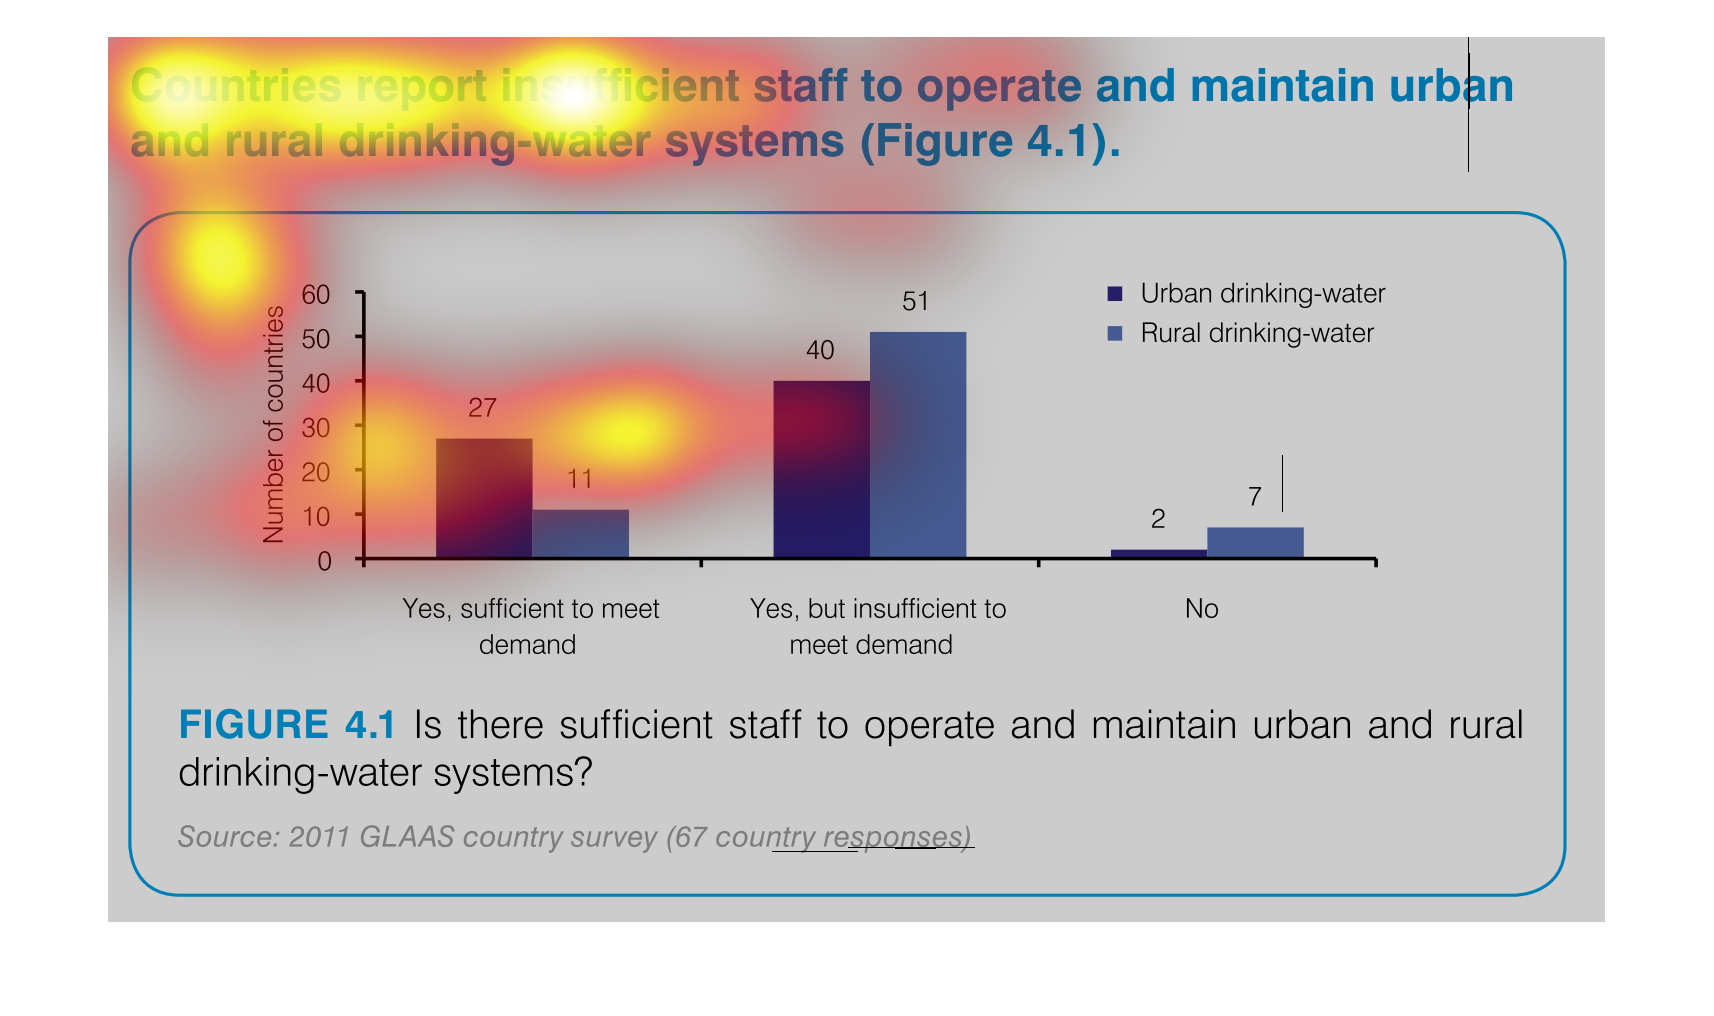
This chart describes countries report insufficient staff to operate and maintain urban and
rural drinking water systems. the chart is divided into two categories.
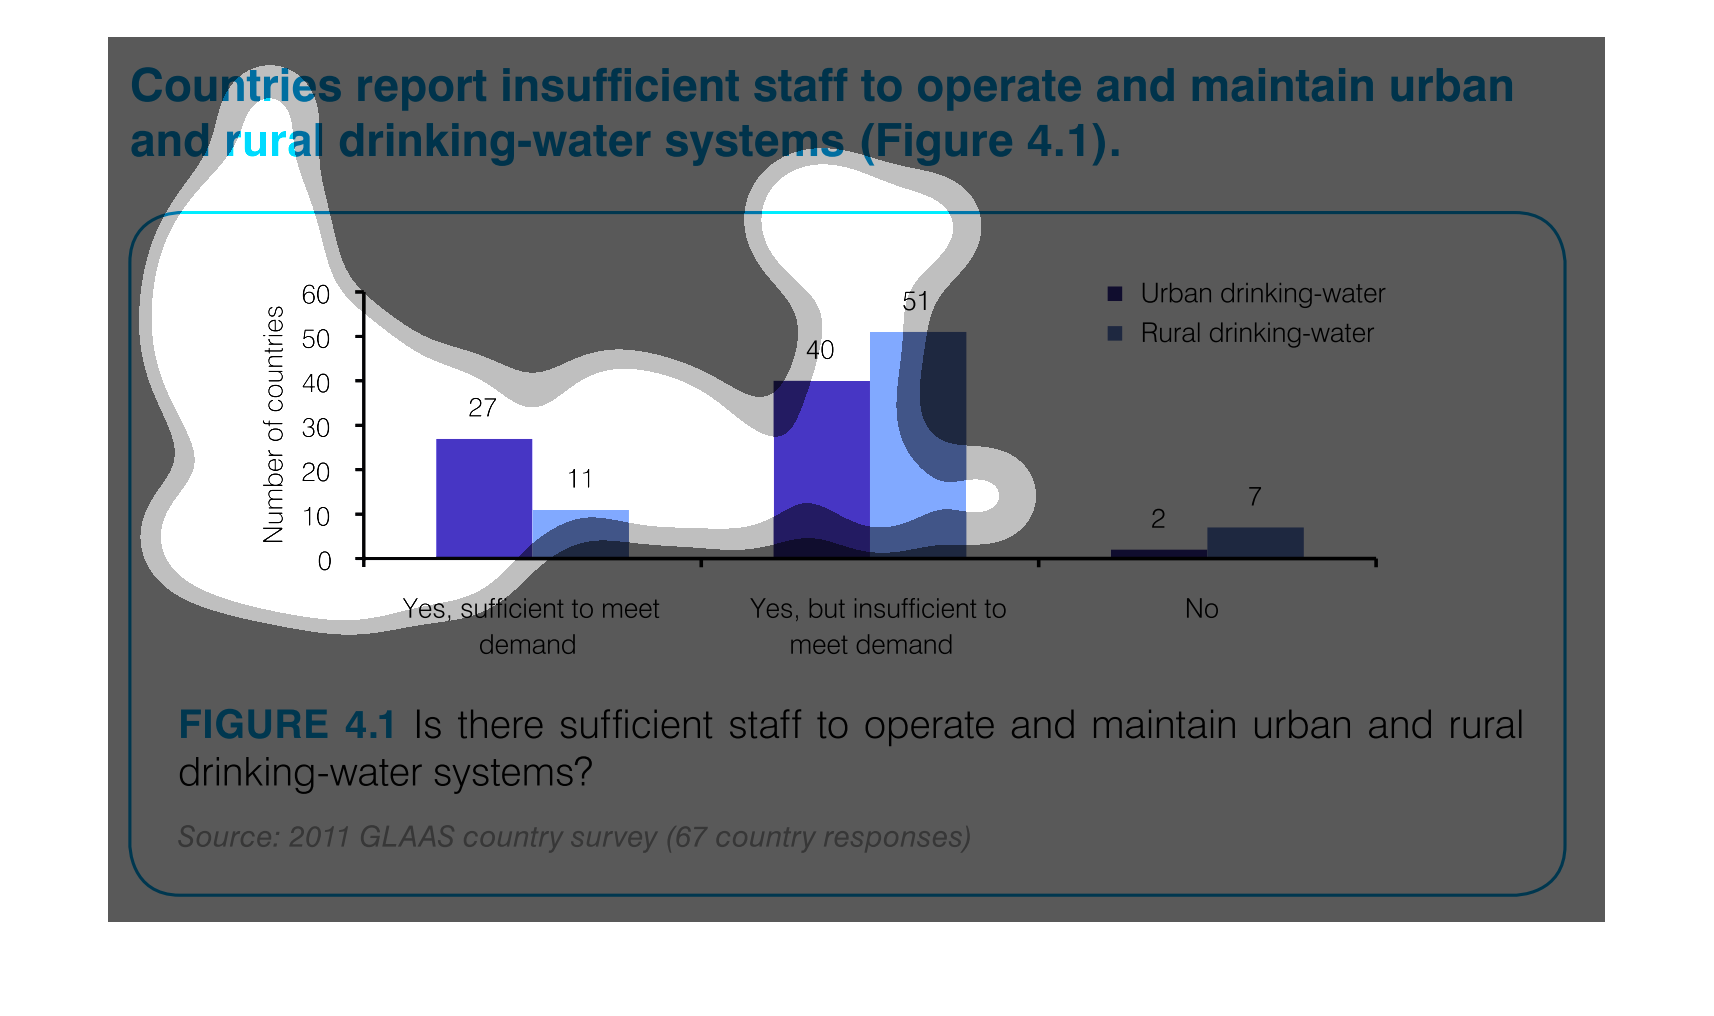
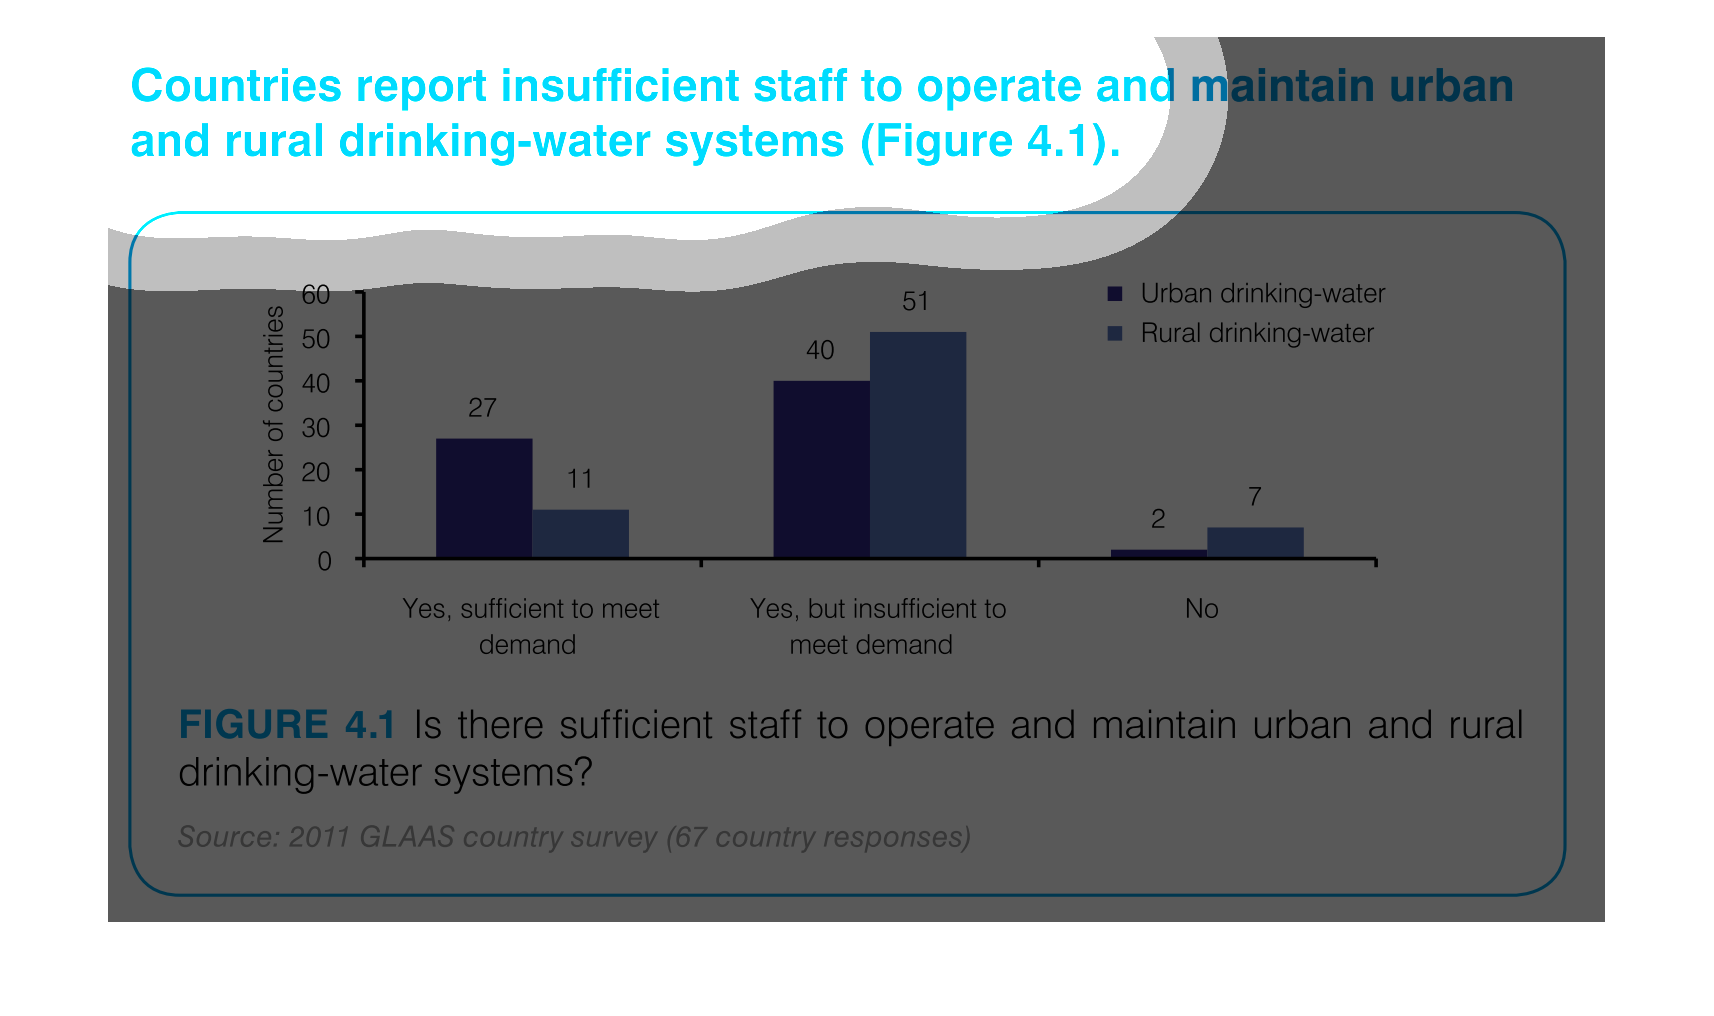
This graph depicts the results of a survey in urban and rural settings, asking whether there
are sufficient drinking water in the respective settings.
This chart describes that countries report insufficient staff to operate and maintain urban
and rural drinking-water systems. Areas include Yes, sufficient to meet demand.
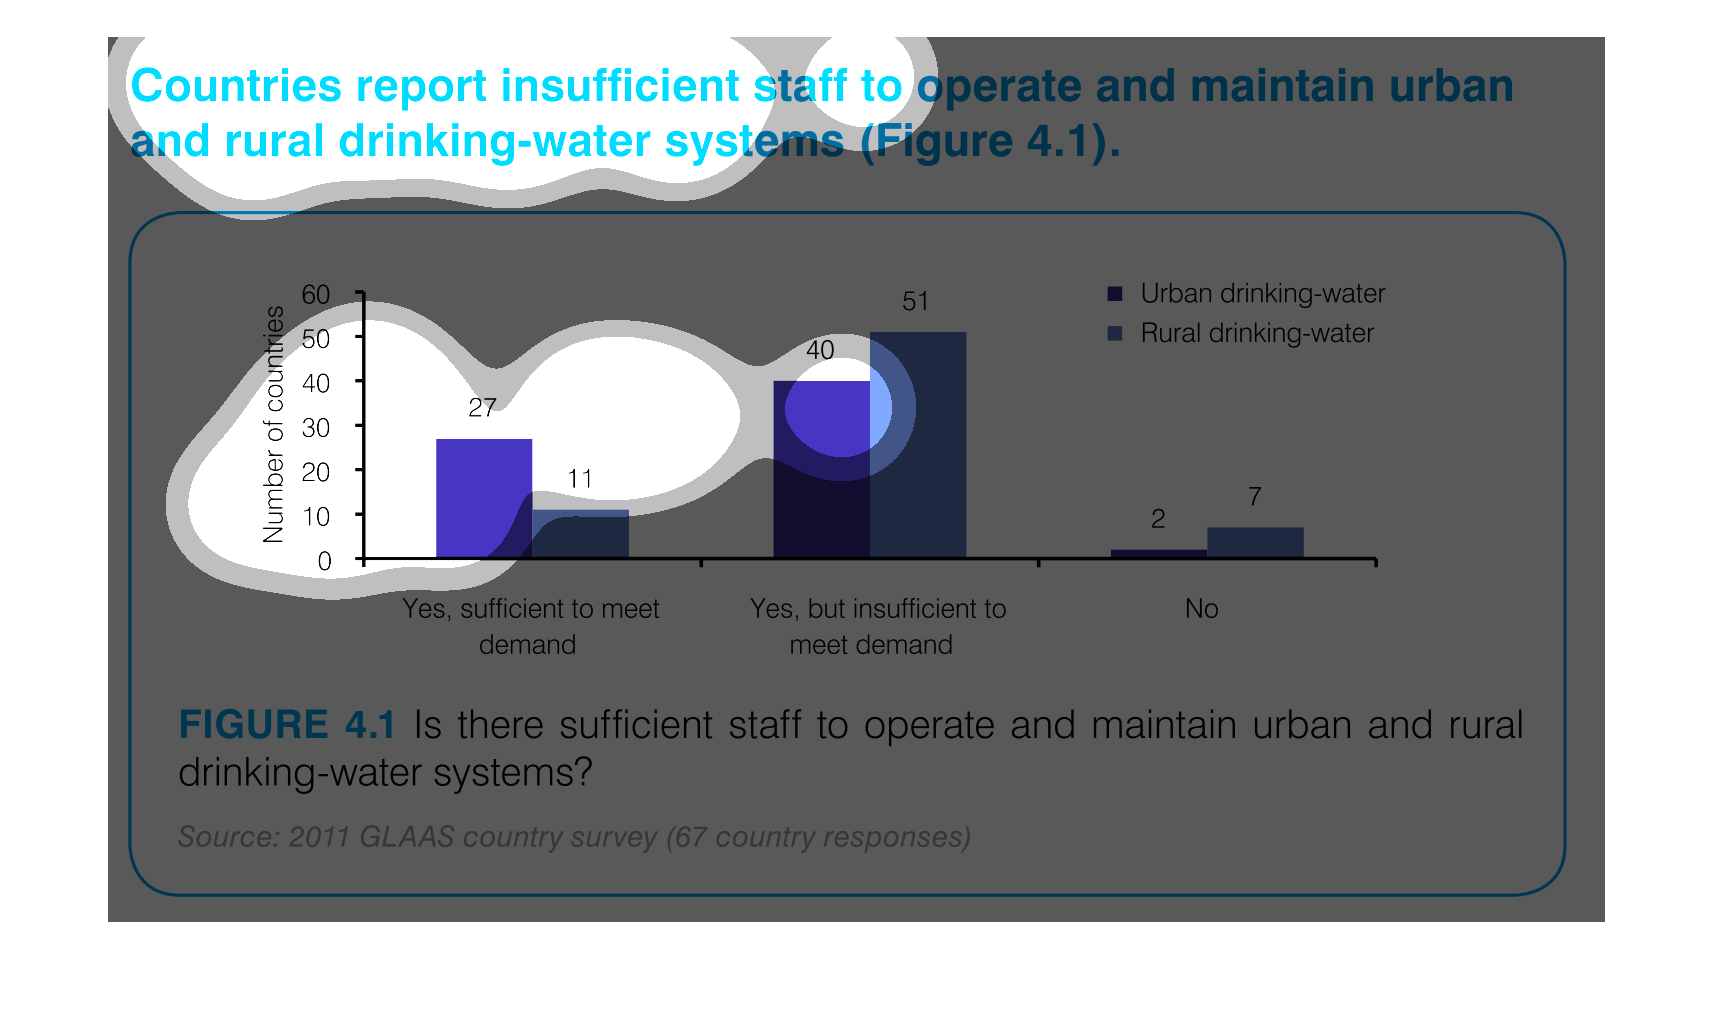
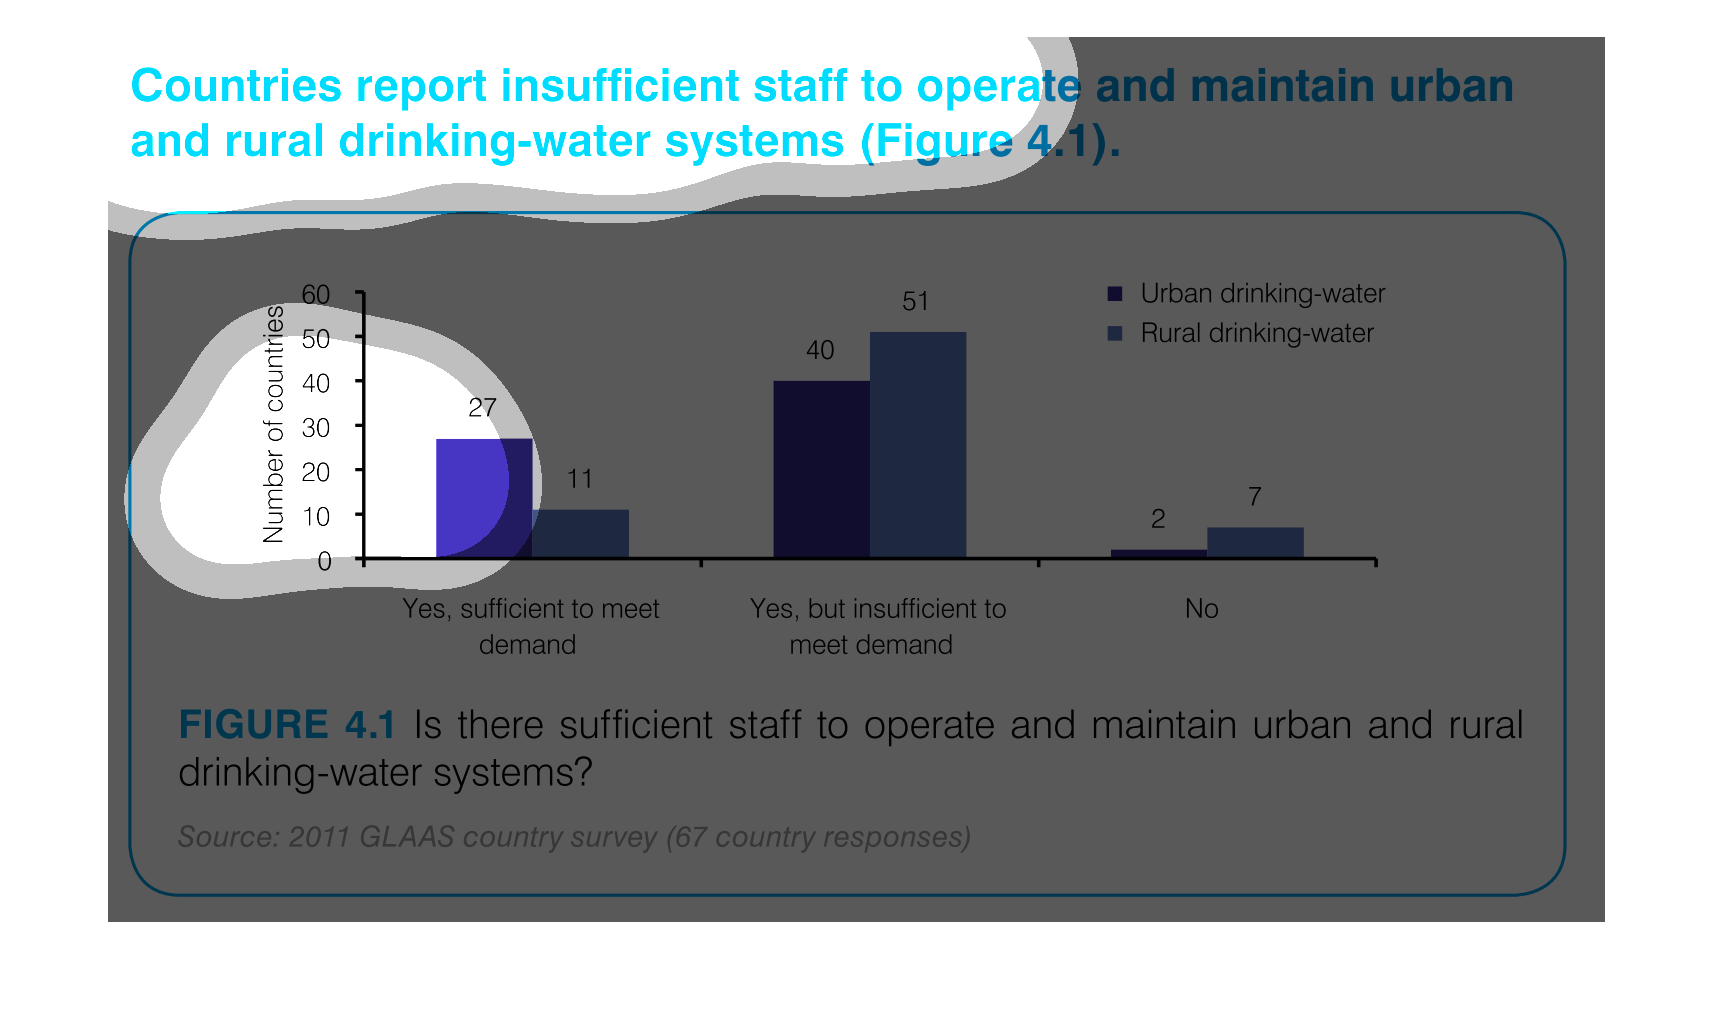
This graph depicts the number of countries able to maintain safe drinking-water systems. which
are not able, and which are not able due to too high of a demand.
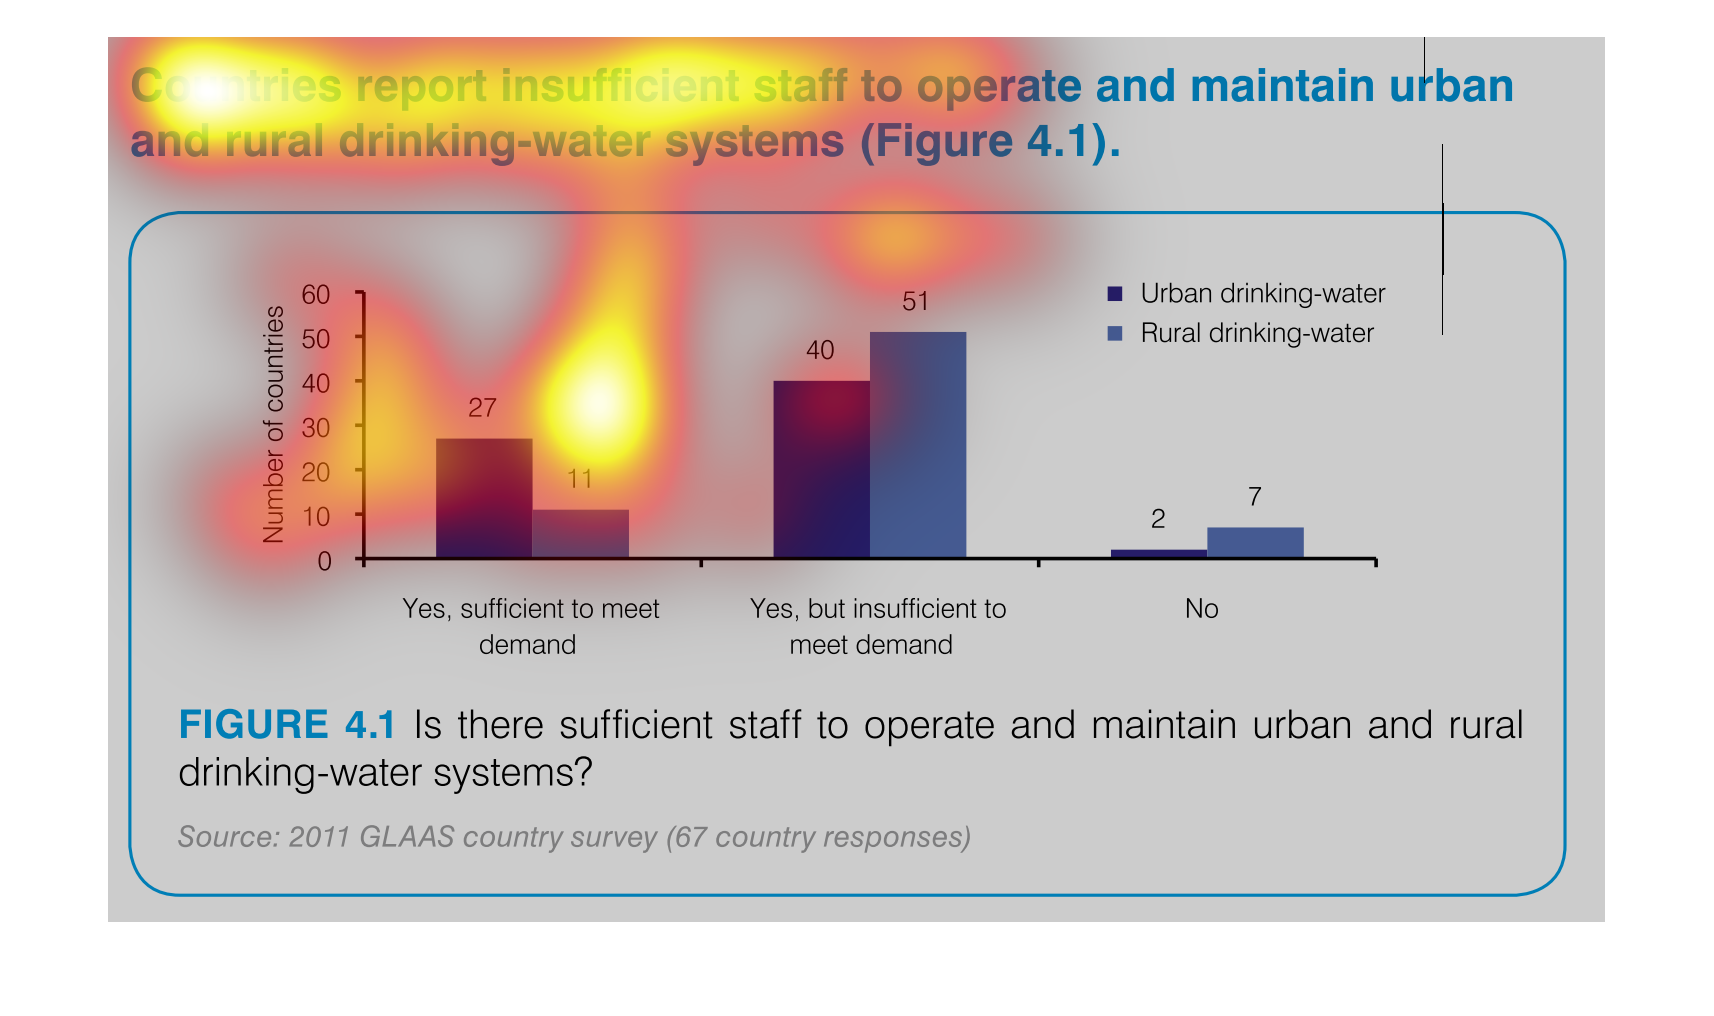
This handmade chart shows how most people in this country or region (not sure since not specified)
do not think the public water supply is adequately staffed
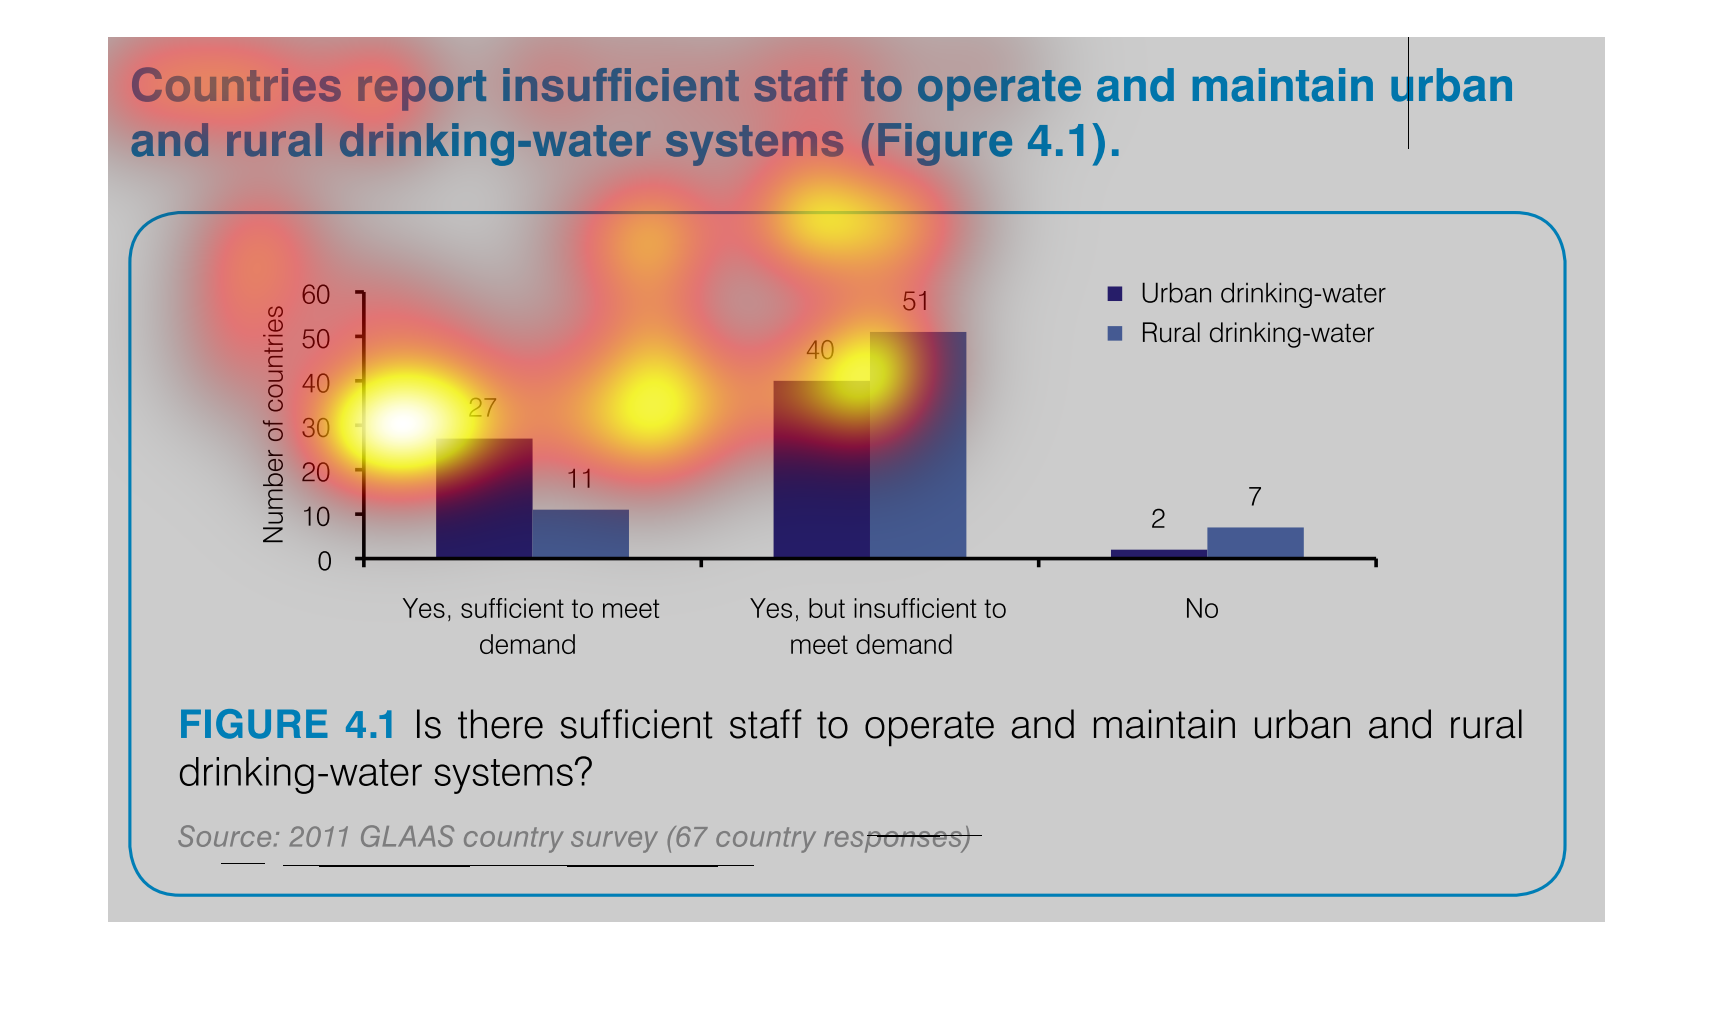
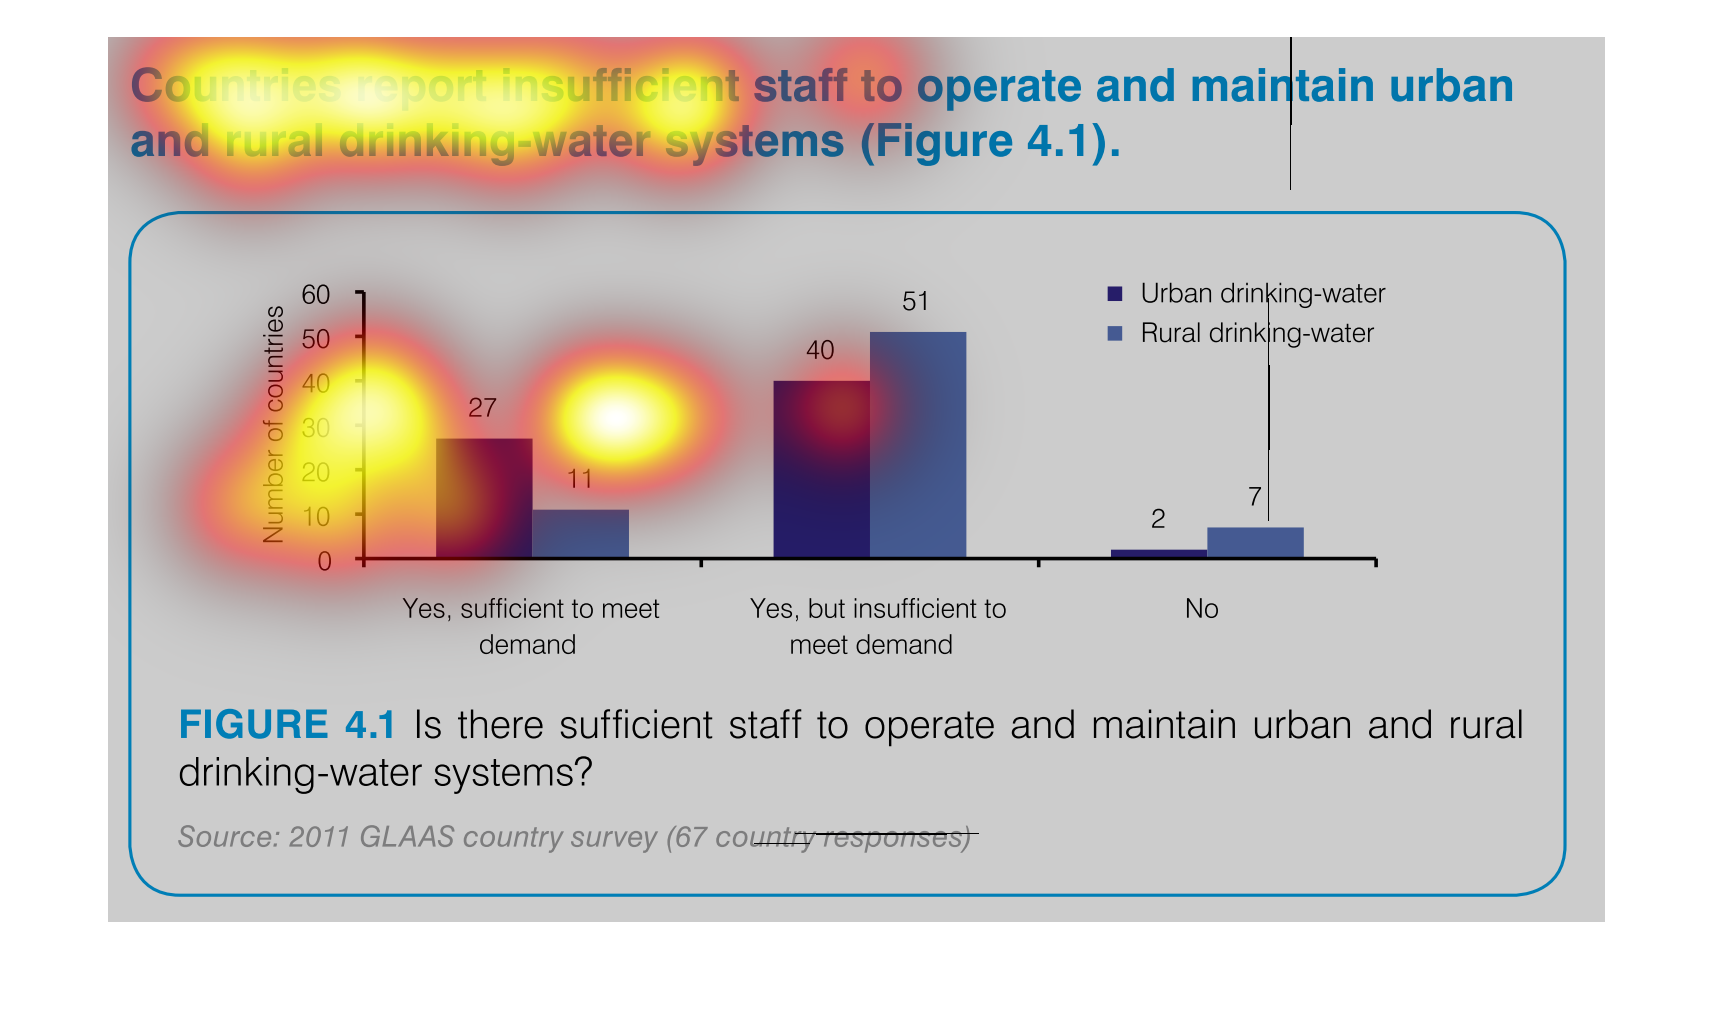
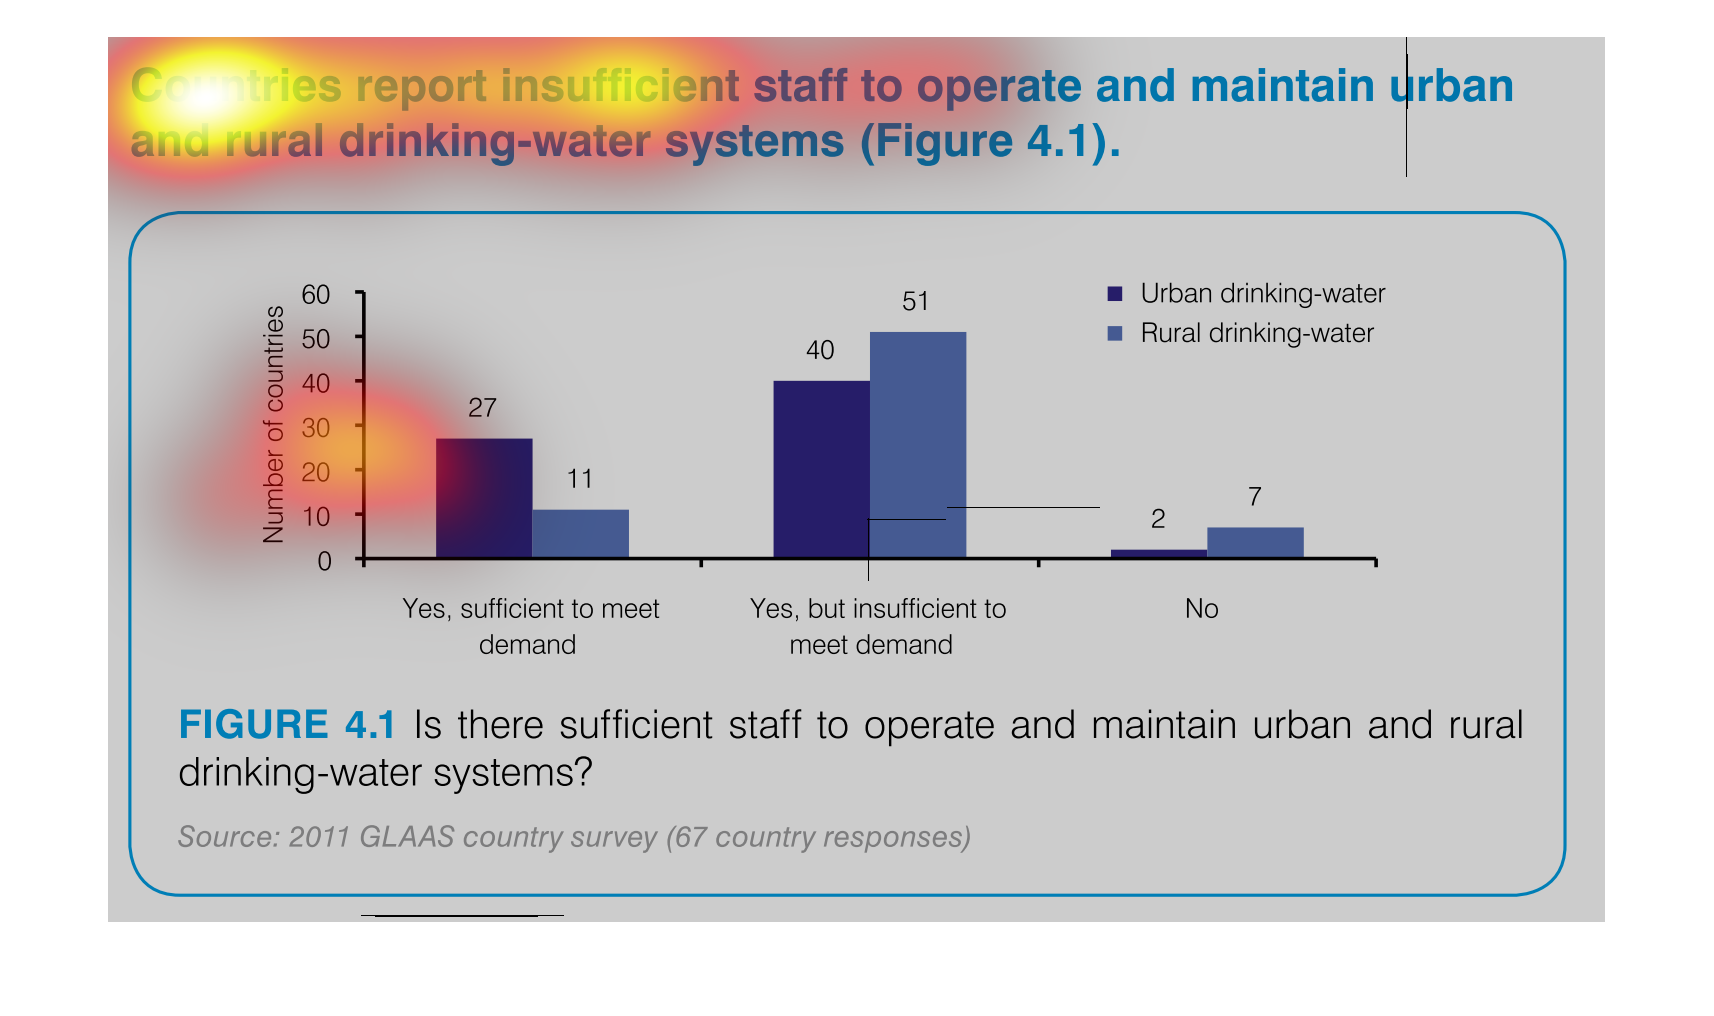
Countries reporting insufficient staff to operate and maintain urban and rural drinking water
systems.  The bar graph indicates while there is a sufficient number of staff to operate and
maintain, the majority of countries are reporting there isn't enough to meet demand.
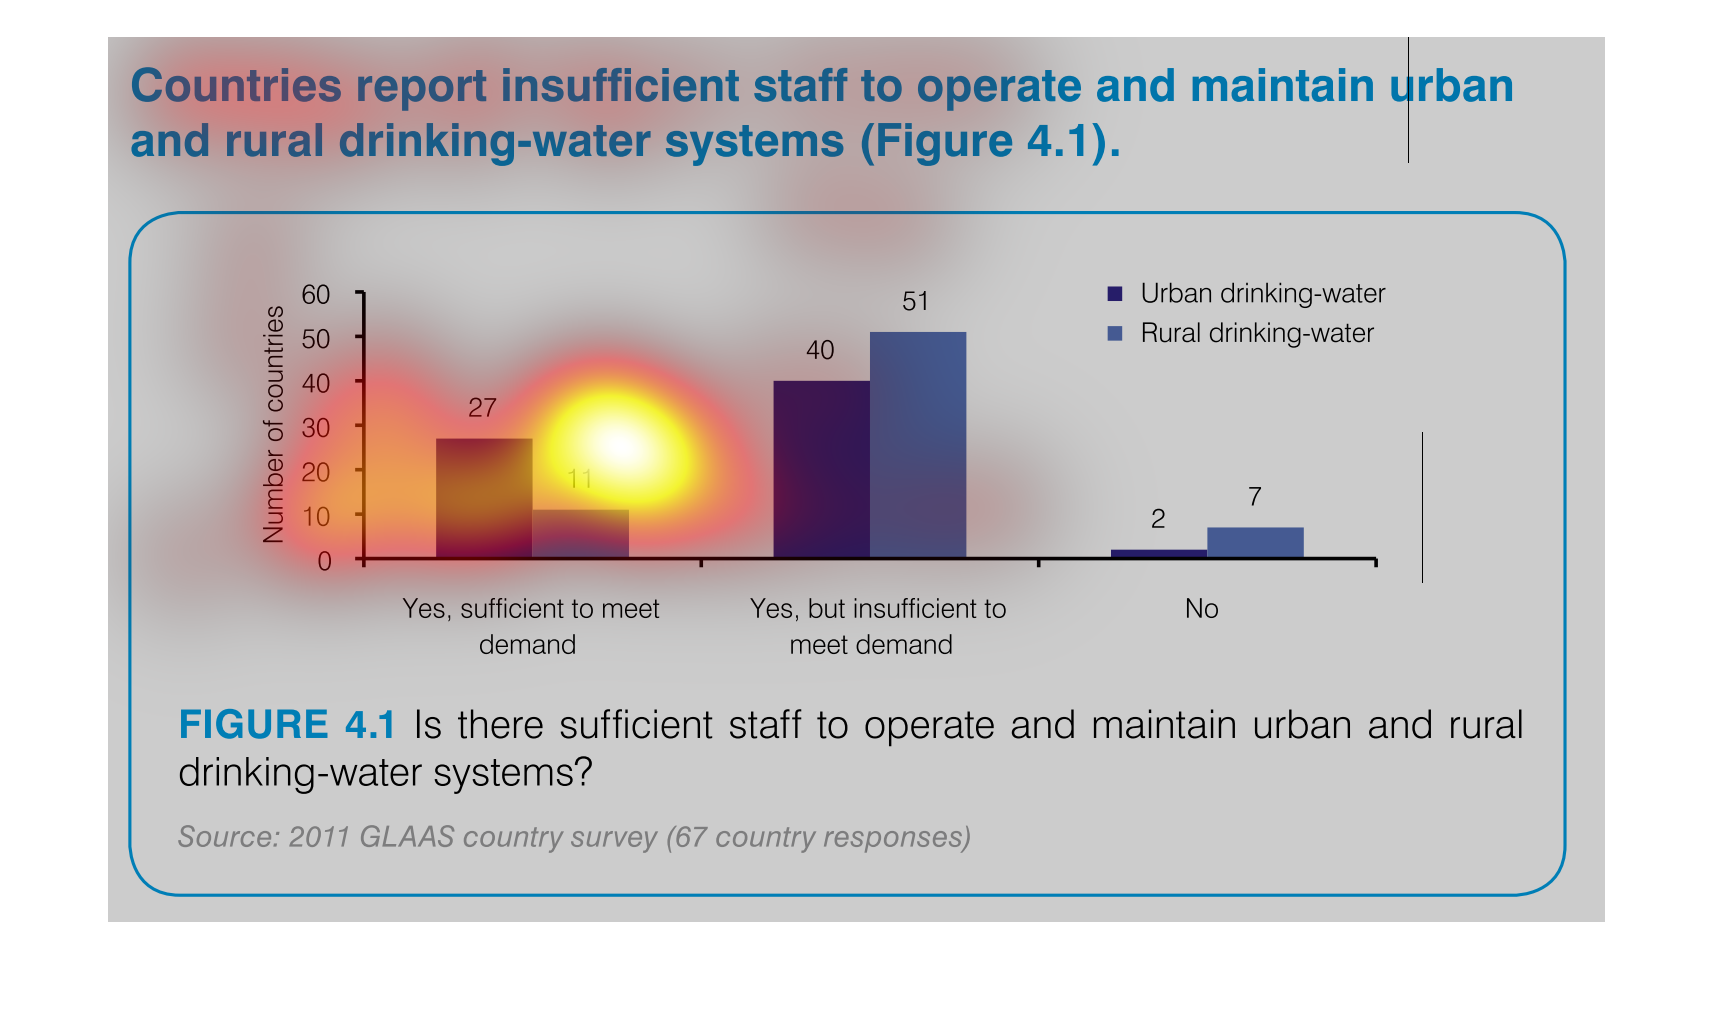
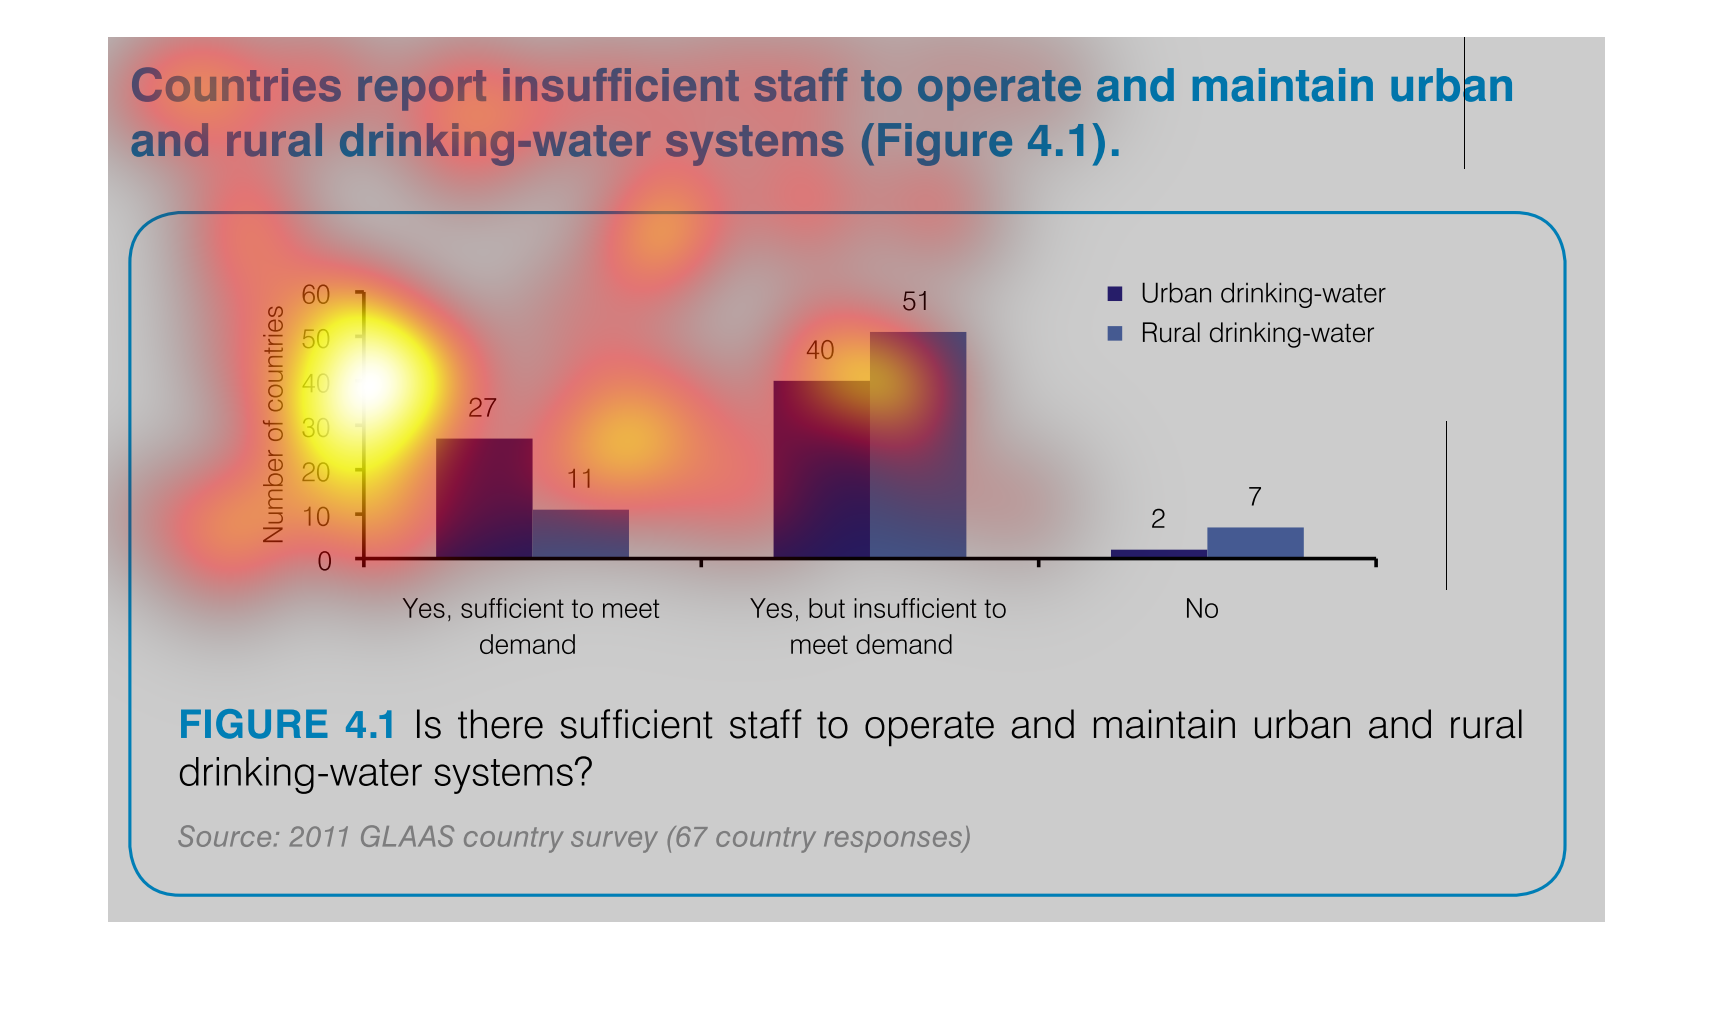
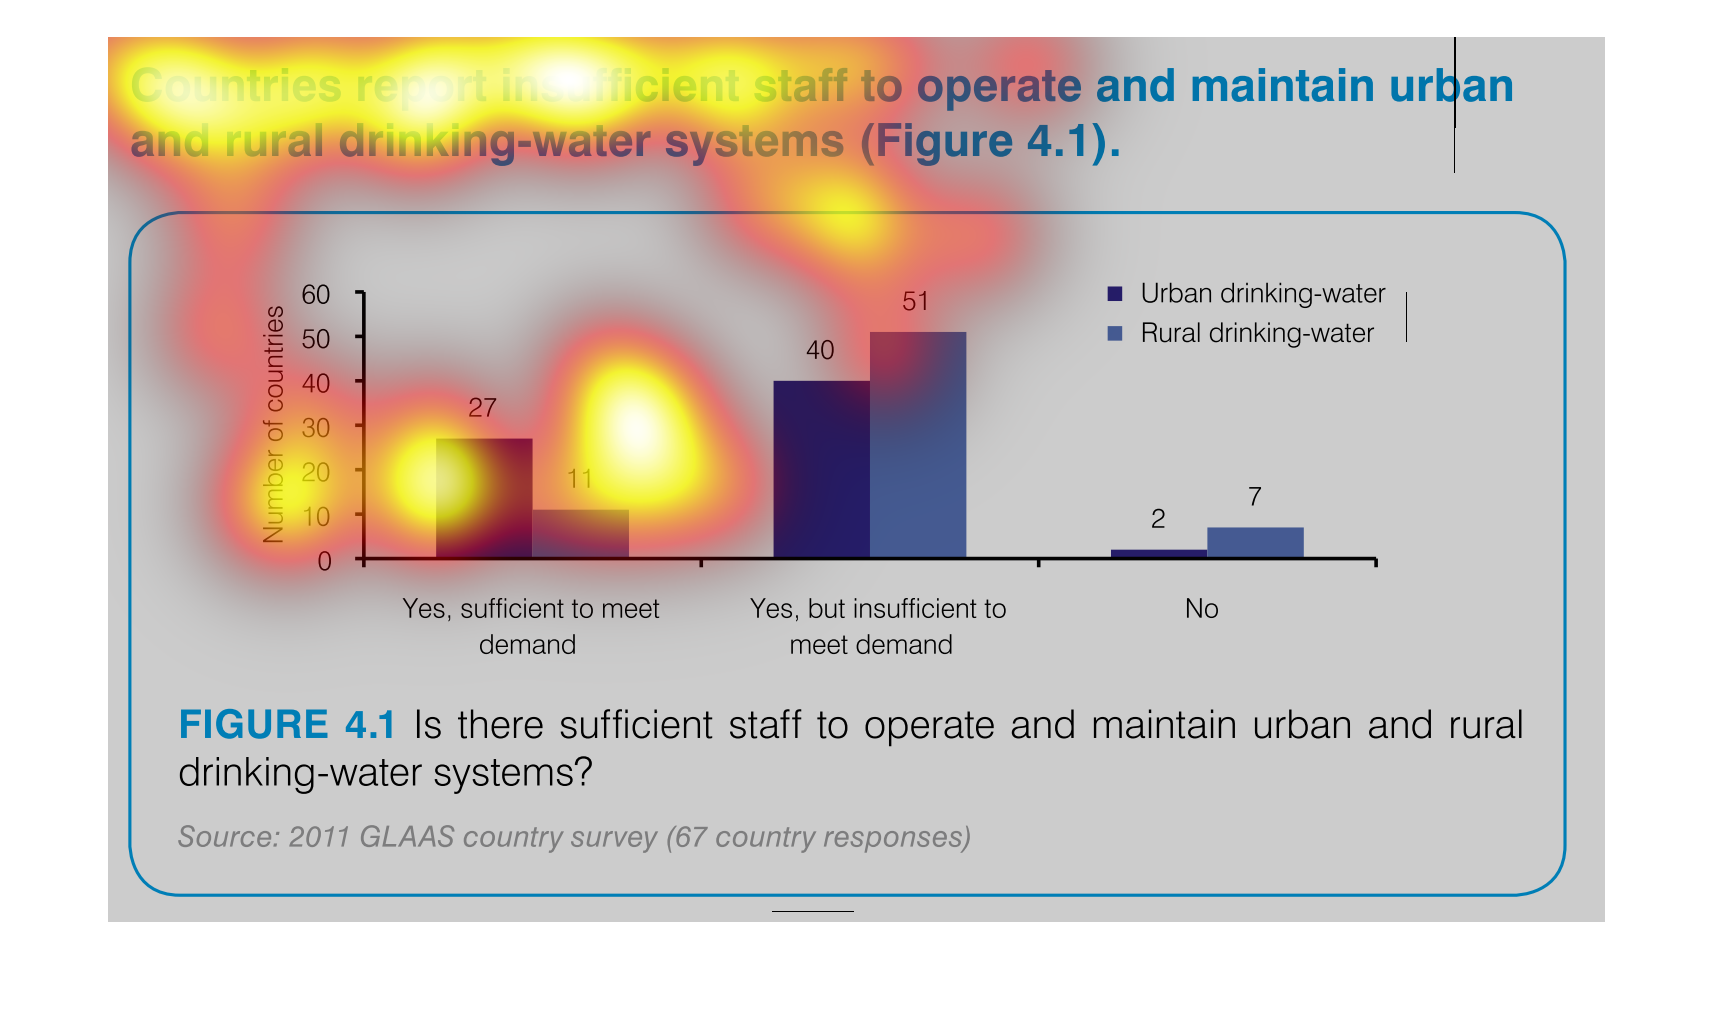
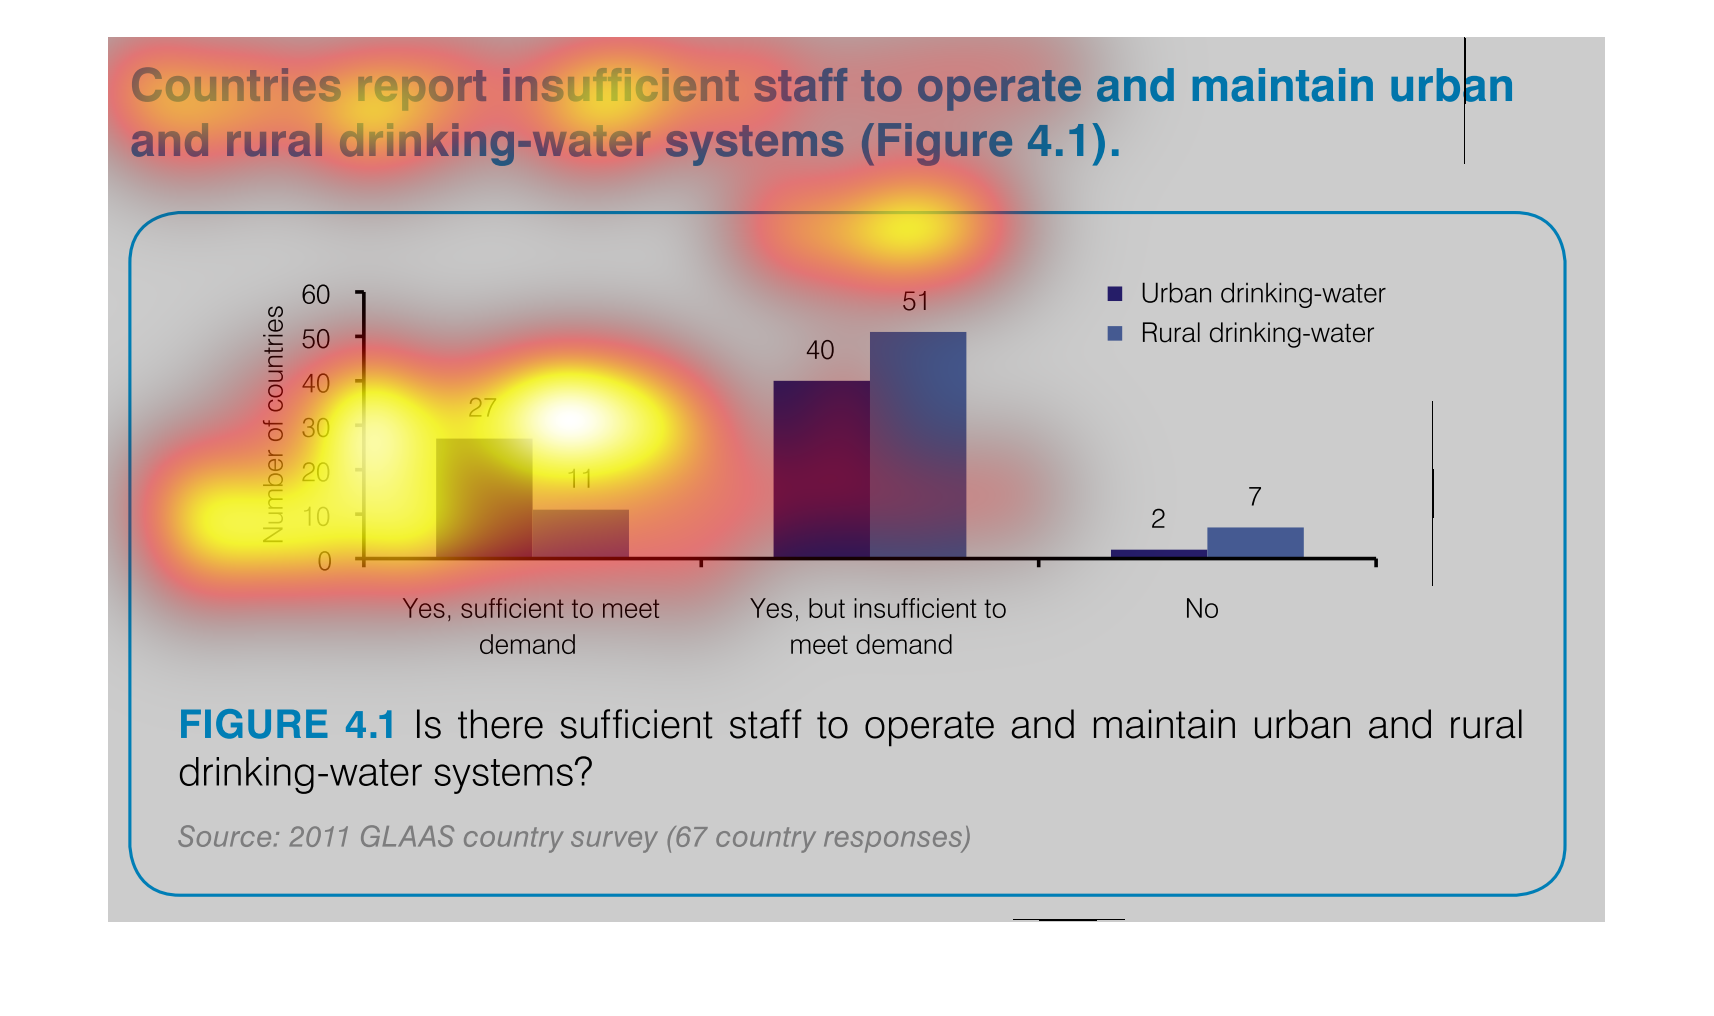
This chart measures countries with insufficient staff to maintain and operate  urban and rural
drinking water.  The bar graph has number of countries on one side with increments of 10 as
the measurement and the other measurement is "yes, sufficient..." , "yes, but insufficient..."
"and "no".