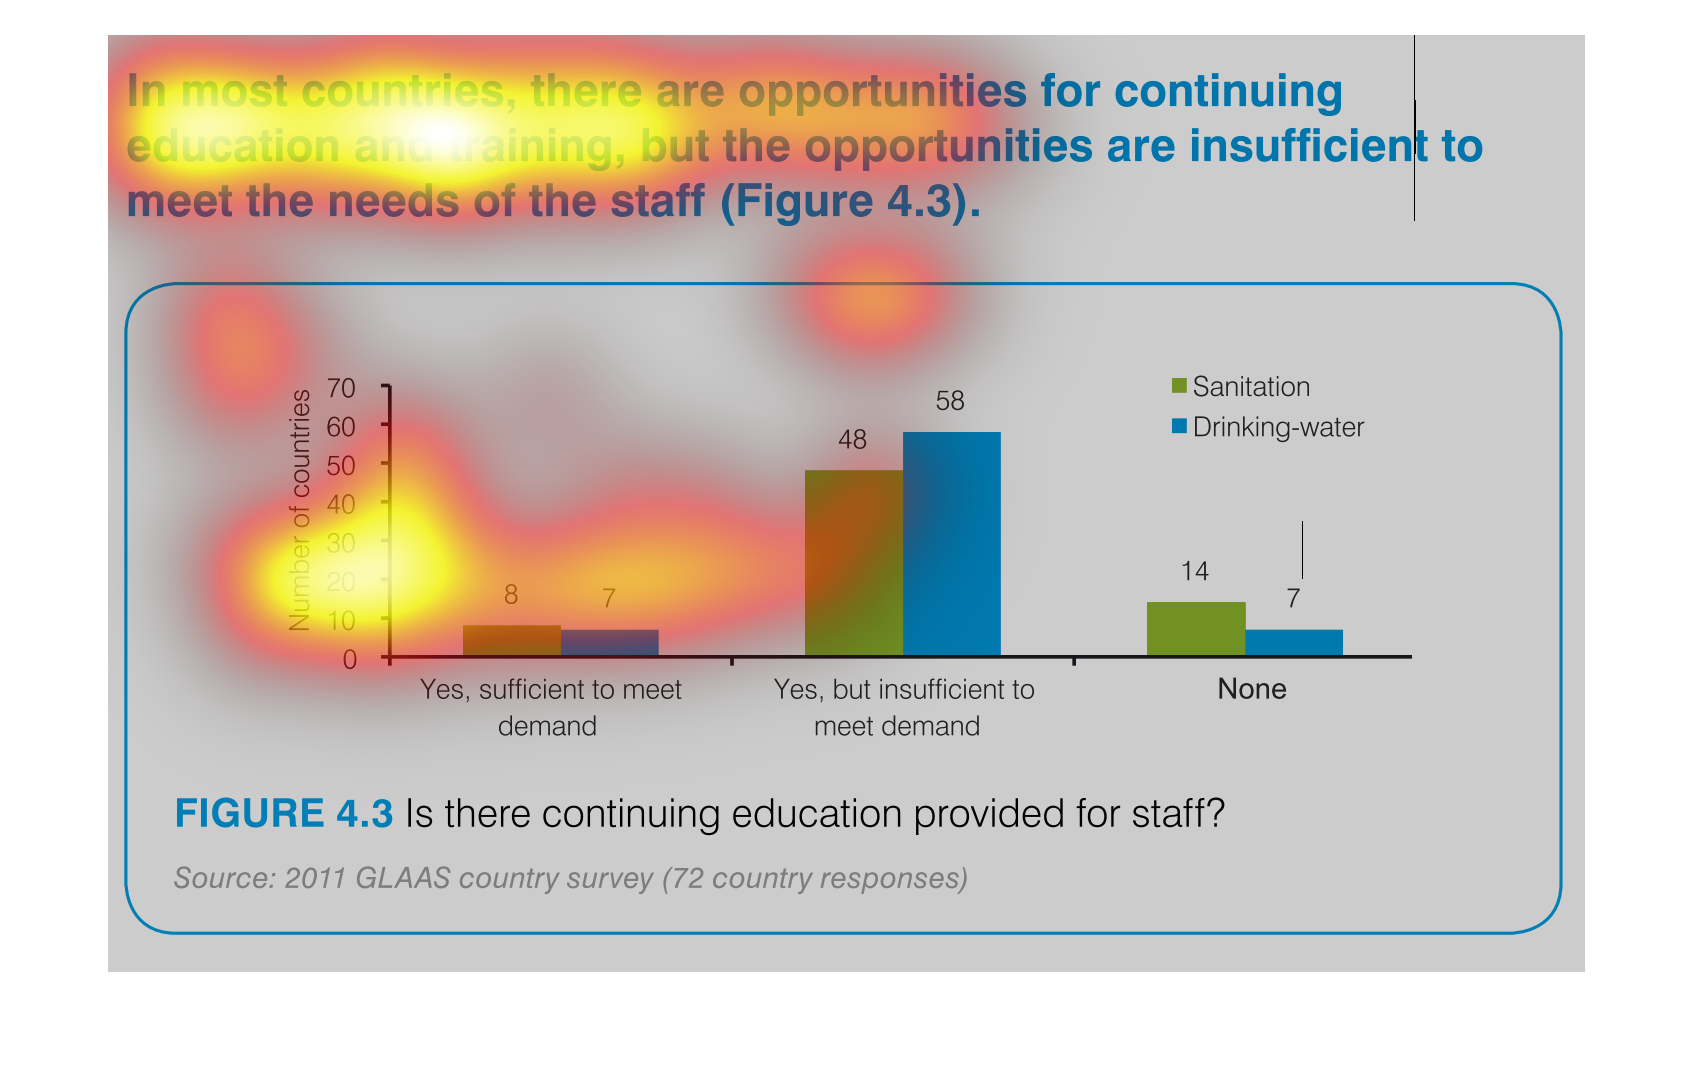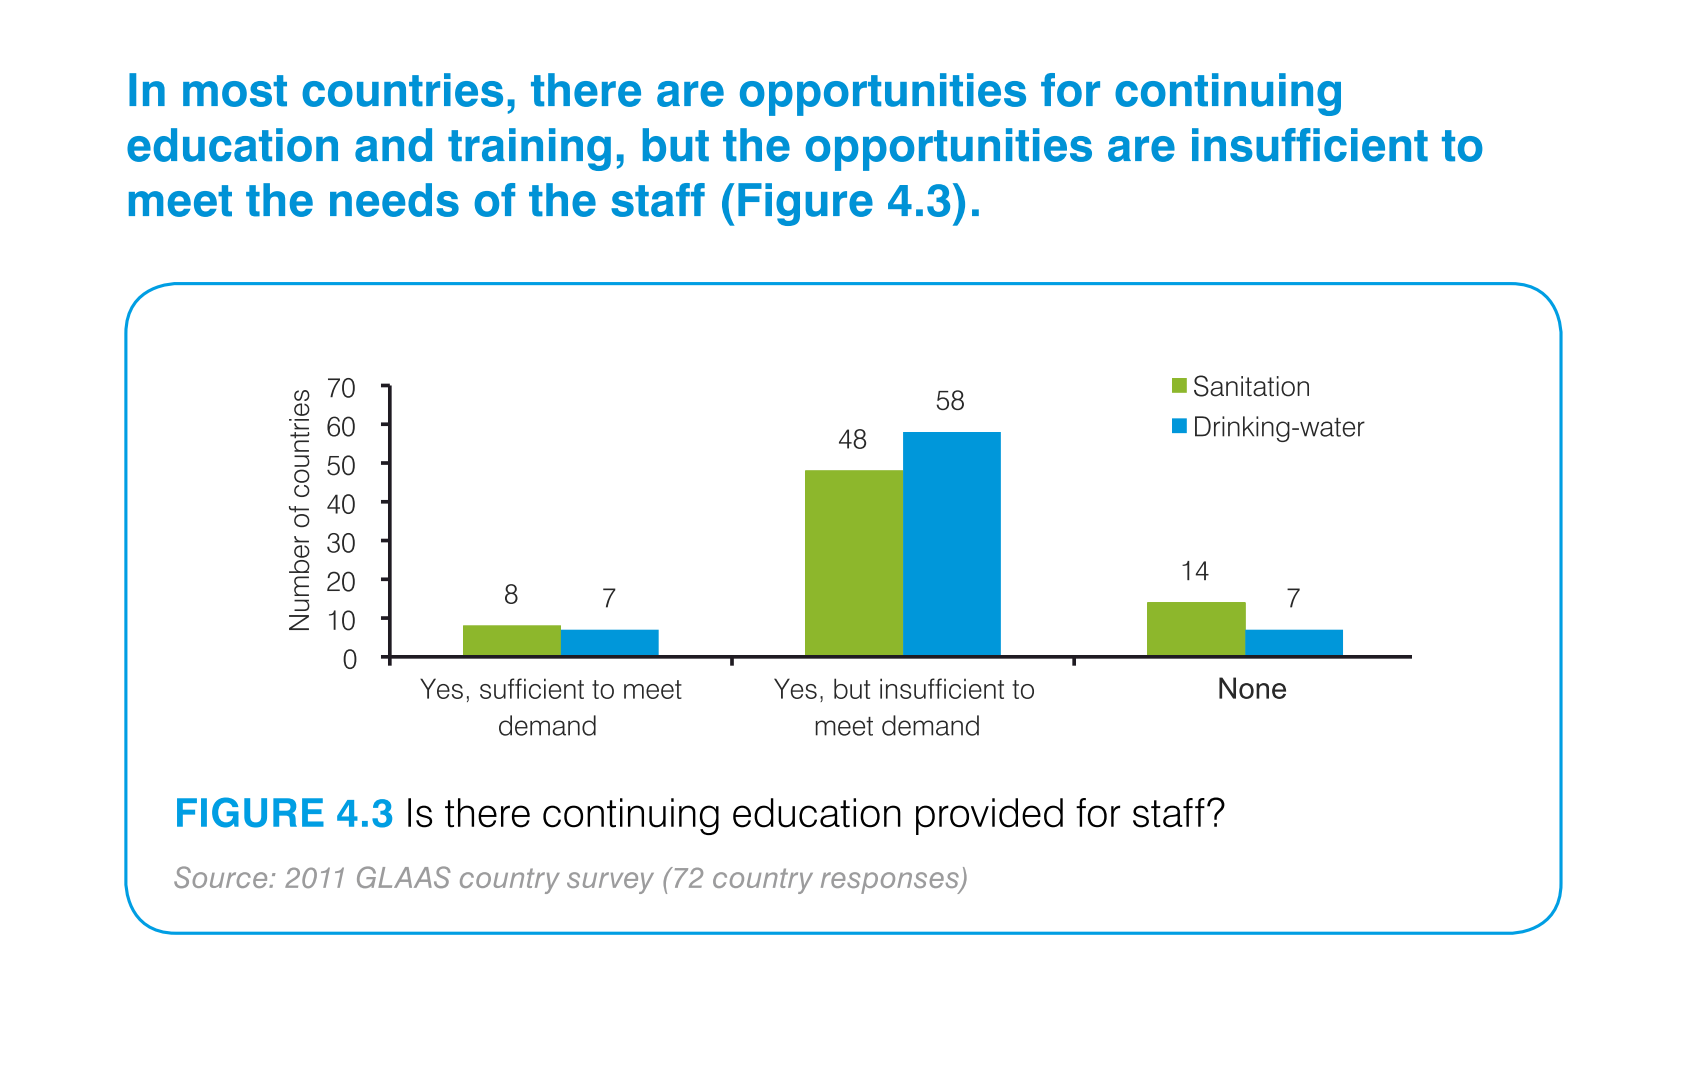
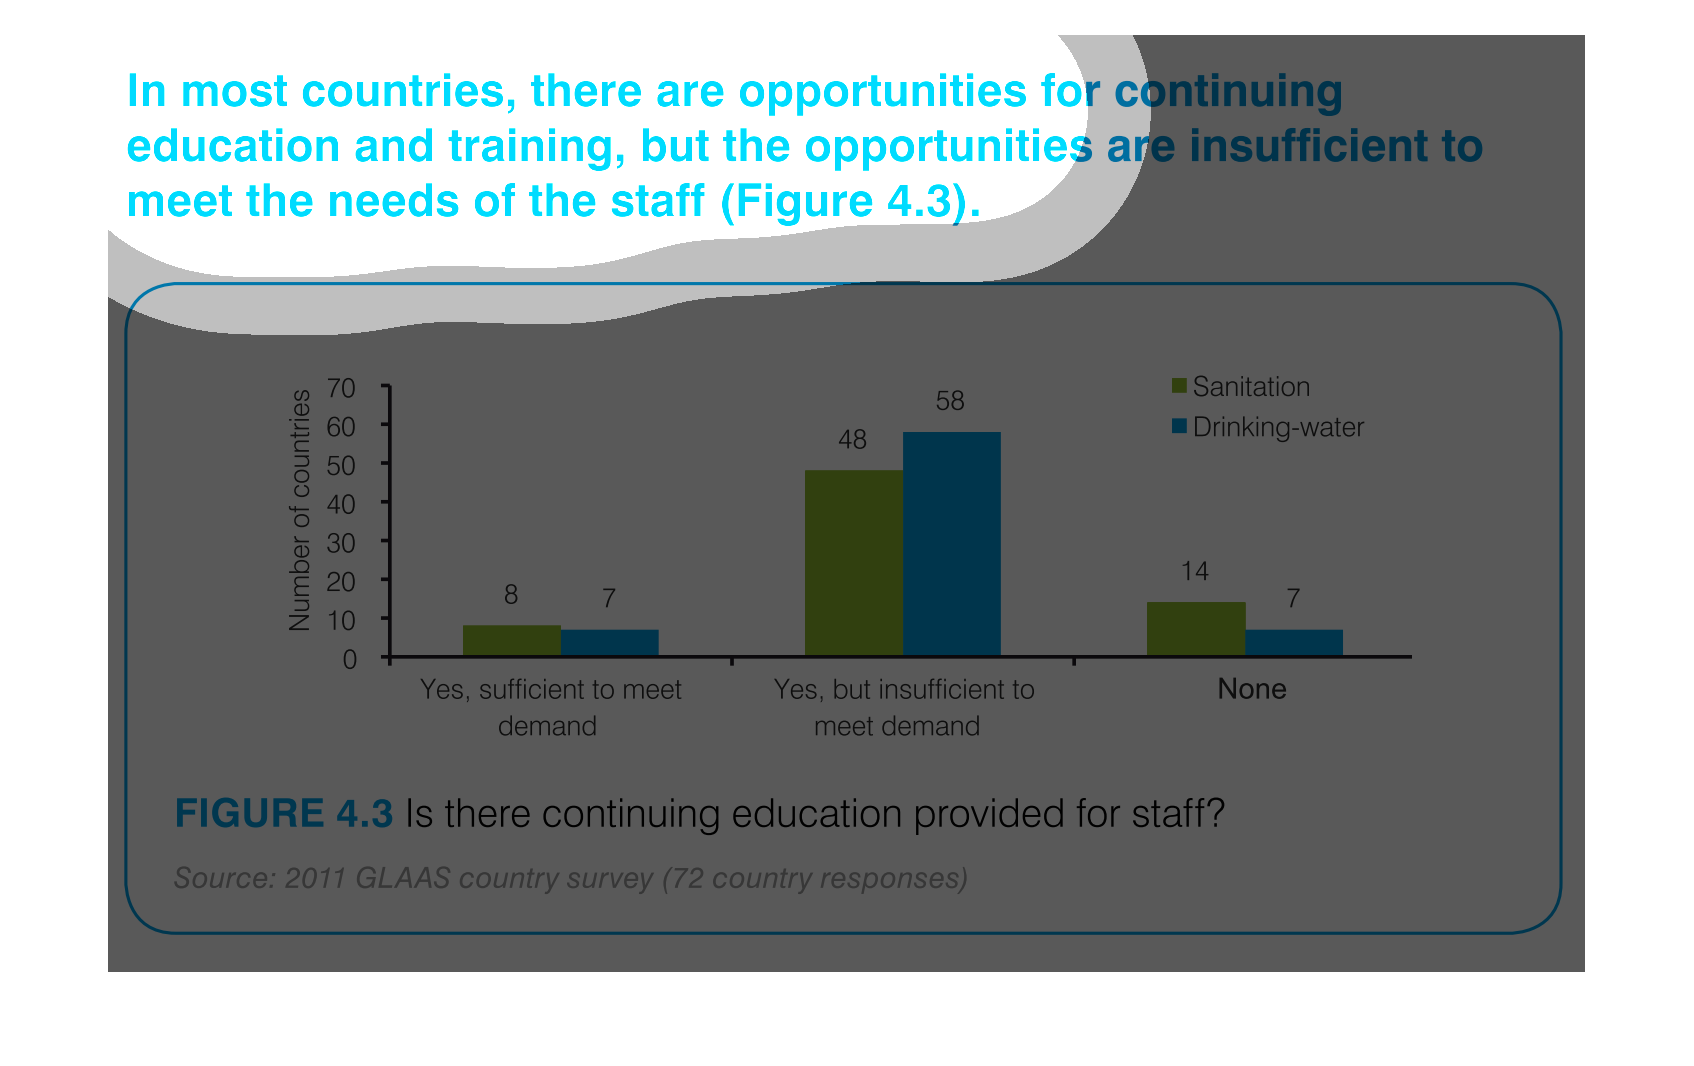
This chart describes that in most countries, there are opportunities for continuing education
and training, but the opportunities are insufficient to meet the needs of the staff.
this is a chart showing people who drink some kind of drinks and what people are mostly buying
also i think it may be about drinking water to is the water clean enough
This chart describes that in most countries, there are opportunities for continuing education
and training, but the opportunities are insufficient to meet the needs of the staff.
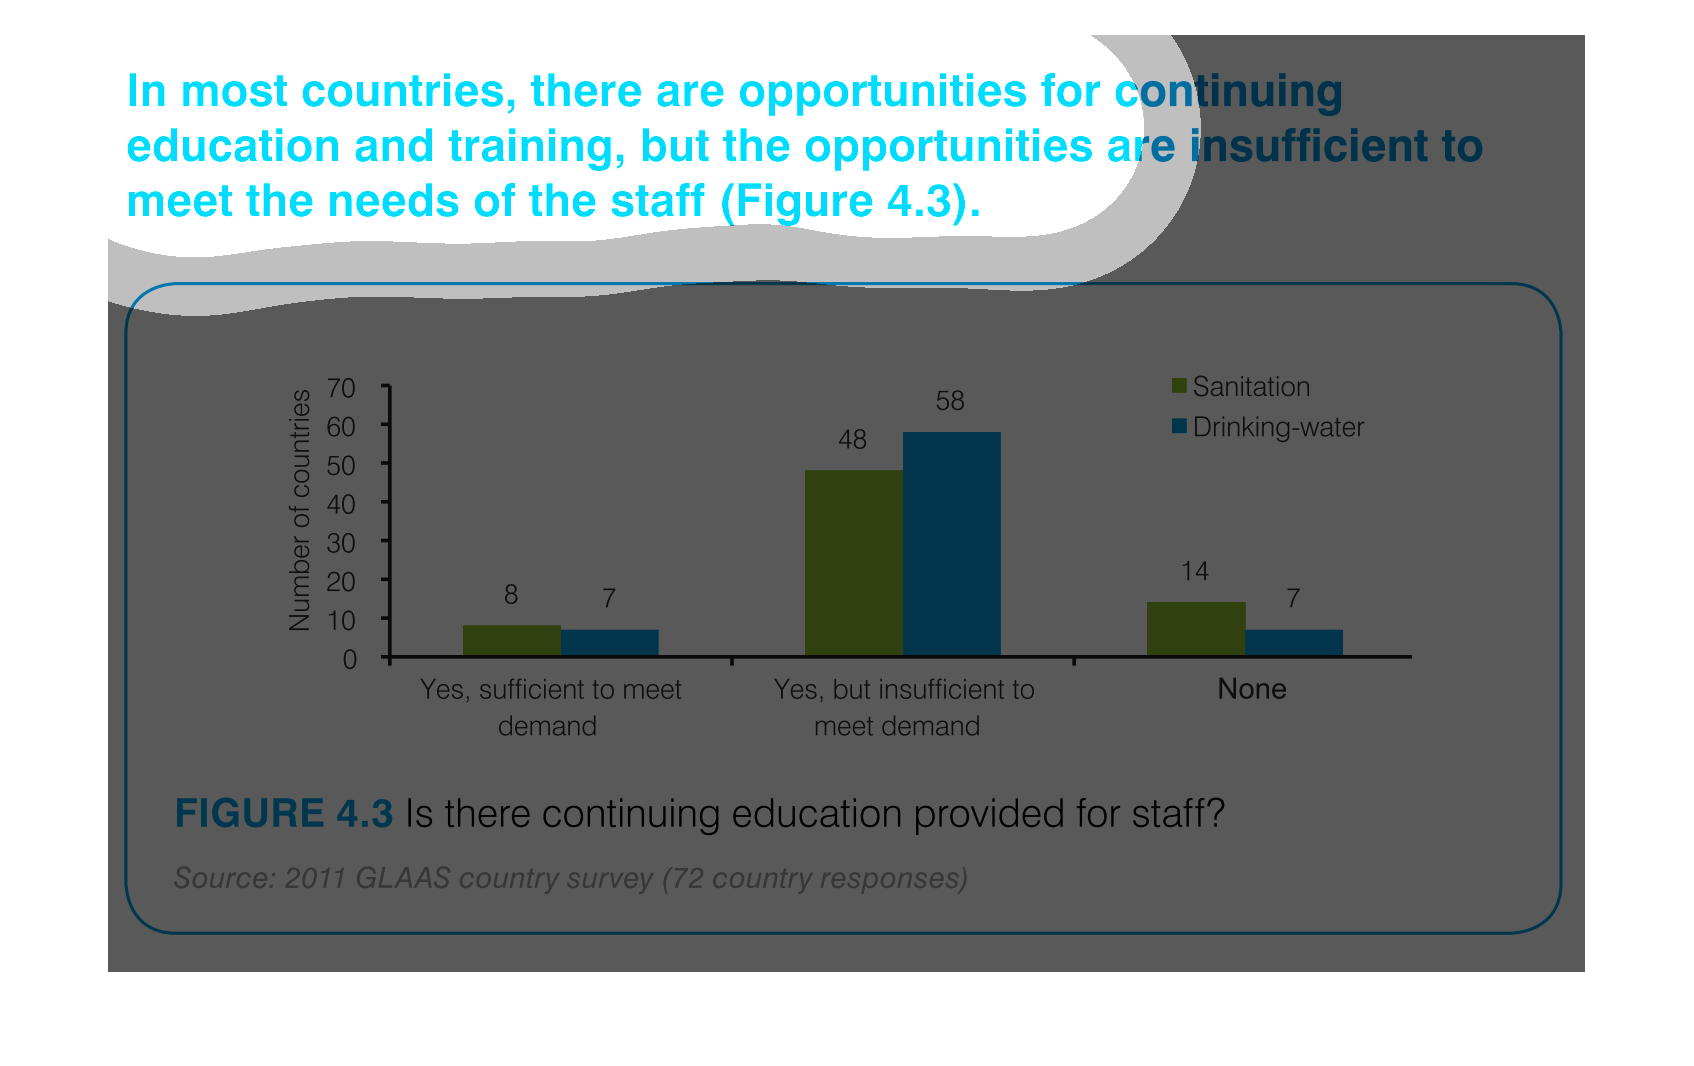
The following chart shows that In most countries their are reasons for continuing education
and training but the opportunities'  are insufficient to meet the needs of the staff.
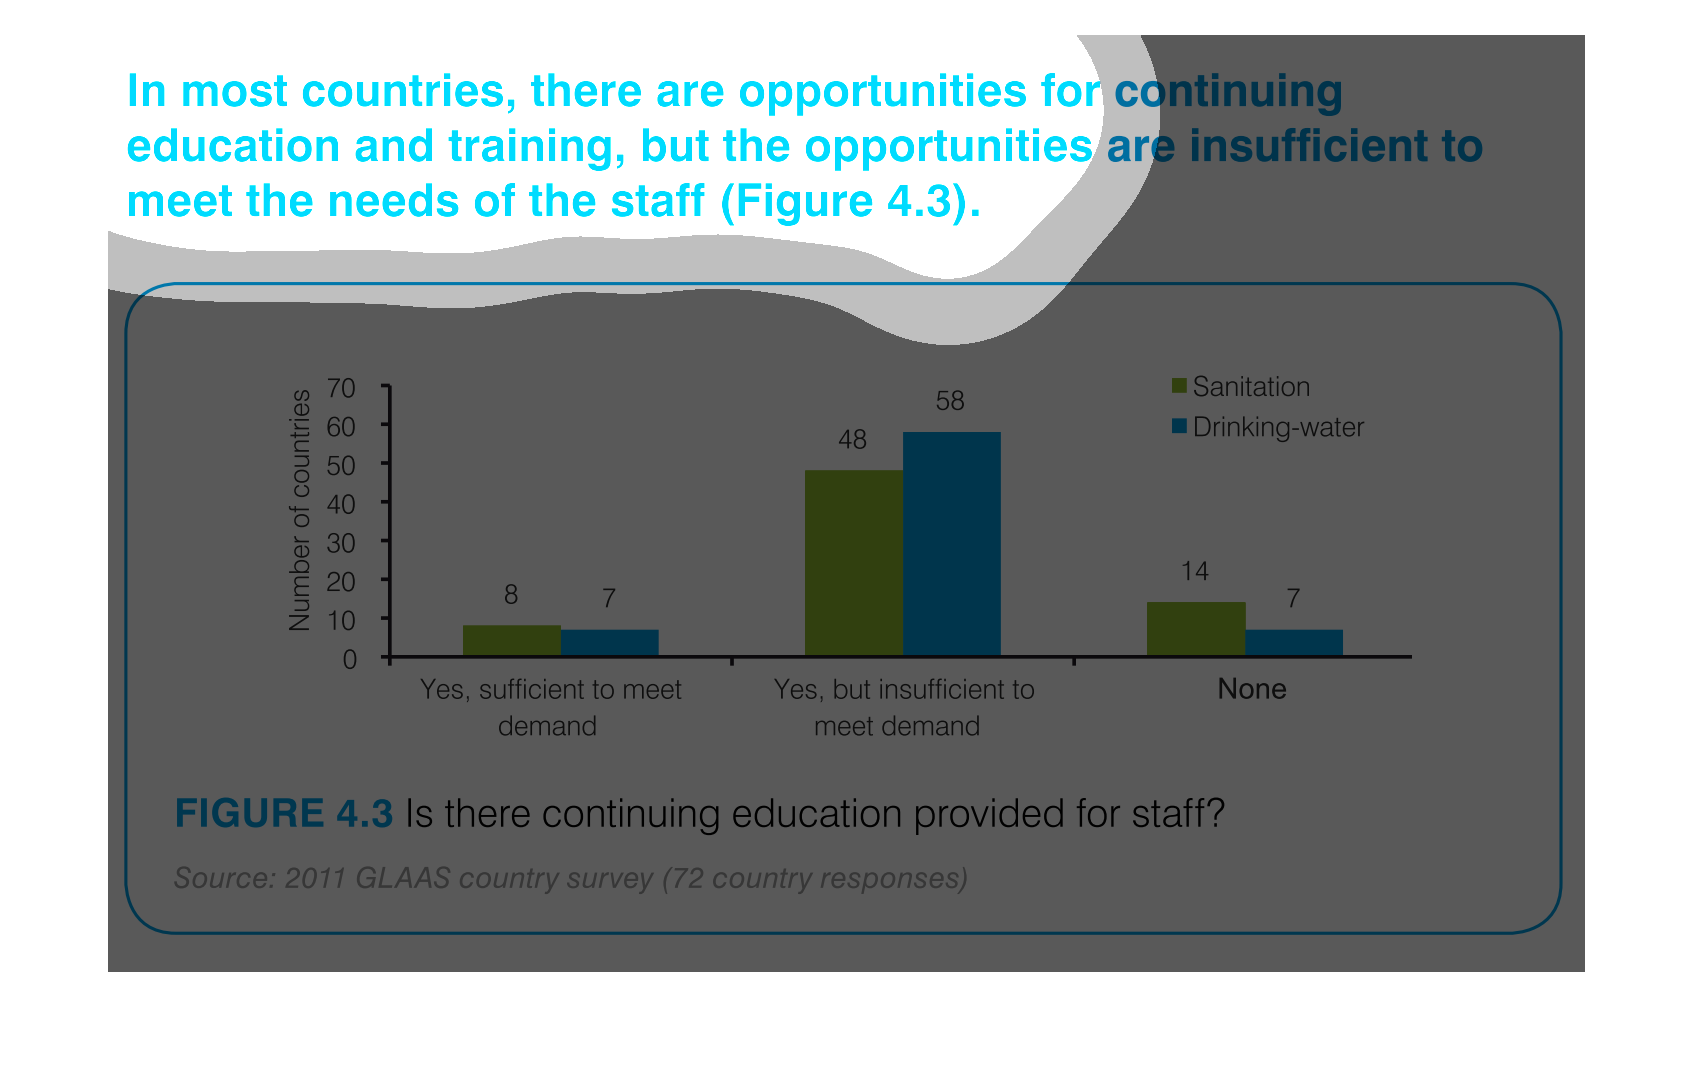
This graph shows that in most countries that there is more room for education and training,
but the opportunities are insufficient to meet the needs of the staff.
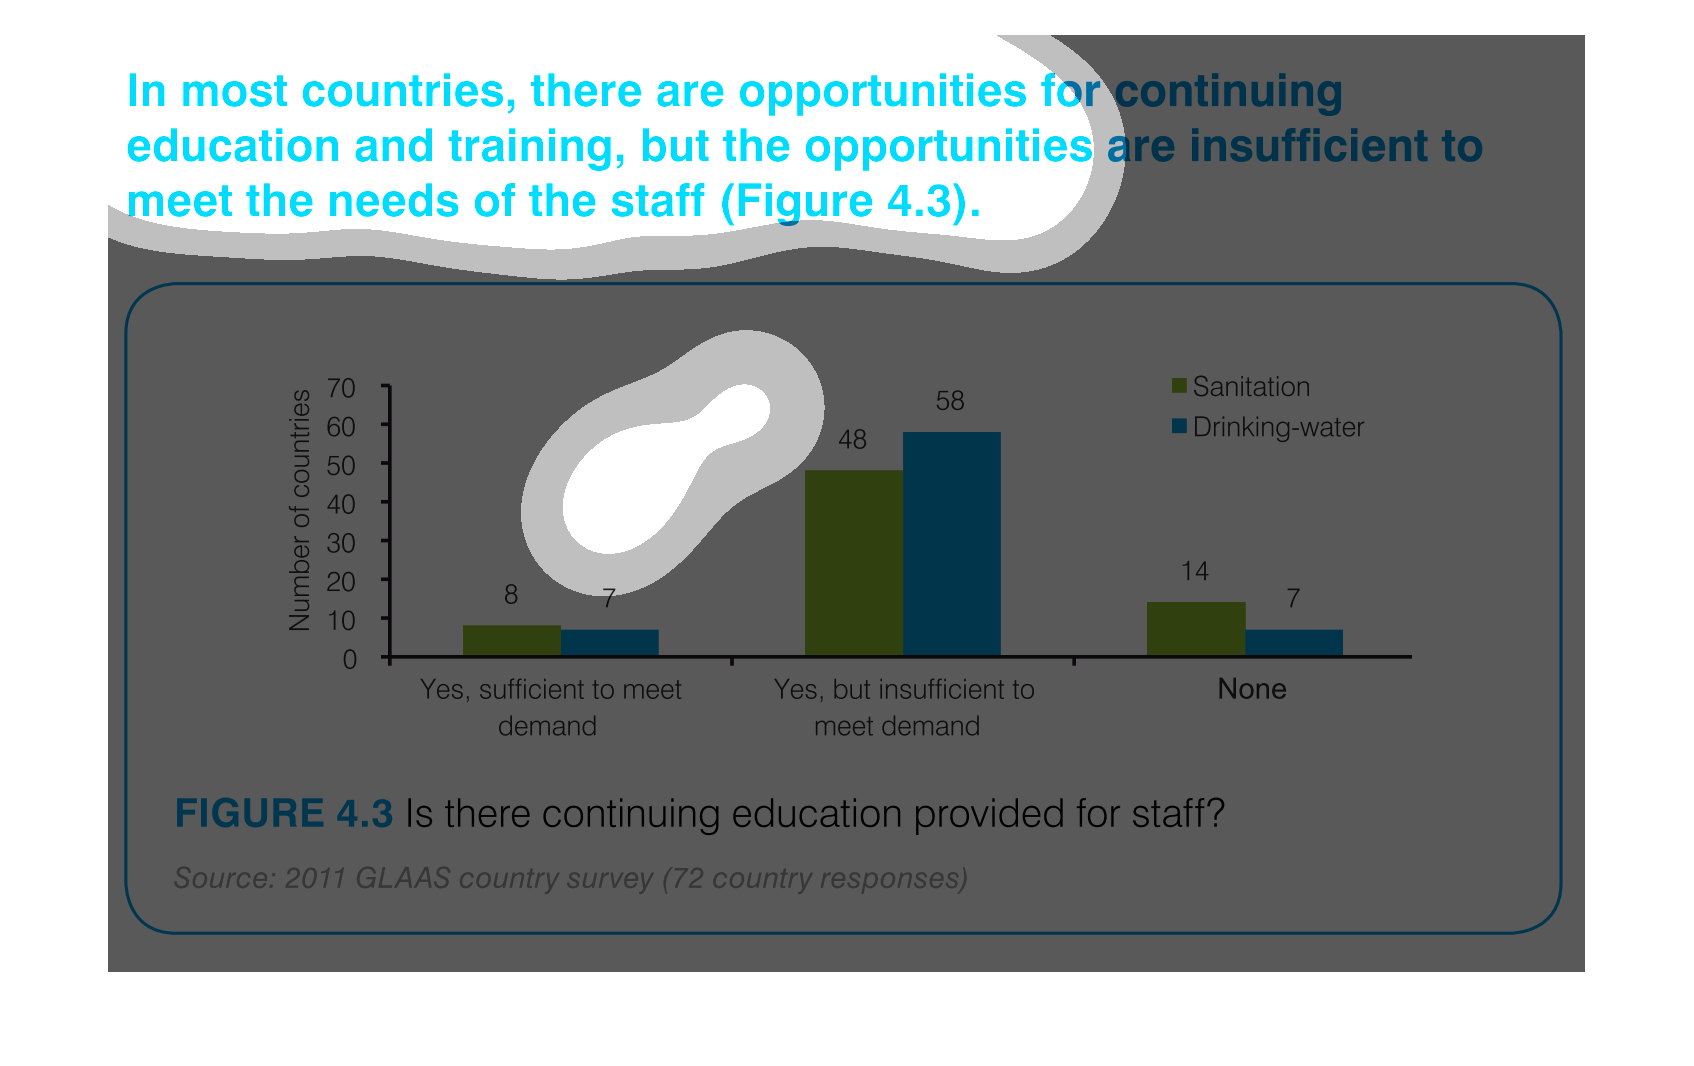
This image compares the percentages of workplaces with sufficient and insufficient continuing
education for their workers. Also represented are those with no continuing education whatsoever.
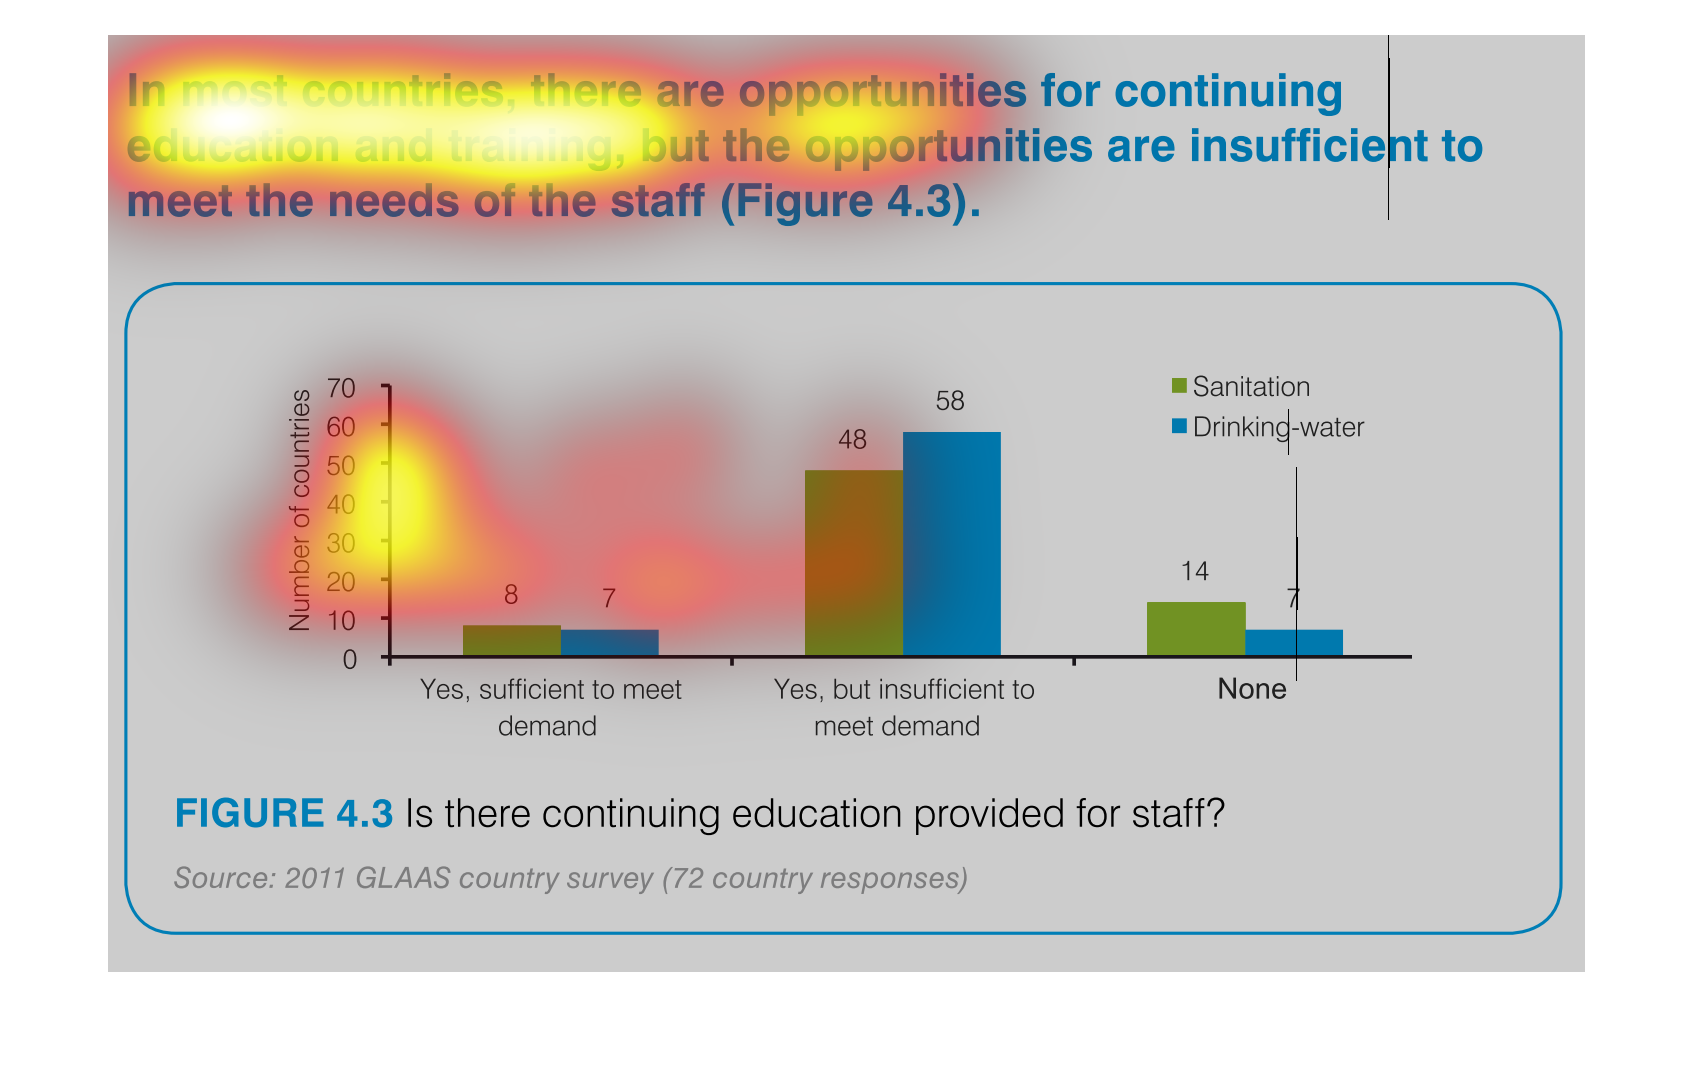
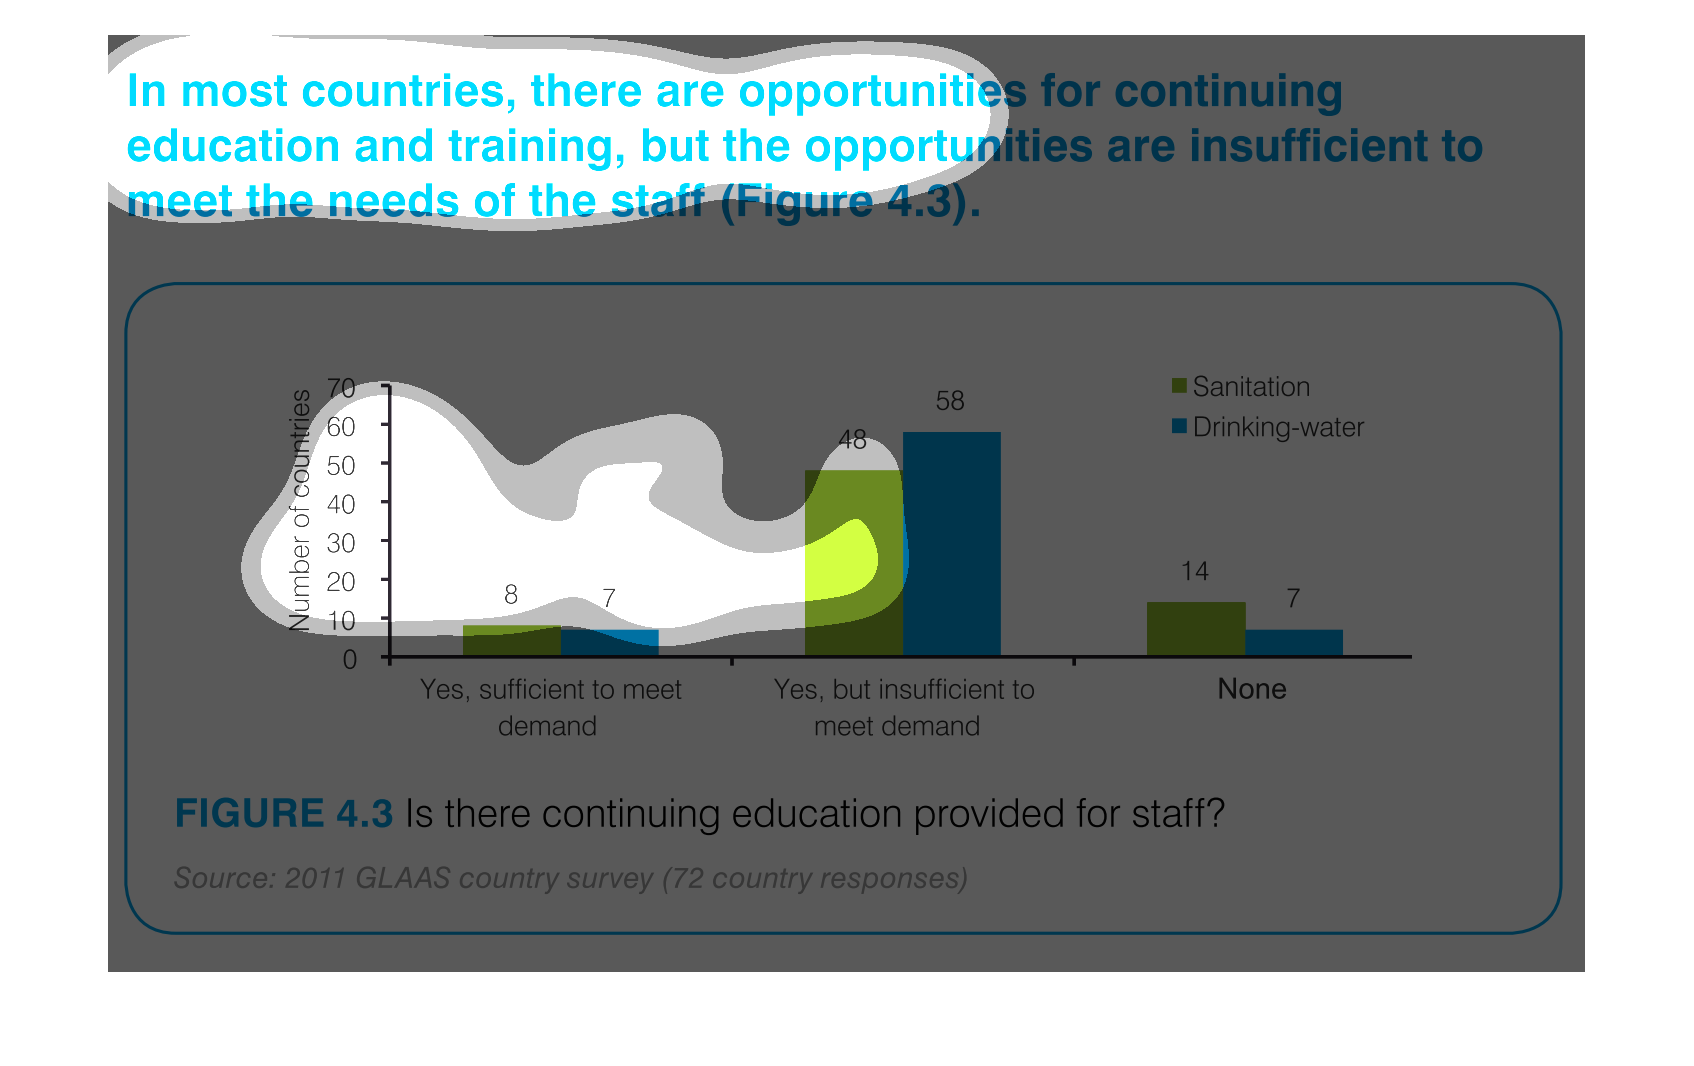
in most of the countries opportunities for continuous education & training  are insuffiecient
 to meet the needs of the staff graphs shows number of countries vs issues like sanitiation
& drin king water
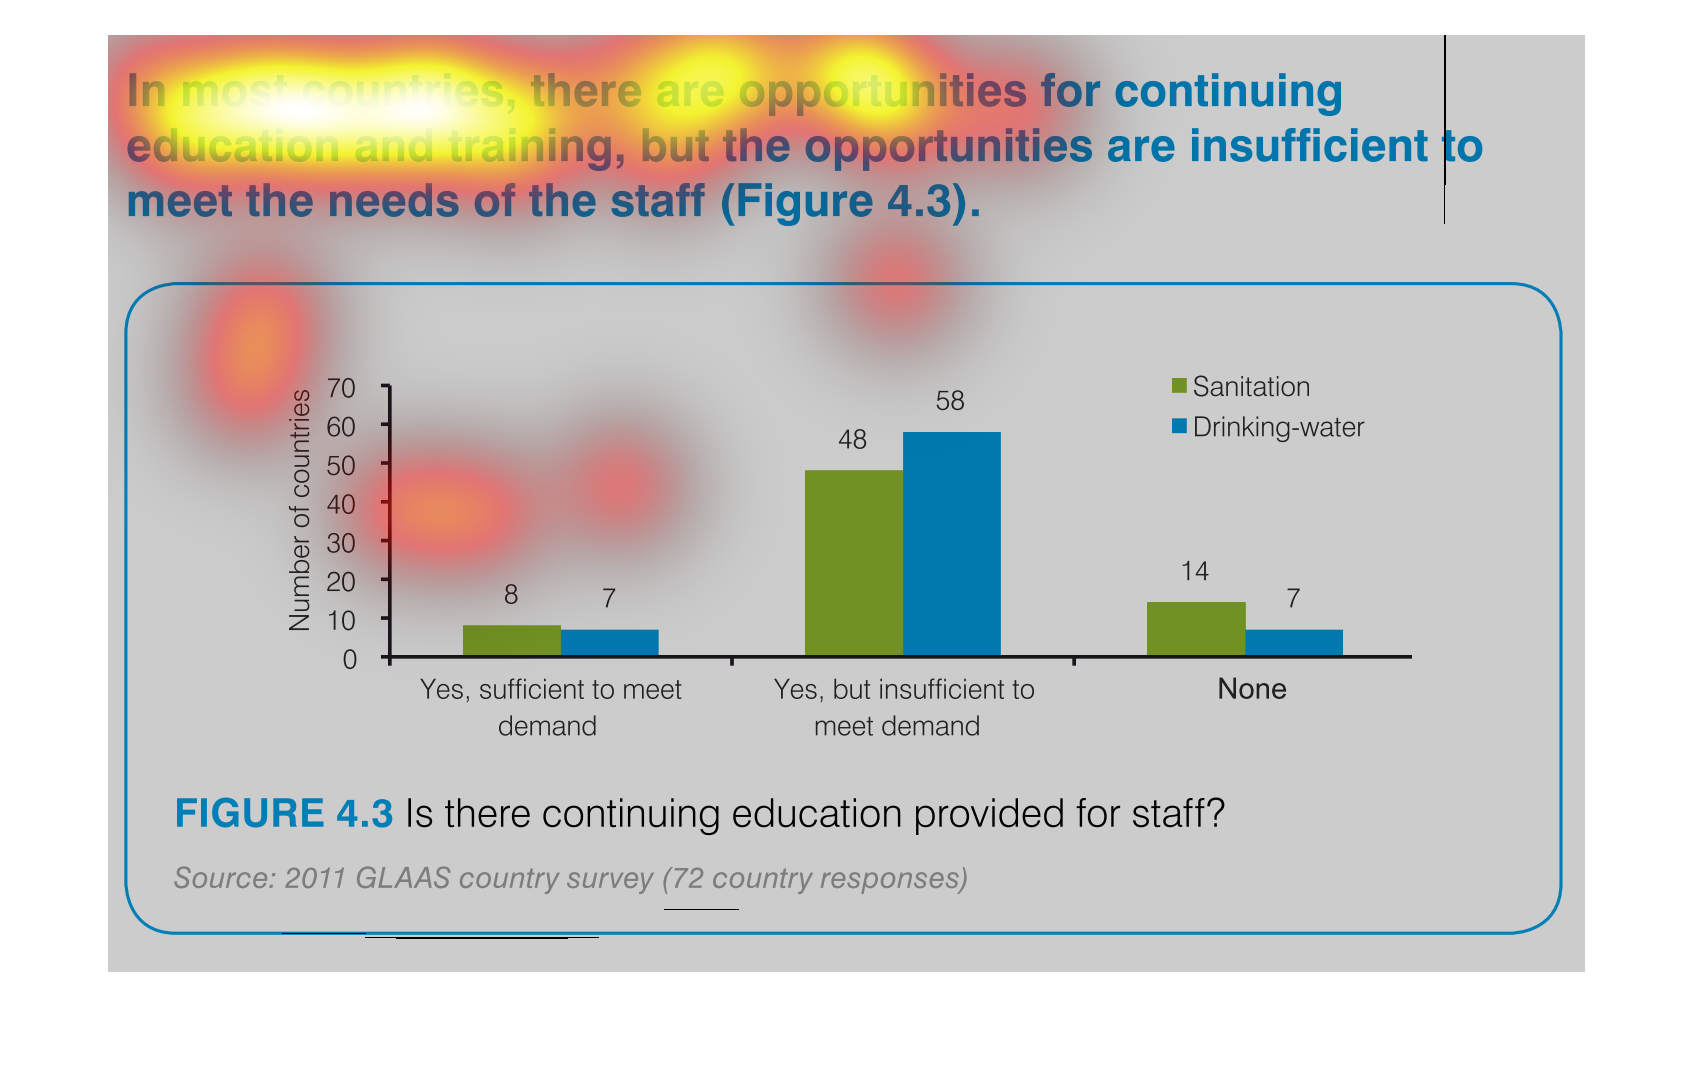
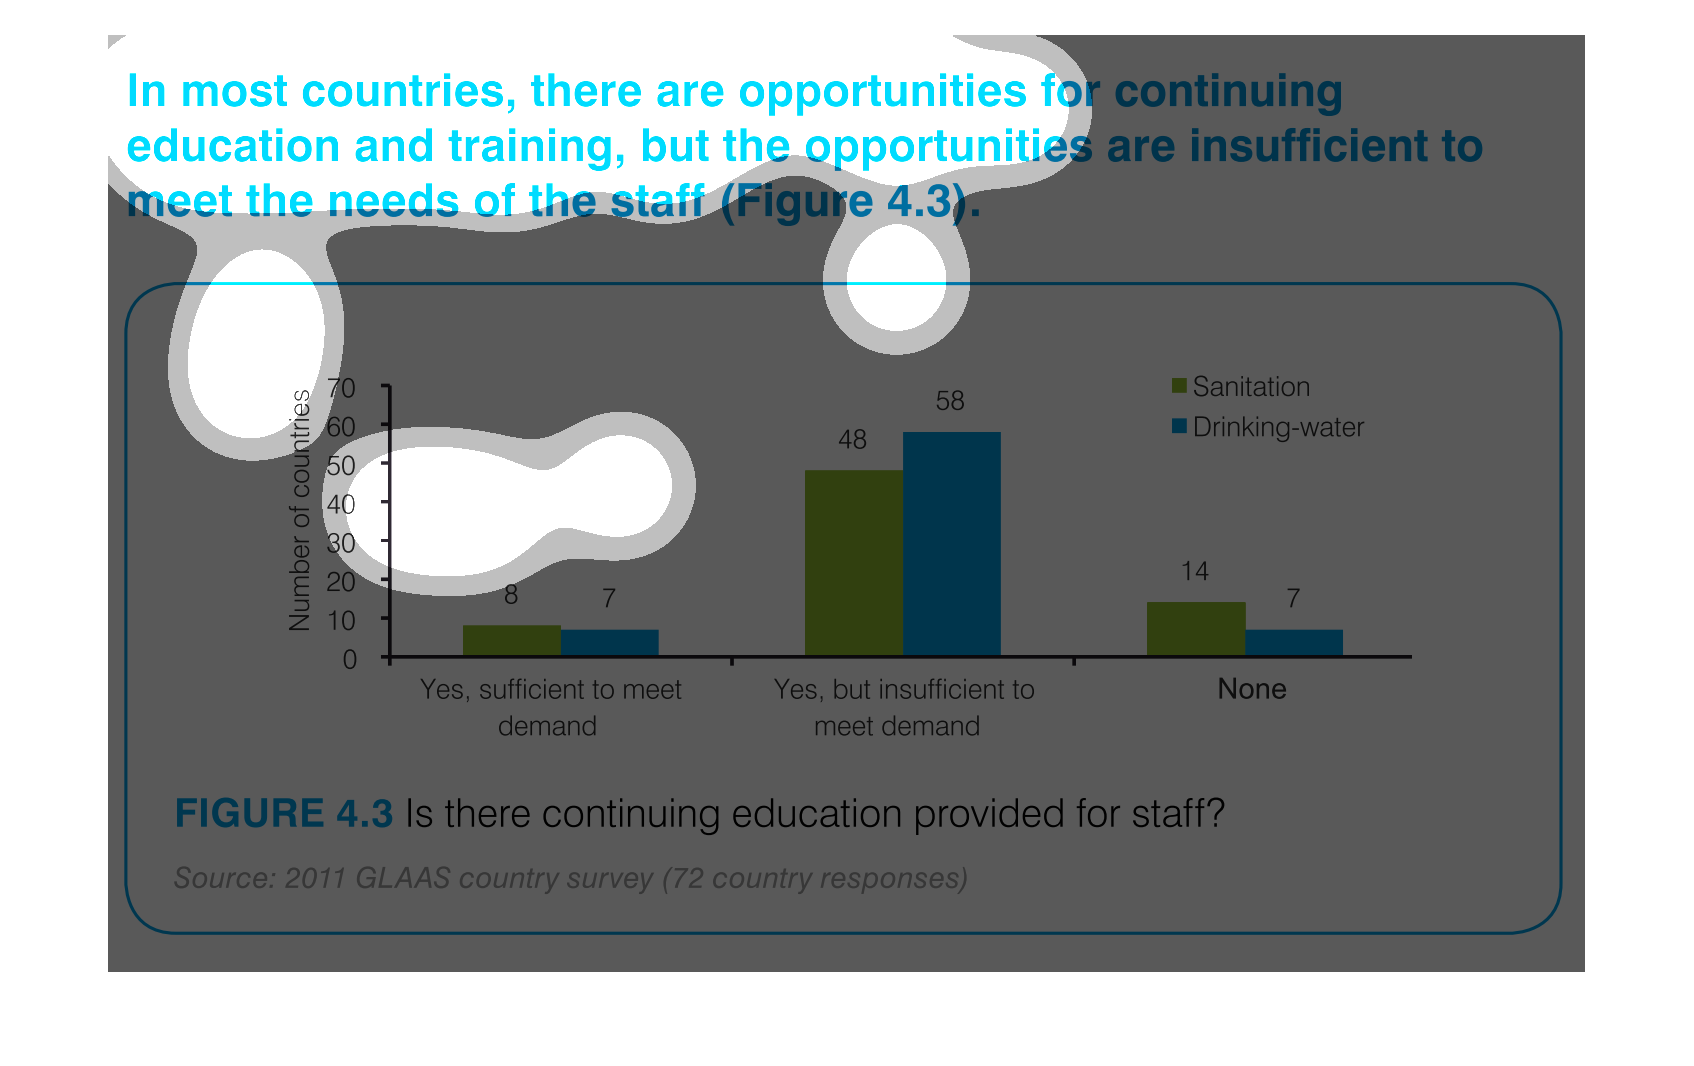
This is a graph about which countries have access to higher education. The Y axis is the number
of countries. The X axis has three sections; yes, sufficient to meet demand, yes but insufficient
to meet demand, and none.
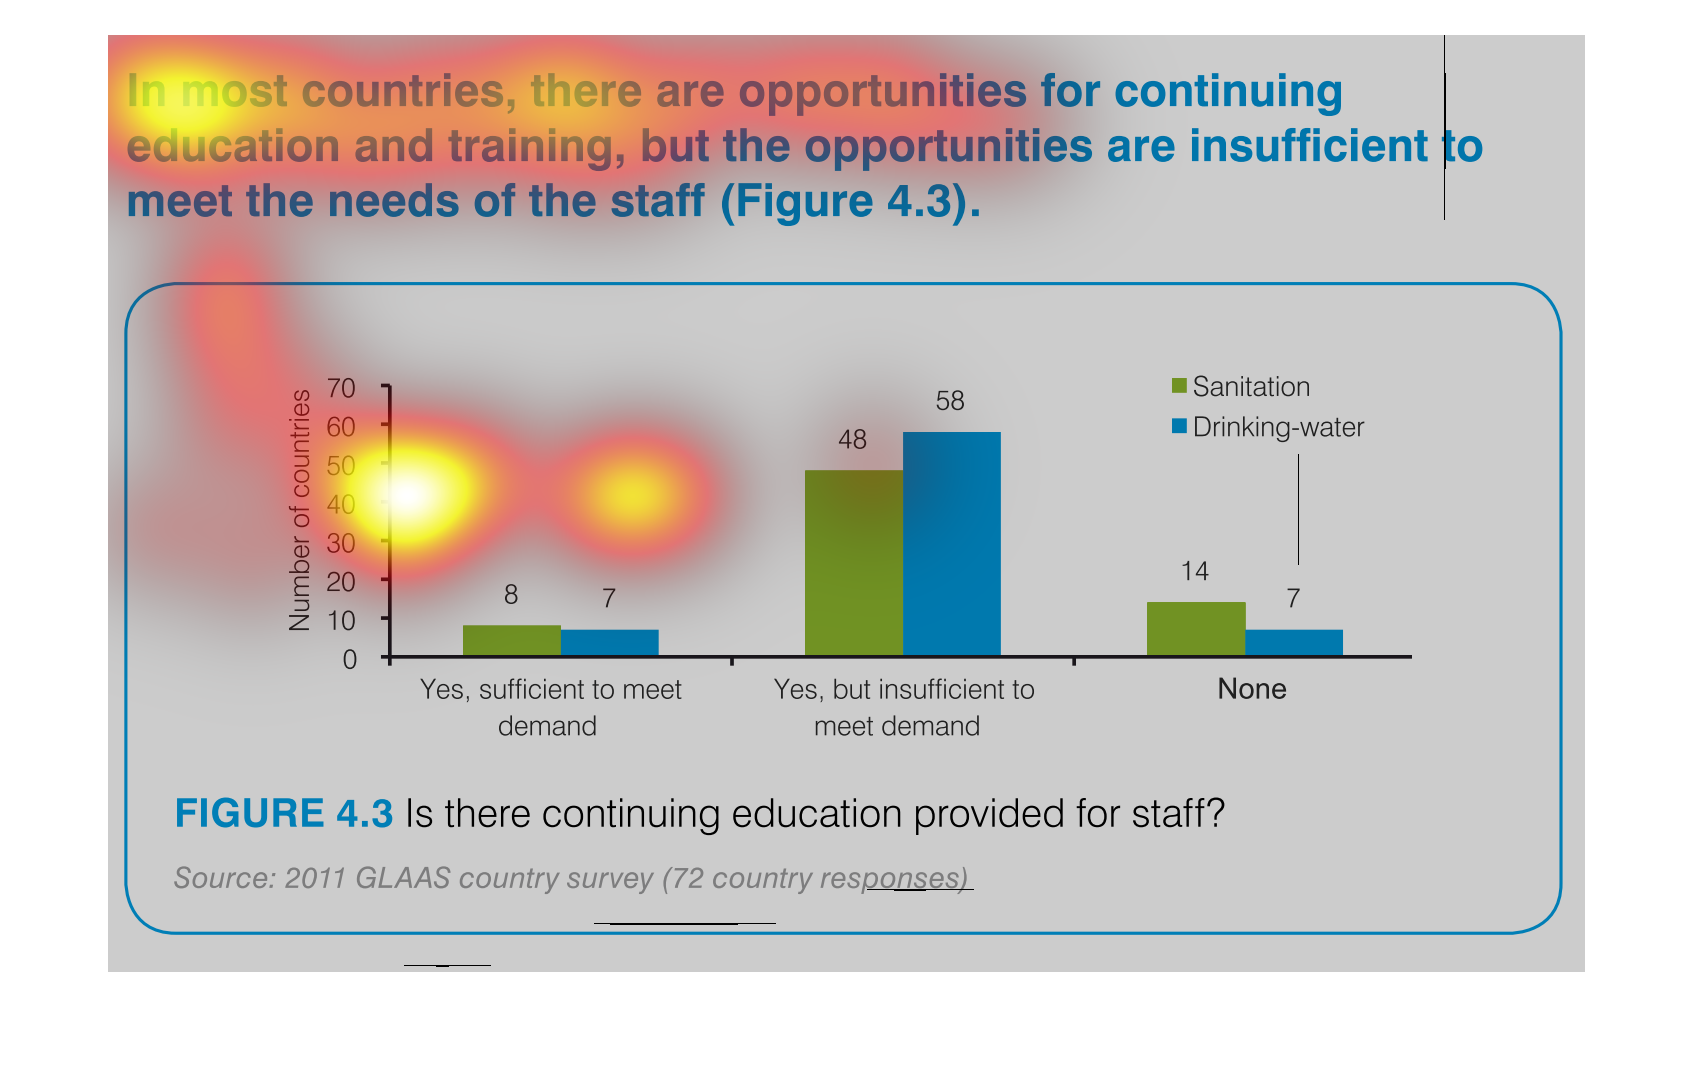
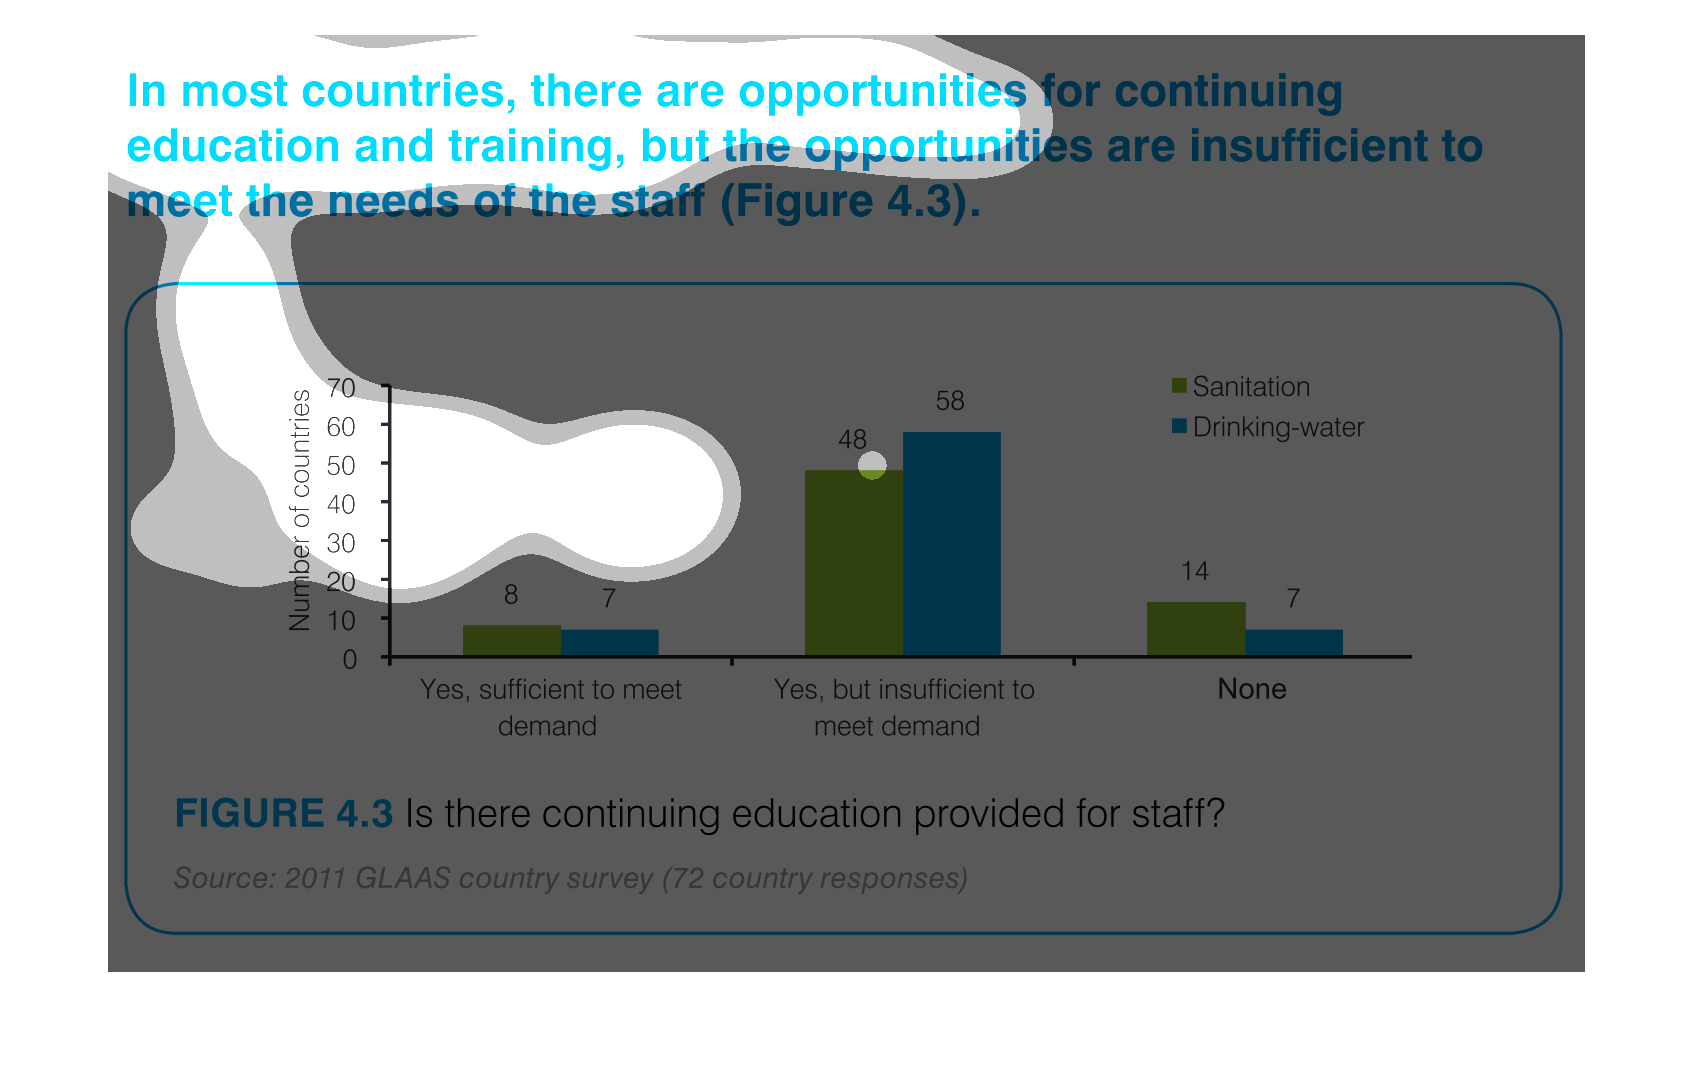
This figure tries to answer the question of whether or not there is a continuing education
program available to staff in the particular countries. Based on the data, there are continuing
education programs available for the most part, but they are usually insufficient to meet
the demand.
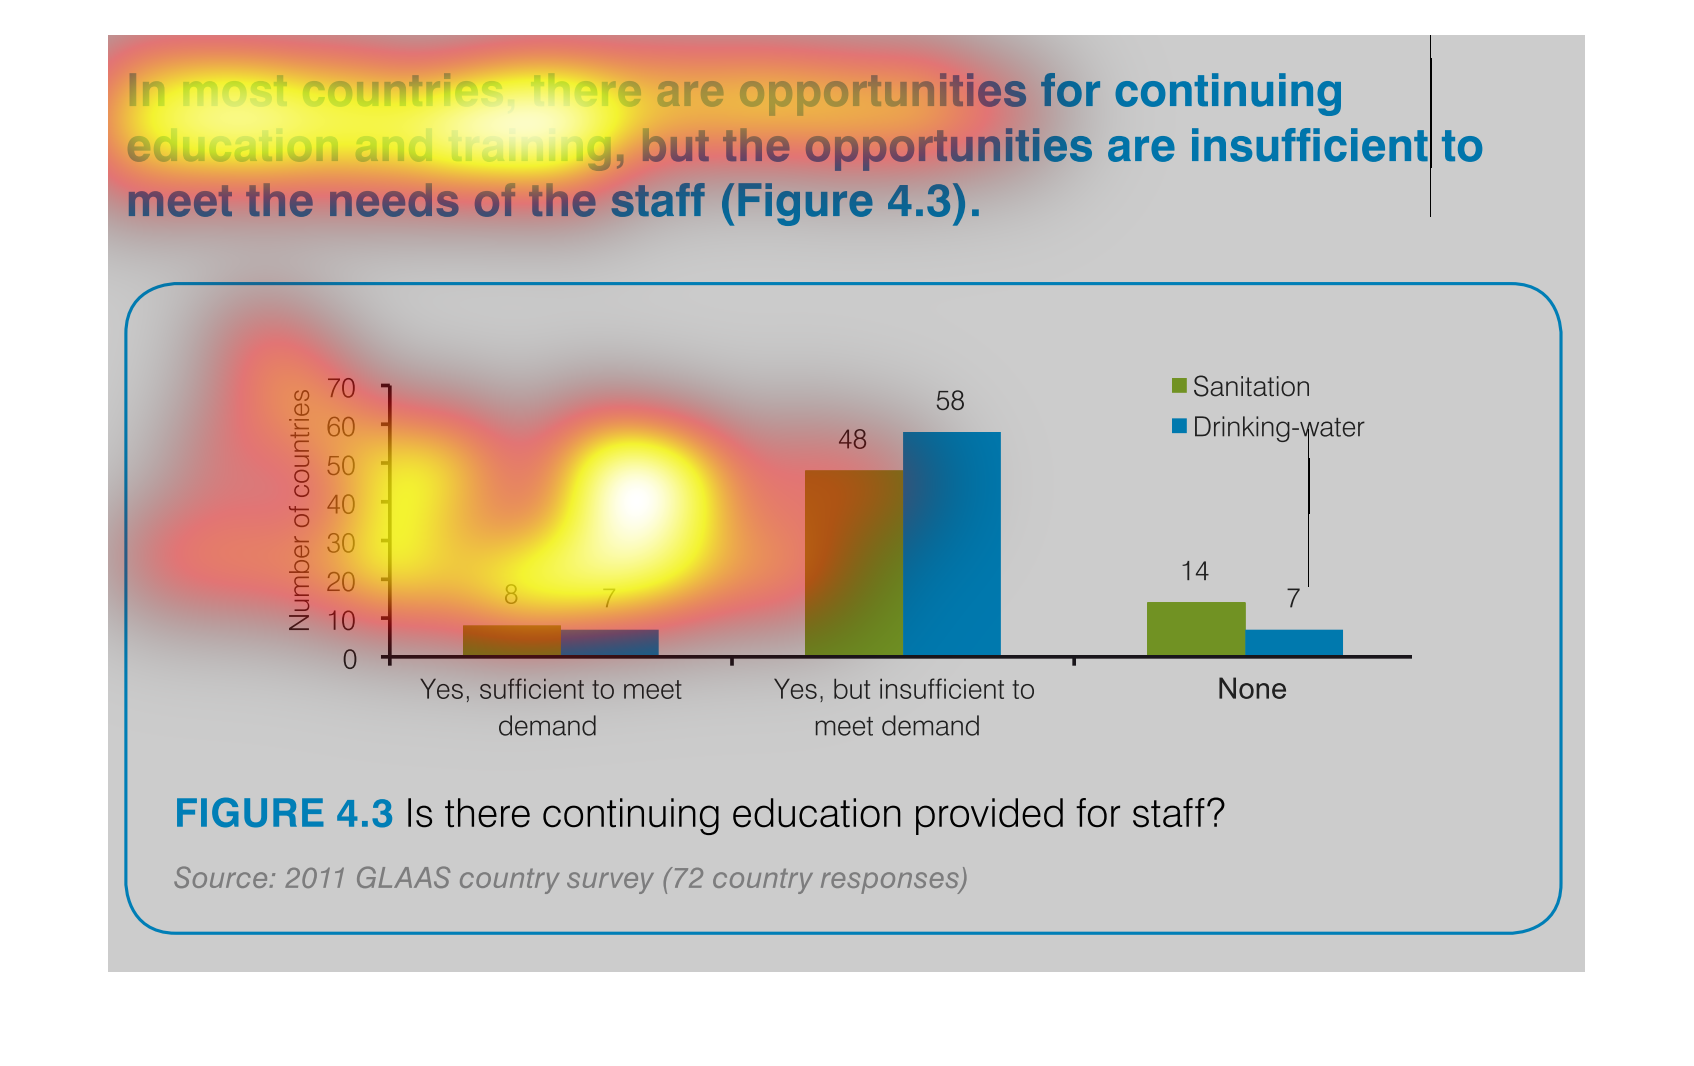
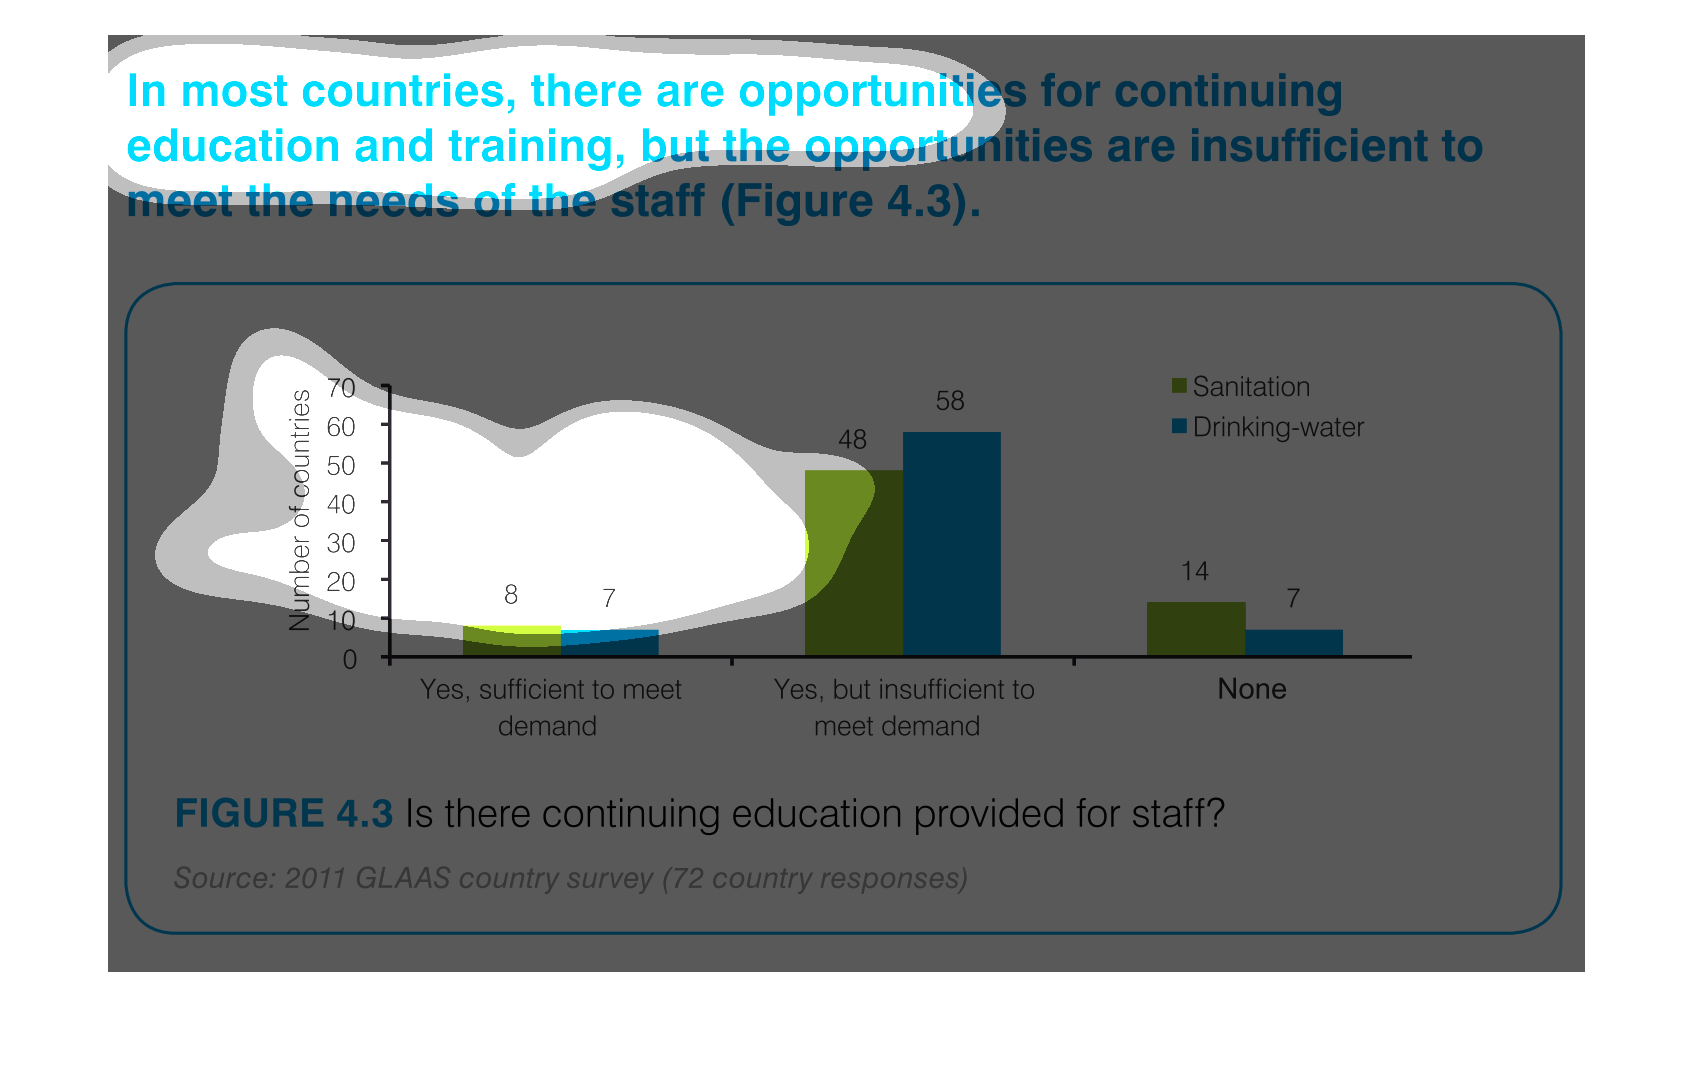
This graph shows how many countries have continuing education for staff: 1) sufficient to
meet demand, 2) yes, but insufficient to meet demand, 3) None. There are two bars in each
category, one for sanitation and one for drinking water. In "yes, but insufficient to meet
demand" is the most countries, both for sanitation and drinking water.
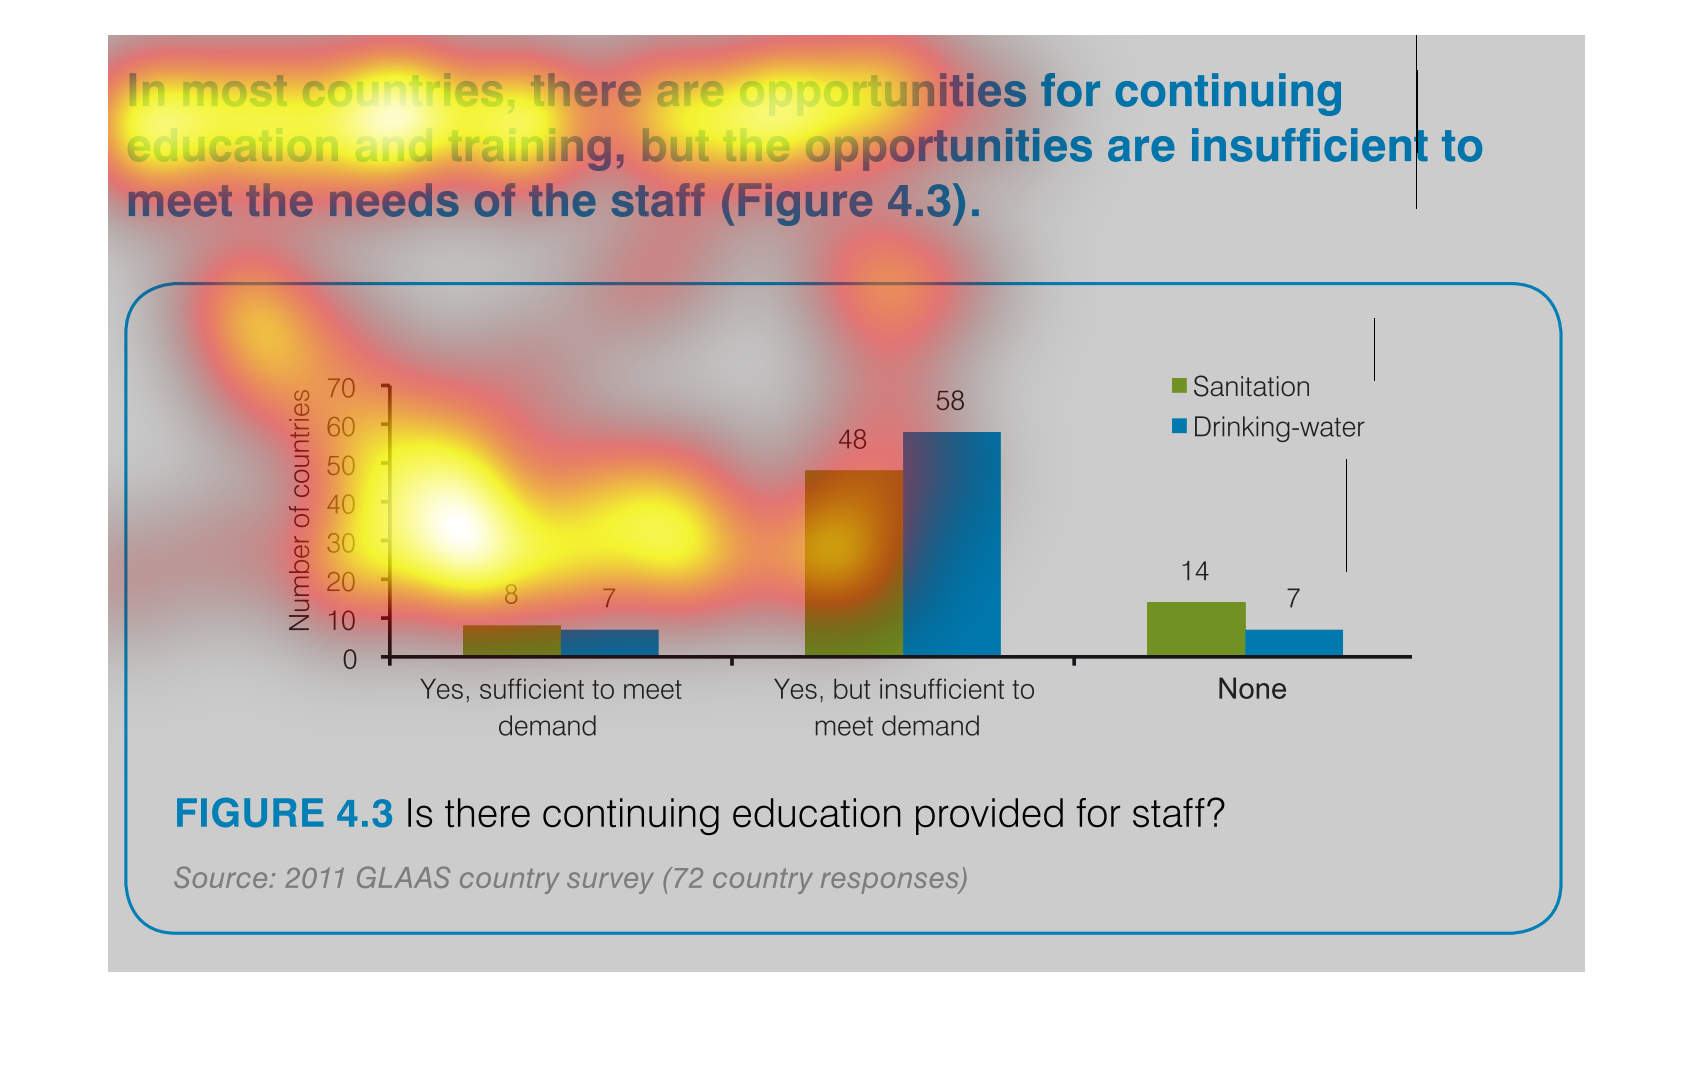
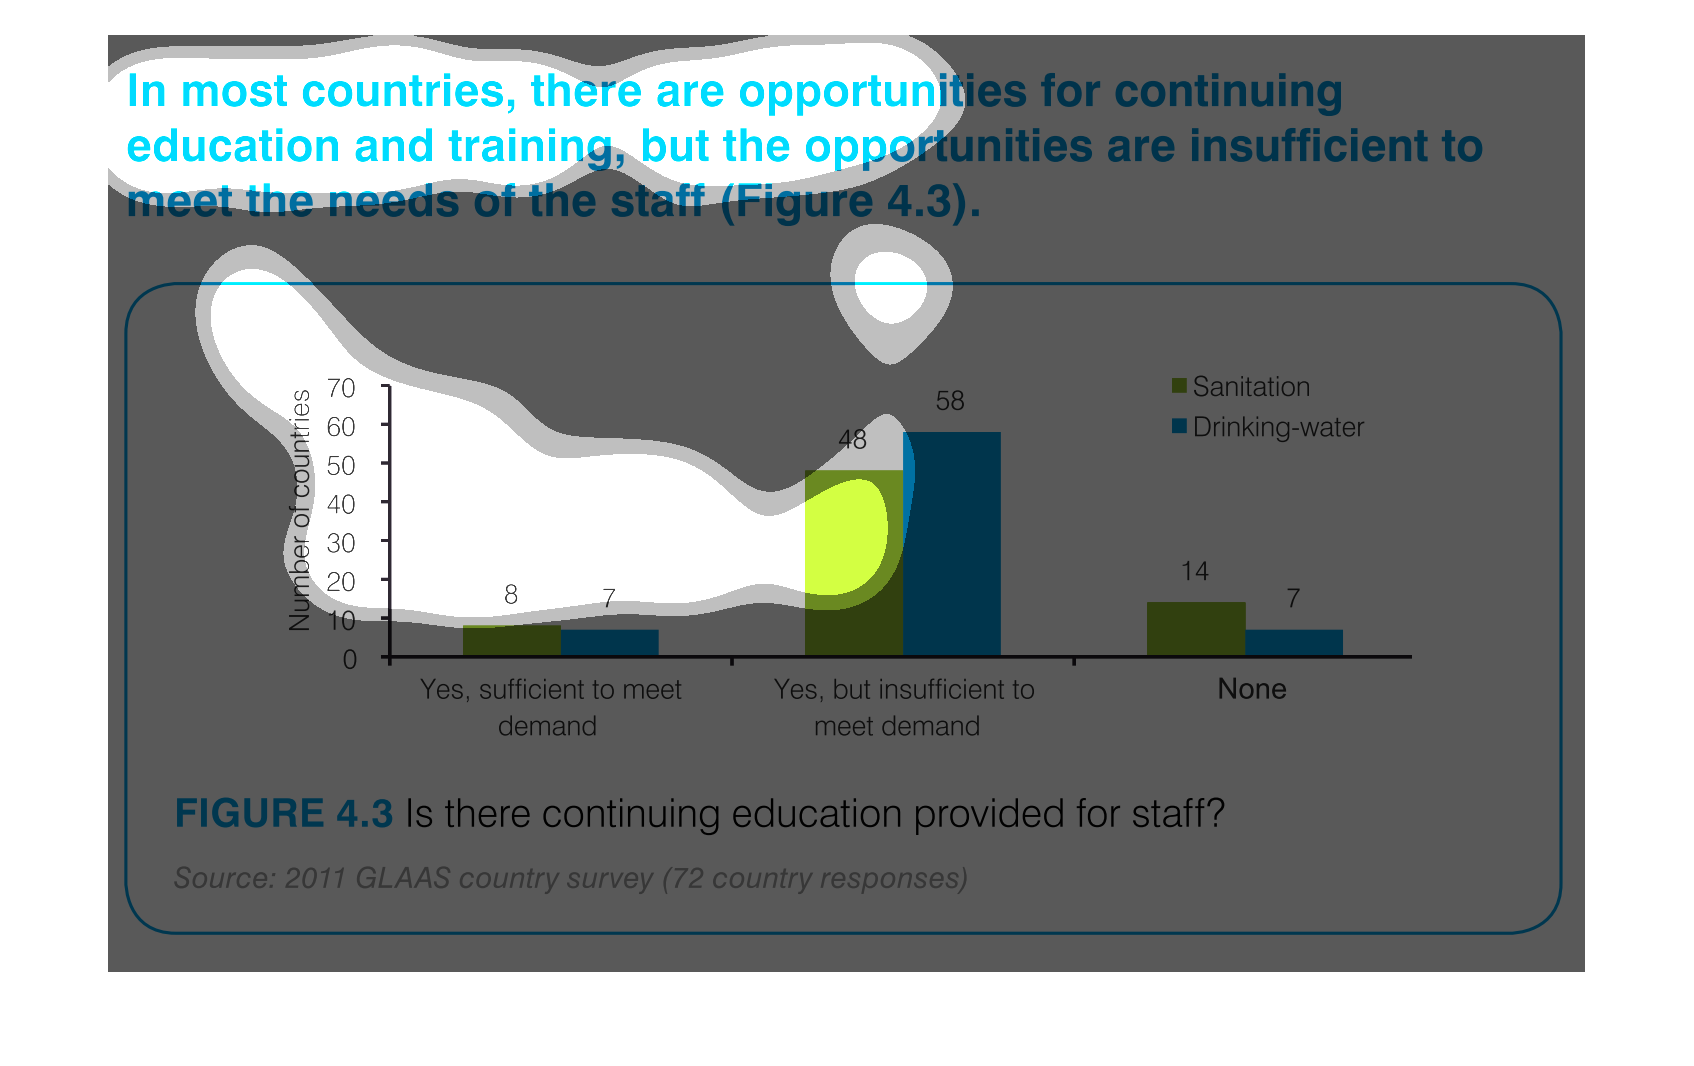
This one shows the number of countries that have sanitation and drinking water opportunities.
Most countries have sanitation and drinking water but not enough to meet demand. Most countries
have drinking water.
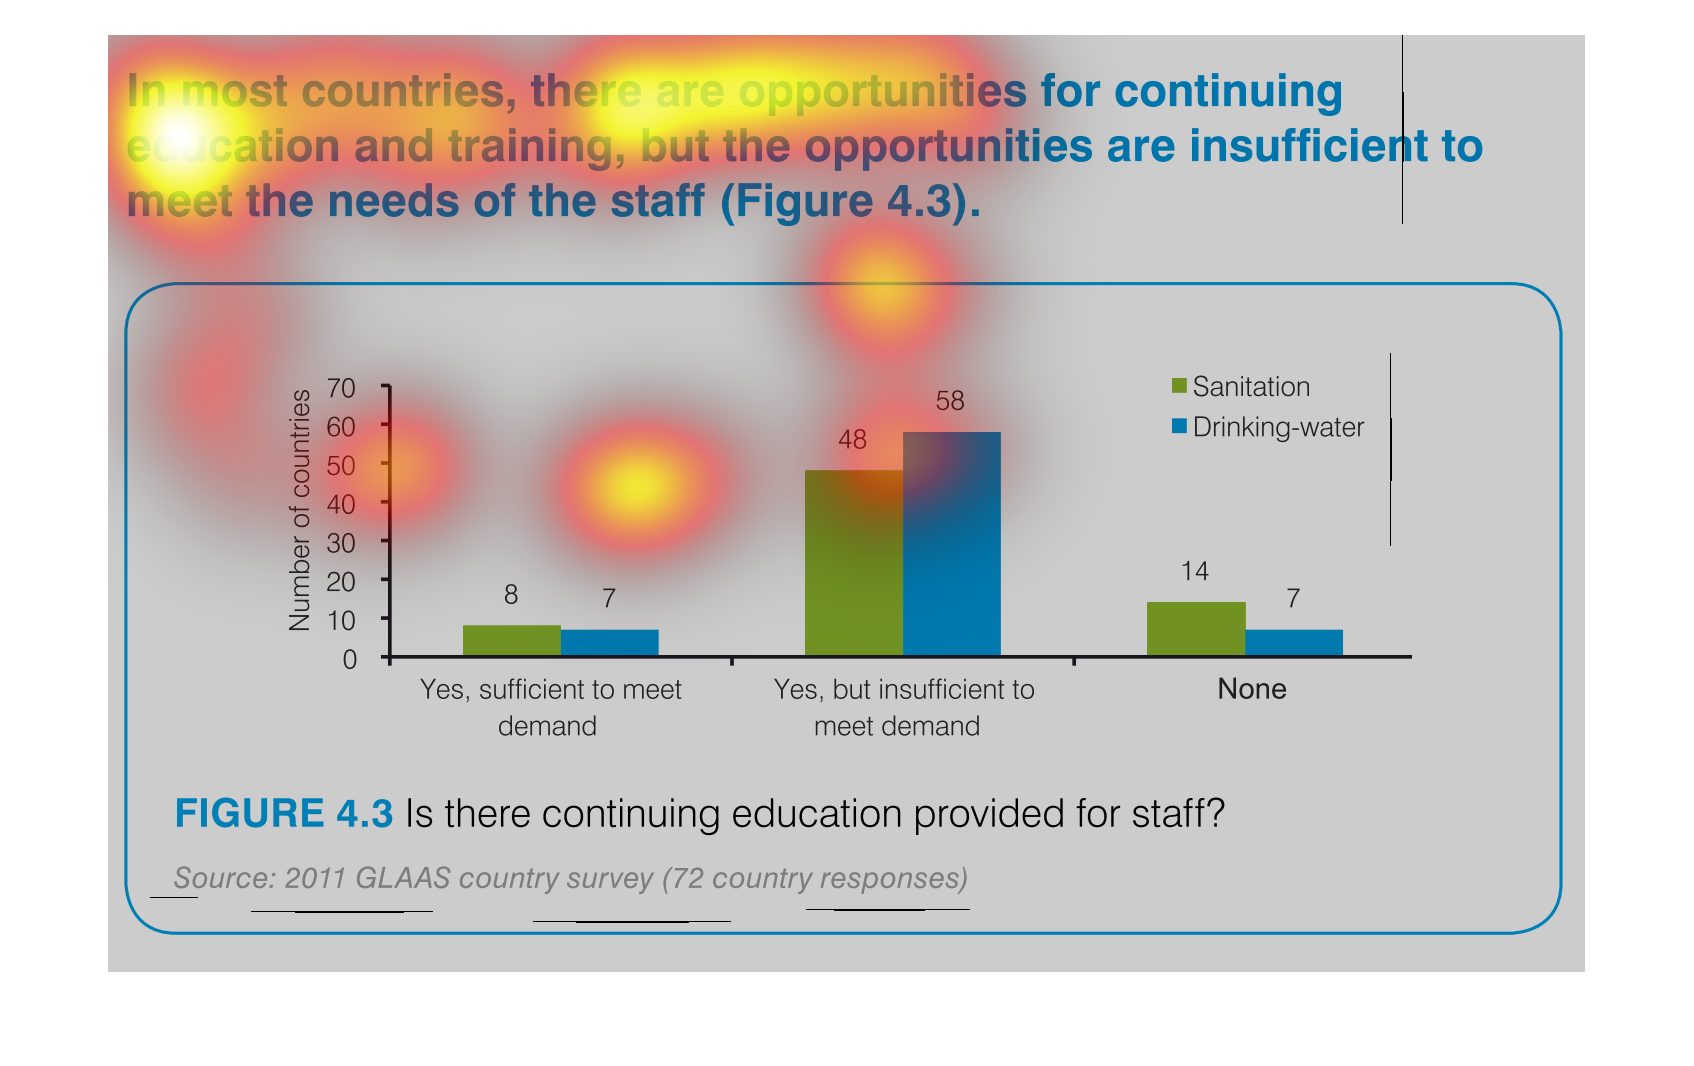
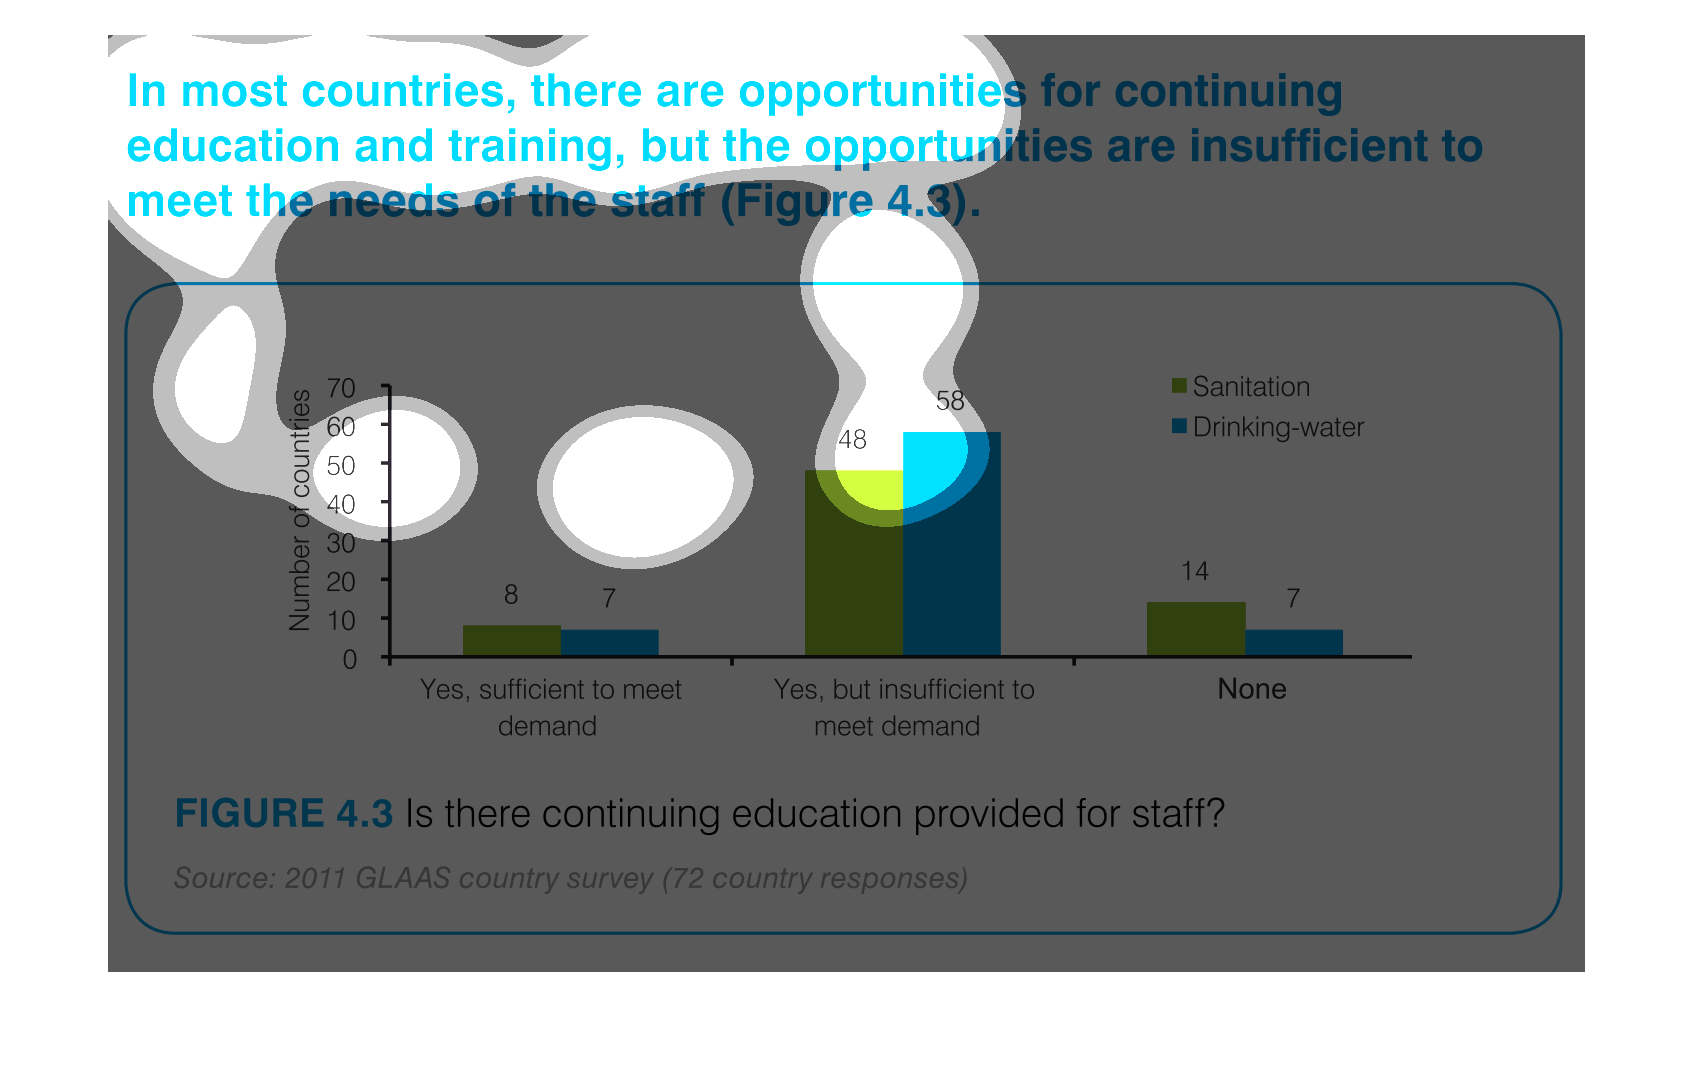
The figure presented is titled In most countries, there are opportunities for continuing education
and training,  but the opportunities are insufficient to meet the needs of the staff.
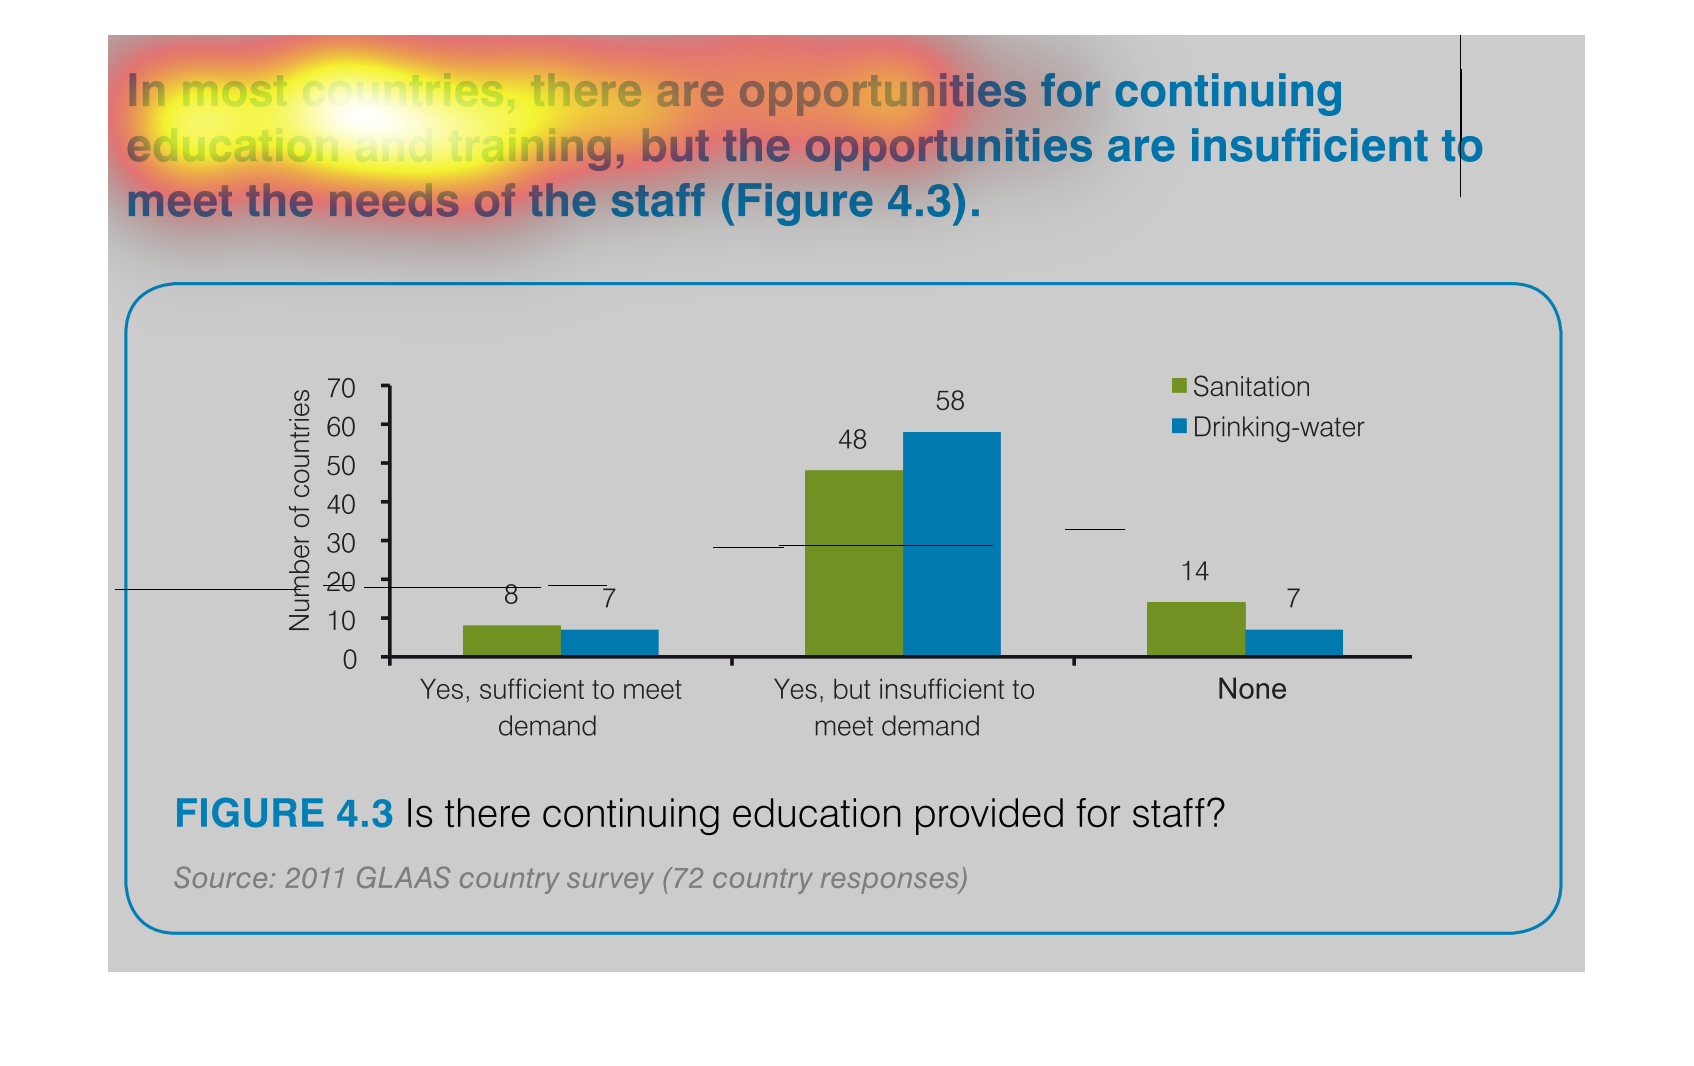
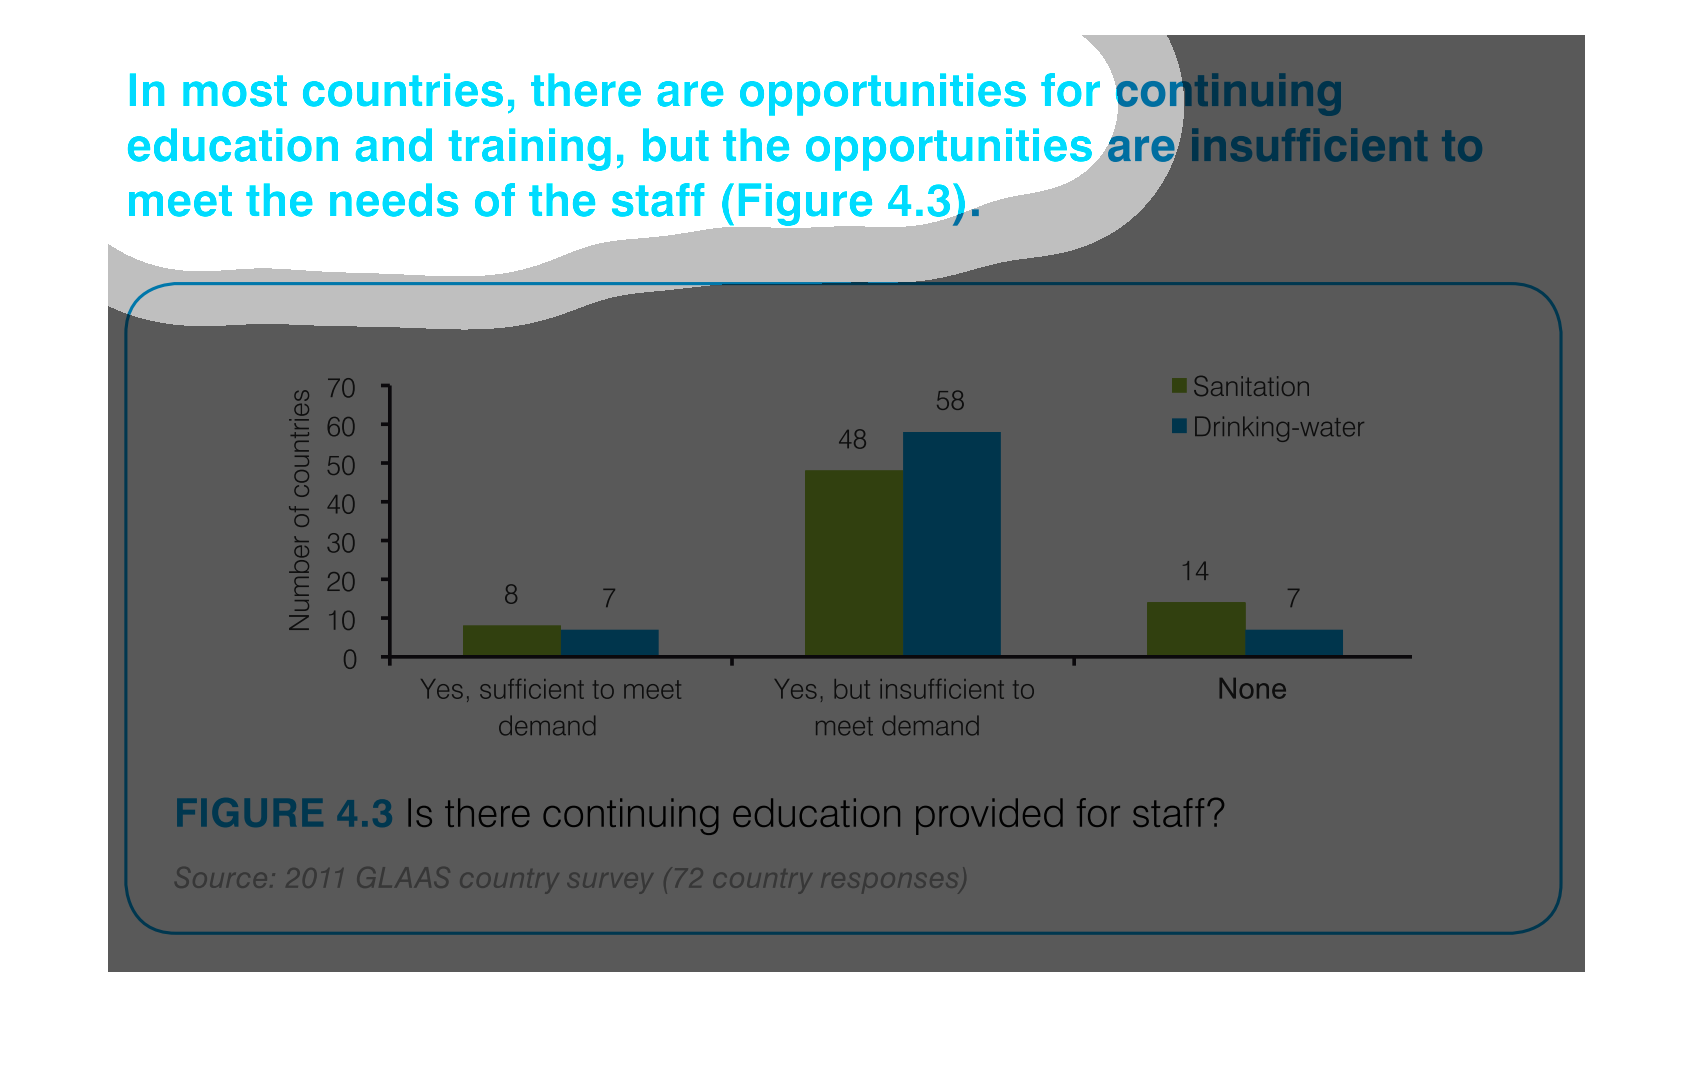
This is a bar graph showing the number of countries with sufficient sanitation and drinking
water to meet demand, available resources that do not meet demand, and countries with no resources.
There were 72 countries in this survey and data is from 2011. The title on the graph talks
about continued education for staff but this is not the data reflected in the graph.