This bar graph addresses whether utilities report their performance results to their customers
in their annual report or bills on sanitation and drinking water. This is measured by number
of countries based on their responses, which can be either: yes, required by policy or regulation,
yes, but done voluntarily or not systematically, and no. Over half (57%) of countries report
that service providers report performance to there customers.
This image shows a bar graph that depicts how often utility companies report performance to
their customers and in how many countries this actually happens..  A green bar represents
sanitation while a blue bar represents drinking water.  The bottom of the graph lists three
choices.  One, that information is provided due to requirements, two that information is provided
voluntarily, and three that information is not provided.  The left of the graph lists values
for the number of countries in which these things happen.  A bar is then drawn for each option
listed for both sanitation and drinking water to show how often each option happens.
This graph shows the number of countries that report that service providers are reporting
to customers regarding sanitation and drinking water services.
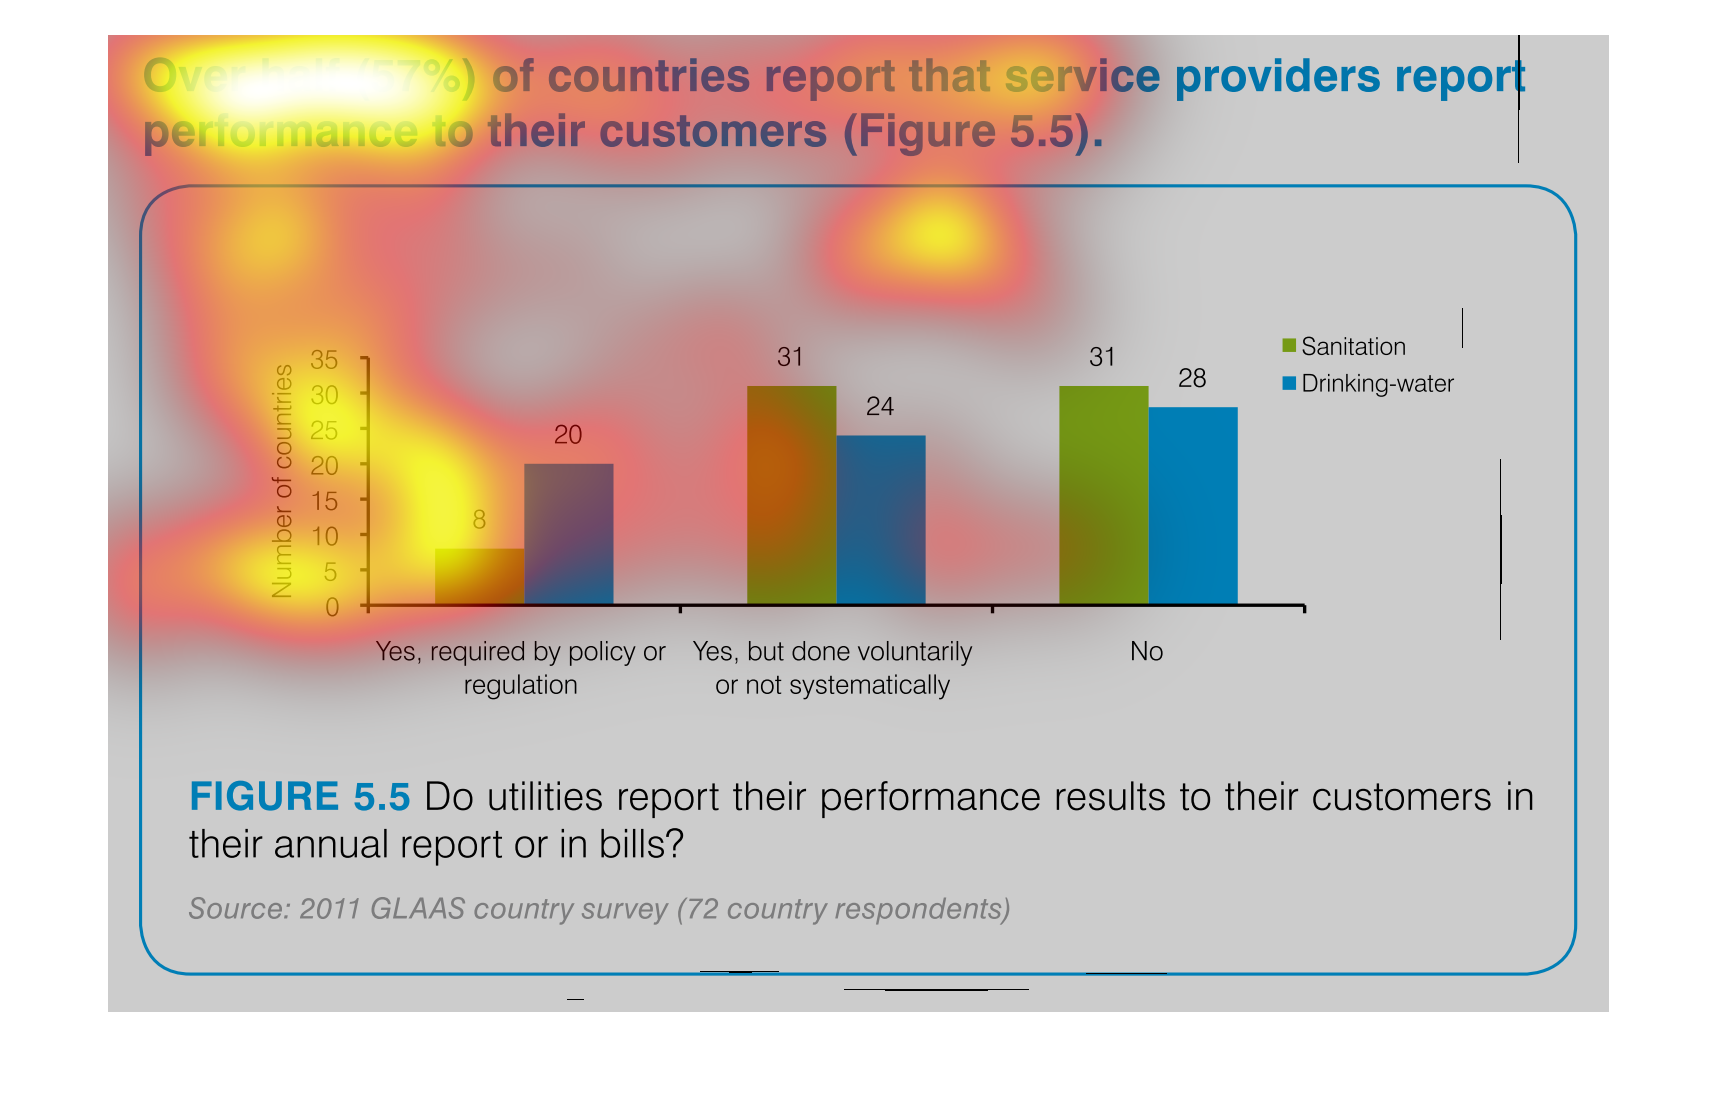
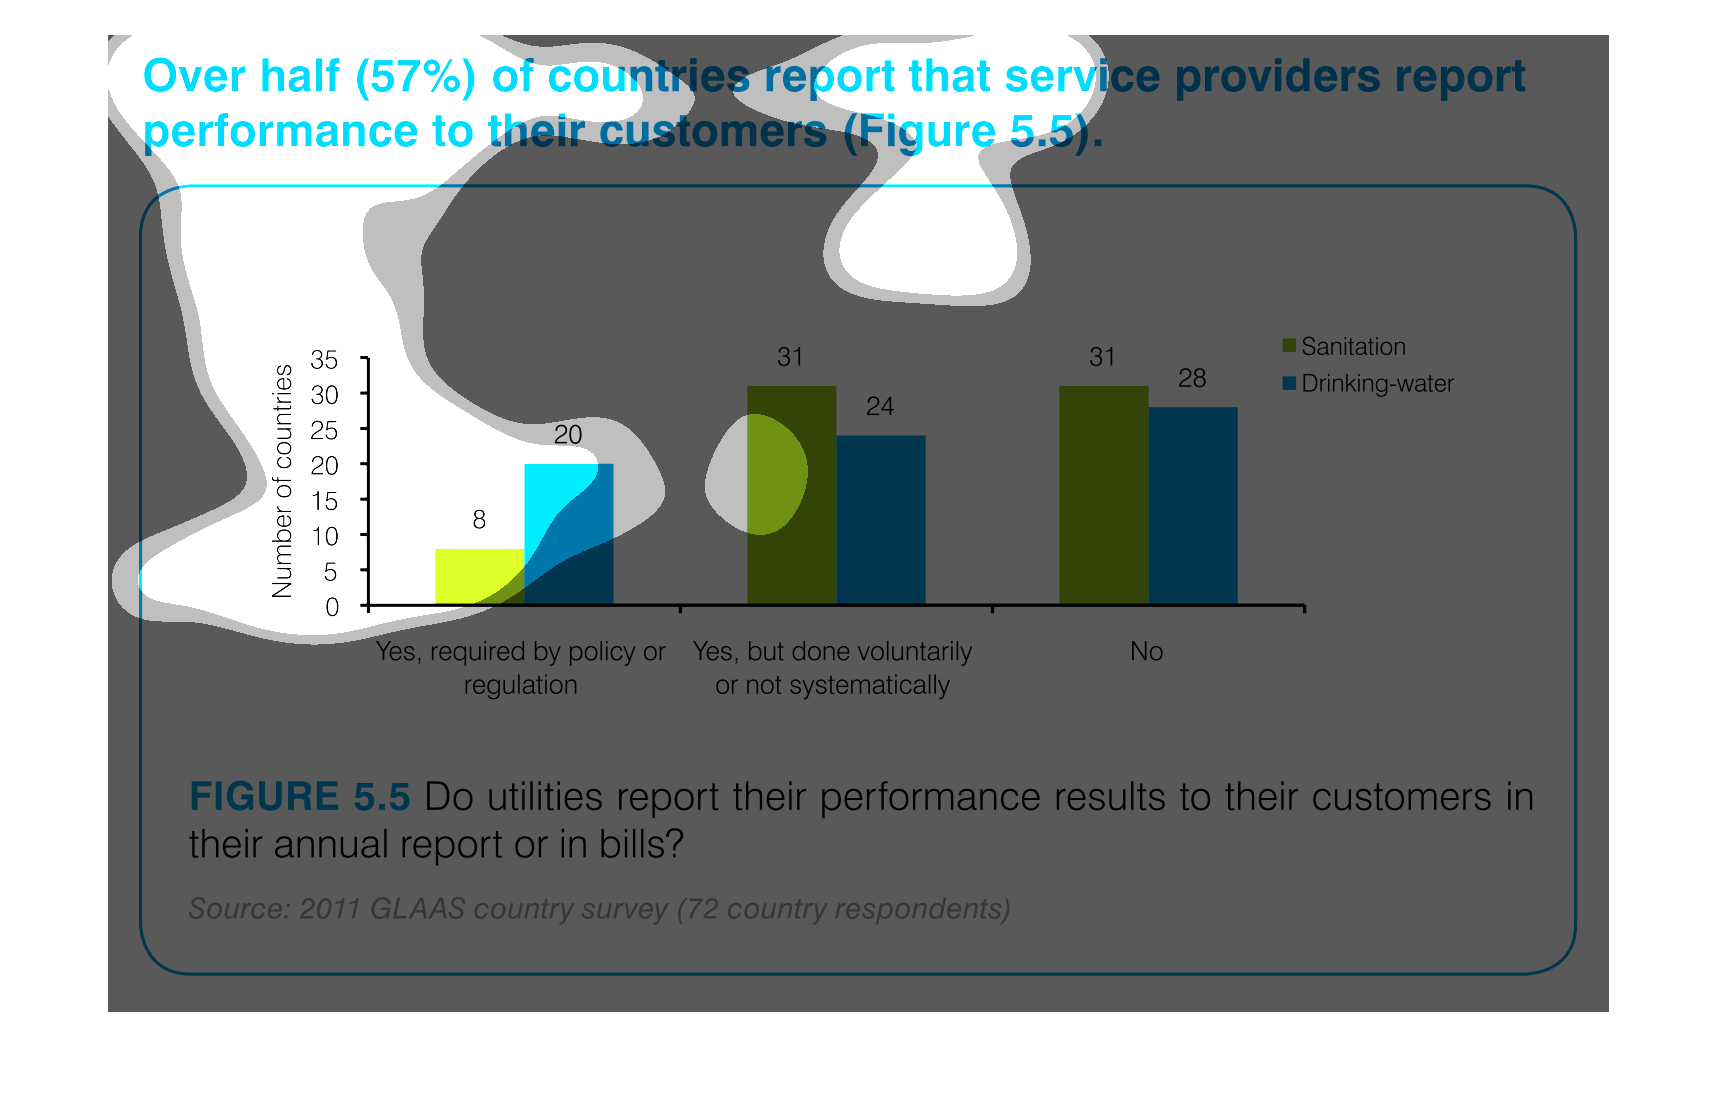
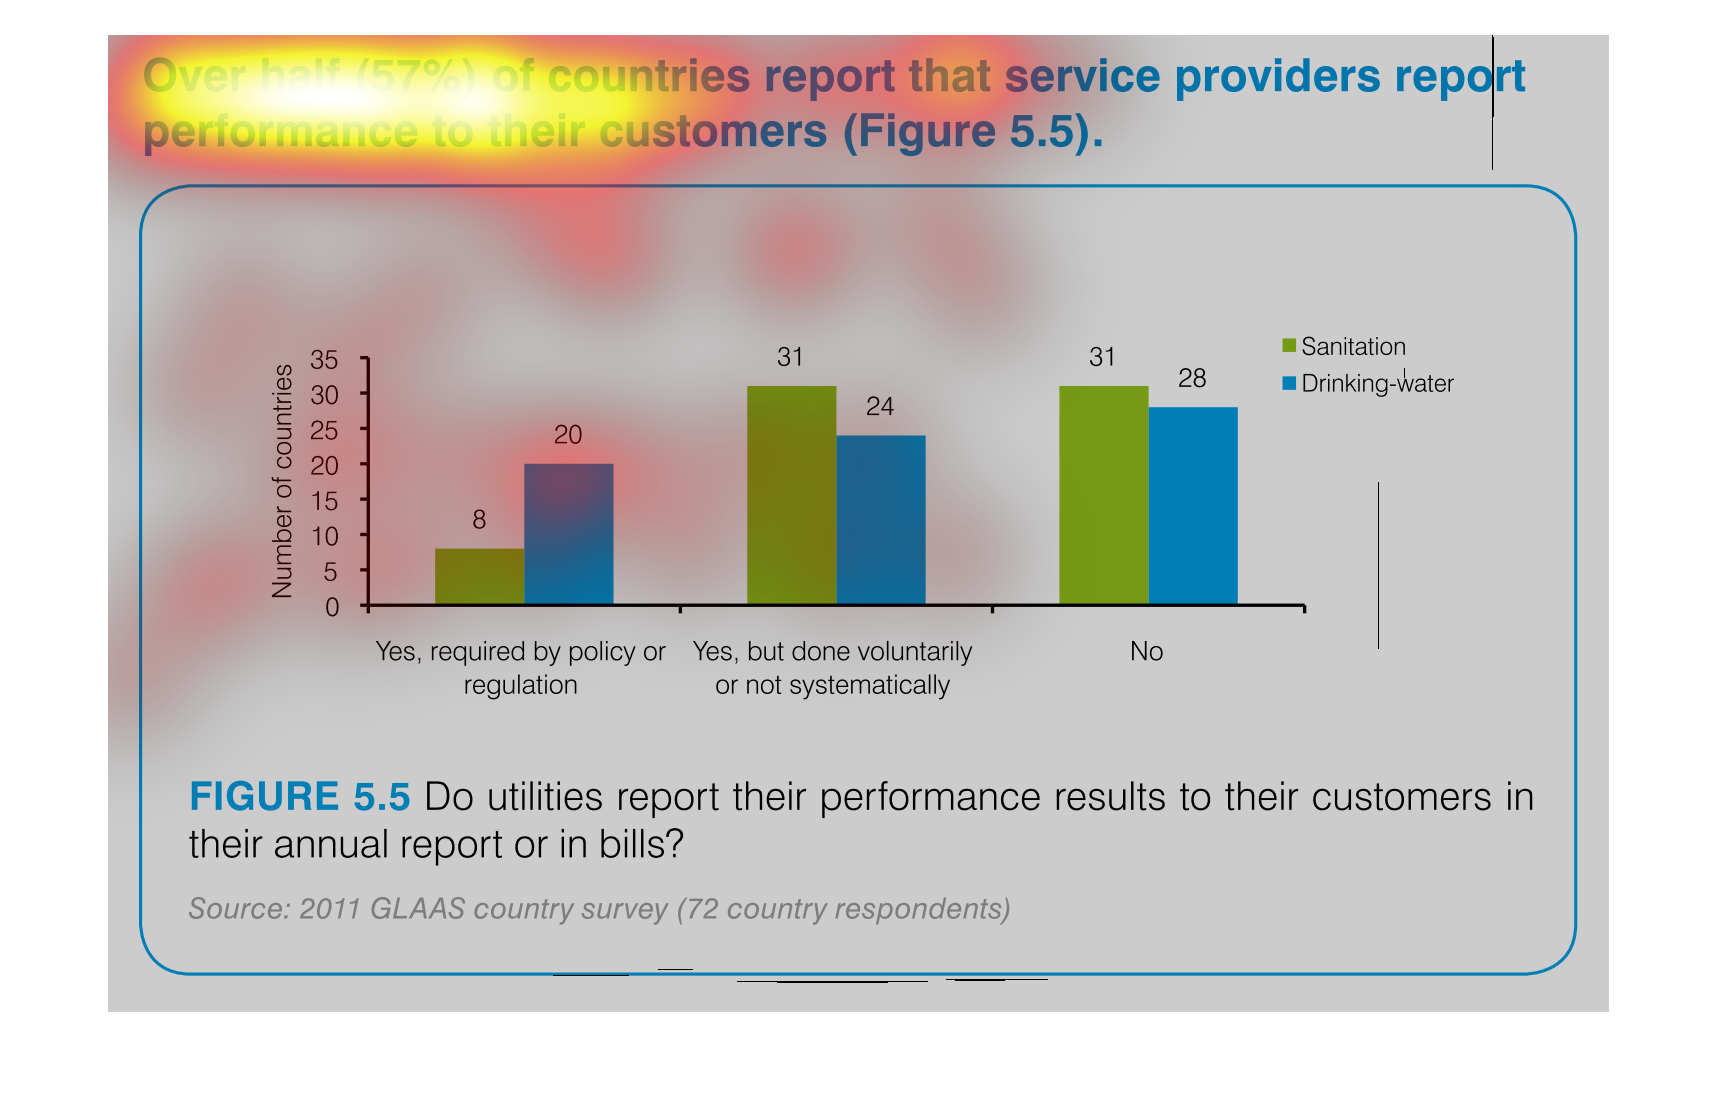
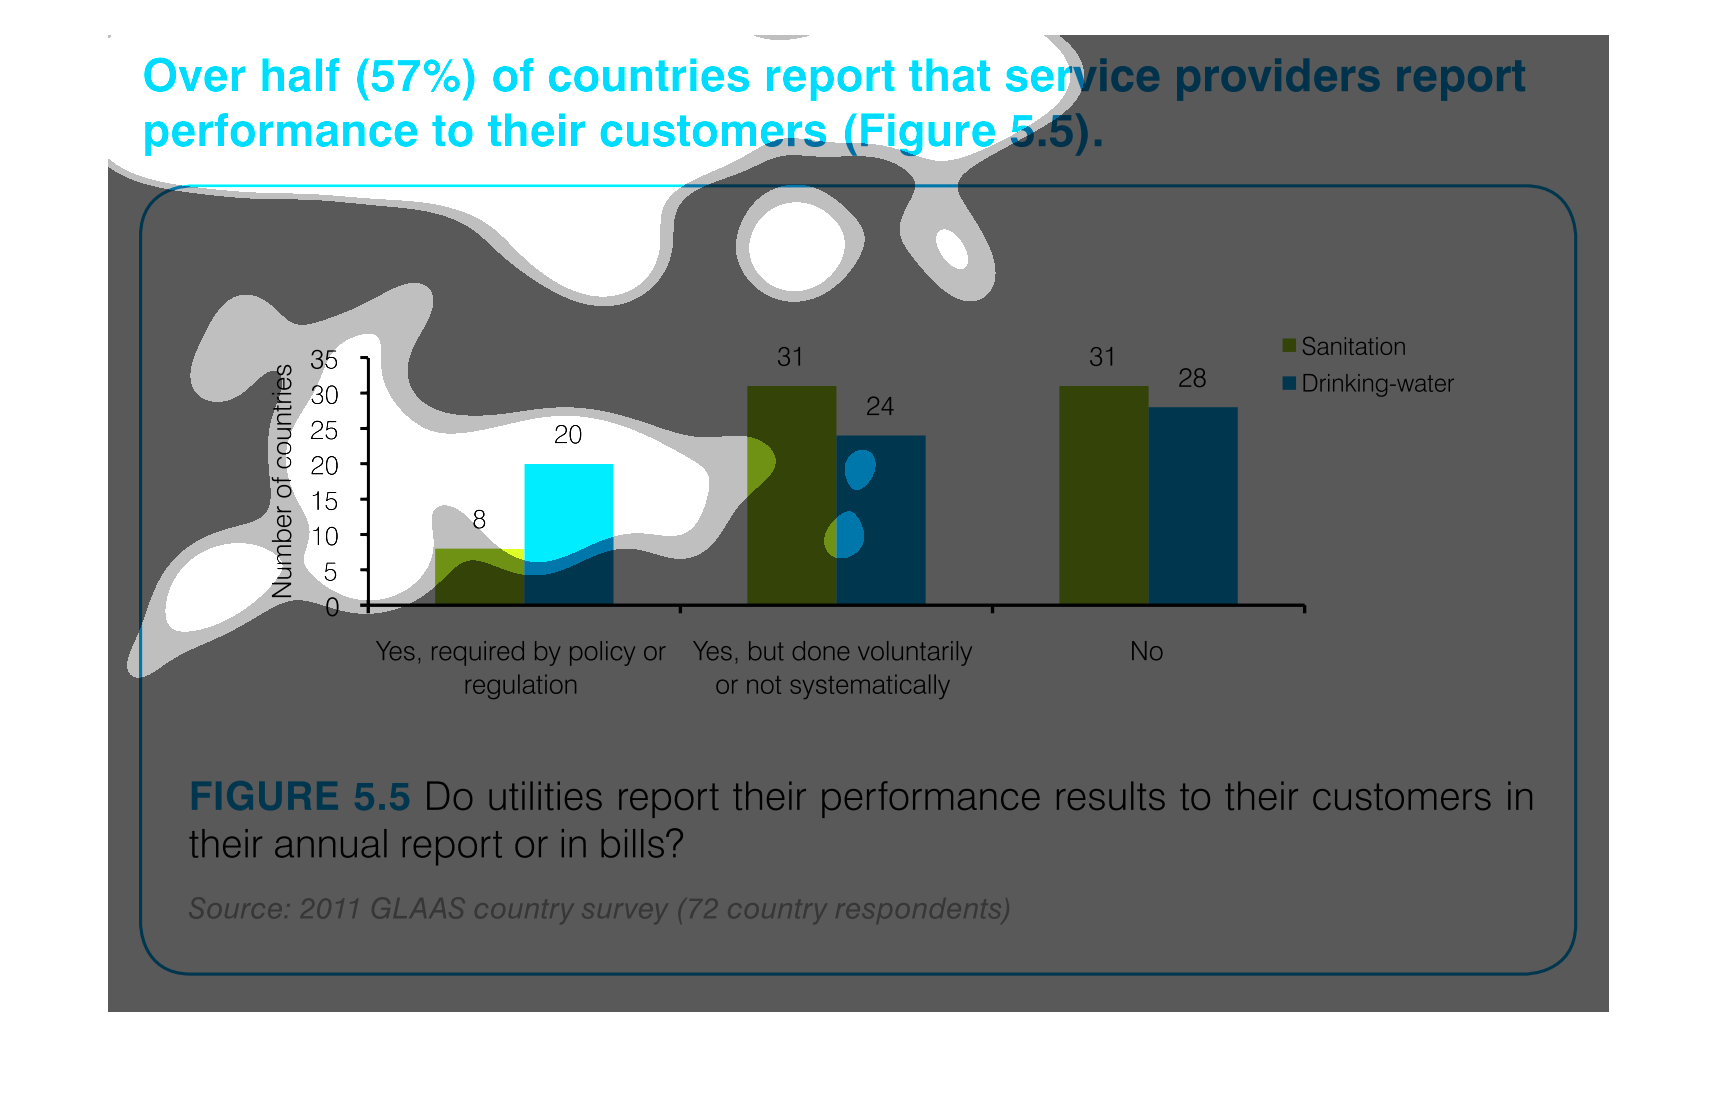
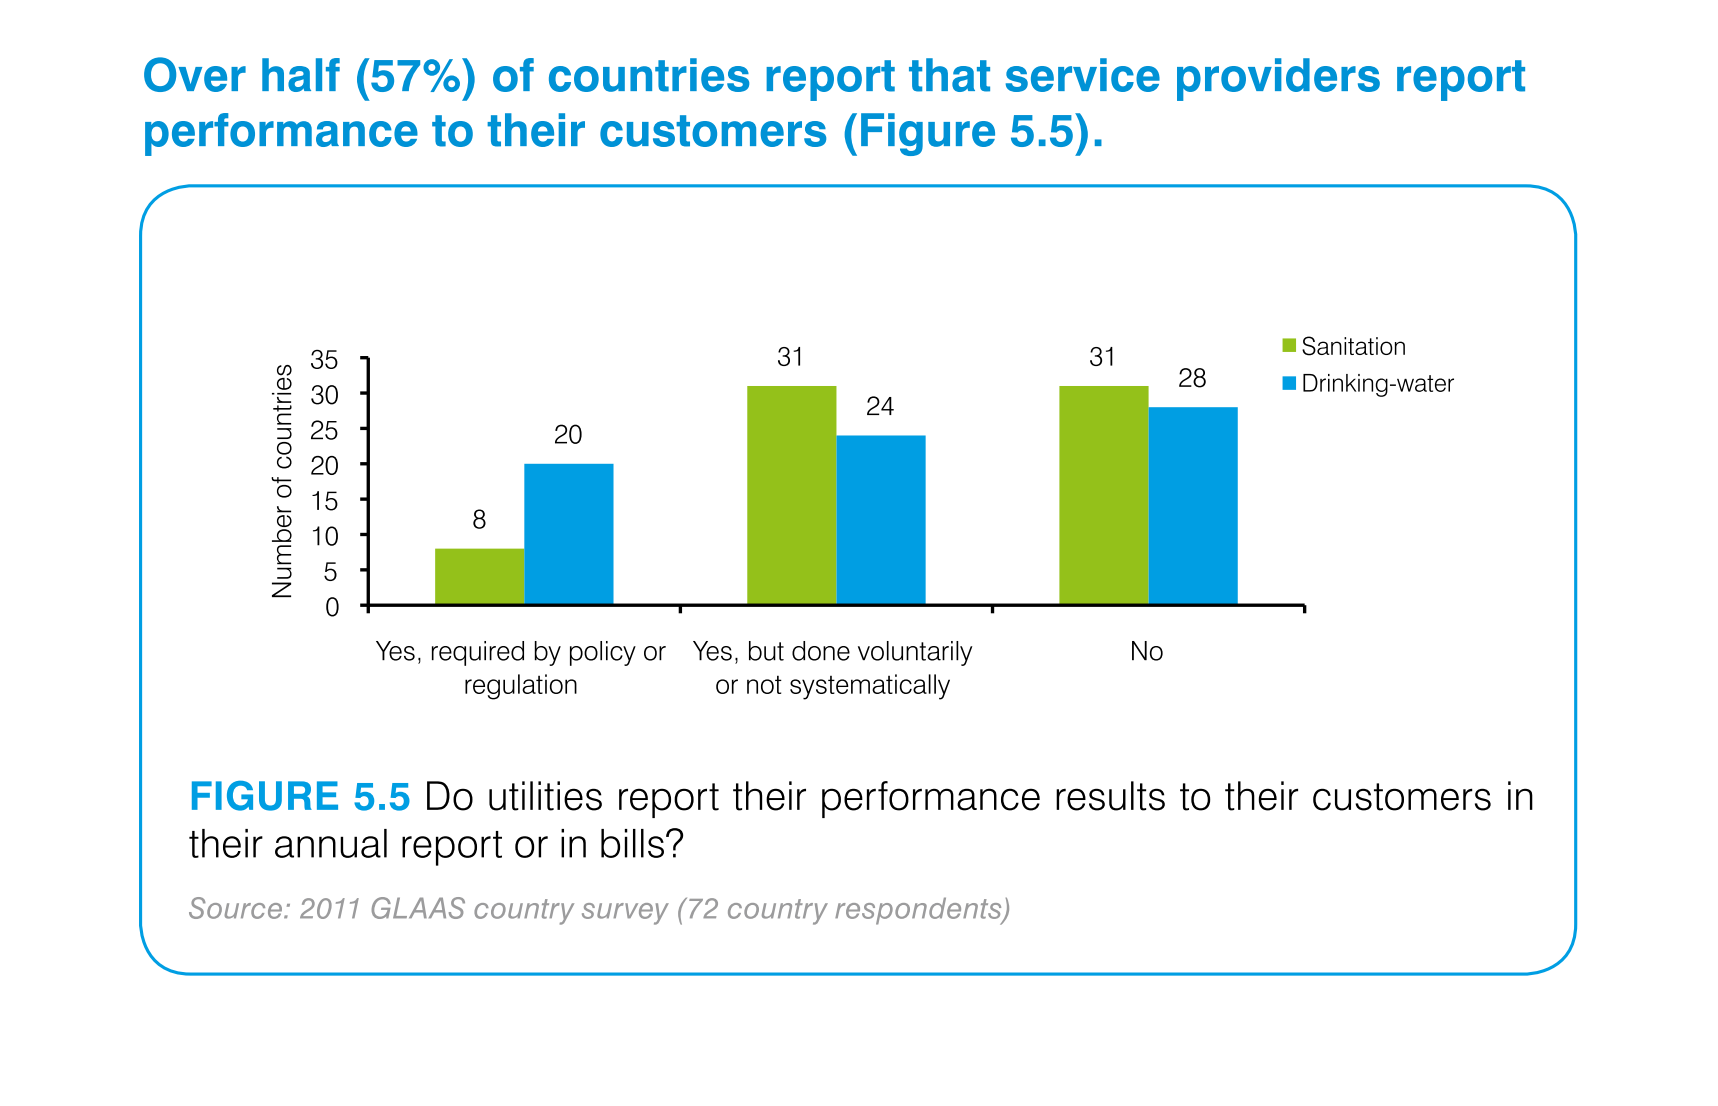
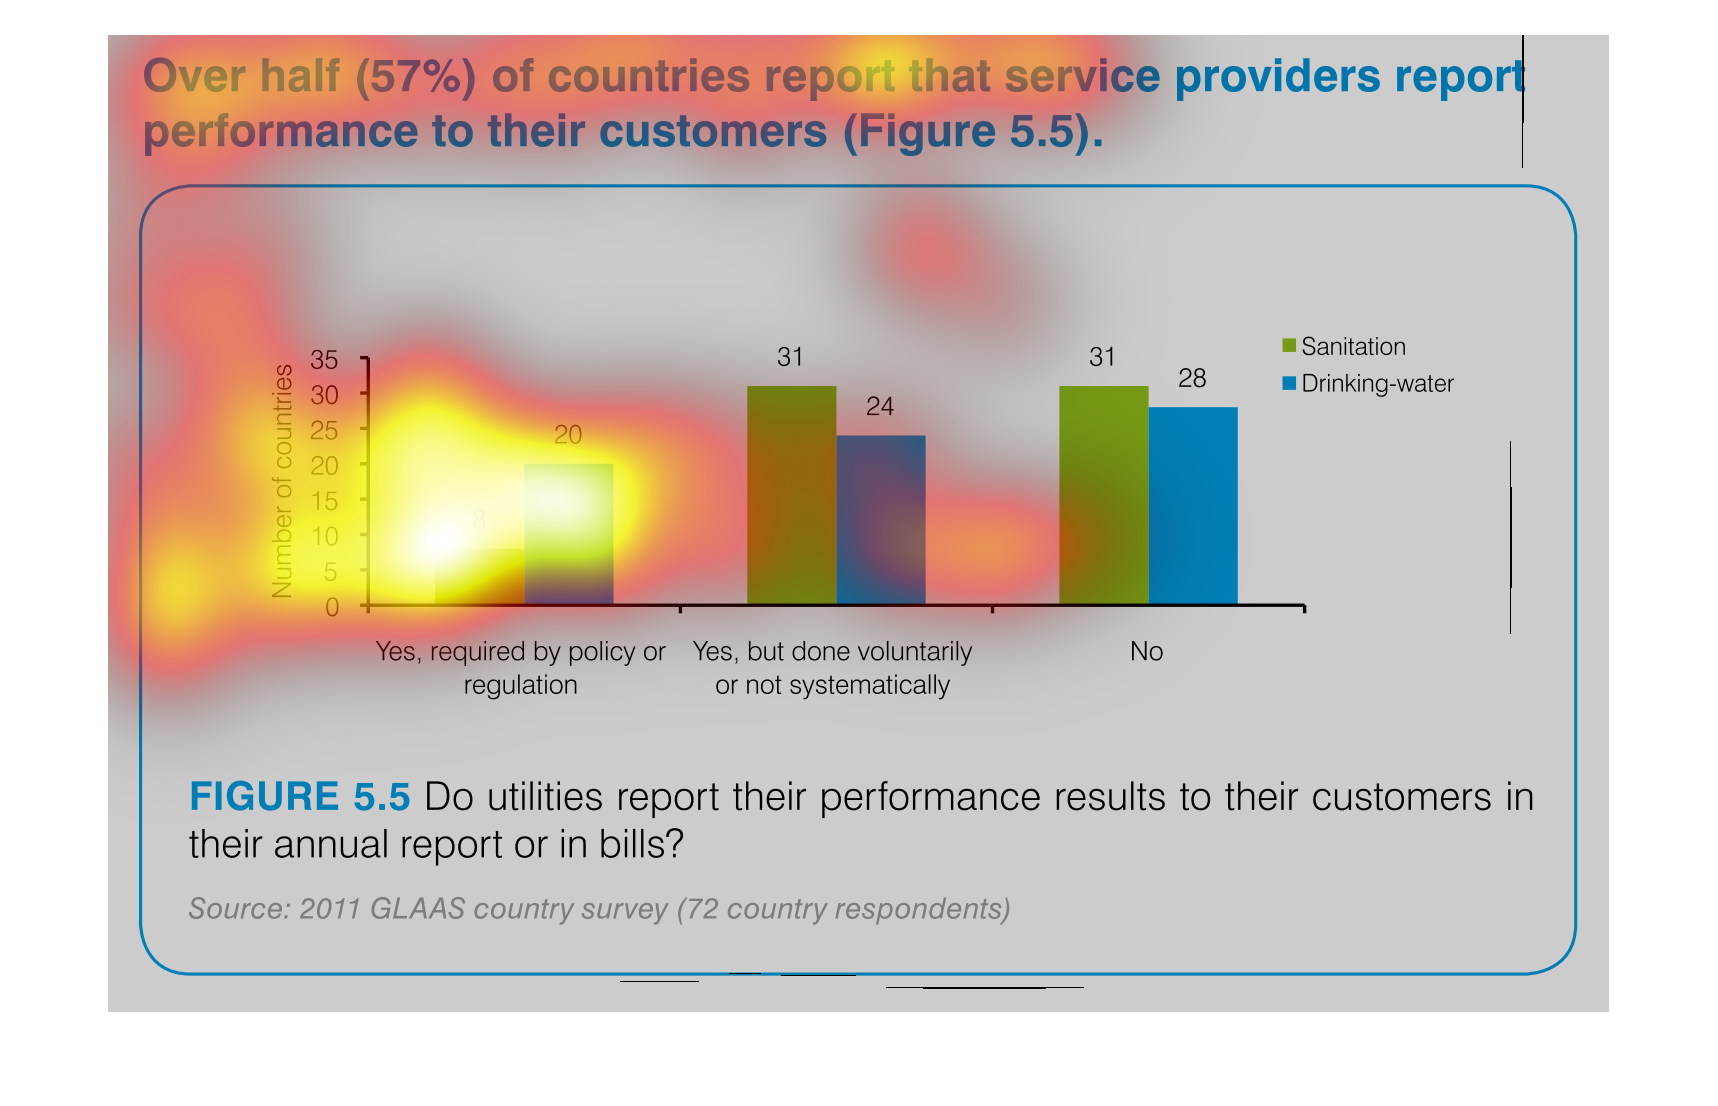
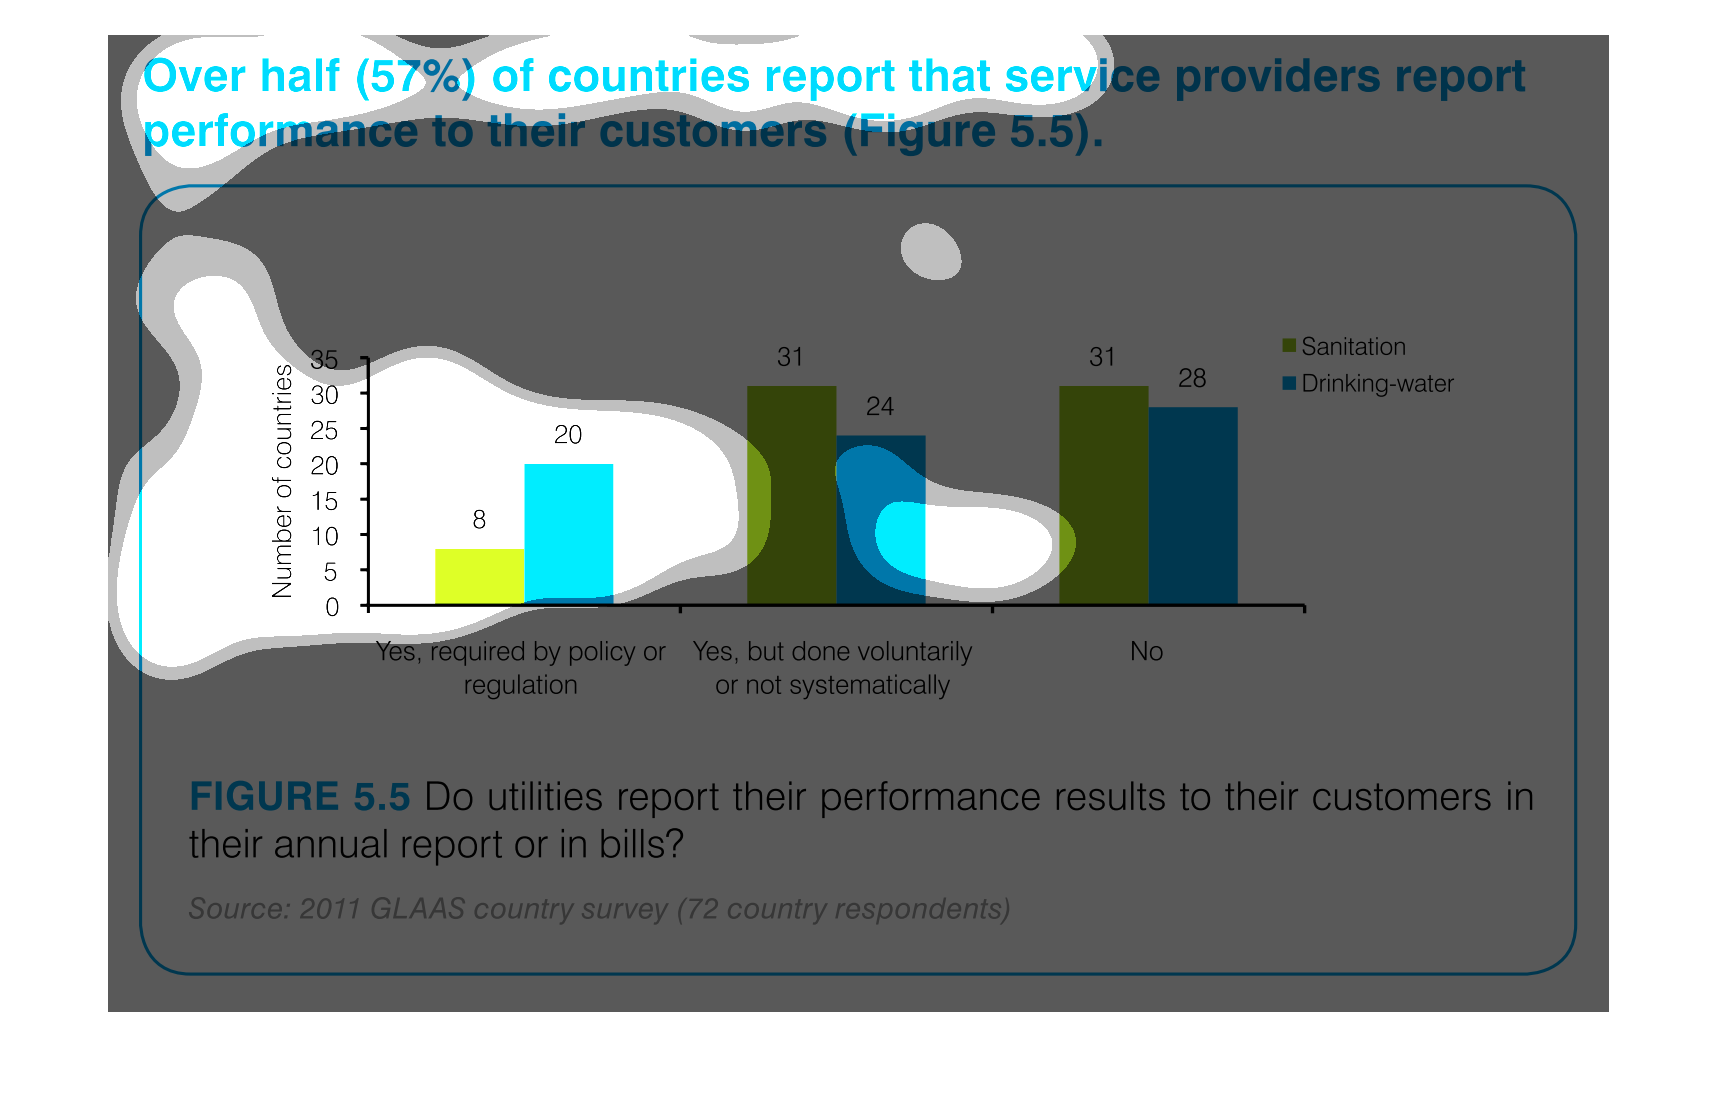
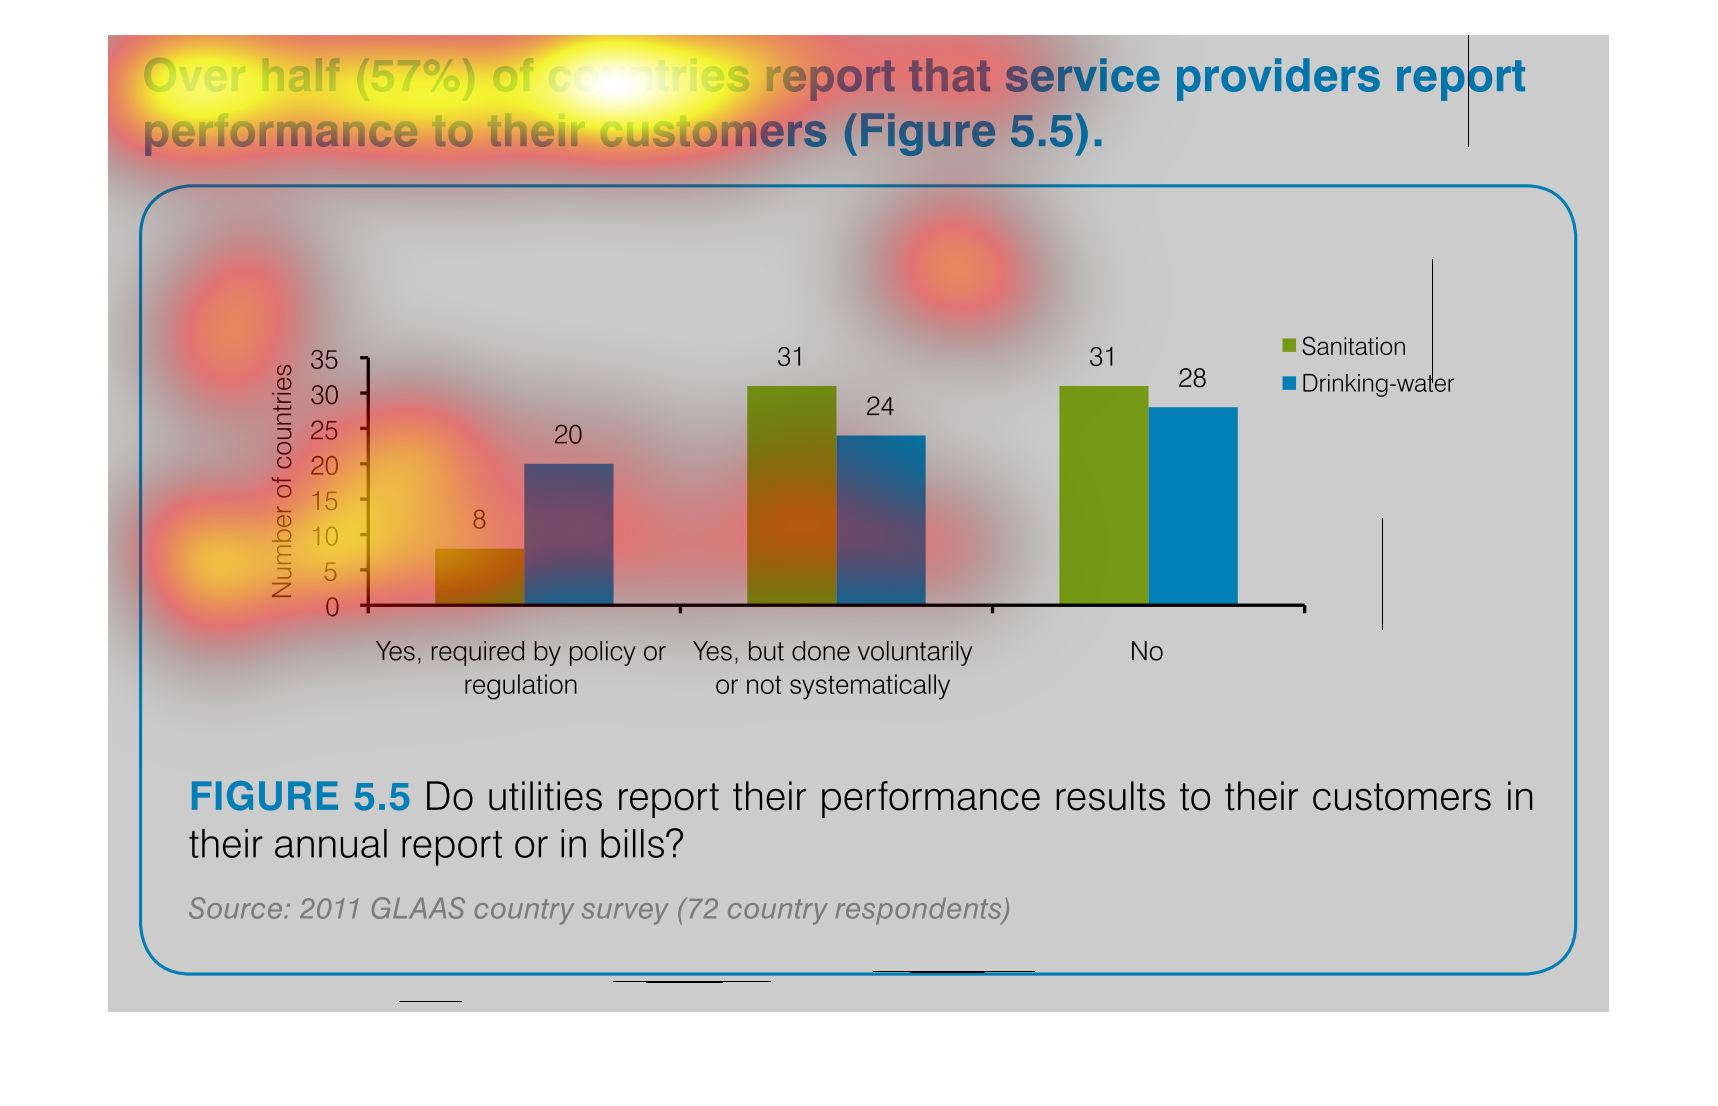
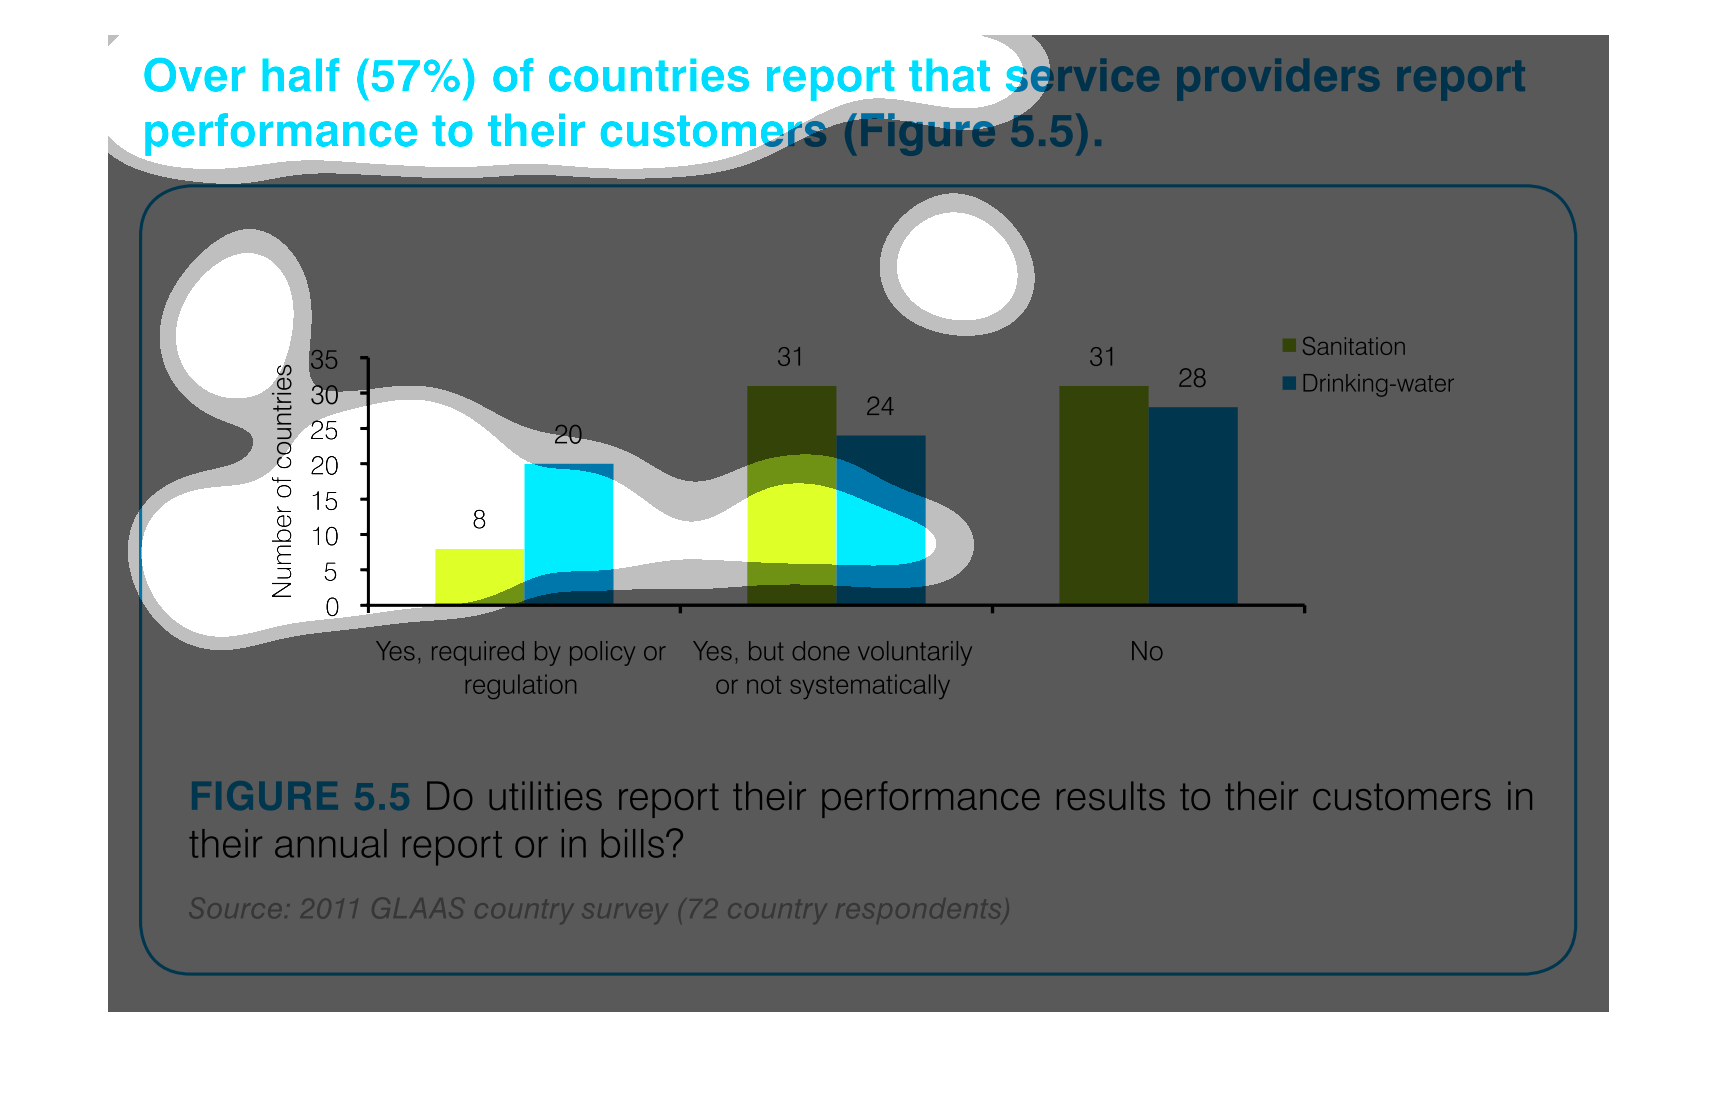
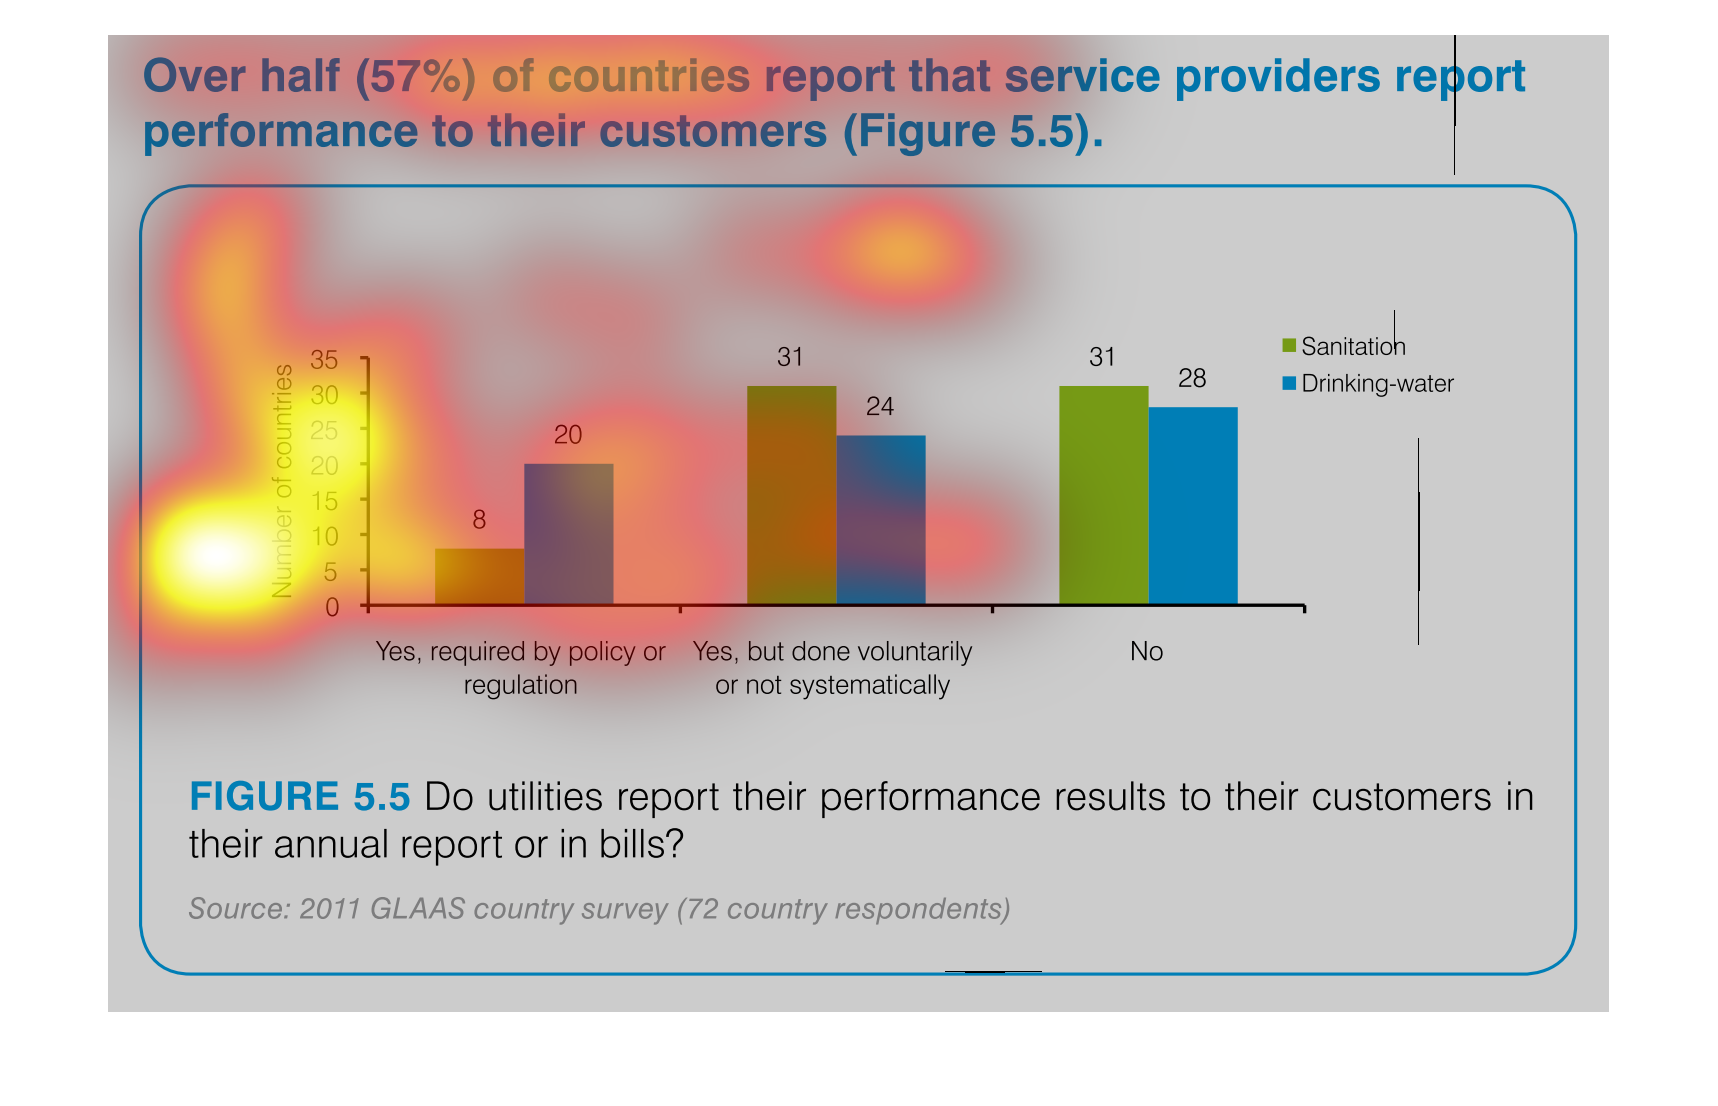
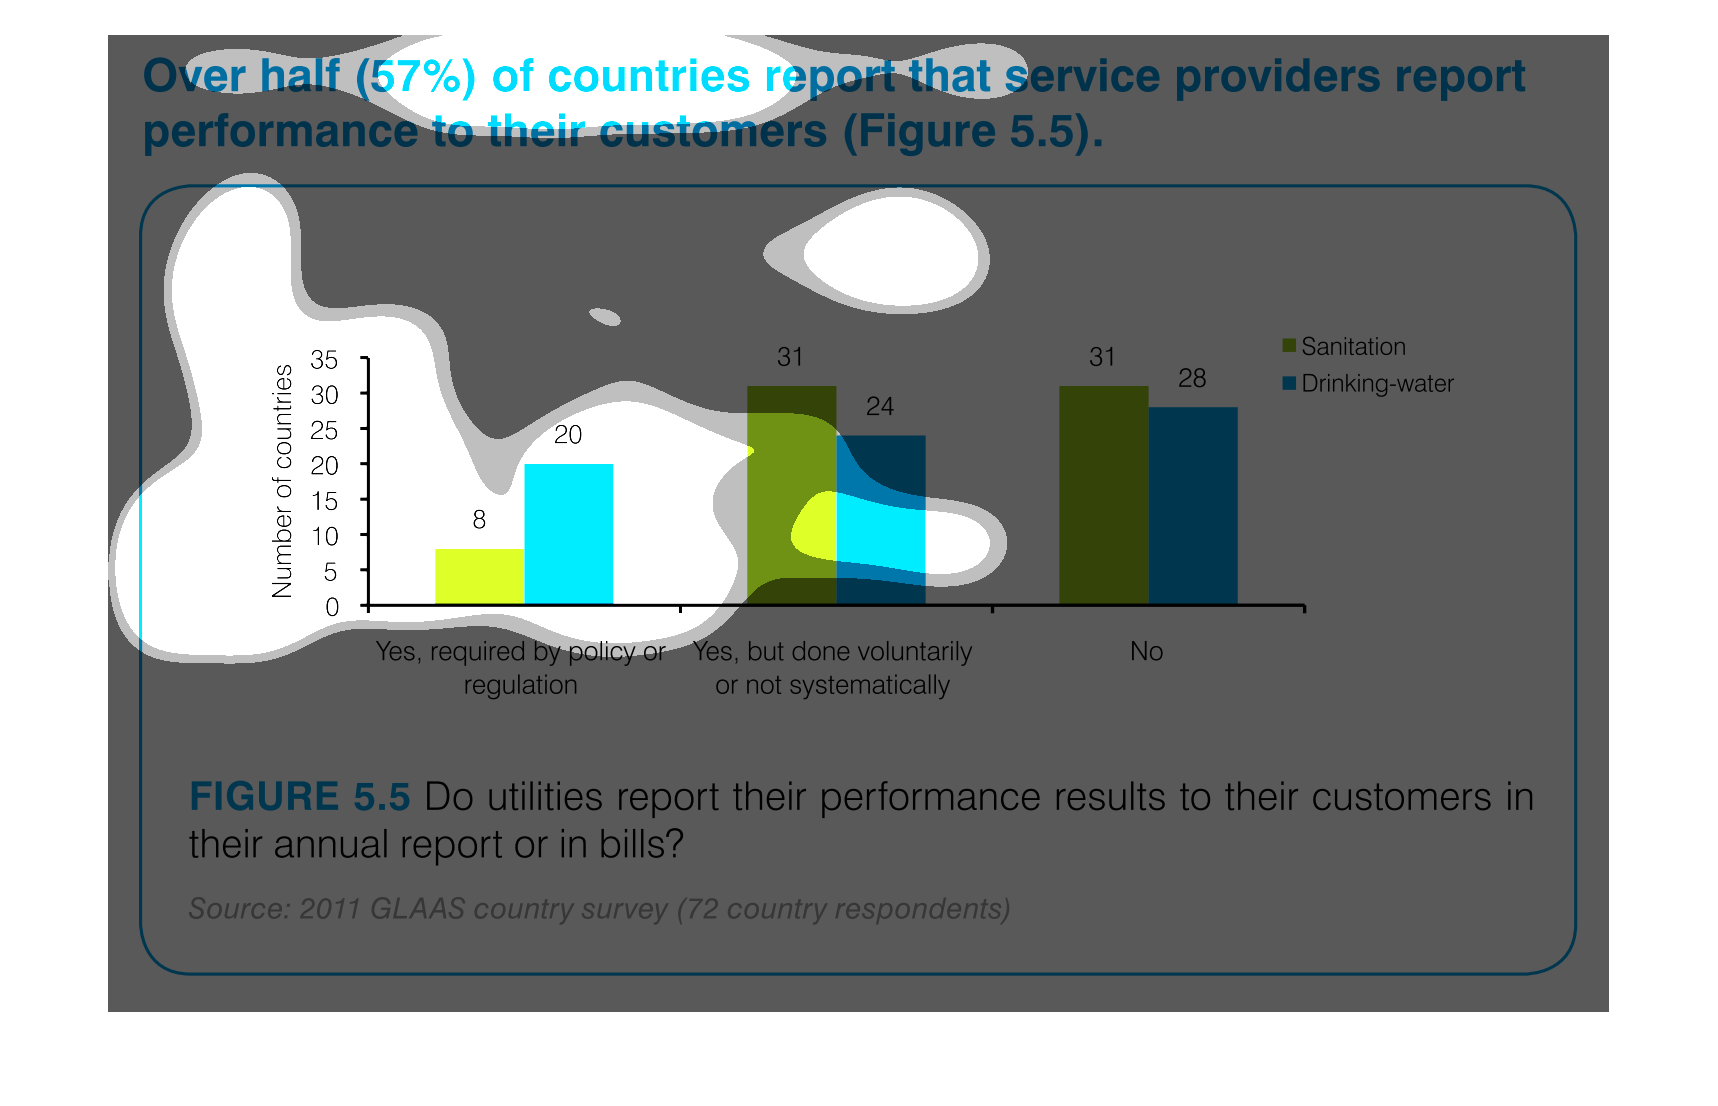
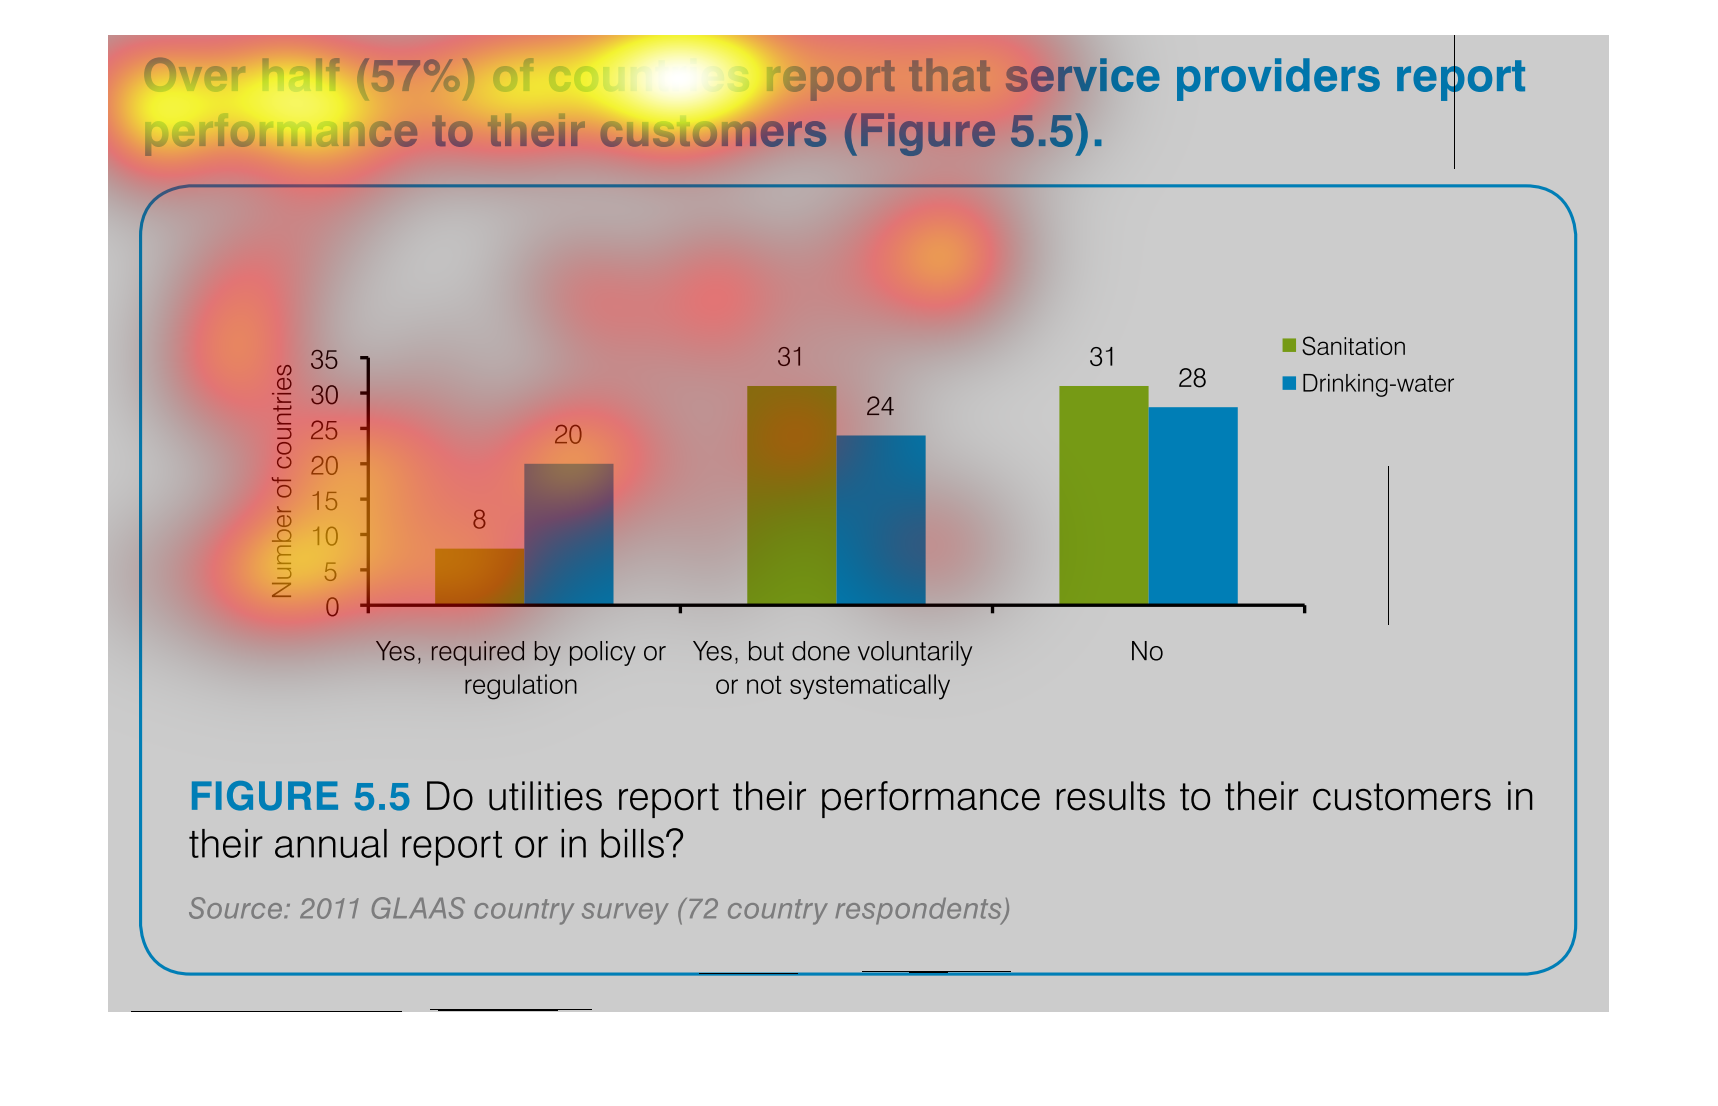
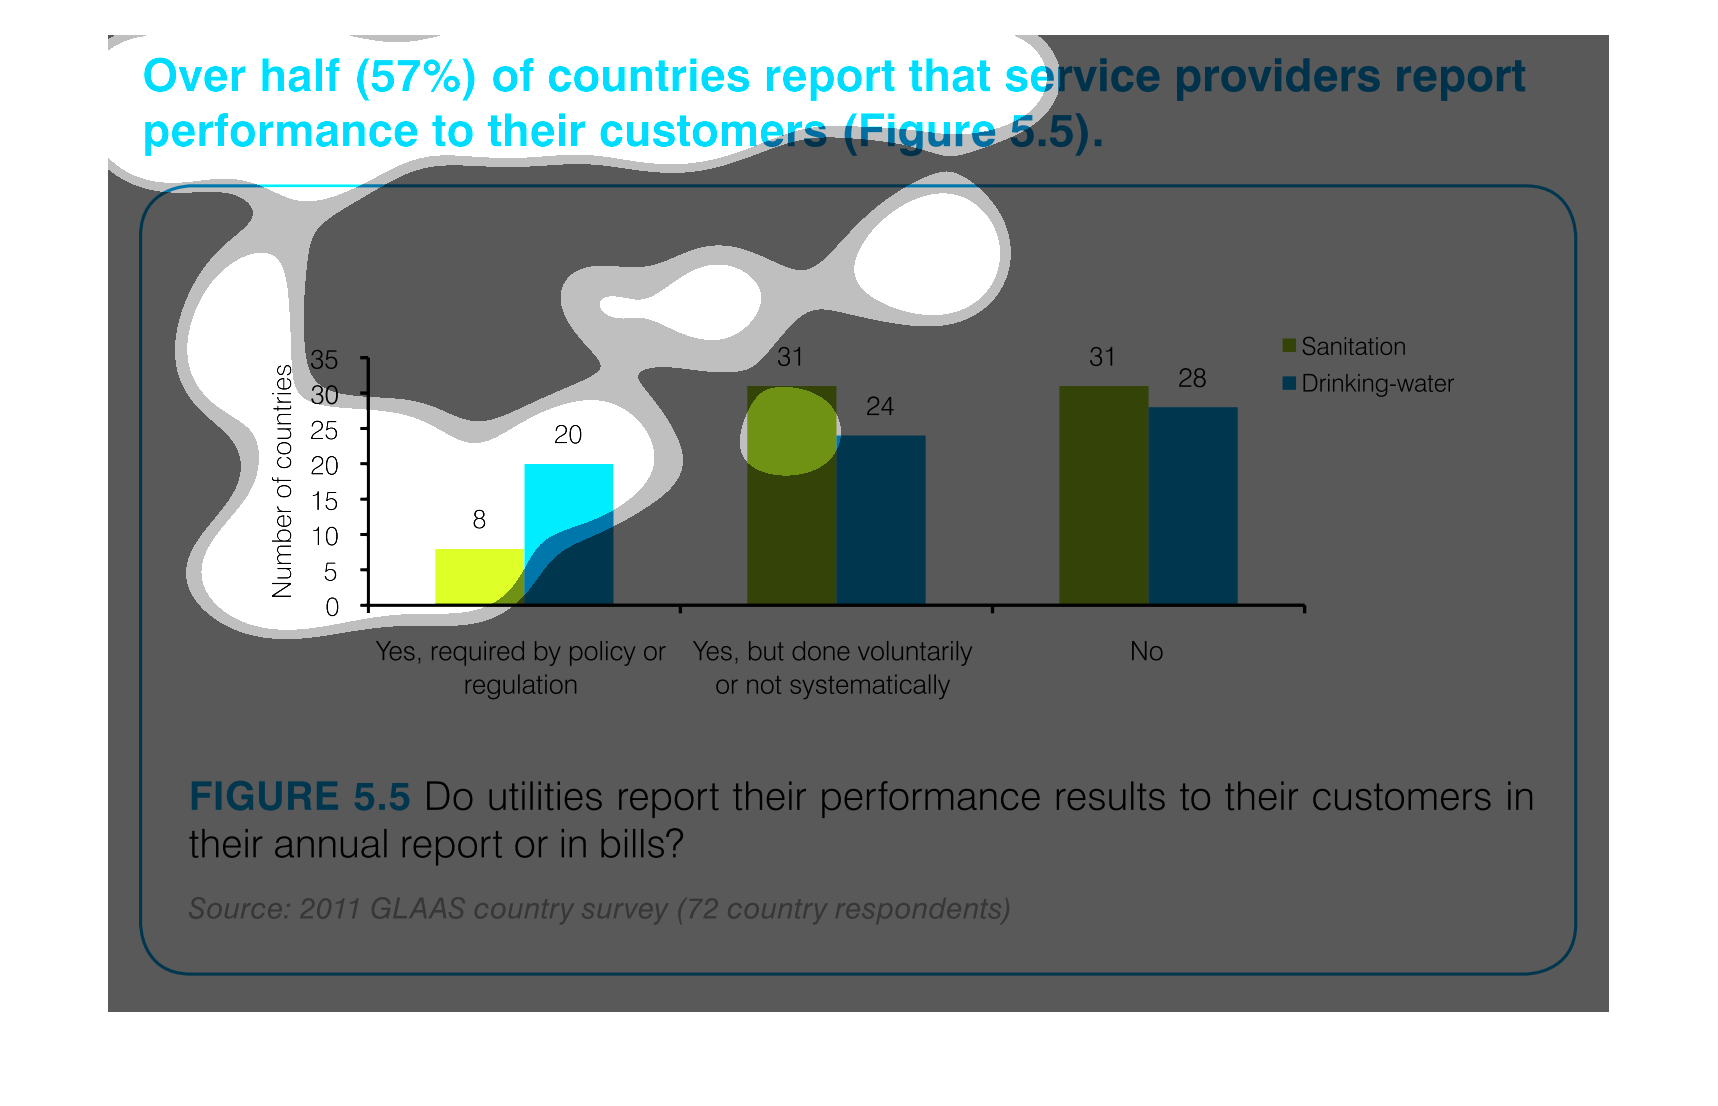
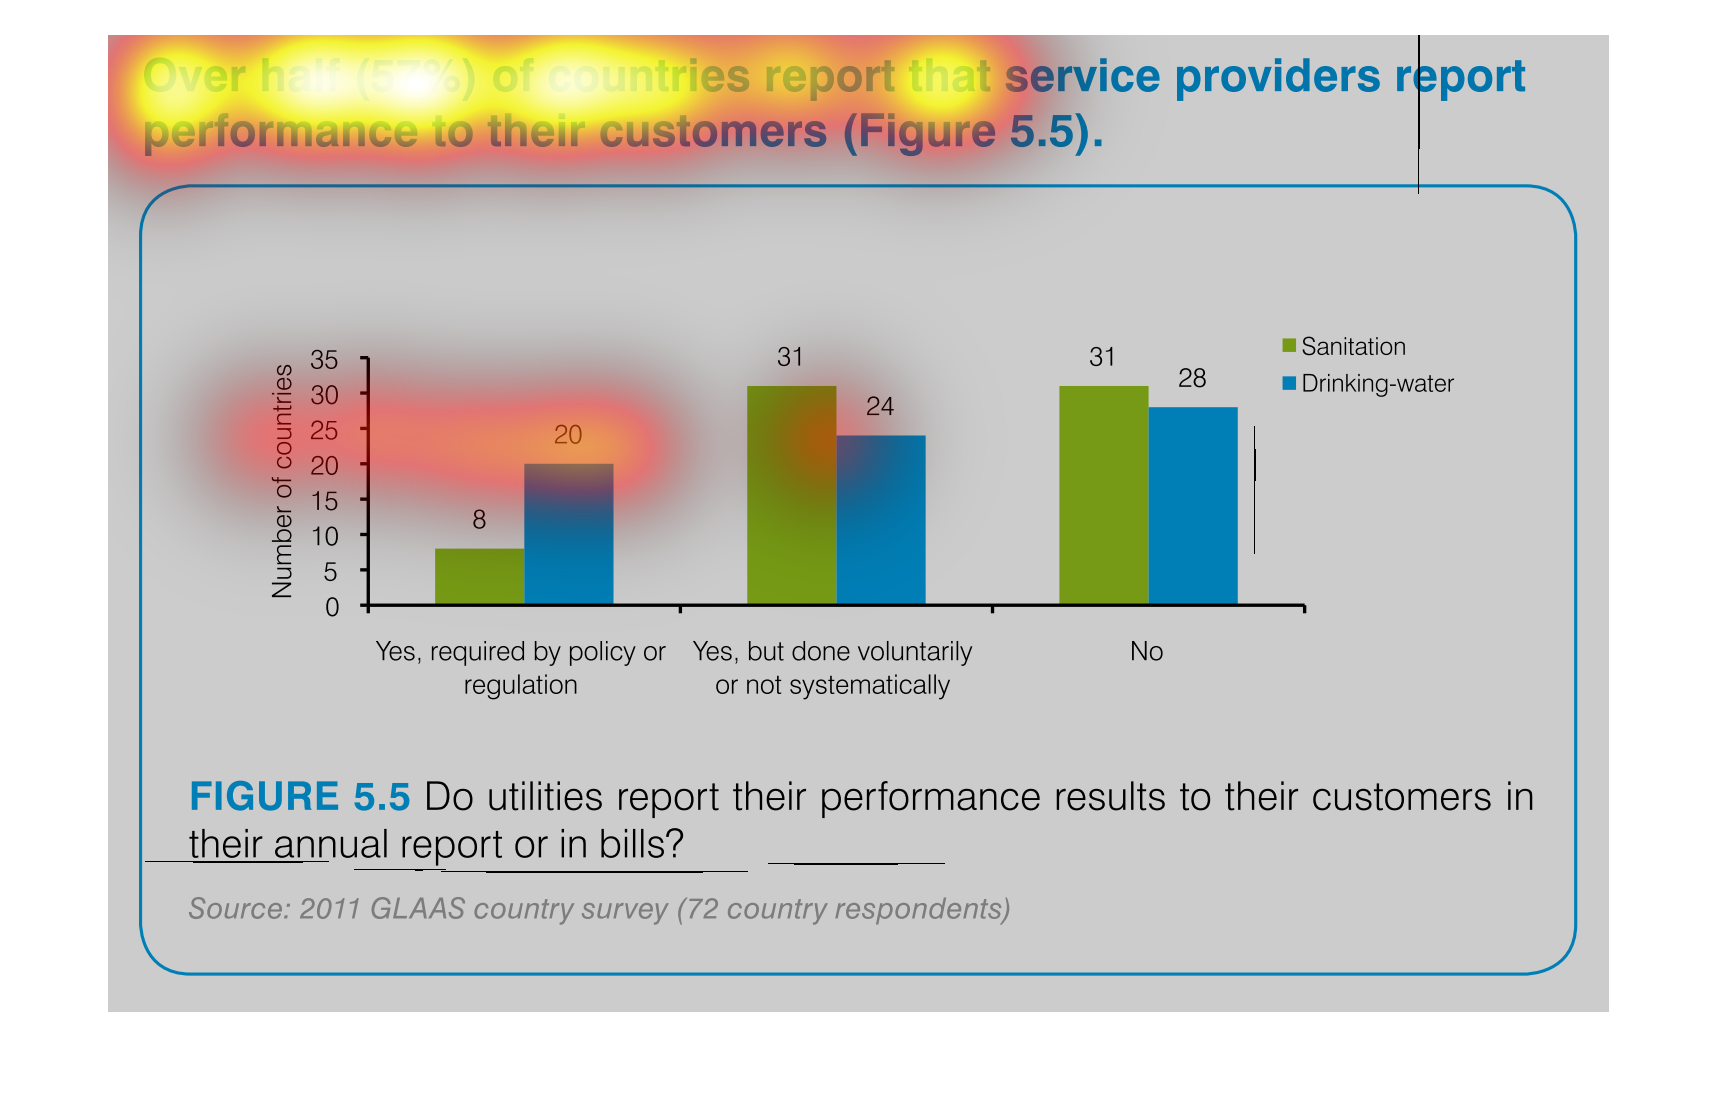
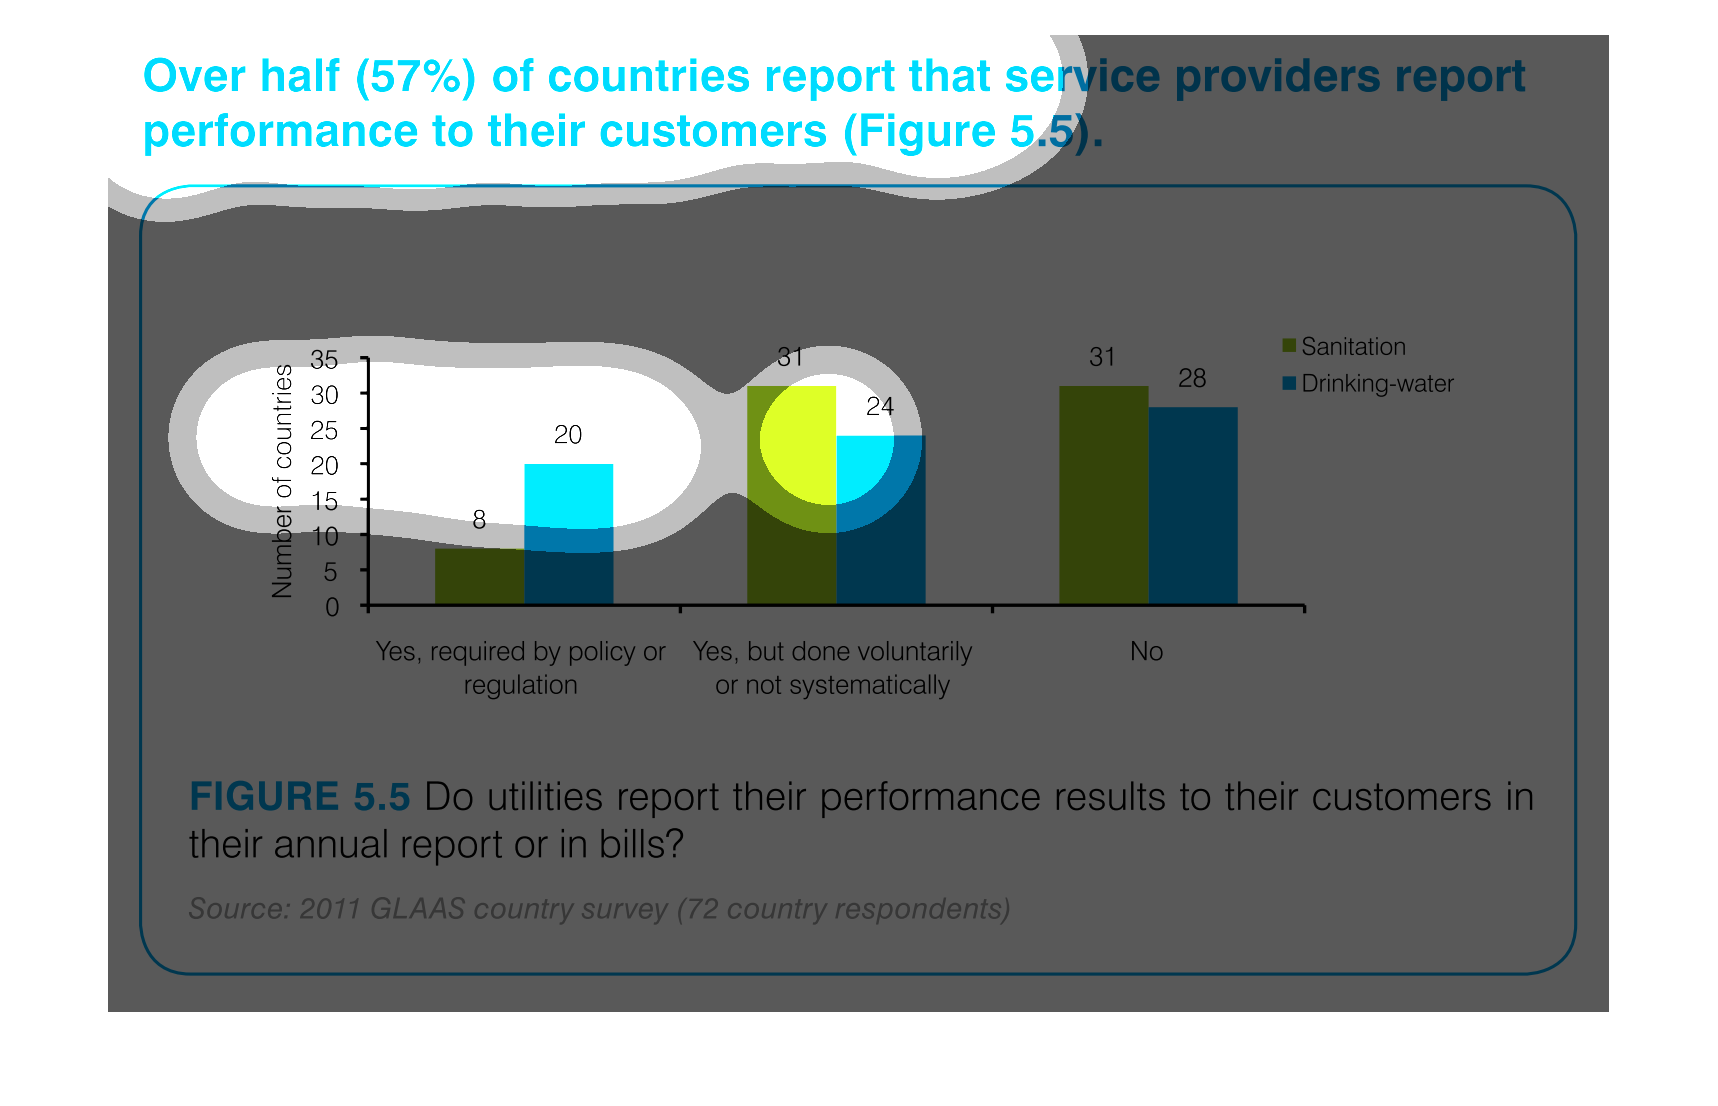
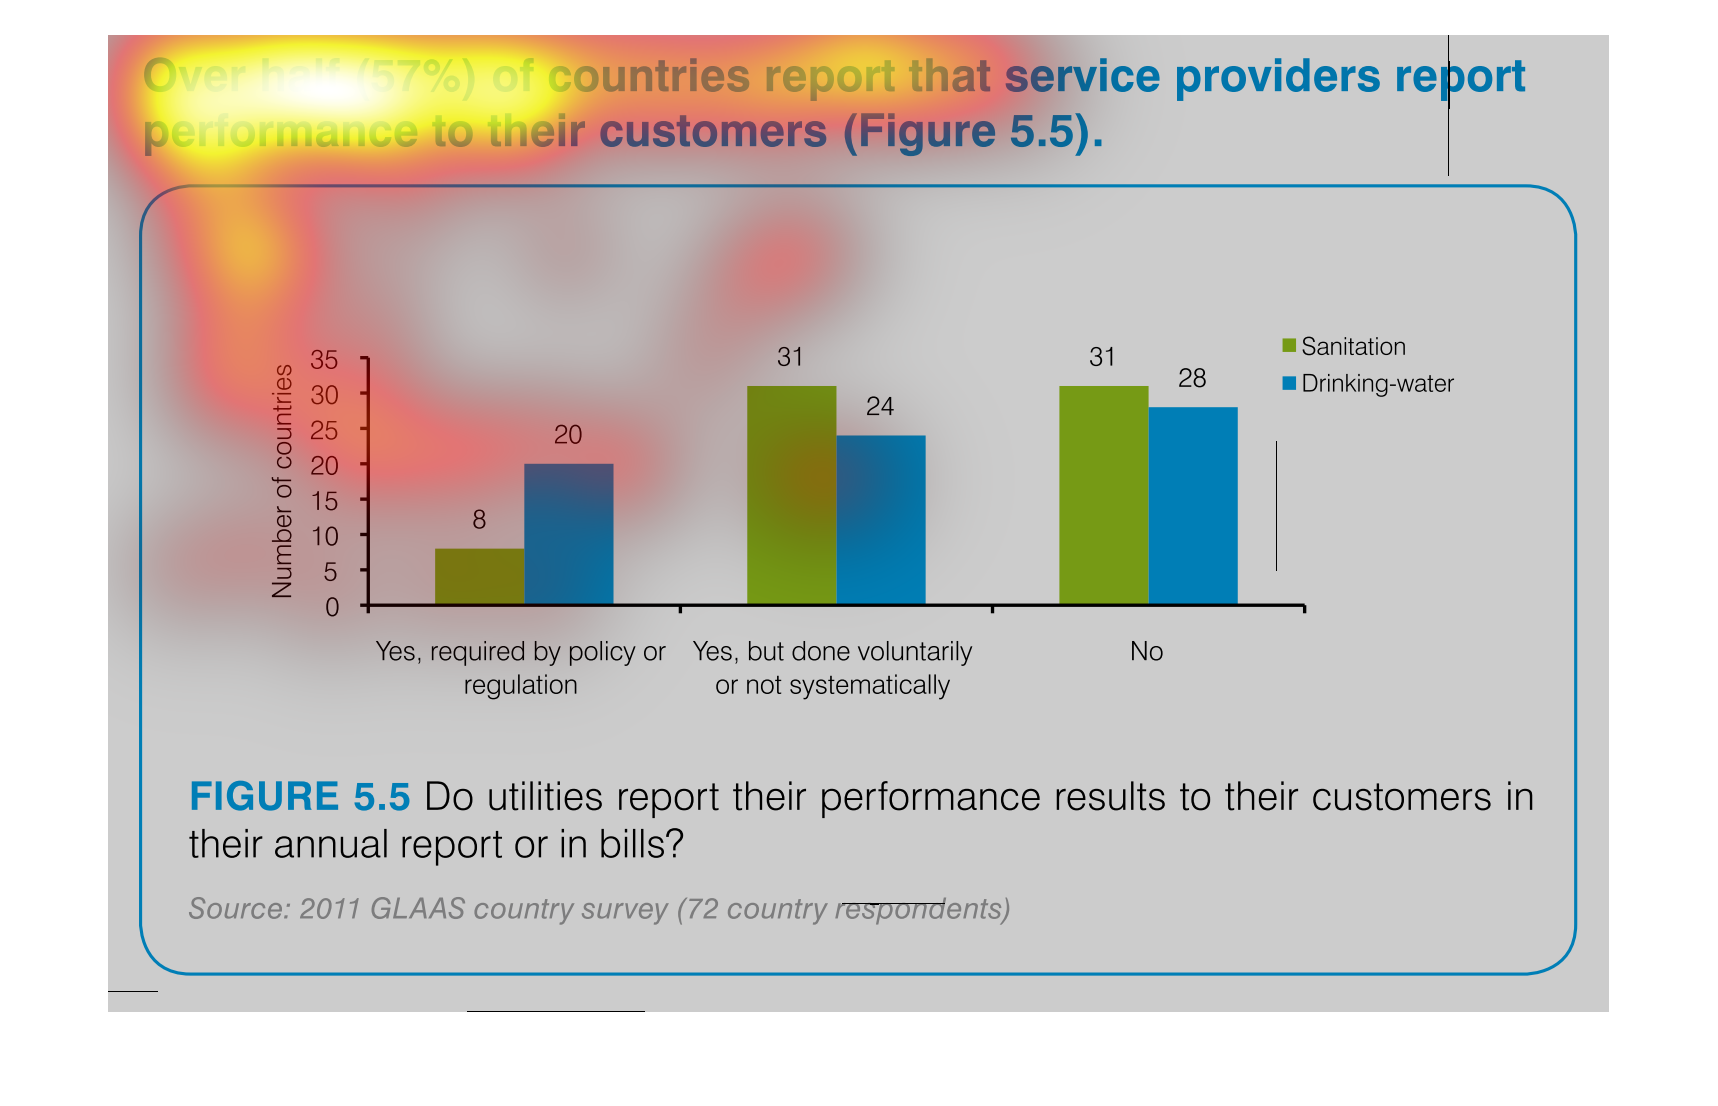
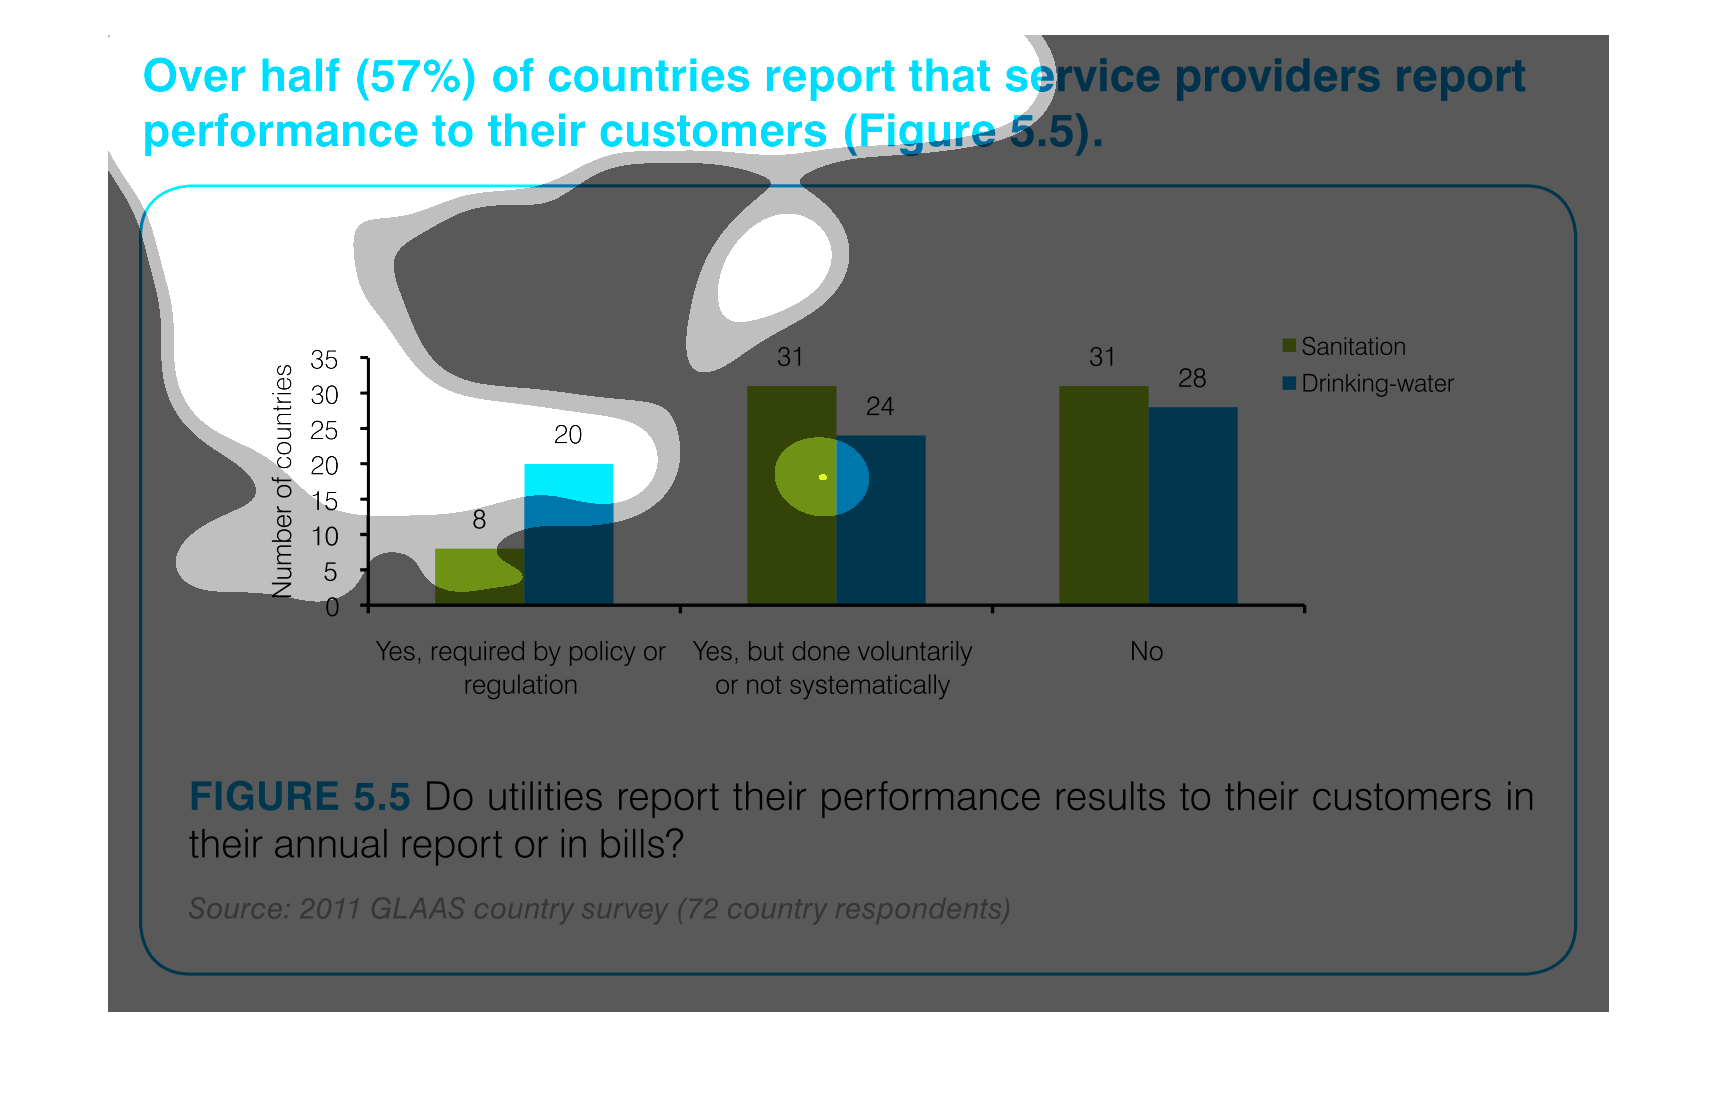
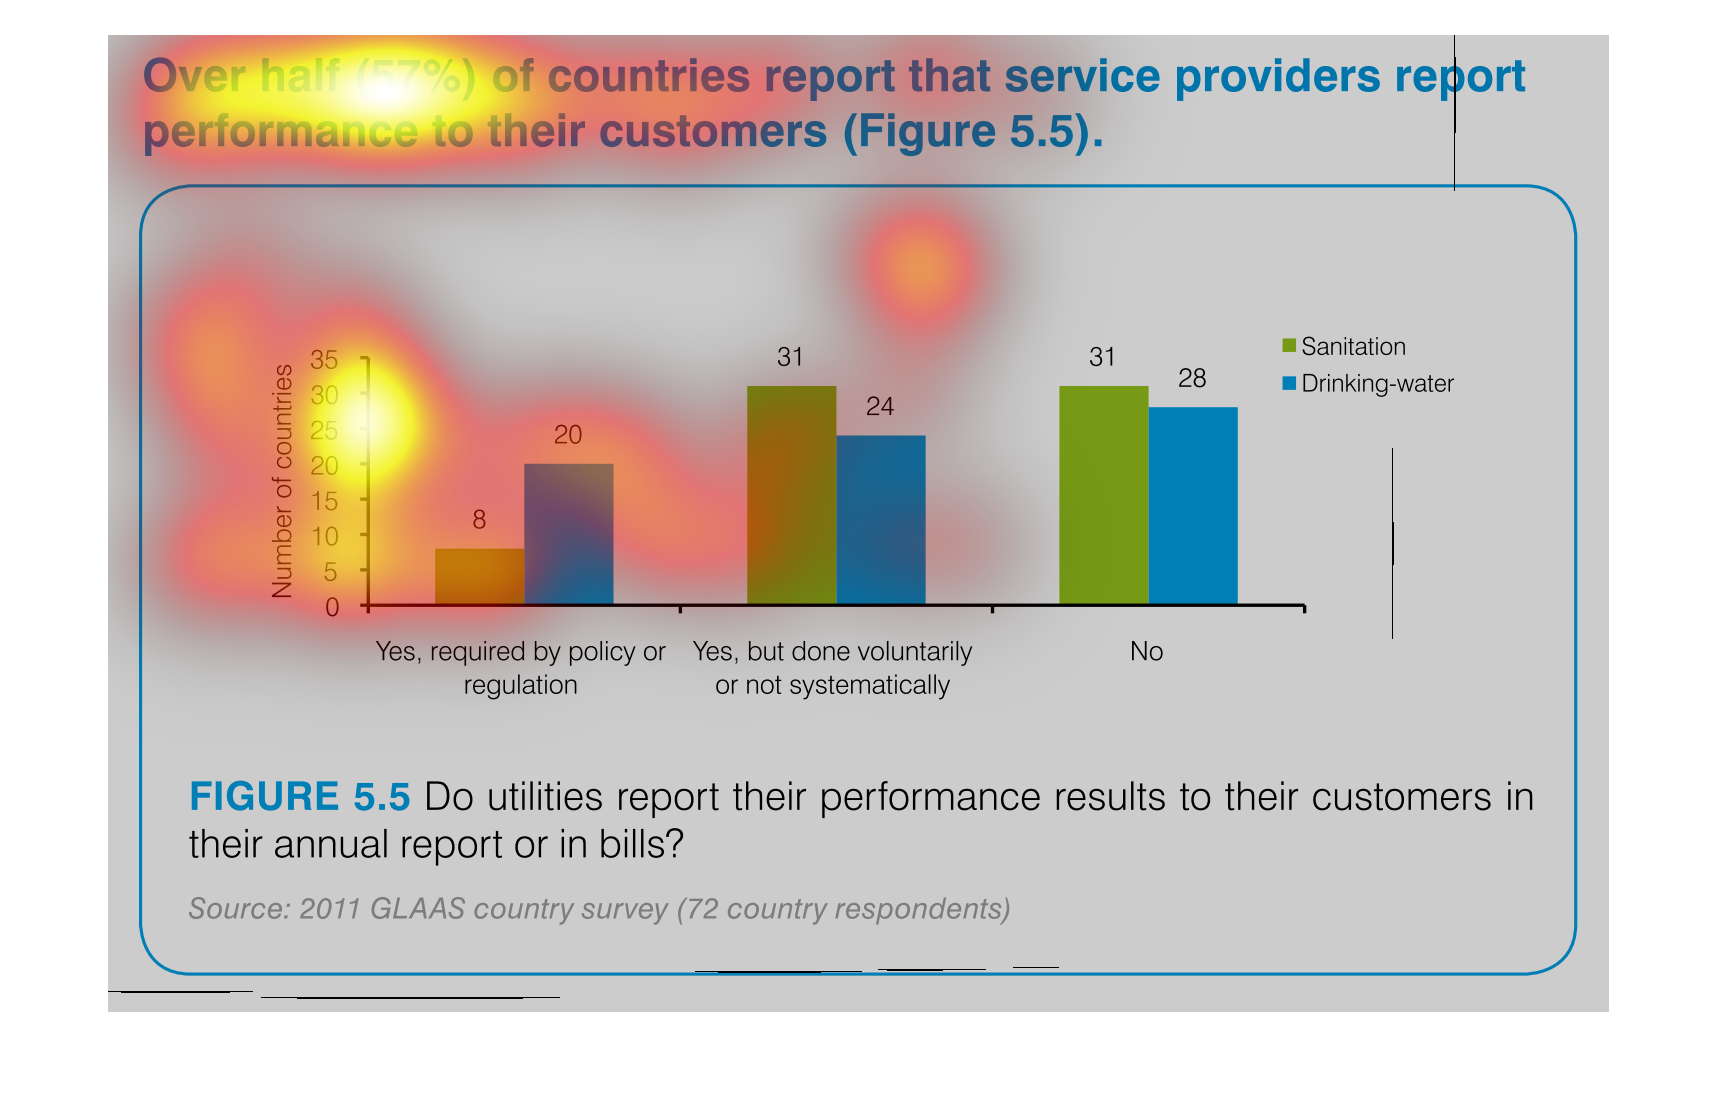
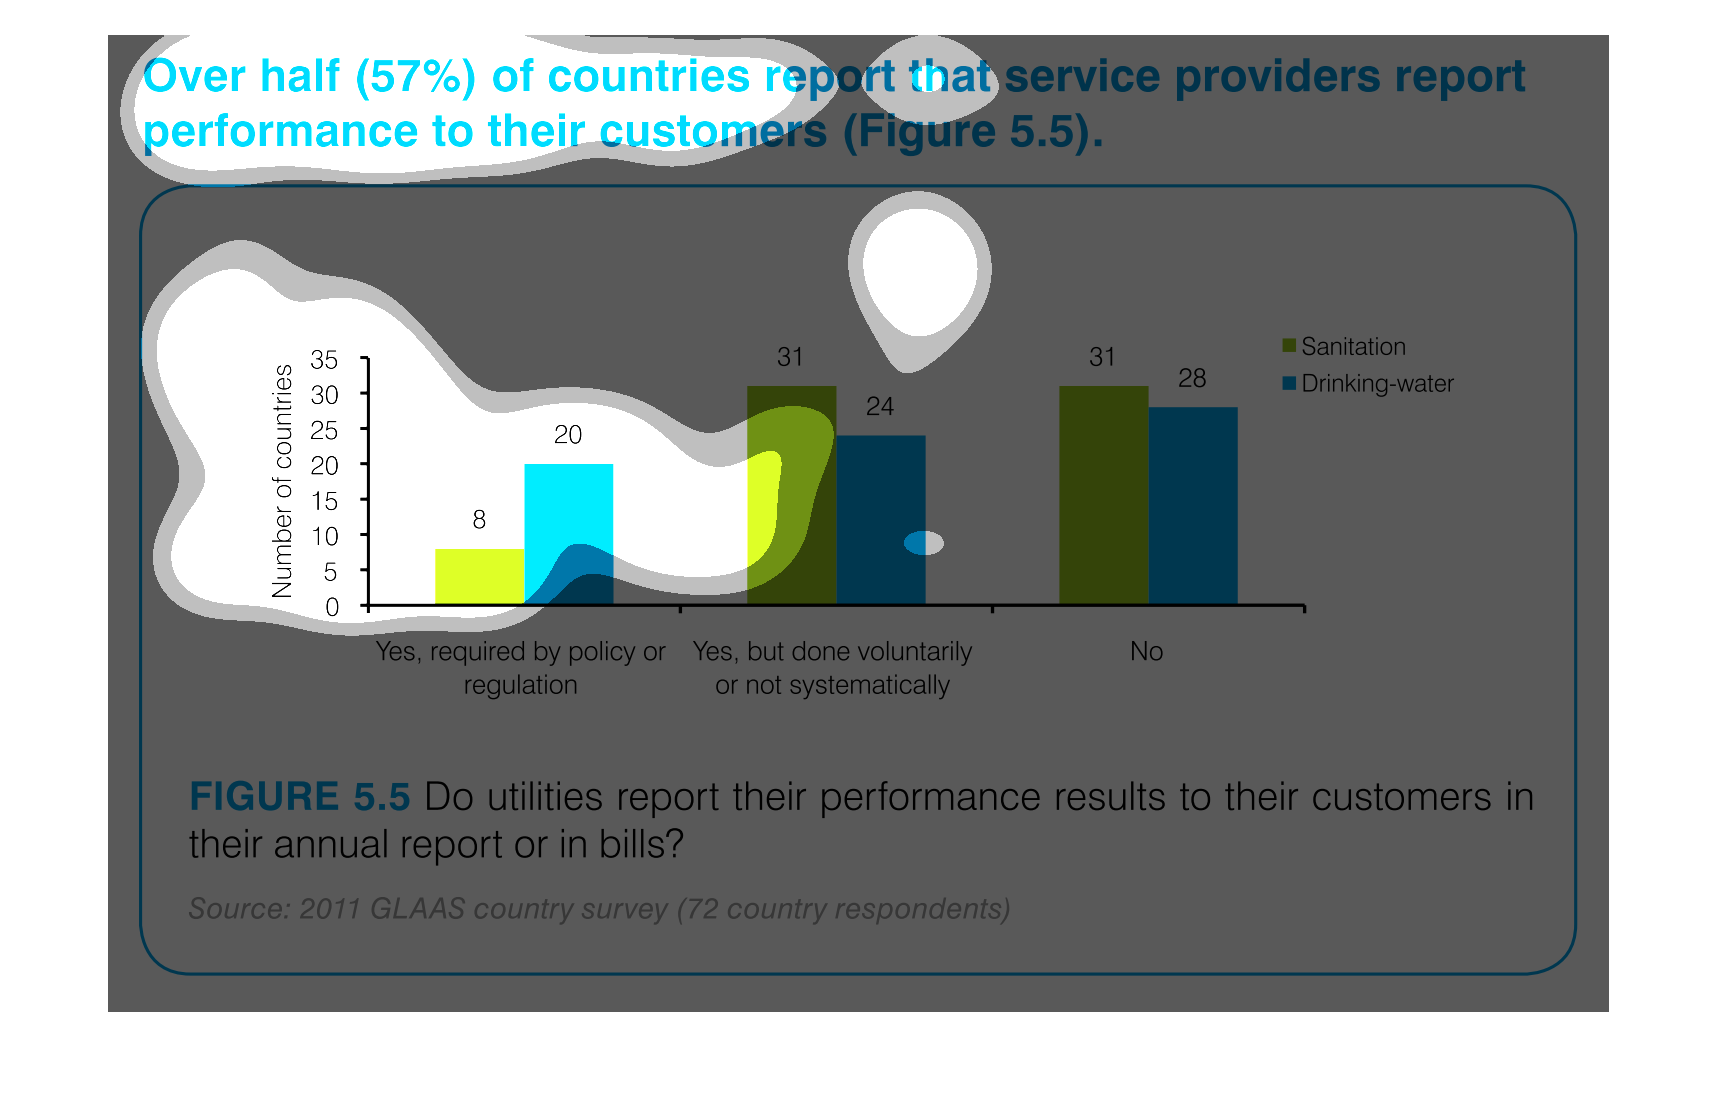
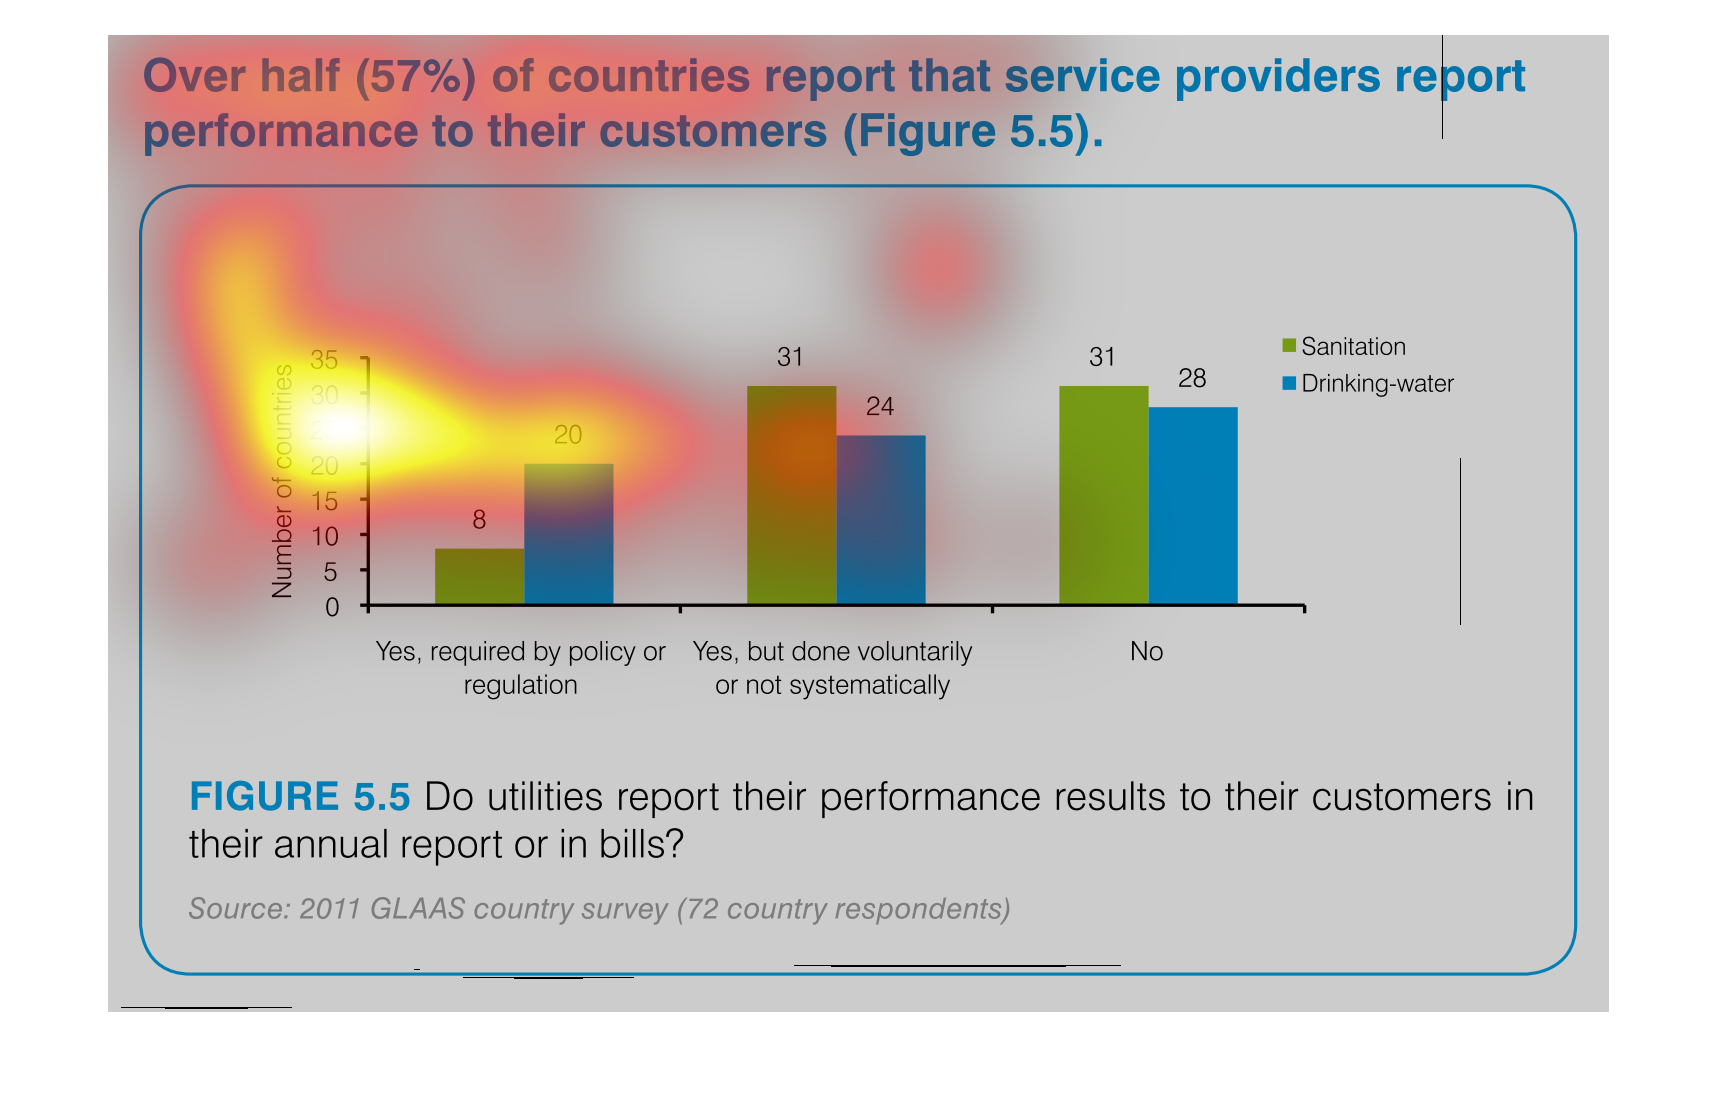
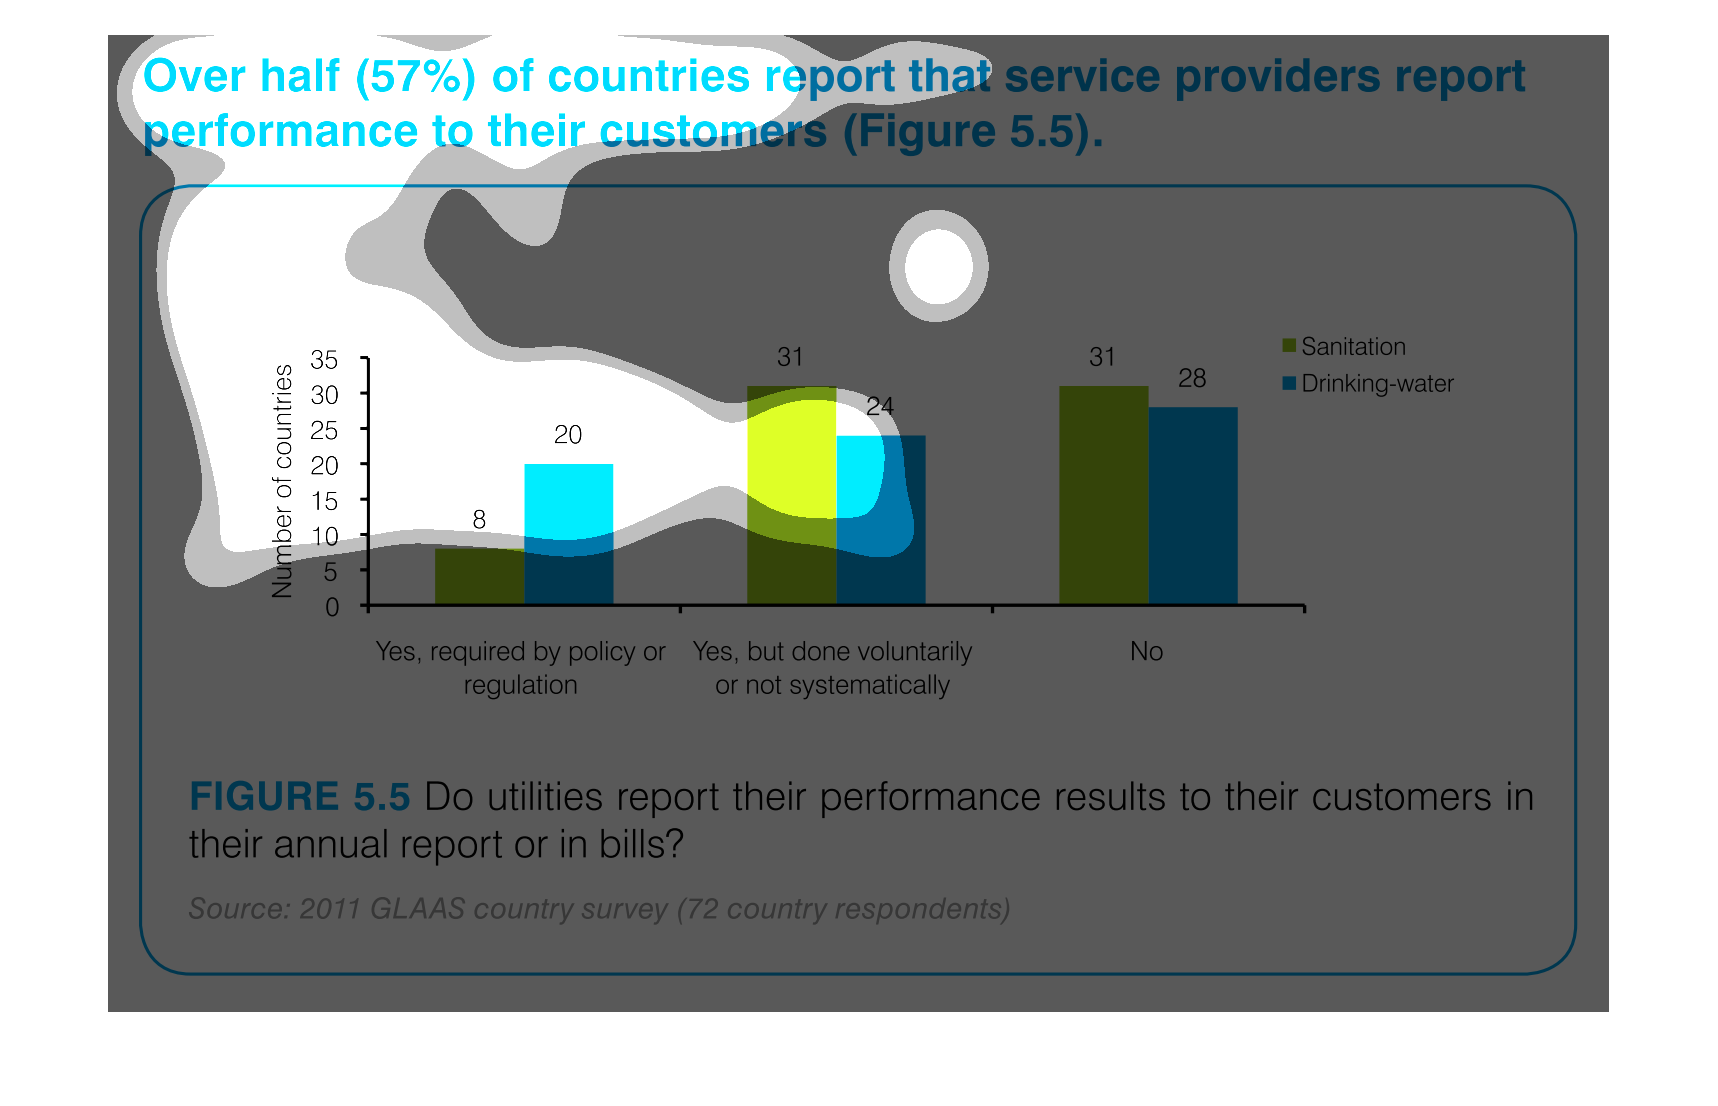
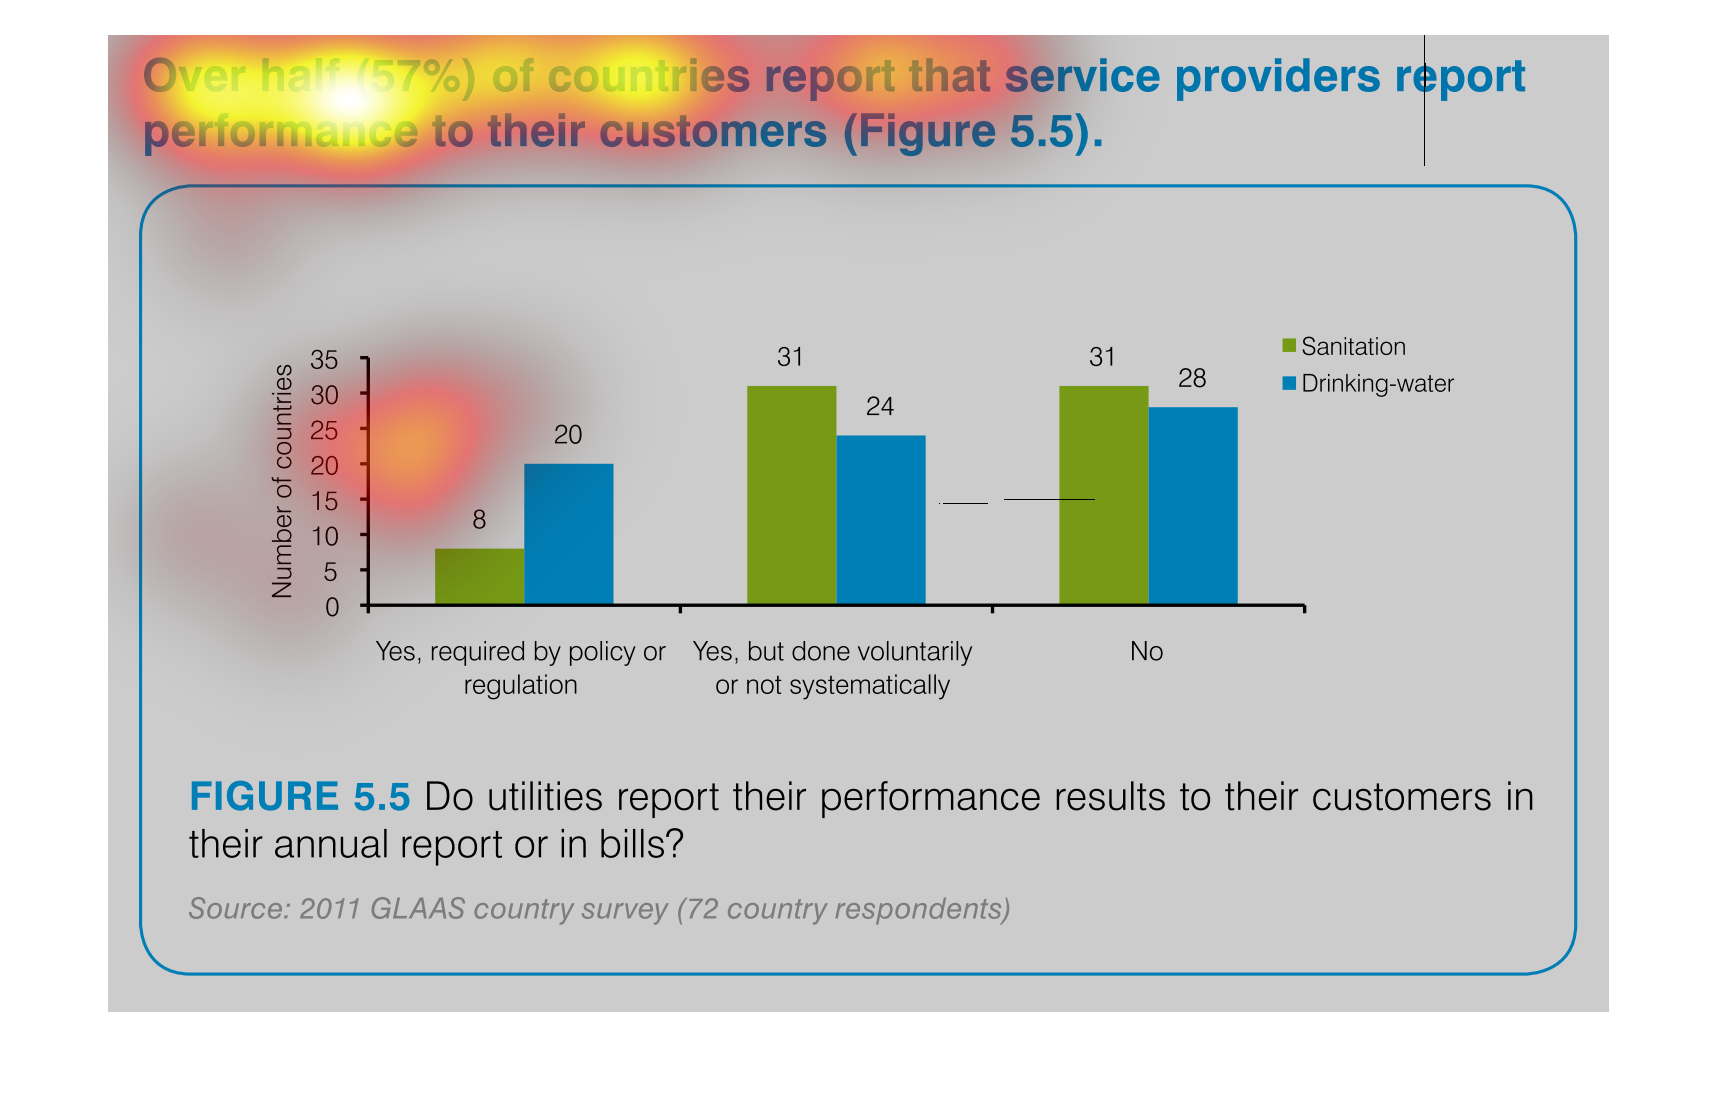
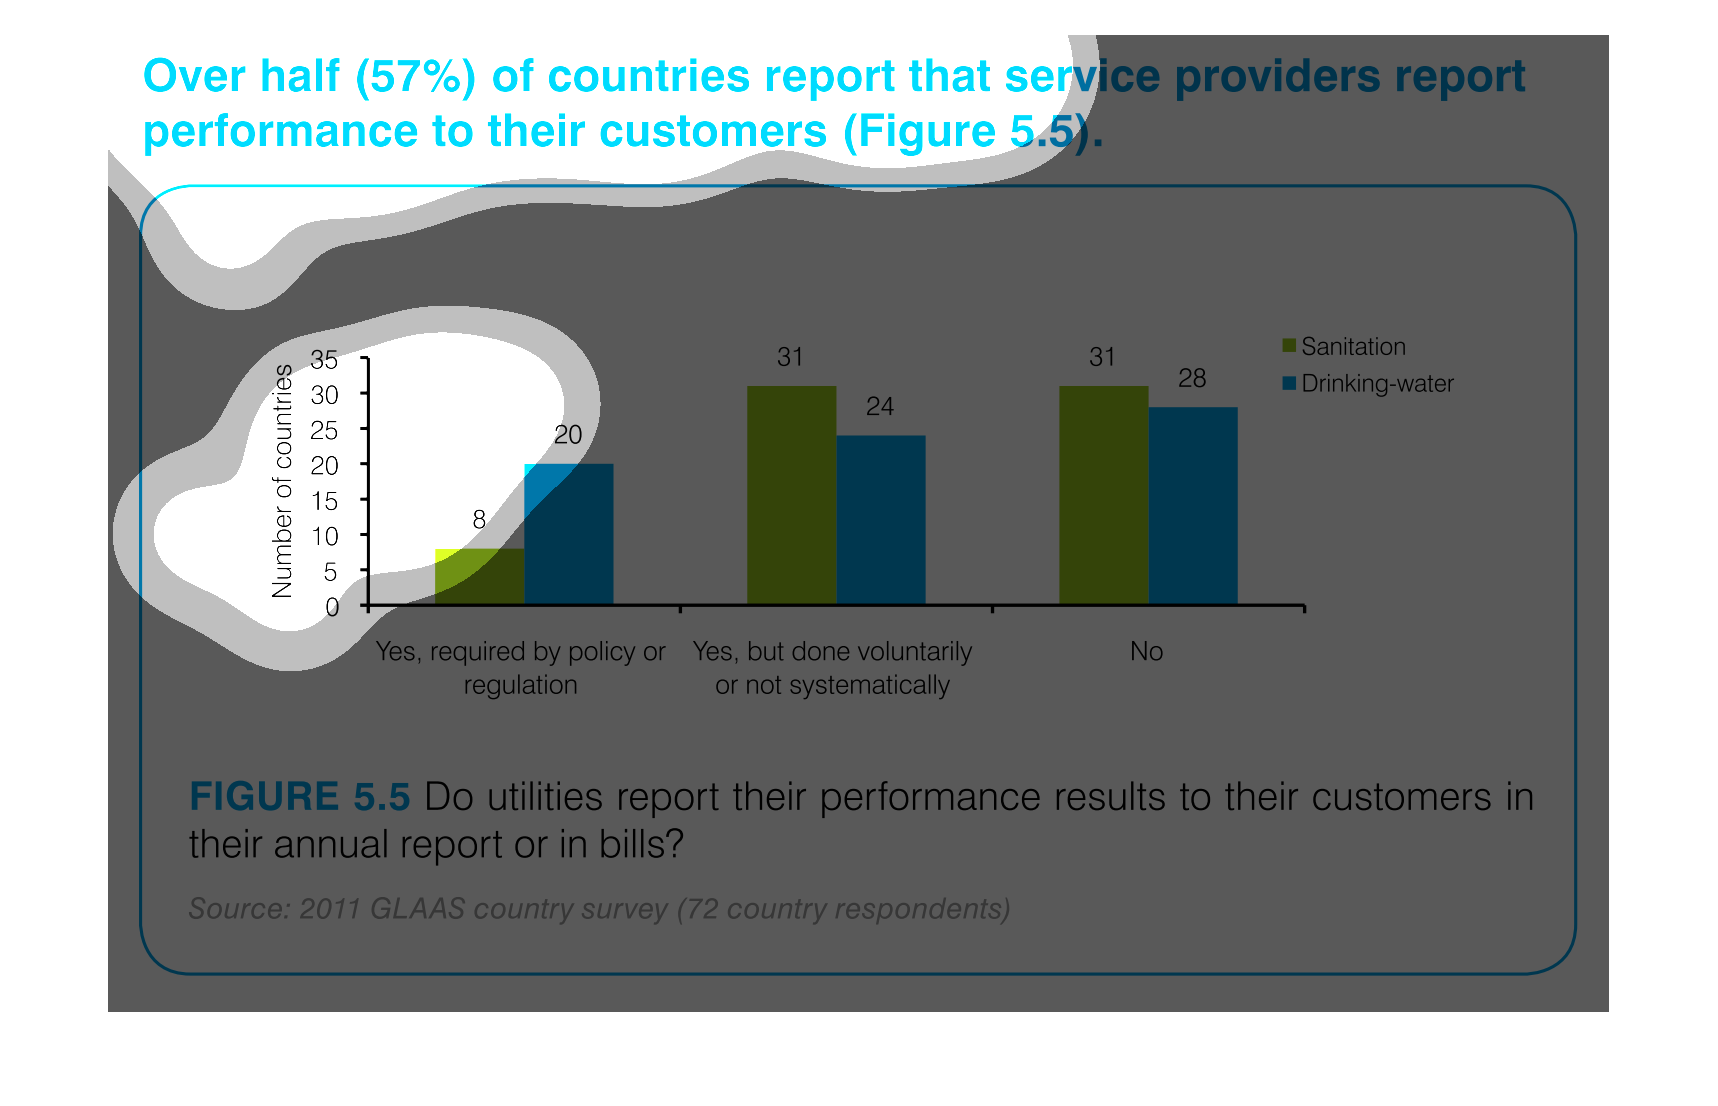
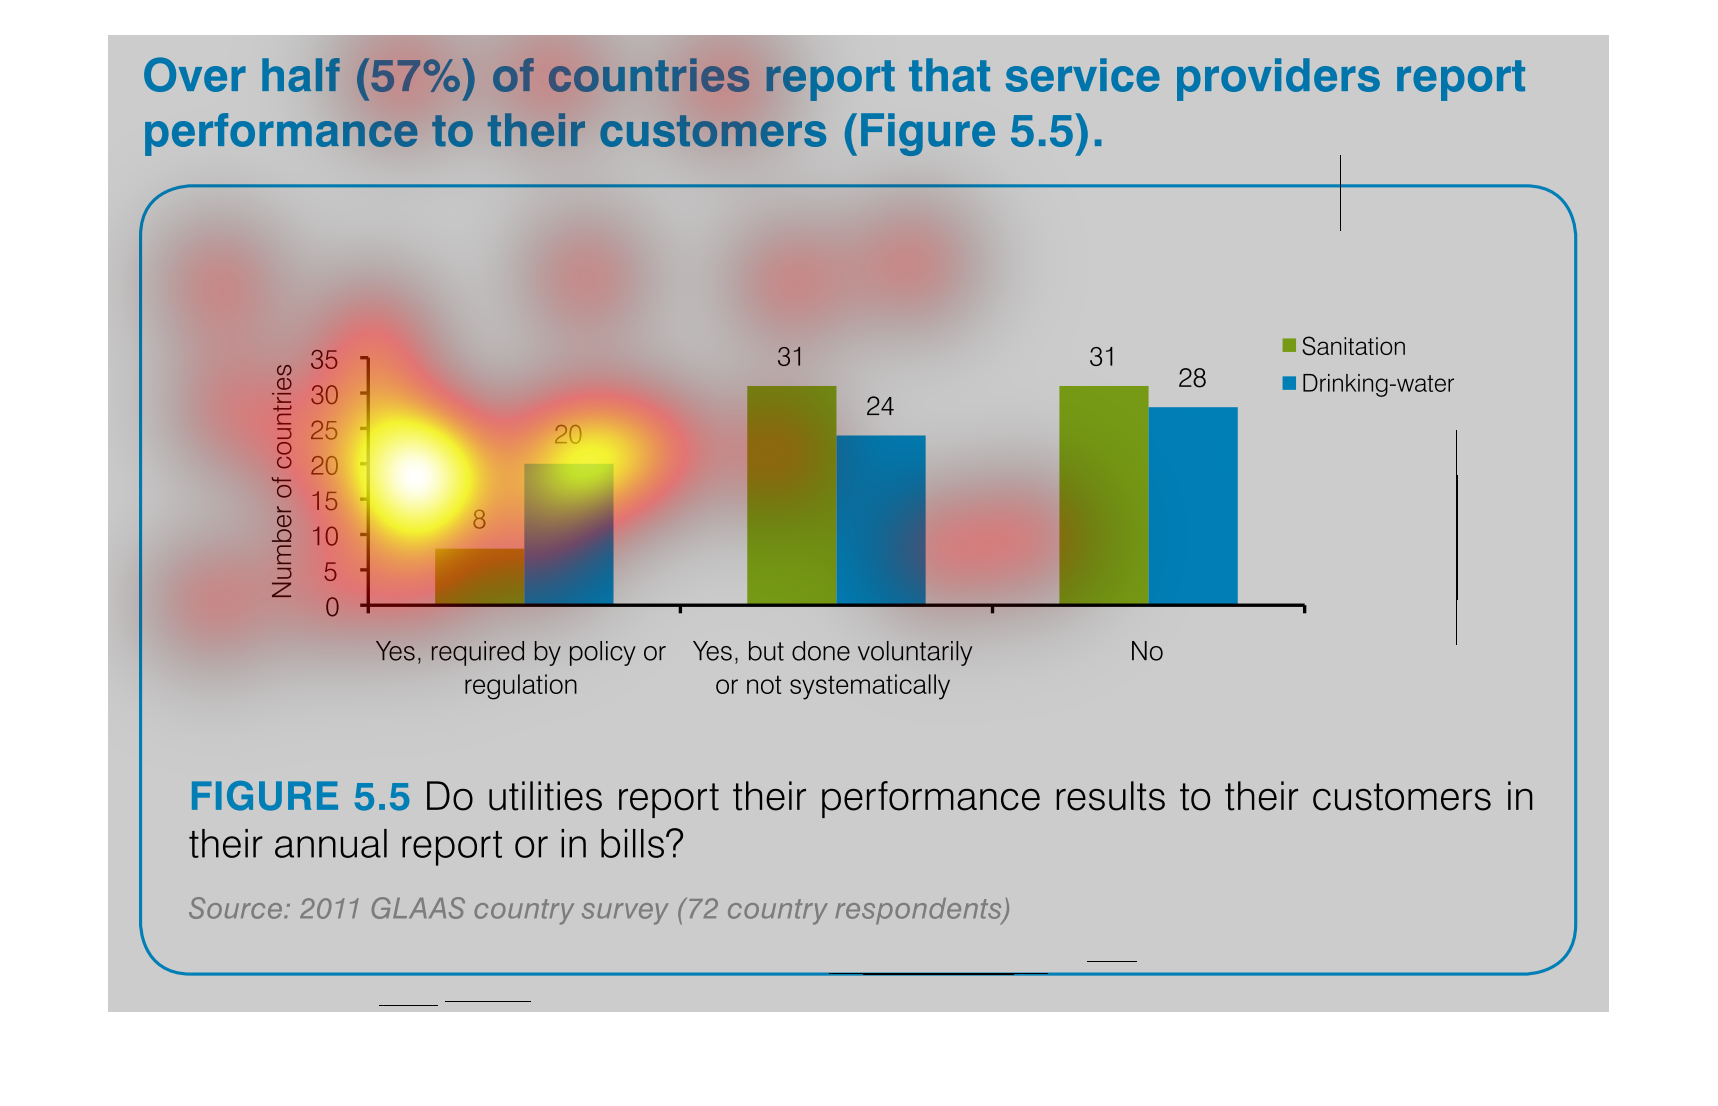
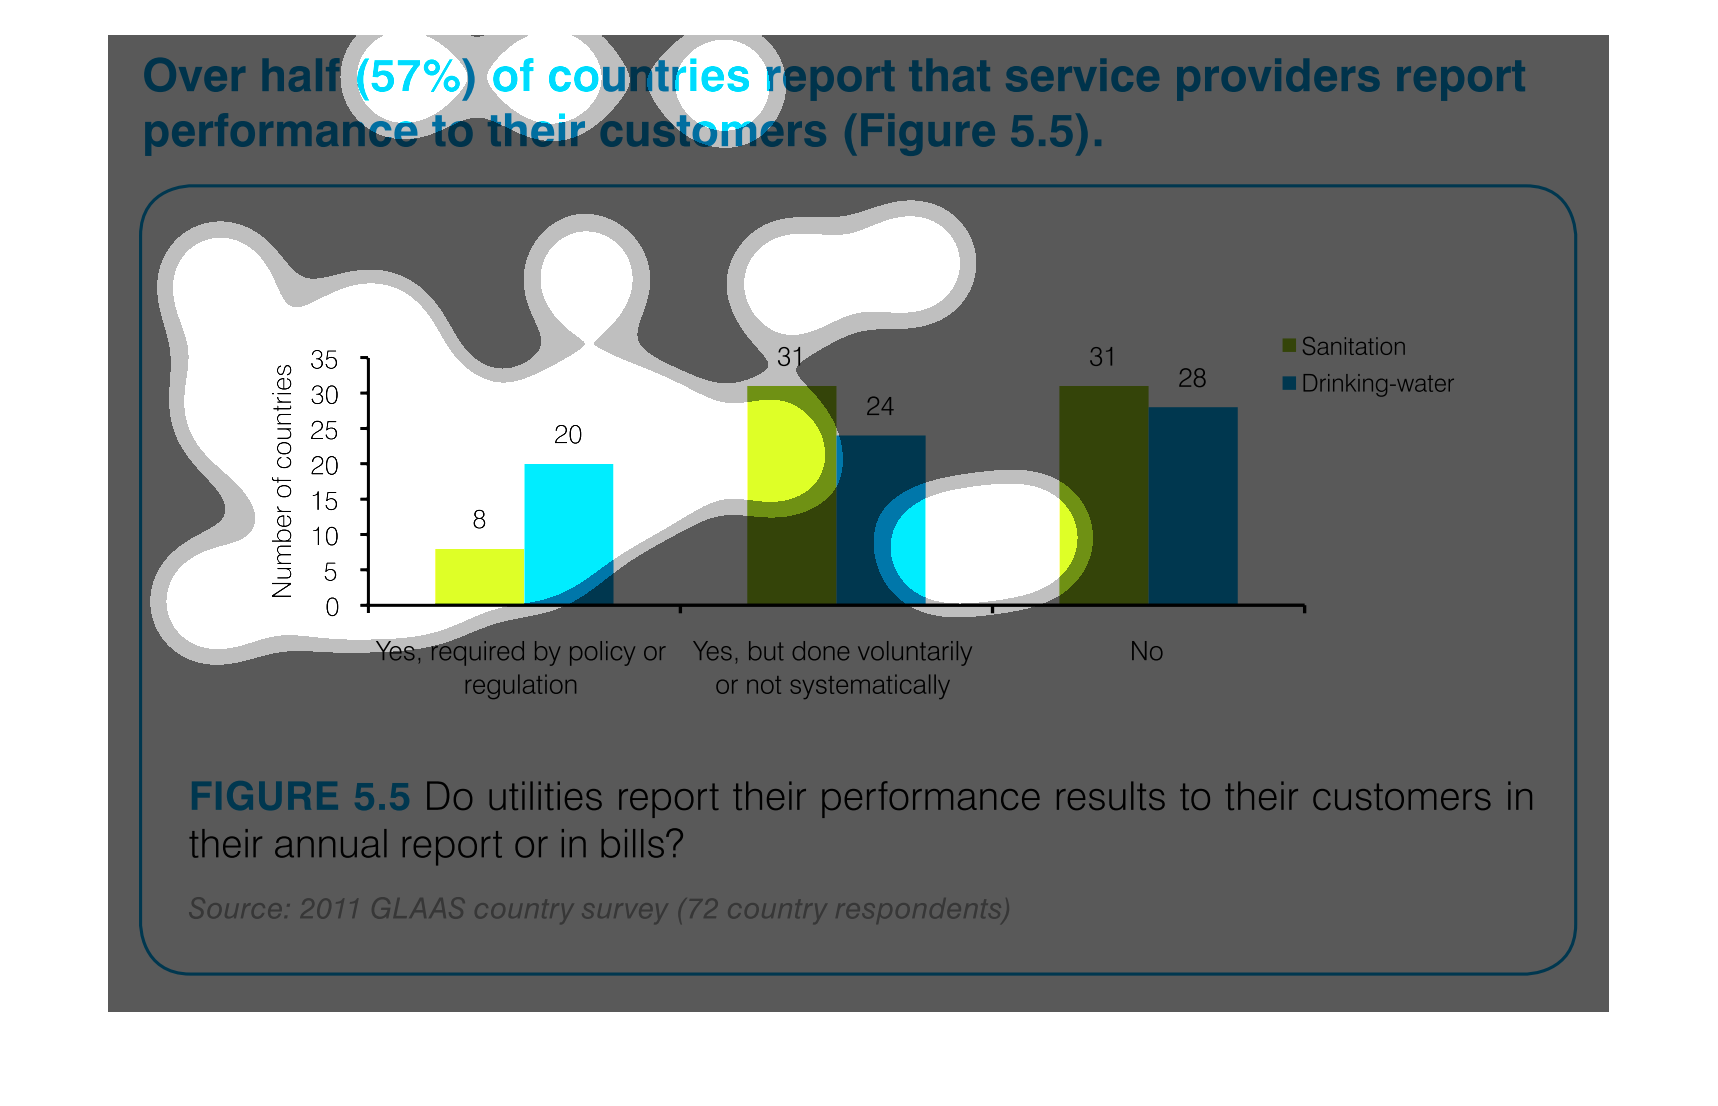
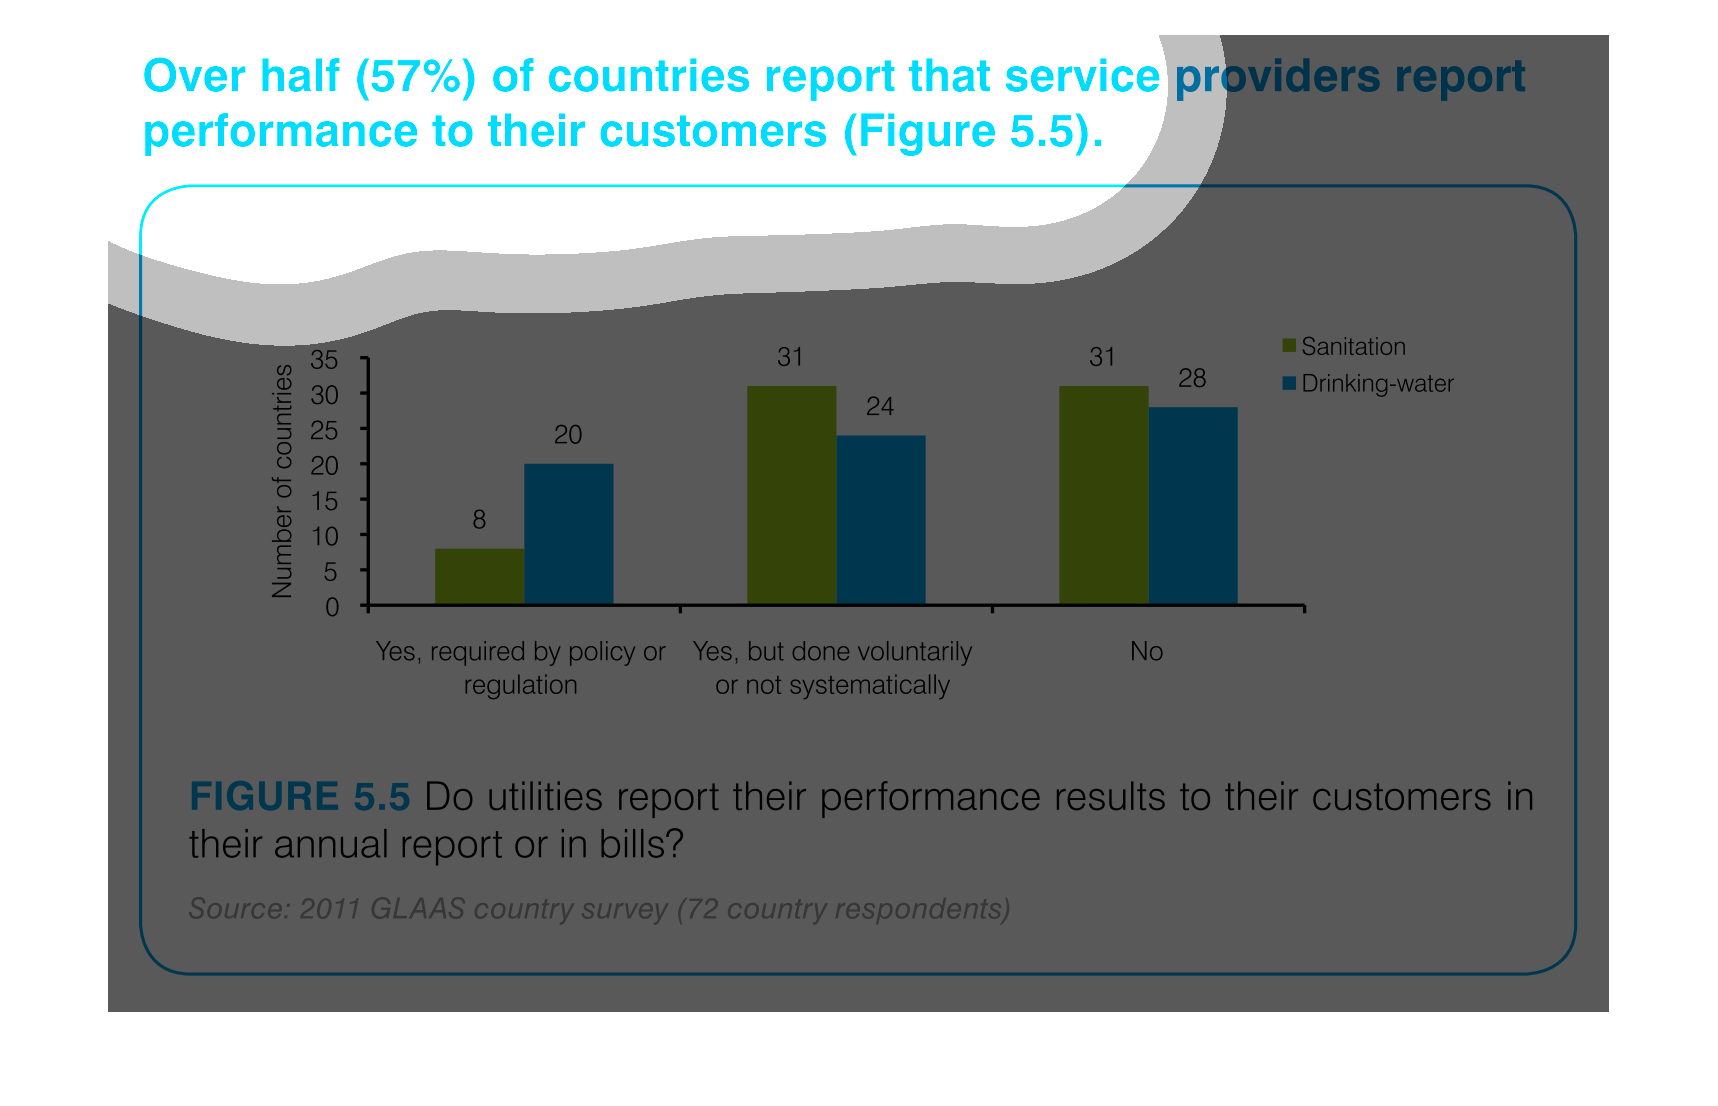
Over half (57%) of countries report that service providers report performance to their customers
(Figure 5.5).  the amount of countries out or 35 surveyed that show performance results to
their customers where its required by policy or regulation is 8/35 for sanitation, and 20/35
for drinking water.  Voluntary reporting/systematically reporting 31/35 countries for sanitation,
24 for drinking water.  Countries with no regulation to show performance amounts to 31/35
for sanitation, and 28/35 for drinking water.  Figure 5.5 Do utilities their performance results
to their customers in their Annual report or in bills?
THIS BAR CHART SHOWS IF SANITATION AND DRINKING WATER UTILITIES REPORT PERFORMANCE TO THEIR
CUSTOMERS IN REPORTS OR BILLS. AT LEFT IS THE NUMBER OF COUNTRIES, AND REPORTING IS BROKEN
DOWN BY REQUIRED, NOT REQUIRED BUT REPORT ANYWAY, AND DO NOT REPORT.
This graph reports that over half of service providers report performance to their customers.
 Categories are: reporting is a policy, reporting is voluntary, and no.
This graph shows what countries have service providers that report their performances. Over
half of the countries actually give performance reports. A lot of countries voluntarily report
them.
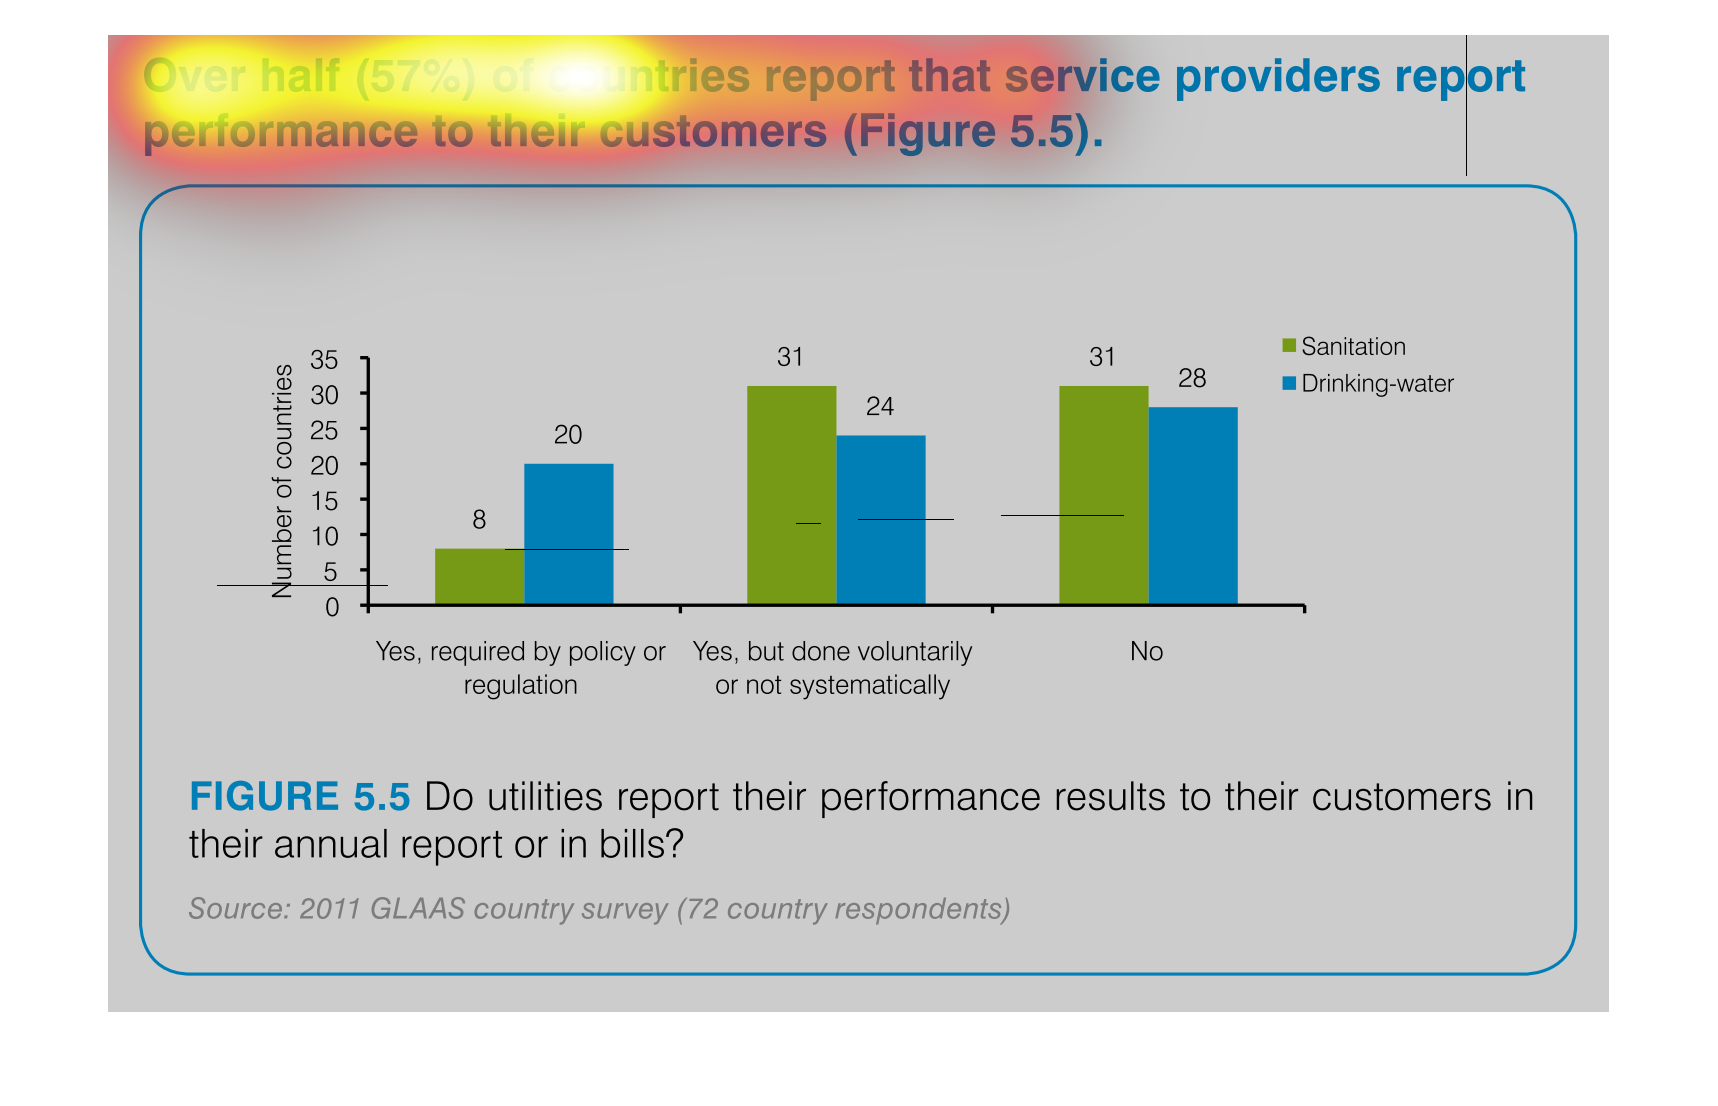
This graph shows that just over half of countries report that service providers report performance
to their customers. The vertical axis is the number of countries, while the graphs are broken
into categories: yes, the providers are required to report by law, yes done voluntarily, and
no. Graphs are color coded into sanitation and drinking waste providers.
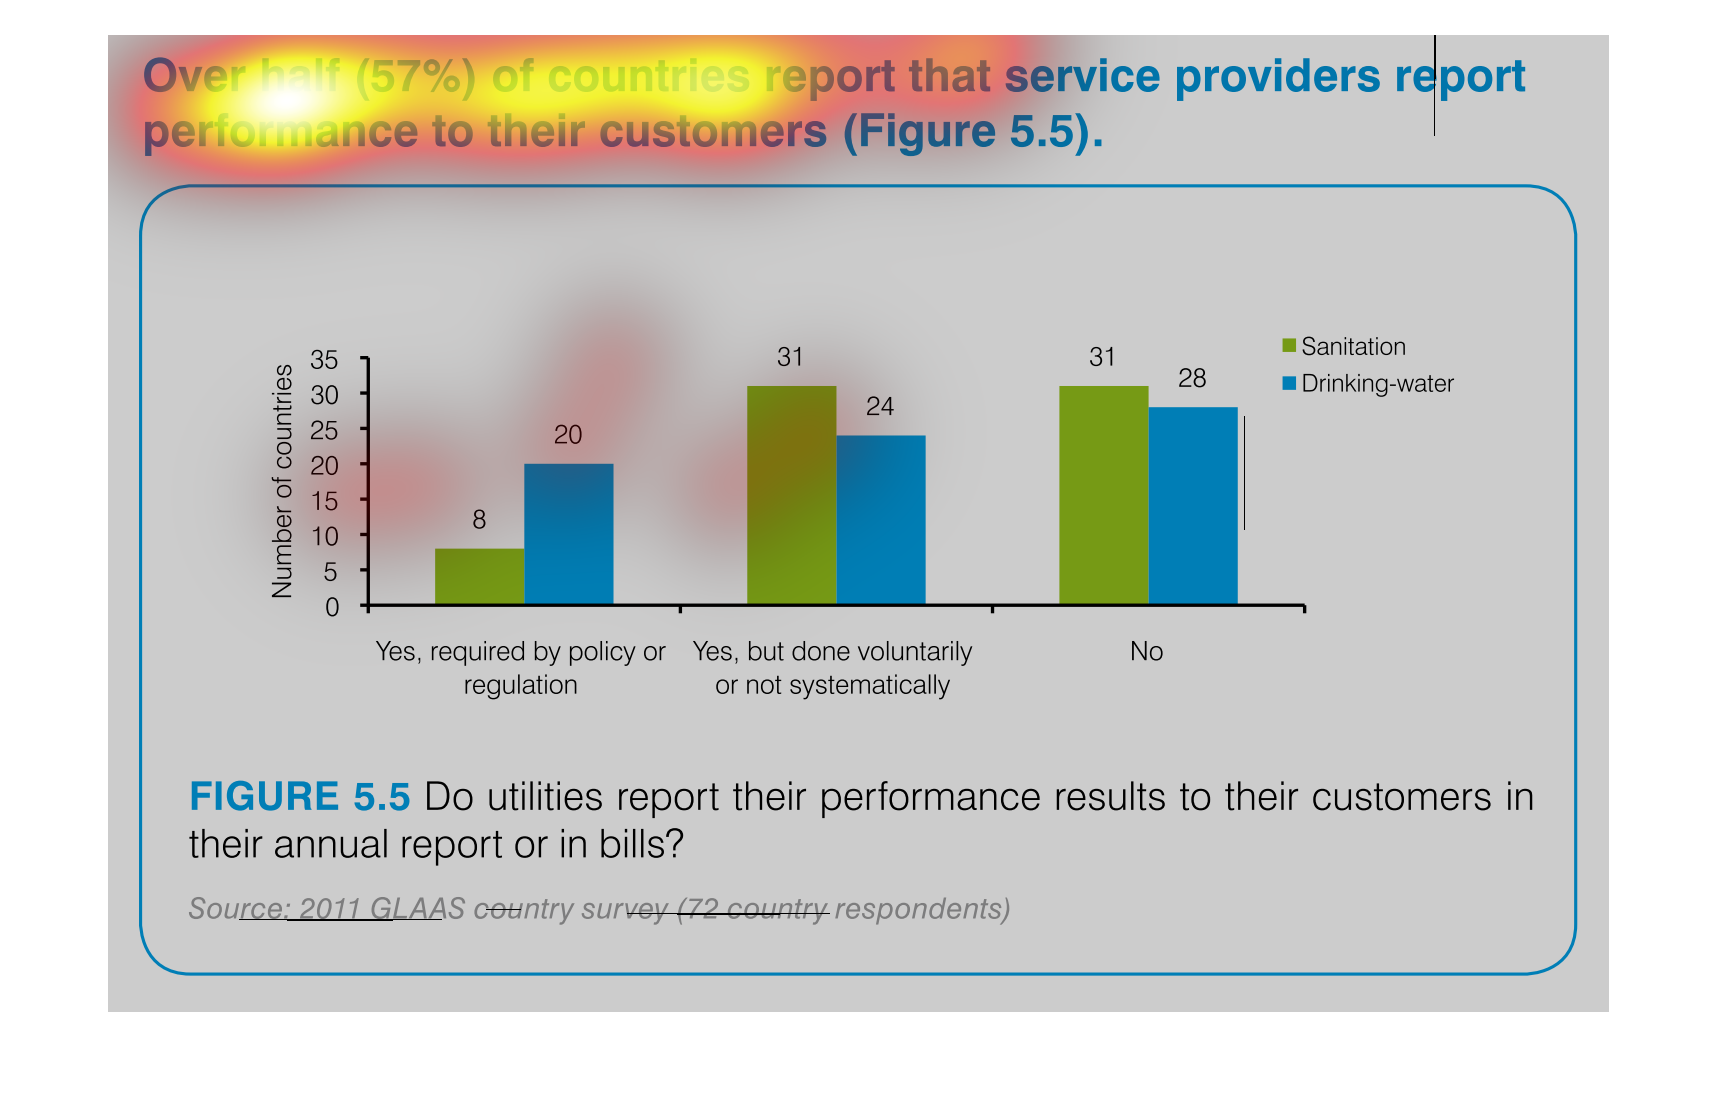
This chart shows if utility companies for sanitation and drinking water report their performance
to their customers.  The least number of countries are required to by regulations or policy,
with sanitation being the lowest percentage of all required reporting.  A moderate amount
of countries report voluntarily, but it's not done systematically, and the largest percentage
of countries are not required to report their performance for drinking water or sanitation.
The image of the graph seems to deal with service providers and if they are or are not required
to disclose there performance reports to the government or their customers
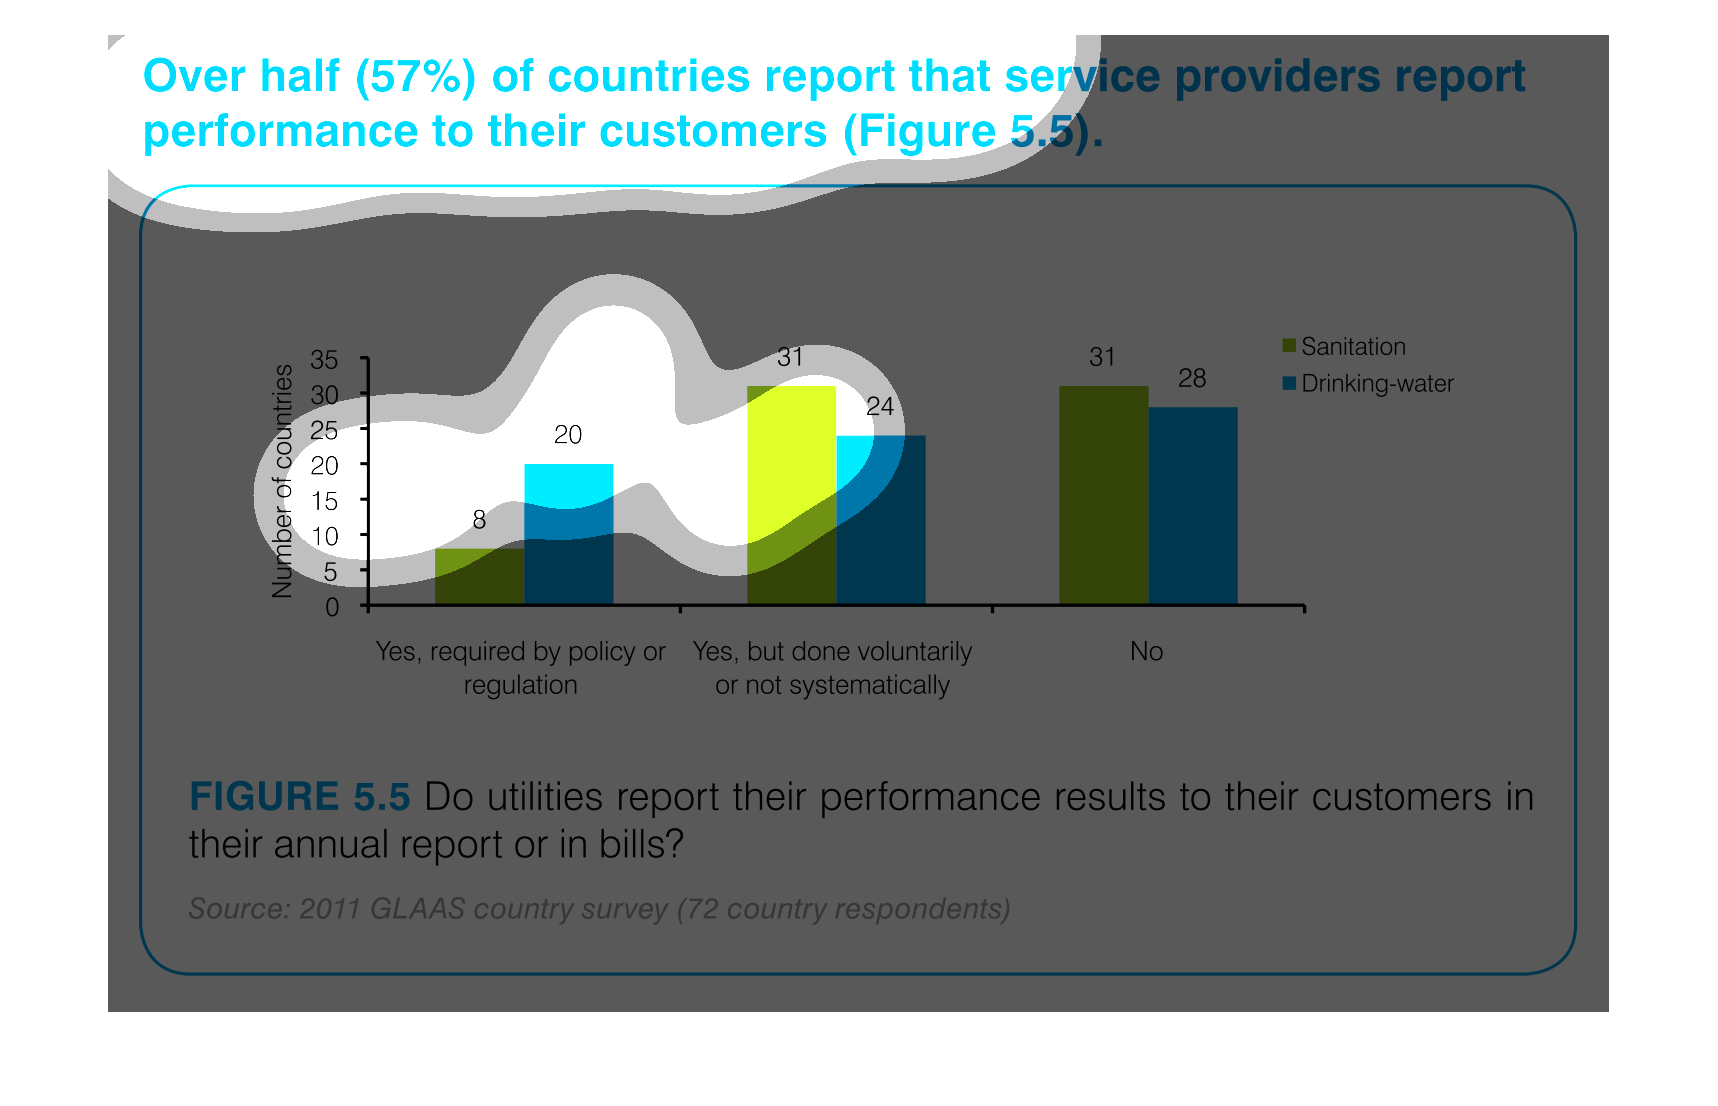
The chart describes countries with regulated sanitation and drinking-water policies, voluntary
regulation, and countries without regulations. Only 8 countries require sanitation regulation,
while 20 require drinking-water regulation. 31 and 24 countries have voluntary participation
in sanitation and drinking-water regulations, respectively. The majority of countries have
no regulations, with 31 having no sanitation policies and 28 having no drinking-water regulations.
This handmade chart shows the percentage of people served by service providers that provide
the level of service to customers. Other than that it doesn't say much because there is no
context.
This is a chart showing the service providers that report performance to their customers worldwide.
Over half of the countries reported that service providers report performance to their customers.
This graph is showing the percentage of countries that receive reports from customers who
confirm they have received performance reports from utility companies.  The graph compares
reports for sanitation and drinking water.  Most customers said "no" in both areas.